Online Information Sources: Government...
15
Online Information Sources: Government Expenditures Compiled by Daniel Agostino August 2016 This report was published by the Global Development and Environment Institute at Tufts University as part of GDAE’s Public Economy Project. To learn more about this project, please contact [email protected] http://ase.tufts.edu/gdae
Transcript of Online Information Sources: Government...
Online Information Sources: Government Expenditures
Compiled by Daniel Agostino August 2016
This report was published by the Global Development and Environment Institute at Tufts University as part of GDAE’s Public Economy Project. To learn more about this
project, please contact [email protected]
http://ase.tufts.edu/gdae
2
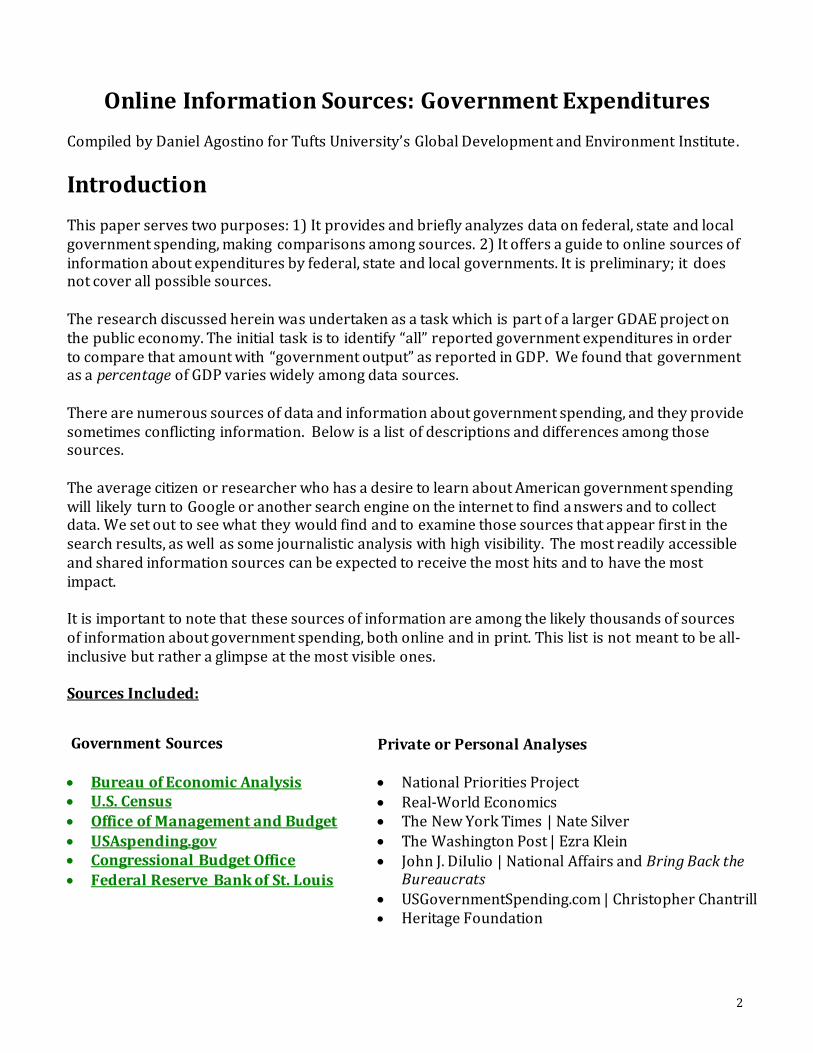
Online Information Sources: Government Expenditures
Compiled by Daniel Agostino for Tufts University’s Global Development and Environment Institute.
Introduction This paper serves two purposes: 1) It provides and briefly analyzes data on federal, state and local government spending, making comparisons among sources. 2) It offers a guide to online sources of information about expenditures by federal, state and local governments. It is preliminary; it does not cover all possible sources. The research discussed herein was undertaken as a task which is part of a larger GDAE project on the public economy. The initial task is to identify “all” reported government expenditures in order to compare that amount with “government output” as reported in GDP. We found that government as a percentage of GDP varies widely among data sources. There are numerous sources of data and information about government spending, and they provide sometimes conflicting information. Below is a list of descriptions and differences among those sources. The average citizen or researcher who has a desire to learn about American government spending will likely turn to Google or another search engine on the internet to find a nswers and to collect data. We set out to see what they would find and to examine those sources that appear first in the search results, as well as some journalistic analysis with high visibility. The most readily accessible and shared information sources can be expected to receive the most hits and to have the most impact. It is important to note that these sources of information are among the likely thousands of sources of information about government spending, both online and in print. This list is not meant to be all-inclusive but rather a glimpse at the most visible ones. Sources Included:
Private or Personal Analyses
National Priorities Project
Real-World Economics The New York Times | Nate Silver
The Washington Post | Ezra Klein John J. DiIulio | National Affairs and Bring Back the
Bureaucrats
USGovernmentSpending.com | Christopher Chantrill Heritage Foundation
Government Sources
Bureau of Economic Analysis U.S. Census Office of Management and Budget
USAspending.gov Congressional Budget Office
Federal Reserve Bank of St. Louis
3
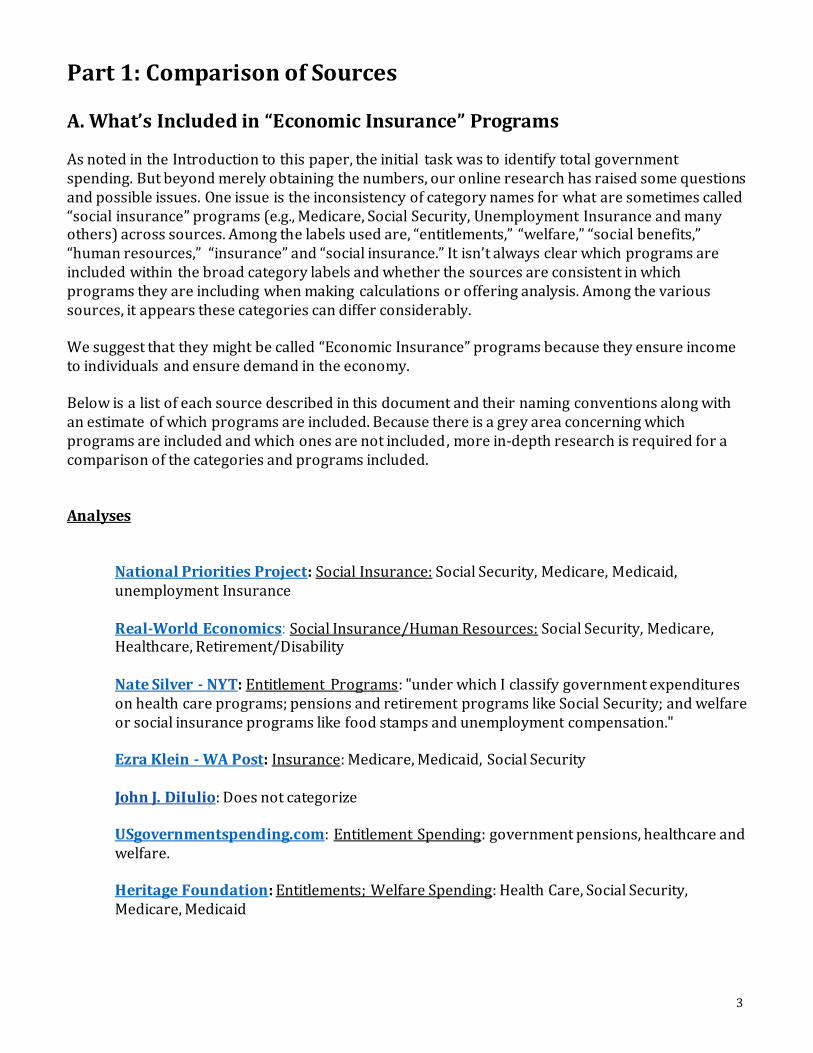
Part 1: Comparison of Sources A. What’s Included in “Economic Insurance” Programs As noted in the Introduction to this paper, the initial task was to identify total government spending. But beyond merely obtaining the numbers, our online research has raised some questions and possible issues. One issue is the inconsistency of category names for what are sometimes called “social insurance” programs (e.g., Medicare, Social Security, Unemployment Insurance and many others) across sources. Among the labels used are, “entitlements,” “welfare,” “social benefits,” “human resources,” “insurance” and “social insurance.” It isn’t always clear which programs are included within the broad category labels and whether the sources are consistent in which programs they are including when making calculations or offering analysis. Among the various sources, it appears these categories can differ considerably. We suggest that they might be called “Economic Insurance” programs because they ensure income to individuals and ensure demand in the economy. Below is a list of each source described in this document and their naming conventions along with an estimate of which programs are included. Because there is a grey area concerning which programs are included and which ones are not included, more in-depth research is required for a comparison of the categories and programs included. Analyses
National Priorities Project: Social Insurance: Social Security, Medicare, Medicaid, unemployment Insurance Real-World Economics: Social Insurance/Human Resources: Social Security, Medicare, Healthcare, Retirement/Disability Nate Silver - NYT: Entitlement Programs: "under which I classify government expenditures on health care programs; pensions and retirement programs like Social Security; and welfare or social insurance programs like food stamps and unemployment compensation." Ezra Klein - WA Post: Insurance: Medicare, Medicaid, Social Security John J. DiIulio: Does not categorize USgovernmentspending.com: Entitlement Spending: government pensions, healthcare and welfare. Heritage Foundation: Entitlements; Welfare Spending: Health Care, Social Security, Medicare, Medicaid

4
Official Government Sources Bureau of Economic Analysis: Government Social Benefits: Social Security, Medicare, unemployment, pensions, SNAP, veteran's benefits. There are 43 categories and subcategories in total, which are displayed in NIPA table 3.12
U.S. Census: Does not categorize Office of Management and Budget: Human Resources (table 3.1): Education, training, employment, social services, health, Medicare, income security, Social Security, and veteran's benefits. USAspending.gov: Does not categorize Congressional Budget Office: Does not categorize
Federal Reserve Bank of St. Louis: Government Social Benefits: Social Security, Medicare, unemployment, pensions, SNAP, veteran's benefits.
Naming Conventions used in “Official” Government Sites
BEA NIPA and St. Louis Fed* OMB CBO Census Government Social Benefits
Social Security Medicare
Unemployment Pensions
SNAP
Veteran’s Benefits Education
* There are 43 total categories (NIPA table 3.12)
Human Resources Health Insurance Medicare
Income security Social security
Veteran's benefits
Education, Training, Employment, and Social Services
Does not categorize
Does not categorize
B. Comparison of the Numbers The data in the various sites are remarkably inconsistent as to levels of government expenditures. Part of the problem is that there is overlap in certain categories, because sources discuss government spending in different ways. Also, the various sites and analysts create idiosyncratic categories, making comparison difficult. Some of the Evident Differences
Total Government Spending: Usgovernmentspending.com consistently estimates total government spending (Federal, State, Local) to be about 500 billion dollars higher per year than the BEA NIPA’s estimate of total government spending. It is unclear how Christopher Chantrill at USgovernmentspending.com arrives at his numbers, and determining the reasons for the differences would require further research. It might be that the discrepancy

5
has something to do with intergovernmental transfers, although both sources claim to adjust for them in their calculations of total government spending.
Government as % of GDP: Although the presentations of total U.S. GDP in terms of dollar amounts are fairly consistent across all sources, the presentation of Federal, State & Local (FSL) government as a percentage of GDP varies widely. For 2015, the BEA NIPAs states 17.7%, OMB reports 31.8% and IMF reports 35.7%. Usgovernmentspending.com – not a government source, but one of the more accessible sites and one that is cited and used by analysts – says it is 35%. For OMB, and usgovernmentspending.com the calculation is discernible: it is total government expenditures divided by total GDP. It is unclear how IMF arrives at 35.7%, since they do not report total government expenditures. For the BEA’s NIPAs, which present government as a much smaller share than the others, the calculation is not based on government “expenditures” but rather on “Government Consumption Expenditures and Gross Investment,” the composition of which is complex and beyond the scope of this report.
We know that NIPA does not include transfer payments (called “government social benefits” by NIPA) in “Government Consumption Expenditures and Gross Investment”). But what other reasons may account for the lower value the GDP calculation places on the g overnment share of GDP? This is a topic for further research.
6
Part 2: Online Information Sources
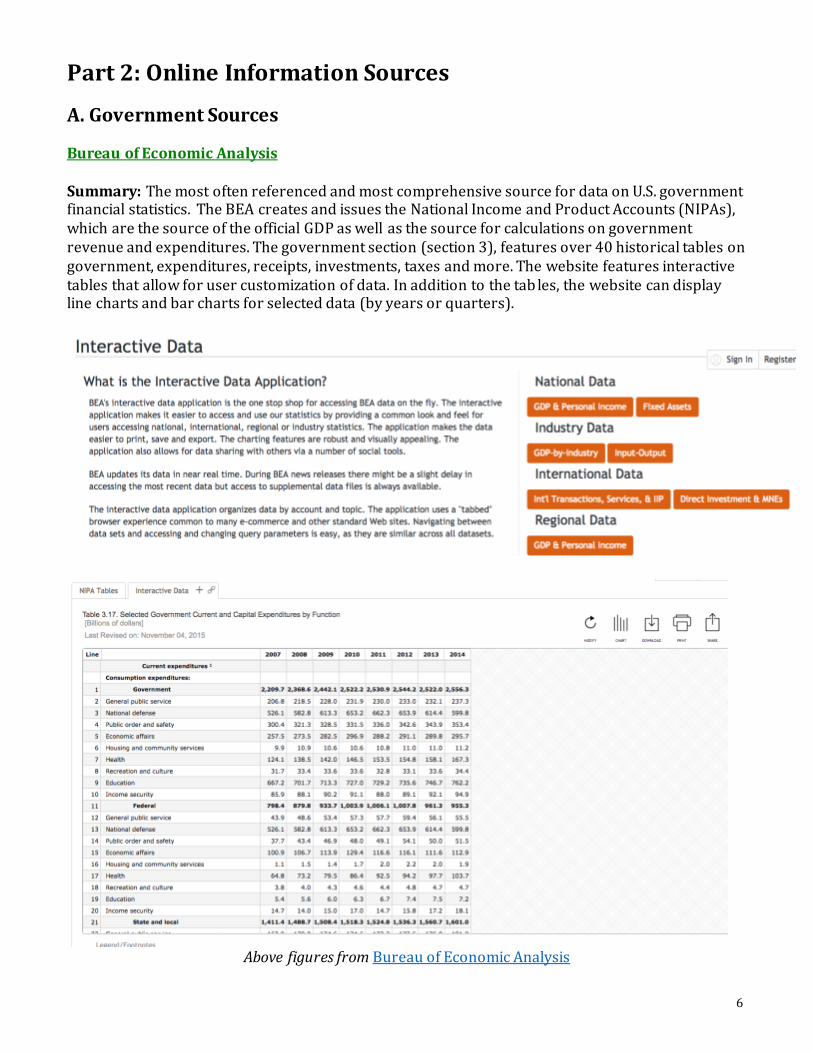
A. Government Sources Bureau of Economic Analysis Summary: The most often referenced and most comprehensive source for data on U.S. government financial statistics. The BEA creates and issues the National Income and Product Accounts (NIPAs), which are the source of the official GDP as well as the source for calculations on government revenue and expenditures. The government section (section 3), features over 40 historical tables on government, expenditures, receipts, investments, taxes and more. The website features interactive tables that allow for user customization of data. In addition to the tab les, the website can display line charts and bar charts for selected data (by years or quarters).
Above figures from Bureau of Economic Analysis

7
U.S. Census Summary: This source includes the most recent census of governments from 2013, which shows spending data for state and local governments, broken down by category. Also available fr om 1992 onwards, are historical tables on government finance, tax statistics, government employment and payroll data, and federal spending data from 1983 to 2010.
Above figure from U.S. Census
8
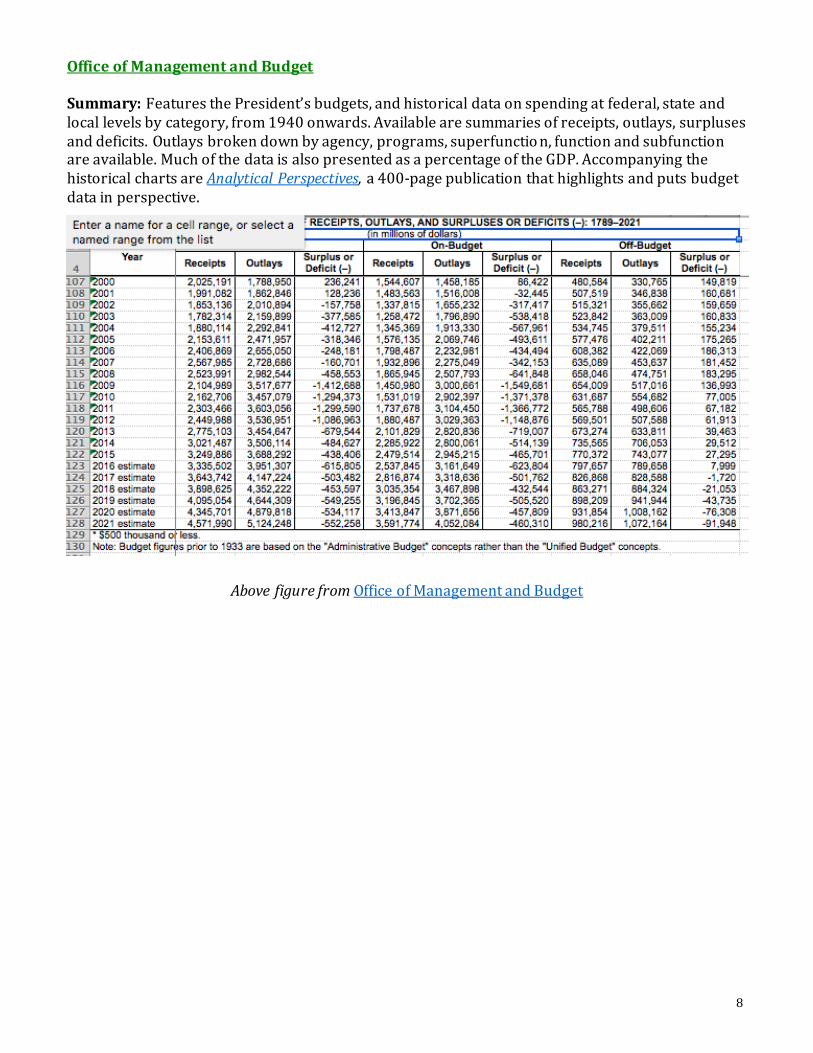
Office of Management and Budget Summary: Features the President’s budgets, and historical data on spending at federal, state and local levels by category, from 1940 onwards. Available are summaries of receipts, outlays, surpluses and deficits. Outlays broken down by agency, programs, superfunctio n, function and subfunction are available. Much of the data is also presented as a percentage of the GDP. Accompanying the historical charts are Analytical Perspectives, a 400-page publication that highlights and puts budget data in perspective.
Above figure from Office of Management and Budget
9
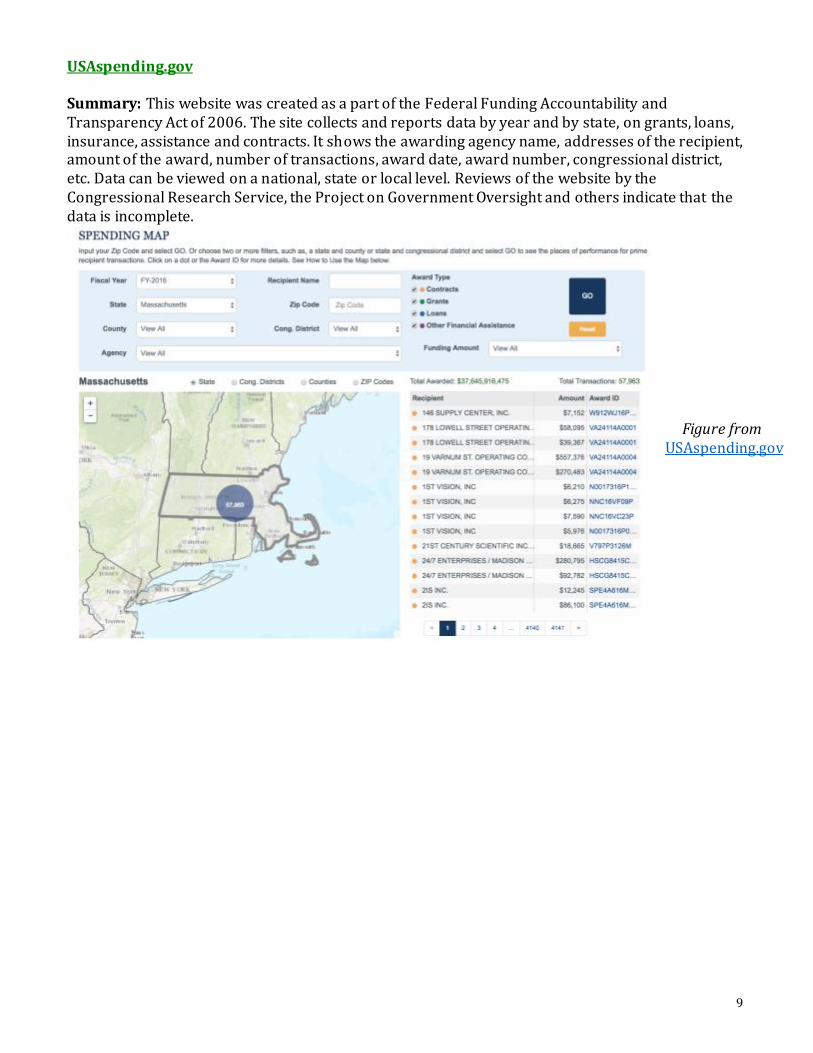
USAspending.gov Summary: This website was created as a part of the Federal Funding Accountability and Transparency Act of 2006. The site collects and reports data by year and by state, on grants, loans, insurance, assistance and contracts. It shows the awarding agency name, addresses of the recipient, amount of the award, number of transactions, award date, award number, congressional district, etc. Data can be viewed on a national, state or local level. Reviews of the website by the Congressional Research Service, the Project on Government Oversight and others indicate that the data is incomplete.
Figure from USAspending.gov
10
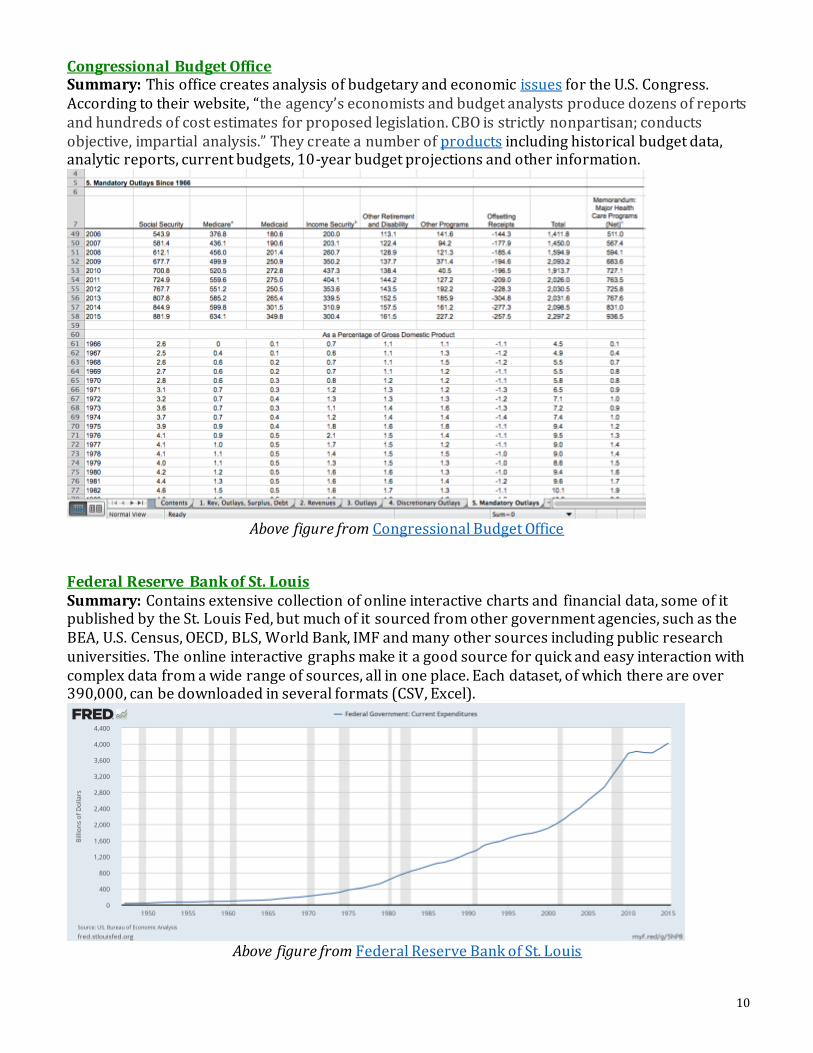
Congressional Budget Office Summary: This office creates analysis of budgetary and economic issues for the U.S. Congress. According to their website, “the agency’s economists and budget analysts produce dozens of reports and hundreds of cost estimates for proposed legislation. CBO is strictly nonpartisan; conducts objective, impartial analysis.” They create a number of products including historical budget data, analytic reports, current budgets, 10-year budget projections and other information.
Above figure from Congressional Budget Office
Federal Reserve Bank of St. Louis Summary: Contains extensive collection of online interactive charts and financial data, some of it published by the St. Louis Fed, but much of it sourced from other government agencies, such as the BEA, U.S. Census, OECD, BLS, World Bank, IMF and many other sources including public research universities. The online interactive graphs make it a good source for quick and easy interaction with complex data from a wide range of sources, all in one place. Each dataset, of which there are over 390,000, can be downloaded in several formats (CSV, Excel).
Above figure from Federal Reserve Bank of St. Louis
11
B. Private or Personal Analyses These sources of information include analyses from journalists , authors and private organizations, available on privately maintained websites.
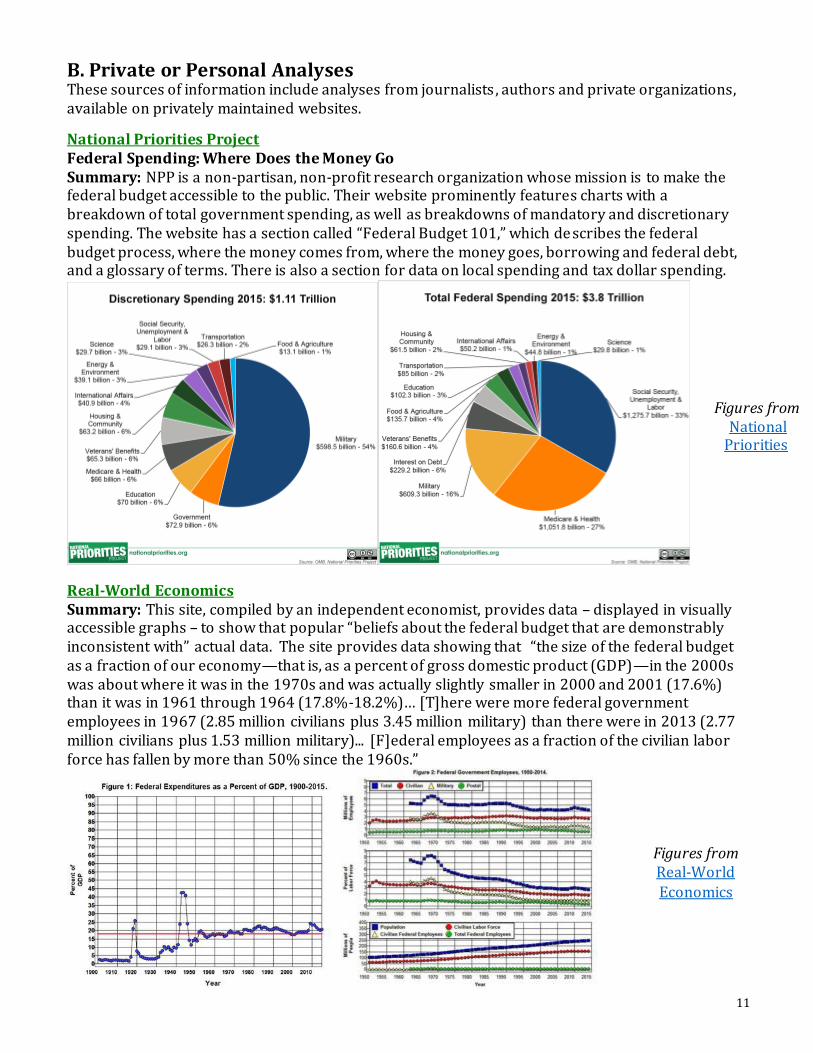
National Priorities Project Federal Spending: Where Does the Money Go Summary: NPP is a non-partisan, non-profit research organization whose mission is to make the federal budget accessible to the public. Their website prominently features charts with a breakdown of total government spending, as well as breakdowns of mandatory and discretionary spending. The website has a section called “Federal Budget 101,” which describes the federal budget process, where the money comes from, where the money goes, borrowing and federal debt, and a glossary of terms. There is also a section for data on local spending and tax dollar spending.
Real-World Economics Summary: This site, compiled by an independent economist, provides data – displayed in visually accessible graphs – to show that popular “beliefs about the federal budget that are demonstrably inconsistent with” actual data. The site provides data showing that “the size of the federal budget as a fraction of our economy—that is, as a percent of gross domestic product (GDP)—in the 2000s was about where it was in the 1970s and was actually slightly smaller in 2000 and 2001 (17.6%) than it was in 1961 through 1964 (17.8%-18.2%)… [T]here were more federal government employees in 1967 (2.85 million civilians plus 3.45 million military) than there were in 2013 (2.77 million civilians plus 1.53 million military)... [F]ederal employees as a fraction of the civilian labor force has fallen by more than 50% since the 1960s.”
Figures from Real-World
Economics
Figures from National Priorities
12
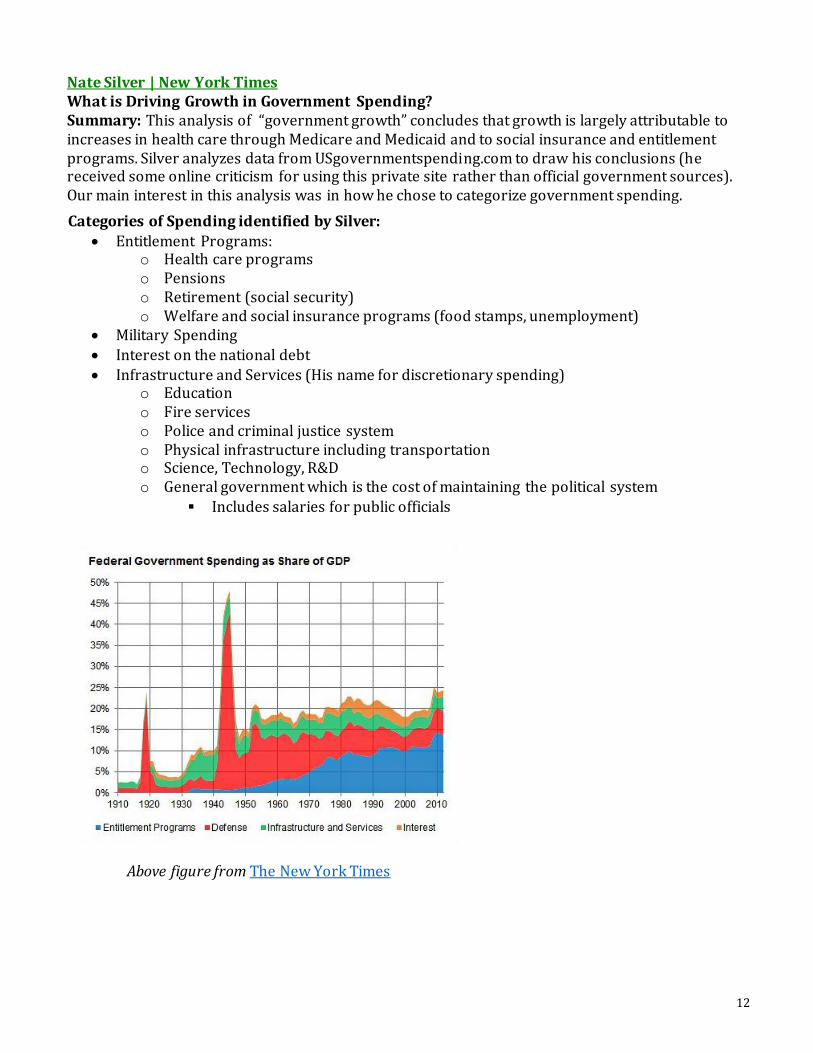
Nate Silver | New York Times What is Driving Growth in Government Spending? Summary: This analysis of “government growth” concludes that growth is largely attributable to increases in health care through Medicare and Medicaid and to social insurance and entitlement programs. Silver analyzes data from USgovernmentspending.com to draw his conclusions (he received some online criticism for using this private site rather than official government sources). Our main interest in this analysis was in how he chose to categorize government spending.
Categories of Spending identified by Silver:
Entitlement Programs: o Health care programs o Pensions o Retirement (social security) o Welfare and social insurance programs (food stamps, unemployment)
Military Spending Interest on the national debt
Infrastructure and Services (His name for discretionary spending) o Education o Fire services o Police and criminal justice system o Physical infrastructure including transportation o Science, Technology, R&D o General government which is the cost of maintaining the political system
Includes salaries for public officials
Above figure from The New York Times

13
Ezra Klein | The Washington Post The U.S. Government: An insurance conglomerate protected by a large, standing army Summary: An analysis of government expenditures using the President’s 2012 budget. Klein characterizes American government as an insurance company, given that the plurality of the budget is used for social insurance programs.
Above figure from The Washington Post
John J. DiIulio | Bring Back the Bureaucrats & Facing Up to Big Government in National Affairs Summary: John J. DiIulio Jr., a political scientist and former government employee, writes about “big government.” But, contrary to most others, he makes the case that government costs would be reduced if more of its work was done by government employees rather tha n contractors.
Categories of Spending Identified by Klein
o Domestic Discretionary o Military o Insurance o Medicare o Medicaid o Social Security o Tarp o Other o Interest on Debt
Figure from National Affairs
14
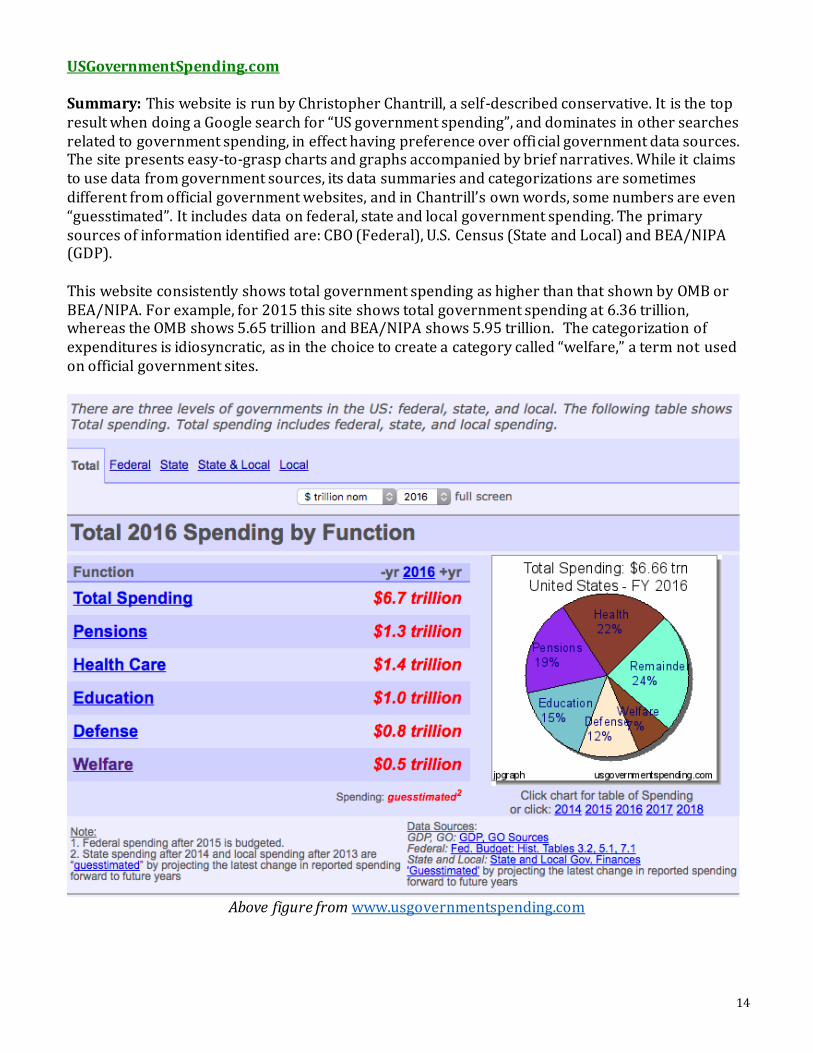
USGovernmentSpending.com Summary: This website is run by Christopher Chantrill, a self-described conservative. It is the top result when doing a Google search for “US government spending”, and dominates in other searches related to government spending, in effect having preference over official government data sources. The site presents easy-to-grasp charts and graphs accompanied by brief narratives. While it claims to use data from government sources, its data summaries and categorizations are sometimes different from official government websites, and in Chantrill’s own words, some numbers are even “guesstimated”. It includes data on federal, state and local government spending. The primary sources of information identified are: CBO (Federal), U.S. Census (State and Local) and BEA/NIPA (GDP). This website consistently shows total government spending as higher than that shown by OMB or BEA/NIPA. For example, for 2015 this site shows total government spending at 6.36 trillion, whereas the OMB shows 5.65 trillion and BEA/NIPA shows 5.95 trillion. The categorization of expenditures is idiosyncratic, as in the choice to create a category called “welfare,” a term not used on official government sites.
Above figure from www.usgovernmentspending.com
15
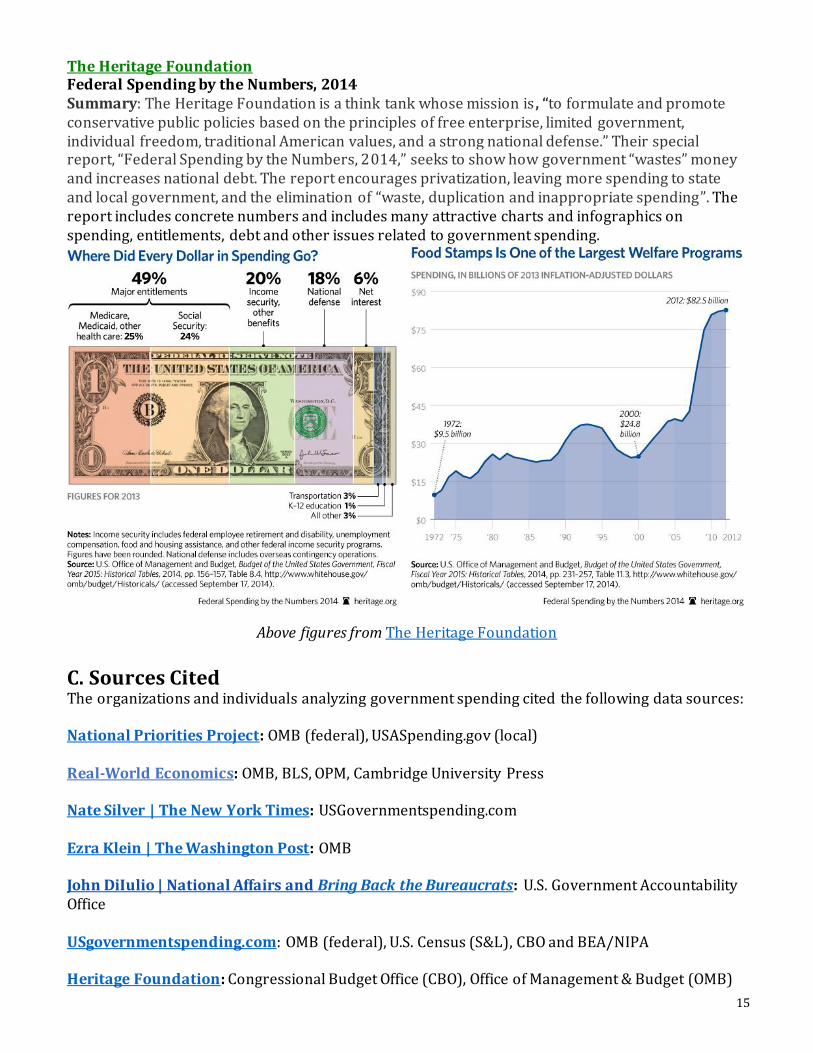
The Heritage Foundation Federal Spending by the Numbers, 2014 Summary: The Heritage Foundation is a think tank whose mission is , “to formulate and promote conservative public policies based on the principles of free enterprise, limited government, individual freedom, traditional American values, and a strong national defense.” Their special report, “Federal Spending by the Numbers, 2014,” seeks to show how government “wastes” money and increases national debt. The report encourages privatization, leaving more spending to state and local government, and the elimination of “waste, duplication and inappropriate spending”. The report includes concrete numbers and includes many attractive charts and infographics on spending, entitlements, debt and other issues related to government spending.
Above figures from The Heritage Foundation
C. Sources Cited The organizations and individuals analyzing government spending cited the following data sources: National Priorities Project: OMB (federal), USASpending.gov (local) Real-World Economics: OMB, BLS, OPM, Cambridge University Press Nate Silver | The New York Times: USGovernmentspending.com Ezra Klein | The Washington Post: OMB John DiIulio | National Affairs and Bring Back the Bureaucrats: U.S. Government Accountability Office USgovernmentspending.com: OMB (federal), U.S. Census (S&L), CBO and BEA/NIPA Heritage Foundation: Congressional Budget Office (CBO), Office of Management & Budget (OMB)