Online Business and Marketplaces
92
Online Business and Marketplaces by Yun Fong Lim yfl[email protected] Lee Kong Chian School of Business Singapore Management University July 26, 2020 Copyright c 2020 by Yun Fong Lim
Transcript of Online Business and Marketplaces
Online Business and Marketplaces
by
Yun Fong Lim
Lee Kong Chian School of Business
Singapore Management University
July 26, 2020
Copyright c© 2020 by Yun Fong Lim

To my family
Acknowledgments
The author thanks Xin Fang and Yini Gao for their comments on the initial draft of this
book. Special acknowledgment must go to Qiyuan Deng and Ruijie Zhang for creating
some of the figures in the book. This book is used as a textbook for OPIM633 Online
Business and Marketplaces, a graduate-level course at Singapore Management University.
The author thanks the students for many stimulating questions and constructive comments.
iii
Contents
Acknowledgments iii
1 Online Retailing 11.1 Introduction . . . . . . . . . . . . . . . . . . . . . . . . . . . . . . . . . . . . 11.2 Brick-and-mortar retailing versus online retailing . . . . . . . . . . . . . . . 21.3 Advantages of online retailing . . . . . . . . . . . . . . . . . . . . . . . . . . 41.4 Disadvantages of online retailing . . . . . . . . . . . . . . . . . . . . . . . . 91.5 Problems . . . . . . . . . . . . . . . . . . . . . . . . . . . . . . . . . . . . . 10
2 Online Marketplaces 122.1 Introduction . . . . . . . . . . . . . . . . . . . . . . . . . . . . . . . . . . . . 122.2 Why does an online retailer run a marketplace? . . . . . . . . . . . . . . . . 122.3 Advantages of selling on a marketplace . . . . . . . . . . . . . . . . . . . . . 142.4 Disadvantages of selling on a marketplace . . . . . . . . . . . . . . . . . . . 162.5 Online marketplaces with fulfillment service . . . . . . . . . . . . . . . . . . 16
2.5.1 Model . . . . . . . . . . . . . . . . . . . . . . . . . . . . . . . . . . . 182.5.2 Stackelberg game . . . . . . . . . . . . . . . . . . . . . . . . . . . . . 202.5.3 Results and insights . . . . . . . . . . . . . . . . . . . . . . . . . . . 21
2.6 Different types of online marketplaces . . . . . . . . . . . . . . . . . . . . . 222.7 Online retailing and marketplaces . . . . . . . . . . . . . . . . . . . . . . . . 232.8 Problems . . . . . . . . . . . . . . . . . . . . . . . . . . . . . . . . . . . . . 23
3 Analytics and AI for Online Retailing 253.1 Introduction . . . . . . . . . . . . . . . . . . . . . . . . . . . . . . . . . . . . 253.2 Online flash sales . . . . . . . . . . . . . . . . . . . . . . . . . . . . . . . . . 253.3 Operations of online flash sales . . . . . . . . . . . . . . . . . . . . . . . . . 273.4 Predicting value of fashion apparel . . . . . . . . . . . . . . . . . . . . . . . 28
3.4.1 Art versus science . . . . . . . . . . . . . . . . . . . . . . . . . . . . 283.4.2 Predicting the demand . . . . . . . . . . . . . . . . . . . . . . . . . . 293.4.3 Optimizing the price . . . . . . . . . . . . . . . . . . . . . . . . . . . 313.4.4 Summary of price optimization . . . . . . . . . . . . . . . . . . . . . 33
3.5 AI and the importance of data . . . . . . . . . . . . . . . . . . . . . . . . . 333.5.1 Two approaches in AI . . . . . . . . . . . . . . . . . . . . . . . . . . 333.5.2 The importance of data . . . . . . . . . . . . . . . . . . . . . . . . . 34
iv
4 Supply Chain Management for Online Retailing 374.1 Introduction . . . . . . . . . . . . . . . . . . . . . . . . . . . . . . . . . . . . 374.2 Aggregate supply chain planning for online retailing . . . . . . . . . . . . . 38
4.2.1 Problem description . . . . . . . . . . . . . . . . . . . . . . . . . . . 404.2.2 Deterministic optimization model . . . . . . . . . . . . . . . . . . . . 41
4.3 Last-mile delivery . . . . . . . . . . . . . . . . . . . . . . . . . . . . . . . . . 44
5 Logistics Equipment and Technologies for Online Retailing 465.1 Introduction . . . . . . . . . . . . . . . . . . . . . . . . . . . . . . . . . . . . 465.2 Storage equipment . . . . . . . . . . . . . . . . . . . . . . . . . . . . . . . . 47
5.2.1 Single-deep pallet racks . . . . . . . . . . . . . . . . . . . . . . . . . 475.2.2 Pallet flow racks . . . . . . . . . . . . . . . . . . . . . . . . . . . . . 475.2.3 Bin-shelving . . . . . . . . . . . . . . . . . . . . . . . . . . . . . . . . 485.2.4 Gravity flow racks . . . . . . . . . . . . . . . . . . . . . . . . . . . . 49
5.3 Handling equipment and technologies . . . . . . . . . . . . . . . . . . . . . . 495.3.1 Counterbalance lift trucks . . . . . . . . . . . . . . . . . . . . . . . . 495.3.2 Turret trucks . . . . . . . . . . . . . . . . . . . . . . . . . . . . . . . 505.3.3 Order-picker trucks . . . . . . . . . . . . . . . . . . . . . . . . . . . . 505.3.4 Automated storage and retrieval systems . . . . . . . . . . . . . . . 505.3.5 Conveyors . . . . . . . . . . . . . . . . . . . . . . . . . . . . . . . . . 515.3.6 Robots . . . . . . . . . . . . . . . . . . . . . . . . . . . . . . . . . . . 51
6 Order Fulfillment for Online Retailing 546.1 Introduction . . . . . . . . . . . . . . . . . . . . . . . . . . . . . . . . . . . . 546.2 How to prepare inventory . . . . . . . . . . . . . . . . . . . . . . . . . . . . 556.3 How to pick faster-moving products . . . . . . . . . . . . . . . . . . . . . . 556.4 How to pick slower-moving products . . . . . . . . . . . . . . . . . . . . . . 596.5 Problems . . . . . . . . . . . . . . . . . . . . . . . . . . . . . . . . . . . . . 61
7 Last-mile Delivery for Online Retailing 647.1 Introduction . . . . . . . . . . . . . . . . . . . . . . . . . . . . . . . . . . . . 647.2 Vehicle routing problem . . . . . . . . . . . . . . . . . . . . . . . . . . . . . 657.3 Challenges of last-mile delivery . . . . . . . . . . . . . . . . . . . . . . . . . 657.4 Solutions to last-mile delivery . . . . . . . . . . . . . . . . . . . . . . . . . . 667.5 Significance of online platforms for services . . . . . . . . . . . . . . . . . . 687.6 Uberization: US versus China . . . . . . . . . . . . . . . . . . . . . . . . . . 71
7.6.1 The O2O Revolution in China . . . . . . . . . . . . . . . . . . . . . 717.6.2 “Go light” versus “go heavy” . . . . . . . . . . . . . . . . . . . . . . 71
8 Omni-channel Retailing 748.1 Introduction . . . . . . . . . . . . . . . . . . . . . . . . . . . . . . . . . . . . 748.2 Advantages of shopping in brick-and-mortar stores . . . . . . . . . . . . . . 748.3 Advantages of shopping online . . . . . . . . . . . . . . . . . . . . . . . . . 758.4 Information-fulfillment matrix . . . . . . . . . . . . . . . . . . . . . . . . . . 758.5 Ways for brick-and-mortar stores to compete against online retailing . . . . 778.6 Integrating retail and logistics . . . . . . . . . . . . . . . . . . . . . . . . . . 79
v

About the author 83
vi
List of Tables
2.1 Different seller-to-buyer types of online retailers and marketplaces . . . . . 23
6.1 Applications of bucket brigades . . . . . . . . . . . . . . . . . . . . . . . . . 57
vii
List of Figures
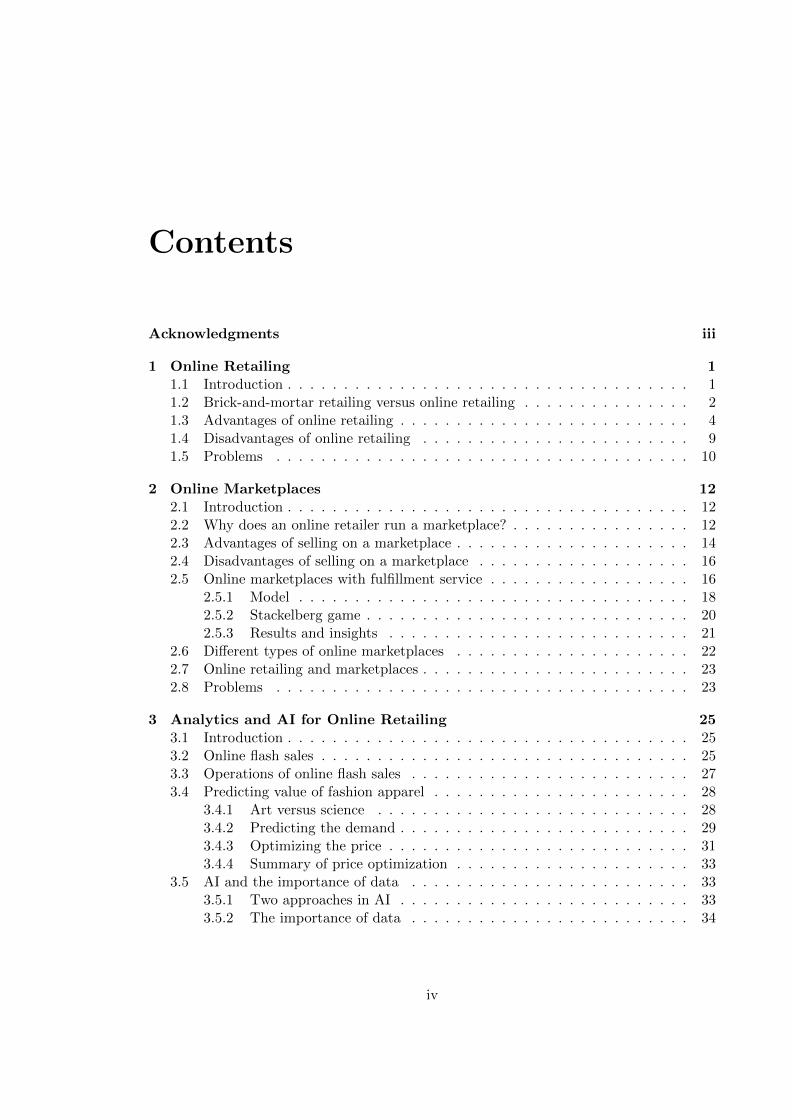
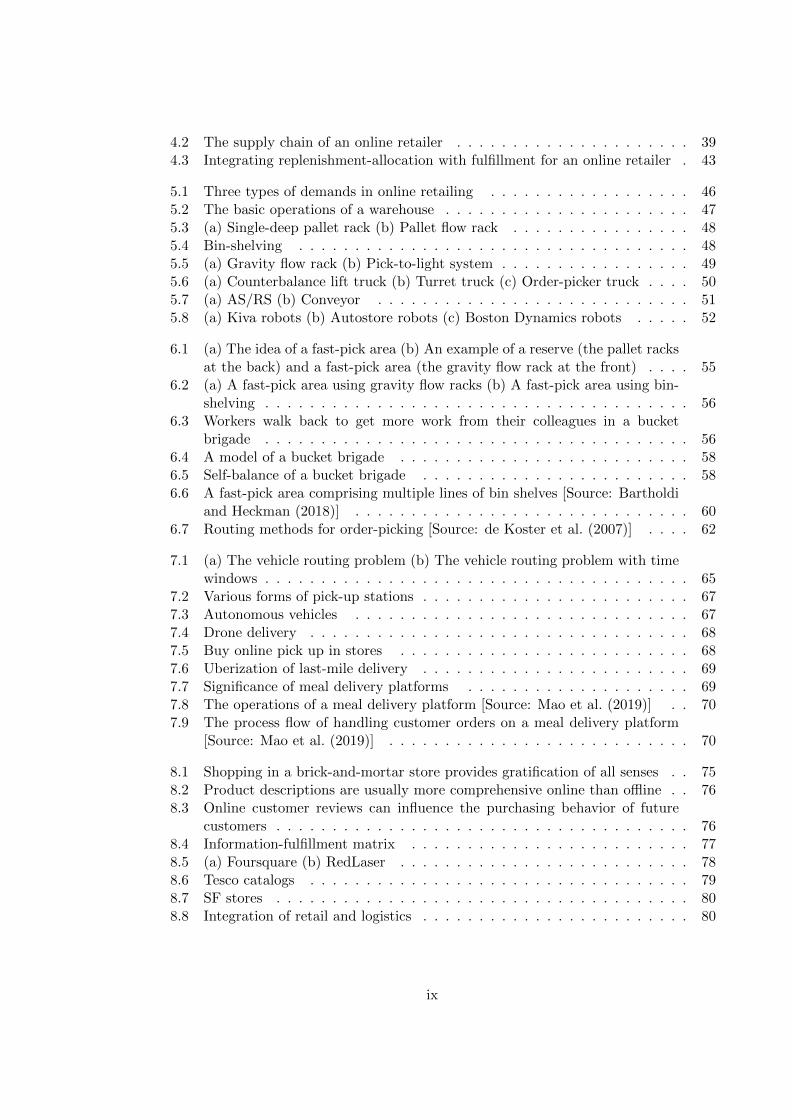
1.1 Size of Southeast Asia’s e-commerce market (in billions USD) [Source: Googleand Temasek Holdings, 2016.] . . . . . . . . . . . . . . . . . . . . . . . . . 2
1.2 Brick-and-mortar retailing versus online retailing . . . . . . . . . . . . . . . 31.3 Fulfillment and shipping costs . . . . . . . . . . . . . . . . . . . . . . . . . 41.4 Cash conversion cycles [Source: Data compiled from the presentation by
Tom Szkutak, CFO of Goldman Sachs Group Inc., Eighth Annual InternetConference, May 24, 2007, and “Amazon.com-going public,” HBS No. 899-003.] . . . . . . . . . . . . . . . . . . . . . . . . . . . . . . . . . . . . . . . 5
1.5 As of December 1, 2016, Amazon sells 368,876,590 items. [Source:https://www.scrapehero.com/how-many-products-does-amazon-sell-december-2016/] . . . . . . . . . . . . . . . . . . . . . . . . . . . . . . . . . . . . . . . 6
1.6 (a) The locations of fulfillment centers of an online retailer in the USA. (b)The population distribution of the USA. . . . . . . . . . . . . . . . . . . . 7
1.7 An online retailer can satisfy the demands of a zone from any warehousethat holds the inventory. . . . . . . . . . . . . . . . . . . . . . . . . . . . . 8
2.1 The business model of an online marketplace . . . . . . . . . . . . . . . . . 132.2 The sales (or demand) distribution in retailing typically has a long tail with
many slow-moving products . . . . . . . . . . . . . . . . . . . . . . . . . . 142.3 Amazon’s international marketplaces . . . . . . . . . . . . . . . . . . . . . 152.4 The business model of an online marketplace with fulfillment service . . . . 172.5 A capacitated retailer serving multiple manufacturers (sellers) . . . . . . . 192.6 Optimal revenue share r∗ and storage fee s∗ with b2 = 4,m2 = 5 . . . . . . 212.7 Expending capacity V benefits both the retailer and the manufacturers (b2 =
4,m2 = 5) . . . . . . . . . . . . . . . . . . . . . . . . . . . . . . . . . . . . 22
3.1 Product segmentation of the online flash sales industry in USA in 2015 . . 263.2 Different “events” on Gilt.com . . . . . . . . . . . . . . . . . . . . . . . . . 263.3 Different styles in an event on (a) Zulily.com and (b) Ruelala.com . . . . . 273.4 The operations of online flash sales (Ferreira et al., 2016) . . . . . . . . . . 283.5 The sell-through distribution of first exposure styles . . . . . . . . . . . . . 293.6 A linear demand model that predicts the demand based on the price . . . . 303.7 Price optimization framework . . . . . . . . . . . . . . . . . . . . . . . . . 323.8 Data is becoming like a natural resource . . . . . . . . . . . . . . . . . . . 34
4.1 Brick-and-mortar retailing versus online retailing . . . . . . . . . . . . . . . 38
viii
4.2 The supply chain of an online retailer . . . . . . . . . . . . . . . . . . . . . 394.3 Integrating replenishment-allocation with fulfillment for an online retailer . 43
5.1 Three types of demands in online retailing . . . . . . . . . . . . . . . . . . 465.2 The basic operations of a warehouse . . . . . . . . . . . . . . . . . . . . . . 475.3 (a) Single-deep pallet rack (b) Pallet flow rack . . . . . . . . . . . . . . . . 485.4 Bin-shelving . . . . . . . . . . . . . . . . . . . . . . . . . . . . . . . . . . . 485.5 (a) Gravity flow rack (b) Pick-to-light system . . . . . . . . . . . . . . . . . 495.6 (a) Counterbalance lift truck (b) Turret truck (c) Order-picker truck . . . . 505.7 (a) AS/RS (b) Conveyor . . . . . . . . . . . . . . . . . . . . . . . . . . . . 515.8 (a) Kiva robots (b) Autostore robots (c) Boston Dynamics robots . . . . . 52
6.1 (a) The idea of a fast-pick area (b) An example of a reserve (the pallet racksat the back) and a fast-pick area (the gravity flow rack at the front) . . . . 55
6.2 (a) A fast-pick area using gravity flow racks (b) A fast-pick area using bin-shelving . . . . . . . . . . . . . . . . . . . . . . . . . . . . . . . . . . . . . . 56
6.3 Workers walk back to get more work from their colleagues in a bucketbrigade . . . . . . . . . . . . . . . . . . . . . . . . . . . . . . . . . . . . . . 56
6.4 A model of a bucket brigade . . . . . . . . . . . . . . . . . . . . . . . . . . 586.5 Self-balance of a bucket brigade . . . . . . . . . . . . . . . . . . . . . . . . 586.6 A fast-pick area comprising multiple lines of bin shelves [Source: Bartholdi
and Heckman (2018)] . . . . . . . . . . . . . . . . . . . . . . . . . . . . . . 606.7 Routing methods for order-picking [Source: de Koster et al. (2007)] . . . . 62
7.1 (a) The vehicle routing problem (b) The vehicle routing problem with timewindows . . . . . . . . . . . . . . . . . . . . . . . . . . . . . . . . . . . . . . 65
7.2 Various forms of pick-up stations . . . . . . . . . . . . . . . . . . . . . . . . 677.3 Autonomous vehicles . . . . . . . . . . . . . . . . . . . . . . . . . . . . . . 677.4 Drone delivery . . . . . . . . . . . . . . . . . . . . . . . . . . . . . . . . . . 687.5 Buy online pick up in stores . . . . . . . . . . . . . . . . . . . . . . . . . . 687.6 Uberization of last-mile delivery . . . . . . . . . . . . . . . . . . . . . . . . 697.7 Significance of meal delivery platforms . . . . . . . . . . . . . . . . . . . . 697.8 The operations of a meal delivery platform [Source: Mao et al. (2019)] . . 707.9 The process flow of handling customer orders on a meal delivery platform
[Source: Mao et al. (2019)] . . . . . . . . . . . . . . . . . . . . . . . . . . . 70
8.1 Shopping in a brick-and-mortar store provides gratification of all senses . . 758.2 Product descriptions are usually more comprehensive online than offline . . 768.3 Online customer reviews can influence the purchasing behavior of future
customers . . . . . . . . . . . . . . . . . . . . . . . . . . . . . . . . . . . . . 768.4 Information-fulfillment matrix . . . . . . . . . . . . . . . . . . . . . . . . . 778.5 (a) Foursquare (b) RedLaser . . . . . . . . . . . . . . . . . . . . . . . . . . 788.6 Tesco catalogs . . . . . . . . . . . . . . . . . . . . . . . . . . . . . . . . . . 798.7 SF stores . . . . . . . . . . . . . . . . . . . . . . . . . . . . . . . . . . . . . 808.8 Integration of retail and logistics . . . . . . . . . . . . . . . . . . . . . . . . 80
ix
Chapter 1
Online Retailing
1.1 Introduction
As the Internet technology and mobile devices develop rapidly, more consumers opt for
online shopping. This results in a boom of online retail sales during the past decades.
For example, in 2019 the global e-commerce sales grew at a rate of 20.7% and reached
US$3.535 trillion, making up 14.1% of the total retail sales (eMarketer, 2019). By 2023,
the online retail sales will amount to US$6.542 trillion, which is equivalent to 22.0% of the
total retail sales. In Southeast Asia, the e-commerce market is projected to grow up to
US$88 billion in 2025 as shown in Figure 1.1, according to Google and Temasek Holdings.
Retailers may see their sales shrinking if they ignore e-commerce as customers continue to
shift to purchasing products online. The strong growth in sales makes online retailing a
significant industry to study.
A common way for online retailers to boost their revenue is to run online seasonal
sales, which have become one of the most popular online promotional events. For exam-
ple, Alibaba generated more than 163.8 billion yuan (approximately US$25.3 billion) of
revenue on the “Singles’ Day” in 2017, whereas JD.com reported a revenue of 127.1 bil-
lion yuan (approximately US$19.14 billion) on the same day (Russel, 2017). In contrast,
1
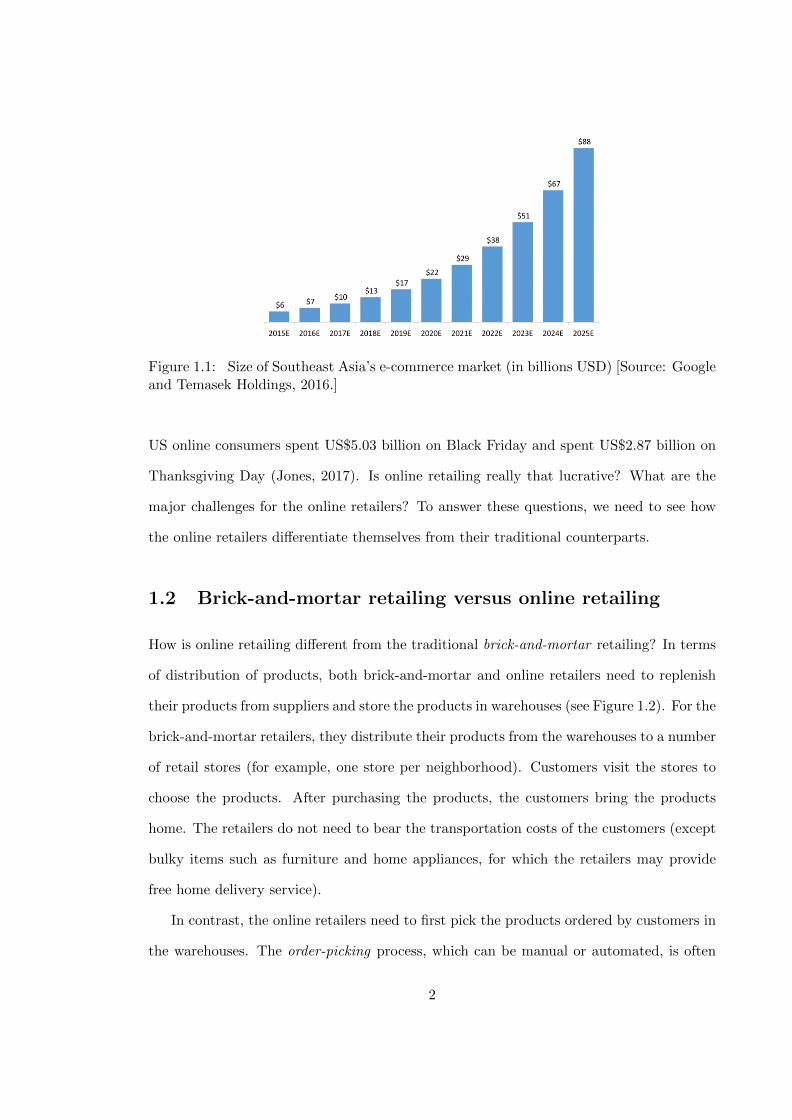
Figure 1.1: Size of Southeast Asia’s e-commerce market (in billions USD) [Source: Googleand Temasek Holdings, 2016.]
US online consumers spent US$5.03 billion on Black Friday and spent US$2.87 billion on
Thanksgiving Day (Jones, 2017). Is online retailing really that lucrative? What are the
major challenges for the online retailers? To answer these questions, we need to see how
the online retailers differentiate themselves from their traditional counterparts.
1.2 Brick-and-mortar retailing versus online retailing
How is online retailing different from the traditional brick-and-mortar retailing? In terms
of distribution of products, both brick-and-mortar and online retailers need to replenish
their products from suppliers and store the products in warehouses (see Figure 1.2). For the
brick-and-mortar retailers, they distribute their products from the warehouses to a number
of retail stores (for example, one store per neighborhood). Customers visit the stores to
choose the products. After purchasing the products, the customers bring the products
home. The retailers do not need to bear the transportation costs of the customers (except
bulky items such as furniture and home appliances, for which the retailers may provide
free home delivery service).
In contrast, the online retailers need to first pick the products ordered by customers in
the warehouses. The order-picking process, which can be manual or automated, is often
2
Figure 1.2: Brick-and-mortar retailing versus online retailing
considered the most costly operation within a warehouse. The online retailers incur a
fulfillment cost, which includes the costs of operating and staffing warehouses and customer
service centers as well as payment processing costs. The retailers then deliver the products
from the warehouses to numerous, individual customers, which are significantly more than
the brick-and-mortar stores. For example, Amazon receives more than 400 customer orders
every second during a typical cyber Monday. Each of these customer orders requires a
delivery. Thus, the online retailers also need to bear a shipping cost to get the products
to the customers. Figure 1.2 illustrates the main difference between brick-and-mortar
retailing and online retailing.
The fulfillment cost and the shipping cost constitute the major operating cost of most
online retailers. Figure 1.3 shows that the sum of the fulfillment and the shipping costs of
Amazon increased over time from 2010 to 2017. Reducing these costs becomes the main
challenge for the online retailers in this cut-throat industry.
3
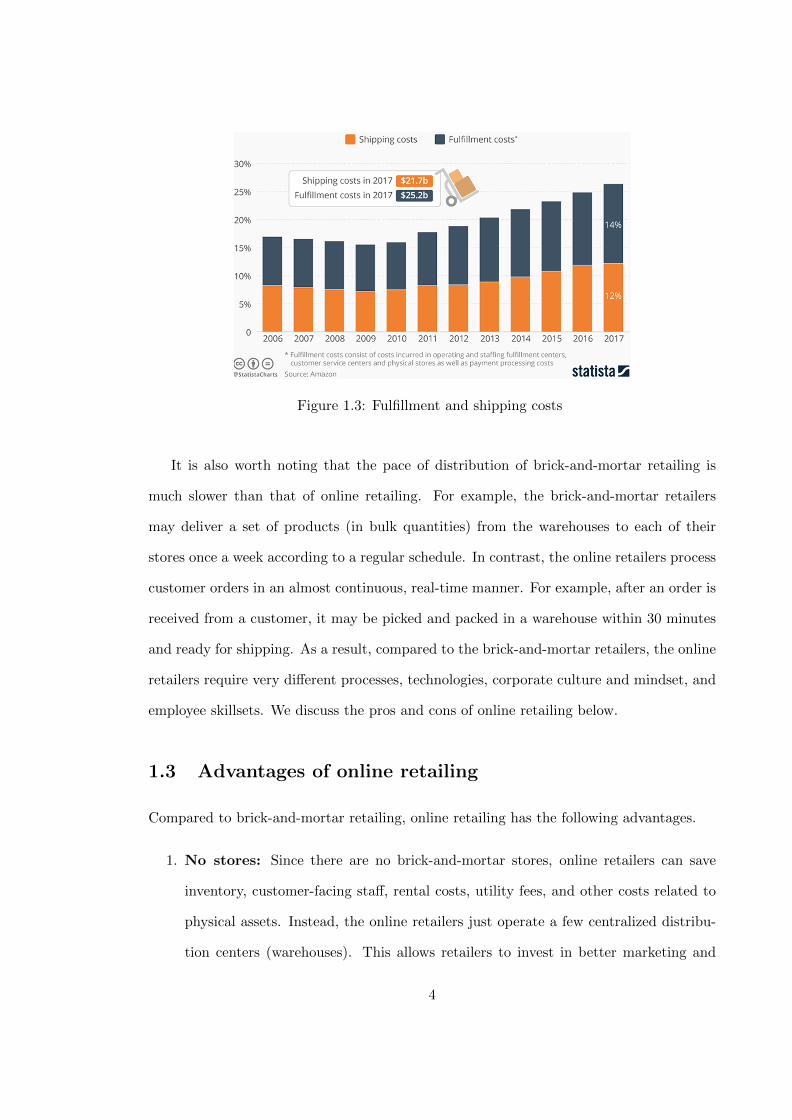
Figure 1.3: Fulfillment and shipping costs
It is also worth noting that the pace of distribution of brick-and-mortar retailing is
much slower than that of online retailing. For example, the brick-and-mortar retailers
may deliver a set of products (in bulk quantities) from the warehouses to each of their
stores once a week according to a regular schedule. In contrast, the online retailers process
customer orders in an almost continuous, real-time manner. For example, after an order is
received from a customer, it may be picked and packed in a warehouse within 30 minutes
and ready for shipping. As a result, compared to the brick-and-mortar retailers, the online
retailers require very different processes, technologies, corporate culture and mindset, and
employee skillsets. We discuss the pros and cons of online retailing below.
1.3 Advantages of online retailing
Compared to brick-and-mortar retailing, online retailing has the following advantages.
1. No stores: Since there are no brick-and-mortar stores, online retailers can save
inventory, customer-facing staff, rental costs, utility fees, and other costs related to
physical assets. Instead, the online retailers just operate a few centralized distribu-
tion centers (warehouses). This allows retailers to invest in better marketing and
4

customer experience on their e-commerce sites.
2. Access to market is easier: Through the Internet, the access to market for sellers
has become easier. Many online marketplaces such as Alibaba, Amazon, eBay, Flip-
kart, Lazada, and Taobao allow sellers to set up an online shop and sell products in
a short period of time. See how to sell through an online marketplace in Chapter 2.
3. Less inventory: With all the regions (countries) served by a few distribution cen-
ters, the online retailers’ inventory can be pooled. Thus, less safety stock is necessary.
This saves space for the online retailers.
4. Attractive cash conversion cycle: Some online retailers adopt the “stock less”
fulfillment model that allows them to achieve remarkable inventory turnover. This
results in an attractive cash conversion cycle. For example, Figure 1.4 shows that
Amazon receives payments from customers 19 days before it pays its supplier. In
contrast, a typical book retailer pays its supplier 78 days before it receives payments
from customers (Netessine, 2009).
Figure 1.4: Cash conversion cycles [Source: Data compiled from the presentation by TomSzkutak, CFO of Goldman Sachs Group Inc., Eighth Annual Internet Conference, May 24,2007, and “Amazon.com-going public,” HBS No. 899-003.]
5
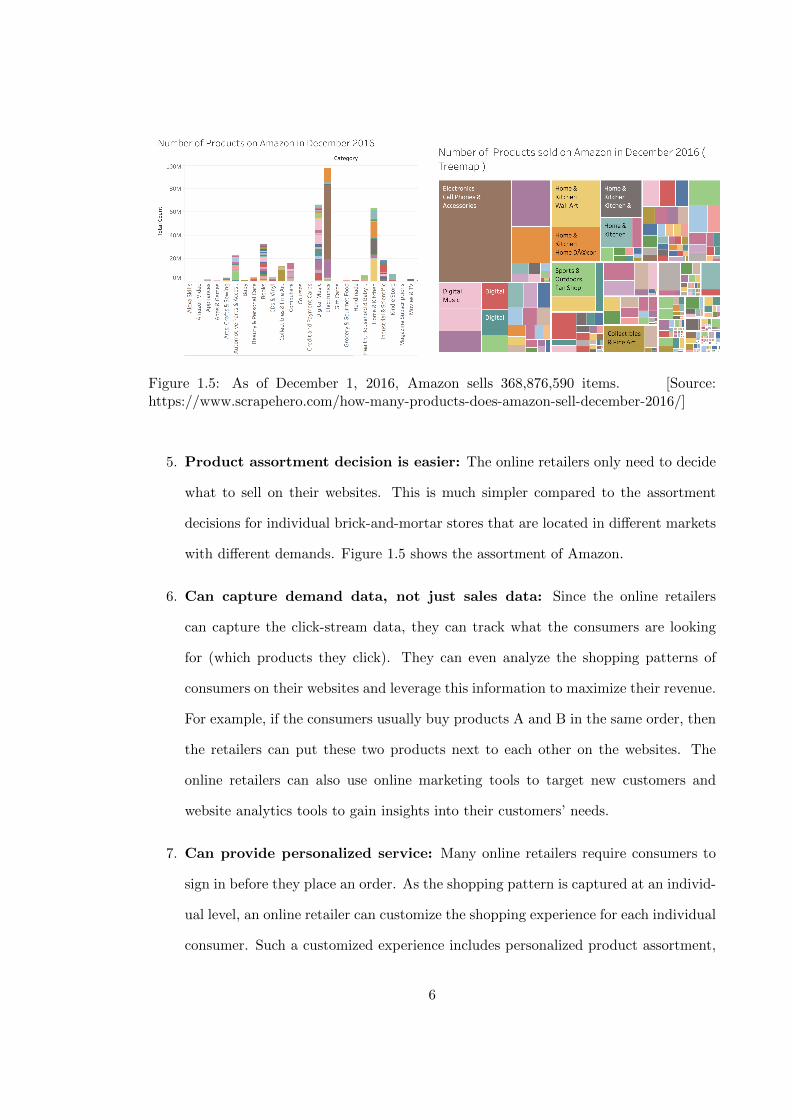
Figure 1.5: As of December 1, 2016, Amazon sells 368,876,590 items. [Source:https://www.scrapehero.com/how-many-products-does-amazon-sell-december-2016/]
5. Product assortment decision is easier: The online retailers only need to decide
what to sell on their websites. This is much simpler compared to the assortment
decisions for individual brick-and-mortar stores that are located in different markets
with different demands. Figure 1.5 shows the assortment of Amazon.
6. Can capture demand data, not just sales data: Since the online retailers
can capture the click-stream data, they can track what the consumers are looking
for (which products they click). They can even analyze the shopping patterns of
consumers on their websites and leverage this information to maximize their revenue.
For example, if the consumers usually buy products A and B in the same order, then
the retailers can put these two products next to each other on the websites. The
online retailers can also use online marketing tools to target new customers and
website analytics tools to gain insights into their customers’ needs.
7. Can provide personalized service: Many online retailers require consumers to
sign in before they place an order. As the shopping pattern is captured at an individ-
ual level, an online retailer can customize the shopping experience for each individual
consumer. Such a customized experience includes personalized product assortment,
6
(a) (b)
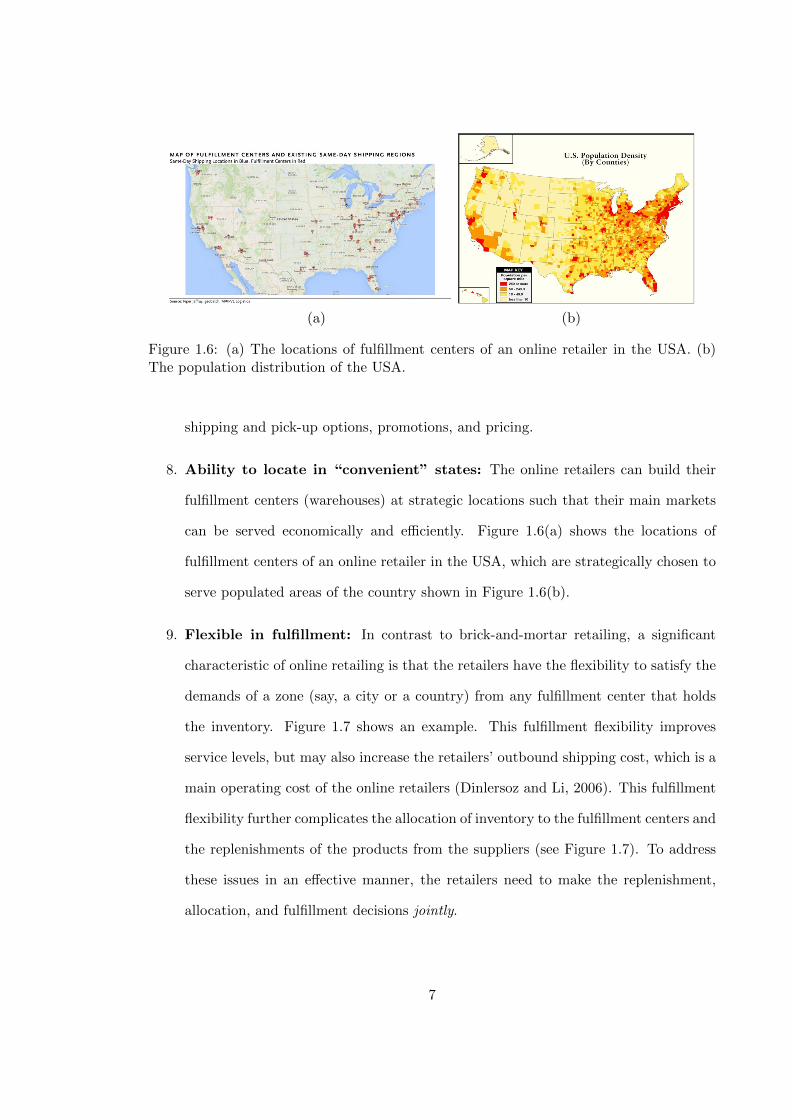
Figure 1.6: (a) The locations of fulfillment centers of an online retailer in the USA. (b)The population distribution of the USA.
shipping and pick-up options, promotions, and pricing.
8. Ability to locate in “convenient” states: The online retailers can build their
fulfillment centers (warehouses) at strategic locations such that their main markets
can be served economically and efficiently. Figure 1.6(a) shows the locations of
fulfillment centers of an online retailer in the USA, which are strategically chosen to
serve populated areas of the country shown in Figure 1.6(b).
9. Flexible in fulfillment: In contrast to brick-and-mortar retailing, a significant
characteristic of online retailing is that the retailers have the flexibility to satisfy the
demands of a zone (say, a city or a country) from any fulfillment center that holds
the inventory. Figure 1.7 shows an example. This fulfillment flexibility improves
service levels, but may also increase the retailers’ outbound shipping cost, which is a
main operating cost of the online retailers (Dinlersoz and Li, 2006). This fulfillment
flexibility further complicates the allocation of inventory to the fulfillment centers and
the replenishments of the products from the suppliers (see Figure 1.7). To address
these issues in an effective manner, the retailers need to make the replenishment,
allocation, and fulfillment decisions jointly.
7

Figure 1.7: An online retailer can satisfy the demands of a zone from any warehouse thatholds the inventory.
10. Tracking and locating inventory is easier: Since all the inventory is kept in a
few distribution centers, it is easier to track and locate the inventory compared to
doing so at many brick-and-mortar stores.
11. Inventory is less likely to be damaged: It is easier to manage (protect) the
inventory in a few distribution centers than at many brick-and-mortar stores.
12. Can diversify the products: The online retailers can diversify their product as-
sortment on their websites with almost the same business process. However, this
causes additional investment in back-end fulfillment for possibly lower-margin prod-
ucts with very different inventory turns. The retailers may no longer be able to
use the same equipment for packaging and assembling shipments. Furthermore, ex-
panded product variety leads to more inventory.
13. Can diversify beyond a country: A major advantage of online retailing over
brick-and-mortar retailing is the ability to expand the market beyond local customers
relatively faster. The online retailers can sell their products to other countries or du-
plicate the same business model in other regions or countries by targeted marketing,
8
offering their websites in different languages, or perhaps partnering with an over-
seas company. However, this causes other problems such as more inventory due to
more stocking points. Furthermore, complex trade rules and custom regulations for
cross-border e-commerce may lower the profit margins.
14. Sales taxes: The online retailers can choose to build their distribution centers at
locations with tax advantages. For example, Delaware in USA did not charge sales
tax on items shipped to consumers located outside the state (Netessine, 2009).
1.4 Disadvantages of online retailing
Compared to brick-and-mortar retailing, online retailing has the following disadvantages.
1. Fulfillment costs: The online retailers require a lot of manual labor as well as
automated technologies for the operations within their distribution centers and the
last-mile delivery to the receivers. The operations in the distribution centers include
receiving, storing, order-picking (most costly), checking, packing, and shipping. The
last-mile delivery of online retailing is notoriously costly because it requires delivery
to each individual consumer. Furthermore, the online retailers also need to deal with
returns from the customers.
2. Website and marketing costs: It is not cheap to plan, design, create, host, secure,
and maintain a professional e-commerce website, especially if the sales volumes are
large and growing. Furthermore, the online retailers require a generous budget for
online marketing to get the right customers for their products. This is especially so
for a crowded sector with popular keywords.
3. Technology development costs: The online retailers need to invest in fulfillment
software to connect with a variety of suppliers. They also need sophisticated soft-
ware to constantly change shipping prices and options, track products, and update
9

receiving and shipping. In addition, the significant growth of the online retail market
has induced sophisticated criminal activities. The online retailers must invest in the
latest security systems to protect their websites and transaction processes.
4. More susceptible to seasonal fluctuations: Online retailing is like “make-to-
order” because the online retailers cannot pre-pack their shipments. Thus, it requires
very accurate forecasts and an extremely efficient fulfillment process to absorb de-
mand spikes.
5. Customer trust and legal issues: Without a physical store with a track record
and face-to-face interactions with the customers, it can be challenging to build a
trusted brand name. Setting up a good online customer service system can be costly.
The online retailers also need to cope with legal issues associated with customer
rights that are attached to online sales.
1.5 Problems
1. Suppose a retailer, such as Barnes & Noble, decided to better integrate its online
and offline (physical) channels. What would be the advantages of better integration?
2. Suppose a retailer, such as Barnes & Noble, decided to better integrate its online
and offline (physical) channels. What are the operational challenges to achieve that
integration?
10
References
Dinlersoz, E.M., Li, H. 2006. The shipping strategies of internet retailers: Evidence frominternet book retailing. Quant. Marketing Econom. 4(4) 407–438.
eMarketer. 2019. Global Ecommerce 2019. https://www.emarketer.com/content/
global-ecommerce-2019.
Ferreira, K.J., Lee, B.H.A., Simchi-Levi, D. 2016. Analytics for an online retailer: Demandforecasting and price optimization. Manuf. Serv. Oper. Manag. 18(1): 69–88.
Jones, C. 2017. Retailers rejoice – and Cyber Monday sales couldset a record. https://www.usatoday.com/story/money/2017/11/26/
online-sales-surge-over-thanksgiving-day-weekend/892767001/, last retrievedon Nov. 27, 2017.
Local Offer Network. 2011. The daily deal phenomenon: A year in review. Report, LocalOffer Network, Chicago.
Netessine, S. 2009. Online Book Retailing: Operational Strategies. Wharton Case 23. TheWharton School of The University of Pennsylvania.
Ostapenko, N. 2013. Online discount luxury: In search of guilty customers. Internat. J.Bus. Soc. Res. 3(2):60–68.
Russel, J. 2017. Alibaba smashes its Single’s Day record once againas sales cross $25 billion. https://techcrunch.com/2017/11/11/
alibaba-smashes-its-singles-day-record/, last retrieved on Nov. 20, 2017.
Wolverson, R. 2012. High and low: Online flash sales go beyond fashion to survive. TimeMagazine 180(19):9–12.
11
Chapter 2
Online Marketplaces
2.1 Introduction
Many online retailers run an online marketplace where third-party sellers list their products
for sale. These products include books, video games, metal parts, soft drinks, honey, pasta
sauces, etc. An example of an online marketplace can be found on Amazon.com called Sell
on Amazon, where individual sellers can upload their product information (including the
inventory level) to the marketplace website. The sellers’ products are listed on the retailer’s
website with other products. After a customer places an order on the retailer’s website,
the seller ships the order directly to the customer. The retailer charges a percentage of the
payment as a commission and then transfers the remaining balance to the seller. Figure
2.1 illustrates the business model of an online marketplace. Other examples of online
retailers operating a marketplace include Lazada.com in Southeast Asia and Flipkart.com
in India. There are also pure-play marketplaces, which do not own any products, such as
Taobao.com and Tmall.com in China, eBay.com in USA, and Rakuten.com in Japan.
2.2 Why does an online retailer run a marketplace?
An online retailer runs a marketplace because of the following reasons.
12
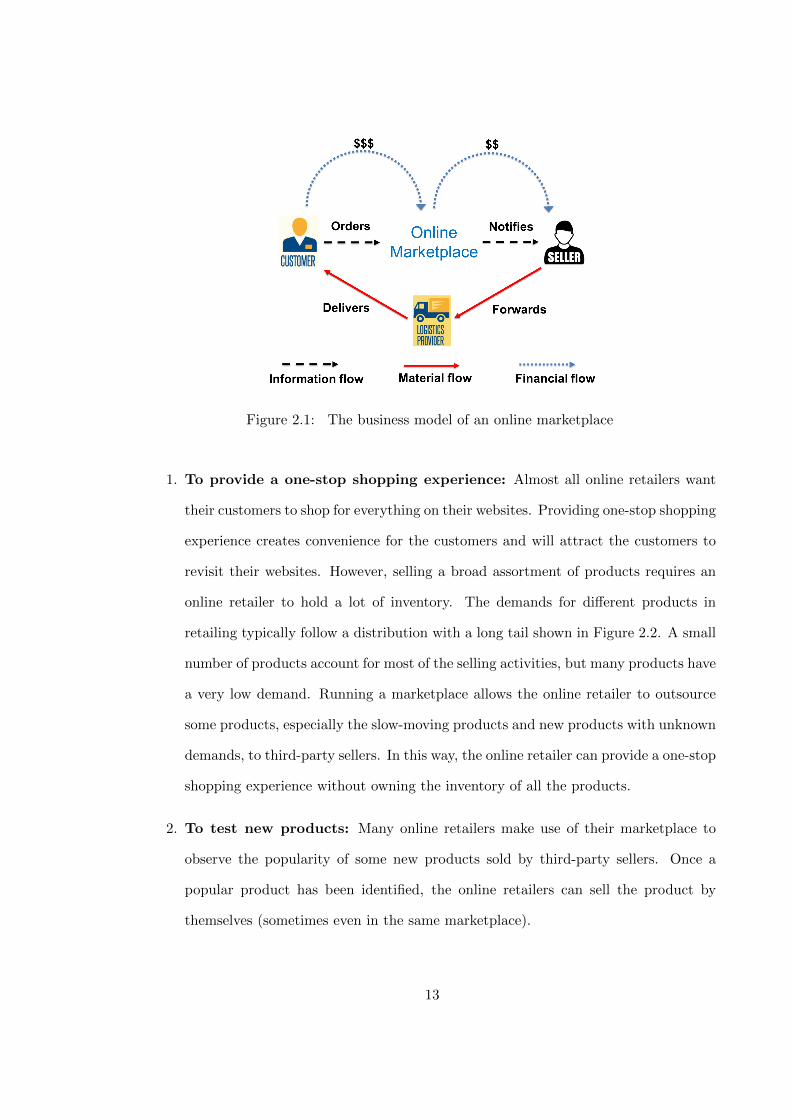
Figure 2.1: The business model of an online marketplace
1. To provide a one-stop shopping experience: Almost all online retailers want
their customers to shop for everything on their websites. Providing one-stop shopping
experience creates convenience for the customers and will attract the customers to
revisit their websites. However, selling a broad assortment of products requires an
online retailer to hold a lot of inventory. The demands for different products in
retailing typically follow a distribution with a long tail shown in Figure 2.2. A small
number of products account for most of the selling activities, but many products have
a very low demand. Running a marketplace allows the online retailer to outsource
some products, especially the slow-moving products and new products with unknown
demands, to third-party sellers. In this way, the online retailer can provide a one-stop
shopping experience without owning the inventory of all the products.
2. To test new products: Many online retailers make use of their marketplace to
observe the popularity of some new products sold by third-party sellers. Once a
popular product has been identified, the online retailers can sell the product by
themselves (sometimes even in the same marketplace).
13
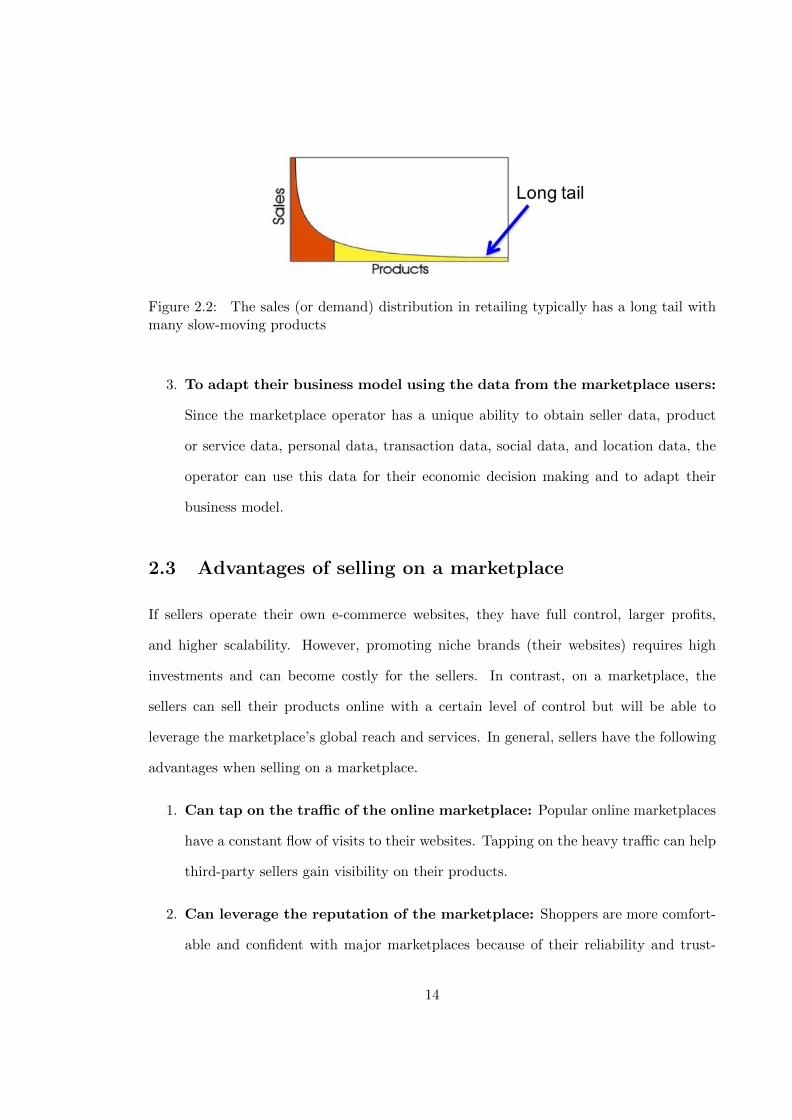
Figure 2.2: The sales (or demand) distribution in retailing typically has a long tail withmany slow-moving products
3. To adapt their business model using the data from the marketplace users:
Since the marketplace operator has a unique ability to obtain seller data, product
or service data, personal data, transaction data, social data, and location data, the
operator can use this data for their economic decision making and to adapt their
business model.
2.3 Advantages of selling on a marketplace
If sellers operate their own e-commerce websites, they have full control, larger profits,
and higher scalability. However, promoting niche brands (their websites) requires high
investments and can become costly for the sellers. In contrast, on a marketplace, the
sellers can sell their products online with a certain level of control but will be able to
leverage the marketplace’s global reach and services. In general, sellers have the following
advantages when selling on a marketplace.
1. Can tap on the traffic of the online marketplace: Popular online marketplaces
have a constant flow of visits to their websites. Tapping on the heavy traffic can help
third-party sellers gain visibility on their products.
2. Can leverage the reputation of the marketplace: Shoppers are more comfort-
able and confident with major marketplaces because of their reliability and trust-
14
worthiness. By selling on these marketplaces, third-party sellers can leverage the
reputation of the online marketplaces.
3. Can control risks: The sellers are under the protections by the marketplace against
the risks of unpaid bills, fraud, disputes, etc.
4. It is cheaper and quicker to begin: Since the marketplace takes care of much
of the hassle of selling online such as website design, hosting of servers, processing
of orders, e-payment, financial transactions, and possibly even fulfillment, the sellers
might save significant costs. By selling on the marketplace, third-party sellers do not
need to make advance investments into the set-up, design, and marketing of their
own websites.
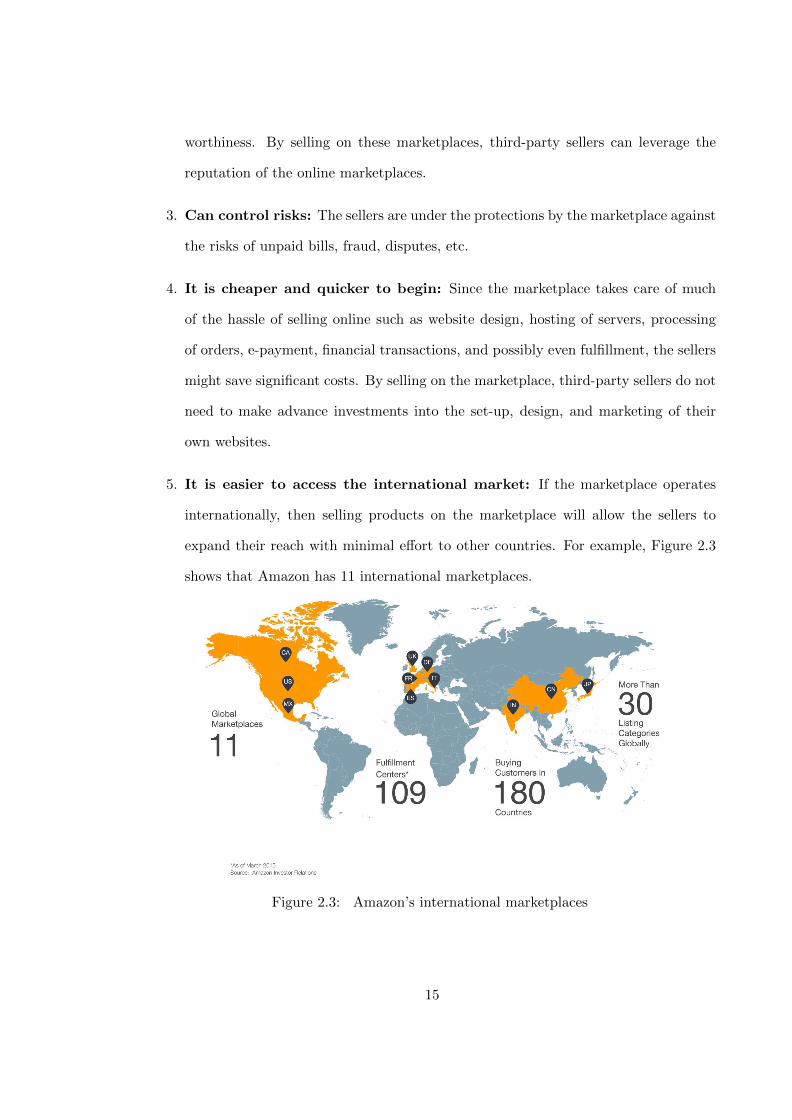
5. It is easier to access the international market: If the marketplace operates
internationally, then selling products on the marketplace will allow the sellers to
expand their reach with minimal effort to other countries. For example, Figure 2.3
shows that Amazon has 11 international marketplaces.
Figure 2.3: Amazon’s international marketplaces
15
2.4 Disadvantages of selling on a marketplace
On the other hand, sellers have the following disadvantages when selling on a marketplace.
1. Rules and regulations: The sellers need to comply with many rules and regulations
when selling on the marketplace. For example, the sellers may not be able to brand
themselves in the way they wish or they may not be allowed to sell certain products.
In addition, it can be a hassle for the sellers to add products to the marketplace as
they need to meet many criteria.
2. Fees: In general, the sellers need to pay fees to the marketplace. These fees may
include a monthly subscription fee and a commission for each successful transaction.
Selling on a marketplace generally leads to a lower profit margin compared to selling
on the sellers’ own websites.
3. Limited personalization options: There are limited personalization options de-
termined by the marketplace operator. The sellers have less control of their brands
and customers. Furthermore, communication with the customers about their pur-
chases are generally handled by the marketplace operator.
4. Fierce competition: The sellers may face a fierce competition on the marketplace.
In some cases, the marketplace operator also sells the same products to compete
with the sellers.
5. Less control on pricing: The marketplace may force the sellers to offer discounts
for their products during promotion periods to attract more customers.
2.5 Online marketplaces with fulfillment service
Some marketplaces provide fulfillment service for their sellers. For example, to save logistics
costs, sellers on the Amazon’s marketplace can enroll in the Fulfillment by Amazon (FBA)
16
program (see http://services.amazon.com). Under the FBA program, sellers store their
products in a fulfillment center managed by Amazon. Upon receiving a customer order
from her website, Amazon picks, packs, and ships the order to the customer. In addition,
the FBA program also provides customer service that includes handling customer inquiries,
refunds, and returns to shoppers for the listed products.
Under the FBA program, each seller determines the retail price of his product and its
number of units to list for sale. Amazon charges only when a unit of the product is sold.
For each unit of the product sold, Amazon keeps a certain percentage of its retail price
and deposits the remaining balance to the seller’s account. Units that are not sold after a
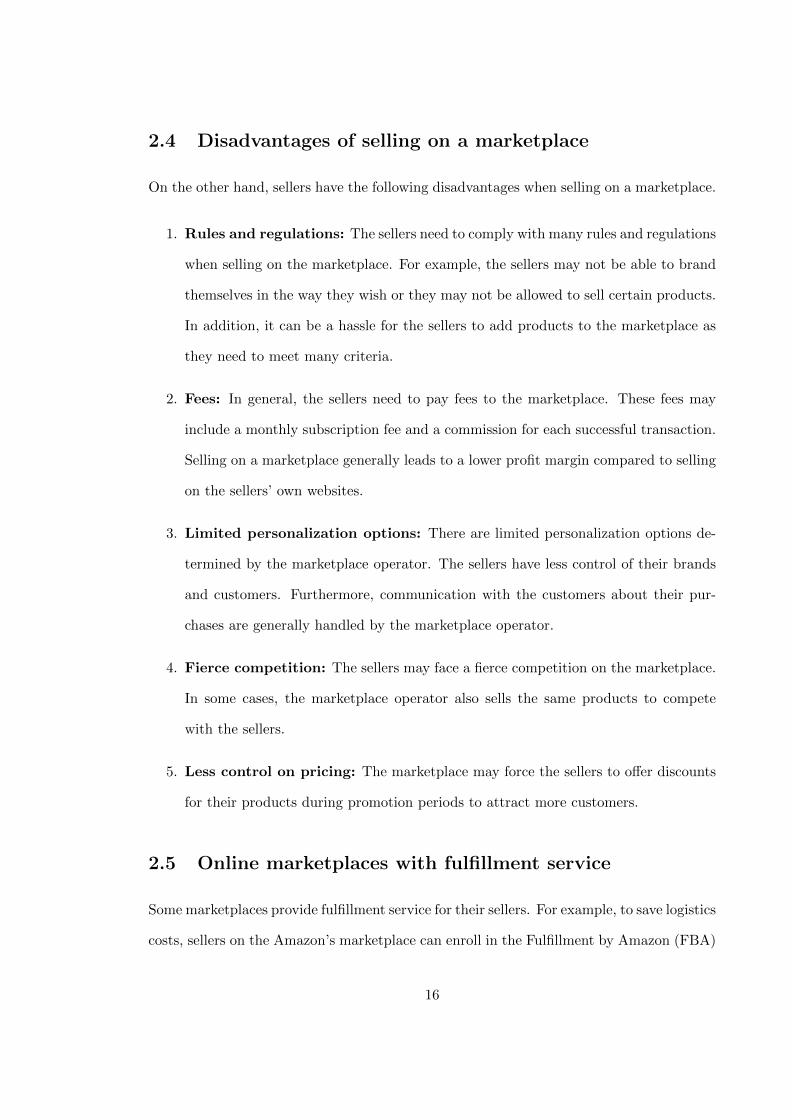
period of time will be returned to the seller and the listing is closed. Figure 2.4 illustrates
the business model of an online marketplace with fulfillment service.
Figure 2.4: The business model of an online marketplace with fulfillment service
Formally, the marketplace operator (Amazon) offers a consignment contract with rev-
enue sharing to each seller. The marketplace operator prefers this type of contract because
of the following reasons: (i) The marketplace operator bears no overstocking risk. (ii) Un-
like in traditional wholesale-price contracts, the marketplace operator does not need to
negotiate with the individual sellers or to determine the retail price and production quan-
17

tity for every product, which could be tedious when there are many sellers. (iii) Although
a consignment contract with revenue sharing requires every seller to monitor his sales, the
implementation is straightforward in an online setting because every transaction is tracked,
and so splitting the revenue can be done automatically.
A marketplace operator typically prefers to provide fulfillment service for their sellers
because of the following reasons:
1. The marketplace operator owns all the detailed data of the products and the sellers
including consumer demography, shopping behavior, delivery time, trends, etc.
2. The marketplace operator can maintain her brand image by delivering the products
to the customers.
3. It becomes harder for the sellers to detach from the marketplace as they rely on the
marketplace’s fulfillment service.
Other marketplace operators that provide fulfillment service for their sellers include
Lazada.com in Southeast Asia and VIP.com in China.
2.5.1 Model
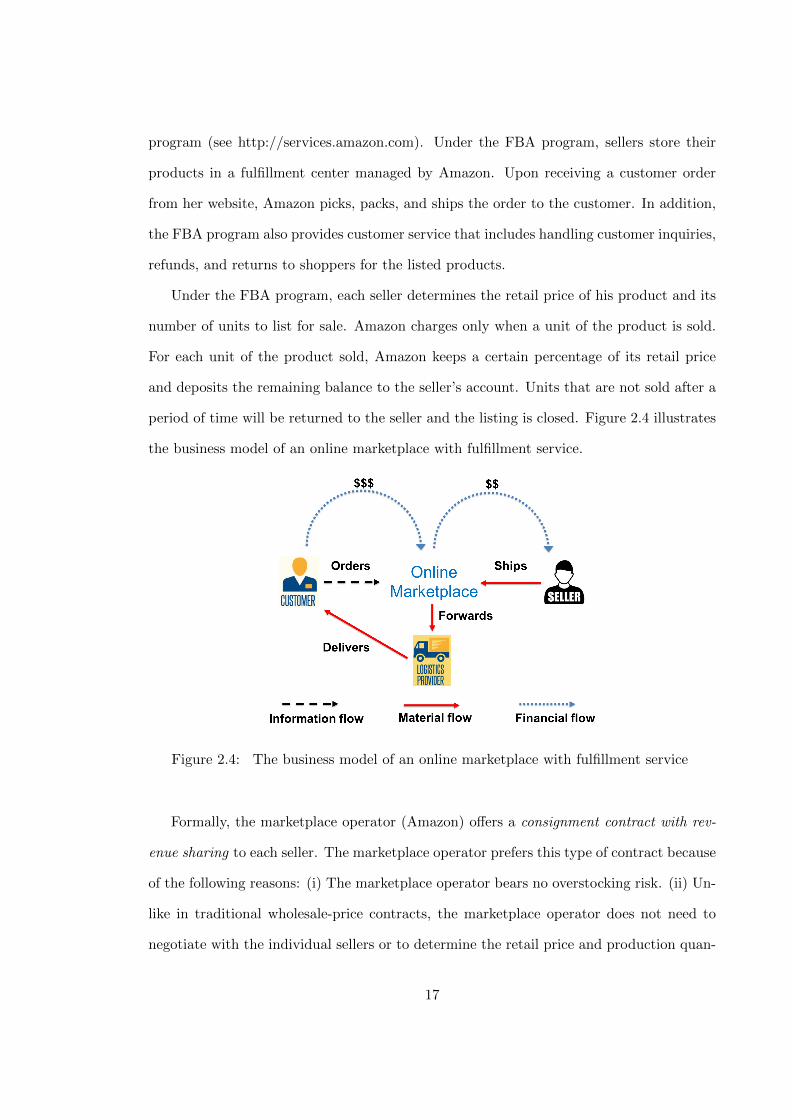
We consider a model illustrated in Figure 2.5. A marketplace operator (or retailer) with
limited storage space sells n independent products over a single period. The total demand
for each product over the selling period is price sensitive and uncertain. Each product is
produced by a distinct manufacturer (seller) before the start of the selling period. The
marketplace operator offers a consignment contract with revenue sharing to each manufac-
turer. Under each contract, the ownership of a product belongs to its manufacturer when
it is stored in the marketplace operator’s warehouse. No money is transacted until a unit
of the product is sold. For each unit of any product sold, the marketplace operator keeps a
fraction r ∈ [0, 1) of the revenue for herself and remits the rest 1− r to the corresponding
manufacturer. The marketplace operator first specifies the common revenue share r for
18
Figure 2.5: A capacitated retailer serving multiple manufacturers (sellers)
all the products (for example, Amazon publishes the revenue share on its website). After
that each manufacturer i determines the retail price pi and the production quantity qi for
his product.
We make the following assumptions.
1. This is a single-period problem.
2. The demand for product i is price sensitive and random: Di(pi) = aip−bii εi, where ai
represents the base demand, bi represents the price elasticity of product i, and εi is
a random variable.
3. For each unit of product i, the marketplace operator charges manufacturer i a storage
fee svi, where s is the storage fee per unit volume and vi is the volume of each unit of
product i. For each unit of product i, let Mi = mi +svi and Ri = di−svi denote the
costs incurred to manufacturer i and the marketplace operator respectively, where
mi is the manufacturing cost per unit of product i and di is the distribution cost per
unit of product i. Thus, each unit of product i incurs a total cost ci = Mi +Ri.
19
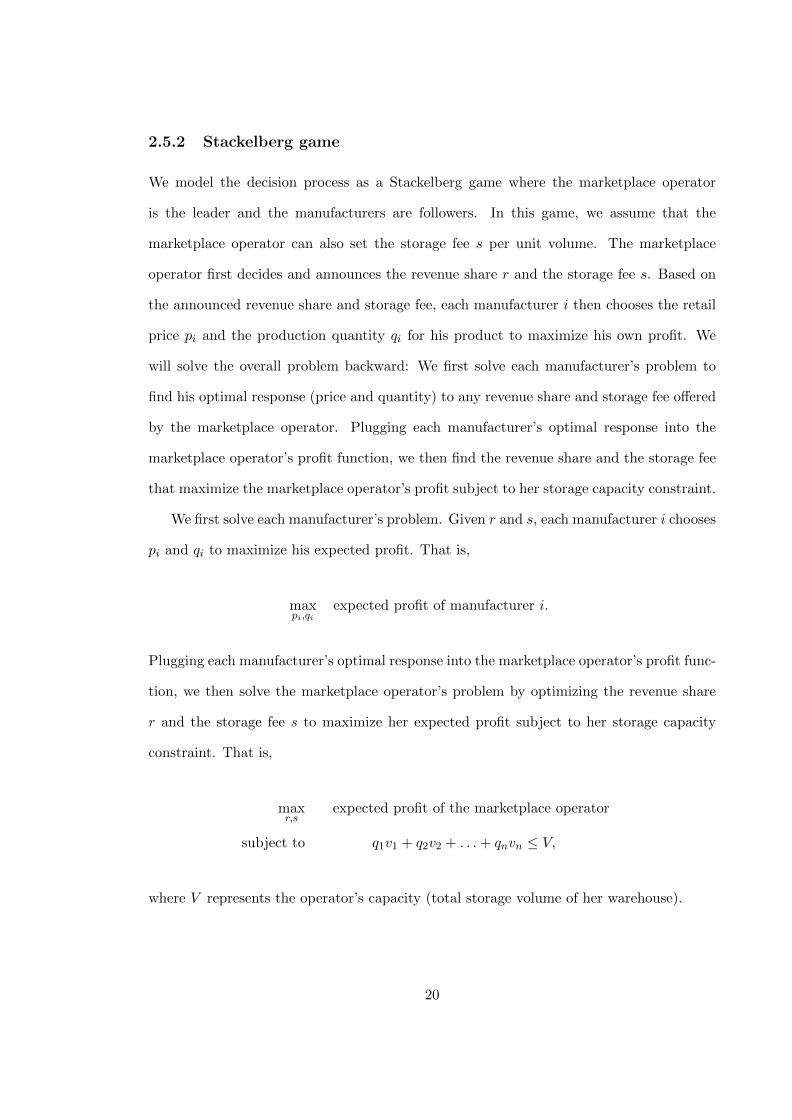
2.5.2 Stackelberg game
We model the decision process as a Stackelberg game where the marketplace operator
is the leader and the manufacturers are followers. In this game, we assume that the
marketplace operator can also set the storage fee s per unit volume. The marketplace
operator first decides and announces the revenue share r and the storage fee s. Based on
the announced revenue share and storage fee, each manufacturer i then chooses the retail
price pi and the production quantity qi for his product to maximize his own profit. We
will solve the overall problem backward: We first solve each manufacturer’s problem to
find his optimal response (price and quantity) to any revenue share and storage fee offered
by the marketplace operator. Plugging each manufacturer’s optimal response into the
marketplace operator’s profit function, we then find the revenue share and the storage fee
that maximize the marketplace operator’s profit subject to her storage capacity constraint.
We first solve each manufacturer’s problem. Given r and s, each manufacturer i chooses
pi and qi to maximize his expected profit. That is,
maxpi,qi
expected profit of manufacturer i.
Plugging each manufacturer’s optimal response into the marketplace operator’s profit func-
tion, we then solve the marketplace operator’s problem by optimizing the revenue share
r and the storage fee s to maximize her expected profit subject to her storage capacity
constraint. That is,
maxr,s
expected profit of the marketplace operator
subject to q1v1 + q2v2 + . . .+ qnvn ≤ V,
where V represents the operator’s capacity (total storage volume of her warehouse).
20
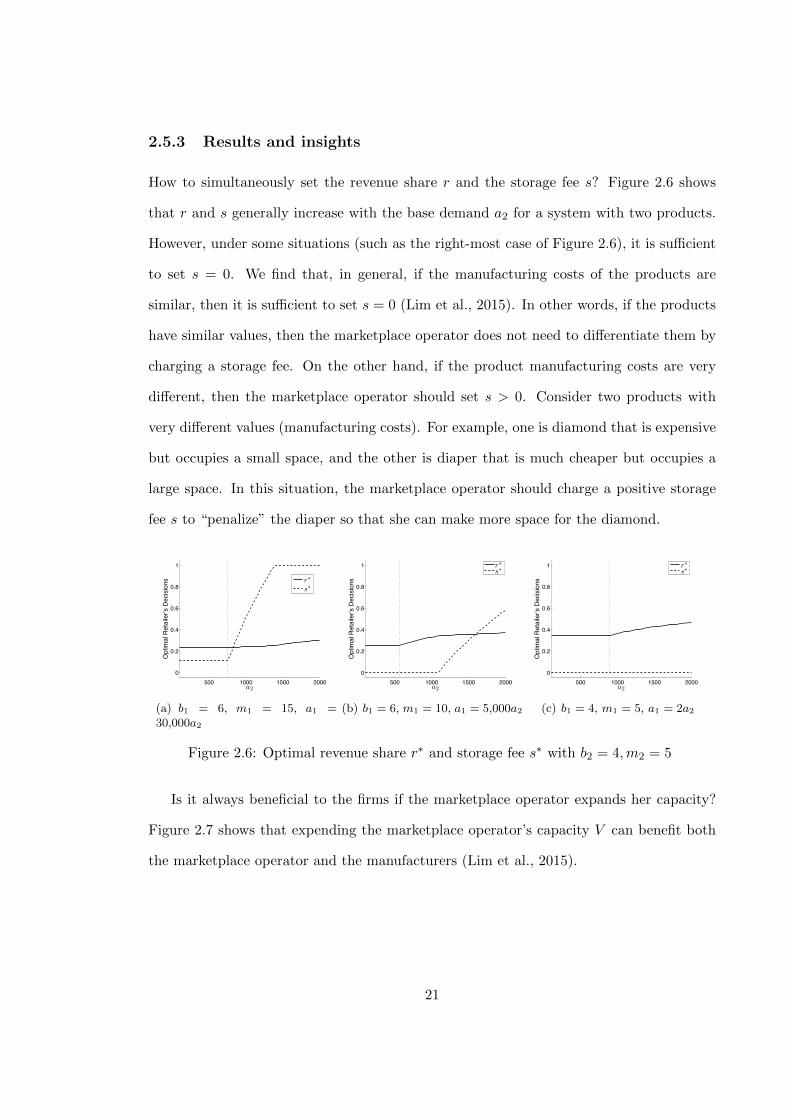
2.5.3 Results and insights
How to simultaneously set the revenue share r and the storage fee s? Figure 2.6 shows
that r and s generally increase with the base demand a2 for a system with two products.
However, under some situations (such as the right-most case of Figure 2.6), it is sufficient
to set s = 0. We find that, in general, if the manufacturing costs of the products are
similar, then it is sufficient to set s = 0 (Lim et al., 2015). In other words, if the products
have similar values, then the marketplace operator does not need to differentiate them by
charging a storage fee. On the other hand, if the product manufacturing costs are very
different, then the marketplace operator should set s > 0. Consider two products with
very different values (manufacturing costs). For example, one is diamond that is expensive
but occupies a small space, and the other is diaper that is much cheaper but occupies a
large space. In this situation, the marketplace operator should charge a positive storage
fee s to “penalize” the diaper so that she can make more space for the diamond.
500 1000 1500 20000
0.2
0.4
0.6
0.8
1
a2
Opt
imal
Ret
aile
r’s D
ecis
ions
r∗
s∗
(a) b1 = 6, m1 = 15, a1 =30,000a2
500 1000 1500 20000
0.2
0.4
0.6
0.8
1
a2
Opt
imal
Ret
aile
r’s D
ecis
ions
r∗s∗
(b) b1 = 6, m1 = 10, a1 = 5,000a2
500 1000 1500 20000
0.2
0.4
0.6
0.8
1
a2
Opt
imal
Ret
aile
r’s D
ecis
ions
r∗s∗
(c) b1 = 4, m1 = 5, a1 = 2a2
Figure 2.6: Optimal revenue share r∗ and storage fee s∗ with b2 = 4,m2 = 5
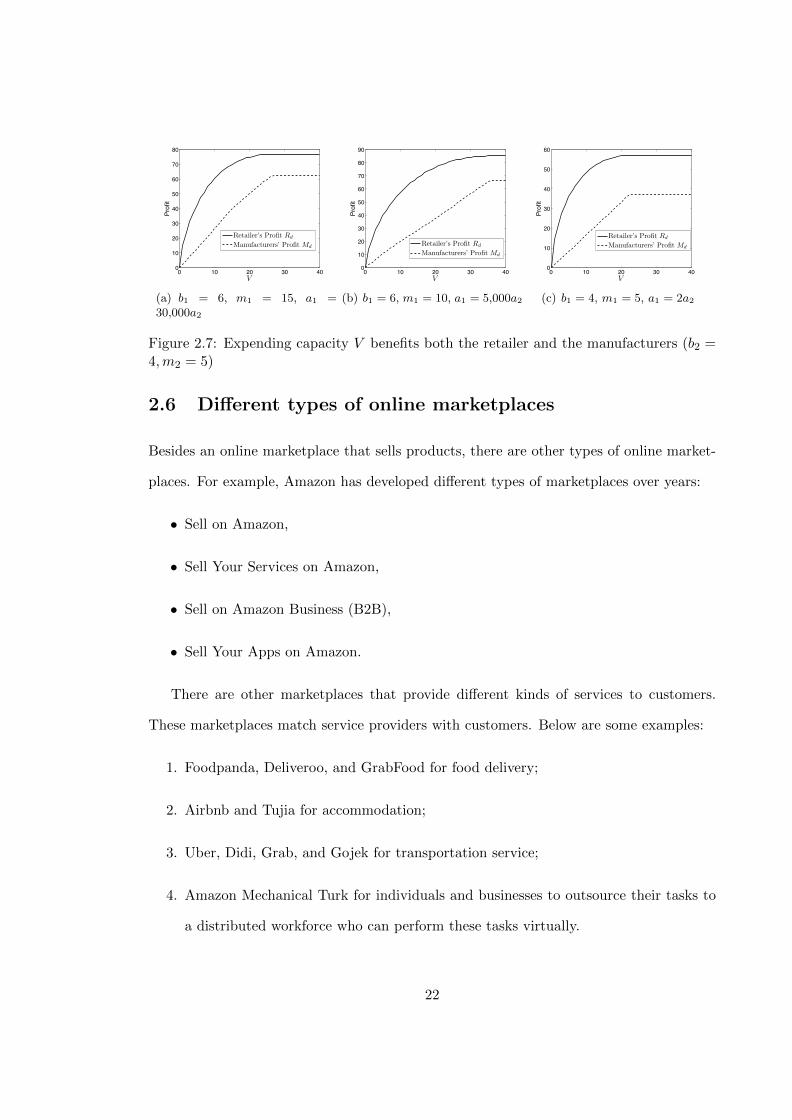
Is it always beneficial to the firms if the marketplace operator expands her capacity?
Figure 2.7 shows that expending the marketplace operator’s capacity V can benefit both
the marketplace operator and the manufacturers (Lim et al., 2015).
21
0 10 20 30 400
10
20
30
40
50
60
70
80
V
Prof
it
Retailer’s Profit Rd
Manufacturers’ Profit Md
(a) b1 = 6, m1 = 15, a1 =30,000a2
0 10 20 30 400
10
20
30
40
50
60
70
80
90
V
Prof
it
Retailer’s Profit Rd
Manufacturers’ Profit Md
(b) b1 = 6, m1 = 10, a1 = 5,000a2
0 10 20 30 400
10
20
30
40
50
60
V
Prof
it
Retailer’s Profit Rd
Manufacturers’ Profit Md
(c) b1 = 4, m1 = 5, a1 = 2a2
Figure 2.7: Expending capacity V benefits both the retailer and the manufacturers (b2 =4,m2 = 5)
2.6 Different types of online marketplaces
Besides an online marketplace that sells products, there are other types of online market-
places. For example, Amazon has developed different types of marketplaces over years:
• Sell on Amazon,
• Sell Your Services on Amazon,
• Sell on Amazon Business (B2B),
• Sell Your Apps on Amazon.
There are other marketplaces that provide different kinds of services to customers.
These marketplaces match service providers with customers. Below are some examples:
1. Foodpanda, Deliveroo, and GrabFood for food delivery;
2. Airbnb and Tujia for accommodation;
3. Uber, Didi, Grab, and Gojek for transportation service;
4. Amazon Mechanical Turk for individuals and businesses to outsource their tasks to
a distributed workforce who can perform these tasks virtually.
22

2.7 Online retailing and marketplaces
Different forms of online retailers and marketplaces exist in terms of the types of sellers
and buyers. Table 2.1 shows some examples.
Table 2.1: Different seller-to-buyer types of online retailers and marketplacesSeller-to-buyer Type Retailer/Marketplace Examples
B2B online retailer Office Depot, Nippon PaintB2B marketplace Alibaba, AmazonB2C online retailer JD, AmazonB2C marketplace Lazada, AmazonC2C marketplace eBay, Taobao
2.8 Problems
1. Which business model is better for Amazon: Sell on Amazon or Fulfillment by Ama-
zon?
2. Which business model is better for a third-party seller: Sell on Amazon or Fulfillment
by Amazon?
23
References
Lim, Y.F., Wang, Y., Wu, Y. 2015. Consignment contracts with revenue sharing for acapacitated retailer and multiple manufacturers. Manufacturing and Service OperationsManagement 17(4), 527–537.
24
Chapter 3
Analytics and AI for OnlineRetailing
3.1 Introduction
Predictive commerce is getting increasingly common. Online retailers are trying to help
customers to find products precisely when their need arises, or even before the customers
perceive that need. To achieve that, the online retailers need to design a customer ex-
perience that leverages data analytics and large-scale automation (often called artificial
intelligence (AI) or machine learning) with knowledge of human behavior. We will illus-
trate this idea using an example from online flash sales as follows.
3.2 Online flash sales
Online flash sales were pioneered by Vente Privee in France in 2001. Each online flash sale
sells products at a discount for a short period (often less than one week). To hold flash
sales, online retailers change assortment of products every week or even multiple times a
day (in contrast, traditional retailers typically change their assortment only a few times a
year). This is to create a sense of urgency among customers to induce impulse purchases.
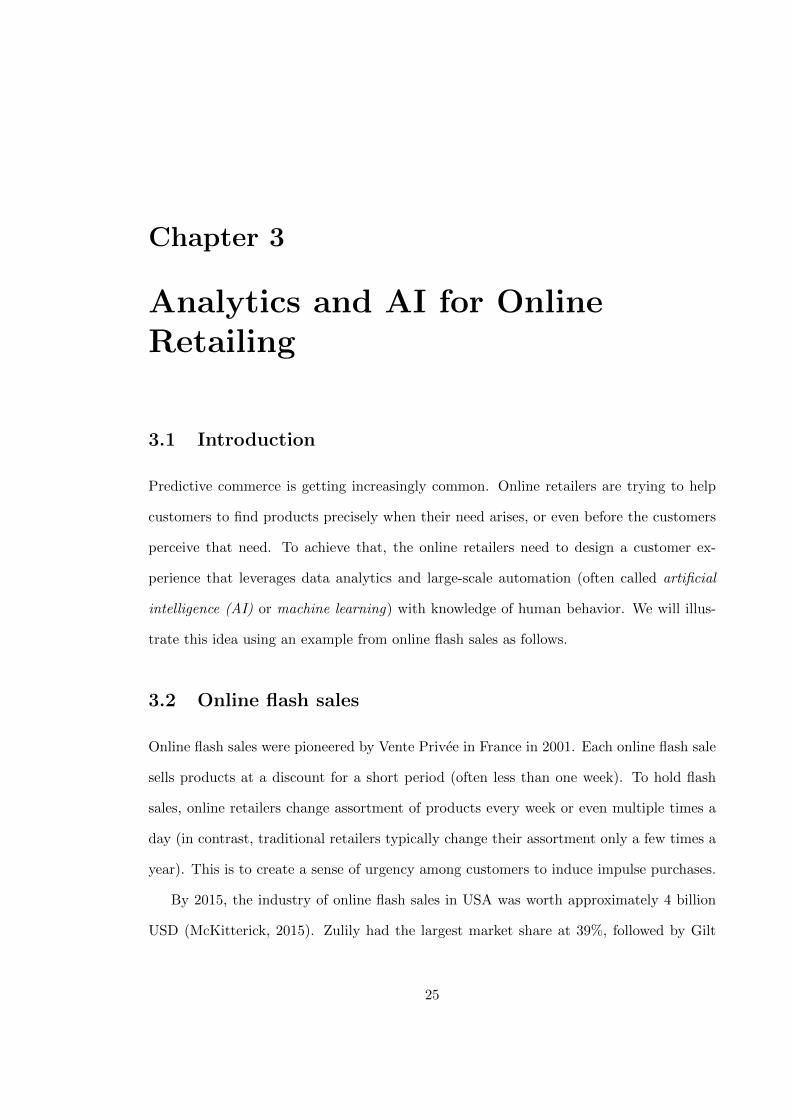
By 2015, the industry of online flash sales in USA was worth approximately 4 billion
USD (McKitterick, 2015). Zulily had the largest market share at 39%, followed by Gilt
25
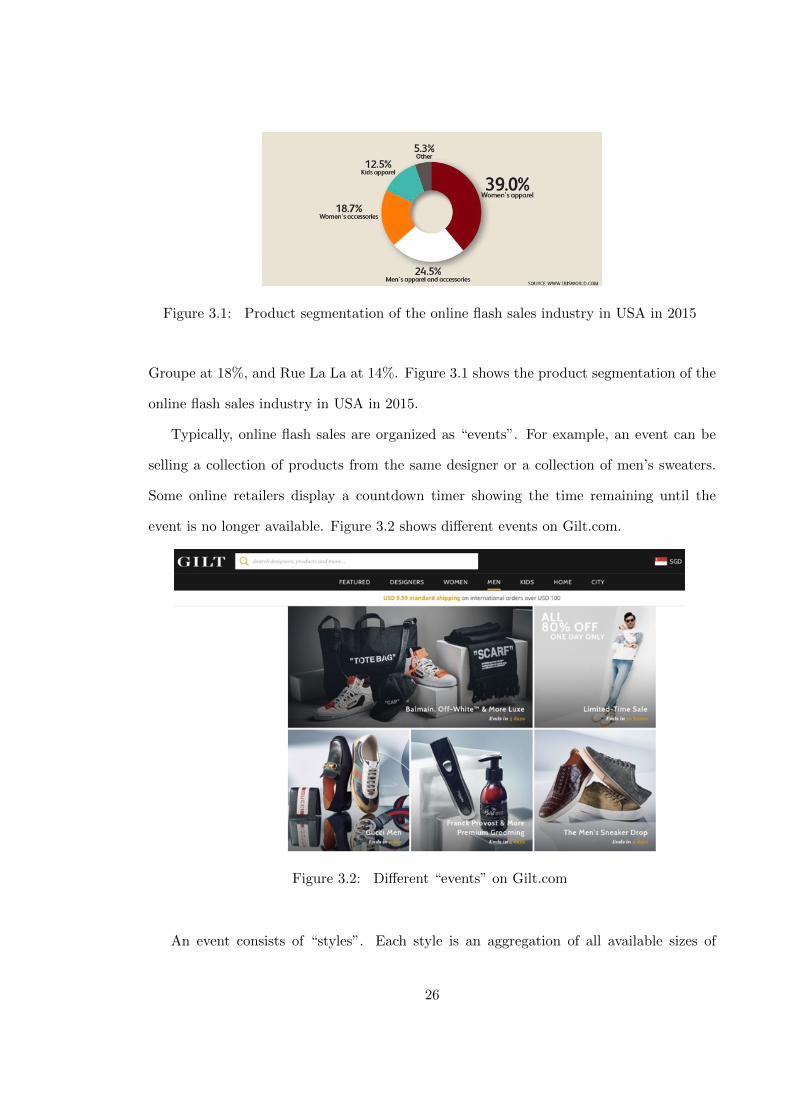
Figure 3.1: Product segmentation of the online flash sales industry in USA in 2015
Groupe at 18%, and Rue La La at 14%. Figure 3.1 shows the product segmentation of the
online flash sales industry in USA in 2015.
Typically, online flash sales are organized as “events”. For example, an event can be
selling a collection of products from the same designer or a collection of men’s sweaters.
Some online retailers display a countdown timer showing the time remaining until the
event is no longer available. Figure 3.2 shows different events on Gilt.com.
Figure 3.2: Different “events” on Gilt.com
An event consists of “styles”. Each style is an aggregation of all available sizes of
26
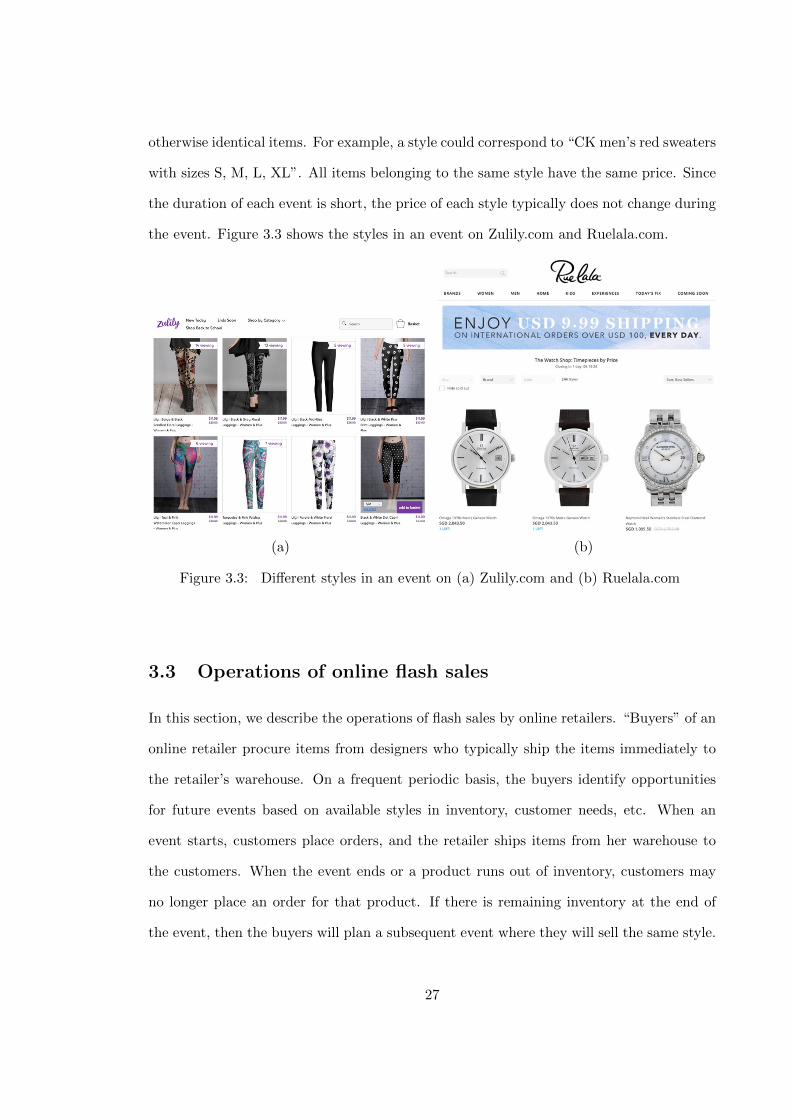
otherwise identical items. For example, a style could correspond to “CK men’s red sweaters
with sizes S, M, L, XL”. All items belonging to the same style have the same price. Since
the duration of each event is short, the price of each style typically does not change during
the event. Figure 3.3 shows the styles in an event on Zulily.com and Ruelala.com.
(a) (b)
Figure 3.3: Different styles in an event on (a) Zulily.com and (b) Ruelala.com
3.3 Operations of online flash sales
In this section, we describe the operations of flash sales by online retailers. “Buyers” of an
online retailer procure items from designers who typically ship the items immediately to
the retailer’s warehouse. On a frequent periodic basis, the buyers identify opportunities
for future events based on available styles in inventory, customer needs, etc. When an
event starts, customers place orders, and the retailer ships items from her warehouse to
the customers. When the event ends or a product runs out of inventory, customers may
no longer place an order for that product. If there is remaining inventory at the end of
the event, then the buyers will plan a subsequent event where they will sell the same style.
27
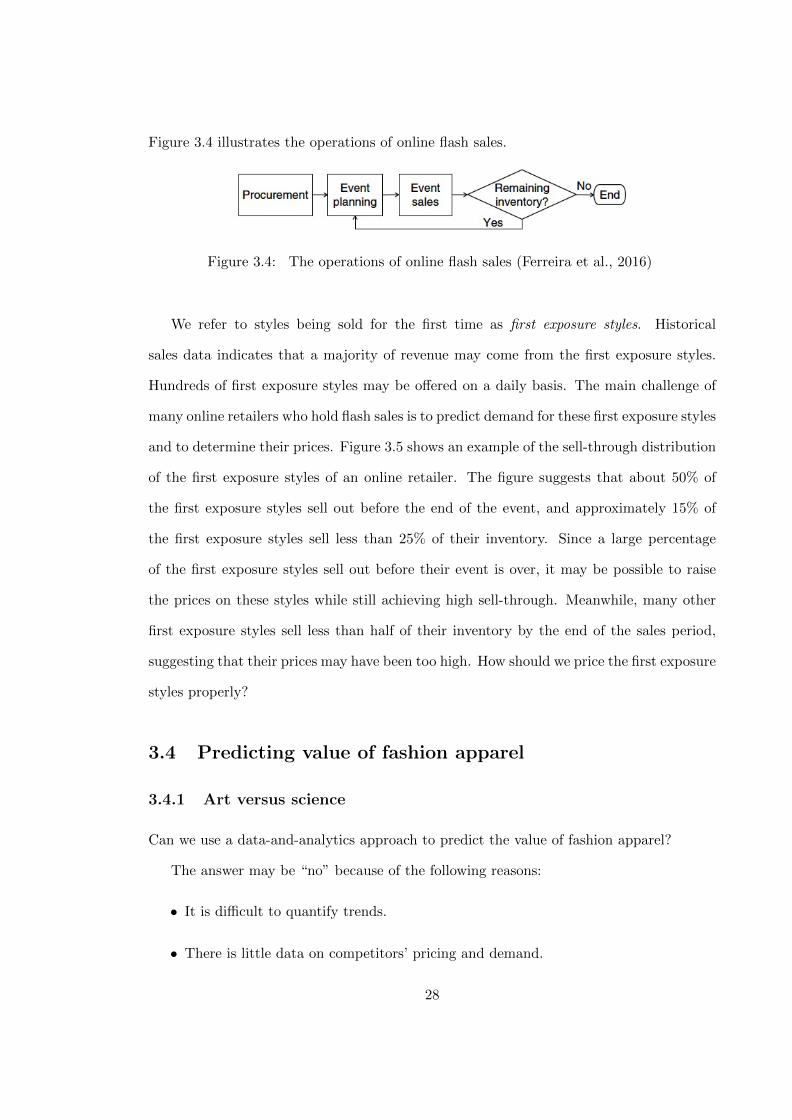
Figure 3.4 illustrates the operations of online flash sales.
Figure 3.4: The operations of online flash sales (Ferreira et al., 2016)
We refer to styles being sold for the first time as first exposure styles. Historical
sales data indicates that a majority of revenue may come from the first exposure styles.
Hundreds of first exposure styles may be offered on a daily basis. The main challenge of
many online retailers who hold flash sales is to predict demand for these first exposure styles
and to determine their prices. Figure 3.5 shows an example of the sell-through distribution
of the first exposure styles of an online retailer. The figure suggests that about 50% of
the first exposure styles sell out before the end of the event, and approximately 15% of
the first exposure styles sell less than 25% of their inventory. Since a large percentage
of the first exposure styles sell out before their event is over, it may be possible to raise
the prices on these styles while still achieving high sell-through. Meanwhile, many other
first exposure styles sell less than half of their inventory by the end of the sales period,
suggesting that their prices may have been too high. How should we price the first exposure
styles properly?
3.4 Predicting value of fashion apparel
3.4.1 Art versus science
Can we use a data-and-analytics approach to predict the value of fashion apparel?
The answer may be “no” because of the following reasons:
• It is difficult to quantify trends.
• There is little data on competitors’ pricing and demand.
28

Figure 3.5: The sell-through distribution of first exposure styles
• It is hard to specify some metrics such as color popularity, style, quality, etc.
• The value of a product is different for different people.
People who support the above view may think pricing for fashion apparel is a kind of art.
On the other hand, the answer may be “yes” because of the following reasons:
• E-commerce data from clickstream, website traffic, etc. is rich.
• Some metrics such as price, discount, product category, etc. can be specified.
• There is a clear criterion of what makes a product successful: Large demand.
• Getting only a few predictions wrong has less of an impact.
People supporting the above view may think pricing for fashion apparel is a study of
science.
3.4.2 Predicting the demand
To determine the price of a style, we first predict its demand. We can predict the demand
for the style by looking at the demand data in the past. Figure 3.6 shows the past demands
of similar styles under different prices. Each dot in the figure represents the demand for a
29

style (Y axis) under a certain price (X axis). We can fit these data points in the figure using
a straight line by linear regression. The solid line in Figure 3.6 suggests that the demand
Y can be expressed as a linear function of the price X. That is Y = f(X) = a + bX,
where a and b represent the intercept and the slope, respectively, of the linear function.
The linear regression helps us to determine the coefficients a and b. We can predict the
demand for a style based on this linear function. For example, the demand is d if a style
is priced at p (dollars).
Figure 3.6: A linear demand model that predicts the demand based on the price
Generally, the demand for a style has a more complicated form. For example, the
demand may depend on multiple factors such that Y = f(X1, X2, X3, . . .). Given the
historical values of Y,X1, X2, X3, . . ., we can use multi-dimensional linear regression to
determine the coefficients of the function f . For example, the demand may depend on two
factors X1 and X2 such that Y = a + bX1 + cX2, where X1 represents the price set by
the retailer and X2 represents the price set by a competitor. The multi-dimensional linear
regression helps us to determine the coefficients a, b, and c.
However, what are X1, X2, X3, . . .? In other words, what factors should we consider to
forecast the demand? The following relevant factors usually have data available:
• Price
30
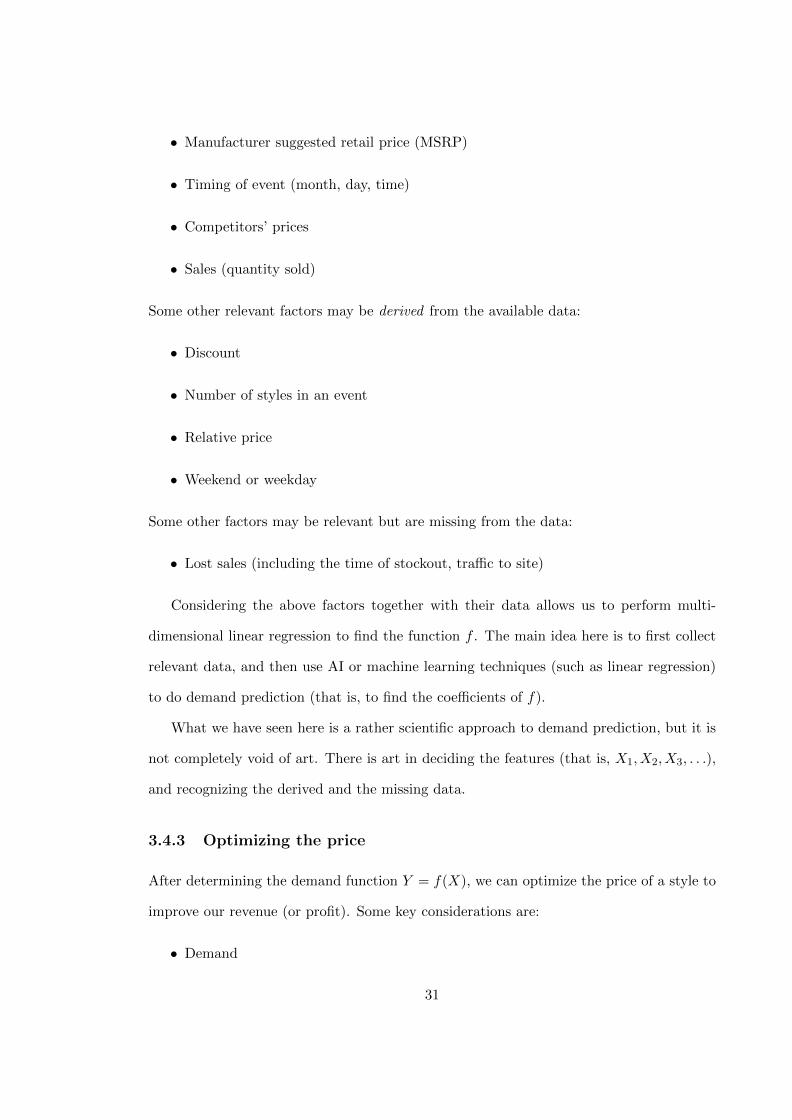
• Manufacturer suggested retail price (MSRP)
• Timing of event (month, day, time)
• Competitors’ prices
• Sales (quantity sold)
Some other relevant factors may be derived from the available data:
• Discount
• Number of styles in an event
• Relative price
• Weekend or weekday
Some other factors may be relevant but are missing from the data:
• Lost sales (including the time of stockout, traffic to site)
Considering the above factors together with their data allows us to perform multi-
dimensional linear regression to find the function f . The main idea here is to first collect
relevant data, and then use AI or machine learning techniques (such as linear regression)
to do demand prediction (that is, to find the coefficients of f).
What we have seen here is a rather scientific approach to demand prediction, but it is
not completely void of art. There is art in deciding the features (that is, X1, X2, X3, . . .),
and recognizing the derived and the missing data.
3.4.3 Optimizing the price
After determining the demand function Y = f(X), we can optimize the price of a style to
improve our revenue (or profit). Some key considerations are:
• Demand
31
• Competitors’ pricing
• Fashion trends (for example, colors)
• Product assortment
• Inventory (what you have, how much you have)
• Target margins
• Target sell-through
• Economic factors or macro changes (including industry growth rate, recession, more
new flash sales sites, etc.)
• Own inventory versus drop-shipping (that is, directly ship the products from the
suppliers)
• Promotions and advertisements
• Discount price point (for example, minimum $9)
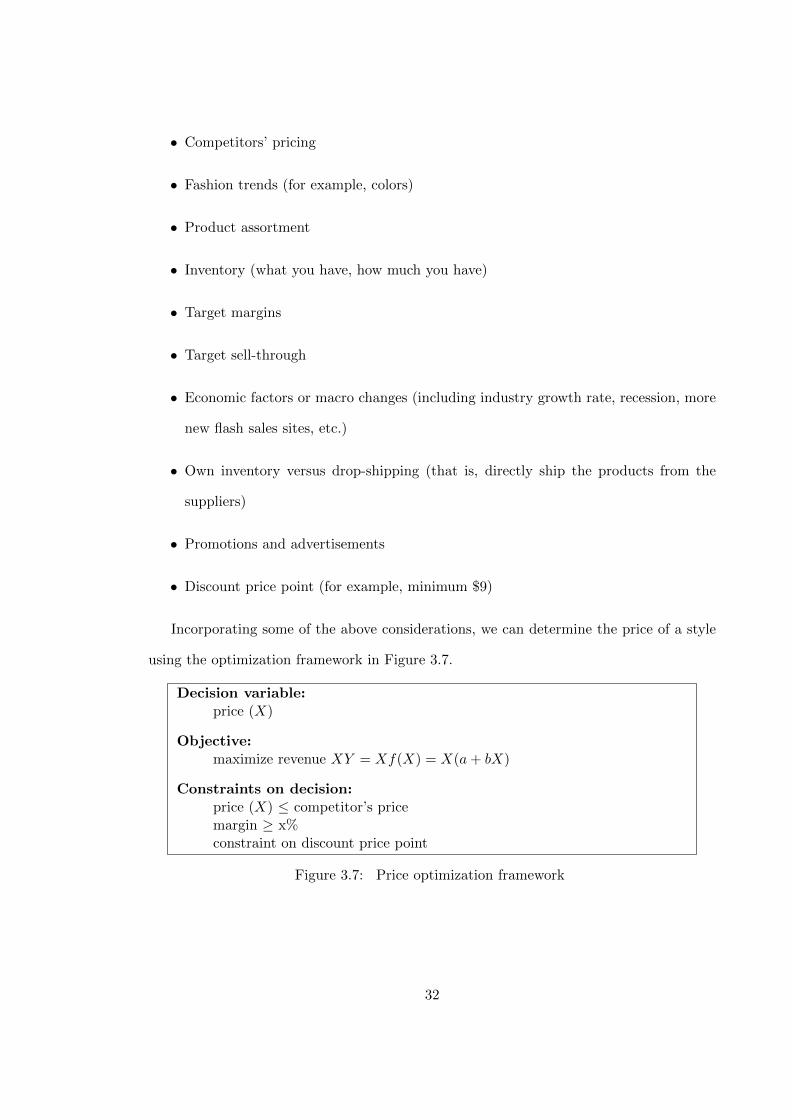
Incorporating some of the above considerations, we can determine the price of a style
using the optimization framework in Figure 3.7.
Decision variable:price (X)
Objective:maximize revenue XY = Xf(X) = X(a+ bX)
Constraints on decision:price (X) ≤ competitor’s pricemargin ≥ x%constraint on discount price point
Figure 3.7: Price optimization framework
32
3.4.4 Summary of price optimization
A retailer can use the following procedure to determine the price of a style to maximize
her revenue (or profit):
1. Collect relevant data.
2. Use AI or machine learning techniques (such as linear regression) to predict the
demand Y = f(X).
3. Perform price optimization using the framework in Figure 3.7.
3.5 AI and the importance of data
3.5.1 Two approaches in AI
In the 1980s the AI field consisted of two camps: the rule-based approach and the neural
networks approach (Lee, 2018). The rule-based approach attempts to instruct computers
to think by providing many logical rules in its programs. For example, to identify whether
there is a panda in a picture, the rule-based approach would lay down many “if-then” rules
to help a computer make a decision. An example of such rules is “if there are black and
white patches on an object, then it is probably a panda.” This approach can be used to
solve simple problems, but breaks down as the complexity of the problems increases.
In contrast, the neural networks approach does not instruct the computer with the rules
created by a human brain. Instead, this approach attempts to emulate the functionality
of the human brain. Researchers in this camp try to reconstruct the structure of the
network of neurons in the human brain. They emulate the human brain’s neural network
structure with layers of artificial neurons that can receive and transmit signals. Instead of
giving rules to the artificial neural networks for decision making, this approach provides an
enormous number of samples of a phenomenon for the networks to identify patterns within
the data. For example, instead of telling the computer the “if-then” rules to determine
33
whether there is a panda in a picture, researchers in this camp simply feed many, many
images labeled “panda” or “no panda” to the computer program and let the program figure
out for itself what features are linked to the “panda” label.
The neural networks approach requires large amounts of data and computing power.
The data (for example, images, texts, or clicks) is used to train the networks to identify
patterns and the computing power is needed to process the data. As these two key ingredi-
ents become more and more available nowadays, the neural networks approach (now called
deep learning) becomes increasingly promising. The approach has real-world applications
(Lee, 2018) including face recognition, deciphering speech, language translation, identi-
fying credit-card fraud, approving insurance applications, predicting consumer behavior,
navigating robots, and driving vehicles.
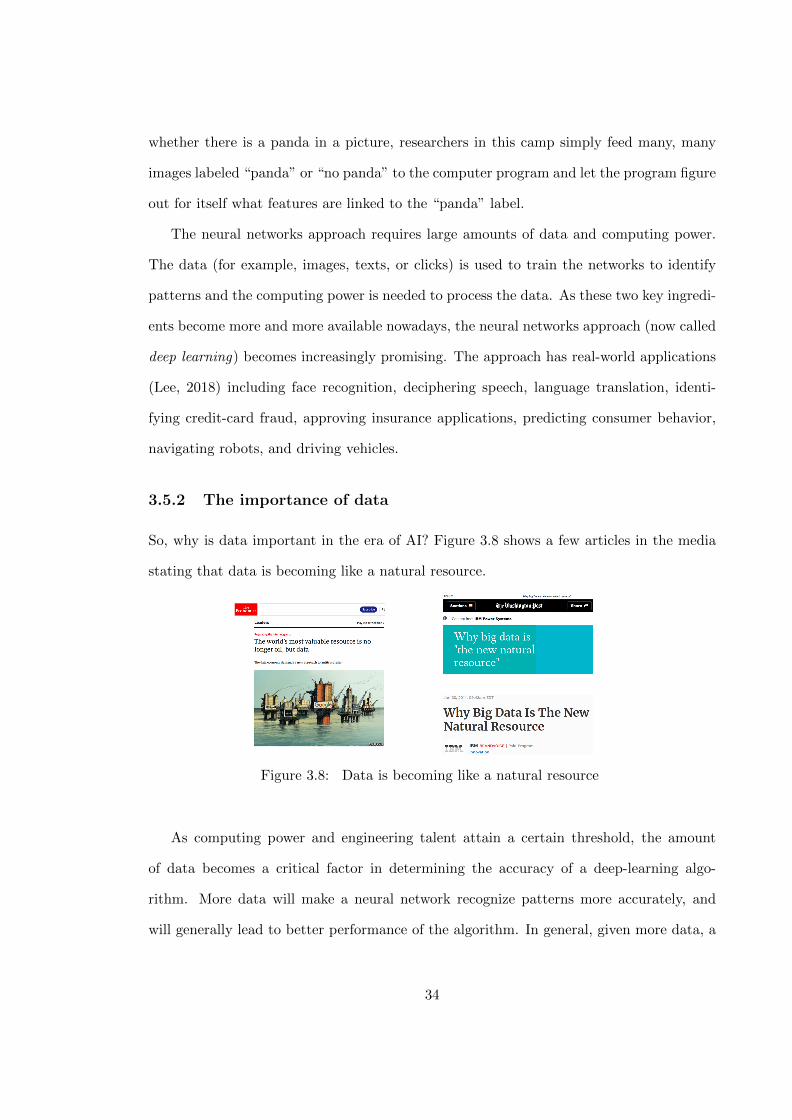
3.5.2 The importance of data
So, why is data important in the era of AI? Figure 3.8 shows a few articles in the media
stating that data is becoming like a natural resource.
Figure 3.8: Data is becoming like a natural resource
As computing power and engineering talent attain a certain threshold, the amount
of data becomes a critical factor in determining the accuracy of a deep-learning algo-
rithm. More data will make a neural network recognize patterns more accurately, and
will generally lead to better performance of the algorithm. In general, given more data, a
34
deep-learning algorithm designed by an average AI engineer can usually outperform that
designed by a world expert of deep learning (Lee, 2018). The importance of data in the
era of AI is best illustrated by the following analogy: If we imagine AI as the electricity
that revolutionized the industry, then data is the oil that generates the electricity.
35
References
Ferreira, K.J., B.H.A. Lee, D. Simchi-Levi. 2016. Analytics for an online retailer: Demandforecasting and price optimization. Manuf. Serv. Oper. Manag. 18(1): 69–88.
Lee, K.-F. 2018. AI Superpowers: China, Silicon Valley, and The New World Order.Houghton Mifflin Harcourt, New York.
McKitterick, W. 2015. Online Fashion Sample Sales in the U.S.. IBISWorld Industry ReportOD5438, p. 12.
36
Chapter 4
Supply Chain Management forOnline Retailing
4.1 Introduction
Supply chain management is a core competency of almost all online retailers. Online
retailers need to control not only their supply of inventory, but also the allocation of
the inventory to different warehouses, the demand fulfillment for different zones, and the
last-mile delivery to the customers in each zone.
The difference between fulfillment for offline and online demands
Figure 4.1 shows the difference between fulfilling offline (brick-and-mortar) and online
demands.
Fulfillment for offline (brick-and-mortar) demands: Each warehouse ships products
to brick-and-mortar retail stores (for example, Walmart). The warehouse receives a
smaller number of orders per day, but a large quantity for each order. In general,
there is no fulfillment flexibility: The retailer does not retrieve products from other
warehouses if one warehouse is out of stock.
Fulfillment for online demands: Each warehouse ships products directly to end con-
sumers. The warehouse receives a large number of orders per day, but a small quan-
37
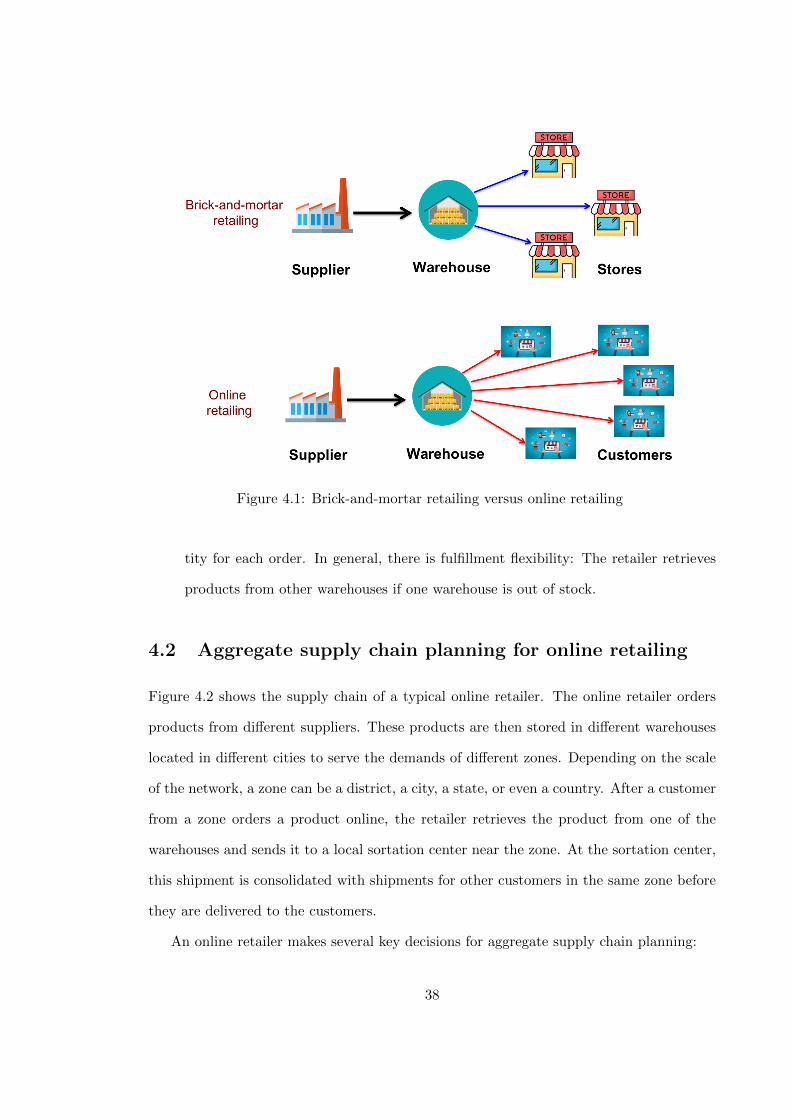
Figure 4.1: Brick-and-mortar retailing versus online retailing
tity for each order. In general, there is fulfillment flexibility: The retailer retrieves
products from other warehouses if one warehouse is out of stock.
4.2 Aggregate supply chain planning for online retailing
Figure 4.2 shows the supply chain of a typical online retailer. The online retailer orders
products from different suppliers. These products are then stored in different warehouses
located in different cities to serve the demands of different zones. Depending on the scale
of the network, a zone can be a district, a city, a state, or even a country. After a customer
from a zone orders a product online, the retailer retrieves the product from one of the
warehouses and sends it to a local sortation center near the zone. At the sortation center,
this shipment is consolidated with shipments for other customers in the same zone before
they are delivered to the customers.
An online retailer makes several key decisions for aggregate supply chain planning:
38
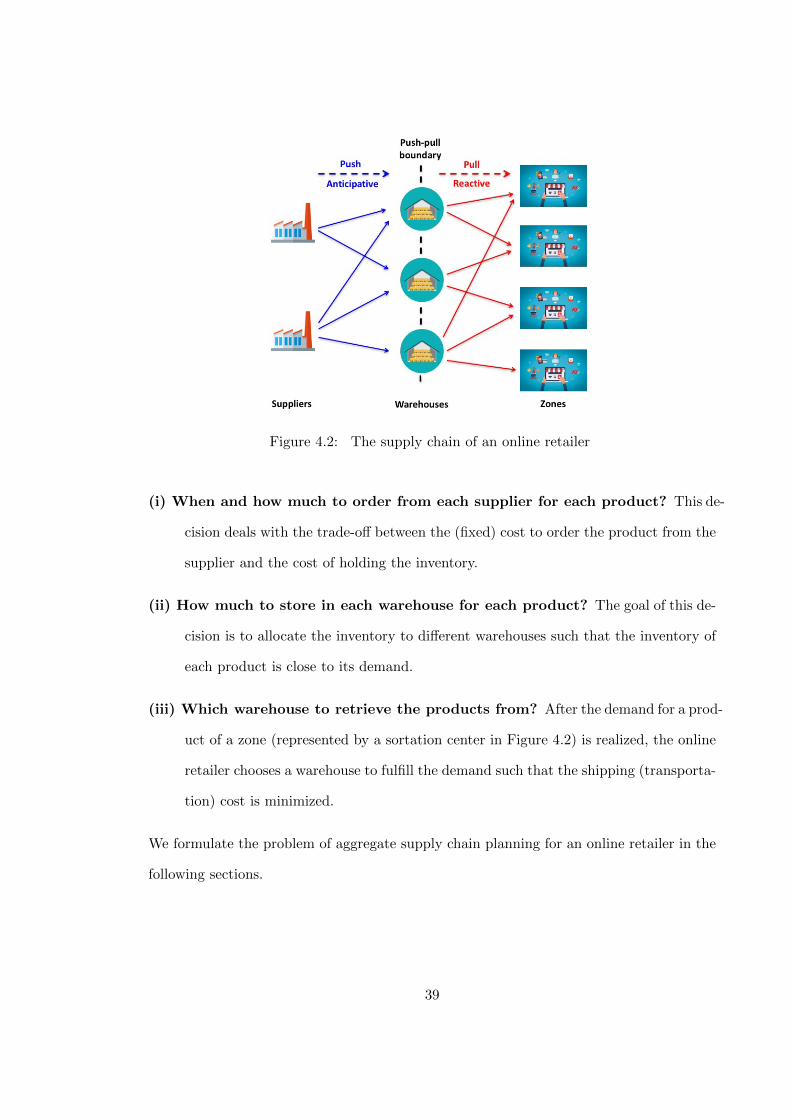
Figure 4.2: The supply chain of an online retailer
(i) When and how much to order from each supplier for each product? This de-
cision deals with the trade-off between the (fixed) cost to order the product from the
supplier and the cost of holding the inventory.
(ii) How much to store in each warehouse for each product? The goal of this de-
cision is to allocate the inventory to different warehouses such that the inventory of
each product is close to its demand.
(iii) Which warehouse to retrieve the products from? After the demand for a prod-
uct of a zone (represented by a sortation center in Figure 4.2) is realized, the online
retailer chooses a warehouse to fulfill the demand such that the shipping (transporta-
tion) cost is minimized.
We formulate the problem of aggregate supply chain planning for an online retailer in the
following sections.
39

4.2.1 Problem description
We consider a common challenge faced by an online retailer selling multiple products to
different demand zones over a multi-period horizon. The retailer replenishes the products
from different suppliers and stores the products at multiple warehouses or fulfillment cen-
ters (FCs) to satisfy demand. In each period, the retailer makes three types of decisions: (i)
At the start of the period, the retailer determines how much to replenish for each product
from each supplier given a lead time and a limited production capacity. (ii) The retailer
then decides how to allocate the inventory to the different FCs, given that each FC has a
limited storage capacity and different allocation and fulfillment costs. (iii) At the end of
the period, the demands are realized and the retailer decides on which FCs to fulfill the
demands of each zone. In case a product is out of stock, the retailer requests the product
to be drop-shipped from suppliers to satisfy the demands (for example, CleoCat Fashion
in Singapore offers drop-shipping services for fashion products). The retailer’s objective is
to minimize the expected total operating cost over the multi-period horizon.
In contrast to brick-and-mortar retailing, a distinct characteristic of online retailing is
that the retailer has the flexibility to satisfy the demands of a zone from any FC that holds
the inventory. This fulfillment flexibility improves service levels, but may also increase
the retailer’s outbound shipping cost, which is a main operating cost of online retailing
(Dinlersoz and Li, 2006). The fulfillment flexibility further complicates the inventory
allocation to the FCs and the product replenishments from the suppliers. To address these
issues in an effective manner, the retailer needs to optimize the replenishment, allocation,
and fulfillment decisions jointly.
The problem is especially challenging because replenishment and allocation of inventory
are typically done before the demand is known in each period. Thus, the replenishment
and allocation decisions are made in an anticipative manner. In contrast, the fulfillment
decisions are made in a reactive manner as order fulfillment for online retailing is usually
performed after the actual demand is realized in each period. In other words, an online
40
retailer typically adopts a “push” strategy for inventory replenishment-allocation and a
“pull” strategy for order fulfillment in each period. We propose a multi-period optimization
model that delicately integrates the anticipative replenishment-allocation decisions with
the reactive fulfillment decisions to minimize the retailer’s expected total cost. These two
kinds of decisions (anticipative versus reactive) can be determined seamlessly by our model.
4.2.2 Deterministic optimization model
Consider an online retailer selling products n = 1, . . . , N to customers in demand zones
k = 1, . . . ,K. The retailer replenishes her inventory from suppliers i = 1, . . . , I and
allocates the inventory to FCs j = 1, . . . , J , where she retrieves the inventory to fulfill the
demand of each zone. If the retailer is out of stock for a certain product, the product is
drop-shipped directly from the suppliers to the customers. For notational convenience, we
denote the drop-shipping channel as FC J+1, which incurs significantly higher production
and transportation costs.
We divide the planning horizon into periods t = 1, . . . , T . In each period t, the retailer
makes the following three decisions in the specified sequence: (1) At the start of period
t, the retailer determines the replenishment quantity for each product from each supplier
(called the replenishment decisions). (2) The retailer then chooses the FCs to store the
product (called the allocation decisions). (3) At the end of period t, the demand of each
zone for each product is realized, the retailer selects the FCs to retrieve the product to fulfill
the demand (called the fulfillment decisions). For convenience, define N = {1, . . . , N},
I = {1, . . . , I}, J = {1, . . . , J}, J + = {1, . . . , J + 1}, K = {1, . . . ,K}, T = {1, . . . , T},
and T + = {1, . . . , T + 1}.
For the sake of simplicity, we consider a deterministic model in which all demand
information throughout the entire planning horizon is available at the start of period t = 1.
Let yntj denote the on-hand inventory level of product n in FC j at the start of period t, for
n ∈ N , j ∈ J , t ∈ T . Based on these inventory levels, the retailer replenishes a quantity
41
xnti of product n from supplier i at the start of period t. This incurs a fixed setup cost
Snti and a variable production cost pnti x
nti , where pnti is the corresponding unit production
cost. Each supplier i has a production capacity xti in period t such that∑
n∈N xnti ≤ xti,
for i ∈ I, t ∈ T . We assume a constant lead time lni such that a replenishment order for
product n from supplier i placed at the start of period t− lni will be received by the retailer
at the start of period t. We assume the replenishment quantities{xn,1−lnii , . . . , xn0i
}and
the initial inventory levels yn1j , for n ∈ N , i ∈ I, j ∈ J , are given at the start of period
t = 1.
Define vntij as a decision variable representing the quantity of product n from supplier i
allocated to FC j in period t, for n ∈ N , i ∈ I, j ∈ J , t ∈ T . This incurs an allocation cost
antij vntij , where antij is the corresponding unit allocation cost. Since all the received quantity
xn,t−lnii at the start of period t must be allocated to the FCs, we have
∑j∈J v
ntij = x
n,t−lnii ,
for n ∈ N , i ∈ I, t ∈ T . The total inventory of each FC j cannot exceed its storage
capacity yj such that∑
n∈N
(yntj +
∑i∈I v
ntij
)≤ yj , for j ∈ J , t ∈ T . Let dntk denote the
realized demand of zone k for product n in period t, for n ∈ N , k ∈ K, t ∈ T . Define
wntjk as a decision variable representing the quantity of product n retrieved from FC j to
fulfill the demand of zone k in period t, for n ∈ N , j ∈ J +, k ∈ K, t ∈ T . This incurs
a fulfillment cost fntjkwntjk, where fntjk is the corresponding unit fulfillment cost. Note that
wntJ+1,k is the drop-shipping quantity of product n to fulfill the demand of zone k in period
t and fntJ+1,k is the corresponding unit drop-shipping cost. We do not allow backlog or
lost-sales of demands such that∑
j∈J+ wntjk = dntk , for n ∈ N , k ∈ K, t ∈ T , and yntj ≥ 0,
for n ∈ N , j ∈ J , t ∈ T +.
After the demands are fulfilled, the inventory level of product n in FC j at the start
of period t + 1 is yn,t+1j = yntj +
∑i∈I v
ntij −
∑k∈K w
ntjk. Since the leftover inventory at
the end of period t is carried over to period t + 1, a holding cost hntj yn,t+1j is incurred,
where hntj is the corresponding unit holding cost. Figure 4.3 illustrates the integration
of replenishment-allocation with fulfillment for the online retailer. The objective is to
42
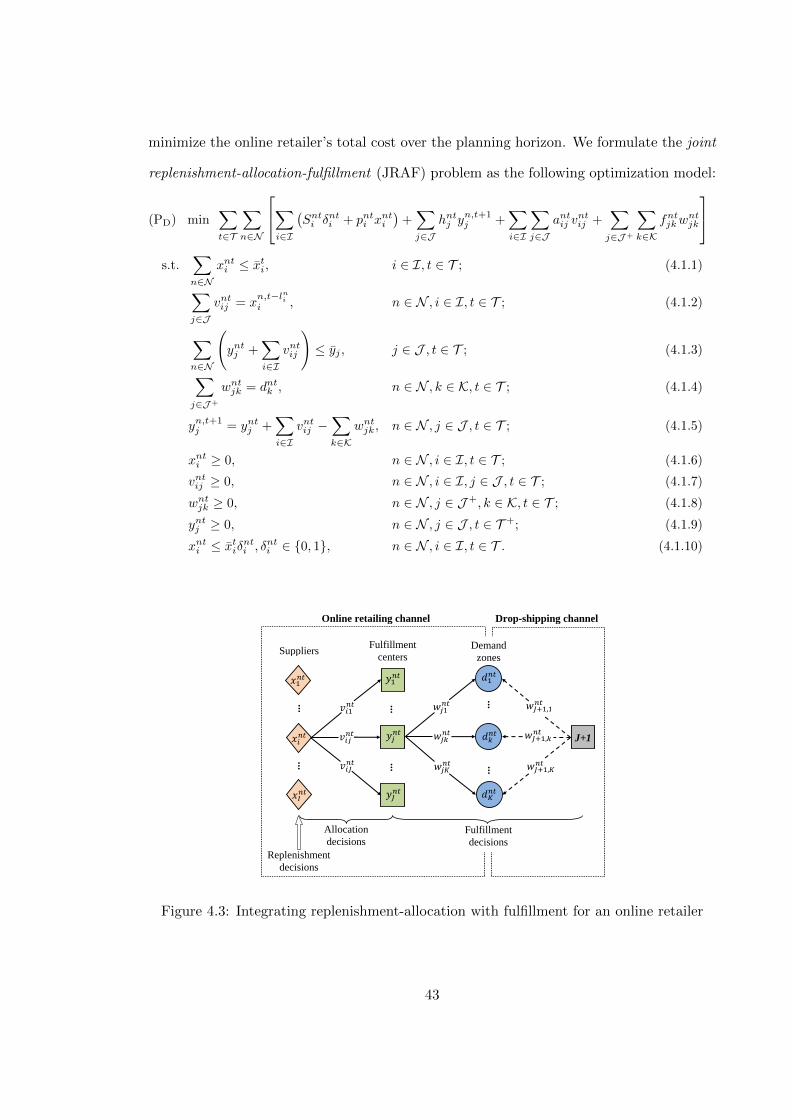
minimize the online retailer’s total cost over the planning horizon. We formulate the joint
replenishment-allocation-fulfillment (JRAF) problem as the following optimization model:
(PD) min∑t∈T
∑n∈N
∑i∈I
(Snti δnti + pnti x
nti
)+∑j∈J
hntj yn,t+1j +
∑i∈I
∑j∈J
antij vntij +
∑j∈J+
∑k∈K
fntjkwntjk
s.t.
∑n∈N
xnti ≤ xti, i ∈ I, t ∈ T ; (4.1.1)∑j∈J
vntij = xn,t−lnii , n ∈ N , i ∈ I, t ∈ T ; (4.1.2)
∑n∈N
(yntj +
∑i∈I
vntij
)≤ yj , j ∈ J , t ∈ T ; (4.1.3)∑
j∈J+
wntjk = dntk , n ∈ N , k ∈ K, t ∈ T ; (4.1.4)
yn,t+1j = yntj +
∑i∈I
vntij −∑k∈K
wntjk, n ∈ N , j ∈ J , t ∈ T ; (4.1.5)
xnti ≥ 0, n ∈ N , i ∈ I, t ∈ T ; (4.1.6)
vntij ≥ 0, n ∈ N , i ∈ I, j ∈ J , t ∈ T ; (4.1.7)
wntjk ≥ 0, n ∈ N , j ∈ J +, k ∈ K, t ∈ T ; (4.1.8)
yntj ≥ 0, n ∈ N , j ∈ J , t ∈ T +; (4.1.9)
xnti ≤ xtiδnti , δnti ∈ {0, 1}, n ∈ N , i ∈ I, t ∈ T . (4.1.10)
⁝
⁝
𝑤𝑗1𝑛𝑡
𝑑𝑘𝑛𝑡
𝑤𝑗𝐾𝑛𝑡
𝑦1𝑛𝑡
⁝
⁝
𝑦𝑗𝑛𝑡
𝑦𝐽𝑛𝑡
Fulfillment
centers
𝑣𝑖𝐽𝑛𝑡
𝑣𝑖𝑗𝑛𝑡
𝑣𝑖1𝑛𝑡
⁝
𝑞𝑖𝑛
⁝
𝑥𝐼𝑛𝑡
𝑥𝑖𝑛𝑡 𝑤𝑗𝑘
𝑛𝑡
Suppliers
𝑥1𝑛𝑡 𝑑1
𝑛𝑡
J+1
𝑑𝐾𝑛𝑡
𝑤𝐽+1,1𝑛𝑡
𝑤𝐽+1,𝐾𝑛𝑡
𝑤𝐽+1,𝑘𝑛𝑡
Demand
zones
Allocation
decisions Fulfillment
decisions
Replenishment
decisions
Online retailing channel Drop-shipping channel
Figure 4.3: Integrating replenishment-allocation with fulfillment for an online retailer
43
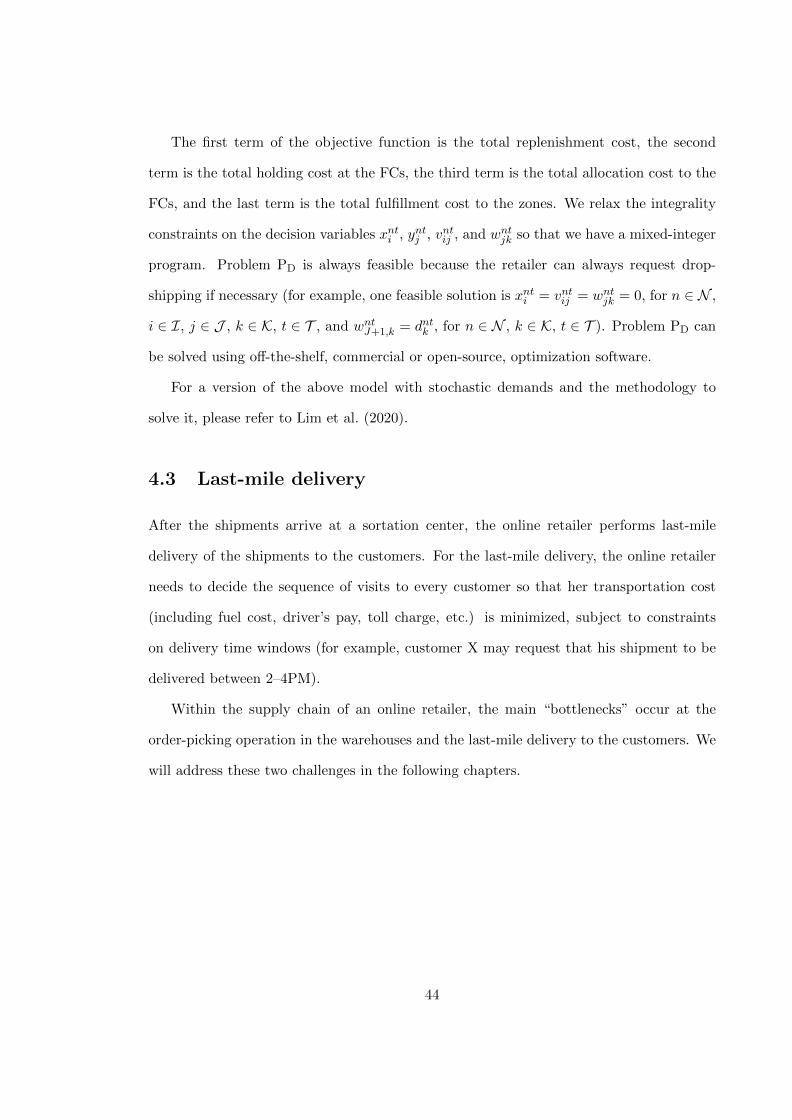
The first term of the objective function is the total replenishment cost, the second
term is the total holding cost at the FCs, the third term is the total allocation cost to the
FCs, and the last term is the total fulfillment cost to the zones. We relax the integrality
constraints on the decision variables xnti , yntj , vntij , and wntjk so that we have a mixed-integer
program. Problem PD is always feasible because the retailer can always request drop-
shipping if necessary (for example, one feasible solution is xnti = vntij = wntjk = 0, for n ∈ N ,
i ∈ I, j ∈ J , k ∈ K, t ∈ T , and wntJ+1,k = dntk , for n ∈ N , k ∈ K, t ∈ T ). Problem PD can
be solved using off-the-shelf, commercial or open-source, optimization software.
For a version of the above model with stochastic demands and the methodology to
solve it, please refer to Lim et al. (2020).
4.3 Last-mile delivery
After the shipments arrive at a sortation center, the online retailer performs last-mile
delivery of the shipments to the customers. For the last-mile delivery, the online retailer
needs to decide the sequence of visits to every customer so that her transportation cost
(including fuel cost, driver’s pay, toll charge, etc.) is minimized, subject to constraints
on delivery time windows (for example, customer X may request that his shipment to be
delivered between 2–4PM).
Within the supply chain of an online retailer, the main “bottlenecks” occur at the
order-picking operation in the warehouses and the last-mile delivery to the customers. We
will address these two challenges in the following chapters.
44
References
Bartholdi JJ III, Hackman ST (2018). Warehouse and Distribution Science. http://www.warehouse-science.com/.
Dinlersoz EM, Li H (2006). The shipping strategies of internet retailers: Evidence frominternet book retailing. Quant. Marketing Econom. 4(4): 407–438.
Lim YF, Jiu S, Ang M (2020). Integrating anticipative replenishment-allocation with reac-tive fulfillment for online retailing using robust optimization. Manufacturing and ServiceOperations Management, forthcoming.
45
Chapter 5
Logistics Equipment andTechnologies for Online Retailing
5.1 Introduction
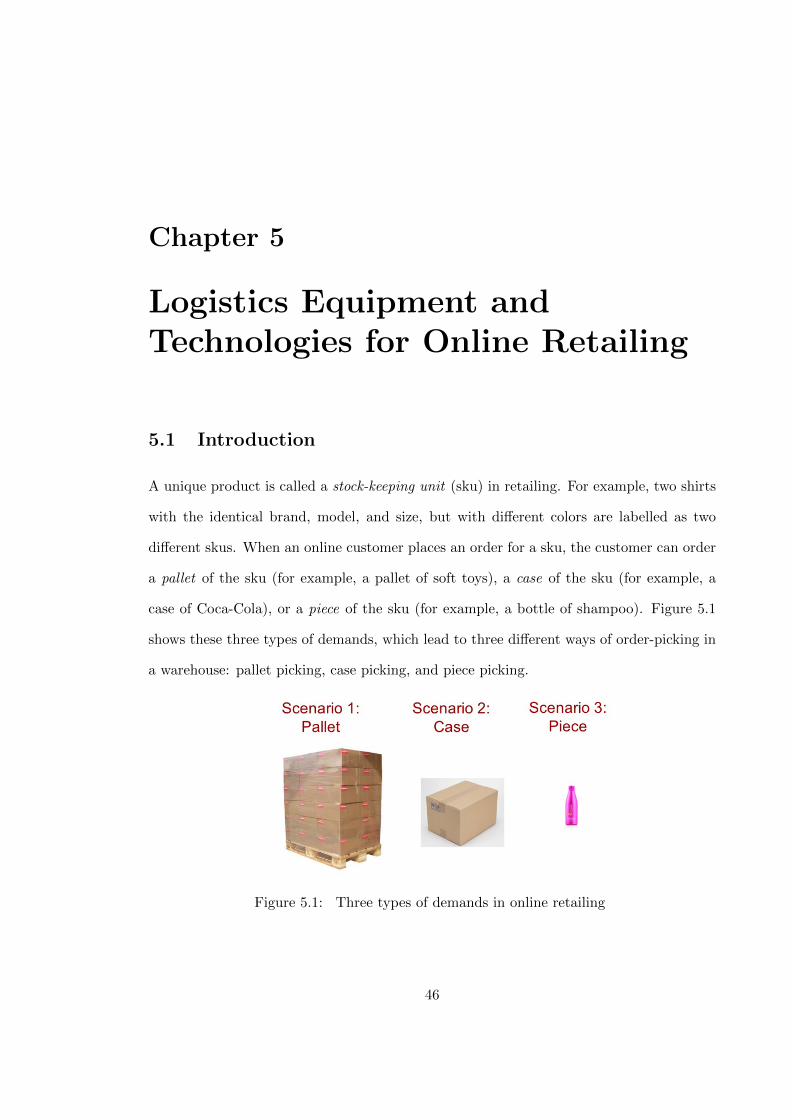
A unique product is called a stock-keeping unit (sku) in retailing. For example, two shirts
with the identical brand, model, and size, but with different colors are labelled as two
different skus. When an online customer places an order for a sku, the customer can order
a pallet of the sku (for example, a pallet of soft toys), a case of the sku (for example, a
case of Coca-Cola), or a piece of the sku (for example, a bottle of shampoo). Figure 5.1
shows these three types of demands, which lead to three different ways of order-picking in
a warehouse: pallet picking, case picking, and piece picking.
Figure 5.1: Three types of demands in online retailing
46
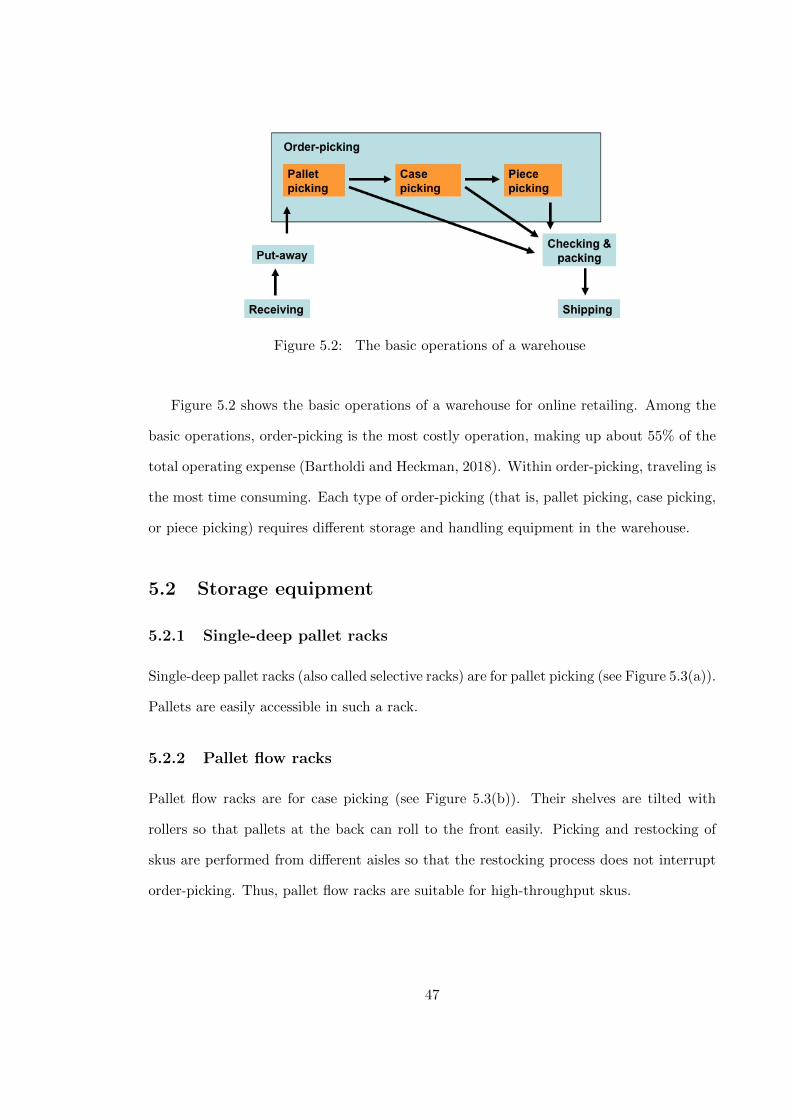
Figure 5.2: The basic operations of a warehouse
Figure 5.2 shows the basic operations of a warehouse for online retailing. Among the
basic operations, order-picking is the most costly operation, making up about 55% of the
total operating expense (Bartholdi and Heckman, 2018). Within order-picking, traveling is
the most time consuming. Each type of order-picking (that is, pallet picking, case picking,
or piece picking) requires different storage and handling equipment in the warehouse.
5.2 Storage equipment
5.2.1 Single-deep pallet racks
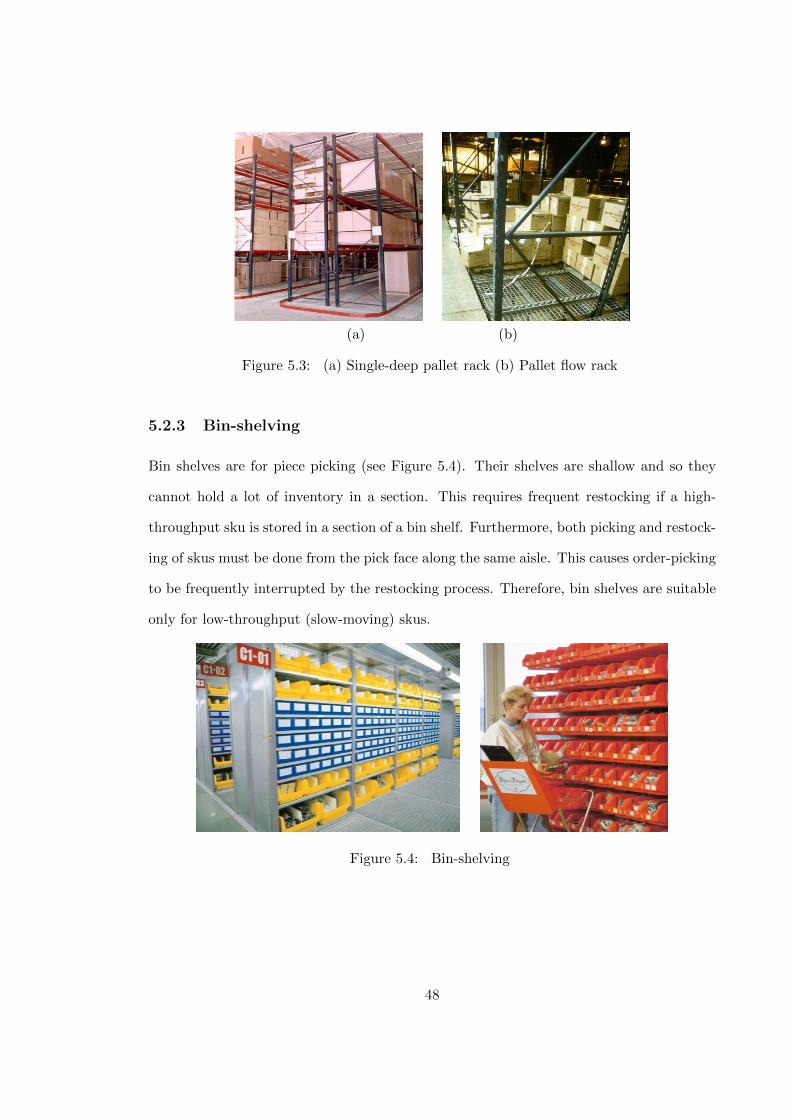
Single-deep pallet racks (also called selective racks) are for pallet picking (see Figure 5.3(a)).
Pallets are easily accessible in such a rack.
5.2.2 Pallet flow racks
Pallet flow racks are for case picking (see Figure 5.3(b)). Their shelves are tilted with
rollers so that pallets at the back can roll to the front easily. Picking and restocking of
skus are performed from different aisles so that the restocking process does not interrupt
order-picking. Thus, pallet flow racks are suitable for high-throughput skus.
47
(a) (b)
Figure 5.3: (a) Single-deep pallet rack (b) Pallet flow rack
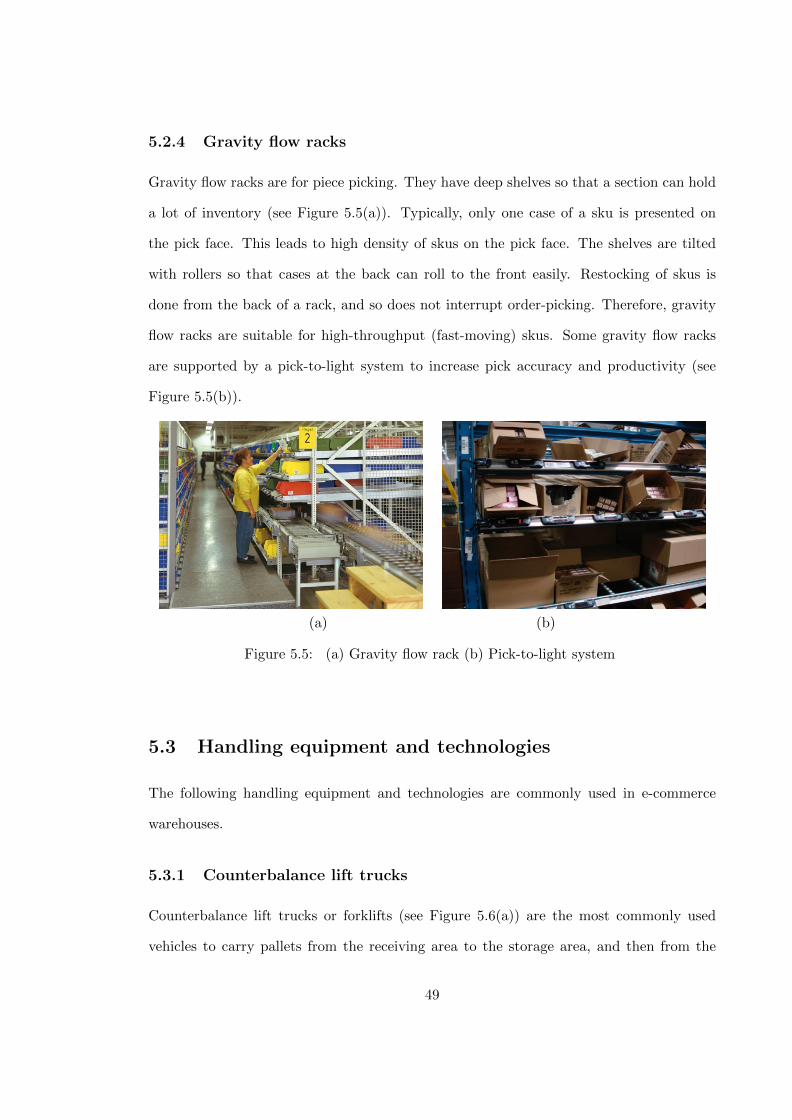
5.2.3 Bin-shelving
Bin shelves are for piece picking (see Figure 5.4). Their shelves are shallow and so they
cannot hold a lot of inventory in a section. This requires frequent restocking if a high-
throughput sku is stored in a section of a bin shelf. Furthermore, both picking and restock-
ing of skus must be done from the pick face along the same aisle. This causes order-picking
to be frequently interrupted by the restocking process. Therefore, bin shelves are suitable
only for low-throughput (slow-moving) skus.
Figure 5.4: Bin-shelving
48
5.2.4 Gravity flow racks
Gravity flow racks are for piece picking. They have deep shelves so that a section can hold
a lot of inventory (see Figure 5.5(a)). Typically, only one case of a sku is presented on
the pick face. This leads to high density of skus on the pick face. The shelves are tilted
with rollers so that cases at the back can roll to the front easily. Restocking of skus is
done from the back of a rack, and so does not interrupt order-picking. Therefore, gravity
flow racks are suitable for high-throughput (fast-moving) skus. Some gravity flow racks
are supported by a pick-to-light system to increase pick accuracy and productivity (see
Figure 5.5(b)).
(a) (b)
Figure 5.5: (a) Gravity flow rack (b) Pick-to-light system
5.3 Handling equipment and technologies
The following handling equipment and technologies are commonly used in e-commerce
warehouses.
5.3.1 Counterbalance lift trucks
Counterbalance lift trucks or forklifts (see Figure 5.6(a)) are the most commonly used
vehicles to carry pallets from the receiving area to the storage area, and then from the
49
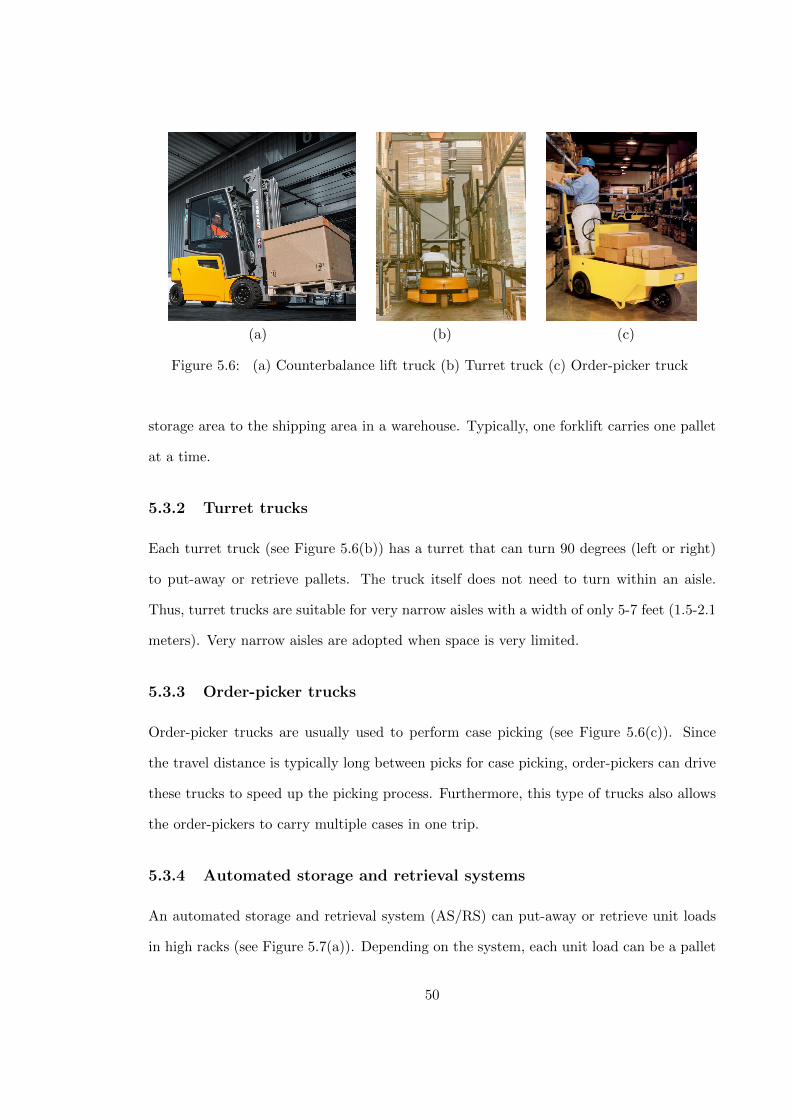
(a) (b) (c)
Figure 5.6: (a) Counterbalance lift truck (b) Turret truck (c) Order-picker truck
storage area to the shipping area in a warehouse. Typically, one forklift carries one pallet
at a time.
5.3.2 Turret trucks
Each turret truck (see Figure 5.6(b)) has a turret that can turn 90 degrees (left or right)
to put-away or retrieve pallets. The truck itself does not need to turn within an aisle.
Thus, turret trucks are suitable for very narrow aisles with a width of only 5-7 feet (1.5-2.1
meters). Very narrow aisles are adopted when space is very limited.
5.3.3 Order-picker trucks
Order-picker trucks are usually used to perform case picking (see Figure 5.6(c)). Since
the travel distance is typically long between picks for case picking, order-pickers can drive
these trucks to speed up the picking process. Furthermore, this type of trucks also allows
the order-pickers to carry multiple cases in one trip.
5.3.4 Automated storage and retrieval systems
An automated storage and retrieval system (AS/RS) can put-away or retrieve unit loads
in high racks (see Figure 5.7(a)). Depending on the system, each unit load can be a pallet
50
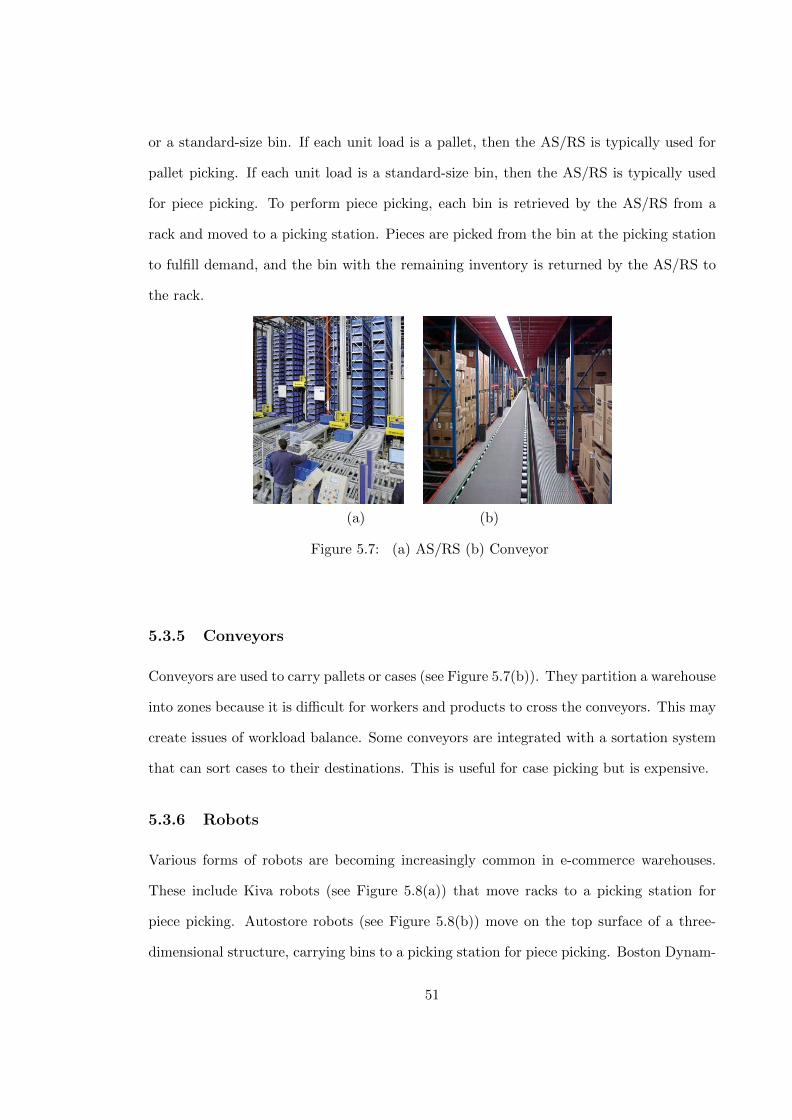
or a standard-size bin. If each unit load is a pallet, then the AS/RS is typically used for
pallet picking. If each unit load is a standard-size bin, then the AS/RS is typically used
for piece picking. To perform piece picking, each bin is retrieved by the AS/RS from a
rack and moved to a picking station. Pieces are picked from the bin at the picking station
to fulfill demand, and the bin with the remaining inventory is returned by the AS/RS to
the rack.
(a) (b)
Figure 5.7: (a) AS/RS (b) Conveyor
5.3.5 Conveyors
Conveyors are used to carry pallets or cases (see Figure 5.7(b)). They partition a warehouse
into zones because it is difficult for workers and products to cross the conveyors. This may
create issues of workload balance. Some conveyors are integrated with a sortation system
that can sort cases to their destinations. This is useful for case picking but is expensive.
5.3.6 Robots
Various forms of robots are becoming increasingly common in e-commerce warehouses.
These include Kiva robots (see Figure 5.8(a)) that move racks to a picking station for
piece picking. Autostore robots (see Figure 5.8(b)) move on the top surface of a three-
dimensional structure, carrying bins to a picking station for piece picking. Boston Dynam-
51
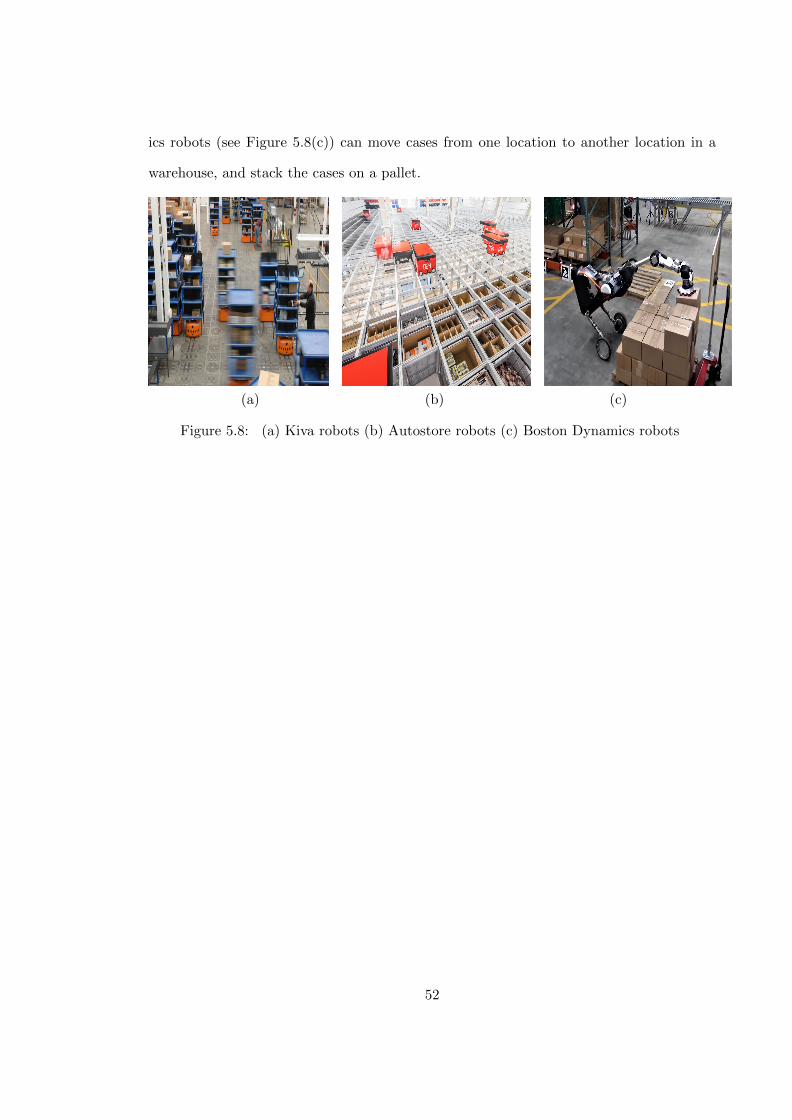
ics robots (see Figure 5.8(c)) can move cases from one location to another location in a
warehouse, and stack the cases on a pallet.
(a) (b) (c)
Figure 5.8: (a) Kiva robots (b) Autostore robots (c) Boston Dynamics robots
52
References
Bartholdi JJ III, Hackman ST (2018). Warehouse and Distribution Science. http://www.warehouse-science.com/.
53
Chapter 6
Order Fulfillment for OnlineRetailing
6.1 Introduction
After a customer places an order, an online retailer first determines which warehouse
(fulfillment center) to satisfy the demand using her decision support system. If the order
requests products from different warehouses, the order might be split into multiple (usually
two) parts. Each part is fulfilled by a single warehouse.
Once an order is received by a warehouse, it first goes through the order-picking process
within the warehouse. After all the requested items have been picked and packed, the order
departs from the warehouse for a sortation center near the customer. At the sortation
center, the order is consolidated with other orders before it departs from the sortation
center for the last-mile delivery to the customer.
Order-picking and last-mile delivery are the most labor-intensive and costly activities
for an online retailer to satisfy demands. Specifically, order-picking costs about 55% of the
total operating expense of a warehouse (Bartholdi and Heckman, 2018), whereas last-mile
delivery comprises up to 28% of the total delivery cost in a supply chain (Wang et al.,
2016). We discuss order-picking in this chapter and last-mile delivery in Chapter 7.
54
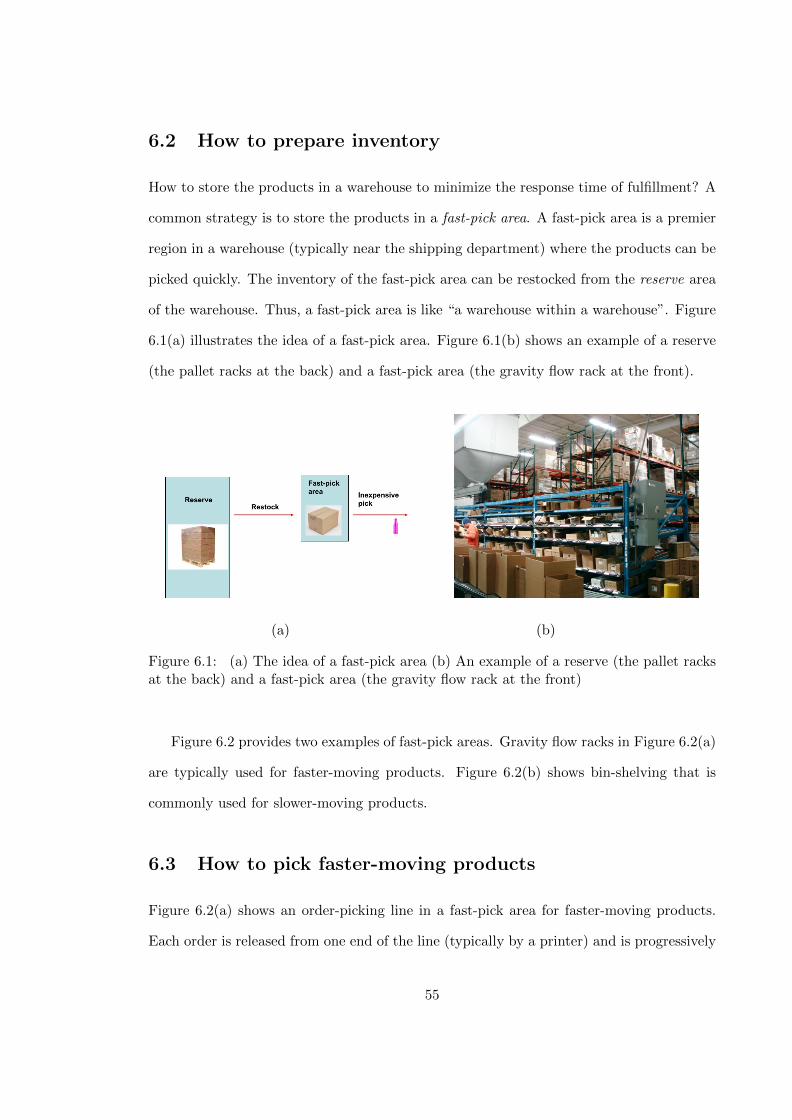
6.2 How to prepare inventory
How to store the products in a warehouse to minimize the response time of fulfillment? A
common strategy is to store the products in a fast-pick area. A fast-pick area is a premier
region in a warehouse (typically near the shipping department) where the products can be
picked quickly. The inventory of the fast-pick area can be restocked from the reserve area
of the warehouse. Thus, a fast-pick area is like “a warehouse within a warehouse”. Figure
6.1(a) illustrates the idea of a fast-pick area. Figure 6.1(b) shows an example of a reserve
(the pallet racks at the back) and a fast-pick area (the gravity flow rack at the front).
(a) (b)
Figure 6.1: (a) The idea of a fast-pick area (b) An example of a reserve (the pallet racksat the back) and a fast-pick area (the gravity flow rack at the front)
Figure 6.2 provides two examples of fast-pick areas. Gravity flow racks in Figure 6.2(a)
are typically used for faster-moving products. Figure 6.2(b) shows bin-shelving that is
commonly used for slower-moving products.
6.3 How to pick faster-moving products
Figure 6.2(a) shows an order-picking line in a fast-pick area for faster-moving products.
Each order is released from one end of the line (typically by a printer) and is progressively
55
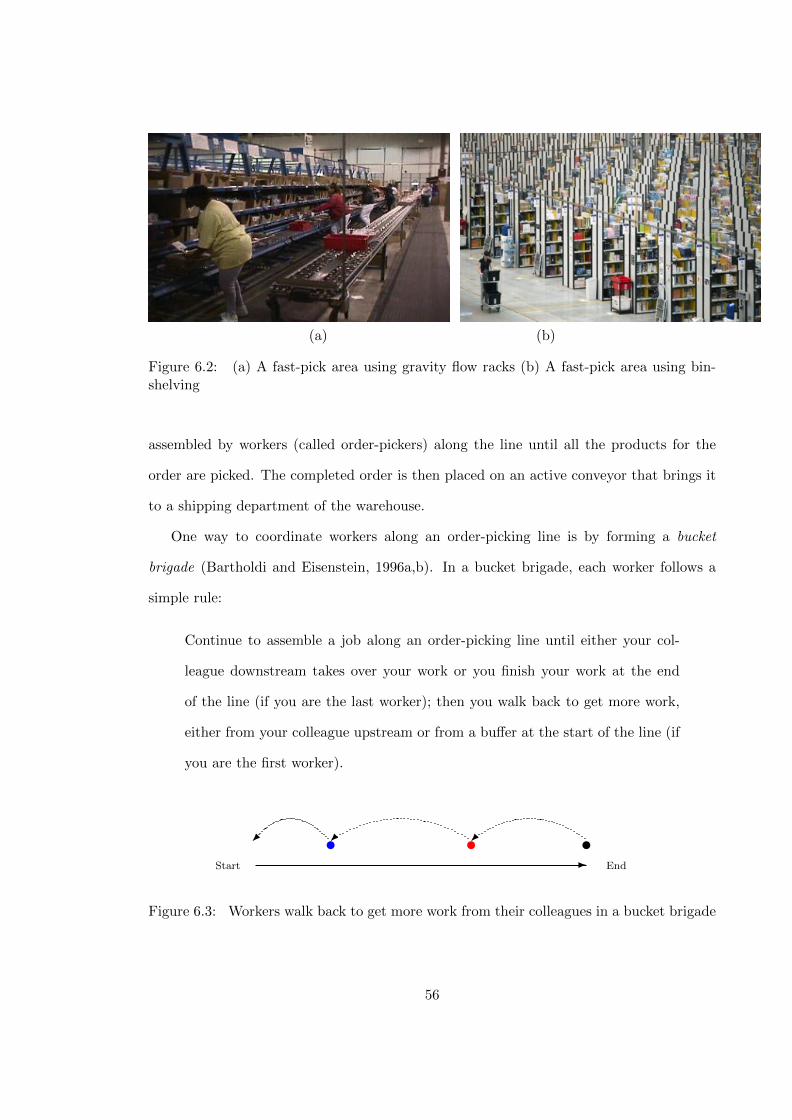
(a) (b)
Figure 6.2: (a) A fast-pick area using gravity flow racks (b) A fast-pick area using bin-shelving
assembled by workers (called order-pickers) along the line until all the products for the
order are picked. The completed order is then placed on an active conveyor that brings it
to a shipping department of the warehouse.
One way to coordinate workers along an order-picking line is by forming a bucket
brigade (Bartholdi and Eisenstein, 1996a,b). In a bucket brigade, each worker follows a
simple rule:
Continue to assemble a job along an order-picking line until either your col-
league downstream takes over your work or you finish your work at the end
of the line (if you are the last worker); then you walk back to get more work,
either from your colleague upstream or from a buffer at the start of the line (if
you are the first worker).
-
u u u
Start End
Figure 6.3: Workers walk back to get more work from their colleagues in a bucket brigade
56
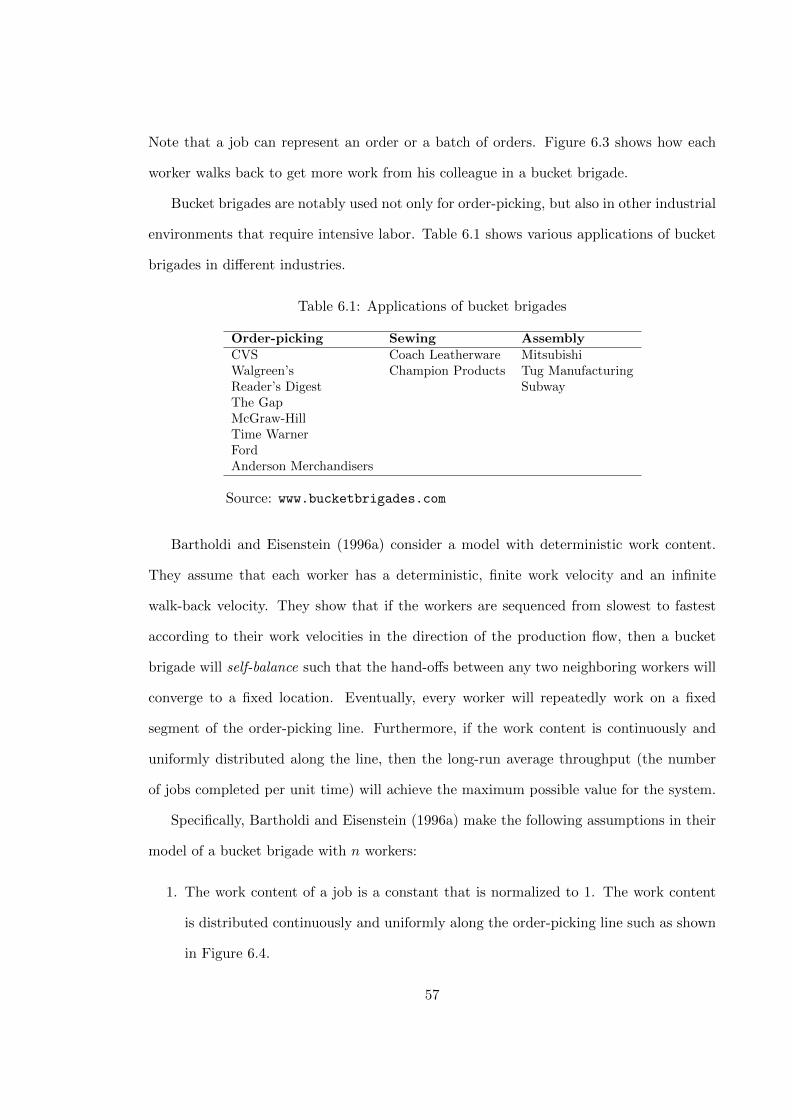
Note that a job can represent an order or a batch of orders. Figure 6.3 shows how each
worker walks back to get more work from his colleague in a bucket brigade.
Bucket brigades are notably used not only for order-picking, but also in other industrial
environments that require intensive labor. Table 6.1 shows various applications of bucket
brigades in different industries.
Table 6.1: Applications of bucket brigades
Order-picking Sewing AssemblyCVS Coach Leatherware MitsubishiWalgreen’s Champion Products Tug ManufacturingReader’s Digest SubwayThe GapMcGraw-HillTime WarnerFordAnderson Merchandisers
Source: www.bucketbrigades.com
Bartholdi and Eisenstein (1996a) consider a model with deterministic work content.
They assume that each worker has a deterministic, finite work velocity and an infinite
walk-back velocity. They show that if the workers are sequenced from slowest to fastest
according to their work velocities in the direction of the production flow, then a bucket
brigade will self-balance such that the hand-offs between any two neighboring workers will
converge to a fixed location. Eventually, every worker will repeatedly work on a fixed
segment of the order-picking line. Furthermore, if the work content is continuously and
uniformly distributed along the line, then the long-run average throughput (the number
of jobs completed per unit time) will achieve the maximum possible value for the system.
Specifically, Bartholdi and Eisenstein (1996a) make the following assumptions in their
model of a bucket brigade with n workers:
1. The work content of a job is a constant that is normalized to 1. The work content
is distributed continuously and uniformly along the order-picking line such as shown
in Figure 6.4.
57
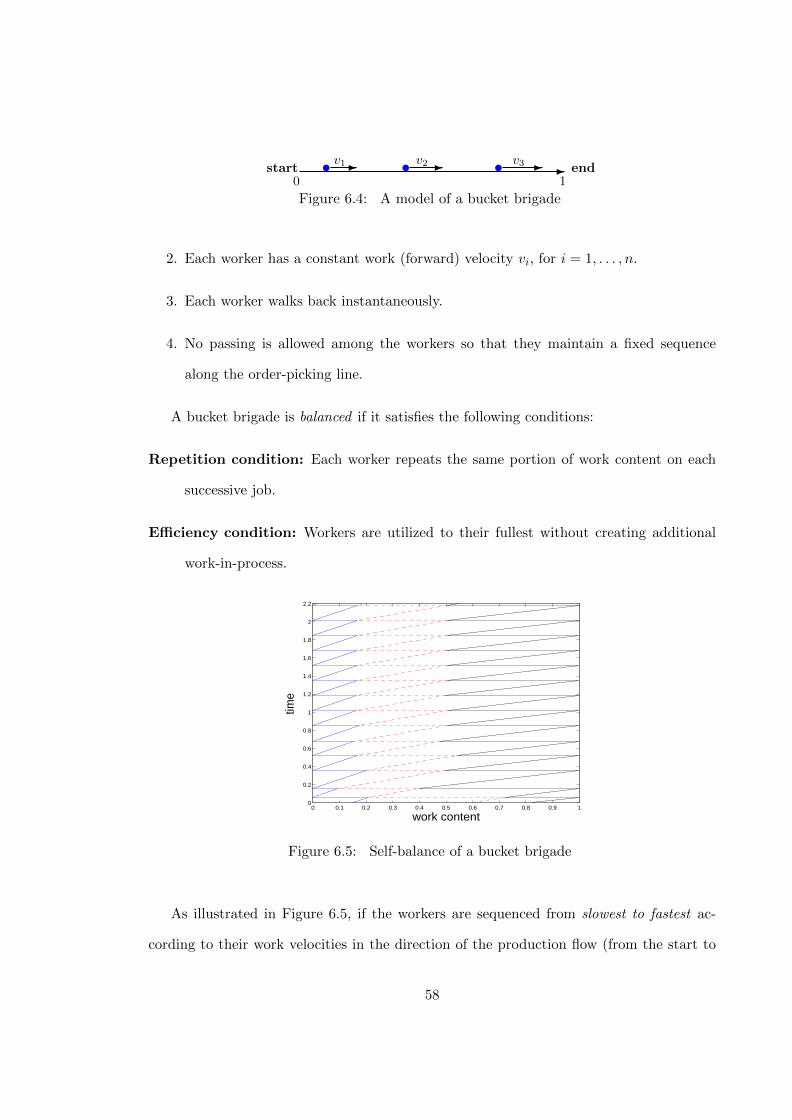
-start endt -v1 t -v2 t -v3
0 1
Figure 6.4: A model of a bucket brigade
2. Each worker has a constant work (forward) velocity vi, for i = 1, . . . , n.
3. Each worker walks back instantaneously.
4. No passing is allowed among the workers so that they maintain a fixed sequence
along the order-picking line.
A bucket brigade is balanced if it satisfies the following conditions:
Repetition condition: Each worker repeats the same portion of work content on each
successive job.
Efficiency condition: Workers are utilized to their fullest without creating additional
work-in-process.
0 0.1 0.2 0.3 0.4 0.5 0.6 0.7 0.8 0.9 10
0.2
0.4
0.6
0.8
1
1.2
1.4
1.6
1.8
2
2.2
work content
time
Figure 6.5: Self-balance of a bucket brigade
As illustrated in Figure 6.5, if the workers are sequenced from slowest to fastest ac-
cording to their work velocities in the direction of the production flow (from the start to
58

the end of the line), then the bucket brigade will self-balance. When a bucket brigade with
n workers is balanced, it satisfies the above two conditions as follows.
Repetition condition: Each worker i repeats the interval of work content
[∑i−1j=1 vj∑nj=1 vj
,
∑ij=1 vj∑nj=1 vj
].
Efficiency condition: Workers are utilized to their fullest. The system’s throughput is
TH =
n∑j=1
vj .
A bucket brigade has the following advantages:
1. It is a pure pull system. Thus, work-in-process is under control.
2. Workers carry the jobs from section to section. Thus, no special material handling
equipment is required.
3. It is self-balancing if the workers are sequenced from slowest to fastest in the direction
of the production flow. Thus, no accurate measurement of task times is required.
4. It is consistent with the trend of team work.
5. The protocol is simple and identical for all the workers and no management inter-
vention is required.
6.4 How to pick slower-moving products
Figure 6.2(b) shows a fast-pick area for slower-moving products in a warehouse. The
slower-moving products are typically stored on bin shelves. These bin shelves are arranged
in multiple lines separated by aisles. Figure 6.6 shows the top view of a fast-pick area
comprising bin shelves. Products requested by an order are located at different shelves
59
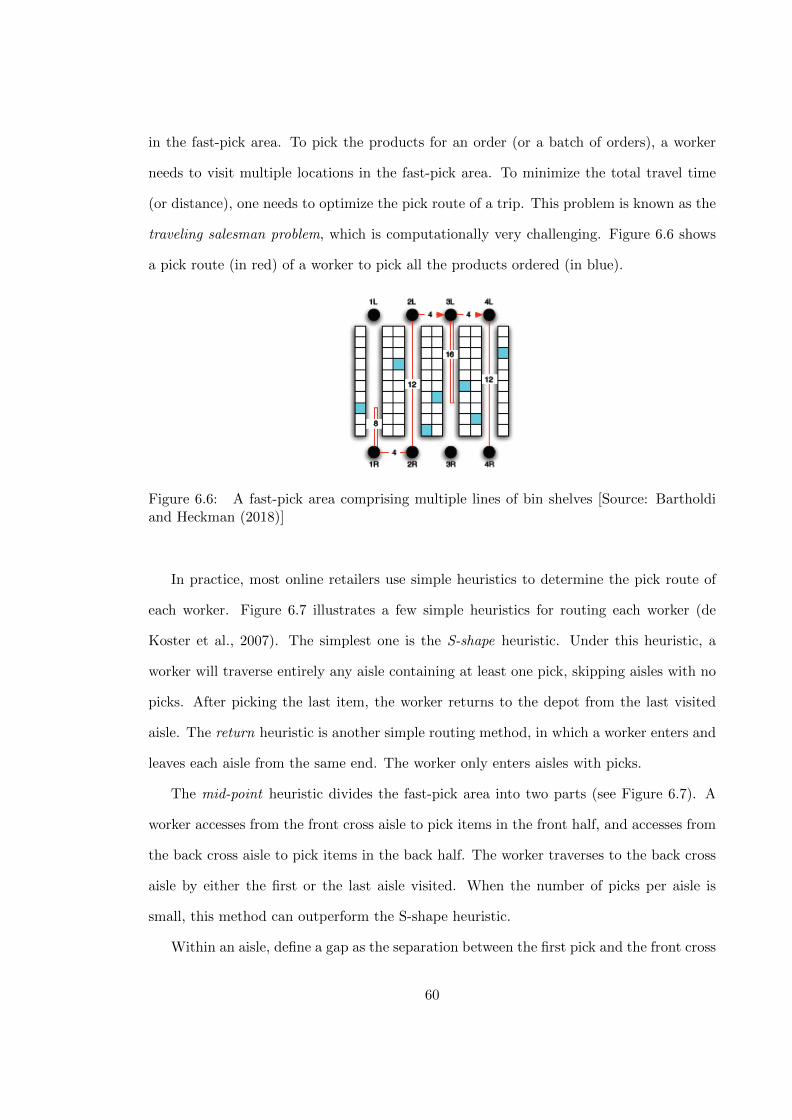
in the fast-pick area. To pick the products for an order (or a batch of orders), a worker
needs to visit multiple locations in the fast-pick area. To minimize the total travel time
(or distance), one needs to optimize the pick route of a trip. This problem is known as the
traveling salesman problem, which is computationally very challenging. Figure 6.6 shows
a pick route (in red) of a worker to pick all the products ordered (in blue).
Figure 6.6: A fast-pick area comprising multiple lines of bin shelves [Source: Bartholdiand Heckman (2018)]
In practice, most online retailers use simple heuristics to determine the pick route of
each worker. Figure 6.7 illustrates a few simple heuristics for routing each worker (de
Koster et al., 2007). The simplest one is the S-shape heuristic. Under this heuristic, a
worker will traverse entirely any aisle containing at least one pick, skipping aisles with no
picks. After picking the last item, the worker returns to the depot from the last visited
aisle. The return heuristic is another simple routing method, in which a worker enters and
leaves each aisle from the same end. The worker only enters aisles with picks.
The mid-point heuristic divides the fast-pick area into two parts (see Figure 6.7). A
worker accesses from the front cross aisle to pick items in the front half, and accesses from
the back cross aisle to pick items in the back half. The worker traverses to the back cross
aisle by either the first or the last aisle visited. When the number of picks per aisle is
small, this method can outperform the S-shape heuristic.
Within an aisle, define a gap as the separation between the first pick and the front cross
60
aisle, between any two adjacent picks, or between the last pick and the back cross aisle.
Instead of reaching the mid-point, each worker under the largest gap heuristic continues
on an aisle until he reaches the largest gap within the aisle, which is the portion of the
aisle that the worker does not traverse. If the largest gap is between two adjacent picks,
the worker performs a return route from both ends of the aisle. Otherwise, the worker
performs a return route from either the front or the back cross aisle. Note that the back
cross aisle can only be accessed through either the first or the last visited aisle. Although
it is more efficient than the mid-point heuristic, the largest gap heuristic is more difficult
to implement in practice (de Koster et al., 2007).
Under the combined heuristic, a worker either entirely traverses an aisle with picks or
performs a return route. For each visited aisle, the choice is determined by an optimization
method called dynamic programming. Based on numerical experiments by Petersen (1997)
that compare the above five routing heuristics with an optimal method for a warehouse
with random storage, the best heuristic solution is on average 5% less efficient than the
optimal solution.
6.5 Problems
1. Do you think the following variant of bucket brigades can improve the productivity
further? Why?
• Allow a blocked worker to drop his incomplete job in a buffer before the busy
section and walk back
2. Do you think the following variant of bucket brigades can improve the productivity
further? Why?
• Allow the workers to circle through the order-picking line
61
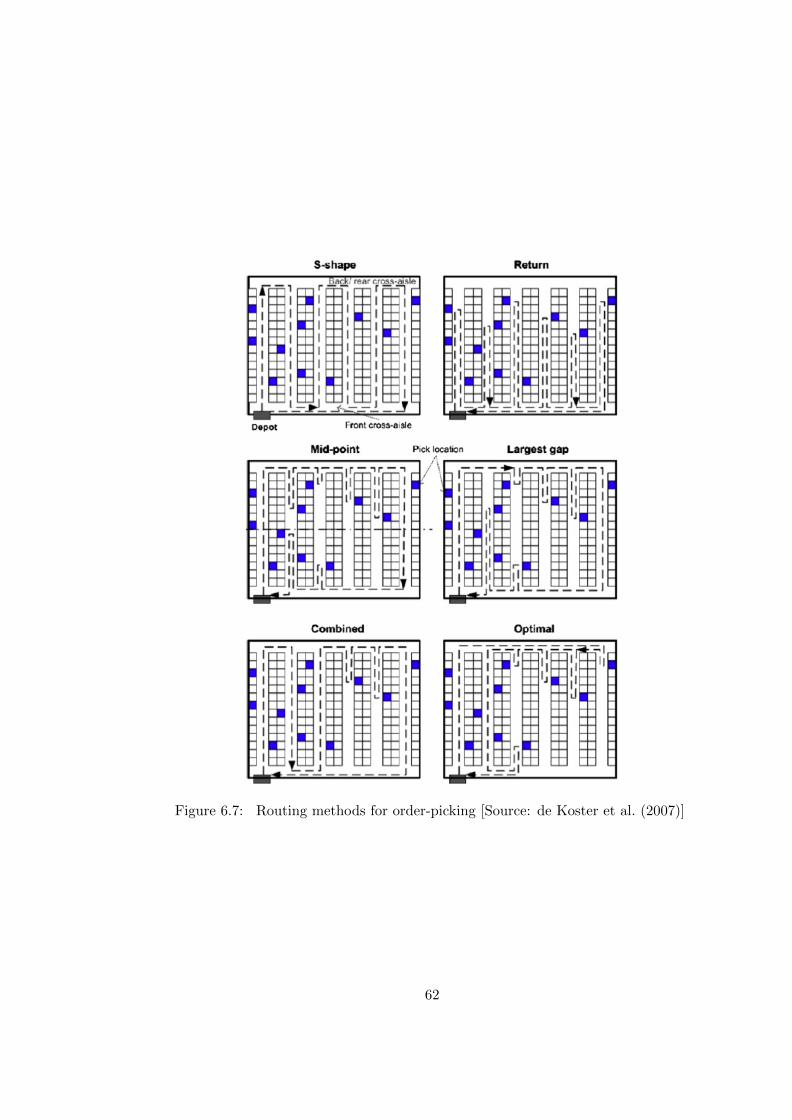
Figure 6.7: Routing methods for order-picking [Source: de Koster et al. (2007)]
62
References
Bartholdi JJ III, Eisenstein DD (1996a) A production line that balances itself. OperationsResearch 44(1): 21–34.
Bartholdi JJ III, Eisenstein DD (1996b) The bucket brigade web page. http://www.
BucketBrigades.com.
Bartholdi JJ III, Hackman ST (2018) Warehouse and Distribution Science. http://www.warehouse-science.com/.
de Koster R, Le-Duc T, Roodbergen KJ (2007) Design and control of warehouse orderpicking: A literature review. Eur. J. Oper. Res. 182(2): 481–501.
Petersen CG (1997) An evaluation of order picking routing policies. International Journalof Operations & Production Management 17(11): 1098–1111.
Wang Y, Zhang D, Liu Q, Shen F, Lee LH (2016) Towards enhancing the last-mile delivery:An effective crowd-tasking model with scalable solutions. Transortation Research PartE 93: 279–293.
63
Chapter 7
Last-mile Delivery for OnlineRetailing
“We pay a lot of money to acquire a customer and if they have that bad
experience on their first delivery they are not going to use us again and they are
going to tell everyone how terrible we are. We couldn’t afford this to happen.
Delivery was our touch point with the customer. We learned that, especially
with groceries, you need to control that last mile.”
— Roger Egan III, co-founder and founding CEO of RedMart
7.1 Introduction
Last-mile delivery is the last leg of a supply chain that transfers products from a sortation
center to a receiver. The latter can be a retail store, a restaurant, a consumer’s home, or a
carrier-designated pickup station, such as a UPS Store or an Amazon locker (Lopez, 2017).
Last-mile delivery comprises up to 28% of the total delivery cost in a supply chain (Wang
et al., 2016). Furthermore, last-mile delivery is the most expensive and critical operation
for companies engaged in e-commerce (Lee and Whang, 2001).
64
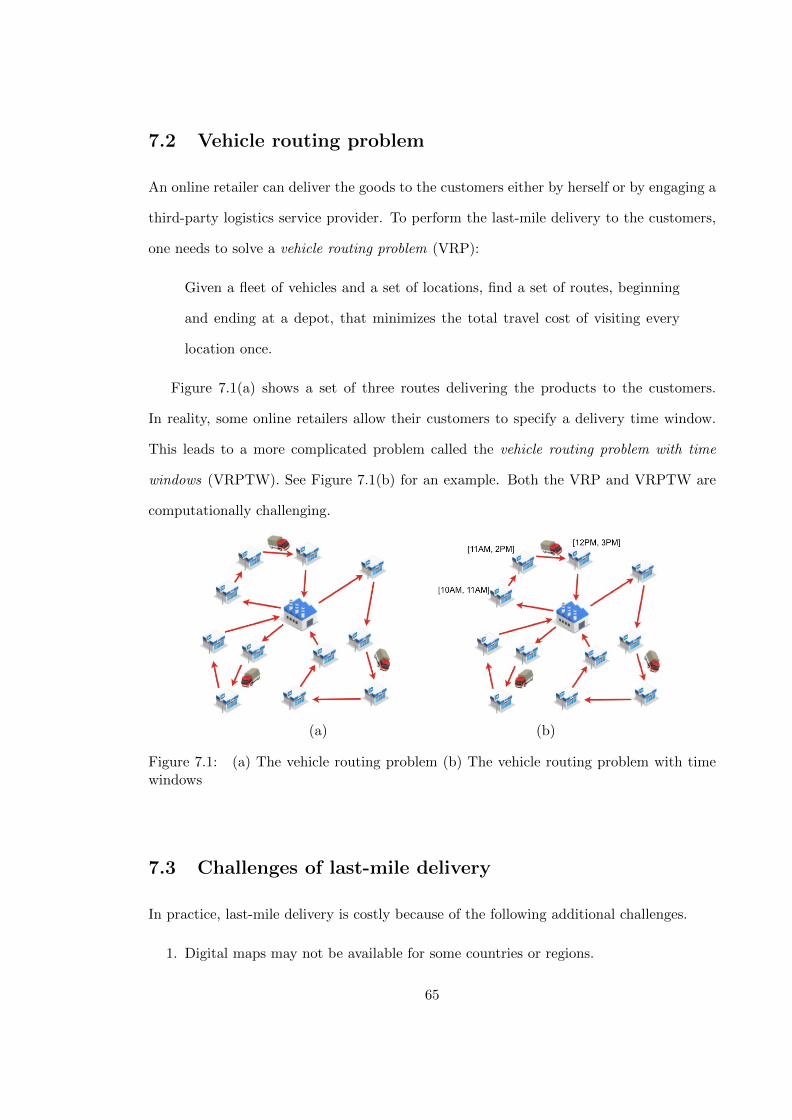
7.2 Vehicle routing problem
An online retailer can deliver the goods to the customers either by herself or by engaging a
third-party logistics service provider. To perform the last-mile delivery to the customers,
one needs to solve a vehicle routing problem (VRP):
Given a fleet of vehicles and a set of locations, find a set of routes, beginning
and ending at a depot, that minimizes the total travel cost of visiting every
location once.
Figure 7.1(a) shows a set of three routes delivering the products to the customers.
In reality, some online retailers allow their customers to specify a delivery time window.
This leads to a more complicated problem called the vehicle routing problem with time
windows (VRPTW). See Figure 7.1(b) for an example. Both the VRP and VRPTW are
computationally challenging.
(a) (b)
Figure 7.1: (a) The vehicle routing problem (b) The vehicle routing problem with timewindows
7.3 Challenges of last-mile delivery
In practice, last-mile delivery is costly because of the following additional challenges.
1. Digital maps may not be available for some countries or regions.
65

2. It is hard to navigate in some complex neighborhood.
3. It takes time to park the vehicle, to find the right elevator, and to locate the final
destination. It is hard to estimate the time.
4. The customer may not be around. In that case, shall we leave it at the doorstep or
revisit? If we revisit, what is the maximum number of attempts?
5. The delivery time is subject to weather and traffic conditions. Thus, it is challenging
to maintain the given delivery schedule.
6. Some online retailers allow rescheduling and adding new orders during the delivery.
This gives rise to the need of dynamic routing, which is more complex.
7. It is hard to maintain a consistent service level and customer experience if the labor
turnover rate is high.
7.4 Solutions to last-mile delivery
To overcome these challenges, companies have developed the following potential solutions
to last-mile delivery.
1. Pick-up stations: A common approach to last-mile delivery is to set up pick-
up stations at some convenient locations for customers to pick up their parcels by
themselves. Figure 7.2 shows examples of PopStation and Ninja Van.
2. Autonomous vehicles: A promising approach to last-mile delivery is to use au-
tonomous vehicles. Many autonomous vehicles are powered by electricity. Figure 7.3
shows some examples. The adoption rate of autonomous vehicles in a city depends
on its infrastructure and traffic regulations.
3. Drone delivery: Some companies, such as Amazon, have been using drone tech-
nology (see Figure 7.4) to deliver orders to their customers. This technology is more
66
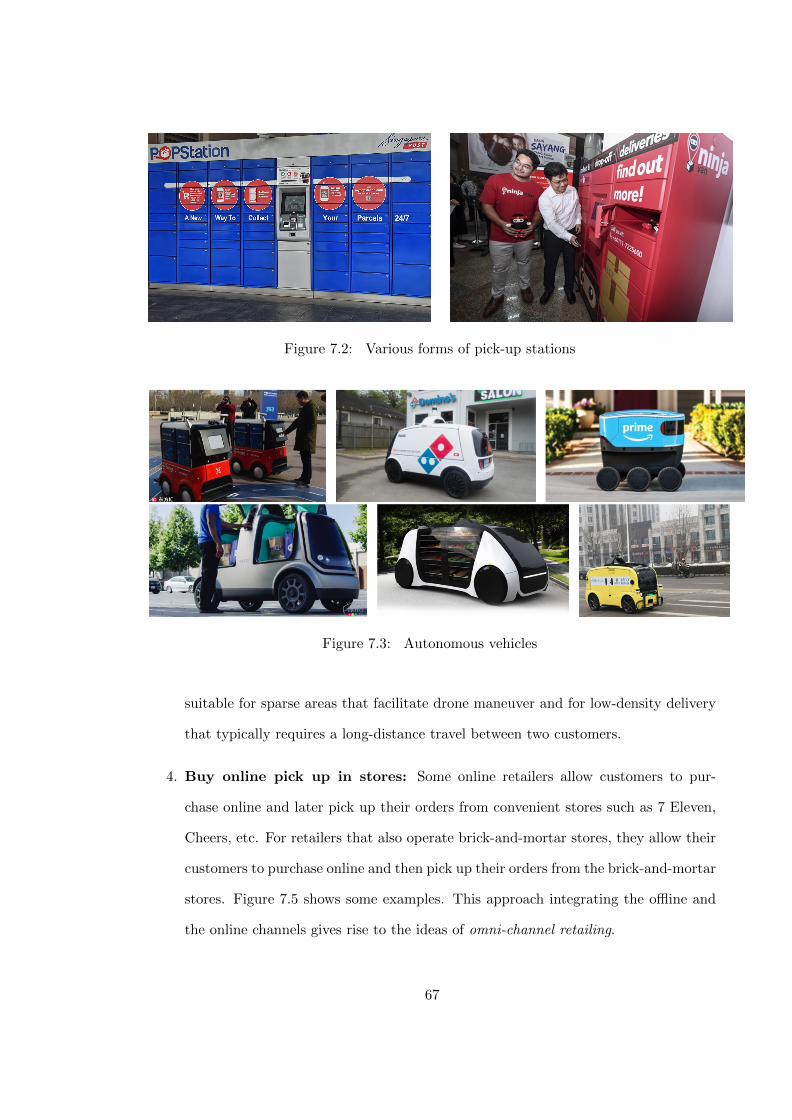
Figure 7.2: Various forms of pick-up stations
Figure 7.3: Autonomous vehicles
suitable for sparse areas that facilitate drone maneuver and for low-density delivery
that typically requires a long-distance travel between two customers.
4. Buy online pick up in stores: Some online retailers allow customers to pur-
chase online and later pick up their orders from convenient stores such as 7 Eleven,
Cheers, etc. For retailers that also operate brick-and-mortar stores, they allow their
customers to purchase online and then pick up their orders from the brick-and-mortar
stores. Figure 7.5 shows some examples. This approach integrating the offline and
the online channels gives rise to the ideas of omni-channel retailing.
67
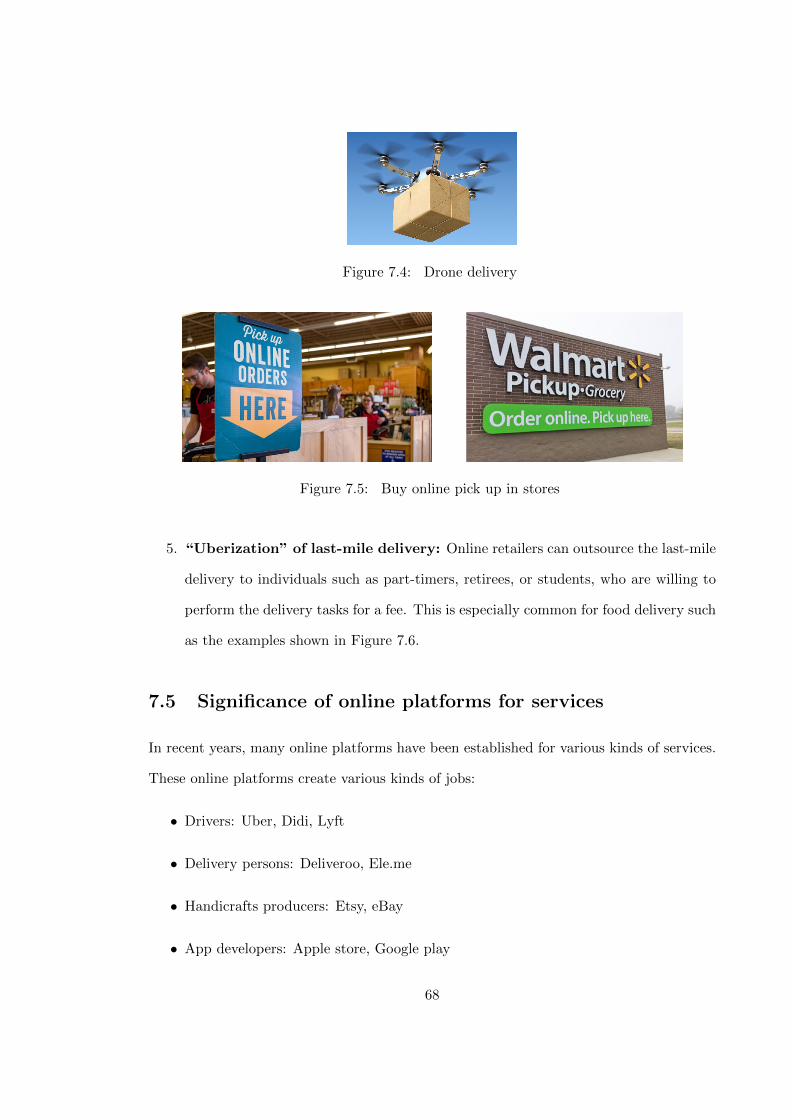
Figure 7.4: Drone delivery
Figure 7.5: Buy online pick up in stores
5. “Uberization” of last-mile delivery: Online retailers can outsource the last-mile
delivery to individuals such as part-timers, retirees, or students, who are willing to
perform the delivery tasks for a fee. This is especially common for food delivery such
as the examples shown in Figure 7.6.
7.5 Significance of online platforms for services
In recent years, many online platforms have been established for various kinds of services.
These online platforms create various kinds of jobs:
• Drivers: Uber, Didi, Lyft
• Delivery persons: Deliveroo, Ele.me
• Handicrafts producers: Etsy, eBay
• App developers: Apple store, Google play
68
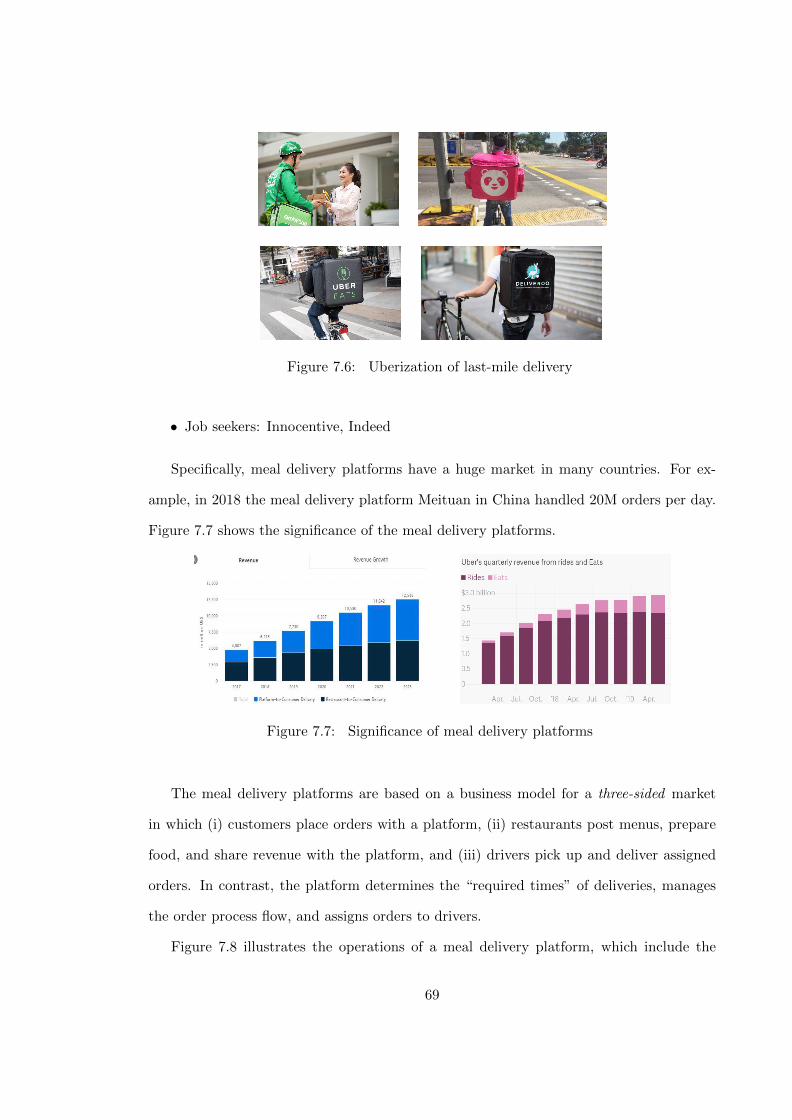
Figure 7.6: Uberization of last-mile delivery
• Job seekers: Innocentive, Indeed
Specifically, meal delivery platforms have a huge market in many countries. For ex-
ample, in 2018 the meal delivery platform Meituan in China handled 20M orders per day.
Figure 7.7 shows the significance of the meal delivery platforms.
Figure 7.7: Significance of meal delivery platforms
The meal delivery platforms are based on a business model for a three-sided market
in which (i) customers place orders with a platform, (ii) restaurants post menus, prepare
food, and share revenue with the platform, and (iii) drivers pick up and deliver assigned
orders. In contrast, the platform determines the “required times” of deliveries, manages
the order process flow, and assigns orders to drivers.
Figure 7.8 illustrates the operations of a meal delivery platform, which include the
69
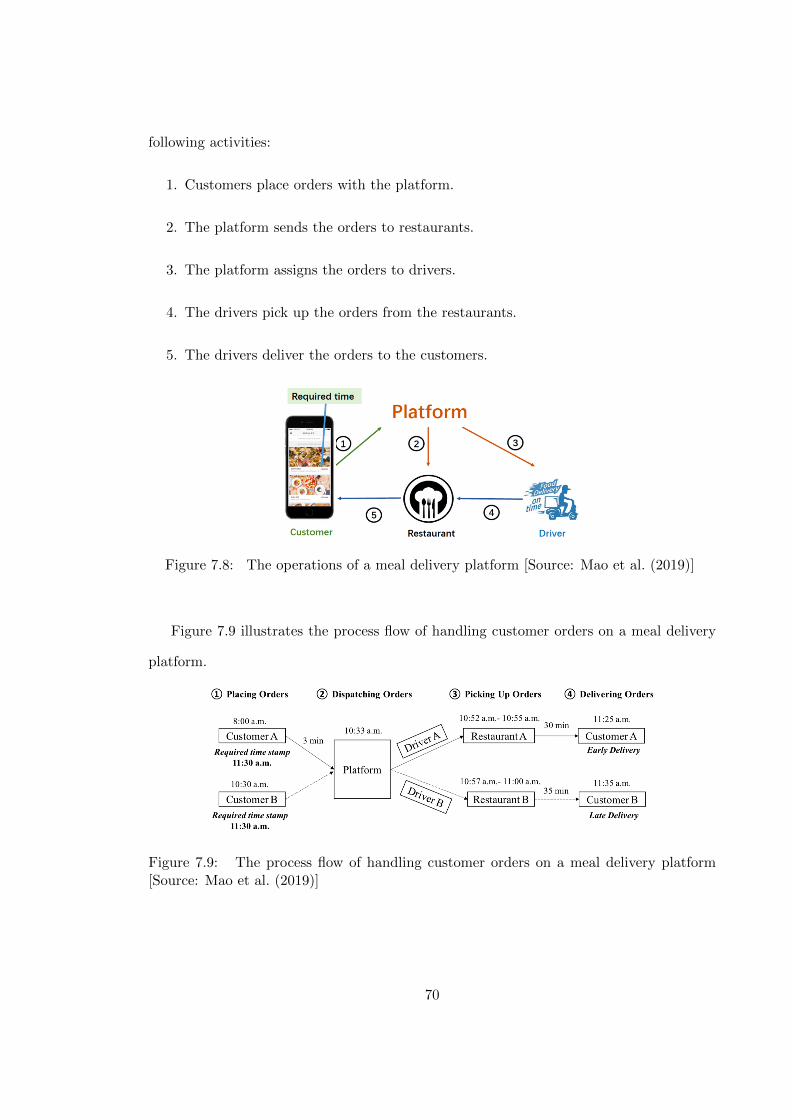
following activities:
1. Customers place orders with the platform.
2. The platform sends the orders to restaurants.
3. The platform assigns the orders to drivers.
4. The drivers pick up the orders from the restaurants.
5. The drivers deliver the orders to the customers.
Figure 7.8: The operations of a meal delivery platform [Source: Mao et al. (2019)]
Figure 7.9 illustrates the process flow of handling customer orders on a meal delivery
platform.
Figure 7.9: The process flow of handling customer orders on a meal delivery platform[Source: Mao et al. (2019)]
70
7.6 Uberization: US versus China
Although Uber was the first that used cell phones and personal vehicles to revolutionize
how people get around cities in the United States, it was arguably Chinese companies that
would generalize this business model and apply it to transforming many other industries.
7.6.1 The O2O Revolution in China
Chinese internet companies have creatively applied the ideas of Uberization in various
forms to many real-world services. “The O2O Revolution” was coined by analysts to
describe the blossom of internet services across Chinese cities. The term “O2O” is a short
form of “online-to-offline”, which means turning online actions into offline services (Lee,
2018). Examples of O2O services include delivery of a hot meal, pickup and delivery of a
parcel, a haircut or manicure at home, and a ride to the bar. People who are sick can use
Apps to hire someones to queue in the long lines outside of famous hospitals. Pet owners
can use Apps to hail someones to come and clean their pets. All these economic activities
create a rich set of data of daily life that is invaluable in building an AI-driven society.
7.6.2 “Go light” versus “go heavy”
It is interesting to see that American internet companies tend to adopt a “light” approach.
They will build information platforms but let others to deal with the on-the-ground logistics
(Lee, 2018). In contrast, companies in China tend to adopt a “heavy” approach. They not
only want to build platforms, but also want to recruit sellers, handle the goods, operate
logistics teams, supply and maintain scooters, and control e-payment. Below are a few
examples (Lee, 2018).
Yelp versus Dianping: Yelp is an American platform founded around 2004 for posting
restaurant reviews. It essentially serves as an information platform that mainly
depends on advertisements. Its Chinese counterpart, Dianping (now called Meituan
71
Dianping after merging with the group-buying platform Meituan) however chooses
a vertically integrated business model. In addition to restaurant reviews, Dianping
goes very heavily into food delivery. It hires and manages teams of scooter riders to
deliver meals from restaurants to customers’ doorstep. By 2017, Meituan Dianping
was valued at 30 billion USD, more than triple that of Yelp.
Airbnb versus Tujia: Airbnb is an American platform that lists homes and rooms for
rent. It operates as a light platform that matches supply with demand for houses,
apartments, and rooms. In contrast, its Chinese rival, Tujia offers various services
including cleaning after each visit, stocking supplies, and installing smart locks.
Uber versus Didi: After Uber created one of the first O2O models for ride-hailing, a
Chinese company called Didi copied the business idea and quickly adapted it to the
local environment. Didi went one step further by acquiring gas stations and car
workshops to service its fleet. This builds trust of drivers in the Didi brand and
makes Didi better understand the drivers. Didi eventually drove Uber out of the
Chinese market. By late 2017, Didi was valued at 57.6 billion USD, higher than that
of Uber.
72
References
Lee H, Whang S (2001) Winning the last mile of e-commerce. MIT Sloan ManagementReview 42(4):54–62.
Lee, K.-F. 2018. AI Superpowers: China, Silicon Valley, and The New World Order.Houghton Mifflin Harcourt, New York.
Lopez E (2017) Why is the last mile so inefficient? Supply Chain Dive.
Mao W, Ming L, Rong Y, Tang CS, Zheng H (2019) Faster deliveries and smarter order as-signments for an on-demand meal delivery platform. https://papers.ssrn.com/sol3/papers.cfm?abstract_id=3469015.
Wang Y, Zhang D, Liu Q, Shen F, Lee LH (2016) Towards enhancing the last-mile delivery:An effective crowd-tasking model with scalable solutions. Transortation Research PartE 93:279–293.
73
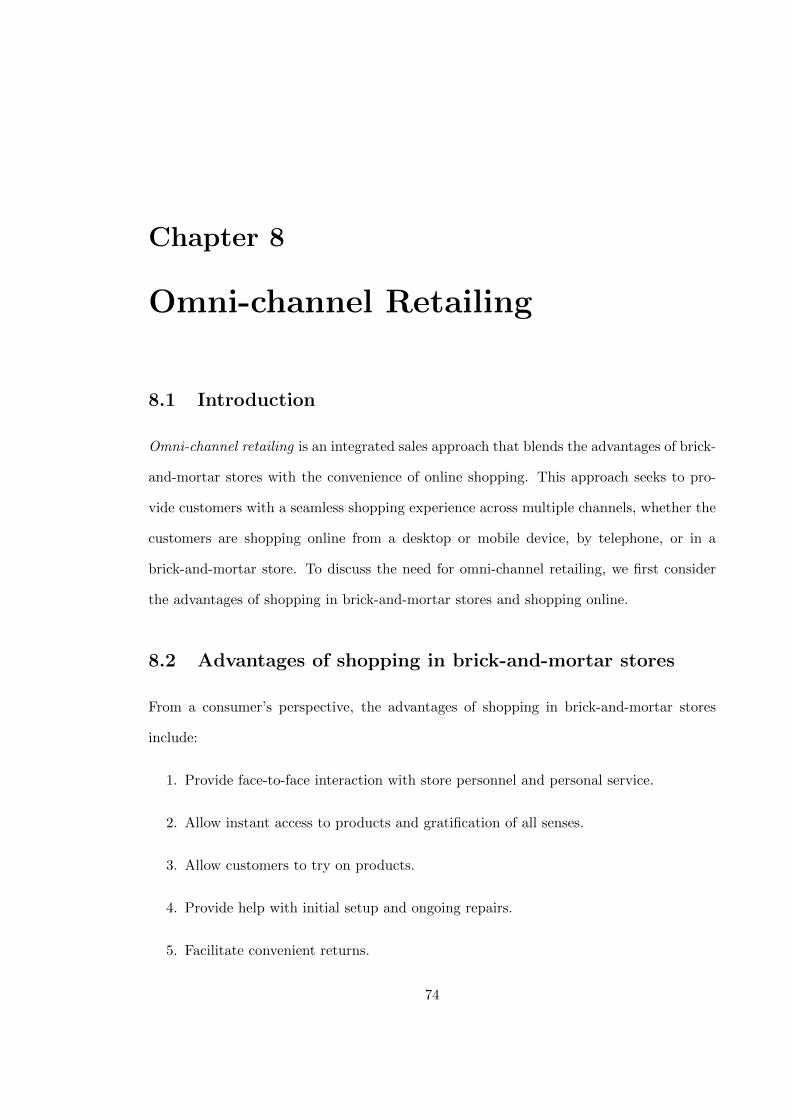
Chapter 8
Omni-channel Retailing
8.1 Introduction
Omni-channel retailing is an integrated sales approach that blends the advantages of brick-
and-mortar stores with the convenience of online shopping. This approach seeks to pro-
vide customers with a seamless shopping experience across multiple channels, whether the
customers are shopping online from a desktop or mobile device, by telephone, or in a
brick-and-mortar store. To discuss the need for omni-channel retailing, we first consider
the advantages of shopping in brick-and-mortar stores and shopping online.
8.2 Advantages of shopping in brick-and-mortar stores
From a consumer’s perspective, the advantages of shopping in brick-and-mortar stores
include:
1. Provide face-to-face interaction with store personnel and personal service.
2. Allow instant access to products and gratification of all senses.
3. Allow customers to try on products.
4. Provide help with initial setup and ongoing repairs.
5. Facilitate convenient returns.
74
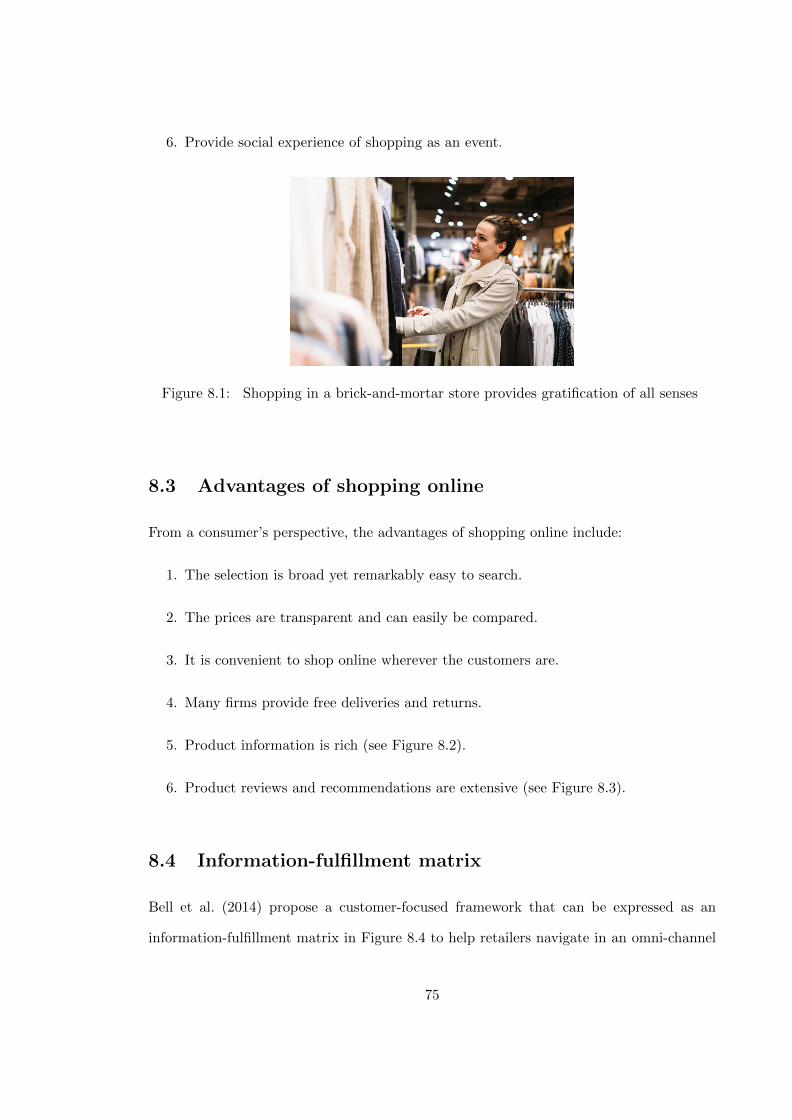
6. Provide social experience of shopping as an event.
Figure 8.1: Shopping in a brick-and-mortar store provides gratification of all senses
8.3 Advantages of shopping online
From a consumer’s perspective, the advantages of shopping online include:
1. The selection is broad yet remarkably easy to search.
2. The prices are transparent and can easily be compared.
3. It is convenient to shop online wherever the customers are.
4. Many firms provide free deliveries and returns.
5. Product information is rich (see Figure 8.2).
6. Product reviews and recommendations are extensive (see Figure 8.3).
8.4 Information-fulfillment matrix
Bell et al. (2014) propose a customer-focused framework that can be expressed as an
information-fulfillment matrix in Figure 8.4 to help retailers navigate in an omni-channel
75
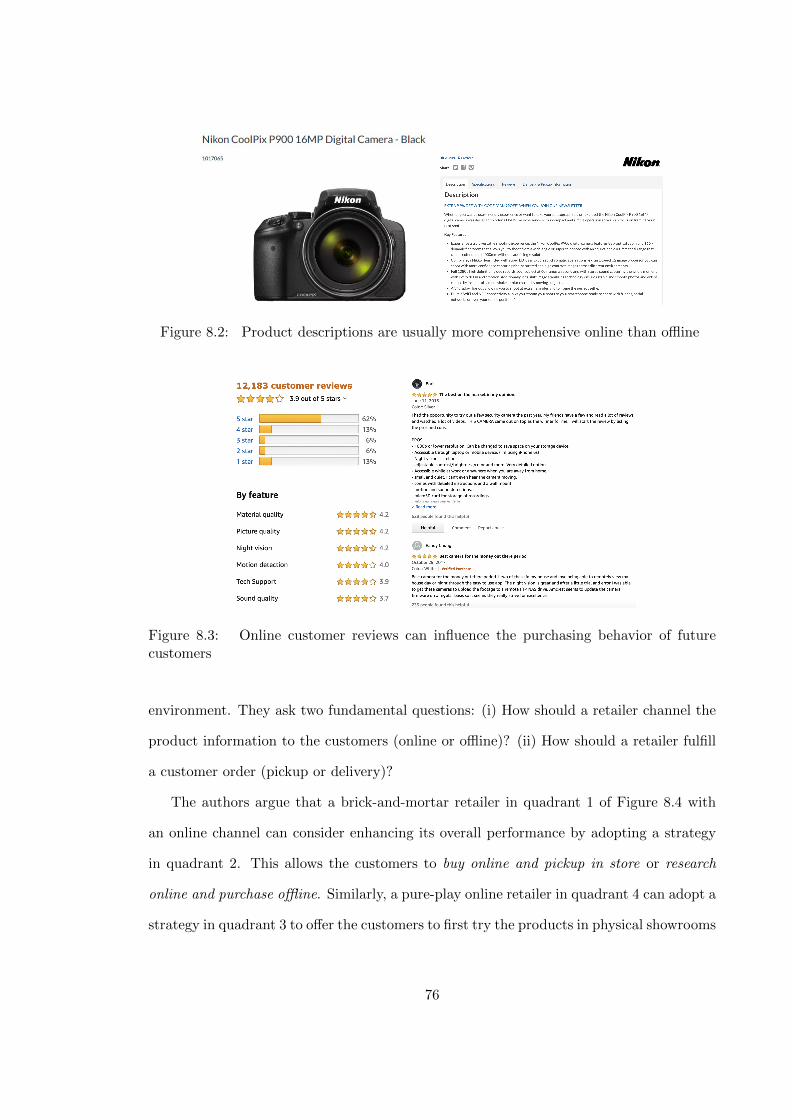
Figure 8.2: Product descriptions are usually more comprehensive online than offline
Figure 8.3: Online customer reviews can influence the purchasing behavior of futurecustomers
environment. They ask two fundamental questions: (i) How should a retailer channel the
product information to the customers (online or offline)? (ii) How should a retailer fulfill
a customer order (pickup or delivery)?
The authors argue that a brick-and-mortar retailer in quadrant 1 of Figure 8.4 with
an online channel can consider enhancing its overall performance by adopting a strategy
in quadrant 2. This allows the customers to buy online and pickup in store or research
online and purchase offline. Similarly, a pure-play online retailer in quadrant 4 can adopt a
strategy in quadrant 3 to offer the customers to first try the products in physical showrooms
76
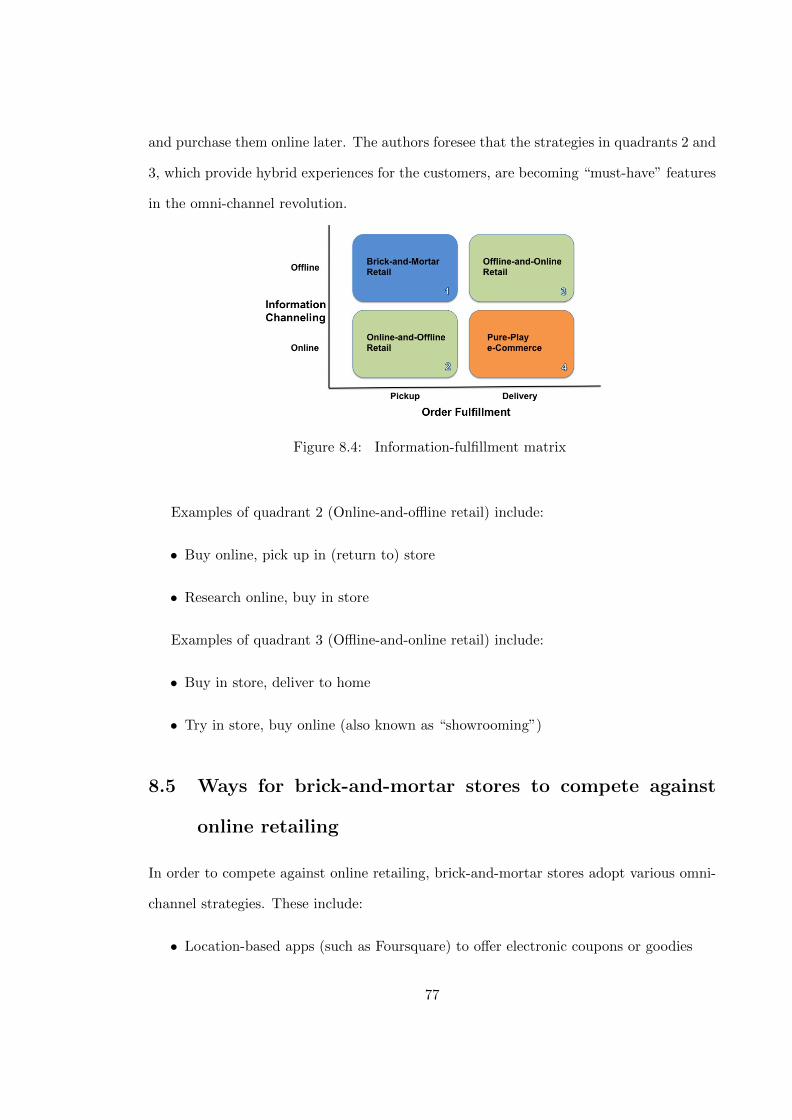
and purchase them online later. The authors foresee that the strategies in quadrants 2 and
3, which provide hybrid experiences for the customers, are becoming “must-have” features
in the omni-channel revolution.
Figure 8.4: Information-fulfillment matrix
Examples of quadrant 2 (Online-and-offline retail) include:
• Buy online, pick up in (return to) store
• Research online, buy in store
Examples of quadrant 3 (Offline-and-online retail) include:
• Buy in store, deliver to home
• Try in store, buy online (also known as “showrooming”)
8.5 Ways for brick-and-mortar stores to compete against
online retailing
In order to compete against online retailing, brick-and-mortar stores adopt various omni-
channel strategies. These include:
• Location-based apps (such as Foursquare) to offer electronic coupons or goodies
77
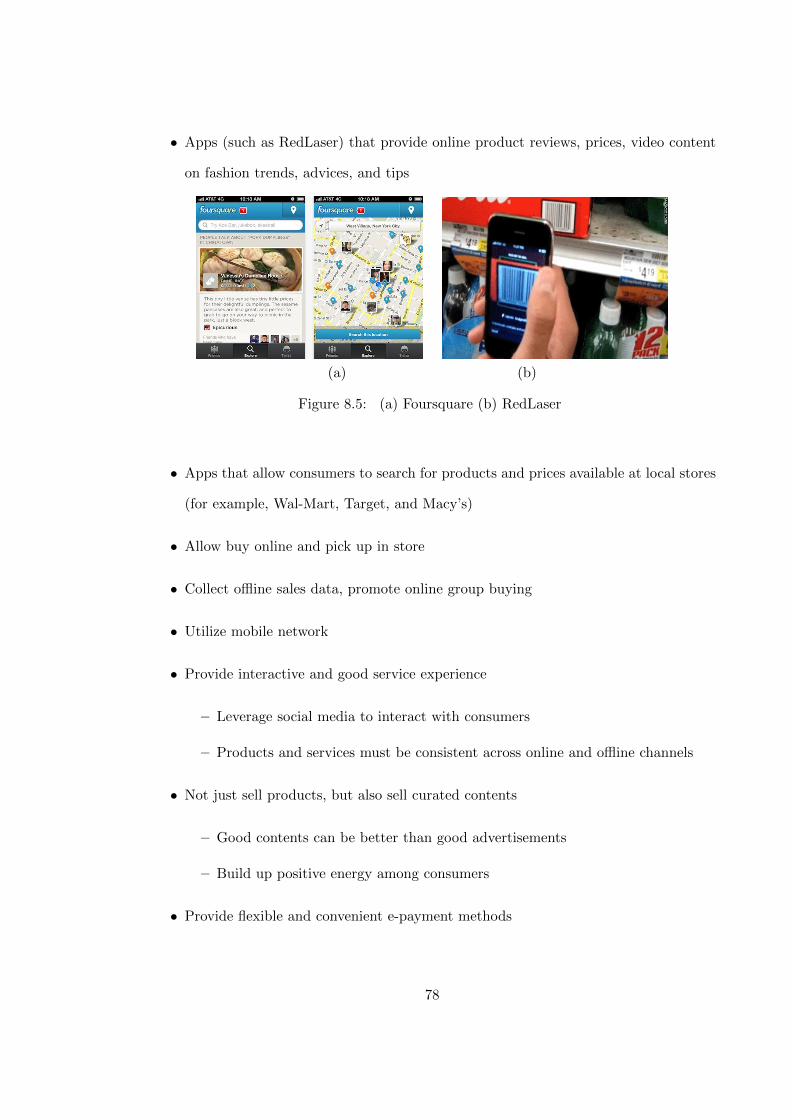
• Apps (such as RedLaser) that provide online product reviews, prices, video content
on fashion trends, advices, and tips
(a) (b)
Figure 8.5: (a) Foursquare (b) RedLaser
• Apps that allow consumers to search for products and prices available at local stores
(for example, Wal-Mart, Target, and Macy’s)
• Allow buy online and pick up in store
• Collect offline sales data, promote online group buying
• Utilize mobile network
• Provide interactive and good service experience
– Leverage social media to interact with consumers
– Products and services must be consistent across online and offline channels
• Not just sell products, but also sell curated contents
– Good contents can be better than good advertisements
– Build up positive energy among consumers
• Provide flexible and convenient e-payment methods
78
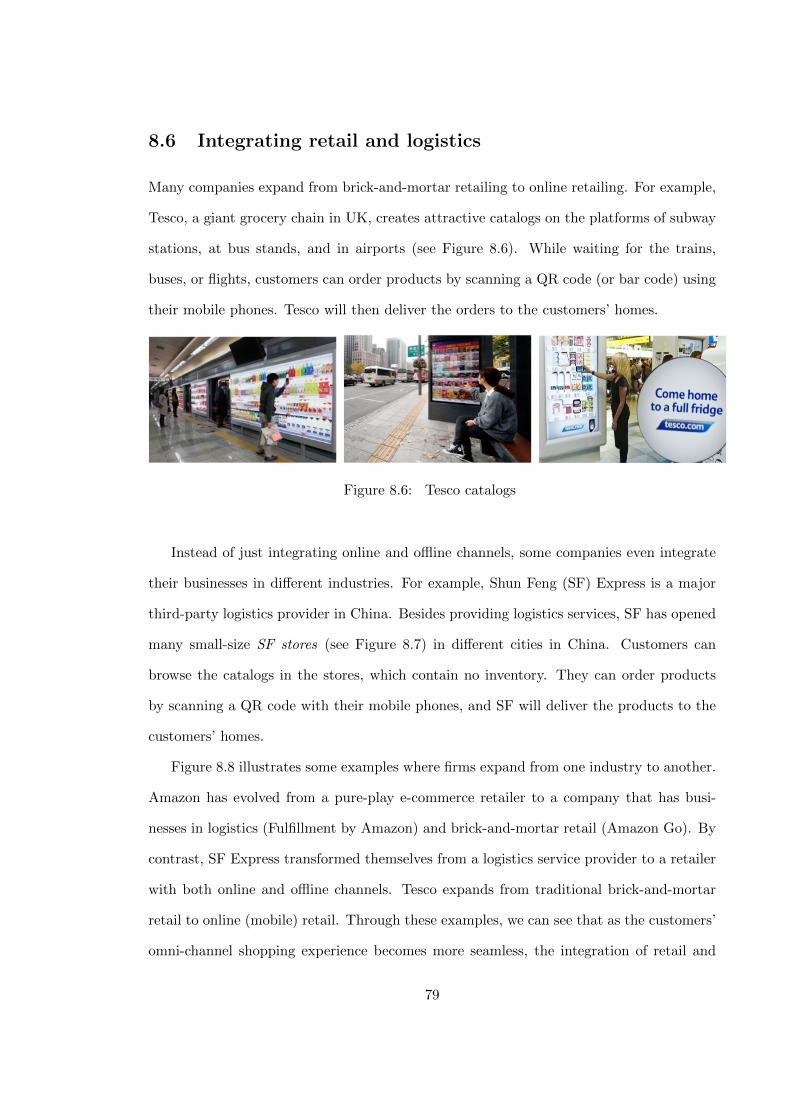
8.6 Integrating retail and logistics
Many companies expand from brick-and-mortar retailing to online retailing. For example,
Tesco, a giant grocery chain in UK, creates attractive catalogs on the platforms of subway
stations, at bus stands, and in airports (see Figure 8.6). While waiting for the trains,
buses, or flights, customers can order products by scanning a QR code (or bar code) using
their mobile phones. Tesco will then deliver the orders to the customers’ homes.
Figure 8.6: Tesco catalogs
Instead of just integrating online and offline channels, some companies even integrate
their businesses in different industries. For example, Shun Feng (SF) Express is a major
third-party logistics provider in China. Besides providing logistics services, SF has opened
many small-size SF stores (see Figure 8.7) in different cities in China. Customers can
browse the catalogs in the stores, which contain no inventory. They can order products
by scanning a QR code with their mobile phones, and SF will deliver the products to the
customers’ homes.
Figure 8.8 illustrates some examples where firms expand from one industry to another.
Amazon has evolved from a pure-play e-commerce retailer to a company that has busi-
nesses in logistics (Fulfillment by Amazon) and brick-and-mortar retail (Amazon Go). By
contrast, SF Express transformed themselves from a logistics service provider to a retailer
with both online and offline channels. Tesco expands from traditional brick-and-mortar
retail to online (mobile) retail. Through these examples, we can see that as the customers’
omni-channel shopping experience becomes more seamless, the integration of retail and
79
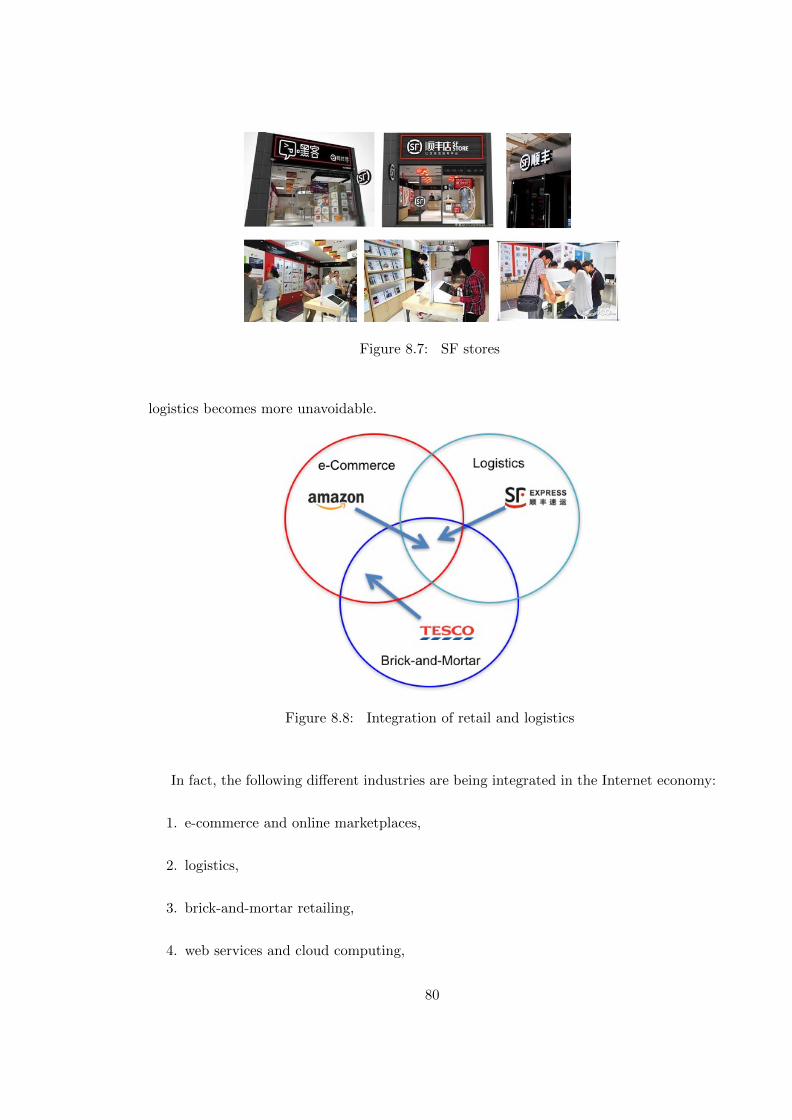
Figure 8.7: SF stores
logistics becomes more unavoidable.
Figure 8.8: Integration of retail and logistics
In fact, the following different industries are being integrated in the Internet economy:
1. e-commerce and online marketplaces,
2. logistics,
3. brick-and-mortar retailing,
4. web services and cloud computing,
80

5. e-payment and financing,
6. AI and autonomous technology.
Companies that provide these services and products include Alibaba, Amazon, and JD.com.
81
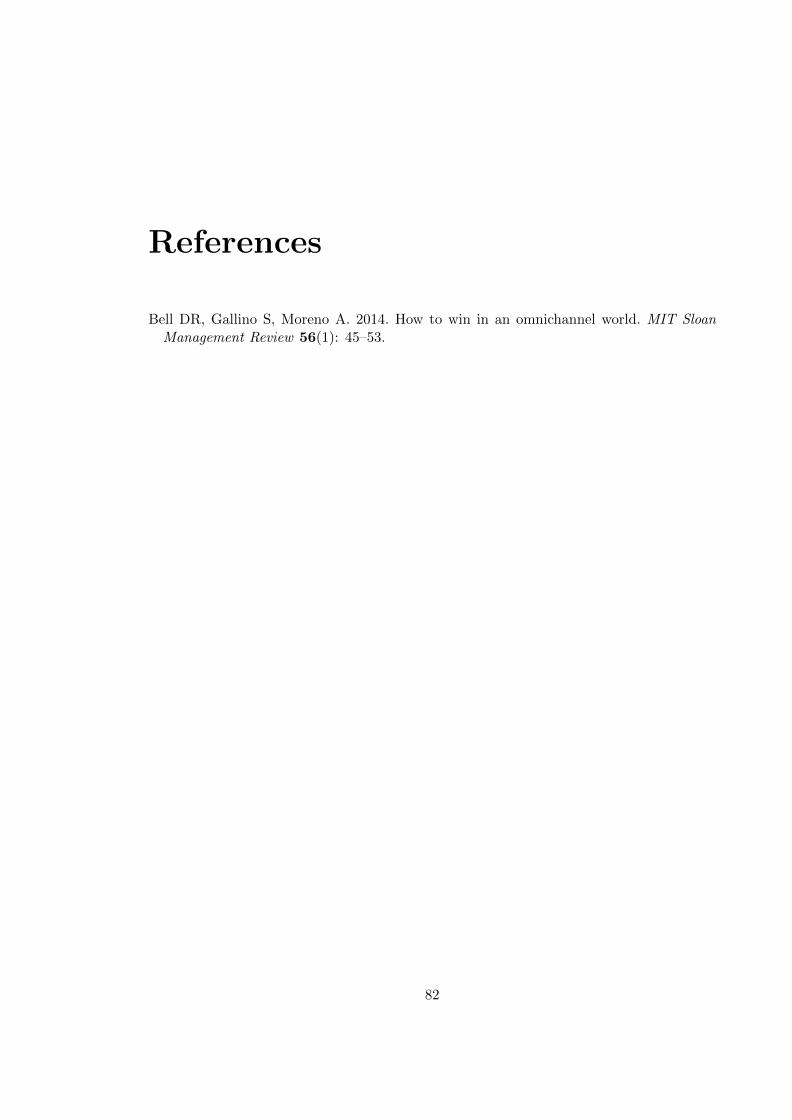
References
Bell DR, Gallino S, Moreno A. 2014. How to win in an omnichannel world. MIT SloanManagement Review 56(1): 45–53.
82
About the author
Yun Fong Lim is Associate Professor of Operations Management and MPA ResearchFellow at the Lee Kong Chian School of Business, Singapore Management University(SMU). He is also Academic Director of the MSc in Management (MiM) Program at SMU.He has been a Chang Jiang Chair Professor, a Lee Kong Chian Fellow, and an NOL Fellow.Yun Fong’s research has appeared in Operations Research, Management Science, Manufac-turing and Service Operations Management, and Production and Operations Management.He has delivered keynote and plenary speeches in several international conferences. Inaddition, his work has received funding by MOE, A*STAR, and NNSF, and media cov-erage by The Business Times, CNA938, and Channel 8. His current research interestsinclude e-commerce and marketplace analytics, inventory management, warehousing andfulfillment, sustainable urban logistics, and flexible workforce and resource management.Yun Fong serves as Associate Editor for Naval Research Logistics and Guest Editor forProduction and Operations Management.
Yun Fong is a recipient of the SMU Teaching Excellence Innovative Teacher Award. Heteaches both undergraduate and postgraduate courses in Operations Management. He hasprovided consulting service and executive development to corporations such as Alibaba,Maersk, McMaster-Carr Company, Resorts World Sentosa, Schneider Electrics, TemasekHoldings, and Zalora. Yun Fong obtained both his PhD and MSc degrees in Industrialand Systems Engineering from the Georgia Institute of Technology.
83