Indirect Domestic Value Added in Mexico's Manufacturing Exports

Online Appendix to Domestic Value Added in Exports: Theory
and Firm Evidence from China
Hiau Looi Kee (World Bank) and Heiwai Tang (Johns Hopkins University)
I Data Description
The main data set for this paper covers the universe of Chinese import and export trans-
actions in each month between 2000 and 2007. It reports values (in US dollars) of a �rm�s
exports (and imports) at the HS 8-digit level (over 7000 products) to each destination (from
each source) country. We drop trading companies (intermediaries) in our sample, using the
methods proposed by Ahn, Khandelwal, and Wei (2011) to identify them. This level of
disaggregation is the �nest for empirical studies in international trade �i.e., transactions at
the �rm-product-country-month level.
Processing trade has been playing a signi�cant role in driving China�s export growth.
From 2000 to 2007, processing exports have increased by over four folds from 138 billion
USD to 680 billion USD with the share of processing exports in total exports held steadily
around 55 percent, as shown in Figure A1. In addition, Table A1 shows that, the U.S.
consistently ranked as the top destination, accounting for about 25 percent of Chinese total
processing exports. Following the U.S. is Hong Kong SAR, China, which accounted for
slightly over 20 percent of the total. Japan has been the third largest market for Chinese
processing exports, but its prominence has declined from 18 percent in 2000 to 10 percent
in 2007. Processing exports are widespread among China�s top 10 export destinations, as
seen in Figure A2. It accounted for 63 percent of Chinese exports to the U.S. in 2007 and
81 percent for Hong Kong SAR, China, the highest share among the top 10 destinations.
We present in Figure A3 the share of processing exports in 2007 by industry sector,
1

according to the United Nations groupings of HS2 categories. There exists a substantial
heterogeneity in the prevalence of processing exports across industries. The share is about
20 percent for the �wood & articles� sector (HS2 = 6 -14) and is over 80 percent for the
�machinery, mechanical, and electrical equipment�sector (HS2 = 84-85).
The advantage of focusing on processing exporters is that we need not worry about their
imports for �nal consumption, as by de�nition, all imports in processing trade have to be
used as intermediate inputs.52 However, not all processing exporters import for their own
use. Some of them import for other processing �rms, which also implies that some processing
�rms must export more than what their imported materials can support. We develop sys-
tematic rules to identify processing �rms that potentially import from and export for other
�rms. To this end, we merge the customs transaction data with the �rm-level data from
the Annual Surveys of Industrial Firms conducted by China�s National Bureau of Statistics
(NBS hereafter). The surveys cover all state-owned enterprises (SOEs) and non-state-owned
�rms that have sales above 5 million yuan in a given year.53 The NBS data contain detailed
information for most of the standard balance sheet information, such as �rm ownership,
output, value added, industry code (480 categories), exports, employment, original value of
�xed asset, and intermediate inputs. Tables A2 and A3 present the percentages of �rms and
sales that are covered by the merged data. Table A4 presents the industry�s median of �rm
materials-to-sales ratios.52Manova and Yu (2013) examine how �nancial constraints a¤ect exporters positions in global supply
chains in China and thus their pro�ts. In this paper, we simply take advantage of the special features of theprocessing regime without getting into the details about �rms�transition from one regime to another.53The industry section in the o¢ cial statistical yearbooks of China is constructed based on the same data
source. The unit of analysis is a �rm, and not the plant, but other information in the survey suggests thatmore than 95% of all observations in our sample are single-plant �rms. 5 million yuan is roughly exchangedto 600,000 US dollars during the sample period.
2

A Transforming Chinese I/O Tables to One Based on UN Indus-
try Code
1. Use the concordance from China�s National Bureau of Statistics to match multiple IO
codes with multiple HS 6-digit codes (revision 2002).
2. Match multiple HS6 codes to multiple UN industry sector codes (20 of them).
3. For each IO code, pick the UN code that has the largest number of HS6 shared. This
will guarantee that all IO codes will be covered.
4. For UN codes that are matched with multiple IO codes, manually choose a unique UN
code for the match. It happens in only one case.
5. Then add up the values of intermediate inputs for each pair of upstream-downstream
relationship. A matrix of 20 groups by 20 groups will be built.
6. Recompute the IO coe¢ cients based on the UN industry sector classi�cation.
B Computing Domestic Upstream Variety
To compute domestic upstream variety, we use the weighted average of the number of HS6
products exported by non-processing �rms across all upstream industries as a proxy for
domestic upstream varieties, since data on domestic varieties are not available. The belief is
that a �rm�s export product scope is a subset of its domestic product scope.54 Speci�cally,
we compute the weighted average of the number of upstream varieties by Vjt =PI
i=1 sijVit,
where sij is the share of industry i0s goods used in total input costs of industry j, according
to the Chinese input-output table for 2002. Vit is the number of HS6 products exported by
54There could be export varieties that were not sold domestically or vice versa. There could also bedomestic varieties produced by non-exporters that were not exported. In these regards, our proxy should beconsidered as a lower bound of the number of domestic varieties.
3

non-processing �rms in industry i in year t. Since the HS classi�cations have changed twice
(in 2002 and 2007, respectively) during our sample period, we use the concordance �le created
by Cebeci et al. (2012) to de�ne a consistent set of varieties over time. As reported in Table
A5, the number of varieties available to the downstream processing exporters is increasing
over time for most industries. Some industries have systematically higher input varieties (e.g.
machinery, mechanical, and electrical equipment). This industry-speci�c feature is already
controlled for by industry �xed e¤ects in the regressions.
C Computing Upstream Input Tari¤s
Computing an industry�s upstream tari¤s involves two steps. For each upstream industry,
input tari¤s are measured as a weighted average of tari¤s facing all input suppliers to that
industry. Speci�cally, we obtain the share of industry i�s inputs in total material cost of
industry j, sij, from the Chinese IO table for 2002. Then for each industry j, we compute
the weighted average of input tari¤s as e� jt =PIi=1 sij� it, where � it is the average tari¤ rate
for industry i in year t and I is the total number of industries. Finally, for each downstream
industry k, we use the IO coe¢ cients again to compute the weighted average of upstream
input tari¤s e�Ukt = PIj=1 sjke� jt. The idea to use the IO tables twice is that we need the
measure of tari¤s facing domestic input suppliers, not downstream exporters. For example,
a garment �rm uses fabrics, zippers and buttons. Fabrics �rms use cotton yarns, zipper �rms
use steel, and button �rms use plastics. Thus, the upstream input tari¤ for a garment �rm
is a weighted average tari¤ rates on cotton yarns, steel and plastics.
D Computing Industry-speci�c Exchange Rate Indices
We use the Tornqvist method to construct an industry-speci�c time-varying exchange rate.
For each industry j, let Ijt be the set of common countries �rms in industry j import from
4

in two consecutive years, t and t � 1: Denote country c�s currency price of a yuan in year
t and t � 1 by Ect and Ect�1; and denote country c�s shares in industry j0s total imports
in year t and t � 1 by scjt and scj;t�1. The industry-speci�c rate of yuan appreciation with
respect to the countries from which industry j imports in year t is de�ned as
4 lnEjt =Xc2Ijt
1
2(scjt + scj;t�1) (lnEct � lnEc;t�1) :
Using this weighted average of appreciation rates, we de�ne the industry-speci�c exchange
rate for imports as
Ejt = Ej;t�1 exp (4 lnEjt) ;
with Ejt normalized to 1 in the base year (i.e., 2000) or any starting year for each industry.
E Computing Industry-speci�c Domestic Input Price Indices
Computing the input price indices involves two steps. First, we use the Tornqvist method to
construct an industry-speci�c time-varying domestic input price indices. For each industry
j (15 of them), let Ijt be the set of common sub-industries in two consecutive years, t and
t� 1: Denote sub-industry s�s output price index in year t and t� 1 by Pst and Ps;t�1; and
denote the share of sub-industry s�s sales in industry j0s total sales in year t and t � 1 by
!sjt and !sj;t�1. Data on output price indices at the 4-digit sector level (based on China�s
NBS classi�cation) are obtained from Brandt, Van Biesebroeck, and Zhang (2012).55 The
industry-speci�c rate of output price in�ation in year t is de�ned as
4 ln ePjt = Xs2Ijt
1
2(!sjt + !sj;t�1) (lnPst � lnPs;t�1) :
55http://www.econ.kuleuven.be/public/N07057/CHINA/appendix/
5

Using this weighted average of in�ation rates, the sector-speci�c output price level is de�ned
as
ePjt = ePj;t�1 exp�4 ln ePjt� ;with ePjt normalized to 1 in 2000.The second step is to compute the weighted average of ePjt, with weights equal to the
coe¢ cients from the Chinese IO table for 2002. The goal is to compute the average domestic
prices facing processing �rms in industry j. Speci�cally, for each industry j, the weighted
average of input prices is PDjt =PJ
k=1 akjePkt, where ak is the share of industry k goods in
total material costs for production of a unit of industry j goods and J is the number of
industries. Notice that PDjt varies across time purely due to the variation in ePjt, since akj is�xed throughout the sample.
F Computing Industry-speci�c Imported Input Price Indices
To compute the imported input indices, we use the Tornqvist method to construct an
industry-speci�c time-varying import price indices based on �rm-level imports from the
customs transaction data. For each industry j (15 of them), let Ijt be the set of common
product (at the HS 8-digit level) in two consecutive years, t and t � 1: Denote product s�s
import prices in year t and t�1 by pIst and pIs;t�1; and denote the share of product s�s imports
in industry j0s total imports in year t and t � 1 by $sjt and $sj;t�1. Product-level import
prices (by processing �rms only) are computed as total import value divided by total quan-
tity of import at the HS8 level, using customs transaction-level data. Then sector-speci�c
rate of import price in�ation in year t is de�ned as
4 ln eP Ijt = Xj2Ijt
1
2($sjt +$sj;t�1)
�ln pIst � ln pIs;t�1
�:
6

Using this weighted average of in�ation rates, the sector-speci�c import price level is de�ned
as
eP Ijt = eP Ij;t�1 exp�4 ln eP Ijt� ;with eP Ijt normalized to 1 in 2000. Table A6 reports the ratio of the imported material priceindex to the domestic material price index across industry-years.
II Theoretical Derivation of Firm DVAR (the Cobb-
Douglas Case)
In the main text, we derive the theoretical expression of �rm DV AR based on a translog
production function. In this section, we use a more convenient form of production function
�the Cobb-Douglas production function, as the basis to derive �rm DV AR.
For each year t; consider �rm i with productivity, �i, which uses both domestic�MDit
�and imported materials
�M Iit
�; alongside capital (Kit) and labor (Lit) to produce output Yi,
according to the following production production:
Yit = �iK�Kit L
�Lit M
�Mit ; (31)
Mit =�M
D ��1�
it +MI ��1
�it
� ���1; (32)
�K + �L + �M = 1 and � > 1:
Each �rm faces input prices�rt; wt; P
Dt ; P
It
�for capital, labor, domestic materials, and im-
ported materials. Given (32) it can be shown that the price index of total materials is a
constant-elasticity-of-substitution (CES) function over PDt and P It :
PMt =��PDt�1��
+�P It�1��� 1
1��
7

Firms�cost minimization implies the following total cost of producing Yit units of output:
Cit�rt; wt; P
Dt ; P
It ; Yit
�=
Yit�i
�rt�K
��K �wt�L
��L �PMt�M
��M; with (33)
PMt Mit
Cit= �M :
Thus, the marginal cost (cit) of producing Yit units of �nal goods is
cit =@Cit@Yit
=1
�i
�rt�K
��K �wt�L
��L �PMt�M
��M; (34)
which is constant over output. Note that while input prices and input elasticities are common
across all �rms within an industry-year, �rms have di¤erent productivity, �i; which results
in di¤erent marginal cost, cit; across �rms. Then we can express the share of imported
materials in total revenue as:
P ItMIit
PitYit=
P ItMIit
PMt Mit
PMt Mit
Cit
CitPitYit
=P ItM
Iit
PMt Mit
�McitPit
= �M (1� �it)P ItM
Iit
PMt Mit
;
where �i =Pit�citPit
2 [0; 1] is the price-cost margin of the �rm.56
Finally, the share of imported materials in total cost of materials can be obtained by the
56Note that price-cost margin, �i is closely related to �rm�s markup, which is usually de�ned as
�i =Pitcit
=1
1� �i:
If price equals marginal cost, as it is in the case of perfect competition, �i equals 0 and �i = 1:When �i > 1;then �i > 0:
8

following minimization problem:
minP ItMIit + P
Dt M
Dit
s:t: Mit =�M
D ��1�
it +MI ��1
�it
� ���1:
Solving it gives the following ratio of imported material cost to total material cost:
P ItMIit
PMt Mit
=1
1 +�P ItPDt
���1 : (35)
We can then express �rm i�s DV AR in period t, based on (4), as
DV ARit = 1� �M (1� �it)1
1 +�P ItPDt
���1 : (36)
According to (36), the determinants of a �rm�s DV AR can be analyzed as follows:
1. Cross-sectional distribution of the DV AR within an industry-year
Given input prices and elasticities, the cross sectional distribution of DV AR within an
industry-year depends on the distribution of �rm�s price-cost margin, �i, given that DV AR
is an a¢ ne transformation of �i. Thus, within an industry-year, a �rm with a higher �i will
have a higher DV AR. Factors that a¤ect the price-cost margin will therefore a¤ect �rm
DV AR:
� Perfect Competition
If the industry is perfectly competitive, �it = 0; 8i; t; the cross-sectional distribution of
9

DV AR degenerates to the following constant that does not vary across �rms:
DV ARit = 1� �M1
1 +�P ItPDt
���1 ; 8i; t:� Monopolistic Competition with CES preferences
Under monopolistic competition with CES preferences, �it = �; 8i; since markup is con-
stant across all �rms, the cross-sectional distribution of DV AR degenerates to the following
constant that also does not vary across �rms within the same industry:
DV ARit = 1� �M (1� �)1
1 +�P ItPDt
���1 ; 8i; t:Note that the cross-sectional distribution of DV AR does not depend on the distribution
of �rm productivity under CES preferences, as long as markup is constant across �rms.
Empirically, if we observe varying DV AR across �rms within the same industry-year, it
indicates that the CES preference assumption is not supported and that the industry is
likely not perfectly competitive.
2. Time-series movement of DV AR within �rms
Eq. (36) shows that the time-series movement of DV AR is determined by the price of
imported inputs to domestic inputs, P ItPDt, which is common across �rms within the same
industry-year. Factors that a¤ect P ItPDt
will a¤ect a �rm�s DV AR over time. It is worth
emphasizing that factors that do not a¤ect P ItPDt
directly, such as the �rm�s wages (w) or
productivity (�i), do not directly a¤ect the time-series movement of DV AR within �rms.57
57Domestic wages can still indirectly a¤ect �rm DV AR through a¤ecting the price of domestic materials.In the regression analysis below, controlling for the relative price of materials, we should expect no impactfrom wages on �rm DV AR.
10

References
[1] Ahn, Jaebin., Amit Khandelwal, and Shang-Jin Wei (2011). �The Role of Intermediaries
in Facilitating Trade,�Journal of International Economics, 84, 73�85.
[2] Brandt, Loren, Johannes Van Biesebroeck, Yifan Zhang (2012). �Creative Accounting
or Creative Destruction? Firm-level Productivity Growth in Chinese Manufacturing,�
Journal of Development Economics, 97:2, 339-351.
[3] Cebeci, Tolga, Fernandes, Ana, Freund, Caroline. and Martha Pierola (2012). �Exporter
Dynamics Database,�World Bank Policy Research Working Paper 6229.
[4] Koopman, Robert, Zhi Wang, and Shang-Jin Wei (2012). �Estimating Domestic Content
in Exports When Processing Trade Is Pervasive,� Journal of Development Economics,
99:1, pp.178-89.
[5] Manova, Kalina and Zhihong Yu (2013). �Firms and Credit Constraints along the Global
Value Chain: Processing Trade in China,�NBER Working Paper 18561.
11

Figure A1: Share of China�s Processing Exports, 2000-2007
.55 .55 .55.55
.55
.55
.53
.56
200
400
600
800
1000
1200
Billio
n U
SD
2000 2001 2002 2003 2004 2005 2006 2007year
Total Exports Processing ExportsShare of Processing Exports
12

Figure A2: Shares of Processing Exports in China�s Top 10 Export Destinations (2000 &2007)
0.2
.4.6
.8Sh
are
of P
roce
ssin
g in
Exp
orts
US HK JP KR DE NL GB SG TW IT
2000 2007

Figure A3: Shares of Processing Exports by Industry Sector (2007)
0 .2 .4 .6 .8Share of Processing in Exports
optical, photographic (9092)machinery/ mechanical/ elec equip (8485)
plastics & rubber (3940)pulp of wood (4749)precious metals (71)
vehicles & aircrafts (8689)footwear & headgear (6467)
misc manu. (9496)raw hides & skins (4143)
textiles (5063)beverages & spirit (1624)
base metals (7283)chemical products (2838)
stone & plaster (6870)wood & articles (4446)
Figure A4: DVAR of Processing Exports - Di¤erent Filtered Samples (2000-2007)
.45
.5.5
5.6
2000 2001 2002 2003 2004 2005 2006 2007year
Filter: Exp >= Imp & Material >= Imp Filter + DVAR < 25% DVAR_Ord
Filter + DVAR < Med DVAR_Ord
14
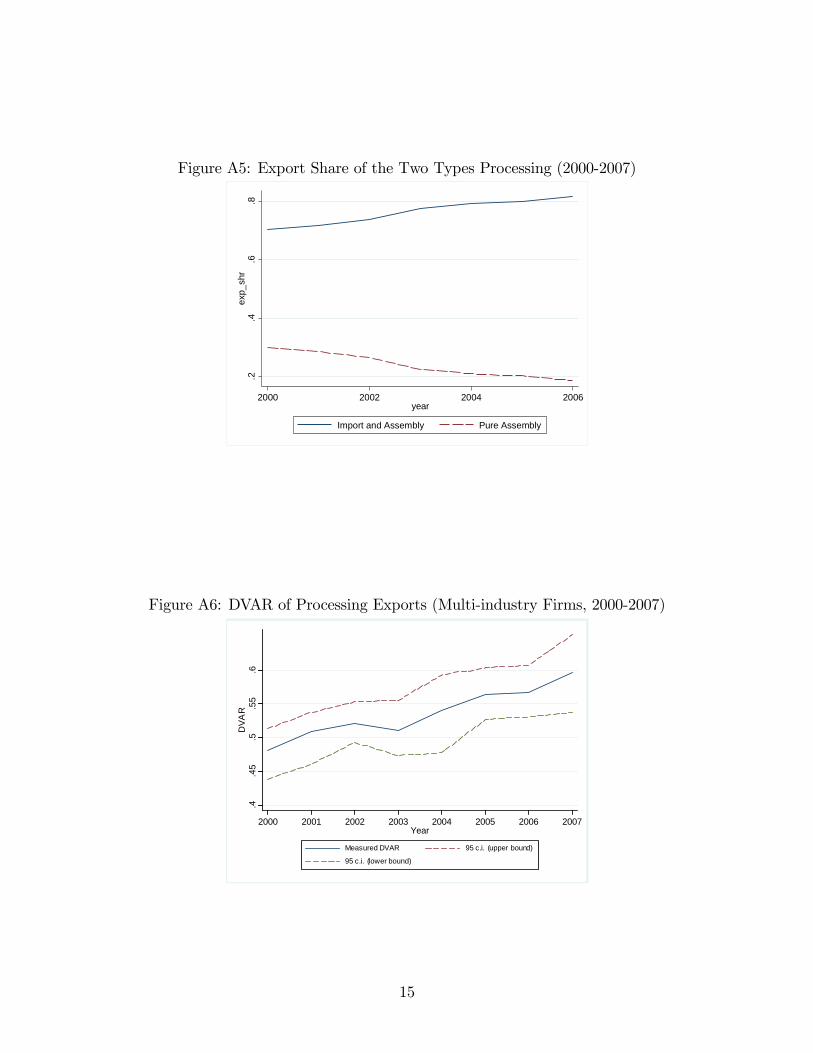
Figure A5: Export Share of the Two Types Processing (2000-2007)
.2.4
.6.8
exp_
shr
2000 2002 2004 2006year
Import and Assembly Pure Assembly
Figure A6: DVAR of Processing Exports (Multi-industry Firms, 2000-2007)
.4.4
5.5
.55
.6D
VAR
2000 2001 2002 2003 2004 2005 2006 2007Year
Measured DVAR 95 c.i. (upper bound)
95 c.i. (lower bound)
15
Figure A7: DVAR of Aggregate Exports (Single-industry Firms, 2000-2007)
.6.6
5.7
.75
DVA
R
2000 2001 2002 2003 2004 2005 2006 2007Year
Measured DVAR (Aggregate Exp) 95 c.i. (upper bound)
95 c.i. (lower bound)
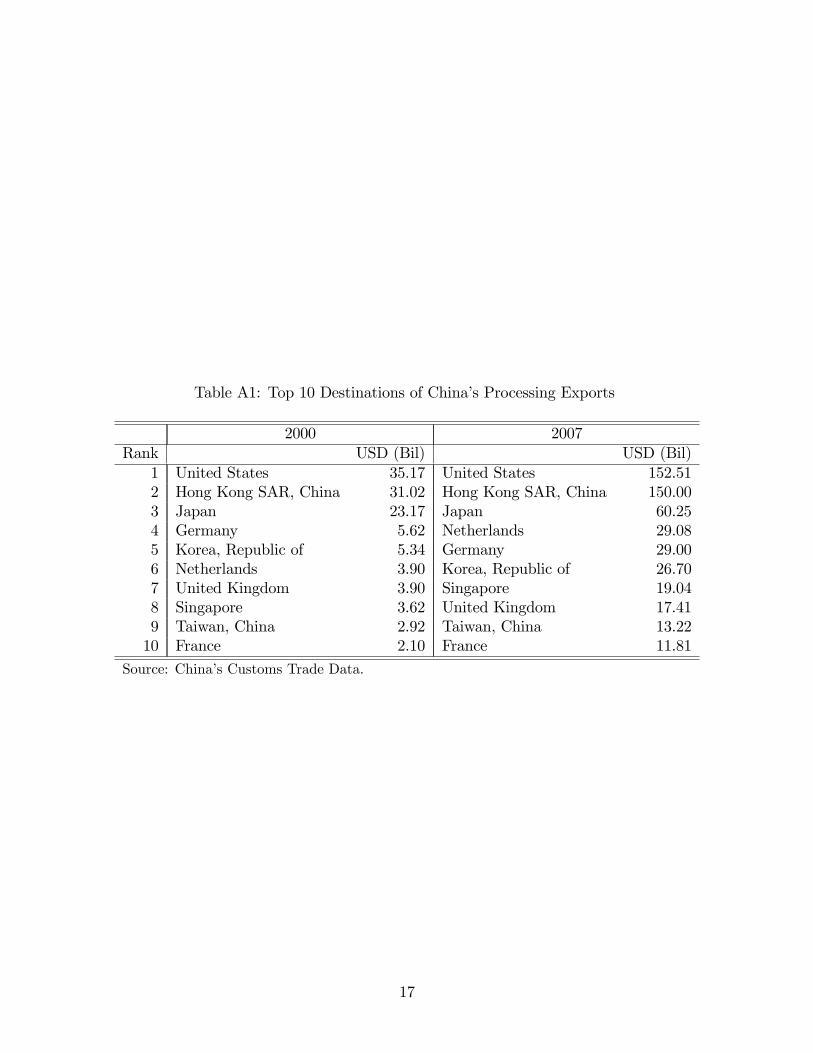
Table A1: Top 10 Destinations of China�s Processing Exports
2000 2007Rank USD (Bil) USD (Bil)
1 United States 35.17 United States 152.512 Hong Kong SAR, China 31.02 Hong Kong SAR, China 150.003 Japan 23.17 Japan 60.254 Germany 5.62 Netherlands 29.085 Korea, Republic of 5.34 Germany 29.006 Netherlands 3.90 Korea, Republic of 26.707 United Kingdom 3.90 Singapore 19.048 Singapore 3.62 United Kingdom 17.419 Taiwan, China 2.92 Taiwan, China 13.2210 France 2.10 France 11.81
Source: China�s Customs Trade Data.
17

TableA2:RepresentationofDi¤erentSubsamplesbyNumbersofExporters
Industry
NumberofFirm-yearObservations
customsmergedw/NBS
%ofcustoms�ltered
%ofcustoms
04:beverages&spirit(16-24)
830
356
42.89
257
30.96
06:chemicalproducts(28-38)
2278
920
40.39
410
18.00
07:plastics&rubber(39-40)
7139
2656
37.20
1190
16.67
08:rawhides&skins(41-43)
3472
1242
35.77
678
19.53
09:wood&articles(44-46)
637
169
26.53
7712.09
10:pulpofwood(47-49)
2570
1204
46.85
337
13.11
11:textiles(50-63)
20054
7619
37.99
4806
23.97
12:footwear&headgear,etc.(64-67)
4776
2158
45.18
1329
27.83
13:stone,plaster,cement,etc.(68-70)
993
401
40.38
226
22.76
14:preciousmetals(71)
1826
446
24.42
219
11.99
15:basemetals(72-83)
4278
1725
40.32
786
18.37
16:machinery,mech,electeqmt(84-85)
22574
9420
41.73
4986
22.09
17:vehicles&aircraft(86-89)
1281
627
48.95
405
31.62
18:optical,photographic,etc.(90-92)
3498
1211
34.62
810
23.16
20:miscmanufacturing(94-96)
5376
1954
36.35
1391
25.87
Total
81582
32108
39.36
17907
21.95
Source:China�sCustomsTradeDataandNationalBureauofStatistics(NBS)ManufacturingSurvey.
Sections1,2,3,5,and19arenon-manufacturingsectorsandareexcludedfrom
theanalysis.
Samplepooledacross2000-2007.
18

TableA3:RepresentationofDi¤erentSubsamplesByExportValues
Industry
Sales(millionusd)
customs(milusd)
merged
%ofcustoms�ltered
%ofcustoms
04:beverages&spirit(16-24)
1447
1042
72.02
822
56.78
06:chemicalproducts(28-38)
4401
2584
58.71
1308
29.72
07:plastics&rubber(39-40)
14156
9535
67.36
6331
44.72
08:rawhides&skins(41-43)
6639
4199
63.25
1843
27.77
09:wood&articles(44-46)
718
434
60.48
217
30.17
10:pulpofwood(47-49)
2760
1923
69.66
1130
40.93
11:textiles(50-63)
42272
29606
70.04
20168
47.71
12:footwear&headgear,etc.(64-67)
18123
13333
73.57
10567
58.31
13:stone,plaster,cement,etc.(68-70)
1575
1133
71.92
706
44.82
14:preciousmetals(71)
13299
9838
73.97
1616
12.15
15:basemetals(72-83)
12562
6439
51.25
4166
33.16
16:machinery,mech,electeqmt(84-85)
223527
151238
67.66
102399
45.81
17:vehicles&aircraft(86-89)
25232
19782
78.40
17525
69.45
18:optical,photographic,etc.(90-92)
10041
8039
80.06
4155
41.38
20:miscmanufacturing(94-96)
13514
9050
66.97
6690
49.50
Total
390268
268173
68.72
179641
46.03
Source:China�sCustomsTradeDataandNationalBureauofStatistics(NBS)ManufacturingSurvey.
Sections1,2,3,5,and19arenon-manufacturingsectorsandareexcludedfrom
theanalysis.
Samplepooledacross2000-2007.
19

Table A4: Median of Materials to Sales Ratio by Industry and Year
Industry Sector Year2000 2001 2002 2003 2004 2005 2006 2007
04:beverages & spirit (16-24) 0.785 0.774 0.779 0.724 0.833 0.784 0.797 0.77406:chemical products (28-38) 0.813 0.824 0.777 0.790 0.814 0.771 0.787 0.77207:plastics & rubber (39-40) 0.806 0.791 0.791 0.799 0.830 0.806 0.798 0.79808:raw hides & skins (41-43) 0.806 0.810 0.788 0.766 0.772 0.792 0.763 0.74109:wood & articles (44-46) 0.801 0.788 0.769 0.741 0.776 0.801 0.796 0.81510:pulp of wood (47-49) 0.800 0.796 0.778 0.785 0.818 0.799 0.769 0.77111:textiles (50-63) 0.791 0.782 0.770 0.771 0.769 0.758 0.753 0.73612:footwear & headgear, etc. (64-67) 0.795 0.778 0.754 0.770 0.763 0.745 0.749 0.72013:stone, plaster, cement, etc. (68-70) 0.795 0.768 0.735 0.777 0.750 0.777 0.739 0.75314:precious metals (71) 0.780 0.754 0.739 0.749 0.744 0.711 0.724 0.76215:base metals (72-83) 0.826 0.817 0.797 0.782 0.812 0.791 0.787 0.81016:machinery, mech, elect & eqmt (84-85) 0.800 0.803 0.773 0.773 0.804 0.796 0.780 0.78017:vehicles & aircraft (86-89) 0.811 0.829 0.800 0.776 0.811 0.787 0.809 0.78818:optical, photographic, etc. (90-92) 0.806 0.785 0.750 0.759 0.773 0.753 0.753 0.72720:misc manufacturing (94-96) 0.796 0.776 0.757 0.764 0.783 0.755 0.758 0.761Source: China�s Customs Trade Data and National Bureau of Statistics Manufacturing Survey.
20

Table A5: Upstream Variety Counts
Industry Sector Year2000 2001 2002 2003 2004 2005 2006 2007
01:live animals (1-5) 287.7 288.2 292.1 289.9 291.2 293.5 291.5 293.402:vegetables (6-14) 333.4 335.0 340.4 339.2 340.9 344.1 342.3 342.803:animal or vegetable oil (15) 294.2 294.5 297.9 295.6 296.4 299.2 297.3 298.004:beverages & spirit (16-24) 307.3 308.4 313.3 311.7 313.2 316.2 314.3 315.305:mineral products (25-27) 253.5 256.0 258.9 261.2 262.6 265.2 266.5 265.406:chemical products (28-38) 304.5 307.4 312.4 313.5 315.5 318.6 319.8 316.907:plastics & rubber (39-40) 263.6 263.6 268.4 268.1 270.9 273.2 273.6 272.108:raw hides & skins (41-43) 308.1 309.1 312.8 310.8 312.1 314.5 314.1 312.209:wood & articles (44-46) 186.2 188.2 192.3 192.0 194.1 195.2 193.6 193.210:pulp of wood (47-49) 202.6 205.3 207.3 209.4 209.6 213.3 210.8 209.811:textiles (50-63) 445.7 447.2 452.0 449.6 452.3 454.4 453.1 451.812:footwear & headgear, etc. (64-67) 374.5 374.6 378.6 376.5 379.5 381.1 380.4 378.613:stone, plaster, cement, etc. (68-70) 282.2 284.2 288.9 289.9 292.3 294.6 295.5 293.614:precious metals (71) 310.3 313.5 319.3 320.1 323.8 326.3 326.9 324.415:base metals (72-83) 348.7 352.7 359.5 361.0 366.4 369.0 370.4 367.416:machinery, mech, elect eqmt (84-85) 447.6 450.9 456.3 457.6 461.6 463.6 464.3 462.917:vehicles & aircraft (86-89) 296.4 297.3 302.6 304.7 308.1 309.4 310.9 311.018:optical, photographic, etc. (90-92) 421.6 424.6 430.7 430.9 435.7 437.6 438.3 435.820:misc manufacturing (94-96) 326.8 328.5 333.5 333.0 336.6 338.4 338.5 336.4Source: China�s Customs Trade Data and National Bureau of Statistics Manufacturing Survey. Each variety
is de�ned as a HS-6 digit product.
21

Table A6: Price Index of Imported Materials/ Price Index of Domestic Materials
Industry Sector Year2000 2001 2002 2003 2004 2005 2006 2007
04:beverages & spirit (16-24) 1 0.980 0.975 1.075 1.067 1.092 1.187 1.22006:chemical products (28-38) 1 0.981 1.028 1.145 1.219 1.385 1.564 1.65707:plastics & rubber (39-40) 1 0.997 1.053 1.139 1.183 1.288 1.418 1.52608:raw hides & skins (41-43) 1 1.000 0.997 1.098 1.125 1.192 1.279 1.35509:wood & articles (44-46) 1 0.960 0.991 1.077 1.112 1.162 1.233 1.26210:pulp of wood (47-49) 1 0.998 1.024 1.116 1.168 1.241 1.332 1.48611:textiles (50-63) 1 0.995 1.004 1.087 1.108 1.153 1.228 1.25312:footwear & headgear, etc. (64-67) 1 0.994 1.019 1.101 1.150 1.234 1.328 1.39613:stone, plaster, cement, etc. (68-70) 1 0.996 1.007 1.095 1.197 1.356 1.510 1.65914:precious metals (71) 1 0.985 0.960 1.048 1.094 1.208 1.316 1.40315:base metals (72-83) 1 0.978 0.991 1.043 1.112 1.256 1.403 1.48816:machinery, mech, elect eqmt (84-85) 1 1.021 1.115 1.237 1.305 1.431 1.572 1.89017:vehicles & aircraft (86-89) 1 1.044 1.053 1.136 1.245 1.390 1.547 1.89018:optical, photographic, etc. (90-92) 1 1.015 1.120 1.299 1.416 1.541 1.672 2.02220:misc manufacturing (94-96) 1 0.992 1.009 1.105 1.175 1.286 1.413 1.563Source: China�s Customs Trade Data and National Bureau of Statistics Manufacturing Survey. Both prices
are normalized to 1 for year 2000.
Table A7: Percentage of Foreign Content in Domestic Materials
Industry Sector Year2000 2001 2002 2003 2004 2005 2006 2007
04:beverages & spirit (16-24) 0.727 0.795 0.960 1.176 1.560 2.032 2.029 2.08406:chemical products (28-38) 0.670 0.744 0.921 1.151 1.595 2.134 2.183 2.31807:plastics & rubber (39-40) 0.386 0.433 0.544 0.691 0.975 1.312 1.374 1.46608:raw hides & skins (41-43) 0.718 0.788 0.972 1.210 1.652 2.169 2.210 2.29109:wood & articles (44-46) 1.110 1.209 1.465 1.826 2.518 3.353 3.352 3.49310:pulp of wood (47-49) 0.892 1.012 1.286 1.680 2.389 3.211 3.374 3.54911:textiles (50-63) 1.058 1.163 1.443 1.800 2.436 3.226 3.288 3.42612:footwear & headgear, etc. (64-67) 0.927 1.027 1.290 1.631 2.263 3.023 3.133 3.29313:stone, plaster, cement, etc. (68-70) 1.204 1.338 1.662 2.094 2.944 3.967 4.103 4.38114:precious metals (71) 0.918 1.024 1.276 1.607 2.249 3.053 3.188 3.45015:base metals (72-83) 1.146 1.282 1.602 2.026 2.857 3.907 4.122 4.51116:machinery, mech, elect eqmt (84-85) 1.089 1.230 1.544 1.974 2.737 3.689 3.939 4.37517:vehicles & aircraft (86-89) 1.414 1.586 1.981 2.528 3.564 4.855 5.134 5.65718:optical, photographic, etc. (90-92) 0.730 0.820 1.028 1.311 1.829 2.466 2.617 2.87720:misc manufacturing (94-96) 1.015 1.129 1.412 1.787 2.502 3.366 3.513 3.759
Source: From Koopman, Wang, and Wei (2012) and authors�imputation based on thegrowth rate of the number of ordinary importers
22

Table A8: 25th-percentile of Ordinary Exporters�DVAR by Industry and Year
Industry Sector Year2000 2001 2002 2003 2004 2005 2006 2007
04:beverages & spirit (16-24) 0.909 0.928 0.897 0.884 0.876 0.922 0.911 0.93106:chemical products (28-38) 0.880 0.906 0.895 0.942 0.880 0.914 0.904 0.91507:plastics & rubber (39-40) 0.811 0.862 0.853 0.838 0.795 0.845 0.849 0.84808:raw hides & skins (41-43) 0.792 0.846 0.876 0.894 0.870 0.792 0.803 0.77709:wood & articles (44-46) 0.820 0.848 0.855 0.878 0.859 0.898 0.870 0.90110:pulp of wood (47-49) 0.804 0.850 0.826 0.873 0.775 0.946 0.893 0.89511:textiles (50-63) 0.802 0.852 0.855 0.873 0.858 0.890 0.893 0.89112:footwear & headgear, etc. (64-67) 0.756 0.789 0.792 0.855 0.804 0.870 0.823 0.88813:stone, plaster, cement, etc. (68-70) 0.942 0.889 0.912 0.907 0.861 0.876 0.877 0.89214:precious metals (71) 1.000 1.000 1.000 1.000 1.000 1.000 1.000 1.00015:base metals (72-83) 0.851 0.861 0.896 0.916 0.876 0.917 0.926 0.95316:machinery, mech, elect eqmt (84-85) 0.830 0.833 0.841 0.893 0.836 0.900 0.910 0.91517:vehicles & aircraft (86-89) 0.944 0.971 0.978 0.967 0.943 0.980 0.982 0.98918:optical, photographic, etc. (90-92) 0.808 0.867 0.843 0.882 0.897 0.901 0.915 0.91520:misc manufacturing (94-96) 0.730 0.804 0.892 0.901 0.899 0.912 0.932 0.923Source: China�s Customs Trade Data and National Bureau of Statistics Manufacturing Survey.
Table A9: DVAR by Industry and Year
Industry Sector Year2000 2001 2002 2003 2004 2005 2006 2007
04:beverages & spirit (16-24) 0.650 0.685 0.699 0.694 0.725 0.680 0.732 0.75006:chemical products (28-38) 0.386 0.463 0.500 0.481 0.384 0.452 0.564 0.44307:plastics & rubber (39-40) 0.418 0.458 0.364 0.403 0.357 0.507 0.417 0.44308:raw hides & skins (41-43) 0.426 0.343 0.410 0.418 0.504 0.525 0.531 0.57309:wood & articles (44-46) 0.438 0.604 0.445 0.289 0.552 0.594 0.347 0.39010:pulp of wood (47-49) 0.304 0.401 0.395 0.393 0.452 0.547 0.562 0.51511:textiles (50-63) 0.495 0.464 0.525 0.546 0.558 0.599 0.620 0.56112:footwear & headgear, etc. (64-67) 0.590 0.571 0.613 0.663 0.628 0.657 0.686 0.69313:stone, plaster, cement, etc. (68-70) 0.550 0.517 0.538 0.617 0.587 0.504 0.530 0.55414:precious metals (71) 0.248 0.262 0.094 0.306 0.531 0.291 0.504 0.52815:base metals (72-83) 0.525 0.468 0.545 0.477 0.556 0.356 0.426 0.49116:machinery, mech, elect eqmt (84-85) 0.402 0.428 0.467 0.436 0.489 0.540 0.479 0.52917:vehicles & aircraft (86-89) 0.501 0.657 0.507 0.628 0.554 0.617 0.721 0.76718:optical, photographic, etc. (90-92) 0.469 0.530 0.509 0.529 0.463 0.574 0.641 0.55820:misc manufacturing (94-96) 0.617 0.572 0.599 0.606 0.620 0.584 0.663 0.650
Source: China�s Customs Trade Data and National Bureau of Statistics Manufacturing SurveyDVAR is computed using single-industry �rm sample and Filter 2 stated in Table 3.
23

TableA10:CharacteristicsofExitingExporters
(1)
(2)
(3)
(4)
(5)
(6)
(7)
(8)
DepVar
Exitt
statet�1DVARt�1ln(sales t�1)ln(exp t�1)
statet�1
0.0680*
0.0606*
0.0686*
0.0617
(0.039)
(0.035)
(0.039)
(0.038)
DVARt�1
0.101***
0.108***
(0.015)
(0.014)
ln(sales t�1)
-0.0035*
-0.0039
(0.002)
(0.003)
ln(exp t�1)
-0.0088***
-0.0073***
(0.002)
(0.002)
Exitt
0.0035**
0.0374***
-0.0461*
-0.151***
(0.002)
(0.005)
(0.026)
(0.028)
Controls
Industry-YearFixedE¤ects
N15271
15274
15271
15274
15274
15304
15299
15304
R2
.0737
.075
.0702
.0711
.0148
.0828
.0944
.0753
Note:Industry-year�xede¤ectsarealwaysincluded.Dataset:mergedNBSandcustomsdata.Columns(1)-(4)examinetherelationbetweenthe
(lagged)�rmcharacteristicsandtheprobabilityofexits.Columns(5)and(8)examinethecharacteristicsofexiting�rms.Bootstrappedstandard
errorsareinparentheses.*p<0.10;**p<0.05;***p<0.01.
24

Table A11: Import and Assembly versus Pure Assembly
(1) (2) (3) (4) (5) (6) (7) (8)Dep. Var. DVAR Imp/Material ln(Exp Variety) ln(Imp variety)Sample: IA PA IA PA IA PA IA PAYear Dummies:2001 0.0298*** 0.0237 -0.0232*** 0.00386 -0.123*** -0.0524 -0.0366* -0.0264
(0.007) (0.032) (0.007) (0.033) (0.019) (0.101) (0.022) (0.088)2002 0.0494*** 0.0422 -0.0295*** 0.0359 -0.114*** -0.0604 0.0601** 0.0335
(0.008) (0.034) (0.007) (0.035) (0.020) (0.106) (0.024) (0.093)2003 0.0682*** 0.0618* -0.0700*** 0.00539 -0.224*** -0.0959 0.101*** 0.119
(0.007) (0.034) (0.007) (0.038) (0.021) (0.107) (0.023) (0.093)2004 0.0706*** 0.0486 -0.0917*** 0.0271 -0.286*** -0.133 0.118*** 0.217**
(0.008) (0.032) (0.008) (0.044) (0.022) (0.106) (0.024) (0.096)2005 0.0980*** 0.100*** -0.118*** -0.0290 -0.349*** -0.221** 0.203*** 0.228**
(0.008) (0.034) (0.009) (0.047) (0.024) (0.107) (0.025) (0.105)2006 0.140*** 0.132*** -0.161*** -0.0467 -0.202*** -0.136 0.283*** 0.285***
(0.008) (0.038) (0.010) (0.045) (0.025) (0.106) (0.029) (0.102)�wLPY
�it
-0.0044 0.0009 0.0270 0.251* -0.0343 -0.231 -0.0417 0.0059(0.016) (0.065) (0.052) (0.136) (0.055) (0.226) (0.037) (0.241)�
PDMD+P IMI
PY
�it
-0.0247*** 0.0073 0.0143 -0.0867 0.0097 -0.123
(0.009) (0.058) (0.025) (0.164) (0.026) (0.224)ln(K=L)it -0.0037 -0.0071
(0.005) (0.011)
N 13062 1744 13040 1733 13062 1744 13062 1744R2 .0686 .0459 .0867 .0579 .0647 .0208 .0419 .0372
Note: Firm and year �xed e¤ects are always included. Data set: merged NBS-customs data. IA and PA
stand for import and assembly and pure assembly, respectively. Columns (1) and (2) use �rm DVAR as the
dependent variable; columns (3) and (4) use �rm imports-to-materials ratio as the dependent variable;
columns (5) and (6) use log of the �rm�s export varieity as the dependent variable; columns (7) and (8) use
log of the �rm�s export varieity as the dependent variable. Bootstrapped standard errors are in
parentheses. * p<0.10; ** p<0.05; *** p<0.01.
25

Table A12: Products that used to be imported by processing exporters but not exportedby ordinary exporters in 2000
Rank HS6 (96) Description Imp00 Exp07 % Exp07 by FIE
1 740200 Unre�ned copper; copper anodes 94775.05 1.785 1.52 530121 Broken and scutched 69219.71 73.338 0.03 740311 Re�ned copper - Cathododes 52945.12 115.669 0.04 510130 Carbonised 47167.51 4099.934 19.25 291733 Aromatic polycarboxylic acids 22195.56 71.764 63.56 740321 Copper alloys - Copper-zinc base alloys 13405.72 21.957 5.07 710610 Powder 10303.45 6269.82 47.38 291412 Acyclic ketones without oxygen function 9354.077 20100.525 13.89 740329 Other copper alloys 8589.997 250.009 1.210 410122 Other hides and skins of bovine animals 7923.013 409.437 91.711 30375 Other �sh, excluding livers and roes 7108.482 403.583 18.112 470720 Other paper or paperboard 5220.848 57.024 0.013 750712 Tubes and pipes - of nickel 4757.735 1073.887 1.514 750511 Bars, rods and pro�les, of nickel 4255.77 87.14 0.015 721113 Not further worked than hot-rolled 3560.055 1737.362 0.016 400260 Isoprene rubber (IR) 3206.528 2492.855 0.617 870423 Other, with compression-ignition 2527.633 796856.69 8.418 481031 Kraft paper and paperboar 2410.466 2424.858 2.119 370120 Instant print �lm 2332.919 351.927 0.020 370256 Other �lm, for colour photography 2135.713 55.455 0.021 722530 Other, not further worked 2130.281 69535.009 10.322 40110 Of a fat content 2022.768 0.023 100.023 40410 Whey and modi�ed whey 1992.98 0.71 0.024 721020 Plated or coated with lead 1506.084 2511.163 0.925 540342 Other yarn, multiple or cabled 1413.818 80.048 7.326 530129 Flax, broken, scutched, hackled - other 1163.462 135.442 49.727 370510 For o¤set reproduction 1067.683 91.158 10.428 740312 Re�ned copper - Wire-bars 1028.783 0.455 100.029 370231 Other �lm, without perforations 888.111 38.389 0.030 480240 Wallpaper base 772.938 6382.673 28.031 80221 Hazelnuts or �lberts 617.869 5.9 0.032 50710 Ivory; ivory powder and waste 540.557 20.158 0.033 151329 Palm kernel or babassu oil 445.65 24.453 99.434 80211 Almonds - In shell 376.58 3.5 0.035 890392 Motorboats, other than outboard 360 607.729 0.036 841013 Hydraulic turbines and water wheels 300 2133.552 0.0
t o be continued to the next page
26

Rank HS6 (96) Description Imp00 Exp07 % Exp07 by FIE
37 293211 Compounds containing unfused furan ring 298.517 3480.953 62.838 30541 Smoked �sh, including �lletsi 268.626 51.527 15.239 290121 Unsaturated - Ethylene 228.697 53980.444 62.440 720450 Remelting scrap ingots 213.786 0.15 0.041 320120 Wattle extract 186.009 4.052 61.142 330112 Essential oils of citrus fruit 182.584 216.775 14.543 180320 Wholly or partly defatted 132.859 3.155 100.044 220860 Vodka 70.474 110.711 83.545 382313 Industrial monocarboxylic fatty acids 60.583 58.399 0.046 151229 Cotton-seed oil and its fractions 51.215 1788.796 55.847 520625 Single yarn, of combed �bres 50.501 721.513 1.048 470319 Unbleached - Non-coniferous 40.203 97.423 0.049 271129 In gaseous state - Other 39.653 14.256 18.450 722720 Of silico-manganese steel 37.912 48480.139 17.551 180310 Not defatted 37.019 1449.275 51.352 550520 Of arti�cial �bres 33.626 195.591 7.053 150300 Lard stearin, lard oil, oleostearin 32.134 1.57 100.054 20319 Fresh or chilled - Other 28.441 25052.286 0.055 292213 Amino-alcohols, their ethers and esters 25.68 58.781 0.056 711510 Catalysts in the form of wire cloth 18.672 0.432 0.057 151000 Other oils and their fractions 14.377 0.035 0.058 151521 Maize (corn) oil and its fractions 11.338 20758.875 22.859 151110 Crude oil 9.91 0.137 0.060 262011 Containing mainly zinc 7.8 226.859 0.061 180400 Cocoa butter, fat and oil 6.861 27570.497 45.362 270730 Xylole 6.047 41.119 0.063 630631 Sails - Of synthetic �bres 5 1073.53 0.064 722592 Otherwise plated or coated w/ zinc 1.681 1002.997 0.065 252230 Hydraulic lime 1.344 11.135 0.066 310229 Ammonium sulphate; double salts 0.992 155.239 0.067 854340 Electric fence energisers 0.54 441628.86 25.1Total 392,126 1,546,760 16.63
Imp00 is the value of imports by processing exporters in 2000, in thousands USD.Exp07 is the value of exports by non-processing exporters in 2007, in thousands USD.
27