Online Accounting Tutorial
140
Online Accounting Tutorial Contents 1. Accounting – an introduction 2. Basic financial statements 3. Capturing economic events 4. Accruals and deferrals 5. Reporting financial results 6. Merchandising activities 7. Financial assets 8. Inventories and cost of goods sold 9. Plant assets and depreciation 10. Liabilities 11. Stockholders’ equity 12. Income and changes in retained earnings 13. Statement of cash flows 14. Financial statement analysis 16. Management accounting 17. Job order costing 18. Process costing 20. Cost volume profit analysis 21. Incremental analysis 23. Operational budgeting 24. Standard cost systems © 1999-2006 Copyright Malcolm E. White, Fulton, Missouri, USA For personal educational use only. All rights reserved. No part of this tutorial may be reproduced or stored in any way without permission.
description
Online Accounting Tutorial
Transcript of Online Accounting Tutorial
Online Accounting Tutorial
Contents
1. Accounting – an introduction 2. Basic financial statements 3. Capturing economic events 4. Accruals and deferrals 5. Reporting financial results 6. Merchandising activities 7. Financial assets 8. Inventories and cost of goods sold 9. Plant assets and depreciation 10. Liabilities 11. Stockholders’ equity 12. Income and changes in retained earnings 13. Statement of cash flows 14. Financial statement analysis 16. Management accounting 17. Job order costing 18. Process costing 20. Cost volume profit analysis 21. Incremental analysis 23. Operational budgeting 24. Standard cost systems
© 1999-2006 Copyright Malcolm E. White, Fulton, Missouri, USA For personal educational use only. All rights reserved. No part of this tutorial may be reproduced or stored in any way without permission.
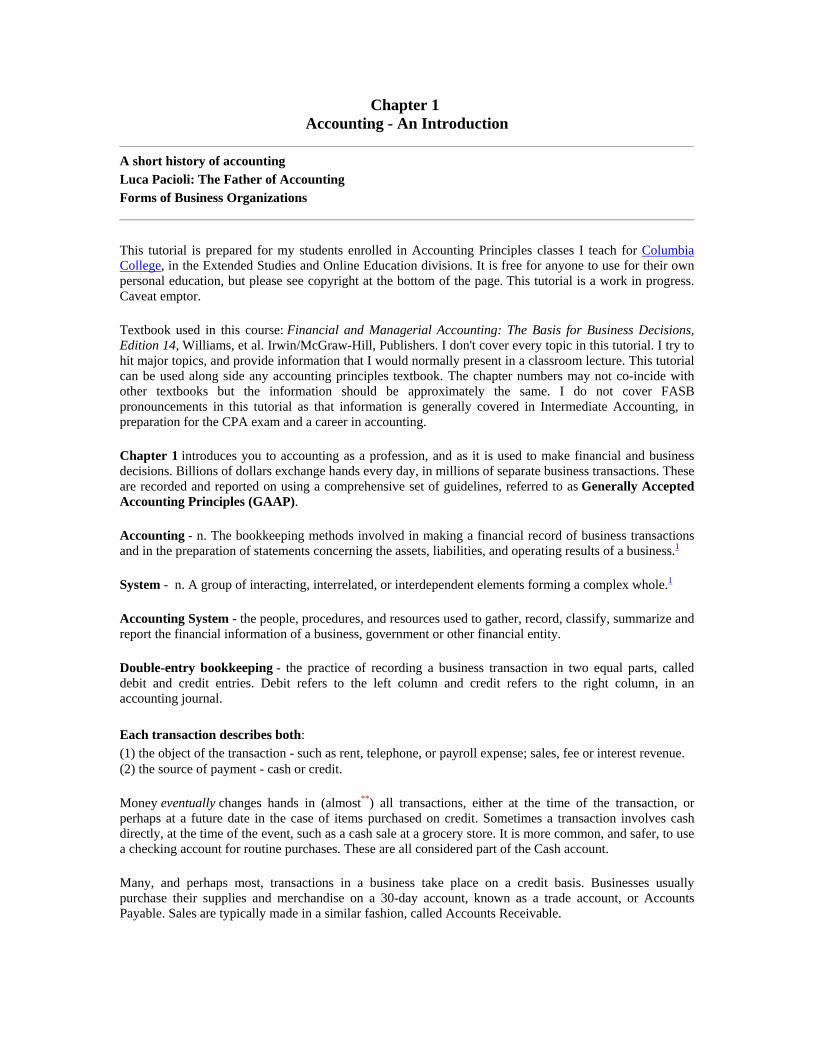
Chapter 1 Accounting - An Introduction
A short history of accounting Luca Pacioli: The Father of Accounting Forms of Business Organizations
This tutorial is prepared for my students enrolled in Accounting Principles classes I teach for Columbia College, in the Extended Studies and Online Education divisions. It is free for anyone to use for their own personal education, but please see copyright at the bottom of the page. This tutorial is a work in progress. Caveat emptor.
Textbook used in this course: Financial and Managerial Accounting: The Basis for Business Decisions, Edition 14, Williams, et al. Irwin/McGraw-Hill, Publishers. I don't cover every topic in this tutorial. I try to hit major topics, and provide information that I would normally present in a classroom lecture. This tutorial can be used along side any accounting principles textbook. The chapter numbers may not co-incide with other textbooks but the information should be approximately the same. I do not cover FASB pronouncements in this tutorial as that information is generally covered in Intermediate Accounting, in preparation for the CPA exam and a career in accounting.
Chapter 1 introduces you to accounting as a profession, and as it is used to make financial and business decisions. Billions of dollars exchange hands every day, in millions of separate business transactions. These are recorded and reported on using a comprehensive set of guidelines, referred to as Generally Accepted Accounting Principles (GAAP).
Accounting - n. The bookkeeping methods involved in making a financial record of business transactions and in the preparation of statements concerning the assets, liabilities, and operating results of a business.1
System - n. A group of interacting, interrelated, or interdependent elements forming a complex whole.1
Accounting System - the people, procedures, and resources used to gather, record, classify, summarize and report the financial information of a business, government or other financial entity.
Double-entry bookkeeping - the practice of recording a business transaction in two equal parts, called debit and credit entries. Debit refers to the left column and credit refers to the right column, in an accounting journal.
Each transaction describes both: (1) the object of the transaction - such as rent, telephone, or payroll expense; sales, fee or interest revenue. (2) the source of payment - cash or credit.
Money eventually changes hands in (almost**) all transactions, either at the time of the transaction, or perhaps at a future date in the case of items purchased on credit. Sometimes a transaction involves cash directly, at the time of the event, such as a cash sale at a grocery store. It is more common, and safer, to use a checking account for routine purchases. These are all considered part of the Cash account.
Many, and perhaps most, transactions in a business take place on a credit basis. Businesses usually purchase their supplies and merchandise on a 30-day account, known as a trade account, or Accounts Payable. Sales are typically made in a similar fashion, called Accounts Receivable.

**Adjusting and closing entries are not typical, and represent special entries made by accountants to prepare financial statements, and reset certain accounts at the end of a fiscal year.
An Accounting history page at TAMU
Marble tablet: Account
of Disbursements of the Athenian State
c. 418-415 BC
A short history of accounting Accounting was born before writing or numbers existed, some 10,000 years ago, in the area known as Mesopotamia, later Persia, and today the countries of Iran and Iraq. This area contains the Tigris Euphrates river valley, a large fertile area 10,000 years ago with a large thriving population and active trading between towns and cities up and down the two rivers.
Writing and numbers would be not be invented for about another 5,000 years. And what happens next will directly lead to the invention of both writing and number systems.
At that time, merchants faced many of the same problems businesses face today. They had to ship their merchandise up and down the rivers, and that meant trusting a boatman with their goods. Unfortunately, not all boatmen were honest, and disagreements often arose about how much was shipped versus what was received at the other end.
It is hard for us today to imagine a world without writing and numbers. Try to imagine yourself in their position.... what would you do?
To deal with the problem, merchants came up with an ingenious plan. They made small clay tokens, in various shapes and with various markings, to indicate different products. One would mean a basket of grain, another would mean a pot of oil, etc. They had over 200 such tokens to indicate a large variety of common goods, including food, leather, clothing, utensils, tools, jewelry, etc.
Bollae and tokens circa 3300 BC
Before shipping their goods, a merchant would take one token for each item in the shipment, and encase the tokens in a ball of clay, called a "bollae" (pronounced "bowl-eye") - meaning ball. The ball would be dried in the sun, given to the boatman, and then broken by the buyer on the other end of the transaction. The buyer would match the tokens with the items in the shipment, to verify that everything sent was accounted for.
This is the function of protection of assets, and is a major function of all modern accounting systems. It was important 10,000 years ago and is just as important now. Today we see merchants doing the same thing as their counterparts 10 millennia ago - today they get a bill of lading - a listing of the merchandise entrusted to a shipper.
The system of using bollae continued for almost 5,000 years, all before the invention of writing or numbers. One day, probably by accident, a wet clay bollae was rolled over a loose token, laying on the

ground. The impression of the token was left in the wet clay. Merchants began pressing the tokens on the outside of the bollae, in addition to putting the tokens inside the ball.
Eventually they would press tokens into a flat piece of clay, leaving an impression for each item. Remember, they didn't have numbers yet, so they would press a token into the clay for each individual item. Probably by accident one day the right token couldn't be found, and someone used a stick or other object to make the right marks in the soft clay tablet. And writing was born...
New symbols were soon created representing multiple items, and suddenly both writing and number systems were invented. The last phase of this remarkable process took about 500 years, but once writing was invented, it caught on like wildfire, and was the most popular thing anyone had ever seen.
People were so much in love with writing they did it every chance they could. We have a huge amount of archaeological evidence to support this notion. Thousands of small clay tablets still survive today.
A common example: a worker sent his boss a note saying he would be late for work that day because he had chores to do. He would hire a scribe to write the tablet (only a few people could read or write), and hire a child to carry the note to his boss. They sent notes like we use the phone today, and they loved it. They wrote for the sheer joy of it - the ability to communicate at a distance.
Written accounting records are some of the oldest writings that have survived until today, and they date back to circa 3300-3200 BC. These early records were simple single-entry listings of wages paid, temple assets, taxes and tributes to the king or Pharaoh. This simple system was used until the mid-1400s, and a period known as the Renaissance.
Picture in the Tomb of Chnemhotep, pharaoh of Egypt circa 1950 BC. The ancient Egyptian scribe (seated on the left) prepared his accounts on papyrus with a calamus. The accompanying text reads "Minute care is not only taken in the case of large amounts, but even the smallest quantities of corn or dates are conscientiously entered." In ancient Egypt, the accountants were literally bean-counters. They also counted rice, beer, and everything else. Ancient Egyptians were paid in "kind" - they had not invented money yet so workers were paid with food, beer, clothing, etc. (Everyone drank beer back then, because it was more sanitary than the water. The alcohol content was very low, because they used a short brewing process. )
It is interesting to note that the Mediterranean and European nations had no concept of the number zero until the middle ages. They learned the concept of zero from Middle Eastern mathematicians, who also knew about the movements of the stars and planets, and had figured out the earth was round, and revolved around the sun in an orbit, etc. It took the Europeans another 500 years to figure that out, largely because those concepts were contrary to views held by the Roman Catholic church at the time. It's also hard to do math using Roman numerals, so their math skills were limited until they started using Arabic numbers.
c. 8500 BC c. 3500 BC c. 3000 BC c. Late 1400s merchants begin to use bollae and tokens to protect shipments
scribing marks onto wet clay replaces use of bollae & tokens
writing & number systems fully developed & in use
Luca Pacioli documents double entry accounting

Luca Pacioli links long bio short bio polyhedra
By the time Christopher Columbus was trying to sail west, a new form of accounting was in use by merchants in Venice . Luca Pacioli (pot-chee-O-lee) set down in writing for the first time a description of the double-entry system of accounting, which we still use today in much the same form. Although he didn't actually invent the system he is called "the father of accounting" for his contributions and for documenting the system in his fifth book on mathematics Summa de Arithmetica, Geometria, Proportioni et Proportionalita (Everything About Arithmetic, Geometry and Proportion).
More on Pacioli and accounting history Nice page on Luca Pacioli by TAMU
Written as a digest and guide to existing mathematical knowledge, bookkeeping was only one of five topics covered. The Summa's 36 short chapters on bookkeeping, entitled De Computis et Scripturis (Of Reckonings and Writings) were added "in order that the subjects of the most gracious Duke of Urbino may have complete instructions in the conduct of business," and to "give the trader without delay information as to his assets and liabilities" (All quotes from the translation by J.B. Geijsbeek, Ancient Double Entry Bookkeeping: Lucas Pacioli's Treatise, 1914)..
Luca Pacioli was a remarkable man. He was one of the best mathematicians of his time, and was a close friend of Leonardo DaVinci. They collaborated on many projects. Pacioli helped DaVinci lay out his painting, The Last Supper, with mathematical precision. And Leonardo illustrated Luca's books on mathematics and accounting. History is full of instances of collaboration between these two great thinkers and Renaissance men.
Modern accounting follows the same principles set down by Luca Pacioli over 500 years ago. However, today it is a highly organized profession, with a complex set of
rules for the fair disclosure and presentation of information in financial statements. Every day trillions of dollars in transactions are recorded by business, government and financial institutions world-wide. They all follow the same general set of rules.
In the United States, we follow Generally Accepted Accounting Principles (GAAP) as specified by the Financial Accounting Standards Board (FASB). We use the US Dollar for all financial statements and transactions. Other countries use similar accounting rules as the US, but there are differences from country to country. If you had a business in France, you would use the French equivalent to our GAAP.
GAAP developed over 500 years from the basic concepts Luca Pacioli set forth in the 1400s. There is a great deal of similarity in accounting practices around the world because they all have a common origin.
What accountants do.... Many people incorrectly believe that accountants' work primarily consists of bookkeeping. Most professional accountants do little or no bookkeeping. Accountants are involved in the preparation of financial statements, and the interpretation of financial information, rather than day-to-day recording of routine transactions. This work includes making sure the financial statements comply with GAAP, provide adequate disclosure of essential financial information, and are free from material errors and misstatements.

Forms of Business Organizations Sole Proprietor - One owner Partnership - 2 or more owners LLC - 1 or more owners (as allowed by state law) Corporation - unlimited number of owners (stockholders)
Legal and Business Info nolo.com
The business entity is the legal form the owners have chosen, depending on their particular needs. The legal form will determine how the company will file tax returns and the owner's individual exposure to legal liability for lawsuits brought against the company.
Corporations and LLCs both provide a layer of legal protection for the owners. Sole Proprietors and General Partners are exposed to unlimited legal liability. This is why most business are organized as corporations. The LLC form has been available in the US for about a decade, but has become a very popular business form. The number of LLCs is growing rapidly, but the predominant business form is still the corporation.
The Balance Sheet presentation and accounts used will vary depending on the way the company is organized. Sole Proprietorships use the Owner's Equity account. Corporations have accounts for stock and retained earnings. Partnerships have accounts for Partner's Capital, contributions and distributions. LLCs may be organized like a corporation or partnership, and will use the appropriate set of accounts depending on how the company is set up.
Quick Quiz State the four most common forms of business enterprises and briefly describe them.
1The American Heritage® Dictionary of the English Language, Fourth Edition, Copyright © 2000 by Houghton Mifflin Company.
© 1999-2006 Copyright Malcolm E. White, Fulton, Missouri, USA For personal educational use only. All rights reserved. No part of this tutorial may be reproduced or stored in any way without permission.

Chapter 2 Basic Financial Statements
The accounting process Financial Statements The Accounting Equation Chart of Accounts
Chapter 2 introduces you to the basic financial statements used to communicate a company's financial information to outsiders - parties other than the company's directors and managers, who are the "insiders."
What is a financial statement? What does it tell us? Why should we care? T hese are good questions and they deserve an answer.
A business is a financial entity separate from its owners. Each business must keep financial records. A number of federal and state laws require this. But even if there were no laws, it would still be a good idea anyway. Businesses provide vital goods and services to those living in the community. They provide jobs for people, and tax dollars that improve our roads, parks and schools. It is in everyone's best interest that our community's businesses be successful.
B usiness owners take a risk. What if no one wants to buy their goods or services? The owner has spent time and money to start a business, purchased land, buildings and equipment, hired people to work in the business.... all this done with the hope that the business will be successful. And if the business is NOT a success, the owner may have lost his or her life's savings, workers must find jobs, and creditors may go unpaid.
F inancial information may not make a business successful, but it helps the owner make sound business decisions. It can also help a bank or creditor evaluate the company for a loan or charge account. And the IRS will be interested in collecting the appropriate amount of income tax. So financial information will serve many purposes.
F inancial information comes in many forms, but the most important are the Financial Statements. They summarize relevant financial information in a format that is useful in making important business decisions. If this were not possible, the whole process would be a waste of time. Too much information may be equally useless. Financial statements summarize a large number of Transactions into a small number of significant categories. To be useful, information must be organized.
Quick Quiz The financial statements of a business entity: A) Include the balance sheet, income statement, and income tax return. B) Provide information about the profitability and financial position of the company. C) Are the first step in the accounting process.

D) Are prepared for a fee by the Financial Accounting Standards Board. Click for answers
Financial statements have generally agreed-upon formats and follow the same rules of disclosure. This puts everyone on the same level playing field, and makes it possible to compare different companies with each other, or to evaluate different year's performance within the same company. There are three main financial statements:
1. Income Statement 2. Balance Sheet 3. Statement of Cash Flows
Each financial statement tells it's own story. Together they form a comprehensive financial picture of the company, the results of its operations, its financial condition, and the sources and uses of its money. Evaluating past performance helps managers identify successful strategies, eliminate wasteful spending and budget appropriately for the future. Armed with this information they will be able to make necessary business decisions in a timely manner.
The accounting process in a nutshell: 1) Capture and Record a business transaction, 2) Classify the transaction into appropriate Accounts, 3) Post transactions to their individual Ledger Accounts, 4) Summarize and Report the balances of Ledger Accounts in financial statements.
There are 5 types of Accounts. 1) Assets 2) Liabilities 3) Owners' Equity (Stockholders' Equity for a corporation) 4) Revenues 5) Expenses
All the accounts in an accounting system are listed in a Chart of Accounts. They are listed in the order shown above. This helps us prepare financial statements, by conveniently organizing accounts in the same order they will be used in the financial statements.
Financial Statements The Balance Sheet lists the balances in all Asset, Liability and Owners' Equity accounts.
The Income Statement lists the balances in all Revenue and Expense accounts.
The Balance Sheet and Income Statement must accompany each other in order to comply with GAAP. Financial statements presented separately do not comply with GAAP. This is necessary so financial statement users get a true and complete financial picture of the company.
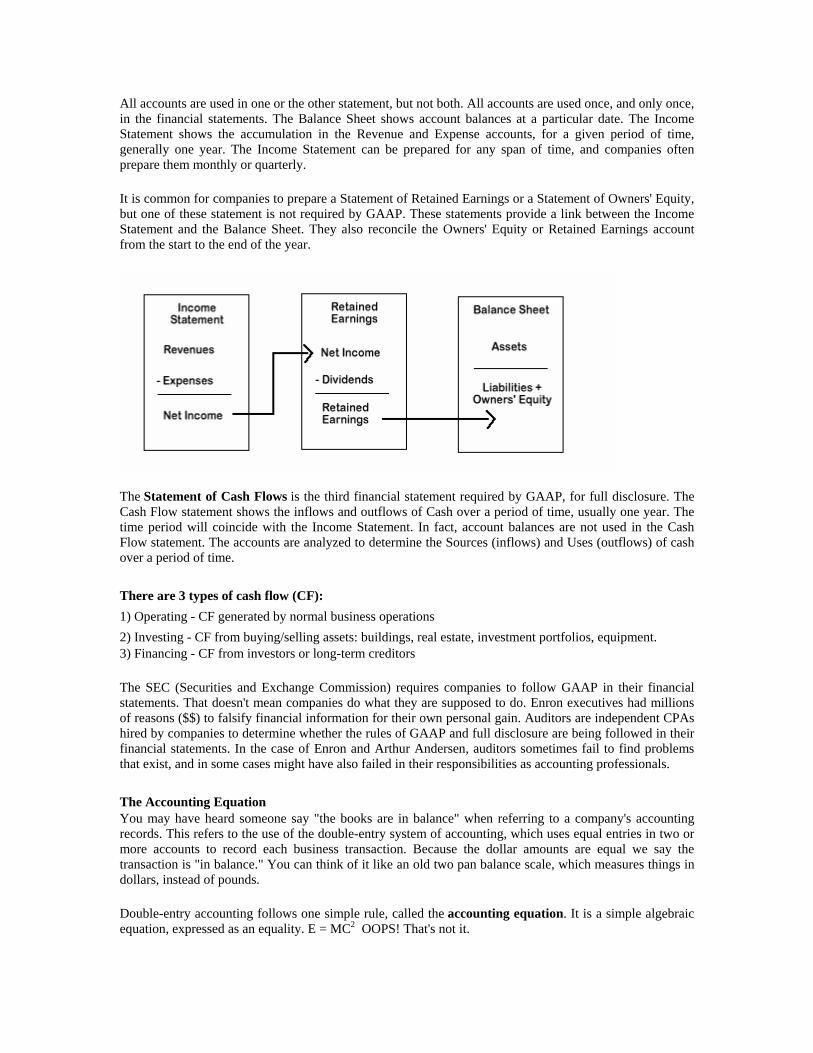
All accounts are used in one or the other statement, but not both. All accounts are used once, and only once, in the financial statements. The Balance Sheet shows account balances at a particular date. The Income Statement shows the accumulation in the Revenue and Expense accounts, for a given period of time, generally one year. The Income Statement can be prepared for any span of time, and companies often prepare them monthly or quarterly.
It is common for companies to prepare a Statement of Retained Earnings or a Statement of Owners' Equity, but one of these statement is not required by GAAP. These statements provide a link between the Income Statement and the Balance Sheet. They also reconcile the Owners' Equity or Retained Earnings account from the start to the end of the year.
The Statement of Cash Flows is the third financial statement required by GAAP, for full disclosure. The Cash Flow statement shows the inflows and outflows of Cash over a period of time, usually one year. The time period will coincide with the Income Statement. In fact, account balances are not used in the Cash Flow statement. The accounts are analyzed to determine the Sources (inflows) and Uses (outflows) of cash over a period of time.
There are 3 types of cash flow (CF): 1) Operating - CF generated by normal business operations 2) Investing - CF from buying/selling assets: buildings, real estate, investment portfolios, equipment. 3) Financing - CF from investors or long-term creditors
The SEC (Securities and Exchange Commission) requires companies to follow GAAP in their financial statements. That doesn't mean companies do what they are supposed to do. Enron executives had millions of reasons ($$) to falsify financial information for their own personal gain. Auditors are independent CPAs hired by companies to determine whether the rules of GAAP and full disclosure are being followed in their financial statements. In the case of Enron and Arthur Andersen, auditors sometimes fail to find problems that exist, and in some cases might have also failed in their responsibilities as accounting professionals.
The Accounting Equation You may have heard someone say "the books are in balance" when referring to a company's accounting records. This refers to the use of the double-entry system of accounting, which uses equal entries in two or more accounts to record each business transaction. Because the dollar amounts are equal we say the transaction is "in balance." You can think of it like an old two pan balance scale, which measures things in dollars, instead of pounds.
Double-entry accounting follows one simple rule, called the accounting equation. It is a simple algebraic equation, expressed as an equality. E = MC2 OOPS! That's not it.

The Accounting Equation really is:
Assets = Liabilities +
Owners' Equity
another way to think about it everything we own = who provided the financing
Remember in Chapter 1, I told you that each transaction describes both an object and form offinancing. In the accounting equation, Assets are the objects, and are on the Left side of the equation. Financing activities are on the Right side of the equation. Liabilities represent borrowings and credit arrangements. Owners' Equity represents investments by owners, residual net worth and retained earnings from ongoing business operations.
The accounting equation uses "simple math" and involves only addition and subtraction. In fact, almost all the math you will do in this course is simple math. We will occasionally use multiplication and division, but all changes to accounts will be addition or subtraction.
Think for a moment about a new company. It's accounting system consists of a new, "fresh" set of books, no entries have ever been made, all accounts have a zero balance.
Assets = Liabilities + Owners' Equity $0 = $0 + $0
The books are in balance!!
If each, and every, transaction is a entered as a "balanced" entry, the books will stay in balance.
There are three general types of transactions and entries. 1) Routine, daily operating events - represents over 99% of all transactions. 2) Occasional events involving major assets, liabilities and owners' equity transactions. 3) Adjusting and Closing entries - made to prepare statements and close the books at the end of the year.
Here are some examples of common type 2 transactions. Before and after each one, the books must be in balance. In Chapter 3 we will see how these are actually entered into the books, in the form of journal entries.
Owner deposits $100 in the company checking account.
Assets = Liabilities + Owners' Equity

$100 = $0 + $100 Cash is an Asset, on the Left side. Owners' Equity is on the Right side.
The amounts are equal
A $1000 computer is purchased on credit.
Assets = Liabilities + Owners' Equity $1000 = $1000 + $0
Computer is an Asset, on the Left side. A Charge account is a Liability and is on the Right side.
The owner transfers a parcel of land to the company, and signs a contract for a building to be constructed. The land is worth $10,000 and the building will cost $90,000. The building will be paid for with a bank loan.
Assets = Liabilities + Owners' Equity $100,000 = $90,000 + $10,000
Land and Building are Assets, on the Left side. Bank loan is a Liability and is on the Right side. This is a compound entry, and involves more than two accounts.
Balance Sheet accounts can increase or decrease, so you will be adding to or subtracting from their balance after each transaction.
The accounting equation can be expressed in 3 ways:
1. Assets = Liabilities + Owners' Equity 2. Liabilities = Assets - Owners' Equity 3. Owners' Equity = Assets - Liabilities
It is common to abbreviate the accounting equation as A=L+OE. Using the numbers from the balance sheet above we get the following equations:
1. 33,000 = 14,000 + 19,000 [A=L+OE] 2. 14,000 = 33,000 - 19,000 [L=A-OE] 3. 19,00 = 33,000 - 14,000 [OE=A-L]
If you know any two of the amounts you can calculate the third.
Quick Quiz Try solving these equations for practice.
Assets = Liabilities + Owners' Equity 1 ? = 27,000 + 36,000 2 426,600 = ? + 168,400

3 1,537,618 = 692,327 + ? Click for answers
Try making up several examples on your own for practice.
We can see the Accounting Equation reflected in the layout of the Balance Sheet, as shown below. Notice that Total Assets equals the sum of Total Liabilities and Total Owners' Equity, shown in boldbelow.
ABC Company Balance Sheet
December 31, 2002 Assets
Cash $ 10,000 Accounts Receivable 6,000 Inventory 17,000 Total Assets $ 33,000 <- |
Liabilities & Owners' Equity | Accounts Payable $ 6,000 E Notes Payable 8,000 Q Total Liabilities 14,000 U A Common Stock, $1 par 10,000 L Retained Earnings 9,000 | Total Owners' Equity 19,000 | Total Liabilities & Owners' Equity $ 33,000 <-
Accounts and the Chart of Accounts An Account is a record used to summarize increases and decreases in a particular asset or liability, revenue or expense, or in owner's equity. Accounts usually have very simple and generic titles such as Cash, Accounts Payable, Sales, and Inventory. These are simple and descriptive terms under which many different transactions can be recorded.
Accounts are organized in a Chart of Accounts . This is a simple list of account titles presented in the following order: Assets, Liabilities, Owners' Equity, Revenue, Expenses. Organizing accounts in the correct order makes it much easier to prepare financial statements and enter transactions.
When doing homework problems students should read carefully and look for a Chart of Accounts, or for references to specific accounts, that should be used in that problem. If you don't find these, you should review the examples in the textbook chapter material for the correct accounts to use.
Here is a sample Chart of Accounts, showing accounts in the correct order. Account group dividers are usually omitted in actual practice. They are shown here for illustrative purposes, so the student can see how the Chart of Accounts is organized, and how it relates to the financial statements.

ABC Company, Inc. Chart of Accounts
Balance Sheet Accounts ---- Asset Accounts ---- Cash Accounts Receivable Prepaid Expenses Supplies Inventory Land Buildings Vehicles & Equipment Accumulated Depreciation Other Assets ---- Liability Accounts ---- Accounts Payable Notes Payable - Current Notes Payable - Long Term ---- Stockholders' Equity Accounts ---- Common Stock Retained Earnings
Income Statement Accounts ---- Revenue Accounts ---- Sales Revenue Sales Returns & Allowances Sales Discounts Interest Income ---- Expense Accounts ---- Advertising Expense Bank Fees Depreciation Expense Payroll Expense Payroll Tax Expense Rent Expense Income Tax Expense Telephone Expense Utilities Expense
© 1999-2006 Copyright Malcolm E. White, Fulton, Missouri, USA For personal educational use only. All rights reserved. No part of this tutorial may be reproduced or stored in any way without permission.

Chapter 3 Capturing Economic Events
General Ledger Debits and Credits Normal Account Balances Journal Entries The Income Statement
Chapter 3 introduces the concepts of debit and credit, and demonstrates bookkeeping activities. After studying Chapter 3 you should be able to:
• Prepare common journal entries • Post to the Ledger accounts • Prepare a basic Income Statement
Accounting Cycle - sequence of procedures used to record, classify and summarize accounting information in financial reports, on a regular basis.
Steps in the Accounting Cycle 1) Record (journalize) transactions. 2) Post journal entries to Ledger accounts. 3) Prepare a Trial Balance. 4) Make adjusting entries. 5) Prepare an Adjusted Trial Balance. 6) Prepare financial statements. 7) Journalize and post closing entries. 8) Prepare After-Closing Trial Balance.
General Journal and Journal Entries Every business transaction is recorded in the General Journal. The General Journal is called the book of original entry. A journal is a chronological record of transactions - they are in date order. Each entry is called a journal entry, and represents a different business transaction. Each transaction is recorded once, and only once. All journal entries follow the rules of debit and credit.
Journal entries should be made contemporaneously with the event they are recording, or reasonably soon after the event. Keep in mind that a journal is a chronological record of events. A contemporaneous writing is one that takes place at the same time as the event. This is the best time to record an event, because the facts and details are still fresh in our minds. Necessary documents, conversations, calculations, etc., are readily available to create a correct record of the event. If we wait too long, the event will be much more difficult to reconstruct.
In a legal sense, a contemporaneous writing carries much more weight than a writing made at a later date. And a writing carries much more weight than a mere recollection of events, months or years after the event has taken place. The courts recognize that people's memories about events are much clearer right after the event has taken place. As to the sale of real estate, state laws require a contemporaneous writing, to establish the exact terms and conditions of the sale. In contract law, this is called a “meeting of the minds,” and must be present for a valid contract to exist.

We will use verifiable, tangible evidence whenever it exists. Tangible evidence has physical existence – we can touch it, fold, staple, copy and file the document. We will look for a check, invoice, purchase order, contract or other business document that is a record of the event, a confirmation of payment received and goods delivered, etc. These documents become the back-up documentation for our journal entry.
General Ledger Transactions are classified into accounts appropriate to the business. Accounts represent major classifications, or categories, organized according to the 5 account types covered in Chapter 2. The accounts are listed in a Chart of Accounts.
Posting - journal entries are copied to the accounts in the Ledger. After posting, the balance in each account is updated. Accounts always carry the most current balance.
Balances in Ledger accounts ==become==> Financial Statements
Books & Bookkeeping Journals and Ledgers were historically written in by hand. They were actual books, which is where many of the terms we use come from. Terms like bookkeeping, journal, balanced books, etc. all came from the days of manually recording entries in books.
Today we use computers to do the same job, but the terminology is usually the same. The concepts we follow are identical whether we use a manual or computer based accounting system. We will use the rules of debit and credit, enter transactions into the Journal, and post to the Ledger.
Debits and Credits Journals and Ledgers can be viewed as pages of a book. Each page has lines and columns. A journal page has columns for the date, account name, and two columns for dollar amounts, referred to as the Debit and Credit columns.
Sample General Journal page
Date Account Debit Credit
Debit = Left column Credit = Right column
We enter dollar amounts in the Debit and Credit columns.
The totals in the Debit and Credit columns must be equal.
Caution!! Do not confuse the concepts of debit and credit we use here, with what you read in your bank statement. Banks copy their records, and send them to you. It reflects your bank account, from the bank's perspective - which is opposite of your perspective, in an accounting sense.
Sample Ledger page Account Title
Date Description Debit Credit Balance

The Ledger page has an additional column to calculate the balance in the account. The balance is updated after each entry.
A Credit balance is usually indicated by enclosing the number in parentheses: $ (500) would indicate a $500 Credit balance.
Accounts Payable
Date Description Debit Credit BalanceJan-1 Balance forward from Dec-31 (500)
The Dollar Sign $ is usually omitted in actual practice. We will always assume that we are using the US Dollar in all transactions, journals, ledgers and financial statements.
Entries are transferred (Posted) from the journal to the ledger pages on a regular basis.
When do we use Debit or Credit? When to use a debit or credit to record a journal entry is one of the biggest problems for beginning accounting students. It doesn't have to be difficult, if you remember a few simple rules.
First, you will always use both a debit and credit. That's the idea of the double-entry system. You have two columns, so every journal entry will have an equal dollar amount in each column.
Remember the Accounting Equation?
Assets = Liabilities+Owners' Equity
Left side Right Side
Debit side Credit Side
Debit = Increase Credit = Decrease Credit = Increase
Debit = Decrease
Accounts on the Left side will INCREASE with a Debit (Left column) entry. Accounts on the Right side will INCREASE with a Credit (Right column) entry. They will each DECREASE with the OPPOSITE entry.
Refer to the Chart of Accounts to determine whether an account falls on the Left or Right side of the Accounting Equation. You will learn more about how this works as the course progresses. The textbook has many good examples.

Normal Account Balances Accounts have a normal balance - the balance they would have if increases to the account are more than decreases to the account. If the account has a balance opposite its normal balance, we say the balance is negative, in relation to what it should be. Negative in this sense does not refer to debits or credits, but to a normal or negative balance, regardless of whether that is a debit or credit balance.
You will save a lot of time making journal entries if you remember the normal balance for the accounts.
account type normal balance example
Revenue accounts credit sales revenue
Expense accounts debit rent expense
Asset accounts debit cash, accounts receivable
Liability accounts credit accounts payable
Owners' equity accounts credit capital stock
If you are recording a sale, or other income transaction, you would credit the revenue account, and debit some other account (cash or accounts receivable). If you are recording an expense, you would debit the expense account, and credit some other account.
Many transactions are so common it's easier to remember them, rather than try and think them through each time you have to record them. If you remember how to record one side of the journal entry it is fairly easy to figure out the other side from the information given, e.g.. cash sale v. credit sale.
Type of entry Do this
Record a sale credit a revenue account
Record an expense debit an expense account
Record a credit sale debit Accounts Receivable
Record a cash sale debit Cash
Buy supplies on credit credit Accounts Payable
If you refer to these charts in the beginning it will writing journal entries much easier. Soon you won't have to refer to your charts any more.
A funny accounting story (yes, there are accountant jokes) A young accountant often asked his boss for advice in writing journal entries. The boss would always open his desk drawer, look at something for a moment and then tell the young accountant how the make the correct journal entry. This went on for many years.
Finally the old accountant was ready to retire. The younger accountant asked the old man, "I don't know what I'm going to do without you. Whenever I've had a question you always knew the answer. What will I do when you're gone? And what's in your desk drawer? Every time I ask for advice you look in there?"
The old accountant took the younger one into his office and opened his desk drawer. There was a 3" x 5" index card. It said: "Debits on the Left, Credits on the Right" -----------

When you are just learning how to make journal entries, a little reminder or hint can make the task much easier. Don't try and reason out every journal entry. If you are going to replace the oil in your car, you don't have to know everything about how the engine works. You only have to find the one bolt to turn to let the oil out. Don't make the job any more difficult than it is.
As an accounting student I kept these little reminders around all the time. As a professional I've done the same thing, except with more complex issues. This is just good practice. Many of the tasks we do are very mechanical in nature. Follow a few simple rules, refer to the hints and tips.
About my student, Al (a true story) I taught at the Columbia College Jefferson City, MO Campus for several years. We had an administrative assistant there who enrolled in my accounting course. His name was Al (I didn't change the name, you know who you are ;-)
Al struggled for 7 weeks trying to understand debits & credits, and how it all fit together. Along about week 8 he was sweating bullets, and not at all comfortable about taking the comprehensive final. All sat in the front row. About the middle of the next to last class he sat up and loudly proclaimed, "I get it! I get it! I understand how it all works." He aced the final, and the course.
And then there was Mary (another true story) Mary was another student (I did change her name). She was a last semester senior, and needed accounting for her business major. This was her third attempt, and we were all hoping 3 would be a charm. At the end of the first week she told me her story, and said she had trouble with the terminology.
Mary worked in the real estate field, and had associated the term "equity" with "real property." In her mind, this was a correct association, and perhaps common slang in her office. If you look up the word equity in the dictionary, there is no association with real property. Mary was working under an incorrect definition.
In accounting real property falls under the Asset category, and equity specifically refers to Owners' Equity - the owners' claim to the business assets. This is also a dictionary definition. But Mary never could get past her own personal (incorrect) definition of equity. She dropped the course, and changed her major. She was looking at a minimum of 2 more years in school, because she got hung up on one definition.
I'm telling these stories for two reasons. First you might be another Al. The concepts we use may seem a little strange at first. But most students catch on, and usually long before the 8th week. And second, to make you aware that each discipline you study in college has its own vocabulary, terms and concepts. Some of them may be very unique to that particular field of study, and the terms may not apply anywhere else.
In the field of accounting, our terminology IS widely used. Millions of people use the same terms and concepts daily to mean the same thing. This is part of the concept of "generally accepted" - the part of GAAP that refers to common practices. Take a little time to understand the terminology you learn in this course, and it will help you for many years to come.
Accounting is nothing more than a way to organize information, so it is useful to people who have to make financial and business decisions. A large number of people use the same concepts, methods, etc. on a daily basis. You can too.
Easy Method to journal entries. Follow these simple steps. Ask yourself these questions:

1) Is Cash used in this transaction? Cash is your first Asset account, it falls on the Left side of the equation, and will be used very often. It is easy to remember the rules for the Cash account: Debit = Increase; Credit = Decrease.
2) Was Cash received or paid?
Cash Received = Increase = Debit Column = Left Column
Cash Paid = Decrease = Credit Column = Right Column
Decide whether Cash belongs in the Debit or Credit column, write the word "Cash" in the Account column, and the dollar amount in the Debit or Credit column. You are now half way done with the journal entry.
3) Enter the balancing dollar amount in the opposite column as Cash. You don't need to worry about the other account title yet. Remember that a double-entry journal entry needs equal dollar amounts in the Debit and Credit column for each journal entry. Make that dollar entry now, and you're 75% done.
4) Refer to the information given, check the Chart of Accounts, tighten your thinking bolts and select the correct account for the second part of the journal entry. Use account titles exactly as they appear in the Chart of Accounts. Don't get creative and make up account titles. If you want to be creative take an art class. (hee, hee... just kidding ;-)
5) If Cash was not used you can substitute "Cash" temporarily where it would go IF it had been used in the transaction. For instance, suppose you are at a restaurant. You could pay in cash, or charge the meal on a credit card. Either way you have paid for a meal, and the journal entry will be very similar. So you can pencil in the word "cash" lightly where it would go. After you finish the journal entry, refer to the Chart of Accounts and replace "cash" with the appropriate account, which will usually end with "Payable" or "Receivable" such as Accounts Payable, Interest Receivable, etc.
.............. The Cash account is equivalent to the company's checking account. The balance goes up when money is deposited in the account, and the balance goes down when checks are written. It works just like your checking account!
So now you know that Cash is an Asset account, is on the Left side of the accounting equation, and the balance can go up or down. The rules you use for the Cash account will be the same for all asset accounts. Now you know how to make journal entries for all asset accounts. Wasn't that easy?
Liability and Owners' Equity accounts are on the Right side of the Accounting Equation, and they follow the OPPOSITE rules as the Cash account. Now you know how to make journal entries for all those accounts! Wasn't that easy, too?
So if you can remember one thing, how the Cash account works, you can easily figure out each and every other account. Since there are only 2 sides to the Accounting Equation, there are only 2 possibilities. Pretty simple.
.............. Let's try an easy example using my simple system. Some transactions are routine and happen very frequently. It helps to know these, because they represent 99% of the total journal entries a company will make. All companies earn some sort of revenue, so let's look at a sale transaction: March 20, the company made a cash sale for $100.

1) Is Cash used in this transaction? Yes. 2) Was Cash received or paid? Received. [Increase = Debit Column] --- enter the Cash portion of the journal entry
Date Account Debit Credit Mar-20 Cash $100
The date always starts a journal entry. Enter the month once on a page, and put the day in front of each journal entry on the page, even if they are all on the same date. The day indicates the beginning of a new journal entry. You should also leave one or two blank lines between journal entries on a page.
3) Enter the balancing dollar amount in the opposite column from Cash.
Date Account Debit Credit Mar-20 Cash $100 $100
Almost done.......
4) Refer to the information given, check the Chart of Accounts, tighten your thinking bolts and select the correct account for the second part. This is a sale, so we will use Sales Revenue for the Credit side of the journal entry.
Date Account Debit Credit Mar-20 Cash $100 Sales Revenue $100
The journal entry is in balance, and is complete. The textbook will show that a memorandum can be entered on the line below the journal entry. This should be additional information that is not contained in the journal entry itself; information that will be useful when trying to reconstruct events at a later date.
.............. Another example. April 1, the company paid rent $500. 1) Is Cash used in this transaction? Yes. 2) Was Cash received or paid? Paid. [Decrease = Credit Column] --- enter the Cash portion of the journal entry 3) Enter the balancing dollar amount in the opposite column as Cash.
Date Account Debit Credit Apr-1 $500 Cash $500

Note that it is customary to enter the debit part first, and the credit entry second. The credit entry account title is indented, to help set it off from the debit account titles. These practices are used to make the journal entry easier to read, and reduce errors in posting.
4) Refer to the information given, check the Chart of Accounts, tighten your thinking bolts and select the correct account for the second part. This is an example of paying an expense, in this case Rent Expense.
Date Account Debit Credit Apr-1 Rent Expense $500 Cash $500
An important tool for accountants...
Take care of your eraser and keep it close at all times..............
Another example .... without cash. April 20, the company opens a charge account at Office Emporium. They buy a $1000 computer, and say "charge it!"
1) Is Cash used in this transaction? No. [We will use the substitution method] 2) If Cash were used...Would it be received or paid? Paid. [Decrease = Credit Column] --- enter the "cash" portion of the journal entry. Pencil "cash" in lightly, you will replace it later with the correct account title. 3) Enter the balancing dollar amount in the opposite column.
Date Account Debit Credit Apr-20 $1000 cash $1000
Notice that I have roughed in the structure of the journal entry, but the actual accounts have not been entered yet.
4) Refer to the information given, check the Chart of Accounts, tighten your thinking bolts and select the correct account for the second part. This is an example of buying equipment, in this case we will use the account Office Equipment.
5) Refer to the Chart of Accounts and replace "cash" with the appropriate account, which will usually end with "Payable" or "Receivable" such as Accounts Payable, Interest Receivable, etc.

In this case we will use Accounts Payable, one of the most frequently used accounts. Accounts Payable is used to refer to most of the common, day-to-day debts and current liabilities that a company incurs. It is short-term debt, meant to be paid soon, like the phone bill, utility bill, etc.
Date Account Debit Credit Apr-20 Office Equipment $1000 Accounts Payable $1000
These are all examples of simple journal entries. There is one debit and one credit. Some transactions might involve more then two accounts, and we would use three or more lines to write those entries. These are called compound journal entries (or complex journal entries). There is no limit to the number of debit or credit accounts that can be included in a journal entry. All necessary accounts will be used. The journal entry will balance, regardless of the number of accounts used.
Let's try an example of a compound journal entry. June 5, the company buys building and land for $100,000. They make a down payment of $20,000 and sign a mortgage note with their bank for the balance. An appraisal shows the land alone has a value of $10,000.
1) Is Cash used in this transaction? Yes & No. [We will use the substitution method along with Cash] 2) If Cash were used...Would it be received or paid? Paid. [Decrease = Credit Column] --- enter the Cash portion of the journal entry. We will use Notes Payable to enter the $80,000 we borrowed from the bank, on its own line, but on the same side as Cash - the Credit side in this case.
Date Account Debit Credit June-5
Notes Payable $80,000 Cash $20,000
3) Enter the balancing dollar amount in the opposite column. 4) Refer to the information given, check the Chart of Accounts, tighten your thinking bolts and select the correct account for the second part. I left 2 blank lines above, because I knew we had both land and a building, which must be entered separately.
Date Account Debit Credit June-5 Land $10,000
Building $90,000 Notes Payable $80,000 Cash $20,000 -------- -------- Total $100,000 $100,000
In this example I have totaled the columns to show that the journal entry is in balance. In real accounting systems a total is only drawn at the bottom of the page, not after each journal entry.

Here's another example of a compound journal entry. This one also shows how to record the issue of common stock, a very important journal entry to know. On May 1, Bill, Bob and Quinn create a new corporation, BBQ, Inc. They raise capital in the company by selling 10,000 shares of Common Stock for $5 per share. The common stock has a Par value of $1 per share.
1) Is Cash used in this transaction? Yes. The organizers are raising initial capital to start a new company. If the stock were sold on a stock exchange this would be referred to as an IPO (Initial Public Offering). 2) If Cash were used...Would it be received or paid? Received. [Increase = Debit Column] --- enter the Cash portion of the journal entry. They sold 10,000 shares of stock at $5 per share, so they have raised 10,000 x $5 = $50,000.
Date Account Debit Credit May-1 Cash $50,000
3) Enter the balancing dollar amount in the opposite column. 4) Refer to the information given, check the Chart of Accounts, tighten your thinking bolts and select the correct account for the second part. Common stock is recorded as a credit to the Common Stock account. It is recorded at Par value, in this case $1 per share. So 10,000 x $1 = $10,000.
Date Account Debit Credit May-1 Cash $50,000
Common Stock $10,000
The journal entry is out of balance and we need to finish it up. Any excess raised by the sale of stock is credited to the Additional Paid-In Capital account.
Date Account Debit Credit May-1 Cash $50,000
Common Stock $10,000 Additional Paid-In Capital $40,000
This is a good example of an important journal entry every accountant and bookkeeper should know. We don't use it very often, but it's important to know how to make this type of journal entry.
A word about issuing stock. Each state has slightly different laws regarding corporations. Most states permit Par value stock, and some have a Legal Capital rule, forcing corporations to maintain tangible capital equal to the Legal Capital. This is in place to protect stockholders. Some states permit No-Par stock.
States also allow Preferred stock, which pays a fixed dividend, similar to an interest-bearing investment. Preferred stock usually has a Par value, and is recorded as in the example above, except the Preferred Stock

account is used. Some company's maintain a separate account Additional Paid-In Capital on Preferred Stock, but Additional Paid-In Capital usually reverts to the Common stockholders, regardless of it's source.
Posting to the Ledger Journal entries must be posted to the Ledger accounts on a regular basis. In many computer based systems this is done automatically, when journal entries are made. In a manual system, and some computer systems, the journal entries are posted on a daily, weekly or monthly basis, called "batch posting."
When you Post, you simply take each line from the journal entries, and transfer the amounts to the corresponding Ledger accounts. You have to be very careful to post all journal entries, get the dollar amounts right, and enter them in the correct column of the correct account. Needless to say, in a manual system errors do get made.
Posting is actually a routine and mechanical procedure.
Using T-Accounts You will see many examples of T-Accounts in your textbook. A T-Account is just a simple way to represent a Ledger account. It's handy for accounting students, because you can make quite a few T-Accounts on one page, and post journal entries quickly. This makes it easier to do homework assignments or analyze transactions.
Most of your homework assignments will only use a few accounts, and there will only be one or two entries to each account. You can make 3 T-Accounts across a page, and several rows down the page. The Cash account should be larger than the rest, since it will have quite a few entries in most assignments.
When you post to T-Accounts, make a large T and write the name of the account above it. Write the Debit entries on the left half of the T, and Credit entries on the right side of the T. I usually draw a line underneath the entries, net all the entries together, and put the balance on the correct side of the T below the line. The Income Statement Relates to a period of time. Revenue - the price of your goods and services Expenses - costs incurred in earning revenue
Net Income - the excess of Revenue over Expenses, on the Income Statement Net Loss - the excess of Expenses over Revenue, on the Income Statement
Net Income is synonymous with Net Profit.
Debit and Credit Rules Revenues = Credit Entry Expenses = Debit Entry
All revenue and expense entries follow these simple rules. The opposite side entry is usually made only to correct an error in an earlier journal entry. This is true of all income statement accounts.
Many balance sheet accounts tend to increase and decrease on a regular basis. Cash, Inventory, Accounts Receivable, Supplies, Accounts Payable all change on a frequent basis. Income statement accounts only increase, and do so according the the rules above. It is really easy to remember this simple rule.

..... Revenue ..... Example February 3, the company makes a credit sale of $250.
Date Account Debit Credit Feb-3 Accounts Receivable $250 Sales Revenue $250
Example February 5, the company makes a cash sale of $250.
Date Account Debit Credit Feb-5 Cash $250 Sales Revenue $250
These two entries are almost identical. Notice that Sales Revenue is on the Credit side in both entries. Remember this and it will make all your journal entries easier. When you record a revenue you will put it on the Credit side.
..... Expenses ..... Example February 1, the company pays rent, $500.
Date Account Debit Credit Feb-1 Rent Expense $500 Cash $500
Example February 5, the company has an service company clean their office every week. The fee is $100 each week, and the bill is paid at the end of the month. This is the first time the office has been cleaned this month.
Date Account Debit Credit Feb-5 Office Expense $100 Accounts Payable $100
These are both examples of an Expense entry. The expense part is always in the Debit column. You will list it first, and then either Cash or Accounts Payable. An entry to record Payroll Expense would credit Wages Payable. An entry to record Interest Expense would credit Interest Payable. These are special payable accounts. Most common business expenses will credit Accounts Payable or occasionally Cash.
When to record Revenue Realization Principle - at the time goods are sold or services are rendered.

When to record Expenses Matching Principle - offsetting expenses against revenues in the appropriate time period. For instance, the bill for June's long distance phone calls is paid in July. The long distance expense should show up on the June income statement.
© 1999-2006 Copyright Malcolm E. White, Fulton, Missouri, USA For personal educational use only. All rights reserved. No part of this tutorial may be reproduced or stored in any way without permission.

Chapter 4 Accruals and Deferrals
Revenue and Expense Accruals Deferrals Depreciation Adjusting Journal Entries Correcting entries Reclassifications Reversing entries
Chapter 4 demonstrates the adjusting entries made at the end of an accounting period to prepare financial statements.
In order for revenues and expenses to be reported in the time period in which they are earned or incurred, adjusting entries must be made at the end of the accounting period. Adjusting entries are made so the revenue recognition and matching principles are followed.
Chapter 4 completes the treatment of the accounting cycle for service type businesses. It focuses on the year-end activities culminating in the annual report. These include the preparation of adjusting entries, preparing the financial statements themselves, drafting the footnotes to the statements, closing the accounts, and preparing for the audit.
Four types of adjusting entries 1) converting assets to expenses 2) converting liabilities to revenue 3) accruing unpaid expenses 4) accruing uncollected revenues
Accounting systems are designed to handle a large number of routine transactions during the year very efficiently, usually with the aid of computers and devices like scanning cash registers, bar code inventory management systems and automatic credit card processing systems. The accounting system has the built-in capability to handle these items with little human intervention, creating appropriate journal entries, and posting thousands of transactions with little effort.
However, at the end of the year accountants must step in and prepare financial statements from all the information that has been collected throughout the year. An accounting system is designed to efficiently capture a large number of transactions. But this information is only partially in accordance to GAAP. The information needs a small amount of adjustment at the end of the year to bring the financial statements in alignment with the requirements of GAAP. And this is where adjusting entries come in.
GAAP also requires certain additional information, referred to as Notes to the Financial Statement. This is a combination of narrative and numerical information that must be prepared by a real live human. Computers can do many things, but the process of preparing financial statements requires professional judgment.
Revenue and Expense As with everything else in accounting, the terms revenue and expense have definitions. They are not difficult so define, but professional judgment is required to apply the definitions correctly, and in conformity with GAAP. You need to develop a working definition for both terms.
According to FASB in SFAC No. 3, "revenue is derived from delivering or producing goods, rendering services, or other major activities of the firm.” In his book Accounting Theory, (fourth edition, Irwin), Eldon S. Hendriksen comments,
"Revenue is best measured by the exchange value of the product or service of the enterprise....we still have the problem of deciding the point or points in time when we should measure and report the revenue....[I am] in general agreement with [the] view that revenue should be acknowledged and reported at the time of the accomplishment of the major economic activity if its measurement is verifiable and free from bias.
The term revenue realization is used in a technical sense by accountants to establish specific rules for the timing of reporting revenue under circumstances where no single solution is necessarily superior to others in the above context of revenue…..The general view is that realization represents the reporting of revenue when an exchange or severance has occurred. That is, goods or services must have been transferred to a customer or client, giving rise to either the receipt of cash or a claim to cash or other assets [accounts or notes receivable]….Thus, the term realization has come generally to mean the reporting of revenue when it has been validated by sale."
There might be other times revenue will be recorded and reported, not related to making a sale. For instance, long term construction projects are reported on the percentage of completion basis. But under most circumstances, revenue will be recorded and reported after a sale is complete, and the customer has received the goods or services.
According to Hendriksen, "...expenses are the using or consuming of goods and services in the process of obtaining revenues.... Frequently, expenses are defined in terms of cost expirations or cost allocations...be careful to distinguish between the measurement of an expense based on cost and the definition of an expense as an activity or process. Emphasis on the latter has the advantage of leaving the measurement of expense open for further discussion."
At the end of the year, or anytime before financial statements are prepared, accountants have to make certain adjustments to the books to make sure that all revenues and expenses are correctly recorded and reported. This is where adjusting entries, accruals and deferrals, come in. Some companies make adjusting entries monthly, in preparation of monthly financial statements.
Accruals - conditions are satisfied to record a revenue or expense, but money has not changed hands yet. Examples:
Accounts Receivable - work done or goods sold but the customer has not yet paid us
Accounts Payable - expenses incurred but we have not yet paid the supplier
These are recorded before financial statements are prepared, so the statements reflect all revenue earned, and expenses incurred.
Example - Accrued Revenue (accounts receivable) ComputerRx repairs computers. During March they fixed a computer, but the customer not picked it up or paid by the end of the month. The total value of the work done was $200, including parts, labor, etc.

The company should record both revenue and accounts receivable for $200 each. The work was done by the end of the month. Repair technicians were paid for their time and labor. Parts used in the repairs were also paid for. The company should record both the revenue and related expenses.
General Journal
Date Account Debit Credit Mar-31 Accounts Receivable $200 Computer Repair Revenue $200
To accrue revenue from repairs made during the month.
The following month when the customer picks up the computer and pays for it, the company will record the receipt of payment as follows.
Date Account Debit Credit Apr-15 Cash $200
Accounts Receivable $200 To record receipt of payments on account.
This is a generalized example of a journal entry. Many companies use an accounts receivable subsidiary ledger to keep track of each individual customer.
Example - Accrued Expense (accounts payable) ComputerRx installs computer networks. They often hire an independent contractor to run cables for the network. They are billed twice a month at a rate of $1.50 per foot of installed cable, including parts and labor. At the end of the month they estimate the contractor installed 500 feet of cable that they had not been billed for.
The company should record an accounts payable for $750 ($1.50 x 500 ft).
General Journal
Date Account Debit Credit Mar-31 Installation Expense $750
Accounts Payable $750
To accrue installation expense at end of month.
The following month when the company pays the installer, they will record the payment, as follows.
Date Account Debit Credit

Apr-10 Accounts Payable $750 Cash $750 To record payment on account.
Note, in both examples above, the revenue or expense is recorded only once, and in the correct month. The second journal entry reflects the receipt or payment of cash to clear the account receivable or payable.
Deferrals - money has changed hands, but conditions are not yet satisfied to record a revenue or expense.
Prepaid Expenses - insurance, rent, advertising paid in advance but the expense shows up on future income statements.
Unearned Revenue - subscriptions, maintenance contracts paid in advance but the revenue shows up on future income statements.
These are recorded before financial statements are prepared, so the statements reflect all revenue earned, and expenses incurred. Let's look at a time line and see how it works.
Deferrals are often referred to as allocations. Costs are spread over a number of months using a reasonable method of allocation. In the example below, we use the straight line method - an equal amount is allocated to each month. Other reasonable methods can be used as well.
Example - Deferred Expense The company has an option of paying its insurance policy once per year, twice a year (2 installments) or monthly (12 installments). They decide to pay it twice a year, in January and July. To get a proper matching of expense to the period we spread each 6-month payment equally over the period the insurance policy covers. The effect of this is to 1) match the appropriate expense with the month it relates to, and 2) eliminate
Month> Jan Feb Mar Apr May Jun total
$ spent> $600 $0 $0 $0 $0 $0 $600
Expense taken $100 $100 $100 $100 $100 $100 $600
Money is spent only once each 6 months, but the expense is allocated to each month by enter an adjusting journal entry in the books. Here's how the first journal entry would look.
General Journal Date Account Debit Credit
Jan-2 Prepaid Insurance $600 Cash $600
To record payment of 6 months insurance policy

And the entry to record January insurance expense at the end of the month.
Date Account Debit Credit Jan-31 Insurance Expense $100 Prepaid Insurance $100 To record one month insurance policy
And finally, the Ledger accounts.
General Ledger Prepaid Insurance
Date Description Debit Credit Balance
Jan-2 $600 $600 Jan-31 $100 $500
Prepaid Insurance declines each month as the expense is transferred from the Balance Sheet to the Income Statement.
Insurance Expense
Date Description Debit Credit Balance
Jan-31 $100 $100
Example - Deferred Revenue American Artist sells subscriptions to their magazine, published 12 times a year. A subscription costs $36 per year. People can subscribe at any time during the year. They record unearned subscription revenue when payment is received for a subscription.
General Journal Date Account Debit Credit
Apr-2 Cash $36 Unearned Subscription revenue $36 To record 1 year subscription received
Each month, as issues of the magazine are mailed, the company recognizes subscription revenue. How do they calculate their total subscription revenue? Each subscription earns them $3 per month ($36/12 issues). Last month they mailed out 3000 copies of the magazine. They will recognize $9,000 in subscription revenue ($3 x 3000 copies).

General Journal
Date Account Debit Credit Apr-30 Unearned Subscription revenue $9,000 Subscription revenue $9,000 To record 1 year subscription received
In both examples above, the company is transferring a deferred cost or revenue from the balance sheet to the income statement. We call this articulation.
Depreciation Depreciation is an exaple of a deferred expense. In this case the cost is deferred over a number of years, rather than a number of months, as in the insurance example above.
In 2000 the company buys a delivery truck for 12,000. They expect the truck to last 5 years. They decide to use the straight line method, with a salvage value (SV) of $2,000. The depreciable value is $10,000 ($12,000 cost - $2,000 SV). The annual depreciation expense is $2,000 ($10,000/ 5 years).
Year> 2001 2002 2003 2004 2005 total
$ spent> $12,000 $0 $0 $0 $0 $12,000
Expense taken $2,000 $2,000 $2,000 $2,000 $2,000 $10,000
Salvage Value $2,000
At the end of 5 years, the company has expensed $10,000 of the total cost. The $2,000 salvage value remains on the books.
General Journal
Date Account Debit Credit Jan-2 Delivery Trucks $12,000 Cash $12,000 To record purchase of delivery truck
Dec-31 Depreciation Expense $2,000 Accumulated Depreciation $2,000
To record depreciation expense for the year
The straight line method is only one method used to calculate depreciation. The subject will be covered more in Chapter 9.
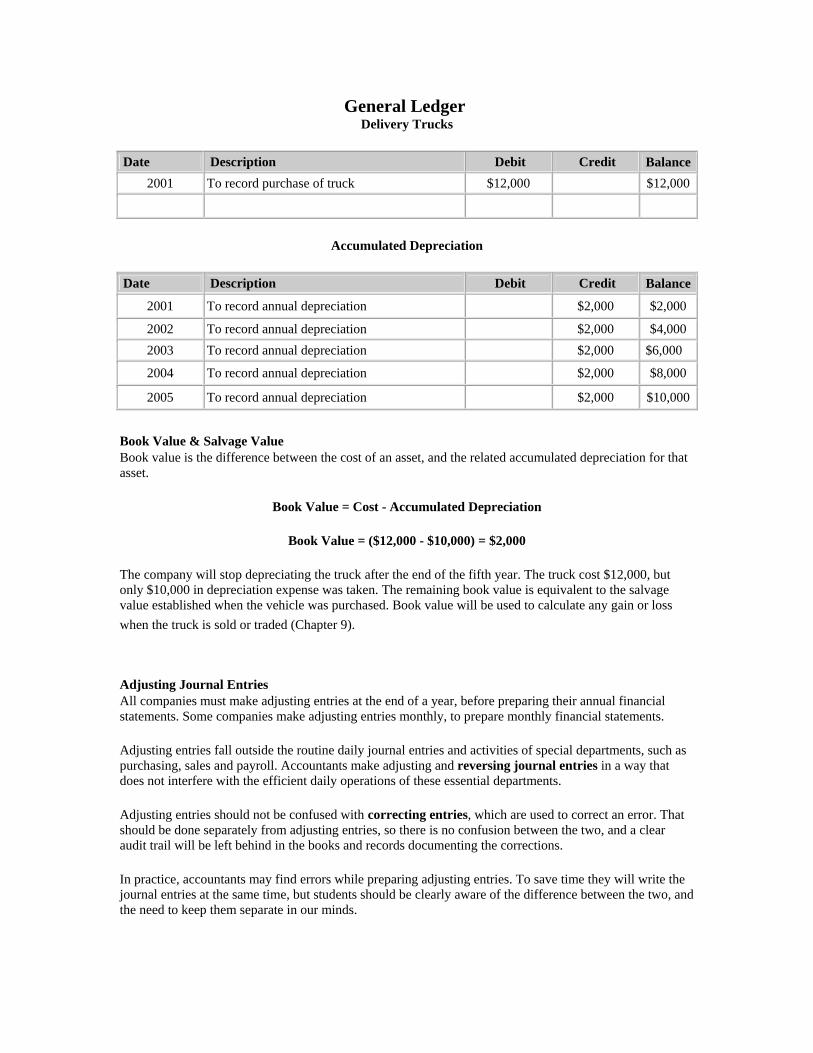
General Ledger Delivery Trucks
Date Description Debit Credit Balance2001 To record purchase of truck $12,000 $12,000
Accumulated Depreciation
Date Description Debit Credit Balance
2001 To record annual depreciation $2,000 $2,000 2002 To record annual depreciation $2,000 $4,000 2003 To record annual depreciation $2,000 $6,000 2004 To record annual depreciation $2,000 $8,000 2005 To record annual depreciation $2,000 $10,000
Book Value & Salvage Value Book value is the difference between the cost of an asset, and the related accumulated depreciation for that asset.
Book Value = Cost - Accumulated Depreciation
Book Value = ($12,000 - $10,000) = $2,000
The company will stop depreciating the truck after the end of the fifth year. The truck cost $12,000, but only $10,000 in depreciation expense was taken. The remaining book value is equivalent to the salvage value established when the vehicle was purchased. Book value will be used to calculate any gain or loss when the truck is sold or traded (Chapter 9).
Adjusting Journal Entries All companies must make adjusting entries at the end of a year, before preparing their annual financial statements. Some companies make adjusting entries monthly, to prepare monthly financial statements.
Adjusting entries fall outside the routine daily journal entries and activities of special departments, such as purchasing, sales and payroll. Accountants make adjusting and reversing journal entries in a way that does not interfere with the efficient daily operations of these essential departments.
Adjusting entries should not be confused with correcting entries, which are used to correct an error. That should be done separately from adjusting entries, so there is no confusion between the two, and a clear audit trail will be left behind in the books and records documenting the corrections.
In practice, accountants may find errors while preparing adjusting entries. To save time they will write the journal entries at the same time, but students should be clearly aware of the difference between the two, and the need to keep them separate in our minds.

Adjusting entries don't involve the Cash account. Any adjustments to Cash should be made in with the bank reconciliation (Chapter 7), or as a correcting entry.
Adjusting entries involve a balance sheet account and an income statement account. Here are some common pairs of accounts and when you would use them.
Income Statement Account Balance Sheet Account Adjustment to be made Sales Revenue (cr) Accounts Receivable (dr) Accrue unrecorded sales Earned Revenue (cr) Unearned Revenue (dr) Recognize earned revenue
Depreciation Expense (dr) Accumulated Depreciation (cr) Recognize depreciation expense
Insurance Expense (dr) Prepaid Insurance (cr) Apportion prepaid expense Interest Expense (dr) Interest Payable (cr) Accrue interest expense
Supplies Expense (dr or cr) Supplies (dr to increase, or cr to decrease account)
Recognize supplies used as an expense, and/or adjust Supplies account
Cost of Goods Sold (dr or (cr, as needed to offset Inventory adjustment)
Inventory (dr to increase, cr to decrease balance)
Adjust Inventory account to match year-end physical count
Legend: dr = debit; cr = credit; these are general rules of thumb. In all adjustments you should make the entry that is needed.
Notice most examples follow general rules: Revenues are credited, Expenses are debited, receivables are debited, payables are credited.
The Supplies or Inventory accounts need to be adjusted to reflect the physical amount of inventory or supplies at the end of the year. With Supplies we will count the physical items, for instance: 3 boxes of paper, 4 dozen pens, etc. and calculate a total value for supplies on hand, based on what we paid for the items originally. The Supplies account will be increased or decreased, as needed, to bring it to the correct balance.
Correcting entries A correcting entry should be entered whenever an error is found. If errors are found at the end of the year, while preparing financial statements, accountants usually go ahead and correct the error at that time. There are various reasons a correction might be needed. A wrong account or dollar amount might have been entered. The entry could have used a debit, when a credit should have been entered.
Errors will carry through to the financial statements, so it is important to detect and correct them. The type of error should be noted, and brought to management's attention, if the accountant feels the error might be intentional. Intentional errors are called "falsifications" and are an indication there might be fraud.
Reclassifications A reclassification is a correction entry used to correct a mis-classification or to change the classification of

an entry. This might be necessary if an entry is made without complete information. For instance, the company might purchase a building and land for a single price. The two assets need to be entered separately. The company may have to wait for an appraisal, and will make a journal entry to record the purchase, then reclassify a portion of the purchase price to allocate the correct values to the land and building.
Reversing entries A reversing entry is a very special type of adjusting entry. They can be extremely useful and should be used where necessary. A reversing entry comes in two parts: the original adjusting entry, and the reverse, or opposite entry. The second entry is written by simply reversing the position of all debits and credits. Ultimately, the end result on the books is zero, but the adjusting entry serves to correctly allocate an expense, so the financial statements are correct.
Let's look at an example. X Company has a payroll department, and cuts checks every two weeks after tabulating hours, and calculating net pay. A large number of allocations have to be made to various withholding accounts. The accountants don't want to interfere with the operations of the payroll department. And the employees also want the department to run efficiently so they can get their pay checks on time.
At the end of the year the accountants need to appropriately allocate payroll expenses, plus taxes due and payable. Rather than interfere with the payroll department the calculation is made on paper (or computer), and entered as an adjusting entry. It is marked to be reversed. After the closing entries are made, the first entries of the new year are the reversing entries. They undo the effects of the adjusting entry.
If the adjusting entry is not reversed, the books will not be correct. Both the accountants and payroll department will be making entries related to payroll. The reversing entry effectively allows the accountants to make adjusting entries without causing the books to be incorrect; the payroll department continues to make routine entries, and doesn't need to make any special entries or allocations.
Until you actually work with reversing entries they seem strange. Here's how the numbers play out. Let's look at a really simple example.
X Company's payroll expense is $1,500 per week; they pay salaries every two weeks. Assume that December 31 falls at the end of the week, and in the middle of the pay period. The payroll expense for the two week period needs to be split between two years, with $1,500 in year 1 and $1,500 in year 2.
Total for 2 week payroll = $3000
This is how the expense should be allocated: Dec 31
Last week of year 1 First week of year 2 $1500 $1500
This is the journal entry the payroll department will make Dec 31
Last week of year 1 First week of year 2 $0 $3000
At the end of the first week in January the payroll department will make its journal entry to record the two week payroll. But that journal entry will be for $3000, and not $1500 as it should be. Two things need to

happen: 1) $1500 needs to be accrued in the year 1 financial statements; 2) the first week of year 2 needs to be adjusted, because it will record too much payroll expense.
If this adjusting entry is made, the year 1 payroll expense will be correct:
Adjusting Entry
Date Account Debit Credit Dec-31 Payroll Expense $1500 Accrued Payroll Expense $1500 To record payroll for last week of the year
Reversing Entry
Date Account Debit Credit Jan-1 Accrued Payroll Expense $1500 Payroll Expense $1500 To reverse payroll accrual
After the books are closed for the year the reversing entry is made, dated the first day of the new year. The Payroll Expense account carries a credit balance, which is not the normal balance for an expense account, and would normally indicate an error in posting or classifying the transaction. But for a reversing entry this is correct.
General Ledger Payroll Expense
Date Description Debit Credit Balance
Jan-1 Reversing entry $1500 ($1500)
Jan-7 2-week payroll expense $3000 $1500
After the payroll department post the 2-week payroll the Payroll Expense account will be correct. The balance is a debit of $1500, which is exactly what the Payroll Expense account should have for one week's payroll. If the reversing entry had not been made, the Payroll Expense account would need to be adjusted, because it would be overstated by $1500.
© 1999-2006 Copyright Malcolm E. White, Fulton, Missouri, USA For personal educational use only. All rights reserved. No part of this tutorial may be reproduced or stored in any way without permission.

Chapter 5 Reporting Financial Results
The Accounting Cycle The Trial Balance Articulation in Financial Statements Closing the books at the end of the year
Chapter 5 brings together what you have learned in the previous chapters. In this chapter we review the overall accounting process and accounting cycle. The weekly exam is replaced with a midterm exam covering the first 4 week's material.
Preparing Financial Statements The ultimate purpose of the accounting process is to prepare financial statements. Everything else, all the routine journal entries & posting, corrections and adjusting entries finally culminate in an organized set of information that follows a set of rules known as GAAP.
GAAP gives us guidance as to what should be included in the financial statements, and how things should be reported and disclosed. The financial statements must include three specific reports, and notes that describe and disclose certain additional information.
The required elements of financial statements: The Income Statement The Balance Sheet The Statement of Cash Flows Notes to the Financial Statements
Optional (but recommended) financial statements: The Statement of Retained Earnings The Statement of Stockholders’ Equity [Only one optional statement will be included in a set of financial statements]
Although GAAP gives us guidance, it also allows for a considerable amount of flexibility in presenting financial information. The Notes must accompany the other financial information, and includes disclosure about accounting principles, lawsuits, lease obligations, concentrations of receivables, and other information the FASB considers necessary for adequate disclosure of important information.
The Accounting Cycle revisited 1) Capture and Record business transactions, 2) Classify transactions into appropriate Accounts, 3) Post transactions to their individual Ledger Accounts, 4) Summarize and Report the balances of Ledger Accounts in financial statements. 5) Post adjusting and closing journal entries. 6) Prepare a post-closing trial balance
Page 191 of your text has a good illustration of the accounting cycle.

The Trial Balance (TB) The Trial Balance is a list of the balance in all accounts. The balances are separated into debit and credit columns, and the columns are totaled (footed) to be sure the financial system is in balance. Just because the system is in balance doesn't mean everything is correct, or that financial statements can be prepared. First we must make any necessary adjusting entries to bring our books into alignment with GAAP.
The Trial Balance Worksheet The TB Worksheet provides accountants with a tool to organize the process of preparing adjusting entries and financial statements. A completed worksheet is presented on p. 192 of your text. It lets us organize the entire set of books on one or two pages of paper, so we can easily see all the balances and calculate the net profit for the year.
After completing the TB Worksheet, all that is left to do is transfer the information from the Income Statement and Balance Sheet columns to their respective financial statements, in the correct format. The worksheet greatly simplifies the process of preparing financial statements. It is also used by auditors when conducting an examination or review of a company's books.
Articulation and Preparing the Financial Statements The textbook shows how information flows back and forth between the Income Statement and Balance Sheet. This is called articulation. There are some very important articulations to watch when preparing financial statements. The financial statements should be prepared in the correct order, so the information articulates (flows) correctly.
The Income Statement should be prepared first. Net Income or Net Loss flows to the Statement of Retained Earnings (or Statement of Stockholders’ Equity). The ending balance of Retained Earnings flows to the Stockholder’s Equity section of the Balance Sheet.
How information articulates between financial statements
Income Statement Retained Earnings Stmt Balance Sheet Net Income or Loss ==> Retained Earnings ===> Stockholders' Equity
Because of articulation, financial statements must be prepared in this order. Closing the books at the end of the year At the end of each year, the books are closed. What this means is that certain account balances are reset to zero, in preparation of a new year. Since the Income Statement reports information on a yearly basis, the income statement accounts are the ones that will be closed.
Have you ever seen an automobile odometer that had a trip odometer, with a button you can push to set the trip odometer to zero? When you want to measure your mileage you can press the button, reset the odometer to zero, then drive to your destination. The trip odometer will tell you how far you've driven. Then you can reset it again for the next trip.
Closing the accounts is very similar. We close the income statement accounts so we can start counting again for a new year. These accounts are all the revenue and expense accounts, and they make up the total we call Net Income.
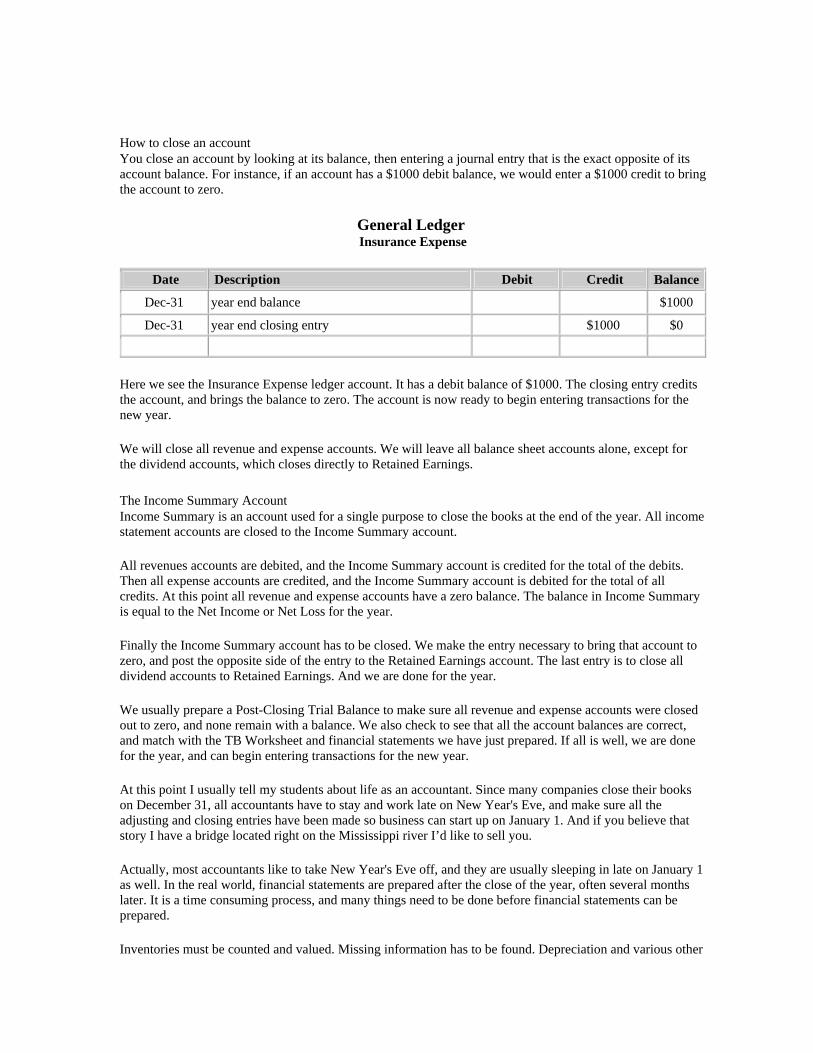
How to close an account You close an account by looking at its balance, then entering a journal entry that is the exact opposite of its account balance. For instance, if an account has a $1000 debit balance, we would enter a $1000 credit to bring the account to zero.
General Ledger Insurance Expense
Date Description Debit Credit Balance
Dec-31 year end balance $1000 Dec-31 year end closing entry $1000 $0
Here we see the Insurance Expense ledger account. It has a debit balance of $1000. The closing entry credits the account, and brings the balance to zero. The account is now ready to begin entering transactions for the new year.
We will close all revenue and expense accounts. We will leave all balance sheet accounts alone, except for the dividend accounts, which closes directly to Retained Earnings.
The Income Summary Account Income Summary is an account used for a single purpose to close the books at the end of the year. All income statement accounts are closed to the Income Summary account.
All revenues accounts are debited, and the Income Summary account is credited for the total of the debits. Then all expense accounts are credited, and the Income Summary account is debited for the total of all credits. At this point all revenue and expense accounts have a zero balance. The balance in Income Summary is equal to the Net Income or Net Loss for the year.
Finally the Income Summary account has to be closed. We make the entry necessary to bring that account to zero, and post the opposite side of the entry to the Retained Earnings account. The last entry is to close all dividend accounts to Retained Earnings. And we are done for the year.
We usually prepare a Post-Closing Trial Balance to make sure all revenue and expense accounts were closed out to zero, and none remain with a balance. We also check to see that all the account balances are correct, and match with the TB Worksheet and financial statements we have just prepared. If all is well, we are done for the year, and can begin entering transactions for the new year.
At this point I usually tell my students about life as an accountant. Since many companies close their books on December 31, all accountants have to stay and work late on New Year's Eve, and make sure all the adjusting and closing entries have been made so business can start up on January 1. And if you believe that story I have a bridge located right on the Mississippi river I’d like to sell you.
Actually, most accountants like to take New Year's Eve off, and they are usually sleeping in late on January 1 as well. In the real world, financial statements are prepared after the close of the year, often several months later. It is a time consuming process, and many things need to be done before financial statements can be prepared.
Inventories must be counted and valued. Missing information has to be found. Depreciation and various other

accruals and deferrals must be calculated. Companies with many branches, or those that do business on a global scale, must gather up the information from all parts of their company, before financial statements can be prepared. So don't worry, you won't have to work late on New Year's Eve if you become an accountant. Now, tax season.... well, that's another story. And we'll save it for another day.
The textbook gives some good illustrations that show the basic mechanics of the closing process, and the final outcome. All that's left to do is analyze the financial information, and see what kind of year the company had.
Your text shows a few financial ratios on p. 189. Most chapters from now on will show some financial ratios, that relate to the specific chapter topics. Chapter 14 of the text recaps all the financial ratios presented in the text. you can see them all on pp 628-29.
These ratios are used by investors and financial analysts on a daily basis. These are nothing new, and are not difficult to use. All you have to do is carefully follow the instructions and formula. Financial ratios can help you understand how your business is doing from year to year, and can also help you compare one business to another.
Financial statements have these elements:
• A proper heading, consisting of o Company Name o Title of Statement o Time Period or Date of Statement
• The body of the statement presenting financial information, in correct format. • Totals and subtotals, specific to each financial statement. • Articulation of balances and totals between statements. • Notes disclosing additional information according to GAAP
© 1999-2006 Copyright Malcolm E. White, Fulton, Missouri, USA For personal educational use only. All rights reserved. No part of this tutorial may be reproduced or stored in any way without permission.

Chapter 6 Merchandising Activities
Accounts Used Physical Inventory Adjusting the Inventory Account Inventory Shrinkage Special Sales and Purchase Accounts Freight In vs Delivery Expense
Chapter 6 Merchandising means selling products to retail customers. Merchandisers, also called retailers, buy products from wholesalers and manufacturers, add a markup or gross profit amount, and sell the products to consumers at a higher price than what they paid. When you go to the mall, all the stores there are retailers, and you are a retail customer.
Retailers deal with an inventory: all the goods (products) they have for sale. They account for inventory purchases and sales in one of two ways: Periodic and Perpetual. As the names suggest these methods refer to how often the inventory account balances are updated.
In a Periodic system, inventory account balances are updated once a year (some companies may do it more often, but all must do so at least once per year).
In a Perpetual system, inventory account balances are updated after each sale. This type of system is much more complex. Scanning cash registers, bar coded merchandise, and similar devices are used to update the inventory records after each sale. Obviously, this type of system is very expensive, but it gives managers a high degree of control over inventory, helps purchasing agents order replacement merchandise in time, detects and deters theft and helps identify other problems relating to inventory.
The main differences between the two relate to the journal entries used to record purchases and sales. The system a company chooses should be cost effective and provide the desired levels of inventory management. Special journals are often used to record sale and purchase transactions.
Accounts Used You can usually tell whether a company is using the Periodic or Perpetual system by the accounts they use to record inventory purchases. Here's a chart that shows the differences: [COGS = Cost of Goods Sold]
Method >>> Periodic Perpetual Account used to record inventory purchases:
Purchases Inventory
Appears on: Income Statement Balance Sheet When a sale is made: No adjustment to inventory is
necessary; merchandise cost is already on the Income Statement
Merchandise cost is transferred from Inventory to Cost of Goods Sold -an Income Statement account
Year-end procedures: Adjust Inventory balance to agree with Adjust Inventory balance to agree with

year-end physical count and merchandise value
year-end physical count and merchandise value
Other procedures: Transfer Purchases balance to Cost of Goods Sold
Balances should now be correct
Physical Inventory The "physical inventory" simply means the actual, real, tangible, touchable stuff the company has for resale. In the case of a manufacturing company, the physical inventory includes raw materials, the value of goods in the process of production, and the value of finished goods (Chapter 16).
Taking a physical inventory means counting the number of units of stuff you have for sale. This is usually done at the end of the year, so the balance sheet Inventory amount accurately reflects the true value of the ending physical inventory.
If you run a grocery store, you would count all the cans, packages and containers of food, and everything else you have available for sale. You would then have to assign a value to everything: it's cost to you when you bought each item. A small piece of your inventory records might look something like the one below.
Quantity is the number of units on the shelf, and also in boxes in storage; this is the amount we counted in taking the physical inventory. Unit Cost is what was paid for each unit of product. The extension column is the total cost of each item.
Item Quantity Unit Cost Extension soup, tomato, can, 8 oz 65 .24 15.60 soup, chicken noodle, can, 8 oz 79 .21 16.59 soup, cream of mushroom, can, 8 oz 53 .16 8.48
Once all items are counted, priced and extended, the total cost is the ending value for Inventory.
Adjusting the Inventory Account The Inventory account usually does not agree with the physical count. If the Periodic method is being used, the Inventory account has the balance as adjusted at the end of the prior year. If the Perpetual method is being used, the Inventory account should be close to the physical value calculated from the physical inventory count. There will always be a difference, and the accounts must be adjusted so the Inventory account agrees with the physical count and valuation. You will study valuation methods more in Chapter 8.
The Inventory account is adjusted to agree with the physical count and valuation. Let's look at an example of how the adjustment is made. The Inventory account has a balance of $12,500. You take a physical count and calculate the correct inventory value is $11,975. You will decrease inventory by $525 to adjust the Inventory account the equal the actual physical inventory value.
General Journal
Date Account Debit Credit Dec-31 Cost of Goods Sold $525 Inventory $525

To adjust Inventory to year-end physical count and valuation
General Ledger Inventory
[a Balance Sheet account]
Date Description Debit Credit BalanceJan-1 Beginning balance forward 12,500 12,500 Dec-31 Year-end adjustment 525 11,975
Cost of Goods Sold [an Income Statement account]
Date Description Debit Credit Balance
Dec-31 Balance 100,000
Dec-31 Year-end Inventory adjustment 525 100,525
The adjusting entry correctly uses an Income Statement account and a Balance Sheet account. The additional merchandise cost is transferred to the Income Statement in this case, but the reverse adjustment could just as easily be made.
Inventory Shrinkage If you throw a good wool sweater in a washing machine full of hot water, what will happen? You ladies already know the answer to that question. If you're a guy you may need to ask you wife, girlfriend, sister, or mother. Go ahead.... we'll wait.......
OK, now that you know the sweater will shrink, or get smaller. Guys, if you do this to your wife's favorite cashmere sweater we'll be forwarding your mail to the doghouse for the next month or so.
Well, inventory also shrinks. But not because we washed it in hot water. In fact inventory shrinkage occurs for a number of reasons, and it is just as it sound - inventory gets smaller. But how should this happen? Things happen to merchandise while the store has it available for sale. Here are some of the things:
Theft - by employees or customers Spoilage - milk, meat, vegetables, past the expiration date Obsolescence - computers, software, clothing (last year's styles) Display - merchandise put on display often can't be sold later or must be discounted Grazing - customers or employees eating food available for sale Damage - broken bottles, bent cans, frozen foods left out of the freezer
The sum total of all these items contributes to the difference between the Inventory account and the physical count. There might also have been errors made in the Inventory account during the year, adding to

the difference.
A true story about grazing I used to live in Tucson, Arizona and went to school at the University there. I lived on North Park, pretty far up the road near the north end of town. Near me was a Lucky grocery store, where I shopped a couple of times each week. Every time I would go there I would see people wandering around the store posing as customers. They would push a cart down the aisles, collecting a few items along the way.
A typical scenario I have observed with my own eyes:
• take a couple of slices of bread (leave the rest of the loaf on the shelf, opened • open a package of cold cuts, take a few slices, leave the package • tear off a couple of pieces of lettuce, leave the rest of the head behind • get one plastic knife from a package of 20, ditch the other 19 somewhere • put some mayo and mustard on the sandwich, return jars to the shelf • get a beverage and have lunch • top it off with a piece of fruit for dessert
The cart is abandoned, along with the empty beverage container, and the grazer leaves the store. This may sound extreme, but I've seen this done on a regular and repeated basis. It is a real problem is many areas, especially in cities and in large stores. Grazing is a form of theft. If you pop a grape in your mouth, you are grazing too.
Special Sales and Purchase Accounts Merchandisers use a few special accounts. When a sale is made, sometimes the customer returns merchandise for a refund. We do not reduce the sales revenue account. We enter the refund in a different account. This is done to help track the number and dollar amount of these types of transactions.
Sales accounts deal with customers and sale transactions
• Sales Returns and Refunds • Sales Allowances • Sales Discounts
Purchase accounts deal with suppliers and purchase transactions
• Purchase Returns and Refunds • Purchase Allowances • Purchase Discounts
Notice the close similarity between the account titles. They are almost identical, but apply on opposite sides of the purchase and sales cycles. Sales accounts are used in conjunction with selling merchandise and dealing with customers. Purchase accounts are used in conjunction with buying merchandise and dealing with suppliers.
By tracking these types of transactions in their own account managers have the opportunity to better understand their business. Are too many refunds being given? Why? Are we buying defective merchandise from a certain supplier? Are Sales Allowances cutting into our gross profit too much? Are we taking advantage of our Purchase Discounts when available?

The key to business profits is to identify each and every item that can be improved, and then improve it. Managers can raise prices. But they can also cut costs, reduce waste, increase efficiency, take discounts when available, and many other things to improve the profitability of their business.
Freight In vs Delivery Expense Freight In is the cost to have merchandise shipped to your store. Freight In is a cost of purchasing merchandise, and becomes part of Cost of Goods Sold in the Income Statement. Sometimes a company has to pay a separate charge for Freight In. At other times the cost may be included in the cost of merchandise from the supplier. In any case, the cost of Freight In is added to the cost of the merchandise.
example: XYZ, Co. buys 100 units of Product R for $7500. The trucking company charges $500 for the shipment. The total cost of the merchandise is $8000. Each unit costs $8000 / 100 = $80. They should set their selling price based on a cost of $80.
Delivery Expense is the cost to ship or deliver merchandise to your customer after a sale. Delivery Expense is a Selling Expense, and is included under that caption in the Income Statement.
© 1999-2006 Copyright Malcolm E. White, Fulton, Missouri, USA For personal educational use only. All rights reserved. No part of this tutorial may be reproduced or stored in any way without permission.

Chapter 7 Financial Assets
Bank Reconciliation Short Term Investments Accounts Receivable Uncollectible Accounts Writing Off Bad Debts Financial Analysis
Chapter 7 discusses financial assets: Cash, Accounts Receivable, Short Term Investments.
What are financial assets Financial assets include Cash, and those assets that can be converted to cash in a reasonably short period of time - one year at most, but less time in many cases. We will study the following financial assets:
• Cash • Cash Equivalents • Short Term Investments • Accounts Receivable
Valuation of financial assets Financial assets are valued as of balance sheet date, when financial statements are prepared. They are valued at the equivalent of their current Cash value - what they would be worth if we could convert them to cash now. In the case of Cash, it is already at it's current value. Short Term Investments are reported at their current market value. Accounts Receivable are adjusted for possible bad debts.
Cash and Cash Equivalents Cash is just as the word suggests. It includes cash money including paper and coins, checks and money orders to be deposited, money deposited in bank accounts that can be accessed quickly. The term liquid refers to Cash, and the ease or difficulty of converting an asset into Cash.
Cash Equivalents are highly liquid short term investments that can be turned into Cash very quickly. These include US Treasury bills, money market accounts and high grade commercial paper. When corporations need to borrow money for a very short time, they often sell commercial paper. These come due within a few months at most, and pay a higher interest rate than other investments.
Bank Reconciliation Banks send statements to their depositors each month. A bank reconciliation compares the information in the bank statement with the company's Cash account, and finds any discrepancies. These are recorded or dealt with as needed. The process is fairly simple.
The bank balance and book Cash balance are listed on a piece of paper (now we often use computers). Some items show up on the bank statement, but have not been reflected in the books yet. These items will be added to or subtracted from the book balance.
Some transactions have been recorded in the books, but have not yet cleared the bank. These include deposits in transit, which are not yet posted in the bank's records - those made after the date of the bank statement. And outstanding checks - those which have been written and mailed, but haven't cleared the bank yet. These items are added to or subtracted from the bank balance.

Once all items have been included, the adjusted bank and book balances should be equal. If they are not, the reconciliation needs to be reviewed and corrected until the two amounts are equal.
Bank Reconciliation
Adjustments to Bank Balance Adjustments to Book Balance
Add Deposits in transit Add anything on bank statement that increases cash balance, but has not been recorded in the books: bank collections, interest earned
Subtract Outstanding checks Subtract anything on bank statement that decreases cash balance, but has not been recorded in the books: bank charges and fees, bad checks, interest charges
Bank errors (add or subtract as needed); notify bank of error; these don't happen very often, but we need to watch for them
Add or subtract for accounting errors relating to deposits or checks.
Do not record any of these adjustments in the books.
These adjustments must be entered as journal entries, so the books agree with the bank balance.
Short Term Investments Short Term Investments include stocks and bonds that the company intends to hold only for a short time, and then sell and convert back to Cash. We consider it a good practice to convert unneeded cash to an investment account, where it can earn interest, dividends or show capital gains. These are shown on the balance sheet at their current market value, even if that is higher than the price paid for the investments. This is one of the few times we increase a balance sheet item above it's historic cost. Accounts Receivable Companies often sell to their customers on credit. The amount the customers owe is called Accounts Receivable (AR). We would record AR at the same time the sale is made, deducting any cash paid at the time of purchase, etc. When customers pay, we subtract the payment from their accounts receivable balance.
Most companies use an Accounts Receivable Subsidiary Ledger, which is similar to the General Ledger. The subsidiary ledger contains detailed information about each customer's account - purchases, payments, returns, adjustments, etc. Most companies send statements at the of each month, listing the monthly transactions and ending balance due from each customer.
Uncollectible Accounts When businesses sell on credit, they run the risk that some customers will not pay their bill. Legitimate complaints, errors in billing , etc. are dealt with in an appropriate manner, and the books are adjusted as needed to correct any errors, or show returns and allowances (price adjustments). Still, some customers don't pay their bill, for any of a variety of reasons, and we must have a way to deal with this in the books, and on the financial statements.
We do this by setting up an account that is a companion to Accounts Receivable. It is called the Allowance for Uncollectible Accounts (or something similar - Allowance for Doubtful Accounts is often used).
Allowance for Doubtful Accounts is called a contra-asset account. It is a companion to Accounts Receivable, and has an opposite balance. When we net the two balances, we get the amount we expect to collect from customers, allowing for those who don't pay.

The allowance account is established each year, at balance sheet date. We usually prepare an Accounts Receivable aging report, which gives us a history of customers accounts tabulated in columns, each column representing one month. We can quickly see which customers are late paying their bills by 30 day, 60 days, 90 days, etc. We would expect that if a customer hadn't paid their bill after 90 days there is a good chance they won't pay at all. The risk of loss goes up as accounts go unpaid for longer periods of time.
Companies use the aging report to make a dollar estimate of how much they will lose in unpaid account balances. At that time we have no way to know exactly which customers won't pay. But by tracking its business history a company can estimate a dollar amount that they believe is reasonable.
When the allowance account is established, an expense account is also debited. That account is called Uncollectible Accounts Expense, Bad Debt Expense, Provision for Bad Debt, or something similar. So the loss due to bad debts is recognized as a normal business expense on the Income Statement. Writing Off Bad Debts Periodically, and no less than once a year, a company must review it's accounts receivable and identify any customers who have not paid their bill for a very long time, generally over 90 days. Information is gathered about these customers, and attempts at collection should be made. However, the customer may be out of business, bankrupt, etc. and it is unlikely the company will be paid by these customers.
When this happens, the debt is no good and should be removed from the books. We do that by making an entry to both Accounts Receivable and the allowance account, reducing the balance in both accounts. Writing off bad debt should be done with management's approval. Potentially collectible accounts should be pursued; only legitimately uncollectible accounts should be written off.
The allowance method is acceptable for accounting, and correct under GAAP. However, no allowance expense is permitted for tax returns. Only accounts actually written off can be expensed on a tax return, and then only in the year the account is deemed uncollectible.
Financial Analysis Financial statements contain valuable information, but it must be analyzed to make relevant and correct decisions. Certain ratios are commonly used by investors and analysts. These are not difficult. All the information you need is already in the financial statements, as required by GAAP. And these ratios are used by thousands of people on a daily basis. No college degree or great math skills are required to use financial ratios.
Ratios can be used to evaluate a company's performance over a number of years. It can also be used to compare several different companies. Bankers often use ratios when considering a loan application. And investors calculate ratios to decide which stocks to buy or sell.
© 1999-2006 Copyright Malcolm E. White, Fulton, Missouri, USA For personal educational use only. All rights reserved. No part of this tutorial may be reproduced or stored in any way without permission.

Chapter 8 Inventories and Cost of Goods Sold
Using a Cost Flow Assumption Specific Identification FIFO LIFO Average Cost The importance of time when working with inventory methods Estimating Inventory Inventory Turnover How Turnover relates to Gross Profit Inventory Management - a delicate balance
Chapter 8 Manufacturing companies have three types of inventory: materials, work in process and finished goods. Retailers have one inventory: merchandise. In all cases, inventory is something the company will re-sell to someone else. Inventory cost is an asset until it is sold; after merchandise is sold, the cost becomes an expense, called Cost of Goods Sold (COGS). A journal entry transfers costs from the Balance Sheet to the Income Statement.
Chapter 8 focuses on inventories of merchandise, those inventories held by retailers for sale to their customers. This would include grocery stores, clothing stores, in fact all the stores you would visit in the mall, or shop at on a regular basis, are retailers. That covers a large and broad group of businesses.
There are several important points, or events, in the life on an inventory item. The company must first order and buy the item. It then holds the item on a shelf or warehouse, until a customer wants to but the item. Once the item is sold, the cost is transferred to COGS. So the three important times in an item's life are buying, holding and selling.
Let's think for a moment about a hypothetical inventory item, we'll call it Item X. If you buy, hold and sell Item X all in the same year, say 2002, the entire transaction relating to Item X will be a completed and realized transaction. If the customer has paid for Item X there will be absolutely no accounting left to do, except show the sale and related COGS on the 2002 Income Statement. Nothing about Item X will affect the company in the future. Everything about Item X relates only to the past.
If Item X costs you $40, and you sell it for $65, you made a Gross Profit on the item of $25.
Income Statement 2002
Selling Price of Item X $ 65.00Less: Cost of Item X 40.00
Gross Profit from selling Item X $25.00
This is the information that will be included in the 2002 Income Statement. Nothing will be left on the Balance Sheet.

Now let's think for a moment about Item Z. Assume you buy Item Z for late in 2002, and you are still holding it. There will be no sale to report, so the cost will remain on the Balance Sheet. If Item Z cost $50 that is the amount that will be shown on the Balance Sheet.
Balance Sheet Dec. 31, 2002
Inventory at December 31, 2002 Cost of Item Z $50.00
If Item Z is sold in 2003, the cost will flow to the Income Statement for 2003, and the gross profit will be reported on that income statement.
Inventory Valuation In the example above, you determined a value for Item Z at the end of the year. It is important for companies to count the physical inventory at the end of the year (Chapter 6). They must also place a dollar value on that inventory. The inventory value will be reported on the Balance Sheet at the end of the year.
It is also important to know the correct value of merchandise sold. That is the cost used to determine Gross Profit. Without enough Gross Profit a company can't pay it's operating expenses, such as salaries and wages, rent and utilities, etc. We will discuss Gross Profit a little more later in this section.
There are four methods commonly used to calculate a value for ending inventory. A company should select and use the method that best matches their merchandise and how it is sold.
4 methods of inventory valuation
Inventory method
How it works When used
Specific Identification
the cost of each individual inventory item is tracked separately; the exact cost of each item is used in the value of ending inventory
auto sales, gems and jewelry, works of art, unique, one of a kind items
First In, First Out (FIFO)
cost of earliest purchases flow to COGS; we assume that the items remaining at the end are the last ones bought in the year
eggs, milk, meat, produce; this is the default flow assumption, unless a different method is specified
Last In, First Out (LIFO)
cost of last purchases flow to COGS; we assume that the items remaining at the end are the earliest ones bought in the year
clothing, seasonal items; a highly specialized method of retail inventory
Average Cost cost of items bought are averaged across the year; the average cost is used at the end of the year; a moving weighted average is sometimes used
lumber, nails, nuts and bolts (simple average); gasoline (moving average)
Using a Cost Flow Assumption
• must meet cost-benefit rule • accounts for quantities of homogeneous products • matches the physical flow of goods • can be used with either Periodic or Perpetual costing system

Specific Identification The Specific Identification method assumes that each inventory item is special enough, unique enough, and costly enough to merit tracking one at a time. But does that apply to each and every item? What about a ream (500 sheets) of typing paper. Is it necessary to place a value on each and every sheet of paper?
Most business would answer "No" to that question. The cost of keeping that much detailed information would exceed the usefulness, or benefit, of the information. We call that the cost-benefit rule. The cost of an accounting system (or any other venture) should be outweighed by the benefits, or it is not cost-effective to follow that course of action.
For most companies, the Specific Identification method is far too costly and the additional information that could be gained is of little value. Most companies use a cost flow assumption. This simply means that the flow of inventory follows a certain pattern. Companies will buy merchandise in a manner consistent with the merchandise itself.
FIFO For instance, a grocery store will buy only the amount of milk it can sell in a week. Because milk spoils quickly, the store will buy small amounts each week, and make sure the milk it has for sale is the freshest milk available.
Further, one gallon of milk is basically the same as the next gallon (with only minor differences). We say that milk is a homogeneous product. All the milk can be viewed as a single product group, that follows an almost identical weekly sales and spoilage pattern.
The grocery will use a flow assumption to value its milk inventory at the end of the year. They will use FIFO, assuming that the milk on hand is the last milk that was bought during the year.
The LIFO method would assume that the milk bought in the first week of the year is the same milk on the shelf at the end of the year. Obviously year old milk will probably be coagulated into a solid, stinking block of green muck. So we know that LIFO would be an incorrect flow assumption for milk. So when will the LIFO assumption will be valid?
LIFO Let's now picture a clothing store. There are basically 4 clothing seasons: Winter, Spring, Summer and Autumn. There is a line of clothing for each season. Further, clothing styles change each year. Except for a few items (socks, handkerchiefs, belts) customers will prefer to buy this year's fashions, rather than last year's fashions. Here's how that works into the LIFO method.
At the end of the year the clothing store looks at its merchandise. If their year ends in December, they have Winter clothes in the show room. But when they look in the storage room, most of the clothes there are from earlier seasons that year. So Last In, First Out means, the most current seasons clothes (Last In) are the ones that people want now (First Out). After all, you wouldn't be buying last summer's clothes in the middle of winter, would you? Most people will wait until the following year and buy clothes in style in the coming summer.
Average Cost Some merchandise is nearly identical and is carried in large quantities, like lumber, nails, nuts and bolts or gasoline. If you have a tank on gasoline with say 50 gallons in it, and you add 200 more gallons, you can't separate the first 50 gallons out from the rest of it. It all just becomes on take with 250 gallons of gasoline in it. So companies use the average cost method to account for things like this.

If you run a gas station, your costs will change every week. You will always have some left in the tank from the week before, and the delivery truck will dump more gas in your tank at this week's prices. Gas stations use a moving average method - they take the moving average from last week, and calculate a new moving average after adding this weeks batch of gasoline to the tank. So a moving average updates the cost frequently, and applies that particular average cost to that week's gasoline sales. Next week they will calculate a new moving average and apply it to next week's gasoline sales, etc.
At one time my office was next to a company that sold nuts, bolts, screws, nails, washers and other types of small hardware items. They bought directly from the manufacturers, mostly foreign. Their goods came packed in small wooden barrels. Believe me, a small wooden barrel full of nails is heavy!
They repackaged the items into small plastic bags for resale to stores, and ultimately to end consumers. They had a very sophisticated set of scales that would accurately weigh out the pieces into the desired quantity. For instance ,they could weigh out 10 flat washers accurately, and drop them into a small plastic bag. It was much quicker and easier than counting pieces manually.
How do you think they counted and valued their ending inventory? They weighted all the opened containers (no need to weigh a full, unopened one), and used their cost per pound, to calculate the value of their ending inventory. This may seem a bit unconventional, but it is a very good method, and entirely acceptable.
Some bulk products and how they might be measured for average costing:
product measurement gasoline, oil, milk, orange juice gallon, liter crude oil barrel natural gas cubic yard, cubic meter nails, nuts and bolts pound, kilo wheat, oats, corn, other grains bushel electric, telephone or TV cable foot, meter
The importance of time when working with inventory methods When it comes to inventory values, time is of the essence. That's a legal term, and means that time is more than just important, it is essential. You can't sell something you don't have, right? You can sell only what you have on hand in your inventory. Once an item is sold we have to determine how much cost to transfer from the Inventory account to the COGS account.
Using the Periodic system If you use a Periodic inventory system, you value your inventory only once a year - at the end of the year! So the job is fairly easy, and you should have little problem making the calculation. You apply a cost flow assumption once at the end of the year, and it pertains only to the physical merchandise still on hand at the end of the year.
It doesn't matter when sales take place, or when inventory is purchased. We ignore all that when we use the Periodic system. All we have to care about is what inventory is on hand at the end of the year.

Using the Perpetual System If you use the Perpetual system you have to track each and every purchase and sale of inventory. Time is definitely of the essence. We will use a cost flow and apply it continuously, updating the Sales, Inventory and COGS accounts daily, as merchandise is purchased and sold.
This can be a daunting task, and usually is done by sophisticated and expensive computerized systems. When you go to a grocery or department store, notice that all the products have a bar code, which is scanned by an electronic cash register. All the merchandise is scanned into the the computer inventory records when it arrives at the store, and is scanned out as it is sold. The inventory records are continuously updated, along with the inventory value.
The type of system a company uses will depend on how much it can afford to spend. Obviously, not all companies can or need to spend $50,000 to $100,000 for each scanning cash register, plus the cost of the computer and software itself. Installing such a system can easily cost $1 million or more per store. That's a high price tag, so most companies use a Periodic system, and update their inventory only once a year.
Estimating Inventory Let's say a company uses the Periodic system. In the middle of the year they go to the bank seeking a loan for expansion. The banker asks to see a set of financial statements. Taking a complete physical inventory can be a huge, time-consuming task. The company may simply not have time to drop everything and take a physical inventory at this time. Do they have any options?
In fact, they do. They can estimate the inventory on hand. They can reconstruct the inventory based on their purchase and sales records for the year to date. There are a couple of methods used to do this. They are both similar.
The Gross Profit method is one method. The store needs to know it's gross profit rate or cost ratio (the inverse of gross profit rate). They start with the beginning inventory balance, add purchases, and deduct for sales made using the cost ratio. The result is an estimate of the merchandise on hand.
This method is especially useful when there has been a loss due to theft, fire, flood and so forth. The Gross Profit or Retail methods can be used to substantiate an insurance claim for loss in these situations.
Inventory Turnover Inventory turnover is not some sort of exotic pastry. It also does not mean we physically pick up our inventory and turn it over or upside down. Having dispensed with those misconceptions, just what is inventory turnover?
Each time you sell your entire inventory, you are said to have "turned" or "turned over" your inventory. We measure this as the number of times per year that this happens. We also measure it in a dollar amount, not by the actual physical objects. A store might have a year-old can of "Uncle Simon's Nasty Stuff That Only Your Aunt Ethel Will Eat". Not selling that can will have not effect on inventory turnover, in the larger sense of the word.
[Managers are definitely interested in micro-inventory management: looking at the sales pattern of individual items. Walmart has been an aggressive pioneer in this area. Right now we are dealing with macro-inventory management: looking at the dollar value of the entire inventory, taken as a whole.]
Earlier I discussed how a grocery store stocks milk. The buy enough for one week. There are 52 weeks in a year, so we would expect their inventory turnover, for milk, to be roughly 52. We usually calculate this using dollars, rather than tracking actual cartons of milk.

Number of Days in Inventory is the concept expressed in number of days. It tells us how many days, on average, inventory stays on a shelf before it is sold. Since there are 365 days in a year, we can divide 365 by the inventory turnover rate and get the number of days in inventory.
365 / 52 = 7 (rounded) or roughly 1 week
There are 52 weeks in the year, and the store wants to stock enough for 1 week at a time. Their weekly milk inventory is sold 52 times a year (turnover), or once every 7 days (days in inventory).
Let's look at a table and see some typical correlation's. Notice the inverse relationship between turnover rate and days in inventory. As one goes up, the other goes down.
Turnover Rate Days in Inventory Frequency 52 7 weekly 12 30.4 monthly 6 60.8 2 months 4 91.25 quarter (3 months) 2 182.5 half year 1 365 one year
What I'm hoping you'll get from this is a little common sense. Eggs would not have a turnover rate of 4. Perishable items will have a high turnover rate and low number of days in inventory.
Automobiles, diamond rings, and works of art would probably not have a turnover rate of 52. It can take much longer to sell these expensive items. They will have a low turnover rate, and a high number of days in inventory.
How Turnover relates to Gross Profit Profits depend on several things. One of the most important is the relationship between turnover and gross profit. Higher turnover brings greater profit. Lets look at a simple example.
A store buys Item X for $20, and sells it for $30. The Gross Profit from each item is $10.
Annual Turnover Rate Sales COGS GP 1 30 20 10 2 60 40 20 4 120 80 40
Guess what, we can just multiply the annual turnover rate and the GP per unit ($10). That would be an easier calculation!

Annual Turnover Rate $GP x TO Rate Total $GP 1 $10 x 1 $10 2 $10 x 2 $20 4 $10 x 4 $40 6 $10 x 6 $60
12 $10 x 12 $120 52 $10 x 52 $520
If you sell 1 unit per year, you will only make $10 per year. If you sell 1 unit per week you make $520 per year.
Which is better?
(I sincerely hope you chose $520 per year. If not, please consult a physician. You may need professional help.)
Turnover is essential to profits. Higher turnover = higher profits.
Let's look at an example Jim buys pocket knives from the manufacturers and resells them on e-bay. He buys by the case and pays $5 for each knife. At the both the start and end of the year he had 30 knives on hand (to make this example a little easier).
Jim bought and sold 800 knives during the year. He had 32 knives on hand at the start and end of the year, so his average inventory is 32 (32+32/2 = 32).
Cost Component Units $ Cost COGS @ $5 800 $ 4,000
Avg Inventory @ $5 32 $ 160 Results
Turnover rate $4000 / $160 = 25 Days in inventory 365 / 25 = 14.6
What this is telling us: His average inventory was 32 knives last year. He sells 32 knives every 25 days. Each batch of 32 knives is in inventory 14.6 days. If he sells 800 knives every year, that's about 800 / 365 = 2.19 knives per day. This is consistent with our results. 32 knives / 14.6 days = 2.19 knives per day. He sells about 2 x 32 = 64 knives each month (avg 66.6 knives per month).
Inventory Management - a delicate balance By now you should be seeing the correlation between Gross Profit and sales. No matter what your gross

profit is, making more sales will always mean making more GP. Since each and every unit of product you sell earns you a GP, you will always do better selling more, rather than less.
Inventory turnover is a measure of ow often your average inventory is sold. Since business managers have access to all the detailed operating information of their company, they can manage inventory on a product by product basis. They can effectively look at the turnover of a single product, and more accurately gauge their real average inventory held for that item.
There is one very important thing that all businesses have to deal with: carrying the right amount of inventory - not too much, not too little.
If you carry too little inventory you will lose sales, and that will reduce your GP.
If you carry too much inventory the surplus will tie up your cash flow. You will have to warehouse, protect and insure the excess inventory. And you run a high risk of spoilage, obsolescence, theft and damage.
A company will maximize its profits by carrying the correct amount of each item in its inventory. This amount is determined by careful analysis and tracking of customer's buying patters. Stores have to pay attention to the seasonal and cyclic buying trends their customers display. Effective inventory management requires both day-to-day attention, and ongoing analysis of customer preferences and buying habits.
© 1999-2006 Copyright Malcolm E. White, Fulton, Missouri, USA For personal educational use only. All rights reserved. No part of this tutorial may be reproduced or stored in any way without permission.

Chapter 9 Plant Assets and Depreciation
Chapter 9 In earlier chapters you learned the basics of depreciation. This chapter explains a little more about how depreciation expense is calculated. It also shows the other significant events in the life of plant assets: the purchase and retirement of those assets.
Depreciation expense spreads the cost of major equipment and assets over a period of time that spans a number of years. Amortization is used to allocate the cost of intangible assets, such as patents, copyrights, trademarks, and franchises. Depletion is used to record the cost of natural resources extracted from the earth.
There are three main events in the life of any asset:
1. acquisition 2. useful life 3. disposal or retirement
We will make journal entries for each of these events. Over the useful life we will enter depreciation expense. At the end of the life we will record any gain or loss at the time of disposal or retirement of the asset. Sometimes assets are traded for other assets, and that must be accounted for in the same manner as a disposal or retirement.
Fixed asset acquisition Fixed asset accounts are debited for the actual cost of fixed assets. The correct account should be debited. Some companies use a Fixed Asset Subsidiary Ledger and show a control account on the Balance Sheet, called Property, Plant and Equipment (PPE) or something similar. In these cases all fixed assets acquisitions debit PPE and the subsidiary ledger carries the details pertaining to the asset.
Depreciable cost Buildings, equipment, vehicles, computers, furniture and fixtures are all examples of depreciable assets. We will depreciate the depreciable cost of assets. This includes the purchase price paid, sales tax, shipping and installation costs, and possibly incidental costs if they are material. Cost of fixing damage caused during shipping and installation is treated as a Repair Expense.
Some costs are incidental to buying new equipment. A specialist might be hired to install a large printing press, or other specialized, complex piece of manufacturing equipment. This type of cost is included in the depreciable cost of the asset.
Sometimes employees have to be trained. The cost of training may be considered part of the depreciable cost, it the amount is material to the purchase of the asset. A brief training session for one or two machine operators will probably be an immaterial amount.
The cost of training the entire company's personnel when a new computer system is installed would probably be a material amount, especially in a large company. Every employee might require a day's training or more in the new system. The loss of productivity would be a material amount, and should be classified as part of the depreciable cost of the asset.

Recording Asset Acquisitions If a company buys land, building, equipment etc. all at the same time, the total purchase price has to be divided correctly among the various assets.
Land is a non-depreciable asset. It falls into its own category in the books and on the Balance Sheet. Don't include land costs with other fixed asset costs, such as buildings. They must always be entered separately. Buildings will be depreciated; land will not be depreciated.
General Journal
Date Account Debit Credit Apr-15 Land $5,000
Building $45,000 Cash $10,000 Mortgage Note Payable $40,000 To record purchase of land and building Apr-30 Manufacturing Equipment $7,000 Computers and peripherals $10,000 Computer software $3,000 Accounts Payable $20,000
To record purchase of equipment, computers and software
The Useful Life of an asset, is the period of time the company expects to use the asset in the business. It is also important that the asset be used as it is intended, and for the production of income. For instance, a computer that is being used as a doorstop is not contributing to the production of income, and it is also not being used as it was intended.
[Of course, at this point some very clever student will say something like, "What if the computer is used as part of an art project displayed in the foyer of an office building? It's not being used as intended nor in the production of income." Well, young Einstein, objects d'art are Investments, not depreciable plant assets. Nice try, but no banana for the monkey.]
Why do assets depreciate? For Federal Income Tax purposes, depreciation is referred to as cost recovery. The government allows you to use the cost of plant assets to offset income. You recover your cost a little bit at a time, over a number of years. Each year you reduce your income tax expense, by an amount relative to the cost recovery amount for that year. It's a slightly strange concept if you're not involved in preparing income taxes. But it does make sense if you think about it a bit.
For financial statement purposes, depreciation reflects a number of different influences that each affect an asset over its useful life.
• recognize physical deterioration • recognize obsolescence • recognize a reduction in market value

• recognize benefits derived from using the asset • apply a logical, systematic cost allocation over a relevant period of time • apply the matching principle
Each of these is important to a company. When assets are purchased, the cost is reflected in the Balance Sheet. Depreciation expense transfers that cost to the Income Statement in order to reflect the effect of the items listed above, in the financial statements.
Usually, at this point, students are a showing a slight glaze over their eyes. I then reiterate that depreciation expense reduces income, which in turn cuts income taxes. Cutting our taxes, that's something most of us can relate to. So depreciation is a good thing, an important thing, a joyous and wonderful thing.
[you may now take a few moments to celebrate the joys of depreciation ...ahhhhh.]
Depreciation Methods We will study a couple of depreciation methods. There are other methods. If you study international accounting, you will find that other countries deal with these issues in a very different way than we do in the US. But we're #1, so we must be right (hee, hee).
Depreciation Method my silly comments Straight-Line Method causes problems with my spell checker because of the hyphenated word Declining-Balance Method oh, no. another hyphenated word. my spell checker is not happy today
MACRS (income tax method)
US congress made up this word. its not in my spell checker dictionary either. whatever they were drinking that night, I want a bottle of it.
OK, let's try this again.
Depreciation Method my serious comments
Straight-Line Method
an easy method that allocates an equal amount of depreciation to each time period; salvage value is used
Declining-Balance Method (200% & 150% DB)
allocates more depreciation expense to the early years of an asset's life, when it is new; since there should be less down-time and fewer repairs in the early years, the company should get more use out of the asset in the beginning of it's life; no salvage value is used.
MACRS (income tax method)
uses the double-declining balance method, but you only take one-half year's depreciation in the first year, and then you switch to the straight-line method in the middle of the asset's life, so a 5 year asset takes 6 years to depreciate. salvage value? salvage value? we don't need no stinking salvage value!! I still want a bottle of whatever they were drinking when they dreamed this one up.
[It is a little known fact that the US congress is responsible for the rapid growth of the computer industry during the 1980s and 1990s. The MACRS depreciation rules were so complex everyone had to buy computers just to do the calculations each year. Millions of computers were sold, just to calculate MACRS depreciation ........ OK, I'm just kidding. You didn't really think I was serious, did you?. Hey, this is week 8, we're almost done.]

Selling or disposing of Fixed Assets After selling or disposing of fixed assets, the company no longer has the asset. This requires a journal entry to remove everything in the accounting records relating to the asset.
The depreciable cost and accumulated depreciation relating to the asset must both be removed, or reversed. There might be a gain or loss when disposing of assets. There might also be incidental costs relating to disposing of the asset. All these things should be included in the journal entry recording the disposal.
Let's assume on September 1, the ledger shows these balances for a piece of equipment.
General Ledger Equipment
Date Description Debit Credit BalanceSep-1 Balance forward $7000 $7000
Accumulated Depreciation - Equipment
Date Description Debit Credit Balance
Sep-1 Balance forward $5600 ($5600)
Removing these amounts from the books with a journal entry When assets disposed of there might be a gain, loss or a wash (no gain or loss). In either case all such journal entries will start from the same place, removing the related asset cost and accumulated depreciation. This journal entry does not balance; is the beginnings of a journal entry, and must be completed when all the information is available.
General Journal
Date Account Debit Credit Sep-15 Accumulated Depreciation $5,600
Equipment $7,000 To record disposal of equipment
Notice the exact opposite of the account balances is entered for each account. This causes the account balances to go to zero after this journal entry is posted.
General Ledger Equipment
Date Description Debit Credit Balance

Sep-1 Balance forward $7000 $7000 Sep-15 Disposal of asset $7000 $0
Accumulated Depreciation - Equipment
Date Description Debit Credit Balance
Sep-1 Balance forward $5600 ($5600)
Sep-15 Disposal of asset $5600 $0
The asset and related accumulated depreciation have both been removed from the books.
Calculating Book Value Book Value is the difference between the asset cost and accumulated depreciation:
Equipment cost $ 7,000Less: accumulated depreciation -5,600
Book Value before sale $ 1,400
Gains and losses are calculated using the Book Value.
Equipment sold for a Gain If the equipment is sold for more than its book value there will be a gain. Gains are similar to revenues, and will be recorded with a credit entry. Let's say the equipment is sold on September 15 for $2,000. The gain will be:
Selling Price $ 2,000Less: Book Value - 1,400
Gain $ 600
We'll begin with the journal entry we started above, and add the additional information, the selling price and gain or loss, in the right places.
General Journal
Date Account Debit Credit Sep-15 Accumulated Depreciation $5,600
Cash $2,000 Gain on disposal of equipment $ 600

Equipment $7,000 To record disposal of equipment
The journal entry is now in balance. Did you notice what I did? I started the journal entry with what I already knew - the cost and accumulated depreciation. I left 2 lines blank in the middle of the journal entry, so the sales price and gain or loss could be recorded.
Equipment sold for a Loss If the equipment is sold for less than its book value there will be a loss. Losses are similar to expenses, and will be recorded with a debit entry. Let's say the equipment is sold on September 15 for $1,000. The loss will be:
Selling Price $ 1,000 Less: Book Value - 1,400
Loss ($ 400)
We'll begin with the journal entry we started above, and add the additional information, the selling price and gain or loss, in the right places.
General Journal
Date Account Debit Credit Sep-15 Accumulated Depreciation $5,600
Cash $1,000 Loss on disposal of equipment $ 400 Equipment $7,000 To record disposal of equipment
Equipment sold for a Wash If the equipment is sold equal to its book value there will be a wash. Let's say the equipment is sold on September 15 for $1,400.
Selling Price $ 1,400 Less: Book Value - 1,400
Wash $ 0
We'll begin with the journal entry we started above, and add the additional information, the selling price and gain or loss, in the right places. In this case there is a wash, so no gain or loss is recorded. The equipment is simply removed from the books.
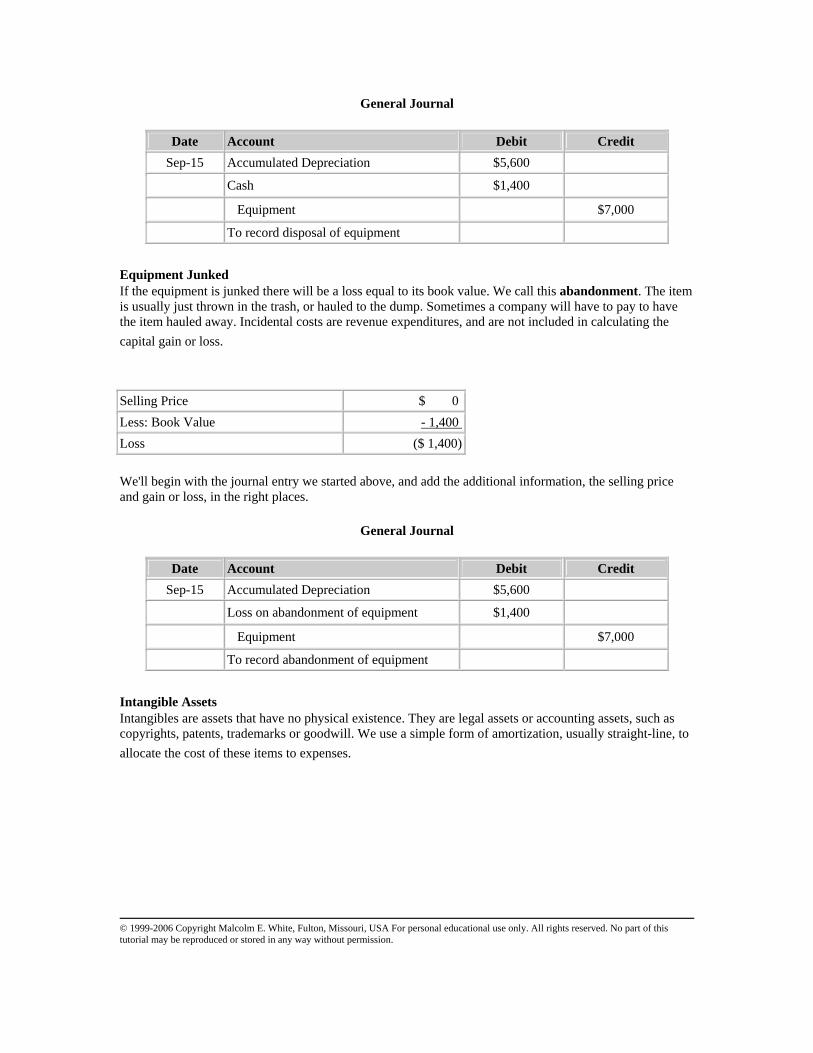
General Journal
Date Account Debit Credit Sep-15 Accumulated Depreciation $5,600
Cash $1,400 Equipment $7,000 To record disposal of equipment
Equipment Junked If the equipment is junked there will be a loss equal to its book value. We call this abandonment. The item is usually just thrown in the trash, or hauled to the dump. Sometimes a company will have to pay to have the item hauled away. Incidental costs are revenue expenditures, and are not included in calculating the capital gain or loss.
Selling Price $ 0 Less: Book Value - 1,400
Loss ($ 1,400)
We'll begin with the journal entry we started above, and add the additional information, the selling price and gain or loss, in the right places.
General Journal
Date Account Debit Credit Sep-15 Accumulated Depreciation $5,600
Loss on abandonment of equipment $1,400 Equipment $7,000 To record abandonment of equipment
Intangible Assets Intangibles are assets that have no physical existence. They are legal assets or accounting assets, such as copyrights, patents, trademarks or goodwill. We use a simple form of amortization, usually straight-line, to allocate the cost of these items to expenses.
© 1999-2006 Copyright Malcolm E. White, Fulton, Missouri, USA For personal educational use only. All rights reserved. No part of this tutorial may be reproduced or stored in any way without permission.

Chapter 10 Liabilities
Amortization table Interest calculation Present Value Contingencies
Chapter 10 Liabilities are essentially debts. They can be: current (short term): due & payable within 1 year long-term: due & payable in over 1 year
The most common liabilities are: Accounts Payable: for routine expenses and inventory purchased on credit
Notes Payable: short- or long-term loans from banks or other lenders
Accrued Expenses: various current expenses, accrued to prepare financial statements; these can include accounts such as interest payable, taxes payable, wages payable, and other similar accruals at the end of the year.
Mortgage Notes: long term borrowing to purchase major assets; the assets purchased are also pledged as collateral
Bonds Payable: corporation general debt; bonds of major corporations can be purchased on a public stock exchange; bonds pay interest on a regular basis, usually twice a year; bonds may have maturity dates from 5 to 30 years, or any other time frame selected by the company and acceptable by lenders.
Liabilities often have to be estimated at balance sheet date, so we can prepare financial statements.
Amortization table An amortization table is a calculation involving interest and regular payments, or reductions, in an account or debt. Costs can be amortized over several years, using an amortization table. They are usually prepared to show the progress of loan payments, especially in long-term mortgage loans. If you have a home loan, you will probably get an amortization table from your bank, showing how your payments are divided among interest, principle and other fees (escrow).
Amortization tables are relatively easy to prepare. The use of computer spreadsheet programs makes creating these tables a very simple task. One "template" can be created and used over and over for different amounts, interest rates and time frames.
Interest calculation Interest applies to many liabilities. Notes, bonds and mortgages all involve interest.
Interest is the fee you pay for the use of someone else's money. The calculation is always the same.

Interest = Principle X Annual Interest Rate X Time (portion of a year)
Interest Rates are always expressed in annual terms. For instance, 12% interest means 12% per year, or 1% (1/12) per month.
The Time factor is always in relation to a year, so it maintains the correct relationship with annual interest rates. One month's time factor would be 1/12. Three months' would be 3/12, 7 months would be 7/12, etc.
Sometimes interest agreements are expressed in a number of days. We usually use a 360 day year to make the calculation easier, and more rounded. This goes back to the days before modern calculators and computers, when we used pencil and paper to calculate interest. Example: 30 day note uses 30/360 time factor.
Using Amortization Tables Amortization is an accounting method used to spread costs or payments over a period of time, based on a few basic concepts: Time, Principal (money or cost), and Interest Rate. Amortizing a loan balance uses all three of these to reduce a loan balance to zero over a number of years. This might apply to a home mortgage or automobile loan. It might also apply to an automobile or equipment lease.
Interest is always expressed as an annual Rate, so your interest calculation must always have a Time factor. For instance, one year's interest on $100 at 12% (annual rate) is
$100 x 12% = $12 annual interest [on your calculator 100 * .12 = 12]
If you make a home or car loan payment every month, you would not want to pay a year's worth of interest on each monthy payment, would you? (this is not a trick question ;-) Of course, you would only want to pay one month's interest each month. So we have to add a Time factor to the annual interest calculation above. In this case there are 12 months in a year, to calculate one month's interest we would use 1/12 as a Time factor.
$100 x 12% x 1/12 = $1 monthly interest [100 * .12 / 12 * 1= 1]
If you wanted to calculate interest for 2 months you would use 2/12:
$100 x 12% x 2/12 = $2 interest [100 * .12 / 12 * 2 = 2]
The monthly payment amount stays the same each month, and is divided between interest expense and principal reduction. As the principal goes down, so does the interest expense. Eventually the principal amount is zero, perhaps over 5 years for a car loan, or 25 years for a home mortgage.
Let's say you buy a new home with a $100,000 mortgage, spread over 25 years, at 8% interest. How much is your payment going to be, and how much interest will you pay over the life of the loan if you make all the payments on time? Here's a good website you can visit to answer this type of question.
http://www.interest.com/calculators/
I used their calculator to answer this question, and create an amortization table. It took about 10 seconds. Your monthly payment would be $771.82 and your total interest over the life of the loan (25 years) would be $131,542.40. In total your $100,000 loan would cost you $231, 542.40 -- that's over twice the amount of money you originally borrowed, in fact you would pay back 2.3 times your original loan amount.

Many borrowers reduce their overall interest expense by making extra principal payments on their loans whenever possible. Look at an amortization table you will see that most of the monthly payment goes to Interest and only a small portion goes to Principal Reduction. [If you have not done so yet, use the calculator link, and enter the amounts shown above, then generate an amortization table and look at it.]
At the end of month 1, you would have paid $771.82 ($666.67 interest and $105.15 principal). This reduces your principal balance to $99,894.85. If you were to make all the first 12 payments on time you would have paid $9,261.84 ($7952.69 interest and $1309.15 principal.) At the end of 12 months the loan balance would be $98,690.85. Now, follow closely at this point.
Principal balance after month 1 $99,894.85Principal balance after month 12 $98,690.85
Difference $1,204.00Month 1 payment $771.82
Total payment $1975.82
If I pay and extra $1204 principal in month 1, it will reduce my principal balance and move me down the amortization table to where I would be after 12 months. I would avoid paying the amortized interest for months 2 - 12, a savings of $7286.02 over the life of the loan.
In other words, paying an extra $1204 principal saved me $7286 in interest. It would also reduce my total loan payments by 1 year, because I moved down 12 months on the amortization table.
An alternative: Let's say you can't afford to pay that much extra principal each month. If you move down the amortization table one extra month, and pay just that amount of extra principal, you would cut your total interest (about) in half, and cut the loan payoff time in half. In this example you would reduce the loan from 25 years to 12.5 years, and reduce your total interest from $131,542.40 to (about) $65,771.20 - a huge savings!!
CAVEAT: You must still make monthly loan payments, even if you pay off some principal early. So you should incorporate extra principal reduction strategies into your overall cashflow budget. But the earlier you reduce your principal, the better.
Using a spreadsheet, you can quickly create an amortization table for any principal amount, interest rate, payment amount or time factor. With a spreadsheet you can quickly see how different interest rates and payment schedules can effect your personal finances. You can use it for credit cards as well. The same concepts apply.
Preparing and using an Amortization Table, year-end balances and adjusting journal entries
On April 1, 2005, Mike's Bikes, Inc. signed a 5-year, $50,000 note payable to 6th National Bank in conjunction with the purchase of equipment. The note calls for interest at an annual rate of 8%, with payments of $ 1,013.82 per month starting May 1, 2005. The note is fully amortizing over a period of 60 months. The bank sent Mike an amortization table showing the allocation of monthly payments between interest and principal over the life of the loan. A small part of this amortization table is illustrated below.

In Chapter 7 we prepared a Bank Reconciliation to dertermine the correct Cash account balance. We also entered journal entries to correct any errors and journalize any unrecorded transactions.
In Chapter 10 we are going to verify the correct account balances for Notes Payable and Interest Payable, that is, the balance these accounts should be as of year-end on December 31. This is one of our standard and ordinary year-end procedures.
We determine correct loan and interest payable balances by creating an amortization table. We will write adjusting entries to bring the account balances into agreement with the amortization table.
Let's look at some journal entries over the life of a loan and see how they relate to the amortization table.
Journal entry to record the original note payable of $50,000 on April 1, 2005. We have increased Cash (Debit) and increased Notes Payable (Credit). No interest has accrued yet. Interest is related to time, so at least one day must pass before we can calculate (accrue) interest.
Date Account Debit Credit Apr-1 Cash $50,000 Notes Payable $50,000
To record 8% 60-month note with 6th National Bank
Monthly payments and principal balances

Interest calculation Beginning Balance * Annual Interest Rate * Time Factor $50,000 * 8% * 1/12 = $333.33
Principal payment = Payment amount - Interest $1,013.82 - $333.33 = $680.49
Principal balance reduction Beginning Balance - Principal payment = Ending Balance $50,000 - $680.49 = $49,319.51
Journal entry to record the first monthly payment on this note, May 1, 2005, payment 1 from the amortization table above.

Date Account Debit Credit May-1 Notes Payable $680.49 Interest Expense 333.33 Cash $1013.82 To record monthly note payment for May.
Balances at December 31, 2006 (year end)
Making Year-End Adjusting Journal Entries Adjusting journal entries should be made to bring account balances to the correct amount before preparing financial statements. The Books are not always correct or accurate. This situation needs to be corrected at the end of the year, or anytime we need to prepare Financial Statements
At the end of each year we organize our adjusting entries on a Working Trial Balance (WTB) before preparing financial statements. You can see an example of the WTB in Comprehensive Problem 1, in your text. Let's look at an example of year-end adjusting entries.
Example - adjusting Notes Payable at year-end
Assume the following: We look at the WTB and see that the loan balance is recorded as a credit balance of $ 44,329.16. We compare this with our amortization table and see that the correct balance should be a credit balance of $ 44,427.38. We need to make an adjusting entry to bring the books to the correct balance.
In this case we need to credit Notes Payable for $ 98.22 to bring the books into agreement with the amortization table. In some cases we would have to debit Notes Payable. When do you think that would be the case? If an amortization table was used for each monthly loan payment, the books should agree with the amortization table, and no adjusting entry would be needed in that case.
What account should we debit? We must review the related journal entries for the year and see which accounts were debited and credited each month. In most cases we will make the adjustment to the Interest

Expense account (look at the monthly entries above). In some cases we may find that a different account was used by mistake. We would correct that error as well, when making the year end adjustments. Let's assume that the only two accounts effected in this example are Notes Payable and Interest Expense. The adjusting journal entry would be.
Date Account Debit Credit Dec-31 Interest Expense $ 98.22 Notes Payable $ 98.22 To adjust Notes Payable to agree with amortization table
Proof:
Debit CreditNotes Payable balance 44,329.16Adjustment 98.22
Corrected NP balance 44,427.38Balance per amortization table 44,427.38
Difference 0
The same approach can be used to reconcile and adjust Interest Expense. But generally speaking we are more concerned with having the correct Notes Payable balance on the balance sheet.
Large businesses record transactions daily, sometimes in Real Time, as they happen. Smaller businesses may record transactions less frequently, perhaps at the end of the day, week or month. Bookkeepers often have to make estimates, especially when they don't have enough information to write a correct entry. This is common in the business world.
Here's a common example, and one I see on a regular basis as an accountant and tax preparer. A client or their bookkeeper records a loan payment as a debit to "Loan Payment" and a credit to "Cash." You should know by now that accountants don't use an account called "Loan Payment." We record a loan payment with debits to Interest Expense and Notes Payable and a credit to Cash, as shown in the examples above. To correct the bookkeeper's error we would write an adjusting entry to debit the correct accounts and bring the "bogus" account to a zero balance.
Present Value If you owe me $1000 I would like to have it paid as soon as possible. I am losing the use of my money as long as you owe me.
If I fall on hard times I might prefer to get my money paid back sooner, rather than later, because I need the money now. I might be inclined to settle for less than the full amount of the debt, in order to get the cash I need as soon as possible.
Let's say I could earn 10% interest if I had the money you owe me. In one year I would lose:

$1000 x 10% x 1 = $100 interest
if you paid me back now I could accept
$1000 - $100 = $900
Investing that money in an interest bearing account, which compounds daily (typical bank method), the $900 would grow to $1000 in a year. I would be in the same position at the end of a year, either way. But one way I have my money available in case I need it, which may be preferable.
The long and short of this story is simple. Money has a value, over time. It can be calculated fairly easily. If we don't have our money, we lose the use of it. Having money now is better than having it in the future, because I can put it to better use if it is available to me.
The business world accepts these simple facts about money, and business managers assume that interest should be earned or paid whenever appropriate in the situation. Federal tax law mandates that interest be charged where appropriate. Zero interest loans are not recognized for federal tax purposes.
Contingencies A contingent situation is one that may arise in the future, based on some past event. For instance, if I sell lawnmowers one of them might break in the warranty period, and I will have to replace it. The warranty claim will arise in the future, from a sale made today.
There may be contingent gains or losses. Contingent gains are ignored until they are finalized. Contingent losses are recognized as soon as they can be identified and measured.
GAAP places a couple of requirements on contingent losses. They should be reported in the financial statements if they meet BOTH of two criteria: 1) the loss is probable, 2) the amount can be reasonably estimated.
It must also be a material amount, in order to have a reportable effect on the financial statements. Some are just a normal part of business, called general business risk, and are not reported. For instance, we all know that airplanes can crash. Airlines don't consider this a reportable contingency, because it is impossible to predict the occurrence or amount of loss in advance.
On the other hand, the company may be involved in a lawsuit. Their attorney advises them that they will probably lose, based on other cases and the probable loss will be $100,000. The loss is probable, and the amount can be reasonably estimated. The loss would be entered into the books, with a journal entry, and disclosed in the financial statements.
© 1999-2006 Copyright Malcolm E. White, Fulton, Missouri, USA For personal educational use only. All rights reserved. No part of this tutorial may be reproduced or stored in any way without permission.

Chapter 11 Stockholders' Equity
About ACCT 281 - Managerial Accounting Managerial Accounting is very different from Financial Accounting. There you learned about the overall framework of accounting, and how to prepare financial statements for investors and other people outside the company. Managerial Accounting will focus on preparing financial information for Managers who are inside the company. Their needs are different than the general public's, and Managers are entitled to access information that is confidential.
In this course, and in the legal and business world in general, Managers (or Management) are viewed as a special group of people. We will view them both as a "whole" and as individuals. They are employees of the company, and they are the ones in charge of running a company and making daily, mission-critical decisions that effect the very life of the company.
Because of their position in a company, Management can either act to benefit the company and it's owners or they can undermine the company. We expect the former, and cringe at the latter. The financial collapse of Enron is a recent example of a group of Managers who put their own personal gain above their obligation to the stockholders and public alike. It was the 7th largest company in the US at the time. Thousands of employees people lost their entire retirement fund, and thousands of other investors lost their entire investment.
Each week we will learn to use new managerial tools. Each one is a little different, but when you are done you will have many useful tools for business decision-making. After all, a carpenter would use a hammer to drive a nail, and a screwdriver to install a screw. OK, I know a few that would use a hammer to drive a screw but you get the idea! ;-)
Let's put it this way: you can do more with a full box of useful tools. Fair enough? So each week we will learn to use some new ones, or find new and different uses for one's we've learned about earlier.
Chapter 11 is the first of two chapters on stockholders’ equity. It deals with topics related to paid-in capital of a corporation. Issues relating to retained earnings is covered in Chapter 12. The advantages and disadvantages of the corporate form are reviewed in detail, and the distinctions between public and closely held corporations are explained. An extensive discussion of the formation of a corporation highlights the rights of stockholders and the roles of corporate directors and officers.
The treatment of accounting procedures regarding paid-in capital concentrates on the issuance of capital stock and the stockholders’ equity section of the balance sheet. The concept of par value is explained in detail, as is additional paid-in capital. The introduction of preferred stock leads to more complex illustrations of the stockholders’

equity section. Preferences with respect to dividends and assets are explained and illustrated. Call and conversion features of preferred stock are also introduced. Other topics dealing with capital stock that are covered include issuance for assets other than cash, donated capital, and stock subscriptions.
The calculation of book value per common share is explained and illustrated before attention turns to factors concerning market values. The significance of market price to the issuing corporation is contrasted to its significance to the investor. We then explain the roles of interest rates and investor expectations in the determination of market prices.
Since stock splits and treasury stock transactions impact the presentation of paid-in capital on the balance sheet, they are also introduced in this chapter. Journal entries to record both the purchase and reissuance of treasury shares are provided. We explain and emphasize that profits and losses on treasury stock transactions are not recognized.
Fiduciary Responsibility
People running a business have a fiduciary responsibility to the owners of the business. That is a legal term that basically means a company's managers must act in a responsible manner with the company's money and business affairs. It also means that Management must keep records and be able to show owners whether the company is profitable (Income Statement), it's financial position (Balance Sheet), how much of the profits have been paid out to owners, and how much more they might be entitled to (Statement of Retained Earnings).
Management is not supposed to treat a company's funds like their (Management's) own. Management is also not supposed to maniuplate funds and resrouces for their own personal benefit or conduct the company's business affairs in such a manner as to defraud the owners.
We see several recent instances of Management fraud in cases such as the Tyco, Enron and Worldcom bankruptcies. The Securuties and Exchange Commission (SEC) is now enforcing new, tougher laws that carry substantial jail sentences for Managment fraud. Company CEOs, Presidents, Vice-Presidents, CFOs, and other managers involved in fraud may have to pay substantial money damages as well as jail terms under theSarbanes-Oxley Act. The Sarbanes-Oxley Act adds new provisions to the Securities Act of 1933 and the Securities Exchange Act of 1934. These two Acts embody much of the federal law regulating the sale and issue of all investments (in both public and private transactions) and the activities of stock markets.
Equity versus Debt
Equity is Ownership in a company.
Debt represents all liabilities, bills and money owed by a company, including bank loans and mortgages.

The Accounting Equation is Assets = Liabilities + Owners' Equity
As we see by this equation, all assets are financed by total equity and debt.
Banks and other lenders expect the owners to take most of the risk in a business. Banks may be willing to lend a corporation some money, but only after stockholders have put in their share first.
Banks generally lend long-term money for long-term assets. This includes mortgage loans for land, buildings and equipment. The asset is pledged capital against the loan, so the bank can take the property back in the event the loan payments aren't made. This further limits the bank's risk of loss.
But, banks generally don't lend long-term money for short-term needs. Short term needs include daily operating expenses, inventory, payroll, insurance premiums and the like. Loaning long-term money for short-term needs is very risky for a bank. They have no collateral to repossess if the corporation defaults on the loan.
Short-term money comes from stockholders, who must take the greatest risk.But in exchange for taking the risk, stockholders are also entitled to benefit from the growth and earnings of the company for years to come. Some companies fail and the stockholders lose their entire investment. But other companies are extremely successful and the financial reward to stockholders can be huge.
Creating a corporation and issuing stock
The life of a corporation starts when the Organizers file an application with theSecretary of State, and pay a fee. The application contains the Articles of Incorporation and asks the State to authorize the company to issue stock.
Authorized, Issued, Outstanding and Treasury stock Authorized - The Secretary of State authorizes a corporation to issue shares of stock. This determines the total number of shares that can be issued, and the par value per share.
Issued - Once a corporation sells a share of stock to a stockholder, that share is issued. A share can be issued only once by the corporation, but it can be traded any number of times among shareholders and investors. Trading is generally done on a public stock market, and transactions go through a stock broker.
An Initial Public Offering (IPO) is the sale and issue of new stock, usually by a new corporation. After the IPO all future trading will take place on a stock market, with shares being traded amoung investors. After the IPO, the corporation is essentially out of the picture, when it comes to stock market activities. The corporation receives money only in the IPO.
Outstanding - After being authorized and issued, the total number of shares held by

stockholders is called outstanding. Dividends are paid on outstanding shares only.
Treasury stock - Sometimes a company buys its own stock back from stockholders. This stock is held in the treasury (along with all the gold and crown jewels :-). No dividends are paid on treasury stock. Treasury stock can be held indefinitely, resold at any time, or retired. Retired stock is permanently removed from future sale and dividends.
A treasury stock journal entry includes a debit to the treasury stock account. It appears as a negative amount in the stockholders' equity section of the balance sheet.
Buying treasury stock reduces the number of shares outstanding. This has several effects. Reducing the number of shares increases Earnings Per Share (EPS). In return the stock's market price generally goes up, or at least holds steady in declining economic times. Since fewer shares are outstanding it also reduces total dividends.
An example: XYZ, Inc plans an IPO. The Secretary of State authorizes them to sell 1,000,000 shares of $1 par common stock. Through a stock market the company offers 750,000 shares for sale to interested investors. They hold back 250,000 shares from issue, because these may be needed later for employee stock option plans. Later that year the corporation decides buy back 50,000 shares that were previously issued.
authorized issued treasury outstandingAuthorized 1,000,000 0 0 0Sold in IPO 1,000,000 750,000 0 750,000Bought Treasury 1,000,000 750,000 (50,000) 700,000
Common and Preferred Stock
All corporations must have one class of voting common stock. Owners of the voting common stock have the right to elect the board of directors and vote on important matters that affect stockholders. They also have the right to receive unlimited dividends and benefit from unlimited capital growth.
Preferred stock is optional. Preferred stock usually carries certain benefits not available to common stockholders. Preferred stockholders generally receive dividends before common stockholders. In the event the corporation is liquidated, the Preferred stockholders are in line ahead of Common stockholders. Despite the benefits of Preferred stock, there are also limits on dividends and there is little or no capital growth potential for Preferred stock.
We follow the same basic rules to record both Common and Preferred Stock transactions.
Par and No-par stock

Par refers to a set amount of money, which is the underlying amount of Capital attributed to each share of stock. It can be any dollar amount the Corporation chooses. Par and No-Par stock rules vary from state to state. The use of these terms is a matter of law. Some states don't allow No-Par stock.
Par value is often used to assess annual corporate franchise fees. The francise fees allow a corporation to be in good standing and continue to operate legally.
Corporations often distribute money to Stockholders, in the form of Dividends and other payments. In some states the Par value limits the amount that can be paid out to Stockholders. Those laws ensure that the Corporation does not deplete all it's capital resources. Not all states allow No-Par stock to prevent corporations for depleting their capital by paying excess Dividends. You need to check the laws in your state to know how corporations are organized where you live.
Selling Par Stock
A corporation raises money by selling stock. Corporations must sell at least one class of Common stock at the initial capitalization. This creates a group of owners who vote to elect a Board of Directors. The Board then hires a President or CEO, who heads the company and authorizes all further activities of the corporation.
Par stock is recorded at its par value in the stock account.
Record the Sale of 100 shares of $1 par common stock, at par ($1 per share). Selling price is $1 per share
General Journal
Date Account Debit Credit Cash 100 Common Stock 100
To record the sale of 100 shares of $1 par common stock at par.
Record the Sale of 100 shares of $1 par common stock, at a premium. Selling price is$5 per share.
General Journal
Date Account Debit Credit Cash 500

Common Stock 100 Additional Paid-in Capital 400
To record the sale of 100 shares of $1 par common stock at $5 per share
The Stock account (Common Stock in this case) is always credited for the amount of Par only.Any premium above par is credited to a different account. In this case I used the title Additional Paid-in Capital, but some companies and textbooks use other terms to mean the same thing.
[Quick check -- what term does your textbook use for Additional Paid-in Capital?]
Selling No-Par Stock
When a company uses No-Par stock, they omit the Additional Paid-in Capital account entirely.
Record the Sale of 100 shares of No-Par common stock for $5 per share.
General Journal
Date Account Debit Credit Cash 500 Common Stock 500
To record the sale of 100 shares of no-par common stock at $5 per share.
Although No-Par stock is easier to record, not all states permit this type of stock. All stock transactions should follow one of the formats above, which much match the type of stock being sold.
In some states a corporation may have par, no-par and preferred stock all at the same time. You need to check with state laws to see what is permitted where you live.
Record the Sale of 10 shares of $100 par, 8% cumulative preferred stock for $105 per share.
General Journal
Date Account Debit Credit Cash 1050
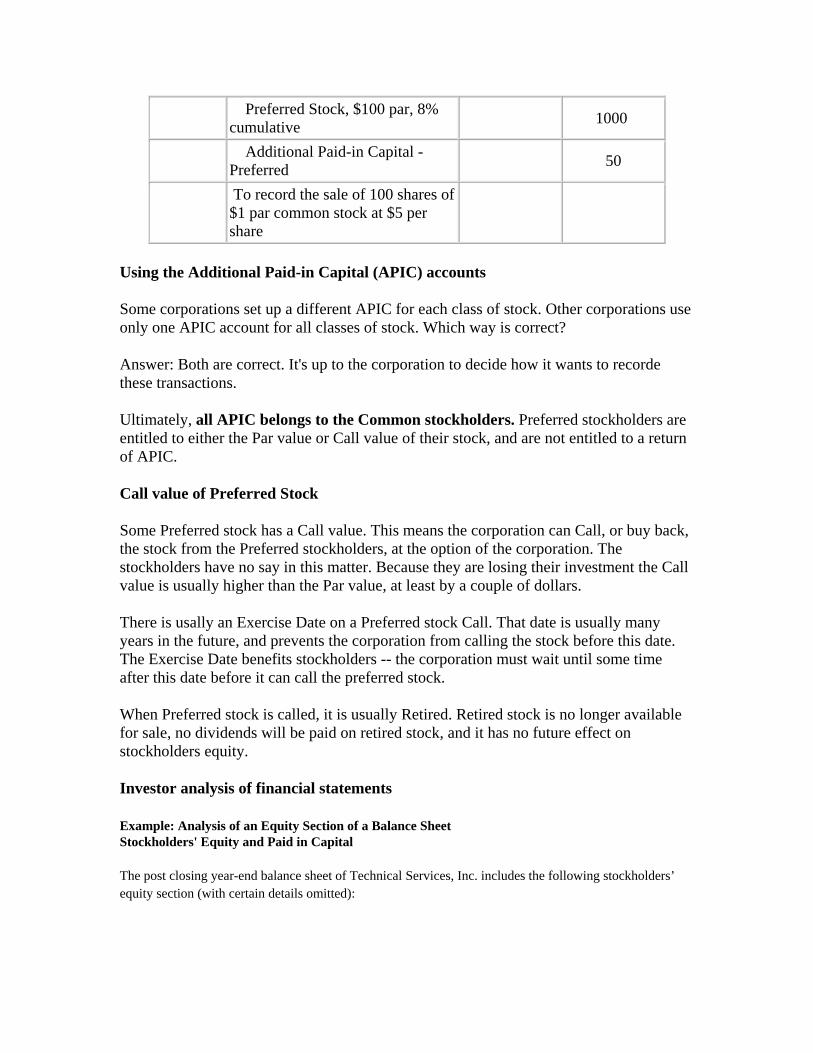
Preferred Stock, $100 par, 8% cumulative 1000
Additional Paid-in Capital - Preferred 50
To record the sale of 100 shares of $1 par common stock at $5 per share
Using the Additional Paid-in Capital (APIC) accounts
Some corporations set up a different APIC for each class of stock. Other corporations use only one APIC account for all classes of stock. Which way is correct?
Answer: Both are correct. It's up to the corporation to decide how it wants to recorde these transactions.
Ultimately, all APIC belongs to the Common stockholders. Preferred stockholders are entitled to either the Par value or Call value of their stock, and are not entitled to a return of APIC.
Call value of Preferred Stock
Some Preferred stock has a Call value. This means the corporation can Call, or buy back, the stock from the Preferred stockholders, at the option of the corporation. The stockholders have no say in this matter. Because they are losing their investment the Call value is usually higher than the Par value, at least by a couple of dollars.
There is usally an Exercise Date on a Preferred stock Call. That date is usually many years in the future, and prevents the corporation from calling the stock before this date. The Exercise Date benefits stockholders -- the corporation must wait until some time after this date before it can call the preferred stock.
When Preferred stock is called, it is usually Retired. Retired stock is no longer available for sale, no dividends will be paid on retired stock, and it has no future effect on stockholders equity.
Investor analysis of financial statements
Example: Analysis of an Equity Section of a Balance Sheet Stockholders' Equity and Paid in Capital
The post closing year-end balance sheet of Technical Services, Inc. includes the following stockholders’ equity section (with certain details omitted):

Stockholders’ equity: 6% cumulative preferred stock, $100 par value, callable at $102, 100,000 shares authorized $2,400,000
Common stock, $2 par value, 2,000,000 shares authorized 2,200,000
Additional paid-in capital: Common stock 1,485,000
Donated capital 410,000
Retained earnings, end of year 3,470,000
Total stockholders’ equity $9,965,000
Instructions From this information, compute answers to the following questions:
a. How many shares of preferred stock have been issued?
Recorded Par value of all preferred stock outstanding $2,400,000
Divided by: Par value per share of preferred stock $100
Number of shares of preferred stock outstanding [2,400,000 / 100] 24,000 shares
[Note: Preferred stock usually has a par value of $100 per share. In this case there is no additional paid-in capital associated with preferred stock.]
b. What is the total amount of the annual dividends paid to preferred stockholders?
Dividend requirement per share of preferred stock ($100 x 6%) $6 per share
Times: Number of shares of preferred stock outstanding (from part a) 24,000
Annual preferred stock dividend requirement [24,000 * $6] $144,000
c. How many shares of common stock are outstanding?
Recorded Par value of all common stock outstanding $2,200,000
Divided by: Par value per share of common stock $2
Number of shares of common stock outstanding [2,200,000 / $2] 1,100,000 shares
[Note: this company has no Treasury stock. Treasury shares would be sutracted from total shares, but only when they are present.]
d. What was the average issuance price per share of common stock?
Recorded Par value of all common stock outstanding $2,200,000

Plus: Additional paid-in capital: Common stock 1,485,000
Total issue price of all common stock $3,685,000
Divided by Number of shares of common stock outstanding (from part c) 1,100,000
Average issue price per share of common stock [$3,685,000 / 1,100,000] $3.35 per share
[Note: this company has recorded additional paid-in capital on common stock. At least some of the stockholders paid a price greater than par value for their shares. Since stock prices tend to fluctuate, this would be a typical situation for most corporations.]
e. What is the amount of legal capital?
Par value of preferred stock issued $2,400,000
Plus: Par value of common stock issued 2,200,000
Total legal capital $4,600,000
[Note: Legal capital is the total of par value of all shares issued. Legal capital laws and requirements vary from state to state. Check with the Secretary of State to find out the legal capital requirements in your state. ]
f. What is the total amount of paid-in capital?
Total Stockholders Equity $9,965,000
Less: Retained earnings 3,470,000
Total paid-in capital $6,495,000
[Note: Paid-in capital represents all amounts paid by stockholders to the corporation in exchange for stock. Donated Capital is also called Contributed Capital. GAAP requires us to include Donated Capital in the computation of paid-in capital. See the note below on Donated Capital.]
g. What is the book value per share of common stock? (Assume there are no dividends in arrears.)
Total stockholders' equity $9,965,000
Less: Call value of Preferred stock [$102 * 24,000 shares] 2,448,000
Total Book Value belonging to common stockholders $7,517,000
Divided by number of common shares outstanding (from part c) 1,100,000
Book value per share of common stock, rounded to nearest cent $6.83
[Note: Book Value is an artificial amount. It merely represents the amount of value due to the common stockholders, divided by the number of common shares outstanding. Call price of preferred stock represents the amount that would be paid to buy out preferred stockholders.]

h. Dividends on common stock Assume that retained earnings at the beginning of the year amounted to $745,000 and the net income for the year was $3,600,000. What was the dividend declared during the year on each share of common stock?
Retained earnings, beginning of year $745,000
Add: Net income for the year 3,600,000
Subtotal 4,345,000
Less: Retained earnings end of year 3,470,000
Total dividends paid during the year 875,000
Less: Dividends on preferred stock (part b) 144,000
Total dividends due common stockholders $731,000
Divided by: Number of common shares outstanding (part c) 1,100,000
Dividends per share of common stock outstanding, rounded $ .6645
[Note: This part simply follows the general format of a Retained Earnings statement. Accountants generally carry Dividend and EPS calculations out to 4 decimal places, for greater accuracy. Most publicly traded companies have millions, perhaps even tens-of-millions of shares of common stock. It's easy to see how those 2 extra decimal places can make a big difference in accuracy when you are dealing with many shares of stock. ]
DONATED CAPITAL is a gift of assets to a company, usually by state or local governments, typically to induce a business to relocate to their jurisdiction. Donated Capital belongs to the Common Stockholders, unless otherwise stated in stockholders' agreements.
When calculating part g, you will use the CALL price of preferred stock. If there is no call price, then you will use the par value. But when preferred stock has a call price, that is the amount used, because it is the amount that would be paid to preferred stockholders if the corporation were to call and retire the preferred stock. Aside from this one small point, this problem is essentially the same as the example I provided in the Study Guide for this week.
Non-Cash Stock Transactions Stock must be paid for before it can be issued. It is a violation of law to issue or record stock prior to receiving payment from investors. It's easy to value a stock sale for cash, since the cash paid fixes the actual value of the transaction.
Sometimes stock is issued for something other than cash. Land, buildings, equipment, vehicles or other assets can be exchanged for stock. Shares of one company's stock can also be exchanged for shares of another company. Investments of various types (stocks,

bonds, etc.) may also be exchanged for shares of stock. In some cases, the value of the property given up can easily be determined, making it easy to place a value on the stock transaction.
When a non-cash transaction occurs, we have to take a market value approach, and we try to identify the part of the transaction that has the most widely accepted market value. There is a specific heirarchy accountants must use to determine the overall value of such transactions. We apply the heirarchy in the following order.
1. If the stock being issued is publicly traded, the entire transaction is the market value of the stock given up. We will assign that value to any assets received.
Example: On March 27, 2006 Microsoft Corp. exchanges 100,000 shares of company stock for a piece of undeveloped real estate. What is the value of this transaction?
On March 27, 2006 Microsoft stock sells for $27.25 per share. They give up 100,000 shares, in effect saying "we think the property we are purchasing is worth $2,725,000." [$27.25 * 100,000 shares = $2,725,000]
We assign the market price of Microsoft stock to this transaction, because the stock is heavily traded on global stock markets, and the price is fixed by a very large market of investors. If Microsoft feels that the real estate is worth 100,000 shares, who are we to argue? Accountants just have to record the transaction.We don't have to care if company management is making a good deal or not. But we do assume that the transaction is "fair" and "at arms length" and that neither party is under any particular pressure or duress to enter into this fair market value agreement.
On the other side of the coin -- the seller (now stockholder) must also feel that $2,725,000 is a "fair" price for his/her real estate, or he/she would not have accepted Microsoft's offer. Since the 100,000 shares can immediately be sold on open market for $2,725,000, the seller can convert the shares to cash the same day as the transaction.
Microsoft common stock is $0.00000625 par value per share, so they will record $0.63 in par value, with the remaining recorded as additional paid-in capital, as follows: [$0.00000625 x 100,000 = $ 0.625, rounded to $ 0.63]
General Journal
Date Account Debit Credit Real Estate 2,725,000.00 Common Stock .63 Additional Paid-in Capital 2,724,999.37
To record the issue of 100,000 shares common stock in exchange for unimproved real estate.

This is a rather unusual example because Microsoft's par value is so low. But this is how it's done, regardless of the dollar amounts involved.
2. If the stock being issued is NOT publicly traded, the entire transaction is the market value of the asset received. We will assign that value to any shares of stock issued.
XYZ Corporation is a small private company. It's stock is not sold on a public stock exchange, and there is no ready market for the company's stock at this time. XYZ Corporation agrees to exchange 10,000 shares of company stock for a piece of unimproved real estate. Two independent, certified and licensed appraisers are hired to provide appraisals of the real estate value. The appraisers agree that the real estate has a fair market value in the range of $100,000 to $110,000 at the time of the transaction.
Following the accounting rule of conservatism, we apply the lower of the range of values, or $100,000, to this transaction. We follow the conservatism rule to minimize the effect of making an estimate. If the company stock has a par value of $1 we would record the transaction as follows:
General Journal
Date Account Debit Credit Real Estate 100,000 Common Stock 10,000 Additional Paid-in Capital 90,000
To record the issue of 10,000 shares $1 par common stock in exchange for unimproved real estate.
3. In some rare instances neither of the two approaces above will work, and we have to take a slightly different approach. We still need to approximate true market valueof the transaction, since that is always considered the fair approach.
Assume ABC Corporation is not publicly traded. They agree to exchange 5,000 shares of company stock for a piece of unimproved real estate. The real estate is in an area that is facing economic downturn in the real estate market, and has been available for sale for many years, with no interested buyers or offers. Appraisers are reluctant to place a market value on the property.
After updating and analyzing the company's books, the accountants determine that ABC Corporation's stock has a Book Value of $2.10 per share. We seldom use book value for

any calculation, but this is one rare instance where it is used. We place a value on the transaction of $10,500 [5000 shares * $2.10]. IF the par value is $1 per share, we record the transaction as follows.
General Journal
Date Account Debit Credit Real Estate 10,500 Common Stock 5,000 Additional Paid-in Capital 5,500
To record the issue of 5,000 shares $1 par common stock in exchange for unimproved real estate.
In this case, the corporation is willing to give a share in the company equal to $10,500 in exchange for the real estate. This represents a future interest in profits and ownership to the person selling the property. The new stockholder believes the value of the land is worth $10,500 since he/she accepts the offer under these terms. Both parties will apply the same value to the transaction.
© 1999-2006 Copyright Malcolm E. White, Fulton, Missouri, USA For personal educational use only. All rights reserved. No part of this tutorial may be reproduced or stored in any way without permission.

Chapter 12 Income and Changes in Retained Earnings
Retained Earnings Dividends Investing Stock Price Income Statement
Irregular Items Net of income taxes Discontinued Operations Extraordinary Items Accounting Changes
Earnings Per Share Preferred Dividends Cash Dividends Stock Dividends Prior Period Adjustments
About ACCT 281 - Managerial Accounting Managerial Accounting is very different from Financial Accounting. There you learned about the overall framework of accounting, and how to prepare financial statements for investors and other people outside the company. Managerial Accounting will focus on preparing financial information for Managers who are inside the company. Their needs are different than the general public's, and Managers are entitled to access information that is confidential.
In this course, and in the legal and business world in general, Managers (or Management) are viewed as a special group of people. We will view them both as a "whole" and as individuals. They are employees of the company, and they are the ones in charge of running a company and making daily, mission-critical decisions that effect the very life of the company.
Because of their position in a company, Management can either act to benefit the company and it's owners or they can undermine the company. We expect the former, and cringe at the latter. The financial collapse of Enron is a recent example of a group of Managers who put their own personal gain above their obligation to the stockholders and public alike. It was the 7th largest company in the US at the time. Thousands of employees people lost their entire retirement fund, and thousands of other investors lost their entire investment.
Each week we will learn to use new managerial tools. Each one is a little different, but when you are done you will have many useful tools for business decision-making. After all, a carpenter would use a hammer to drive a nail, and a screwdriver to install a screw. OK, I know a few that would use a hammer to drive a screw but you get the idea! ;-)
Let's put it this way: you can do more with a full box of useful tools. Fair enough? So each week we will learn to use some new ones, or find new and different uses for one's we've learned about earlier.
In week 1 we will study the Income Statement in more detail. In week 2 you will learn how to analyze and interpret financial information. After that, the remaining 6 weeks will deal with the business of management. You will learn some important tools managers use to make their business run better, be more efficient and more profitable.
Chapter 12 expands on the Income Statement, and adds some new sections to include three special situations that are presented separately in the Income Statement. It also introduces Earnings Per Share, which is a required disclosure under GAAP.
You learned about the Income Statement in Accounting I. What you learned was OK at that level of learning. But it does not entirely comply with GAAP. This chapter will show you how to prepare an Income Statement that is fully in compliance with GAAP. This is very important for managers; a company's financial statements are Management's responsibility!
In this course we will assume that all companies we study are publicly traded (sell their stock on a public
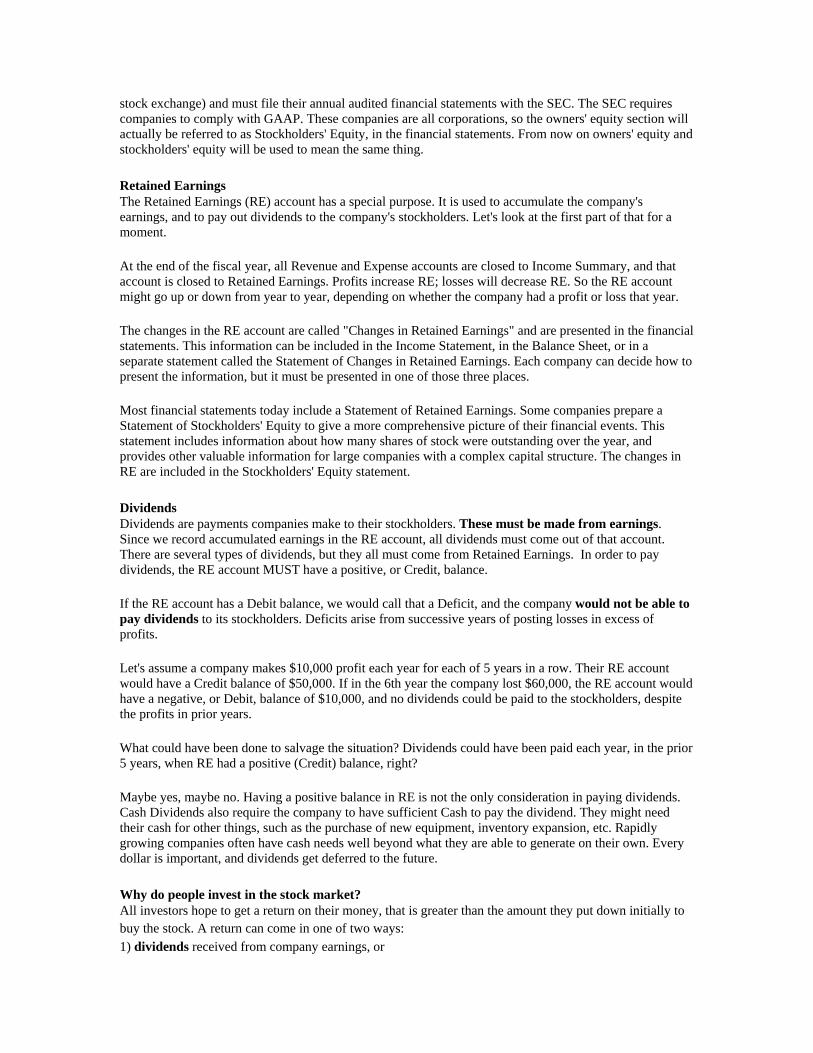
stock exchange) and must file their annual audited financial statements with the SEC. The SEC requires companies to comply with GAAP. These companies are all corporations, so the owners' equity section will actually be referred to as Stockholders' Equity, in the financial statements. From now on owners' equity and stockholders' equity will be used to mean the same thing.
Retained Earnings The Retained Earnings (RE) account has a special purpose. It is used to accumulate the company's earnings, and to pay out dividends to the company's stockholders. Let's look at the first part of that for a moment.
At the end of the fiscal year, all Revenue and Expense accounts are closed to Income Summary, and that account is closed to Retained Earnings. Profits increase RE; losses will decrease RE. So the RE account might go up or down from year to year, depending on whether the company had a profit or loss that year.
The changes in the RE account are called "Changes in Retained Earnings" and are presented in the financial statements. This information can be included in the Income Statement, in the Balance Sheet, or in a separate statement called the Statement of Changes in Retained Earnings. Each company can decide how to present the information, but it must be presented in one of those three places.
Most financial statements today include a Statement of Retained Earnings. Some companies prepare a Statement of Stockholders' Equity to give a more comprehensive picture of their financial events. This statement includes information about how many shares of stock were outstanding over the year, and provides other valuable information for large companies with a complex capital structure. The changes in RE are included in the Stockholders' Equity statement.
Dividends Dividends are payments companies make to their stockholders. These must be made from earnings. Since we record accumulated earnings in the RE account, all dividends must come out of that account. There are several types of dividends, but they all must come from Retained Earnings. In order to pay dividends, the RE account MUST have a positive, or Credit, balance.
If the RE account has a Debit balance, we would call that a Deficit, and the company would not be able to pay dividends to its stockholders. Deficits arise from successive years of posting losses in excess of profits.
Let's assume a company makes $10,000 profit each year for each of 5 years in a row. Their RE account would have a Credit balance of $50,000. If in the 6th year the company lost $60,000, the RE account would have a negative, or Debit, balance of $10,000, and no dividends could be paid to the stockholders, despite the profits in prior years.
What could have been done to salvage the situation? Dividends could have been paid each year, in the prior 5 years, when RE had a positive (Credit) balance, right?
Maybe yes, maybe no. Having a positive balance in RE is not the only consideration in paying dividends. Cash Dividends also require the company to have sufficient Cash to pay the dividend. They might need their cash for other things, such as the purchase of new equipment, inventory expansion, etc. Rapidly growing companies often have cash needs well beyond what they are able to generate on their own. Every dollar is important, and dividends get deferred to the future.
Why do people invest in the stock market? All investors hope to get a return on their money, that is greater than the amount they put down initially to buy the stock. A return can come in one of two ways: 1) dividends received from company earnings, or

2) capital gains from selling the stock at a higher price than what was paid.
Blue Chip company's generally pay regular dividends. But their stock prices are high, and the prices tend to move slowly. If you buy a blue chip stock hoping for capital gains, you might have to wait many years for the price to increase to the desired level.
On the other hand, new, fast growing companies may never pay a dividend, but their stock price can be increasing steadily because the company is growing. In these companies, because of their growth, a share of stock can quickly increase in value. We saw that in the late 1990s with tech stocks. Unfortunately, the tech sector suffered a serious setback by the start of the 21st century.
The moral of this story is... investing in growth stocks is risky business. BUT people do it because the gains can be very impressive. Capital gains can easily be many times what would have been earned in dividends. This provides a tremendous incentive for investors to put their money on risky investments. Each investor has to decide how much or how little risk they are willing to accept in their portfolio.
Gambling casinos are also risky. But that risk is a calculated risk. For any game, we can statistically calculate your chances of winning or losing a particular turn of play. That is never the case in the stock market. You must always be prepared to lose your entire investment in the stock market. The odds are always against you.
Why do company's care about their stock market price? A company sells its stock to the public ONCE and only once, in what is commonly known as an IPO (Initial Public Offering). After that, all trading in the stock is done between individual stockholders, and the company is essentially out of the picture.
So once a company has money in it's hand for the stock, why should it care about the stock market price?
Managers are very sensitive to stock market prices, and the information in their financial statements directly influences stock prices.
Many managers are also stockholders in their company, so they have a personal interest in the stock price. They want their own portfolio to be strong, and the company's stock price will have an impact on them personally.
Other companies have to decide whether to do business with yours, and that's also very important. Right now how many other companies are anxious to do business with Enron, Global Crossing or K-Mart? Not very many, and the number is dwindling.
These companies have all recently filed for bankruptcy, and their stock prices are extremely low. Investors have little trust in the management of these companies and they are voting with their investment dollars. Other companies who sell merchandise to them are cautious, because they're not sure if these companies will be around long enough to pay their bills.
So, stock price sends a message to everyone - investors, suppliers, creditors and bankers, employees - everyone. And the message is "this company is in financial trouble, and the management of this company is not doing a good job."
This is a course in Managerial Accounting, and in Chapters 12 & 14 we will study the Income Statement, learn to analyze information in the financial statements, and gain a better perspective on financial reporting, that can benefit you as both an investor and a manager. It is important to understand why we study this material, it's importance in the investing community, and that this information is the responsibility of a company's management! So it's a good topic for a course in managerial accounting.

Income Statement - Reporting Continuing Operations Continuing Operations - are the "regular" business activities a company is engaged in. It is called "continuing" or "ongoing" operations, because this is the part of the business that will continue into the future.
Investors evaluate Income from Continuing Operations separately from other, irregular items. It is so important that it is listed as a separate item on the Income Statement. This is a required disclosure under GAAP.
Stock market prices are greatly influenced by income from continuing operations. It is part of the calculation referred to as the Price Earnings Ratio, or PE Ratio. It is so important to investors, you will find the PE in the Wall Street Journal, listed next to the stock price for each company. PE ratio isSP/EPS which means:
Current Common Stock Price Per Share Most Current Earnings Per Share
In this chapter, you will learn more about both of these items. You will be preparing an Income Statement and calculating Earnings Per Share as part of your homework assignment in this chapter. EPS is just as it sounds:
EPS = Current Earnings / Number of Shares of Common Stock
We will cover EPS in more detail a little later. The PE ratio is actually a multiple of a company's earnings. In essence, investors are trading stock at a multiple of the expected future earnings of the company. So if a company has a PE of 5, the stock price is 5 times the most recent earnings per share (i.e., the most recent audited financial statements released to the public). A PE of 20 would indicate 20 times EPS. Investors are buying a piece of a company's expected future earnings when they trade based on PE ratio.
Income Statement - Reporting Irregular Items Irregular items are those that are not expected to influence, or be part of, future continuing operations. We report 3 items separately in the Income Statement. These items appear below Operations from Continuing Operations. We also calculate EPS for each of these items, as illustrated in your text in the Tanner Corporation example.
These three items are always presented in the following order. 1) Gain or loss from discontinued operations. 2) Gain or loss from extraordinary items. 3) Cumulative effect of a change in an accounting principle.
Multiple irregular items should be listed separately. They may be subtotaled as a group. You could have two or three extraordinary items, each listed separately, but the group netted as a single dollar amount.
Irregular items are reported separately for several reasons: First, they are not expected to affect future earnings. Investors prefer to evaluate expected future earnings separately, as was discussed above.
Second, they represent major events or decisions by management, and deserve special attention. Investors like to evaluate these decisions separately as well.

Third, this information is considered necessary for the adequate disclosure of important information in the financial statements.
Net of income taxes.... All items in this group are presented net of income taxes, whether they produce a gain or loss. If the item is a gain, the tax expense is deducted from the gain. If the item is a loss, the tax effect will decrease the loss. So, in either case, the tax effect will decrease the item. Gains will be smaller gains, and losses will be smaller losses.
In problems and homework assignments the tax effect will be expressed as either a dollar amount for each item, or as a percentage that can be applied to each item. Either way, you will reduce each item by the amount if its tax effect, and list the dollar amount of the tax effect in parentheses. This is calledparenthetical disclosure - which means it is enclosed in parentheses. Example:
Total Gain .....105,000 Less Tax ........ 31,500 Net Gain ........ 73,500
Extraordinary Items: Gain on condemnation of land (net of $31,500 income tax) .......... $73,500
We don't need to show the total gain, because the reader only has to add the two numbers to get the total:
$73,500 + $31,500 = $105,000
Discontinued Operations A discontinued operation is one that will not continue into the future. The company may just disband part of the business entirely and scrap or sell off the facilities and related equipment and assets. Or it might try to sell that part of the business to another company. Sometimes they might "spin off" part of the business to create a separate segment, which is later sold.
Sometimes one business buys another business, and gets rid of those parts of the new acquisition that don't fit it's overall strategy or profile. For instance, a food producer might buy another company that owns food production facilities and a hotel chain. They might choose to sell off the hotel chain, because it is not within their normal line of business. Since they have expertise in food production, but not in hotel management, this might be a wise decision.
Discontinued operations are reported in two parts: 1) Gain or loss from wrapping up business operations, and 2) Gain or loss from selling off assets.
These are listed separately because they represent two different types of income. The first type of income arises from the continuing the business and earnings process until the assets can be sold off. The second is Capital Gain or Loss which arise from selling business assets.
In many cases a company will continue running the discontinued segment until a new owner can take over. A running business has more value than one that has been shut down, and must be started up again. Keeping a stream of customers coming in the doors, and making a little more money from the operations, will certainly help minimize any loss that might result from the decision, and will increase value to both the stockholders and potential buyers.

Extraordinary Items Some events don't happen very often, and are considered so uncommon that they fall in a special category called Extraordinary Items. This list includes earthquakes, tornadoes, acts of war, and the moon crashing into the earth. OK, the last one's not on the list, I just made that up. But you get the idea.
Extraordinary items must meet two criteria: 1) It must be unusual in nature, and 2) not expected to recur in the foreseeable future.
An item which does not meet both these criteria is considered Unusual, and is listed as part of Continuing Operations. It must meet both to be Extraordinary.
Changes in Law - Changes in law meet both requirements. If a company suffers a loss due to a change in law, that would be extraordinary.
Example: assume Congress outlaws the sale of cigarettes and tobacco products. All companies manufacturing or carrying these products would have an extraordinary loss on the disposal of inventory. .
Condemnations - a city, county or state government may condem property, perhaps for a new roadway, or other public use. Losses resulting for condemnations are extraordinary. However, these losses are usually mitigated because the government will pay for the property. As a result either an extraordinary loss or gain may result from a condemnation (see discussion below).
Acts of War, Civil War, etc. - Acts of war, civil war, and similar events often mean that companies lose property and investments in the countries affected. Local currencies and property values may be devalued or changed as well.
Deciding if an event is Extraordinary is a matter of professional judgement. We do try to keep the list small, and look at each event individually to see if it clearly meets the conditions and criteria for an extraordinary event. Geography may also play a role in making this determination.
Some events are specifically NOT considered extraordinary:
Fires are never considered extraordinary. Fires are a common occurrence, and businesses are expected to carry insurance to protect them against fire loss.
Floods that occur in a flood plain are not considered extraordinary. Floods are expected in a flood plain, and should be insured against. However, if you had a flood on top of a mountain, that WOULD BE extraordinary!!
Strikes are considered a normal business risk. They're also part of having employees, which relates to continuing operations, and are therefore not extraordinary.
Hurricanes in Florida are not considered extraordinary, because they are bound to happen in the foreseeable future. However, a hurricane in Missouri would be an extraordinary event, and a good reason to move to higher ground.
Volcanos in Hawaii erupt on a frequent basis, and are not extraordinary events. People building homes near an active volcano are taking a calculated risk.
Extraordinary Gains? That sounds like an oxymoron, like "definite maybe" or "legally drunk."

[More fun at oxymoron.com]
From our discussion above you might get the idea that extraordinary items are generally losses. And you would generally be right. But sometimes, in rare circumstances, a company may get an insurance or government settlement that exceeds their actual loss. In these cases, they would have an extraordinary gain.
Indemnification against loss The discussion above covers losses from several circumstances. In general accountants (especially outside auditors) expect companies to recognize potential losses, and indemnify themselves against loss by taking out insurance policies.
Changes in Accounting Principle There are a few accounting principles that deal with the value of certain items, such as inventory or long-term contracts. On rare occasion a company will change the way it records these items, and start using a different accounting principle. For instance, it might change from using FIFO to LIFO for inventory valuation.
The old method was used in previous years, and there may be some lingering effect left on the books. In order to change to a new method of accounting you must recalculate the impact on prior years, as if the new method had been used in the past. The net cumulative effect of the change from old to new method is shown in the Income Statement. It is the last item listed before Net Income.
Changes in accounting principle don't happen very often. It is more likely that a company will change from a method that is not approved by GAAP, to a method that is approved by GAAP. In these cases, no adjust needs to be made. One would only report a change from one approved application of GAAP to another.
Let's look at an example of an income statement prepared according to GAAP, with significant subtotals, irregular items and EPS.
These are the account balances for Amalgamated Widget's Income Statement, in alphabetic order. The company has an average tax rate of 30%.
Account Balance Cost of goods sold $ 4,500,000 Effect on prior years' income of change in method of computing depreciation 140,000
Gain on condemnation of land 105,000 Gain on sale of discontinued operation assets 455,000 General and administrative expenses 920,000 Loss from earthquake damage (175,000) Loss on settlement of lawsuit (80,000) Net sales 8,000,000 Operating loss on discontinued operations (210,000) Selling expenses 1,500,000

First we separate the Operating Income and Non-operating items, and calculate the tax effect of each. In this example the lawsuit will be a significant item listed in the Operating section. Lawsuits are commonplace in business, so it is not considered extraordinary. However, because of the large dollar amount, such losses should be shown on their own line. This helps the user to better evaluate future results of operations.
In the example below I have calculated operating income before taxes, then I apply the 30% tax rate.
Operating Income Revenues Net sales $8,000,000 Expenses Cost of goods sold $4,500,000 Selling expenses 1,500,000 General and administrative expenses 920,000 Loss on settlement of lawsuit 80,000 Total expenses 7,000,000
Operating income before taxes 1,000,000 Less: Income tax expense @ 30% 300,000
Operating income $ 700,000
This chart shows one approach to calculating the needed amounts. In all cases the tax effect reduces the amount shown. Gains are made smaller because taxes have to be paid on them. Losses are reduced, because they reduce the total tax espouse; this is called a tax benefit.
Non-operating or Separately-stated Items Discontinued operations Gross amount 30% tax Net of taxOperating loss on discontinued operations (210,000) (63,000) (147,000)Gain on sale of discontinued operation assets 455,000 136,500 318,500 Extraordinary items Gain on condemnation of land 105,000 31,500 73,500 Loss from earthquake damage (175,000) (52,500) (122,500) Accounting principle changes Effect on prior years' income of change in method of computing depreciation 140,000 42,000 98,000

I have shown some significant subtotals in blue because we will use them later when calculating Earnings Per Share. The company had 1,000,000 shares of common stock outstanding all year.
Amalgamated Widgets, Inc. Income Statement
For the year ended December 31, 2001
Net sales $ 8,000,000
Costs and expenses Cost of goods sold $4,500,000 Selling expenses 1,500,000 General and administrative expenses 920,000 Loss on settlement of lawsuit 80,000 Income tax expense 300,000 Total costs and expenses 7,300,000
Income from continuing operations 700,000
Discontinued operations Operating loss on discontinued operations (net of $63,000 income tax benefit) (147,000)
Gain on sale of assets of discontinued operation (net of $136,500 income tax) 318,500 171,500
Income before extraordinary items and cumulative effect of accounting change 871,500
Extraordinary losses Gain on condemnation of land (net of $31,500 income tax) 73,500
Loss from earthquake damage (net of $52,500 income tax benefit) (122,500)
Effect on prior years' income due to change in method of computing depreciation (net of $42,000 income tax) 98,000
Net Income $ 920,500 =======
Earnings per share of common stock Income from continuing operations $ 0.7000
Gain on Discontinued operations 0.1715
Earnings before extraordinary items and cumulative effect of accounting change 0.8715
Extraordinary Gain on condemnation of land 0.0735
Extraordinary Loss from earthquake damage (0.1225)
Cumulative effect of accounting change (gain) 0.0980
Net Income $ 0.9205
=====

The company had 1,000,000 shares of common stock outstanding all year.
Of course, the Income Statement will be modified to show only the items that actually happened in any given year. There is no need to put a line on the statement for something that didn't happen. IF the company has any of these three items, they would be disclosed as shown above. These are called irregular items, because they don't happen very often.
Significant subtotals Several significant subtotals must be included in the income statement. These are indicated in blue in these examples, and in your text on p.502. These subtotals help investors evaluate the company's past performance and predict and estimate it's future prospects.
Earnings Per Share All Income Statements must show Earnings Per Share for each significant subtotal item, starting with Income from continuing operations. The significant ones are the amounts in the far right column in the statement.
Calculating EPS EPS is calculated for common stock only. If a company has both common and preferred stock, any preferred dividends must first be deducted from Income from continuing operations and Net Income, before calculating EPS.
EPS = Earnings available to common stock / Outstanding shares of common stock
An outstanding share is one in the hands of an investor. If a company has Treasury Stock, those share are not outstanding, no dividend is paid on them, and they don't figure in to EPS.
In most cases, the company will have the same number of shares of common stock outstanding all year. In these cases, calculating EPS is an easy job. But in some cases the number of shares outstanding may change during the year. If that happens we use the weighted average method.
Weighted average might be a complex calculation if the company issued new shares during the year, on many different days. The company may also have Treasury stock transactions, which changes the number of outstanding shares. Since dividends are not paid on Treasury stock, these shares are also not included in calculating EPS. Generally this is not the case, but let's look at a simple example of a weighted average.
A company has 100,000 shares of stock outstanding for the entire year. On July 1 it issues an additional 50,000 shares.
Weighted Average Shares of Common Stock
100,000 shares x 6/12 of a year 50,000 150,000 shares x 6/12 of a year 75,000
Weighted average number of shares (add) 125,000
This is a simple example, and you could use a decimal instead of a fraction. You could also have more than two parts, if there was a change in outstanding shares on more than one occasion. If there is no change in outstanding shares, you don't need to do this calculation.
Once you have the number of shares figured out, all you need to do is divide to calculate the EPS for each item in the list above. Your text has a couple of examples of the calculations worked out for you.

Calculating Preferred Dividends Preferred dividends are paid on preferred stock (Pfd) . This type of stock carries special privileges and features. Preferred stockholders are in line for dividends before common stockholders. If all the retained earnings and cash are used up to pay preferred dividends, then there is nothing available for the common stockholders. So we deduct Pfd dividends when calculating EPS on common stock.
It is fairly easy to calculate the preferred dividends. You need to know the number of shares of Pfd stock, and the amount of the dividend, which will always be stated. If the Pfd stock has a dollar amount, that is the dividend to be paid each year, per share. If the Pfd stock has a percentage, multiply the par value per share times the percentage to get the dividend. Here are two examples. Assume the company has 5,000 shares of preferred stock.
$6.25, $100 par preferred stock $7%, $100 par preferred stock Dividend = $6.25 per share $100 x 7% = $7.00 per share dividend
Total = $6.25 x 5,000 = $31,250 Total = $7.00 x 5,000 = $35,000
Types of dividends Cash Dividend - a payment of Cash to the stockholders Stock Dividend - transfer or issue of additional stock certificates to the stockholders Property Dividend - transfer of company property to the stockholders Liquidating Dividend - a return of capital; comes out of paid-in capital, not RE
Cash Dividends Dividends must first be declared by the Board of Directors. Dividends are recorded (entry dated) in the books on the day they are declared. The Board of Directors must examine the Retained Earnings account and determine how much dividends could be paid. In this example, the RE account has a Credit balance of $20,000 so this will the maximum amount of dividends they would be able to declare.
It is unlikely a company would declare all the retained earnings as dividends. As discussed above, they would also have to consider cash needs of the company for the coming months ahead and see if they are able to pay a dividend at all.
Retained Earnings
Date Description Debit Credit Balance Dec-31 (20,000)
Let's assume the Board of Directors declared a $10,000 cash dividend on December 31. It can take a month or more to prepare dividend payments to all stockholders in a large corporation. When dividends are declared, we write a journal entry, as follows:
Date Account Debit Credit

Dec-31 Cash Dividends $10,000 Dividends Payable $10,000
In this example I debited Cash Dividends, to differentiate this type of dividend from other types. Companies often simply debit a Dividends account for all dividend transactions. Either way is acceptable. When the dividend checks are prepared and mailed to the stockholders we record the following entry, to eliminate the payable.
Date Account Debit Credit Jan-31 Dividends Payable $10,000
Cash $10,000
The Dividend accounts are closed to Retained Earnings at the end of the year. Companies also have the option to directly deduct the dividend from Retained Earnings on the day the dividend is declared. Some company's follow this procedure. In that case the first entry would look like this:
Date Account Debit Credit Dec-31 Retained Earnings $10,000
Dividends Payable $10,000
Different textbooks will show these two methods. The company's accounting managers will generally decide which method the company will use. You must always remember that an accounting system is tailored to the needs of the company using it. GAAP deals with disclosure of information in financial statements, not with bookkeeping procedures. Different bookkeeping procedures may be equally acceptable, as long as the financial statements are prepared according to GAAP.
Stock Dividends Stock dividends are paid for various reasons. Sometimes they are paid because the company has adequate Retained Earnings, but not the cash to make a dividend payment. Stockholders are often very happy to have more shares of stock, rather than money. Stock dividends are not taxed until the stock is sold; tax on cash dividends must be paid in the year the dividend was received. So taxes on a stock dividend become deferred to a future year, which many investors see as an advantage.
Stock dividends are declared in the same way as cash dividends. However, the company is issuing stock, so we will credit the common Stock account, and perhaps the Additional Paid-In Capital (APIC) account. If you're not up to speed on journal entries for stock issues you should review Chapter 11. There is also a good example of these journal entries in Chapter 12, in the discussion of stock dividends.
Stock dividends are directly linked to the market price of the stock. The market value of a stock dividend is transferred from the RE account to the Common Stock and APIC accounts, to record the issuance of the

shares. Let's assume that stock is trading for $25 per share, and has a par value of $1. The journal entry for one share would be:
Date Account Debit Credit Jan-31 Retained Earnings $25
Common Stock $1 Additional Paid-In Capital $24
Of course, you would determine the total number of shares to be distributed, and write a journal entry to match. If 1000 shares were to be distributed, you would multiply each of the numbers above by 1000.
[Note: the book illustrates how to do a stock dividend, where the stock is issued at a future date. In that case a Stock Dividend to be Distributed account is used, similar to the use of Dividends Payable in a cash dividend situation. This would be normal, and my illustration above is meant to show you how the RE and stock accounts are linked, and how the dollars are split in the transaction.]
Prior Period Adjustments A prior period adjustment is one that relates to a previous fiscal year that has already been closed - closing entries have been posted, and financial statements have been prepared and released. Sometimes after the year end we discover a material error that would have effected net income of the prior period. When this happens, we make an adjusting journal entry to Retained Earnings to correct the problem.
We have to report the situation in the financial statements and this is done by showing an adjustment to the beginning balance of Retained Earnings. After RE has been restated, the current year's activity is reported on. Your textbook has a good example of how this is shown in a Statement of Retained Earnings.
© 1999-2006 Copyright Malcolm E. White, Fulton, Missouri, USA For personal educational use only. All rights reserved. No part of this tutorial may be reproduced or stored in any way without permission.

Chapter 13 Statement of Cash Flows
The terms "Cash Flow Statement" and "Statement of Cash Flows" are interchangeable.
The Cash Flow Statement is relatively easy to prepare. It is better to use logic and "common sense" to understand what is happening and how information should be presented in this statement.
The Income Statement and Balance Sheet are both prepared using Accrual Accounting. This involves making a combination of adjustments to the books, including accruals, deferrals, apportioning costs such as depreciation, and charging Income with future expenditure such as warranty claims and post-retirement benefits. Every time we make an adjustment in the books and records, the resulting financial statements comply with accrual accounting, but are also farther away from cash accounting.
Before 1987 we prepared a third financial statement called the Statement of Changes in Financial Position. This was generally prepared on a Working Capital basis, but could also be prepared on a Cash Flow basis.
In 1987 FASB mandated the use of the Cash Flow Statement, in place of the Statement of Changes. The Statement of Cash Flows removes all accruals, deferrals and other non-cash adjustments, and provide investors and creditors with information about a company's Sources and Uses of Cash. An Income Statement might show a Profit or a Loss, but that says nothing about how the company's Management managed the company's money.
Today this is more important than every. Managers are frequently caught "cooking the books," hiding losses and liabilities, overstating or understating Income, all for the purpose of influencing the market price of company stock. Managers frequently benefit personally from increases in company stock prices, so there is a high incentive for these people to manipulate information.
The Cash Flow Statement is fairly simple.There are only 3 sections, which report Increases and Decreases in Cash. The sections are always presented in the following order.
Operating Cash Flows - Inflows - Money received from customers for sales of products or services. Outflows - Money paid to suppliers, employees, etc. for normal business expenses.
Investing Cash Flows - Inflows - Money received from selling assets, including land, buildings equipment, stocks, bonds. Money received from loans made to others, such as Notes Receivable.

Outflows - Money paid to purchase assets; and money paid out to make loans to others.
Financing Cash Flows - Inflows - Money received from stockholders purchasing company stock, from bondholders for bonds payable, and money borrowed from banks and other creditors. Outflows - Money paid to stockholders for dividends, to bondholders, banks and other creditors.
The Statement of Cash Flows also reconciles the Cash balance from the beginning to end of the year. The beginning and ending Cash balances can be found on the Balance Sheet.
Direct and Indirect Method There are 2 ways to present the Statement of Cash Flows - Direct and Indirect. Your textbook presents the Direct Method. The Indirect Method is illustrated in the appendix at the end of the chapter. FASB recommends the use of the Direct Method. A recent survey of company shows the following:
Companies using the Direct Method 5% Companies using the Indirect Method 95%
Despite these statistics, most accounting textbooks teach the Direct Method.You should also note that when the Direct Method is used, the statement must also include a supplemental calculation of Operating Cash Flows using the Indirect Method. Accountants should be able to do both methods.
Preparing the Statement of Cash Flows I generally include the cash flow worksheet as part of my 13-column trial balance worksheet. I use the space in the far right side of the trial balance worksheet to analyze cash flows for all accounts. Calculate the difference between the beginning and ending balances for all accounts, and determine if the change reflects an increase or decrease in cash flow. Mark each account with and O for Operating cash flows, I for Investing cash flows and F for Financing cash flows.
Next lay out the general format of the statement on a piece of paper or spreadsheet. I generally identify the Investing and Financing activites first, and put them in the appropriate place. There should only be a few items that fall in these categories. Most of the accounts will be Operating activities. These include all Income and Expense accounts - the majority of accounts on the trial balance.
You may need to look at a few Ledger accounts. For instance, the company may have purchased Land and also sold Land in the same year. The purchases would be outflows of cash, and recorded as Debits in the Land account. Sales would be inflows of cash, and recorded as Credits in the Land account.

Land
Date Description Debit Credit Balance
1/1/04 Beginning balance forward 100,000 3/17/04 Purchase of Land 30,000 130,000 9/12/04 Sale of Land 20,000 110,000
Let's analyze the Land account
Beginning balance 100,000 Ending balance 110,000
Increase in Land 10,000
If the Land was sold and purchased for Cash, there would be a net decrease in Cash of $10,000, but really we have an Outflow of $30,000 for the purchase of Land, and an Inflow of $20,000 from the sale of Land.
Let's assume the Cash account looks like this for these transactions....
Cash
Date Description Debit Credit Balance
- 3/17/04 Purchase of Land (cash outflow) 30,000 - 9/12/04 Sale of Land (cash inflow) 20,000 - [Cash balance is irrelevant]
The Investing section of the Cash Flow statement would look like this:
Investing Cash Flows
Cash Inflows: Sale of Land $20,000 Cash Outflows: Purchase of Land (30,000) Net Cash used for Investing activities $(10,000)

Analyzing the Cash Flow Statement Analyzing cash flows is an important part of financial statement analysis. Here are some important things to look for:
1. There should be a net Increase in Cash from Operating Activities. If operations don't produce positive cash flows, the business will soon be in trouble. Without adequate operating cash flows, the company may have to dip into cash reserves or sell investments to meet regular payment of expenses.
2. If a company shows net Increase in Investing Cash Flows, it means they are selling off assets. That is generally not a good sign. I would also look to see if teh company was posting losses and had negative cash flows from Operating activities. This might indicate that Management is selling off assets to pay bills. More analysis is needed in this case.
© 1999-2006 Copyright Malcolm E. White, Fulton, Missouri, USA For personal educational use only. All rights reserved. No part of this tutorial may be reproduced or stored in any way without permission.

Chapter 14 Financial Statement Analysis
Chapter 14 deals with the analysis of financial statements by investors, creditors and other interested parties. Management is always one of those interested parties, because how others perceive the company will effect their business and stock price.
The financial ratios described in this chapter are used on a daily basis by thousands of investors. There's really nothing difficult about them, and all the information you need is required disclosure in the financial statements prepared under GAAP.
After you complete this chapter you should be able to analyze the financial statements of any company, including all publicly traded companies. Many students use this information to help understand and analyze their company retirement plans. Even if you're not an investor today, chances are that someday you will be. If you already have a portfolio or retirement plan, this information will be extremely valuable to you.
Many web sites are devoted to investing. You can find out more about ratios with a search on the internet.
Investing in the stock market and Evaluating management When investors purchase stock in a company they are investing in future earnings. You can't invest in past income, because it is past. That's like betting on yesterday's horse race or ball game. So all investing is actually a bet on the future prospects of a business.
The PE ratio (Price/Earnings) is a direct reflection of looking to the future. Essentially the PE ratio is a measure of how confident investors are about the future prospects of a business. The higher the PE ratio, the more confident investors are. But only to a certain extent.
Each unit of PE basically represents one year of earnings, paid forward, in advance to purchase one share of stock. So a PE of 5 means investors are willing to pay forward an amount equal to 5 years of earnings to buy a share of that company's stock. A PE of 10 represents buying forward 10 years of earnings. It's common to see PE ratios that range 12-20 years.
The PE ratio is so important that it's listed every day in the Wall Street Journal for every stock they list. So what has that got to do with evaluating management?
There are a number of ratios that can be used to evaluate a company's management. And when investors look at those ratios they decide how good a job management is doing. If the ratios go up, investors are willing to pay more for the stock, resulting in a higher PE ratio. If ratios go down the opposite happens.
Since a PE of 10 represents 10 years forward earnings, you have to feel like management is going to do a good job over the next 10 years to recoup your investment.
How to analyze a financial statement There are a couple of steps, and a caution to observe, when you analyze financial statements. And after you've done an analysis you still have to interpret the meaning of your analysis, and the significance of your analysis. First, the caution...
Several ratios use an average. When an average is used it is a simple average. In all these ratios you will take the balance in an account at the start and end of year, add them together and divide by 2. That's a simple average. For instance, the Receivable Turnover Rate is

Net Sales _ Average Accounts Receivable
Average accounts receivable is:
AR start of year balance + AR end of year balance 2
Some people calculate these using the end of year balance, rather than an average. The textbook shows one possible set of formulae. If you search the Internet you will find many other formulae that can be used to evaluate financial information.
Steps to financial statement analysis All financial ratios and measures use information from the balance sheet and/or income statement. Many of the use either an average, discussed above, or a significant subtotal, such as current assets, quick assets or current liabilities. You should be able to identify and calculate these amounts before beginning.
Current Assets Current assets are those that will be available to conduct business and pay bills in the near future, within the coming year. Long term assets are those that will benefit the company beyond the current year. In a classified balance sheet, the current assets will be subtotaled already.
Current assets consist of: > Cash > Accounts Receivable > Notes Receivable > Short Term Investments > Inventory > Prepaid Expenses
Quick Assets are used to calculate the Quick Ratio. Cash, Accounts and Notes Receivable, and Short Term Investments are quick assets.
Current Liabilities Current liabilities are those that will come due within the next year. They are matched to current assets, because the money generated from current assets will pay the current liabilities.
Current liabilities consist of: > Current portion of Notes Payable > Accounts Payable > Accrued Expenses Payable (taxes, interest, payroll) > Unearned Revenue
In order to calculate ratios you should be able to identify the current and quick assets, and current liabilities in any balance sheet.
Measures of Liquidity Liquidity refers to how quickly a company can turn its assets into cash, and its ability to pay it's current debts on time. Highly liquid assets can be turned into cash very quickly. Some of these are called cash equivalents, because they are very liquid. For instance, a US Treasury bill or note can be converted into cash immediately at almost any bank, so it is considered equivalent to cash.

Other assets can be turned into cash, but more slowly. The company expects to collect its accounts and notes receivable, but that may take 30-60 days, or longer. Inventory takes even longer to turn into money. It could take six months or more to convert inventory into cash, depending on the type of merchandise. Automobiles and jewelry sell slower than eggs and milk.
Inventory Turnover Rate Turnover refers to how often a sales or collection cycle happens in a given year. Let's think about grocery store inventory for a minute. Milk spoils quickly and a grocery store will only stock enough milk to meet its demand for a short period of time, perhaps one week. If they store sells its entire stock of milk each week, we would say that their milk inventory turns over 52 times each year. The number of days sales in inventory for milk would be 7. Let's recap:
Milk inventory: Turnover = 52 times Days in Inventory = 7 days
A company may analyze a single product, like milk, because they have detailed inventory records. The information contained in financial statements relates to the entire inventory. So you, and other investors, can only draw some large, general inferences. However, a few rules of thumb hold true:
> A higher turnover rate is better > Fewer days in inventory is better
These would indicate better inventory management.
caveat - L. a warning as in caveat emptor let the buyer beware
caveat Financial statements don't tell the whole story. A high turnover rate is a good thing, but empty shelves can mean lost sales, and that's a bad thing. Good inventory management means stocking an adequate supply of merchandise to meet demand, but not too much excess.
Inventory is an asset with it's own problems. It must be stored and protected until it is sold. It must often be paid for before it is sold. It can be damaged, stolen or become spoiled or obsolete. These are all risks associated with inventory and the cost of these losses have to be made up from revenues.
Ratios tell part of a story, but not the whole story. How can you answer some of these questions? You would probably have to visit the store on a regular basis, and observe how they handle inventory, note the condition of merchandise, how well the shelves are stocked and tended, and check the dumpsters to see how much spoiled or damaged goods ar being thrown away each week.
Accounts Receivable Turnover Rate AR turnover is similar to inventory turnover. It is the other end of the sales cycle - the collections side. The AR turnover tells us how good a job management is doing collecting accounts receivable. If the company has a 30 day payment policy, their AR turnover rate should be about 12 (once a month), and their number of days in AR should be around 30.
If the turnover rate is too low (days in AR too high), the company is having problems enforcing its credit policies. This is the credit manager's responsibility. The company needs to review its credit policy and start enforcing it. They might also have too many old, uncollectible accounts receivable that need to be turned over to a collection agency.
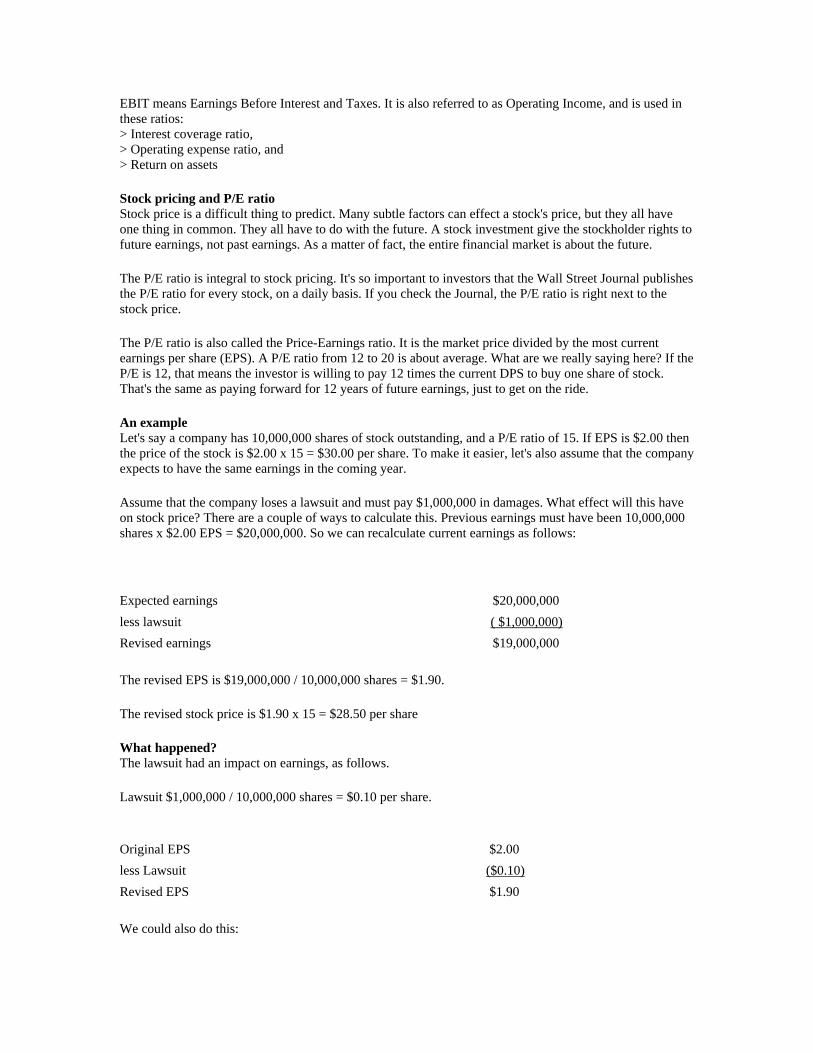
EBIT means Earnings Before Interest and Taxes. It is also referred to as Operating Income, and is used in these ratios: > Interest coverage ratio, > Operating expense ratio, and > Return on assets
Stock pricing and P/E ratio Stock price is a difficult thing to predict. Many subtle factors can effect a stock's price, but they all have one thing in common. They all have to do with the future. A stock investment give the stockholder rights to future earnings, not past earnings. As a matter of fact, the entire financial market is about the future.
The P/E ratio is integral to stock pricing. It's so important to investors that the Wall Street Journal publishes the P/E ratio for every stock, on a daily basis. If you check the Journal, the P/E ratio is right next to the stock price.
The P/E ratio is also called the Price-Earnings ratio. It is the market price divided by the most current earnings per share (EPS). A P/E ratio from 12 to 20 is about average. What are we really saying here? If the P/E is 12, that means the investor is willing to pay 12 times the current DPS to buy one share of stock. That's the same as paying forward for 12 years of future earnings, just to get on the ride.
An example Let's say a company has 10,000,000 shares of stock outstanding, and a P/E ratio of 15. If EPS is $2.00 then the price of the stock is $2.00 x 15 = $30.00 per share. To make it easier, let's also assume that the company expects to have the same earnings in the coming year.
Assume that the company loses a lawsuit and must pay $1,000,000 in damages. What effect will this have on stock price? There are a couple of ways to calculate this. Previous earnings must have been 10,000,000 shares x $2.00 EPS = $20,000,000. So we can recalculate current earnings as follows:
Expected earnings $20,000,000 less lawsuit ( $1,000,000)
Revised earnings $19,000,000
The revised EPS is $19,000,000 / 10,000,000 shares = $1.90.
The revised stock price is $1.90 x 15 = $28.50 per share
What happened? The lawsuit had an impact on earnings, as follows.
Lawsuit $1,000,000 / 10,000,000 shares = $0.10 per share.
Original EPS $2.00 less Lawsuit ($0.10)
Revised EPS $1.90
We could also do this:

Effect of lawsuit per share $0.10 x 15 P/E = $1.50
Original stock price $30.00 - $1.50 = $28.50
If you look over the calculations above, you will see there are several ways to arrive at the solution. They all reflect the relationships between a company's earnings, the number of shares outstanding, and investors' perception of the company's future earnings potential (P/E ratio).
If investors think the company's earning potential is improving they are willing to pay more for the stock, which is reflected in a higher P/E ratio. The opposite is also true. If they think the company's earnings are impaired the P/E ratio will go down. That is a much more complex discussion that we have time for here, but investors look at a large variety of things to determine P/E ratio - strength of the market for the company's product, the quality of the company's management, liklihood of continued business success, etc.
© 1999-2006 Copyright Malcolm E. White, Fulton, Missouri, USA For personal educational use only. All rights reserved. No part of this tutorial may be reproduced or stored in any way without permission.

Chapter 16 Management Accounting
Management Accounting Manufacturing Costs Non-Manufacturing Costs Inventories Unit Product Costs Applying Overhead Overhead allocation methods
Chapter 16 introduces you to some of the basic managerial accounting concepts you will use for the remainder of the course. The introduction to management accounting begins with an overview of the design requirements of a managerial accounting system. The system must allocate decision-making authority over a company's resources. Second, it must furnish the information to support decision-making by managers. Finally, the system must generate the information needed to evaluate and reward performance.
Managers deal with the operations of the business, and with information that is internal to the business. We call this operating information. It involves things like product costing information, payroll information and other sensitive or confidential information. For this reason, operating information is not released to the public, but is used by managers to improve business performance, and ensure the objectives of the company.
Manufacturing costs are first classified into direct material, direct labor and manufacturing overhead. With these definitions established, we introduce the critical distinction between product and period costs. This discussion in turn lays the foundation for introducing the manufacturing inventory accounts: raw materials, work-in-process, and finished goods.
The flow of costs through the inventory accounts is explained with the help of an extended illustration. The example includes a detailed analysis of the process of applying overhead using a predetermined rate. The text explains both the mechanics and the rationale underlying overhead application at this point, and calls attention to the potential weaknesses of volume based applications that will be addressed in later chapters.
The chapter closes with the development of financial statements for a manufacturing company. The schedule of cost of goods manufactured is introduced as a supplement to the financial statements intended to assist managers in evaluating the overall costs of manufactured products.
Management Accounting Management (or managerial) accounting is intended to fulfill a large number of requirements. Financial accounting is intended to meet the needs of outside users of financial information, and follows GAAP. Management accounting is intended to satisfy the various needs of a large group of decision-makers inside the business, and does not follow GAAP.
A single set of financial statements satisfies the requirements of GAAP, but management accounting reports can be tailored for any situation and user. The form and format can vary widely, depending on the type of decision being analyzed.
You first need to learn to use a few basic concepts. After that, those concepts can be modified in an almost infinite number of ways to analyze business information, and make operating decisions.
A company's audited financial statements look backwards in to the prior year or years. But managers have to make decisions today, that affect the present and the future. Financial statements that are a year or more

old are not very useful for the daily decisions managers have to make. They are more interested in current operating information, and projections about the future. They are also concerned with setting goals, measuring progress and achievement, eliminating waste, complying with government regulations, and a much, much more.
Accounting cycles
An accounting system is often organized into accounting cycles. These cycles are connected and interrelated. Costs flow the product costing system as illustrated in your text, and as described below.
The Purchase/Payments cycle includes purchasing raw materials and supplies as needed, and paying the bills when they come due.
The Payroll cycle includes scheduling employees for production and paying them on regular intervals.
The Production cycle includes collecting materials, labor and overhead costs into an inventory cost pool called Work in Process. Once completed the product costs are transferred to Finished Goods inventory until the goods are sold.
Finally in the Sales/Receipts cycle sales are recorded when goods are sold, and Finished Goods costs are transferred to Cost of Goods Sold. Customers are billed and receipts are recorded when received.
Separating the accounting process lets us assign different people to different tasks. Many companies have large Accounts Payable, Accounts Receivable and Payroll departments, not to mention huge Production departments and many sales people. Separating activities into accounting cycles helps us understand and apply managerial controls to these activities.

Accounting Cycles are connected and interrelated.
Manufacturing Costs We study manufacturing environments because they are some of the most complex business environments. What we learn here can easily be transferred to other, less complex, situations. Management accounting is really much easier than financial accounting. We classify all costs as either manufacturing or non-manufacturing.
We separate manufacturing costs into three categories: Manufacturing costs relate to making a product.
Direct Materials (DM) - raw materials and parts, directly traceable to the product. Materials must attach themselves to, and become part of, the finished product to be considered Direct Materials.

Direct Labor (DL) - wages and other payroll costs of the employees that directly work to convert Direct Materials into finished products. These costs are directly traceable to the product.
Manufacturing Overhead (OHD) - all the other costs related to producing products that don't qualify as Direct Materials or Direct Labor. Picture a manufacturing plant and all the costs of the plant. Now subtract DM and DL. Everything that's left is Overhead. These costs are indirectly traceable to the product.
Non-Manufacturing Costs Some costs are specifically not manufacturing costs, and therefore not DM, DL or OHD. These are costs not related to the manufacturing plant or producing the product. The include the following two categories:
Selling Costs The costs associated with selling the product are Selling Costs. These include sales salaries and commissions, advertising, stores and their related fixtures and equipment.
General and Administrative Costs The costs associated with the central management and home office of a company, and general costs of being incorporated, are classified as General and Administrative (GA) costs. This includes buildings, offices, equipment, salaries, etc. that are part of the administrative arm of the business, provided these costs can't be traced directly or indirectly to the manufacturing function.
Period Costs Some costs don't have any future value, and only relate to the current period. These include Selling costs and GA costs. Other period costs include income taxes and interest expense.
Inventories There are three classifications of inventory.
Materials inventory - raw materials and parts used in producing goods
Work in process inventory (WIP)- all partially completed goods, not ready for sale
Finished goods inventory - all completed goods ready for sale
Cost Flow We say that costs "flow" though a company. This means that we collect costs in the books in certain accounts, and transfer those costs to other accounts, in a way that resembles how those costs are actually incurred in the manufacturing process.
In general here is the way costs flow through an accounting system:
Direct Materials > Direct Labor ==> Mfg Overhead =>
Work in Process => Finished Goods=> Cost of Goods Sold
These are the actual accounts that will be debited and credited in a way that approximates the way costs are actually incurred in the production process. These accounts are all debited to increase the account, and credited to decrease the account.

To move costs along we debit the account the cost is moving into, and credit the account the cost is moving from. Total cost increases as it moves along, just like a snowball gets bigger as you roll it around in the snow. As goods move through the manufacturing process they pick up all the related costs along the way. Materials and labor are added as the goods are worked on, and overhead is added along the way.
Let's look at how one unit of product picks up costs in its journey through the production process. Amalgamated Widget, Inc. produces a variety of widgets for home and commercial use. The production manager requisitions raw materials, from the Materials inventory. Materials inventory account is credited and the costs are transferred to the Work in Process inventory account.
Work is started in the shaping and forming department. Labor is added at this point by crediting Direct Labor and debiting Work in Process inventory. After the widgets are formed, they go to the finishing department. The appropriate finish is applied and the finished widget is sent to the packing department, where it is prepared for shipment. Additional Materials and Direct Labor costs are added to Work in Process in the finishing and packing departments.
Overhead is added to the product cost at each stage of the operation by debiting Work in Process inventory and crediting the Overhead account. We will discuss Overhead allocation more in a moment.
At this point the product is complete and ready for sale. The final cost is transferred to the Finished Goods inventory account. When the item is sold the cost will then be transferred to the Cost of Goods Sold account.
The total cost of producing a widget accumulates as the widget moves along though the production process.
Unit Product Costs The word "unit" comes from the Latin unus, meaning one. The Spanish word uno comes from the same Latin root, and also means one. A Unit Cost is the cost of producing one unit of product. We might break that down into its component parts - labor, materials & overhead - perhaps in great detail.
Manufacturing companies usually make a large quantity of products at a time. Each batch of product may be thousands of units. In some cases production is done on an assembly line, and there is little distinction between departments, aside from those arbitrarily determined by management.
Ultimately the company must set a selling price for its goods. Since goods are sold one at a time, the company must determine the total cost of producing a single unit of goods. Unit costs are tracked throughout the production cycle in some accounting systems. In other cases, unit costs are determined at the end of production, after all costs of production have been accumulated and the finished units have been counted.
It is important that you clearly distinguish between unit costs and total costs, in your mind, at all times in this class.
Applying Overhead Overhead consists of a large number of separate costs related to the manufacturing process. They are collected in a single account and allocated to the product cost using what is called an overhead application rate.
The overhead application rate is simply a way to divide the total overhead costs for a year, across all the units of goods produced that year. Here's the formula:

Total Annual Overhead Costs Overhead Cost Driver
The overhead cost driver, is something related to production that can be used to help spread the total cost evenly to individual units of product. Sometimes that is simply the number of units of products produced in a given year. At other times that's not the best measure to use. For instance, hot dogs are produced by the tens-of-thousands per day, packed into boxes and sold by the palette load. The overhead cost applied to one hot dog would be a very small amount, and not very relevant to managers. They will apply overhead costs in a way relevant to the decisions they need to make.
Allocating overhead using labor hours Labor hours are often used as a cost driver, to apply overhead. Total overhead costs are divided by total estimated labor hours to come up with a dollar rate per labor hour. Each time labor is recorded, a corresponding amount of overhead can also be allocated and recorded (transferred to WIP).
Advantages of using labor hours: Tends to be a predictable & steady amount Different pay rates among employees is irrelevant Labor hours are closely related to production, so should be an accurate measure
Let's look at an example. The company estimates it will have 100,000 labor hours and spend $200,000 in overhead costs. The company records 8,300 labor hours this month. Their overhead allocation is:
$200,000 / 100,000 hours = $2 per labor hour x 8,300 hours = $16,600
The company would transfer $16,600 from the Overhead account to Work in Process for the month's production.
Allocating overhead using labor dollars Some very large companies allocate overhead using labor dollars, because they have a large work force, and their total labor dollars tends to be a predictable amount. They may be operating under a labor contract. They may have a large and wide-spread work force.
Overhead costs are allocated in much the same manner as above, except that labor dollars would be used, instead of labor hours.
Other Overhead Allocation Methods Some companies use other allocation methods for overhead. Whatever method is used should be a reliable and predictable method, where a cost driver or reasonable cause and effect relationship can be found between costs and production.
Overhead costs are allocated using journal entries, which means that these managerial accounting entries will also affect the audited financial statements released to outsiders. The allocation method will come under the scrutiny of the company's auditors, so it should be a reasonable method that complies with GAAP.

© 1999-2006 Copyright Malcolm E. White, Fulton, Missouri, USA For personal educational use only. All rights reserved. No part of this tutorial may be reproduced or stored in any way without permission.
Chapter 17 Job Order Costing
Chapter 17 shows the use of several major types of cost accounting systems. All companies have to accumulate and allocate costs. Each company has to decide how it is going to do that. Companies pick a method that works well for them, and is cost effective.
Accounting isn't hard; students just like to make it seem that way. Accounting is simply a way to organize information, and make it useful for the people who have to manage a business, and make decisions. Managerial accounting reports don't have to follow GAAP because they are prepared for managers, not outside investors or creditors.
A well designed accounting system should generate reports for a large variety of uses. Of course, it must provide the necessary information for annual financial statements; and it should also help in the preparation of special reports, like sales tax and payroll reports. It should help managers track and manage inventories, open orders, accounts receivable and accounts payable.
Managers must make decisions on a daily basis. Annual financial statements are prepared well after the end of the year, and are useless for managing a businesses daily affairs. Managers must look forward to the near future, usually the coming week, month and year. Annual financials look backwards in time.
The basic concepts and terms you learned in Chapter 16 will carry over through this chapter and the remainder of the course. Businesses use these concepts to prepare managerial reports, and analyze their business activities.
There are two main types of cost accounting systems. Companies select a method that best matches the flow of work in their business. These methods are used to allocate all production costs: labor, materials and overhead.
Job order costing - work is broken into jobs; each job is tracked separately
auto mechanics, carpenters, painters, print shops, computer repair
Process costing - a large quantity of identical or similar products are mass produced
auto assembly plants, hot dog manufacturing, any large mechanized production facility
Each cost accounting system gathers and reports on the same information. The method used depends on the needs of the business.
Job Order Costing A job order costing system is used when a job or batch is significantly different from other jobs or batches. Cost accounting is usually fairly simple in these systems. Labor and materials are entered on a job ticket. Overhead is usually added to the amount the customer will be charged for labor and materials.
If you go to an auto repair shop, they will start a job ticket just for the work to be done on your car. Your job ticket will show charges for labor and materials, just for your job. Let's say they charge you $35 per hour for labor. That charge includes the mechanic's payroll cost. But it also includes an overhead charge - which is generally not stated separately. The overhead charge covers the costs of operating the garage -

tools and equipment, rent, insurance, maintenance, utilities, etc. It is a way to allocate overhead (discussed below), and build it in to the amount charged to customers.
The garage will also make a gross profit on the parts they use to repair your car. This gross profit covers the cost of buying and maintaining a parts inventory, including department employee wages, insurance and warehousing costs.
Allocating Overhead Overhead is a large mixed group of costs that can't be directly traced to products. There are several methods of allocating overhead costs in a cost accounting system. ABC costing is one method. We will learn other, simpler methods as well.
Activity-based costing (ABC) - overhead costs are tracked activities that consume resources
used primarily for allocating overhead that is hard to track to specific products or departments
ABC Costing is covered in Chapter 18.
Cost flow in an accounting system We say that costs flow through an accounting system. That is because they accumulate as the product progresses through the various stages of production. Let's look at a typical product.
Before a product is started, no costs have been incurred. Workers stand ready to make the product, inventory waits patiently in the warehouse, and the manufacturing plant contains all the resources necessary to perform the manufacturing operation.
We first add materials into production, from the inventory. At the same time the accounting department transfers the cost of inventory items to the Work in Process account, and the product or job now has a value.
Next the workers start to convert the raw inventory into a product. As labor is added, the accounting department transfers payroll costs to the Work in Process account, increasing the value of the product or job.
Overhead costs are allocated to the product or job, based on the costing method used. As work progresses on the product or job, it accumulates labor, materials and overhead costs. Finally, the total finished product or job cost is transferred to Finished Goods, and when it is sold the cost is transferred to Cost of Goods Sold.
Accounting Overhead Costs Overhead is allocated to products or jobs using a reasonable allocation method. We try to find some part of the manufacturing process that is regular and predictable. We call this a cost driver.
Labor hours used is the most popular allocation method. The number of labor hours in a year are fairly predictable. Differences in employees pay rates are not relevant when using hours. The information is readily available from existing payroll records. There is usually a direct correlation between labor and the production process.

Labor dollars is the second most popular allocation method. It is used by very large companies, with large work forces operating under labor contracts. The labor costs are fairly predictable, and are closely linked to production. Because of the large number of employees, labor dollars tends to be a very stable and predictable measure of the progress of production.
Other overhead methods include: number of units produced, machine hours use (jet engines, diesel locomotives), square footage of floor space (heating, cooling & janitorial costs), miles (taxis, trucking)
Some companies use a sophisticated method involving service departments such as maintenance and computer processing. These departments provide services to other departments. Service departments are widely used in hospital accounting.
Simple Overhead Allocation The simplest form of overhead allocation is to treat all annual overhead as a single cost pool, and allocate it to one annual cost driver.
Assume Johnson's Bakery produces 2,000,000 loaves of bread per year, and incurs $60,000 in annual overhead cost. How much overhead cost must Johnson allocate to each loaf of bread?
Total Annual Overhead ------------------------ Units of Cost Driver
= one $ unit of cost driver
$60,000
------------------------ 2,000,000 loaves
= 3 cents per loaf
In addition to direct costs (labor & materials), Johnson will allocate 3 cents per loaf to overhead costs.
Decision making using overhead costs Assume Johnson's Bakery must lease a new oven for $20,000 per year, to replace an old oven. Direct costs per loaf will not change. Johnson charges all Lease costs to the Overhead account. All other overhead costs will stay the same. How will the new oven lease change Johnson's overhead costs?
$60,000 + $20,000 ------------------------
2,000,000 loaves= 4 cents per loaf
Johnson's overhead cost per loaf will increase 1 cent, from 3 cents to 4 cents.
Another Example
Wilson's Garage has 6 mechanics working full time, 2,000 hours per year each, for a total of 12,000 hours that will be billed to jobs. They incur $60,000 per year in overhead costs. Wilson allocates overhead costs

to car repair jobs, based on the number of hours worked on each job. How much will Wilson allocate per labor hour?
$60,000 ------------------------
12,000 hours= $5.00 overhead per labor hour
Wilson's Garage will allocate $5.00 per labor hour for overhead.
Example of Overhead Allocation to a Job
Wilson's Garage works on the delivery truck belonging to Johnson's Bakery. The job takes 2 hours. How much overhead cost will Wilson's allocate to this job?
overhead per labor hour X labor hours on job = overhead allocated to job
$5.00 x 2 = $10.00
Wilson's Garage will allocate $10.00 in overhead costs to the repair job.
Why don't you see Overhead costs listed separately on repair tickets? Customers usually don't understand what overhead costs are, or why they are important for a business. Overhead costs are generally "built in" to other costs. Wilson's Garage will add the overhead cost to it's regular labor rate. Since overhead is allocated by labor hour, this is an easy method for a garage, or similar types of businesses. Overhead costs are generally "hidden" from customers in this way, but the company must charge the customer for these costs in some way.
© 1999-2006 Copyright Malcolm E. White, Fulton, Missouri, USA For personal educational use only. All rights reserved. No part of this tutorial may be reproduced or stored in any way without permission.

Chapter 18 Process Costing
Chapter 18 focuses on Process Costing. There are two main types of cost accounting systems. Companies select a method that best matches the flow of work in their business. These methods are used to allocate all production costs: labor, materials and overhead.
Job order costing - work is broken into jobs; each job is tracked separately
auto mechanics, carpenters, painters, print shops, computer repair
Process costing - a large quantity of identical or similar products are mass produced
auto assembly plants, hot dog manufacturing, any large mechanized production facility
Each cost accounting system gathers and reports on the same information. The method used depends on the needs of the business.
Process Costing traces and accumulates direct costs, and allocates indirect costs, through a manufacturing process. Costs are assigned to products, usually in a large batch, which might include an entire month's production. Eventually, costs have to be allocated to individual units of product.
Why do we need to allocate total product costs to units of product? A company may manufacture thousands or millions of units of product in a given period of time.
• products are manufactured in large quantities, but, • products must be sold in small quantities, sometimes one at a time (automobiles, loaves of
bread), a dozen or two at a time (eggs, cookies), etc. • product costs must be transferred from Finished Goods to Cost of Goods Sold as sales are
made. This requires a correct and accurate accounting of product costs per unit, to have a proper matching of product costs against related sales revenue.
• managers need to maintain cost control over the manufacturing process. Process costing provides managers with feedback that can be used to compare similar product costs from one month to the next, keeping costs in line with projected manufacturing budgets.
• a fraction-of-a-cent cost change can represent a large dollar change in overall profitability, when selling millions of units of product a month. Managers must carefully watch per unit costs on a daily basis through the production process, while at the same time dealing with materials and output in huge quantities.
Allocating Overhead using ABC Costing Overhead is a large mixed group of costs that can't be directly traced to products. There are several methods of allocating overhead costs in a cost accounting system. ABC costing is one method. We will learn other, simpler methods as well.

Activity-based costing (ABC) - overhead costs are tracked activities that consume resources
used primarily for allocating overhead that is hard to track to specific products or departments
ABC Costing is a little more sophistocated that the single-driver method covered in Chapter 17. But it is really not much more difficult. ABC Costing assumes that
• you may have more than one cost driver that is relevant, • a single cost driver may incorrectly allocate costs to products or departments -- too much or too
little costs, or costs allocated to the wrong department or product, • service type enterprises don't produce a product, but must find a way to allocate overhead costs to
services provided (e.g. hospitals), • multi-department and multi-factory situations require more sophistocated overhead allocation
methods.
Two-Stage Overhead Allocation
Stage 1 Stage 2 Allocate Total Costs to Pools Allocate Pools to Products or Services
Nagle Manufacturing has identified 3 cost pools, each with a relevant driver. They can trace total overhead costs as follows.
Using separate cost pools and drivers, Nagle Manufacturing can allocate total overhead costs more accurately to the products that consume those costs.
EXAMPLE - Occupancy Cost Pool allocation
Mike's Bikes, Inc. decides to allocate factory Occupancy costs based on the square footage each department occupies. Occupancy costs include many common costs, like heat, air conditioning, water & sewer, lights, cleaning

and maintenance, insurance, security and other related costs.

The company draws up a floor plan and measures how many square feet each department uses.
They had a total of $120,000 in Occupancy costs last year.
The company produced 6000 bicycles last year
Occupancy Cost Pool Overhead Allocation
Department Sq ft Cost allocation formula Allocatedto depts
Bicycles made
Overhead Per Bike
Assembly 5,000 / 15,000 * $120,000 = $40,000 / 6000 = $ 6.67Finishing 7,000 / 15,000 * $120,000 = 56,000 / 6000 = 9.33Sales & admin 3,000 / 15,000 * $120,000 = 24,000 / 6000 = 4.00
Total 15,000 $120,000 / 6000 = $ 20.00
NOTE: Only Assembly and Finishing costs are considered Product costs. Product costs become part of the cost of Finished Goods, which flows to Cost of Goods Sold. Sales and administrative costs are treated as Period costs against related revenue for the same time period, one year in this case. It's important to consider ALL costs when pricing a product.
Equivalent Units of Production This is a concept that seems to confuse students. Don't worry, after working with the concepts for a couple of years they become much easier. Just kidding! But honestly, it is a difficult concept the first time or two around. Your success with this topic will largely depend on taking your time, and carefully working and reviewing a number of sample problems.
Equivalent units are mainly used in process accounting systems, but the method could also be used in a job order system. Equivalent unit calculations are used at the end of a month, to prepare monthly production reports. They are also used at the end of the year to determine ending inventory values.
The Equivalent Unit concept has to do with costs incurred, in the form of materials,labor and overhead. Let's say it costs the company $50 to produce 1 bicycle.

1/2 bike + 1/2 bike = 1 whole bike
PLUS
EQUIVALENT TO
$25 + $25 = $50
Let's say at the end of a day, two bikes are half completed, and have accumulated $25 in costs each. That is the same as one equivalent unit which has accumulated $50 in costs.
Using equivalents unit is a way to mathematically convert partially completed units of product into an equivalent number of fully completed units. Let's look at an example:
1000 units of Product X are 50% complete at the end of the month. We convert them into equivalent units as follows:
1000 units X 50% complete = 500 equivalent units
If they were 25% complete this would be the calculation:
1000 units X 25% complete = 250 equivalent units
So equivalent unit calculation is just a way to convert partly complete products into their equivalent number of fully completed products, using a little math. Remember, this is accounting; we are recording and reporting on costs, and trying to have the costs parallel the actual flow of production through the manufacturing process.
Let's look at a furniture company. They are producing a batch of 1000 wooden chairs. The wood is cut and shaped into component parts. The parts are sanded and assembled. Next paint or varnish is applied, and decorations and hardware are added. Under these circumstances, a batch of 1000 chairs could be at any stage of the production process at the end of a month. Using equivalent units would be appropriate in this example.
Of course, this doesn't make sense in every situation. Let's take a cookie bakery. They mix a batch of dough, bake the cookies, and package them all on the same day. There is no carry over of partially completed cookies from one day to the next. This company would not need to calculate equivalent units of production.
Unit Costs A manufacturing company can make thousands of units of product in a given time periods. Some make millions of units per year. Ultimately those products have to be sold, and they are sold one at a time. So it is important for companies to know the unit cost of the products. This unit cost should include all costs when setting a selling price.
We can also analyze our production efficiency by looking at how unit costs change from month to month. We can break unit costs down into component parts as well, such as labor, material and overhead. This gives managers even more control over the manufacturing process.

We will soon study standard costs and budgets (Chapter 23). Unit costs are very important in both of these areas. By comparing standard and actual costs per unit we can reduce waste, increase productivity, and manager resources more carefully.
Using ABC Costing Systems Your text has a good example of ABC costing, with an informative chart on page 750. Overhead costs are not treated as a single item in ABC systems. Costs are pooled by type or activity, and allocated to production using different cost drivers.
It is important to identify relevant and reliable cost drivers for different types of costs. For instance, square footage of floor space might be used to allocate heating and air conditioning costs. Costs usually go through a series of steps in the allocation process.
Just In Time Just in time (JIT) inventory management systems have been widely used in the automotive manufacturing and assembly industry, as well as others. The idea is to have parts arrive at the assembly plant just in time to go into the production line when they are needed. The company does not keep an inventory of parts in storage. Very few extras are ordered, further eliminating waste.
JIT systems help companies in several ways. They reduce costs and risks associated with inventory. There is no need to warehouse parts, eliminating building, personnel and insurance costs. They reduce the risk of loss from damage, theft, obsolescence of inventory.
There's no difference in the accounting procedures associated with JIT systems. They are a way to manage the physical flow of inventory.
Using Spreadsheet Programs (Excel, Lotus 1-2-3) Spreadsheets are widely used in managerial accounting. The are very helpful for calculating ABC cost allocations. Standardized formulae can be entered into a spreadsheet. When monthly information is entered, the formulae do all the math, and calculate the final cost allocations.
A spreadsheet can be used to calculate equivalent units of production in a process costing system. They are also widely used in preparing budgets (Chapter 22), performing incremental analysis calculations (Chapter 21), and in C-V-P analysis (Chapter 19) for calculating break even points and creating graphs.
© 1999-2006 Copyright Malcolm E. White, Fulton, Missouri, USA For personal educational use only. All rights reserved. No part of this tutorial may be reproduced or stored in any way without permission.

Chapter 20 Cost-Volume-Profit Analysis
Chapter 19 introduces cost-volume-profit analysis.
CVP Analysis is a way to quickly answer a number of important questions about the profitability of a company's products or services. CVP Analysis can be used with either a product or service. Our examples will usually involve businesses that produce products, since they are often more complex situations. Service businesses (health care, accounting, barbers & beauty shops, auto repair, etc.) can also use CVP Analysis.
It involves three elements:
1. Cost - the cost of making the product or providing a service 2. Volume - the number of units of products produced or hours/units of service delivered 3. Profit - Selling Price of product/service - Cost to make product/provide service = Operating Profit
The first two items are information available to business managers, about their own business, products and services. This type of information is not generally available to those outside the business. They constitute important operating information that can help managers asses past performance, plan for the future, and monitor current progress. As for the third item, a business can't stay in business very long without profits.
It is important to know whether the company is profitable as a whole. It is also important to know if a particular product is profitable. A business that sells 100 or more different products may lose sight of a single product. If that product becomes unprofitable (selling for less than the cost to produce & sell), the company will lose money on each and every sale of that product. The company might raise the selling price, cut production costs or discontinue the product entirely. Building a business with 100 products we know are profitable is good management. CVP & variable costing provide the tools to make this happen in a real business.
A successful business can be built around a single profitable product. It can also be built around hundreds or thousands of profitable products. Many businesses start small and grow over time, adding products as they gain experience and are able to identify and/or develop new markets and products. No matter the size of the business or the number of products, the same rules apply. Each product must "carry its own weight" for the business to be profitable.
Using CVP Analysis we can analyze a single product, a group of products, or evaluate the entire business as a whole. The ability to work across the entire product line in this way gives us a powerful tool to analyze financial information. It provides us with day-to-day techniques that are easy to understand and easy to use. The concepts parallel the real world, so they are easy to visualize and use. The math is very simple - no complex formulae or techniques. Just simple formulae that can be easily modified to analyze a large variety of situations.
Quiz Yourself CVP Analysis is important because: a. the teacher says so. b. it sounds cool to say "see vee pee". c. it is a good way to analyze the profitability of a company's products or services. d. I haven't a clue.

CVP Relationships Cost - product cost, consisting of materials, labor, overhead, etc. Volume - number of units of product sold in a given period of time Profit - Selling Price minus Cost, per unit or in total
The greater the volume, the greater the TOTAL profit.
Approaches to product costs Full Costing is used in financial accounting. The full cost of a product includes materials, labor and manufacturing overhead. Not included: Selling and administrative costs.
Variable Costing is used in managerial accounting. Costs are classified as either Variable or Fixed, depending on their Cost Behavior.
Cost Behavior Costs are classified according to how they behave, in relation to units of production.
CAUTION: Cost behavior can be viewed in terms of total costs or unit costs. Both approaches will be used, but they are not interchangeable.
Fixed Costs Total Fixed Costs - stay essentially the same month to month, regardless of the number of units produced.
Unit Fixed Costs - goes down as production goes up
Variable Costs Total Variable Costs - go up and down in direct proportion to units produced.
Unit Variable Costs - stay the same regardless of how many units are produced.
Accounting information is captured once by the accounting system. In Accounting I you learned how to analyze transactions, record journal entries, post to the ledger accounts and prepare financial statements for use by those outside the company. That is one way to organize accounting information, but it is not the only way. That same information can be organized in many different ways. In this section we are going to simplify the process greatly. Our topic is Cost-Volume-Profit, so we will focus on income statement accounts, Revenues and Expenses. For now we can ignore balance sheet accounts.
Managers focus on income statement accounts because these are the ones affected by day-to-day operating activities. Companies produce/purchase and sell products or services. Companies may uses hundreds of income statement accounts to track all their different types of revenues and expenses. We are going to simplify the income statement by dividing all expenses into one of two categories: Variable and Fixed. To master this material you need to master these two concepts.
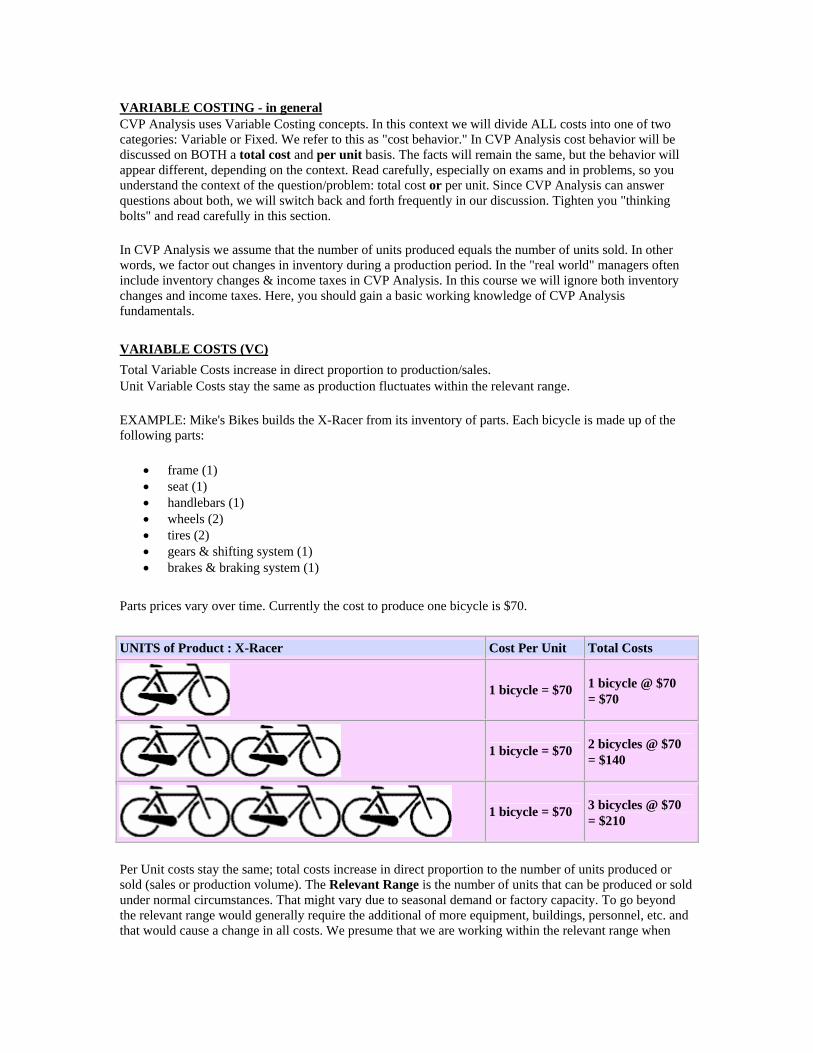
VARIABLE COSTING - in general CVP Analysis uses Variable Costing concepts. In this context we will divide ALL costs into one of two categories: Variable or Fixed. We refer to this as "cost behavior." In CVP Analysis cost behavior will be discussed on BOTH a total cost and per unit basis. The facts will remain the same, but the behavior will appear different, depending on the context. Read carefully, especially on exams and in problems, so you understand the context of the question/problem: total cost or per unit. Since CVP Analysis can answer questions about both, we will switch back and forth frequently in our discussion. Tighten you "thinking bolts" and read carefully in this section.
In CVP Analysis we assume that the number of units produced equals the number of units sold. In other words, we factor out changes in inventory during a production period. In the "real world" managers often include inventory changes & income taxes in CVP Analysis. In this course we will ignore both inventory changes and income taxes. Here, you should gain a basic working knowledge of CVP Analysis fundamentals.
VARIABLE COSTS (VC) Total Variable Costs increase in direct proportion to production/sales. Unit Variable Costs stay the same as production fluctuates within the relevant range.
EXAMPLE: Mike's Bikes builds the X-Racer from its inventory of parts. Each bicycle is made up of the following parts:
• frame (1) • seat (1) • handlebars (1) • wheels (2) • tires (2) • gears & shifting system (1) • brakes & braking system (1)
Parts prices vary over time. Currently the cost to produce one bicycle is $70. UNITS of Product : X-Racer Cost Per Unit Total Costs
1 bicycle = $70 1 bicycle @ $70
= $70
1 bicycle = $70 2 bicycles @ $70
= $140
1 bicycle = $70 3 bicycles @ $70
= $210
Per Unit costs stay the same; total costs increase in direct proportion to the number of units produced or sold (sales or production volume). The Relevant Range is the number of units that can be produced or sold under normal circumstances. That might vary due to seasonal demand or factory capacity. To go beyond the relevant range would generally require the additional of more equipment, buildings, personnel, etc. and that would cause a change in all costs. We presume that we are working within the relevant range when

doing CVP Analysis. This makes the task much easier. It also helps us understand when we will need to address the need to expand our business.
Variable Costs include any total cost that varies in direct proportion to volume. These commonly include:
• component parts, packaging, etc. • production labor • sales commissions (percentage or per unit basis) • other costs allocated on a per unit basis
FIXED COSTS (FC) Total Fixed Costs (FC) do not change as production/sales increases. Unit Fixed Costs decrease as production increases within the relevant range.
Ask yourself this question: Would a cost be zero if production was zero? If the answer is NO, you are looking at a fixed cost. A common example would be rent on a building. The company must pay rent on the building even if it sells no products in a given month! Some other common costs that follow this pattern are:
• managers & executives salaries • insurance • advertising • real estate & property taxes • security service • cleaning & maintenance costs • depreciation expense on buildings, vehicles & equipment
EXAMPLE: Mike's Bikes spends $5,000 per month in fixed costs. If they make X bicycles per month.... their fixed costs PER UNIT will be...... 1,000 bicycles $5,000 / 1,000 bicycles = $5.00 per bicycle 2,000 bicycles $5,000 / 2,000 bicycles = $2.50 per bicycle 3,000 bicycles $5,000 / 3,000 bicycles = $1.67 per bicycle 4,000 bicycles ????????? Quick Quiz try these on your own 5,000 bicycles ?????????
Quick Quiz Do Total Fixed Costs change as production goes up?
Since Fixed Cost per Unit goes down as sales/production go up, it is always a good idea to sell/produce more units. In the real world, companies try to produce approximately the same number of units they expect to sell in a given period of time. If you think about the computer industry you will see how important this can be. If a computer company manufactures too many units it may have a stock of merchandise that is hard to sell as new computer chips are introduced to the market. It may have to sell its products at a discount or even at a loss to liquidate its inventory. Chapter 8 discusses "Just In Time" (JIT) inventory management, which is used to help reduce inventory costs, by having parts delivered "just in time" to go into production. JIT inventory systems are commonly used in automobile assembly plants. Using JIT reduces a company's risk of carrying a stock of parts that may quickly become obsolete.

MIXED COSTS Mixed costs change somewhat in relation to production, but not proportionately like Variable Costs do. Mixed costs generally have a fixed portion and a variable portion. We deal with these costs by separating them into these two parts - so we are back to only 2 types of cost behavior.
A common example of a mixed cost would be a rental car. You might rent a car for a weekend for $20, for up to a total of 200 miles. You will be charged $ .10 for each additional mile you drive. The flat rate of $20 represents the fixed component; the $ .10 per mile represents the variable component. If you drive 300 miles you will pay:
Fixed component $20.00 Variable component $10.00 (100 extra miles @ $ .10) Total cost $30.00
We have a couple of simple ways to separate costs into their fixed and variable components. One way is called the High-Low Method. It looks at the highest & lowest costs over a period of several months to come up with a simple formula that can be used to calculate the variable & fixed costs. Separating mixed costs into their parts is an in-exact practice. At best it is an estimate, or approximation, that is only as accurate as the method we use. This is not usually a significant issue, since all costs are eventually included in our equations. However, if mixed costs constitute a percentage of total costs, it is necessary to be as accurate as possible. More sophisticated methods should be used when a higher level of accuracy is needed.
Contribution Margin The Contribution Margin (CM) is one of the most essential parts of variable costing and managerial accounting.
CM = Selling Price - Variable Costs
It can be calculated as either unit CM or total CM.
CM is the profit available to cover fixed costs and provide net income to the owners.
Break Even analysis One of the first uses of variable costing is calculating the break even point. This is the point at which sales exactly equals total costs. It can be expressed as either units or sales dollars.
Break Even Units (BE units)- the number of units needed to cover fixed costs for a given period of time.
---------------------------------------------------- BE units example: XYZ Co. has monthly fixed costs of $2,000. They sell a single product for $30 each. Variable costs are $10 per unit. They sell about 200 units per month. Calculate the break even point in units.
1) Calculate CM

Selling price $ 30Variable costs 10
Contribution margin (CM) $ 20
2) Calculate BE units
BE Units = Total Fixed Costs Unit CM = 2000
20 = 100 units to break even
proof:
Contribution margin 100 units @ $20 $ 2000 less Total Fixed Costs 2000
Profit (loss) $ 0
When sales are below the Break Even point a company is operating at a loss; Above the BE point they will be operating at a profit. The company is selling 200 units per month, well above the break even point, so they are operating at a profit.
How much profit will they make by selling 200 units per month?
Contribution margin 200 units @ $20 $ 4000 less Total Fixed Costs 2000
Profit at 200 units per month $ 2000
---------------------------------------------------- Example 2: XYZ is facing fierce competition from a new company, and management decides to lower the selling price of their product to $20 per unit. They also decide to take out advertising at a cost of $400 per month. Recalculate their Break Even point given the new information:
1) Calculate CM
Selling price $ 20Variable costs 10
Contribution margin $ 10
2) Calculate BE units The $400 advertising costs will increase total fixed costs; add it to the numerator (top number).
BE Units = Total Fixed Costs Unit CM = 2400
10 = 240 units at break even
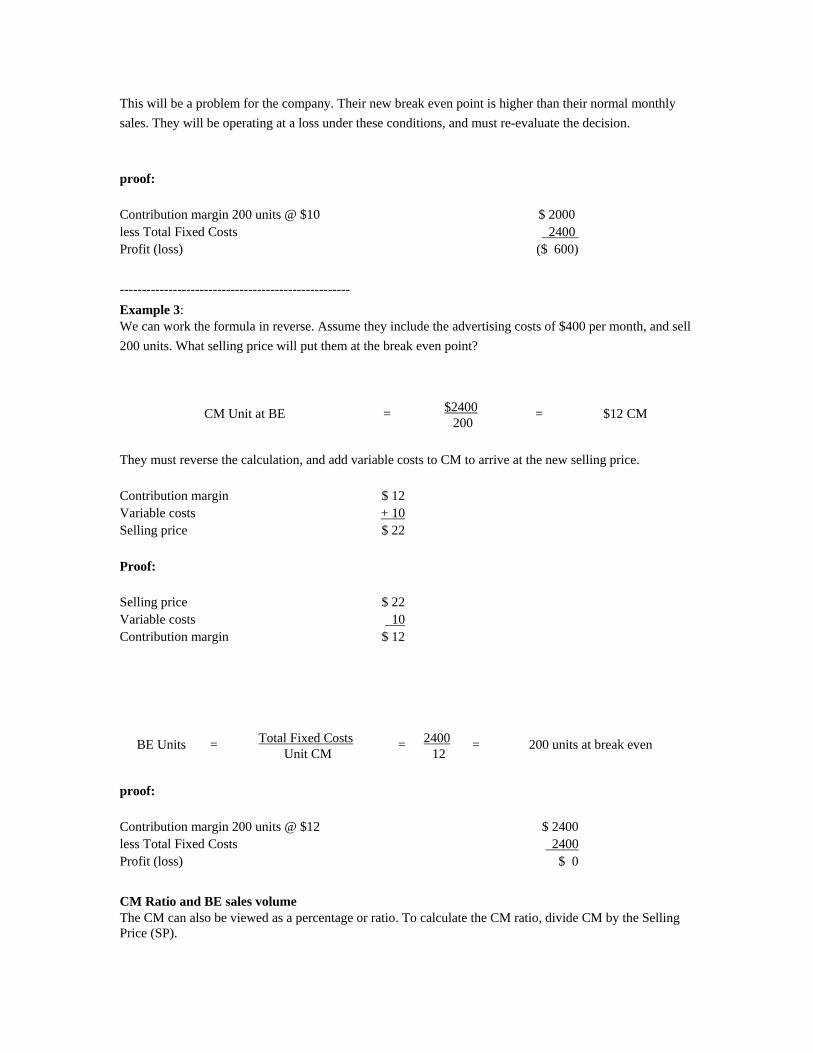
This will be a problem for the company. Their new break even point is higher than their normal monthly sales. They will be operating at a loss under these conditions, and must re-evaluate the decision.
proof:
Contribution margin 200 units @ $10 $ 2000 less Total Fixed Costs 2400
Profit (loss) ($ 600)
---------------------------------------------------- Example 3: We can work the formula in reverse. Assume they include the advertising costs of $400 per month, and sell 200 units. What selling price will put them at the break even point?
CM Unit at BE = $2400 200 = $12 CM
They must reverse the calculation, and add variable costs to CM to arrive at the new selling price.
Contribution margin $ 12Variable costs + 10
Selling price $ 22
Proof:
Selling price $ 22Variable costs 10
Contribution margin $ 12
BE Units = Total Fixed Costs Unit CM = 2400
12 = 200 units at break even
proof:
Contribution margin 200 units @ $12 $ 2400 less Total Fixed Costs 2400
Profit (loss) $ 0
CM Ratio and BE sales volume The CM can also be viewed as a percentage or ratio. To calculate the CM ratio, divide CM by the Selling Price (SP).

ABC Co. has monthly fixed costs of $2,400. They sell a single product for $40 each. Variable costs are $24 per unit. They sell about 250 units per month. Calculate their break even point in sales dollars (also called sales volume).
Selling price $ 40Variable costs 24
Contribution margin $ 16
Their CM Ratio is CM/SP = 16/40 = .40 or 40%
(In accounting we usually carry calculations out to 4 decimal places).
Break Even Sales Volume
Total Fixed Costs / CM Ratio = 2400/.40 = $6000 in sales per month
proof: $6000 / $40 SP per unit = 150 units to break even, or:
BE Units = 2400 16 = 150 units at break even
When do we use CM Ratio and BE sales volume? We can use these calculations anytime. They are especially useful when the company sells a large number of different products - in other words a large sales mix. Take for example a convenience store. They might sell 200 different items, or more. Each item carries its own selling price, and contribution margin per unit.
Calculating all those contribution margins would be a huge job. And with a sales mix, the company would have to carefully track each and every product. It is much easier to consider the merchandise as a large group, and use the CM Ratio.
QuikMart operates a convenience store, and their CM Ratio is approximately 42%. Their monthly overhead (fixed costs) is $2604. What sales volume is needed to break even?
BE volume = TFC / CM Ratio = $2604 / .42 = $6200 per month in sales volume
It is not necessary for the owner to know exactly how many Snickers bars, Milky Way, cans of Coke etc. will be sold each month. That will depend on the what the customers want to buy. The owner will stock a variety of products. By using CM Ratio we don't need to know each item individually.
Of course, in the real world not all products will earn the same CM Ratio. Some products face stiff competition, and the company will charge accordingly. For instance, they will sell milk at a price similar to grocery stores, earning a rather small CM. But the neat trinkets that adorn the front counter will be sold for twice, three, four times or more their cost, greatly improving the company's overall profit margin. A few high profit items can make up for the "loss leaders" in a company's product mix.
[Loss leaders are products sold at a low price, sometimes at a loss, to attract customers, and get them to shop in your store. Free items, 2-fer sales, 1 cent sales, etc. are all examples of the loss leader strategy used

by grocery stores to get your business. They hope you will buy some of the high profit items while you are shopping in their store. Sometimes they will require a minimum purchase, or limit the number of loss leader items a customer can buy.]
CVP Graphs CVP relationships and the break even formula can all be illustrated with a simple graph. CVP graphs are a great way to convey information. They are especially useful in presenting alternatives to decision makers, many of whom may more easily grasp the concepts with a visual presentation, rather than page full of numbers.
© 1999-2006 Copyright Malcolm E. White, Fulton, Missouri, USA For personal educational use only. All rights reserved. No part of this tutorial may be reproduced or stored in any way without permission.

Chapter 21 Incremental Analysis
Chapter 21 Managers often face complex business decisions. Incremental analysis provides a way to simplify even the most complex decisions.
Incremental analysis (IA) is not a formula, but rather an approach to problem-solving. It relies heavily on variable accounting concepts: using variable & fixed costs. You have already studied variable costing concepts; IA will show you a way to make these concepts even more useful.
Relevant Costs and Revenues The key to IA is identifying and using only relevant costs and revenues in a decision. Non-relevant costs will not change, regardless of the decision made, so they can be ignored. However, all costs and revenues that will or may change, are relevant to the decision and must be considered.
Since we are using variable costing, we will classify all costs are either variable or fixed. This greatly simplifies the analysis because we are just using only two sets of numbers.
Some decisions involve cash inflows, or revenues. These may be incidental to the decision, or they may be a significant element. Either way, if they are relevant they must be included in the analysis. Revenues or inflows that won't be effected by the decision can be ignored.
Opportunity costs represent the benefit (income, gain, profit or expense reduction) that could be realized by pursuing an alternate course of action. IA can help identify the BEST course of action, among several. So giving up the alternates would be preferable, and we would be justified in giving up the benefits of these alternatives.
For instance, you may graduate and get a job as an accountant, system administrator, business manager, etc. You will weigh your job options, select the BEST one, and reject the others. The income you could have made from the rejected jobs, represents your opportunity costs. But you can only take one job, so you choose to take the BEST one and give up the potential, but lesser income and satisfaction, that would come from the other jobs.
Sunk costs have already been incurred, you can't go back and change that, they won't affect the current decision, so they are NOT relevant.
Out of pocket costs ARE relevant to decisions. They often represent small or incidental costs relevant to a decision, such as hauling, set-up or clean-up costs, minor construction costs, and the like.
This chapter demonstrates several different "textbook" style problems. They represent common business decisions, and the text shows how these decisions could be approached, using Incremental Analysis.
Does that mean that IA is the only approach or the best approach? No, not necessarily. But in most cases it IS the best approach, because it helps managers identify the relevant parts of a decision. And it takes much less time than other types of analysis, based on full costing concepts.
You should also realize that a decision can be analyzed using full costing, and there may be a difference between the results of the two methods. Is one way more reliable than the other? Probably not, in most cases. Incremental analysis can easily be adjusted to include any relevant items that should be considered using full costing. Since IA is much quicker and more direct, managers usually prefer to use it.

Fixed costs are frequently a key to IA decisions. Managers often allocate fixed costs in an arbitrary manner. This can lead to material errors in decision making. Fixed costs may not affect a decision at all, or may do so only in a very specific way. Once fixed costs are treated correctly in a decision, the effects of mis-allocations can be clearly seen.
Layout of an IA decision Several approaches are presented in the text. The simplest decision involves only two alternatives. One alternative is (usually) to maintain the status quo. In other words, make no change. So a simple decision would be to change or not to change. Several layouts could be used equally well. We often look at the two alternatives, and compute the difference between the two amounts. One will outweigh the other, by the amount of the difference.
Decisions often look at a reduction of costs, rather than an increase in revenues. In the examples below, one would select the greatest cost reduction.
Below Alternative A incurs costs of $750, while Alternative B incurs only $50, a savings of $700 over Alternative A. In this case Alternative B is preferable.
Relevant: Alt A Alt B Difference A-B
revenues 0 300 (300) var costs (750) (450) (300) fixed costs 0 100 (100)
------------ ------------ ------------ (750) (50) (700)
I call the above method the "classic approach" - it's been taught for many years and is always a good method to learn. The text illustrates other methods as well. We can also expand the classic approach to include many alternatives, as illustrated in the 4-part decision below.
When a decision has more than two options or alternatives, it is usually better to create a table, consisting of one column for each decision, and a row for each relevant item to be considered. Once again, the lowest cost is the best solution. But we can also rank the options, best, next best, and so on.
Relevant: Alt A Alt B Alt C Alt D revenues 0 0 50 200 var costs (250) (500) (100) (700) fixed costs 0 (50) (100) 150
------------ ------------ ------------ ------------ (250) (550) (150) (350) Rank 2nd 4th Best 3rd
Types of IA decisions Several types of decision are illustrated in the text. These are common decisions. Others can be made as

well. There is no end to the types of decisions that can be made using IA. You should try to understand HOW to approach an IA problem.
Special Order decision - should the company accept a special order for products, at a price significantly lower than its normal selling price?
Limited Resource (production constraint) decision - the company has a limited resource it must allocate among several products. Which product should it favor?
Make or Buy decision - the company currently makes a part or product. It wants to evaluate whether it should buy the item instead. Of course, the reverse decision could be analyzed in exactly the same manner.
Sell, Scrap or Rebuild decision - defective or obsolete products must be dealt with in some way. The company should try to minimize its loss on these items.
Joint Products decision - several products come from the same raw materials, but are processed in different ways. Maple syrup and maple sugar both come from the same batch of sap. Different grades of syrup can be extracted during the production process. Syrup can be further processed into maple sugar or candy, expanding the product line. The cost of the original batch of sap must be allocated among the various finished products.
The best way to learn IA is to look at a number of examples and work along with the problem in your own mind. It even helps to take a piece of paper and write down the solution as you are reading and looking at it on your monitor. The process of writing it down will greatly reinforce your learning.
Here are some IA decision problems I have used in class. See if you can work the problem before looking at my solution. The solutions I provided are just suggested. You might find a different approach, or find an alternative solution that is just as valid.
© 1999-2006 Copyright Malcolm E. White, Fulton, Missouri, USA For personal educational use only. All rights reserved. No part of this tutorial may be reproduced or stored in any way without permission.
Chapter 23 Operational Budgeting
This chapter deals with preparing and using budgets. When preparing budgets managers won't be looking at specifics, they will look at the big picture.
They won't look at something like the route a delivery driver takes each day. They will be more concerned with the total monthly fuel costs for all the delivery trucks. The manager in charge of delivery trucks and drivers will be responsible for controlling delivery costs and working within the fuel budget for the month.
Any single budget will benefit a company. Several budgets can help even more. This chapter shows how to prepare a number of monthly budgets that fit together into a unified set. They give management the ability to manage various aspects of the business on both a short term and long term basis.
Operating busiest are very short term, and deal with production and costs over the coming month. Capital budgets deal with the purchase of land, buildings and major machinery. These things don't happen every day, so capital budgets might span over many years. Budgets will span a time period relevant to the type of decision that relates to that budget. Short term decisions will use short term budgeting; long term decisions will use long term budgeting.
The monthly budget should be prepared in a certain order. This order follows a logical sequence to manage production and delivery of goods.
• Sales forecast • Production schedule • Manufacturing cost budget • Cost of Goods Sold and ending inventory budgets • Operating expense budget
The logical order should be clear to see. The sales department must forecast the demand for the company's products. Now that they know how much to make, the production schedule and manufacturing cost budget can be prepared. The production schedule budgets labor, machinery and materials into the production process in terms of units, not dollars. The manufacturing cost budget shows the cost of the inputs calculated in the production schedule.
The COGS budget shows how much gross profit the company can expect to be generated by the month's production. The ending inventory budget shows the reserve of products that will be on hand to start the next month. Finally the operating expense budget will examine all the other monthly costs of running the factory.
After preparing the short term budget, managers can update the capital expenditures budget, and update the budgeted financial statements.
There are three elements to the budgeting process:
1. planning and budgeting before production, 2. overseeing production and operations during the month, and 3. month end budget to actual analysis, and review of the month's results
Flexible Budgeting There are two basic types of budgeting: static and flexible. A static budget assumes a set level of

production. A flexible budget uses standard costs, and is adjusted relative to actual production. A flexible budget is a much better analysis tool. Static budgets rarely produce reliable results. Static budgets are widely used in government accounting, where results are less important, but staying within a legal budget is mandatory.
Flexible budgeting starts with standard costs. After estimating sales and preparing a production schedule, the flexible budget can be prepared. The manufacturing and operating cost budgets can be prepared using flexible budgeting. The sales forecast can also be prepared using flexible budgeting.
The critical thing about flexible budgeting is the reporting that happens at the end of the month. After production, a budget to actual cost analysis is prepared, adjusted for the actual production that month. Favorable and unfavorable variances are identified and can be analyzed.
Computer spreadsheet programs are a great tool for preparing flexible budgets. Once a budget template is created, the same format and formulae can be used over and over again, by simply updating a few pieces of information. A set of flexible budget worksheets can be combined, and linked together, so beginning and ending amounts automatically flow from one month to the next.
© 1999-2006 Copyright Malcolm E. White, Fulton, Missouri, USA For personal educational use only. All rights reserved. No part of this tutorial may be reproduced or stored in any way without permission.

Chapter 24 Standard Cost Systems
A common scenario Mike manages a production facility for Amalgamated Widgets, Inc. Under him are the following departments: purchasing, production, warehousing and shipping, maintenance and security. Mike gets a bonus each year, depending on how well he manages the production facility. He also has the authority to give bonuses to employees working under him when they meet or exceed performance goals.
Mike, and his management team, use a standard cost system. They have determined the quantities possible, and the cost components of their products, under normal conditions. Costs are divided into the following categories: Direct Materials, Direct Labor and Factory Overhead. The factory incurs no Selling or G&A (General and Administrative) expenses. All their costs relate to producing products.
A product's standard cost, is what it should cost to make the product. At the start of each month aproduction budget is prepared, using standard costs and estimated production quantities. At the end of each month a variance report is prepared to compare the production budget with the actual quantities and costs of production.
The variance report tells Mike and his managers how well they did at achieving their budget goals. Afavorable variance shows that actual costs are less than budgeted (standard) costs. An unfavorable variance is just the opposite - actual costs are greater than budgeted costs.
By using a budget the management team can estimate their future costs and cash needs, plan production, schedule employees, coordinate materials purchases, reduce waste, increase production efficiency and meet shipping deadlines. Variances help the managers identify specific areas where they came in either over or under budget. They will try to repeat their successes and eliminate their failures. Each month they hope to become a little more efficient.
The budgets will be used to evaluate Mike and his managers. Their annual bonuses will depend on how well they meet their budget goals. Managers who consistently produce unfavorable variances will probably be replaced. We ask a few questions and answer them by using relevant variances. How well did management (managers) do:
• buying and using materials to make products? • scheduling employee time and motivating employees to be efficient? • controlling factory overhead costs?
Variances
1. Total Materials Variance 1. Materials Price Variance 2. Materials Quantity Variance
2. Total Labor Variance 1. Labor Rate Variance 2. Labor Efficiency Variance
3. Variable Overhead Variance 4. Fixed Overhead Variance

Variances and Standard Costs are entered into the accounting records using journal entries. The use of standard costing systems greatly simplifies some accounting procedures. Standard costs are entered weekly or monthly. Variances are calculated and entered. Monthly production and income reports are prepared. Managers use current information to prepare budgets for the coming months.
actual costs standard costs ^--------- difference = variance ---------^
$1200 $1250 ^------- $50 favorable variance -------^
actual costs are less than standard = favorable variance
By breaking the total variance down into its component parts managers can pinpoint the cause of the variance. Sometimes a favorable variance in one area causes an unfavorable variance in another area. Managers should be alert to these possibilities.
For instance, there might be a favorable materials price variance, because lower cost materials were purchased. If the materials were of an inferior grade, there could be an increase in waste, giving rise to an unfavorable materials quantity variance. Additionally, more labor could be required to handle and deal with the inferior materials, giving rise to an unfavorable labor efficiency variance.
Don't be mislead by a small total variance. This example shows large favorable and unfavorable variances offsetting each other. This is not a sign of efficient or effective management.
quantity variance $1000 favorable price variance (950) unfavorable total variance $50 favorable
Changes in Costs Variances can arise for a large number of reasons:
• errors in estimating • mis-management of resources • unforeseen price changes • equipment breakdown • labor problems • poor planning • shortage of raw materials
Budgeting and Variance accounting presume that managers should fix problems, not bury or hide them. It also presumes that these problems are short term problems, and can be effectively controlled in the future.
Sometimes there is a change in actual costs that necessitates a change in standard costs. For instance, a new labor contract could increase total labor costs by a predictable amount. Standard labor costs should be re-calculated to reflect the new actual labor costs. Once a new standard cost is calculated, future variances will be correctly reflected in the monthly variance report. If standard costs are not updated periodically, the monthly reports can show unrealistic favorable or unfavorable variances.

The purpose of variances and budgeting is to give management an effective tool for controlling costs. But the system must be continually reviewed and kept up to date. This is also important, because standard costs and variances are entered into the books as journal entries, so they must be based on reliable underlying assumptions. These assumptions must pass the critical eye of the company's certified auditors, so they must be current and accurate.
© 1999-2006 Copyright Malcolm E. White, Fulton, Missouri, USA For personal educational use only. All rights reserved. No part of this tutorial may be reproduced or stored in any way without permission.