One Total Maximum Daily Load for Dissolved Oxygen in … · Dissolved Oxygen in . Upper Oyster...
48
Adopted July 28, 2010 Approved by EPA September 21, 2010 Two Total Maximum Daily Loads for Dissolved Oxygen in Upper Oyster Creek Segment 1245 Assessment Units: 1245_02 and 1245_03 Prepared by the Water Quality Planning Division, Office of Water TEXAS COMMISSION ON ENVIRONMENTAL QUALITY
-
Upload
trankhuong -
Category
Documents
-
view
218 -
download
0
Transcript of One Total Maximum Daily Load for Dissolved Oxygen in … · Dissolved Oxygen in . Upper Oyster...
Adopted July 28, 2010 Approved by EPA September 21, 2010
Two Total Maximum Daily Loads for Dissolved Oxygen in Upper Oyster Creek Segment 1245 Assessment Units: 1245_02 and 1245_03
P r e p a r e d b y t h e W a t e r Q u a l i t y P l a n n i n g D i v i s i o n , O f f i c e o f W a t e r
TEXAS COMMISSION ON ENVIRONMENTAL QUALITY
Two TMDLs for Dissolved Oxygen in Upper Oyster Creek, Segment 1245
Texas Commission on Environmental Quality ii Adopted July 2010
Distributed by the Total Maximum Daily Load Program
Texas Commission on Environmental Quality MC-203
P.O. Box 13087 Austin, Texas 78711-3087
TMDL project reports are available on the TCEQ Web site at: <www.tceq.state.tx.us/implementation/water/tmdl/>
The preparation of this report was financed in part through grants from the U.S. Environmental Protection Agency.
This report is based in large part on the report titled: “Technical Support Document:
Upper Oyster Creek (Segment 1245) Dissolved Oxygen TMDL”
prepared by: Texas Institute for Applied Environmental Research
Tarleton State University Stephenville, Texas
Two TMDLs for Dissolved Oxygen in Upper Oyster Creek, Segment 1245
Texas Commission on Environmental Quality iii Adopted July 2010
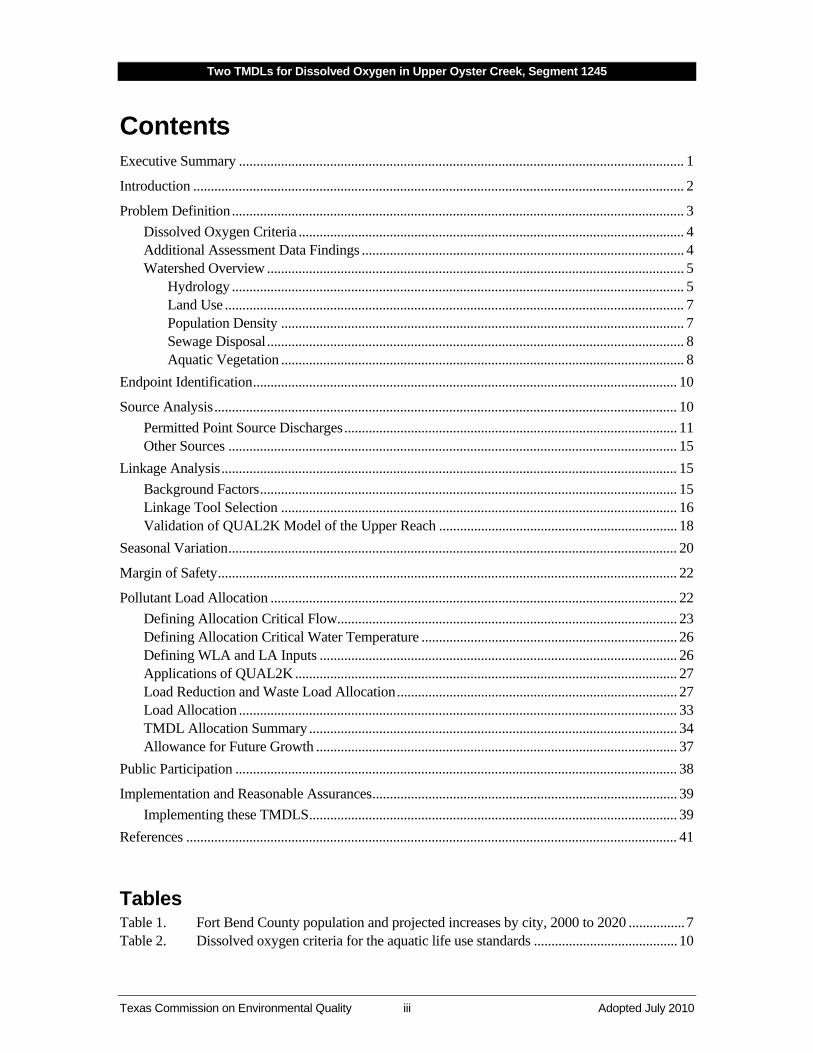
Contents Executive Summary ............................................................................................................................... 1
Introduction ............................................................................................................................................ 2
Problem Definition ................................................................................................................................. 3Dissolved Oxygen Criteria .............................................................................................................. 4Additional Assessment Data Findings ............................................................................................ 4Watershed Overview ....................................................................................................................... 5
Hydrology ................................................................................................................................. 5Land Use ................................................................................................................................... 7Population Density ................................................................................................................... 7Sewage Disposal ....................................................................................................................... 8Aquatic Vegetation ................................................................................................................... 8
Endpoint Identification ......................................................................................................................... 10
Source Analysis .................................................................................................................................... 10Permitted Point Source Discharges ............................................................................................... 11Other Sources ................................................................................................................................ 15
Linkage Analysis .................................................................................................................................. 15Background Factors ....................................................................................................................... 15Linkage Tool Selection ................................................................................................................. 16Validation of QUAL2K Model of the Upper Reach .................................................................... 18
Seasonal Variation ................................................................................................................................ 20
Margin of Safety ................................................................................................................................... 22
Pollutant Load Allocation .................................................................................................................... 22Defining Allocation Critical Flow ................................................................................................. 23Defining Allocation Critical Water Temperature ......................................................................... 26Defining WLA and LA Inputs ...................................................................................................... 26Applications of QUAL2K ............................................................................................................. 27Load Reduction and Waste Load Allocation ................................................................................ 27Load Allocation ............................................................................................................................. 33TMDL Allocation Summary ......................................................................................................... 34Allowance for Future Growth ....................................................................................................... 37
Public Participation .............................................................................................................................. 38
Implementation and Reasonable Assurances ....................................................................................... 39Implementing these TMDLS ......................................................................................................... 39
References ............................................................................................................................................ 41 Tables Table 1. Fort Bend County population and projected increases by city, 2000 to 2020 ................ 7Table 2. Dissolved oxygen criteria for the aquatic life use standards ......................................... 10
Two TMDLs for Dissolved Oxygen in Upper Oyster Creek, Segment 1245
Texas Commission on Environmental Quality iv Adopted July 2010
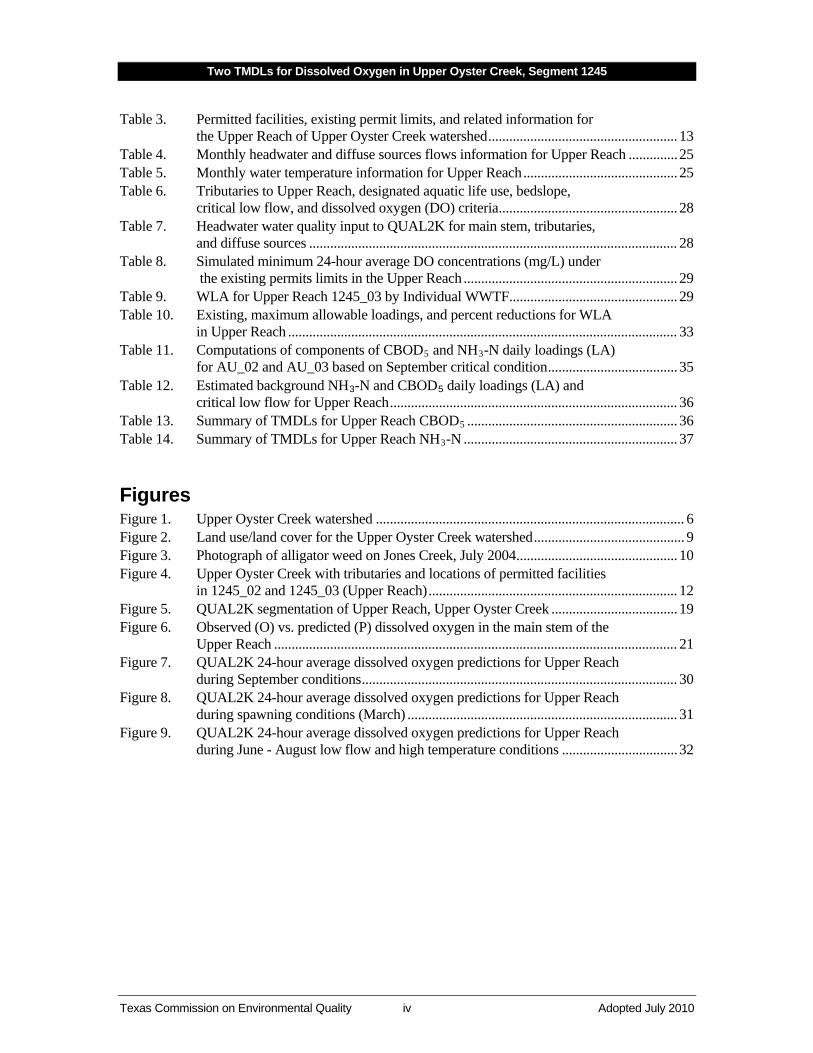
Table 3. Permitted facilities, existing permit limits, and related information for the Upper Reach of Upper Oyster Creek watershed ...................................................... 13
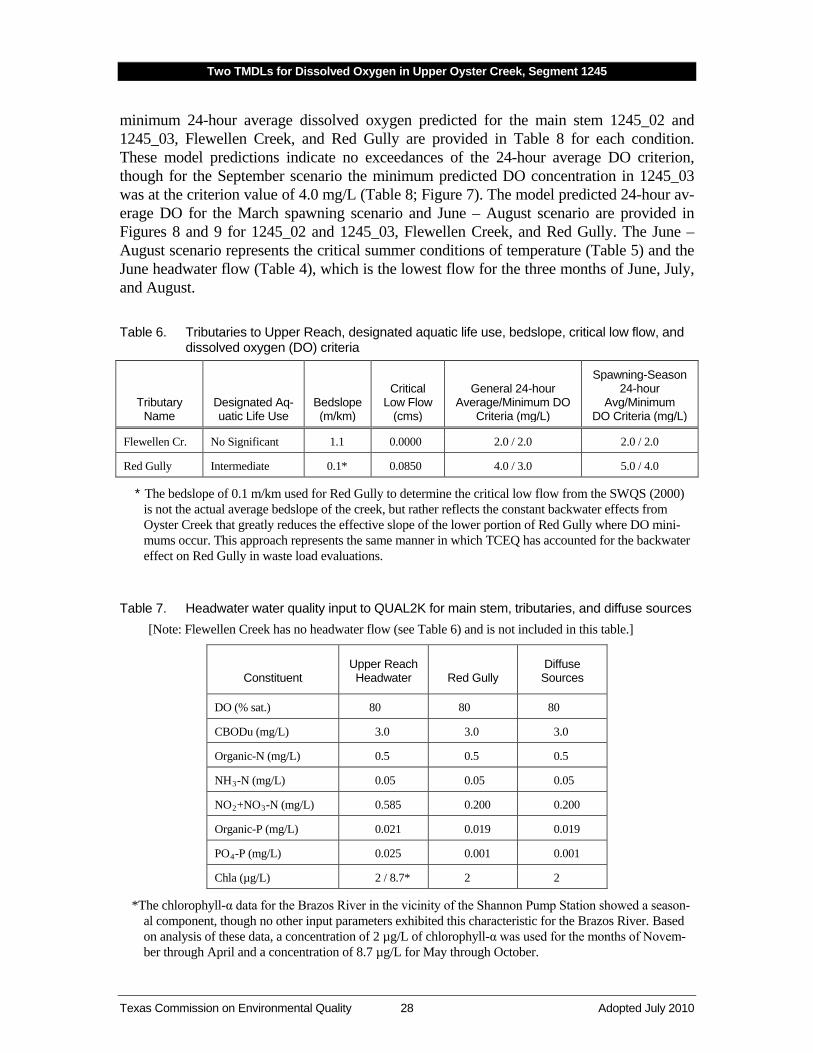
Table 4. Monthly headwater and diffuse sources flows information for Upper Reach .............. 25Table 5. Monthly water temperature information for Upper Reach ............................................ 25Table 6. Tributaries to Upper Reach, designated aquatic life use, bedslope,
critical low flow, and dissolved oxygen (DO) criteria ................................................... 28Table 7. Headwater water quality input to QUAL2K for main stem, tributaries,
and diffuse sources ......................................................................................................... 28Table 8. Simulated minimum 24-hour average DO concentrations (mg/L) under
the existing permits limits in the Upper Reach ............................................................. 29Table 9. WLA for Upper Reach 1245_03 by Individual WWTF ................................................ 29Table 10. Existing, maximum allowable loadings, and percent reductions for WLA
in Upper Reach ............................................................................................................... 33Table 11. Computations of components of CBOD5 and NH3-N daily loadings (LA)
for AU_02 and AU_03 based on September critical condition ..................................... 35Table 12. Estimated background NH3-N and CBOD5 daily loadings (LA) and
critical low flow for Upper Reach .................................................................................. 36Table 13. Summary of TMDLs for Upper Reach CBOD5 ............................................................ 36Table 14. Summary of TMDLs for Upper Reach NH3-N ............................................................. 37 Figures Figure 1. Upper Oyster Creek watershed ........................................................................................ 6Figure 2. Land use/land cover for the Upper Oyster Creek watershed ........................................... 9Figure 3. Photograph of alligator weed on Jones Creek, July 2004 .............................................. 10Figure 4. Upper Oyster Creek with tributaries and locations of permitted facilities
in 1245_02 and 1245_03 (Upper Reach) ....................................................................... 12Figure 5. QUAL2K segmentation of Upper Reach, Upper Oyster Creek .................................... 19Figure 6. Observed (O) vs. predicted (P) dissolved oxygen in the main stem of the
Upper Reach ................................................................................................................... 21Figure 7. QUAL2K 24-hour average dissolved oxygen predictions for Upper Reach
during September conditions .......................................................................................... 30Figure 8. QUAL2K 24-hour average dissolved oxygen predictions for Upper Reach
during spawning conditions (March) ............................................................................. 31Figure 9. QUAL2K 24-hour average dissolved oxygen predictions for Upper Reach
during June - August low flow and high temperature conditions ................................. 32
Two TMDLs for Dissolved Oxygen in Upper Oyster Creek, Segment 1245
Texas Commission on Environmental Quality v Adopted July 2010
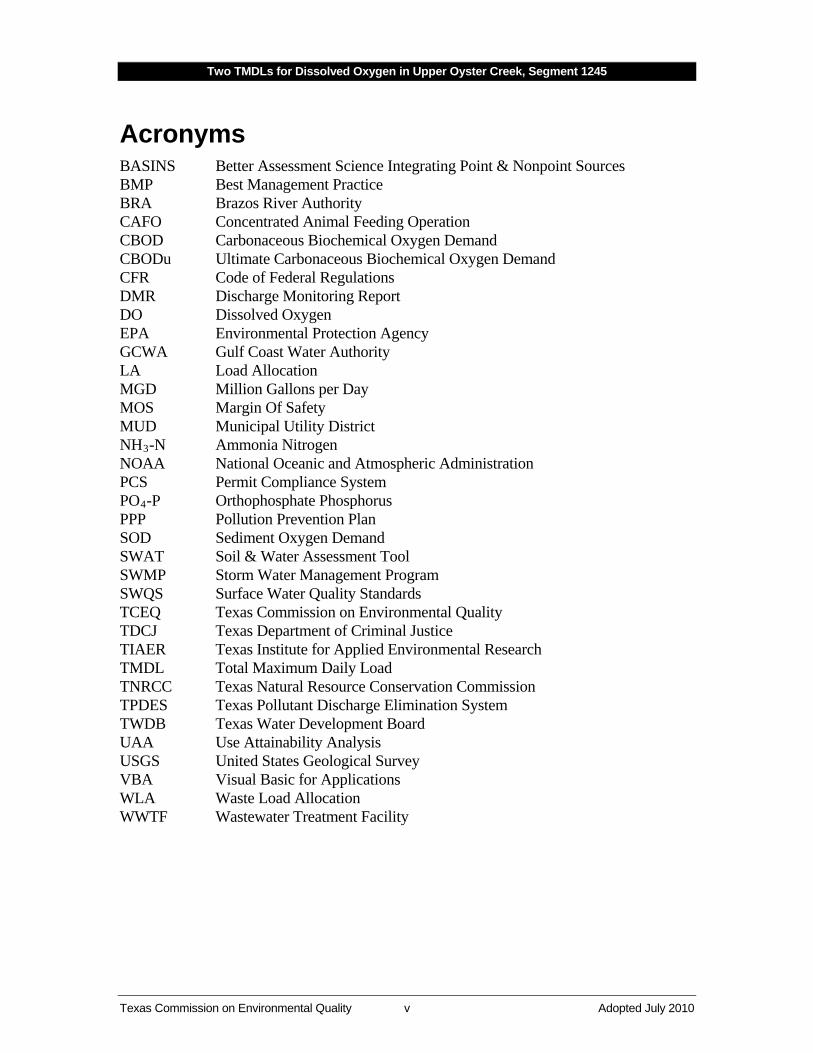
Acronyms BASINS Better Assessment Science Integrating Point & Nonpoint Sources BMP Best Management Practice BRA Brazos River Authority CAFO Concentrated Animal Feeding Operation CBOD Carbonaceous Biochemical Oxygen Demand CBODu Ultimate Carbonaceous Biochemical Oxygen Demand CFR Code of Federal Regulations DMR Discharge Monitoring Report DO Dissolved Oxygen EPA Environmental Protection Agency GCWA Gulf Coast Water Authority LA Load Allocation MGD Million Gallons per Day MOS Margin Of Safety MUD Municipal Utility District NH3NOAA National Oceanic and Atmospheric Administration
-N Ammonia Nitrogen
PCS Permit Compliance System PO4PPP Pollution Prevention Plan
-P Orthophosphate Phosphorus
SOD Sediment Oxygen Demand SWAT Soil & Water Assessment Tool SWMP Storm Water Management Program SWQS Surface Water Quality Standards TCEQ Texas Commission on Environmental Quality TDCJ Texas Department of Criminal Justice TIAER Texas Institute for Applied Environmental Research TMDL Total Maximum Daily Load TNRCC Texas Natural Resource Conservation Commission TPDES Texas Pollutant Discharge Elimination System TWDB Texas Water Development Board UAA Use Attainability Analysis USGS United States Geological Survey VBA Visual Basic for Applications WLA Waste Load Allocation WWTF Wastewater Treatment Facility
Two TMDLs for Dissolved Oxygen in Upper Oyster Creek, Segment 1245
Texas Commission on Environmental Quality vi Adopted July 2010
Texas Commission on Environmental Quality 1 Adopted July 2010
Two Total Maximum Daily Loads for Dissolved Oxygen in Upper Oyster Creek
Executive Summary This document describes the total maximum daily loads for dissolved oxygen (DO) in Up-per Oyster Creek (Segment 1245). Monitored concentrations of dissolved oxygen are lower than the criteria used to evaluate attainment of the segment’s designated intermediate aqua-tic life use. This impairment was first identified in the 1996 Texas Water Quality Inventory and 303(d) List. Upper Oyster Creek extends for approximately 54 miles in rapidly urbaniz-ing Fort Bend County and has a watershed area of approximately 107 square miles (27,600 hectares). It is located in the Brazos River Basin southwest of Houston. Assessment sampling conducted during the project confirmed that Upper Oyster Creek is not meeting its dissolved oxygen criteria. Depressed dissolved oxygen concentrations ex-tend through much of the length of the segment. Pollutant discharges to Upper Oyster Creek and its tributaries originate from both point and nonpoint sources. Sources include municipal wastewater treatment facilities (WWTFs), regulated and unregulated nonpoint sources, and water pumped into the segment from the Brazos River. Upper Oyster Creek contains three assessment units (AUs). Upper Oyster Creek can also be divided into two hydrologically distinct sections, which are referred to as the Lower Reach (AU 1245_01) and the Upper Reach (AUs 1245_02 and 1245_03). The Texas Commission on Environmental Quality (TCEQ) has planned a Use Attainability Analysis for 1245_01 that will evaluate the aquatic life use supported by this portion of Segment 1245. The aqua-tic life use designation will define the dissolved oxygen criteria applicable to 1245_01, so the total maximum daily loads (TMDLs) will not include that AU. For 1245_02 and 1245_03, pollutant load allocations were developed for two substances—carbonaceous bio-chemical oxygen demand (CBOD) and ammonia nitrogen—both of which exert a demand on oxygen as they undergo biological and chemical processes in the stream. A steady-state water quality model of the Upper Reach was calibrated and validated, and then applied to determine the necessary maximum allowable loadings. Because depressed dissolved oxygen could not be substantively associated with nonpoint source loadings of CBOD, ammonia nitrogen, or sediment oxygen demand, this study addresses critical low-flow conditions and point source loadings, but does not address nonpoint source loadings. Complexities associated with pumping of Brazos River water and curtailment of that pump-ing, maintenance dredging, periodic herbicide treatment to control aquatic vegetation, and low stream velocities in the lake-like portion of Segment 1245 may all have some role of unknown extent in the depressed dissolved oxygen that is experienced. There are no required reductions of point (or nonpoint) sources for this TMDL. However, using conservative modeling of low-flow conditions under full-permitted existing point source loadings of oxygen-demanding substances, the model-predicted value of the mini-mum 24-hour average dissolved oxygen concentration was approximately equal to the
Two TMDLs for Dissolved Oxygen in Upper Oyster Creek, Segment 1245
Texas Commission on Environmental Quality 2 Adopted July 2010
relevant dissolved oxygen criterion. This equivalence indicates that the assimilative capaci-ty of the system in one portion of Segment 1245 is fully utilized. The TMDL allocations for the Upper Reach do not preclude nor prevent consideration of expansions to WWTFs or the addition of new WWTFs. Any additional point source loadings from new facilities or per-mit expansions must be evaluated on a permit-by-permit basis to avoid controllable depressed oxygen conditions. This TMDL provides a tool by which future point source loadings can be evaluated to en-sure that permitted loadings of oxygen-demanding substances do not contribute to the Upper Reach’s failure to meet water quality standards. Additional sampling during the im-plementation phase of the project is recommended to help determine what factors (other than typically modeled nonpoint sources or permitted point sources, including dredging, use of herbicides to control aquatic vegetation, and hydraulic changes to the system) cause the Upper Reach to occasionally fail to meet the water quality standards.
Introduction Section 303(d) of the federal Clean Water Act requires all states to identify waters that do not meet, or are not expected to meet, applicable water quality standards. States must de-velop a TMDL for each pollutant that contributes to the impairment of a listed water body. The TCEQ is responsible for ensuring that TMDLs are developed for impaired surface wa-ters in Texas. A TMDL is like a budget—it determines the amount of a particular pollutant that a water body can receive and still meet its applicable water quality standards. Thus, TMDLs are the best possible estimates of the assimilative capacity of the water body for a pollutant under consideration. A TMDL is commonly expressed as a load with units of mass per period of time, but may be expressed in other ways. The TMDL Program is a major component of Texas’ overall process for managing the quality of its surface waters. The program addresses impaired or threatened streams, reser-voirs, lakes, bays, and estuaries (water bodies) in, or bordering on, the state of Texas. The primary objective of the TMDL Program is to restore and maintain the beneficial uses—such as drinking water supply, recreation, support of aquatic life, or fishing—of impaired or threatened water bodies. These two TMDLs (corresponding to 1245_02 and 1245_03) address impairments to the intermediate aquatic life use due to low dissolved oxygen levels in Upper Oyster Creek (Segment 1245). An earlier TMDL for bacteria for this segment was adopted by the TCEQ in August 2007 and was approved by the U.S. Environmental Protection Agency (EPA) in September 2007. Section 303(d) of the Clean Water Act and the implementing regulations of the EPA in Title 40 of the Code of Federal Regulations, Part 130 (40 CFR 130) describe the statutory and regulatory requirements for acceptable TMDLs. The EPA provides further direction in
Two TMDLs for Dissolved Oxygen in Upper Oyster Creek, Segment 1245
Texas Commission on Environmental Quality 3 Adopted July 2010
its Guidance for Water Quality-Based Decisions: The TMDL Process (EPA 1991). This TMDL document has been prepared in accordance with those regulations and guidelines. EPA requires that states consider nine elements in developing a TMDL. They are de-scribed in the following sections of the TMDL report:
§ Problem Definition § Endpoint Identification § Source Analysis § Linkage Analysis § Seasonal Variation § Margin of Safety § Pollutant Load Allocation § Public Participation § Implementation and Reasonable Assurance
The commission adopted this document on July 28, 2010. Upon EPA approval, these TMDLs will become an update to the state’s Water Quality Management Plan.
Problem Definition The TCEQ first identified the impairment to the intermediate aquatic life use for Upper Oyster Creek (Segment 1245) in the 1996 Texas Water Quality Inventory and 303(d) List (TCEQ 1996). The standards for water quality are defined in the Texas Surface Water Quality Standards (SWQS; TCEQ 2000). The specific uses assigned to Upper Oyster Creek are contact recreation, intermediate aquatic life use, and domestic water supply. The TCEQ has assessed dissolved oxygen concentrations as being less than optimal for attainment of Segment 1245’s intermediate aquatic life use. The 2004 Texas Water Quality Inventory and 303(d) List (TCEQ 2004) considered six sep-arate assessment units for the segment and reported that each assessment unit contained depressed dissolved oxygen concentrations. The 2004 inventory and 303(d) list also in-cluded Segment 1245 under category 5c, which indicated that additional data would be collected before a TMDL was scheduled. Those additional data were collected in years 2003–2005. The most recently approved 303(d) list (2008) included the segment under cat-egory 5a (equivalent to the former priority ranking of “U”), indicating a TMDL is underway. The 2008 303(d) list (TCEQ 2008a) also indicated a consolidation of the number of the separate assessment units from six to three and indicated that each assessment unit contained depressed dissolved oxygen concentrations. A use attainability analysis (UAA) is planned by the TCEQ to evaluate the aquatic life use for 1245_01 that will define the dissolved oxygen criteria applicable to that portion of Seg-ment 1245. Because of this planned UAA, these TMDLs will not include 1245_ 01, but will include 1245_ 02 and 1245_03. Several of the maps and portions of the “Watershed Over-view” section cover the entire watershed, not just 1245_02 and 1245_03.
Two TMDLs for Dissolved Oxygen in Upper Oyster Creek, Segment 1245
Texas Commission on Environmental Quality 4 Adopted July 2010
Dissolved Oxygen Criteria Dissolved oxygen criteria for Upper Oyster Creek consist of 24-hour average and absolute minimum concentrations. The criteria for protection of intermediate aquatic life use are:
§ 24-hour average dissolved oxygen concentration > 4.0 mg/L § 24-hour absolute minimum dissolved oxygen concentration > 3.0 mg/L
To protect fish spawning during any of the first 6 months of the year when average water temperature is between 63 and 73 °F (17.2 and 22.8 °C), the criteria are:
§ 24-hour average dissolved oxygen concentration > 5.0 mg/L § 24-hour absolute minimum dissolved oxygen concentration > 4.0 mg/L
For dissolved oxygen, the TCEQ considers that a water body is fully supporting if 10 per-cent or less of the sample sets are below the established criteria and not supporting if greater than 10 percent of the sample sets are below the established criteria. The TCEQ uses a binomial method to specify the number of exceedances required to determine non-support of the aquatic life use. Additional Assessment Data Findings To address the need for additional assessment data, a series of 24-hour dissolved oxygen surveys were conducted in the years of 2003, 2004, and 2005. The data collection activities occurred under the following constraints:
§ No more than two thirds of the events should occur in any year. § The events must be spaced over an Index Period representing warm-weather sea-
sons (March 15–October 15) with annually between one half to two thirds of the measurements occurring during the Critical Period (July 1–September 30).
§ A period of at least one month (or four weeks) must separate sequential 24-hour sampling events.
All data used in the assessment were collected under quality assurance project plans that ensure the data are of a known and appropriate quality (TIAER 2002; TIAER 2004; TIAER 2005). For purposes of the two TMDLs presented here, the present assessment focused on the two most upstream assessment units described in the 2008 303(d) list (Figure 1):
§ 1245_02: from Dam #3 upstream to Harmon Street crossing in Sugar Land § 1245_03: from Harmon Street crossing in Sugar Land to the end of
the segment The assessment was performed using TCEQ specified methodology (TCEQ 2008b). In general, the assessment found that the Upper Oyster Creek system was not supporting of the intermediate aquatic life use (Hauck 2008). A summary of assessment findings regard-ing support of the intermediate aquatic life use is as follows:
§ 1245_02: not supporting § 1245_03: not supporting
Two TMDLs for Dissolved Oxygen in Upper Oyster Creek, Segment 1245
Texas Commission on Environmental Quality 5 Adopted July 2010
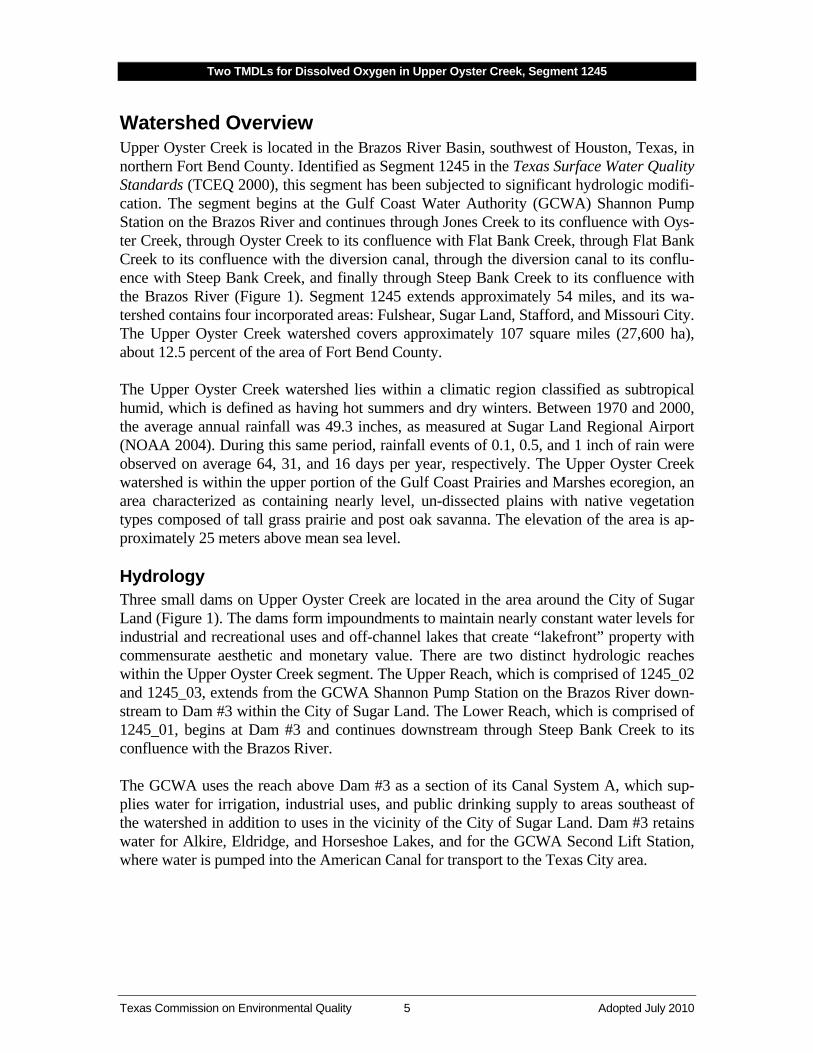
Watershed Overview Upper Oyster Creek is located in the Brazos River Basin, southwest of Houston, Texas, in northern Fort Bend County. Identified as Segment 1245 in the Texas Surface Water Quality Standards (TCEQ 2000), this segment has been subjected to significant hydrologic modifi-cation. The segment begins at the Gulf Coast Water Authority (GCWA) Shannon Pump Station on the Brazos River and continues through Jones Creek to its confluence with Oys-ter Creek, through Oyster Creek to its confluence with Flat Bank Creek, through Flat Bank Creek to its confluence with the diversion canal, through the diversion canal to its conflu-ence with Steep Bank Creek, and finally through Steep Bank Creek to its confluence with the Brazos River (Figure 1). Segment 1245 extends approximately 54 miles, and its wa-tershed contains four incorporated areas: Fulshear, Sugar Land, Stafford, and Missouri City. The Upper Oyster Creek watershed covers approximately 107 square miles (27,600 ha), about 12.5 percent of the area of Fort Bend County. The Upper Oyster Creek watershed lies within a climatic region classified as subtropical humid, which is defined as having hot summers and dry winters. Between 1970 and 2000, the average annual rainfall was 49.3 inches, as measured at Sugar Land Regional Airport (NOAA 2004). During this same period, rainfall events of 0.1, 0.5, and 1 inch of rain were observed on average 64, 31, and 16 days per year, respectively. The Upper Oyster Creek watershed is within the upper portion of the Gulf Coast Prairies and Marshes ecoregion, an area characterized as containing nearly level, un-dissected plains with native vegetation types composed of tall grass prairie and post oak savanna. The elevation of the area is ap-proximately 25 meters above mean sea level. Hydrology Three small dams on Upper Oyster Creek are located in the area around the City of Sugar Land (Figure 1). The dams form impoundments to maintain nearly constant water levels for industrial and recreational uses and off-channel lakes that create “lakefront” property with commensurate aesthetic and monetary value. There are two distinct hydrologic reaches within the Upper Oyster Creek segment. The Upper Reach, which is comprised of 1245_02 and 1245_03, extends from the GCWA Shannon Pump Station on the Brazos River down-stream to Dam #3 within the City of Sugar Land. The Lower Reach, which is comprised of 1245_01, begins at Dam #3 and continues downstream through Steep Bank Creek to its confluence with the Brazos River. The GCWA uses the reach above Dam #3 as a section of its Canal System A, which sup-plies water for irrigation, industrial uses, and public drinking supply to areas southeast of the watershed in addition to uses in the vicinity of the City of Sugar Land. Dam #3 retains water for Alkire, Eldridge, and Horseshoe Lakes, and for the GCWA Second Lift Station, where water is pumped into the American Canal for transport to the Texas City area.
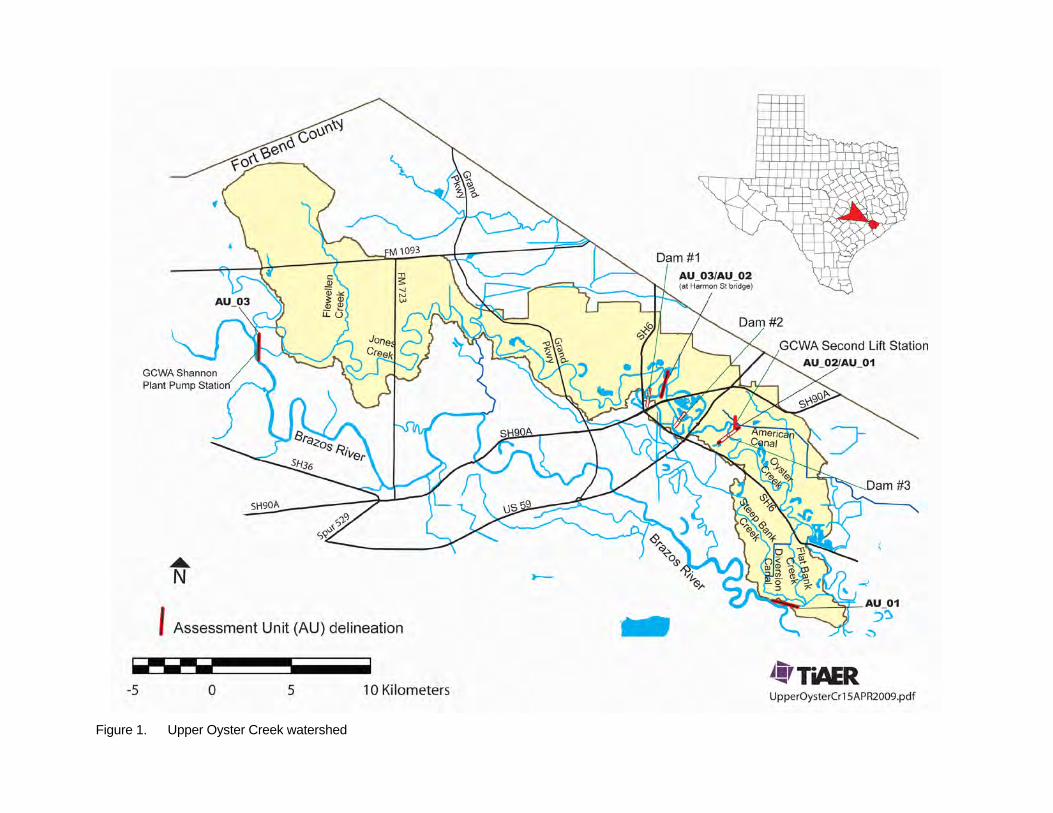
Figure 1. Upper Oyster Creek watershed
Two TMDLs for Dissolved Oxygen in Upper Oyster Creek, Segment 1245
Texas Commission on Environmental Quality 7 Adopted July 2010
Monthly pumping records from the Shannon Pump Station and the Second Lift Station for the 12-year period of 1993–2004 were obtained from the GCWA. Monthly averages of these records indicated a strong seasonal trend with minimum average pumping occurring in February (approximately 0.4 cubic meters per second [cms or m3
/s]) at the Shannon Pump Station and maximum pumping in July (approximately 4.5 cms). There is a monoton-ic increase from February to July and decrease from July to February. Historical flow data from the U.S. Geological Survey (USGS) station 08112500 located near the Shannon Pump Station indicated similar characteristics and patterns of pumped flow for a period from 1931 to 1973.
In addition to the seasonal pumping of Brazos River water into the Upper Reach via the Shannon Pump Station, there is also pumping related to precipitation and rainfall runoff. When rainfall runoff occurs in the Upper Reach, the storage capacity of the system allows pumping at the Shannon Pump Station to be curtailed and the necessary water needed at the Second Lift Station to be supplied by the rainfall runoff. Land Use The dominant land use category in the watershed is grassland, which accounts for 53 per-cent of the total area. The urban areas (high intensity and low intensity developed land) occupy 21 percent of land cover within the watershed. Other land uses include cultivated land at 11 percent, woody land at 8 percent, and others totaling 7 percent (see Figure 2). Population Density The population of the Upper Oyster Creek watershed in 2000 was estimated to be 96,273 (31,573 households) with an overall average population density of 877 persons per square mile (U.S. Census Bureau 2000). The population of Fort Bend County is estimated by the U.S. Census Bureau to have increased approximately 6 percent per year since the 2000 cen-sus. The recent (2005) population may exceed 125,000. Fort Bend County is expected to increase in population by approximately 78 percent from 2000 to 2020, according to the Texas Water Development Board (TWDB; TWDB 2006). As a result, the county expects significant increases in water demand for municipal purpos-es (65 percent increase). Smaller increases are expected for manufacturing (17 percent), mining (8 percent), and steam electric (10 percent) uses. Table 1 provides TWDB popula-tion growth estimates for selected cities within Fort Bend County from 2000 to 2020. The population estimates for Sugar Land are held constant after the year 2010 because the city is expected to be completely built-out by this date. The TWDB confirmed that previous TWDB estimates were in error because they did not account for the build-out issue. How-ever, TWDB estimates may not account for future annexations that could occur. Annexations were used to drive population growth in the 1990s. The 2000 census figures indicate a 158 percent increase in the population of Sugar Land since 1990.
Two TMDLs for Dissolved Oxygen in Upper Oyster Creek, Segment 1245
Texas Commission on Environmental Quality 8 Adopted July 2010
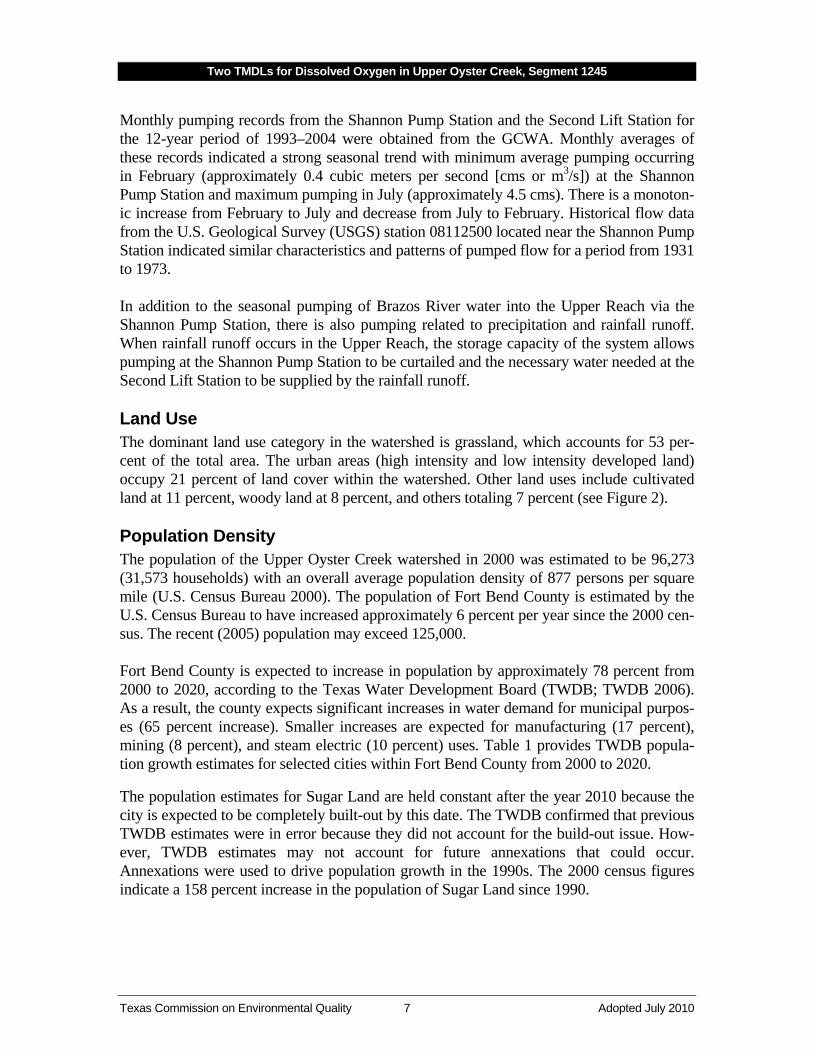
Table 1. Fort Bend County population and projected increases by city, 2000 to 2020
City 2000 Census
Population 2010 Population 2020 Population Growth Rate (2000-2020)
Fulshear 716 883 1,056 47%
Missouri City 47,419 76,768 96,601 104%
Stafford 15,371 23,026 30,959 101%
Sugar Land 63,328 72,500 72,500 14%
Source: TWDB (2006) Sewage Disposal The method of sewage disposal for housing units in the Upper Oyster Creek watershed was estimated from the 1990 federal census at the block group level. This is the best information available, because these data were not collected in the 2000 census (U.S. Census Bureau 1990). In 1990, approximately 7 percent of households (about 1,400 units) were not con-nected to a sanitary sewer system (the majority of those utilized septic tanks for sanitary waste disposal), while 93 percent were connected to a sanitary sewer system. The more rural areas of the Upper Oyster Creek watershed, primarily west of Sugar Land, are typically served by septic tanks. However, the highest density of septic tanks (approx-imately 0.2 to 0.3 per acre) was in two areas:
§ the Fifth Street area, bounded roughly by Cartwright Road on the south, Ameri-can Canal on the north and east, and farm-to-market Road 1092 on the west, and
§ the Four Corners area northwest of Sugar Land, bounded by SH 6 on the east, Old Richmond Road on the west, Voss Road on the south, and Boss-Gaston Road on the north.
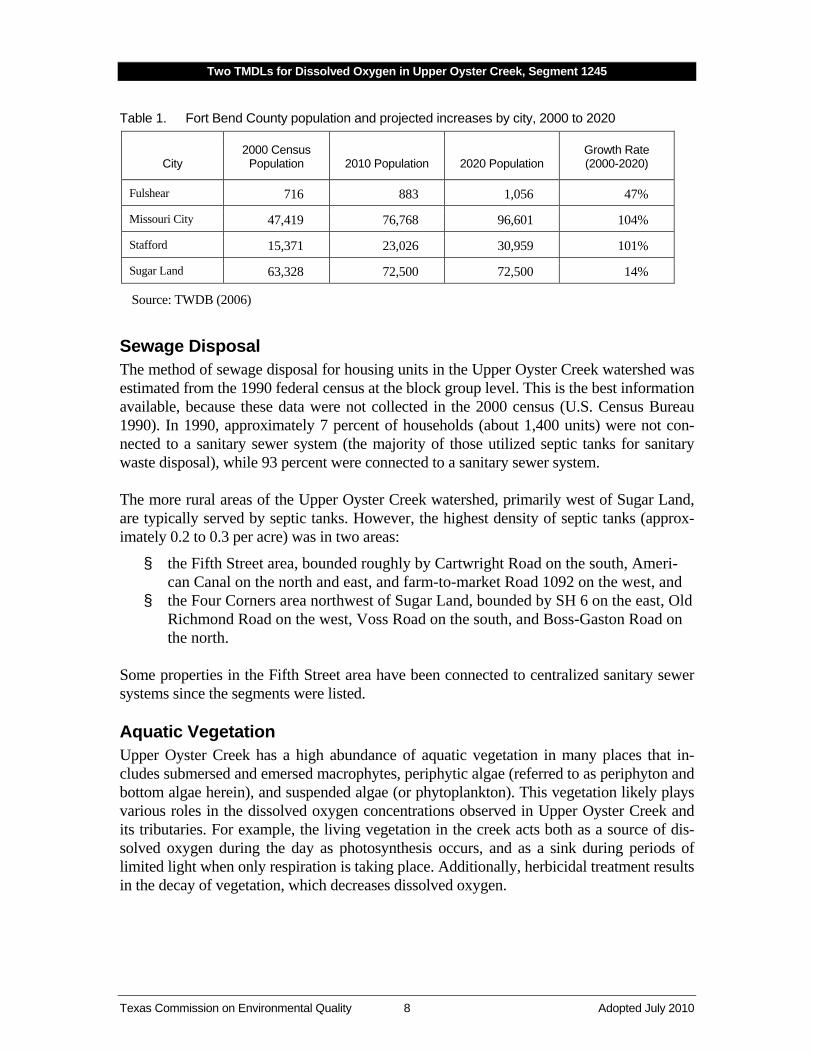
Some properties in the Fifth Street area have been connected to centralized sanitary sewer systems since the segments were listed. Aquatic Vegetation Upper Oyster Creek has a high abundance of aquatic vegetation in many places that in-cludes submersed and emersed macrophytes, periphytic algae (referred to as periphyton and bottom algae herein), and suspended algae (or phytoplankton). This vegetation likely plays various roles in the dissolved oxygen concentrations observed in Upper Oyster Creek and its tributaries. For example, the living vegetation in the creek acts both as a source of dis-solved oxygen during the day as photosynthesis occurs, and as a sink during periods of limited light when only respiration is taking place. Additionally, herbicidal treatment results in the decay of vegetation, which decreases dissolved oxygen.

Figure 2. Land use/land cover for the Upper Oyster Creek watershed (Source: Houston-Galveston Area Council, 2007)
Two TMDLs for Dissolved Oxygen in Upper Oyster Creek, Segment 1245
Texas Commission on Environmental Quality 10 Adopted July 2010
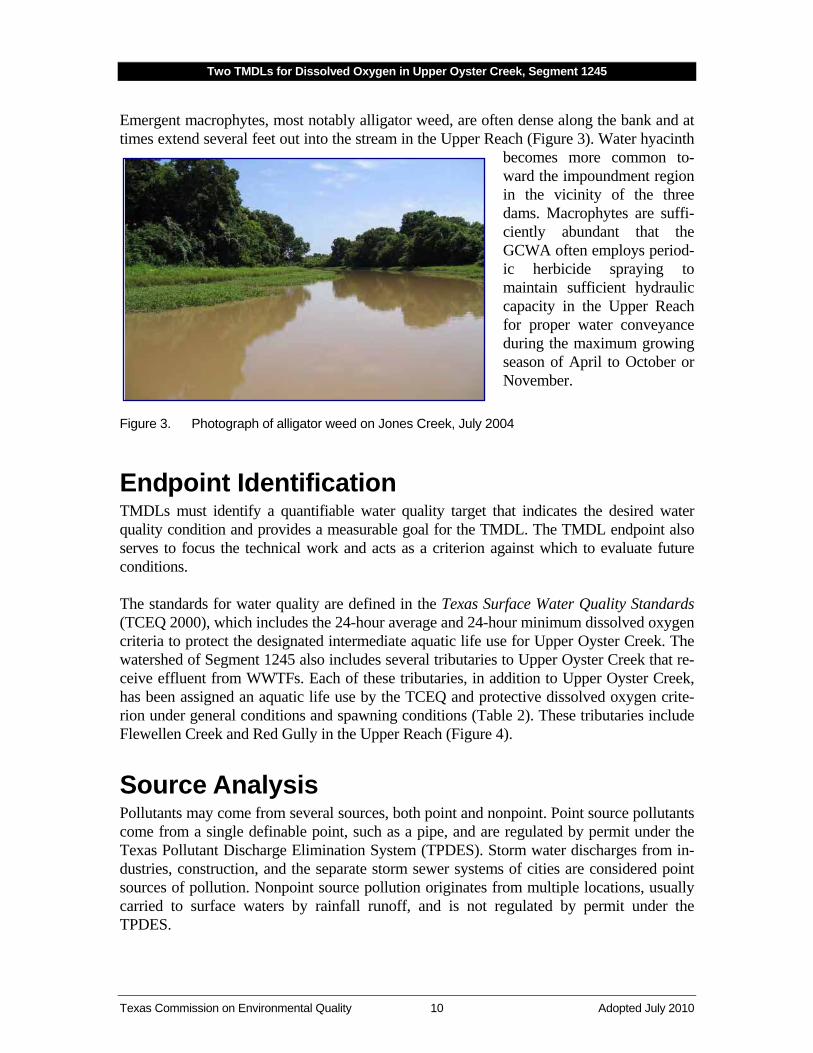
Emergent macrophytes, most notably alligator weed, are often dense along the bank and at times extend several feet out into the stream in the Upper Reach (Figure 3). Water hyacinth
becomes more common to-ward the impoundment region in the vicinity of the three dams. Macrophytes are suffi-ciently abundant that the GCWA often employs period-ic herbicide spraying to maintain sufficient hydraulic capacity in the Upper Reach for proper water conveyance during the maximum growing season of April to October or November.
Figure 3. Photograph of alligator weed on Jones Creek, July 2004
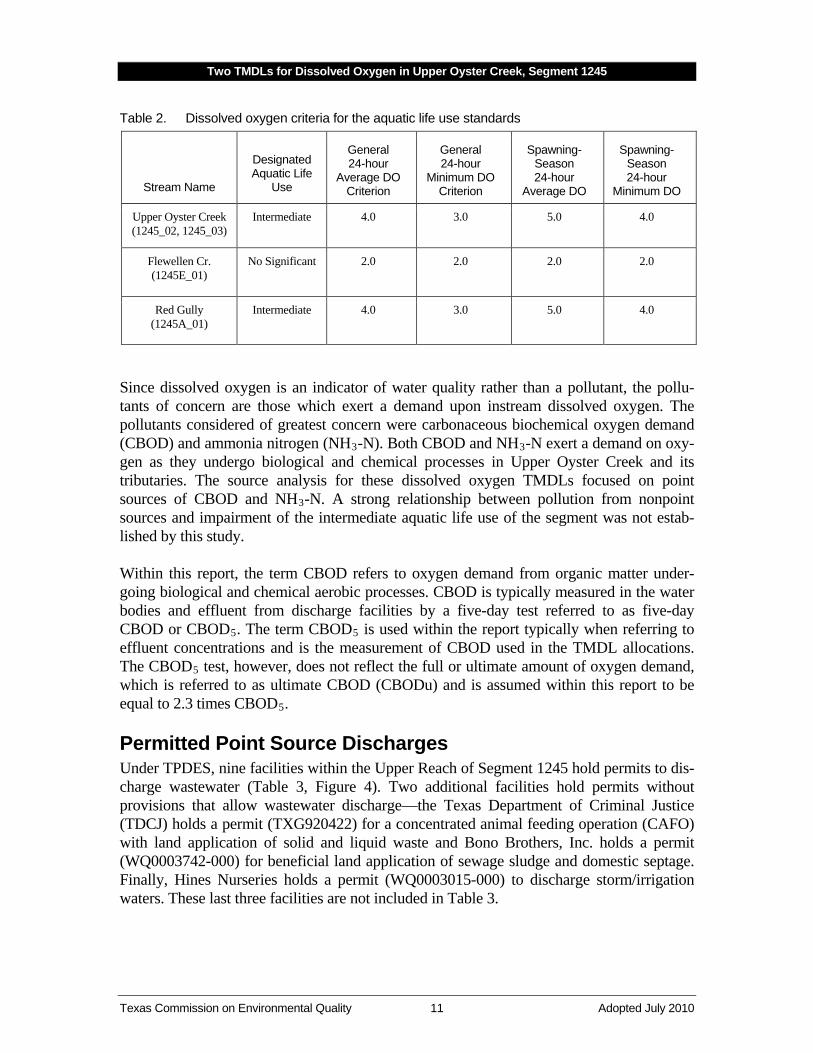
Endpoint Identification TMDLs must identify a quantifiable water quality target that indicates the desired water quality condition and provides a measurable goal for the TMDL. The TMDL endpoint also serves to focus the technical work and acts as a criterion against which to evaluate future conditions. The standards for water quality are defined in the Texas Surface Water Quality Standards (TCEQ 2000), which includes the 24-hour average and 24-hour minimum dissolved oxygen criteria to protect the designated intermediate aquatic life use for Upper Oyster Creek. The watershed of Segment 1245 also includes several tributaries to Upper Oyster Creek that re-ceive effluent from WWTFs. Each of these tributaries, in addition to Upper Oyster Creek, has been assigned an aquatic life use by the TCEQ and protective dissolved oxygen crite-rion under general conditions and spawning conditions (Table 2). These tributaries include Flewellen Creek and Red Gully in the Upper Reach (Figure 4).
Source Analysis Pollutants may come from several sources, both point and nonpoint. Point source pollutants come from a single definable point, such as a pipe, and are regulated by permit under the Texas Pollutant Discharge Elimination System (TPDES). Storm water discharges from in-dustries, construction, and the separate storm sewer systems of cities are considered point sources of pollution. Nonpoint source pollution originates from multiple locations, usually carried to surface waters by rainfall runoff, and is not regulated by permit under the TPDES.
Two TMDLs for Dissolved Oxygen in Upper Oyster Creek, Segment 1245
Texas Commission on Environmental Quality 11 Adopted July 2010
Table 2. Dissolved oxygen criteria for the aquatic life use standards
Stream Name
Designated Aquatic Life
Use
General 24-hour
Average DO Criterion
General 24-hour
Minimum DO Criterion
Spawning-Season 24-hour
Average DO
Spawning-Season 24-hour
Minimum DO
Upper Oyster Creek (1245_02, 1245_03)
Intermediate 4.0 3.0 5.0 4.0
Flewellen Cr. (1245E_01)
No Significant 2.0 2.0 2.0 2.0
Red Gully (1245A_01)
Intermediate 4.0 3.0 5.0 4.0
Since dissolved oxygen is an indicator of water quality rather than a pollutant, the pollu-tants of concern are those which exert a demand upon instream dissolved oxygen. The pollutants considered of greatest concern were carbonaceous biochemical oxygen demand
(CBOD) and ammonia nitrogen (NH3-N). Both CBOD and NH3-N exert a demand on oxy-gen as they undergo biological and chemical processes in Upper Oyster Creek and its tributaries. The source analysis for these dissolved oxygen TMDLs focused on point sources of CBOD and NH3
-N. A strong relationship between pollution from nonpoint sources and impairment of the intermediate aquatic life use of the segment was not estab-lished by this study.
Within this report, the term CBOD refers to oxygen demand from organic matter under-going biological and chemical aerobic processes. CBOD is typically measured in the water bodies and effluent from discharge facilities by a five-day test referred to as five-day CBOD or CBOD5. The term CBOD5 is used within the report typically when referring to effluent concentrations and is the measurement of CBOD used in the TMDL allocations. The CBOD5 test, however, does not reflect the full or ultimate amount of oxygen demand, which is referred to as ultimate CBOD (CBODu) and is assumed within this report to be equal to 2.3 times CBOD5
.
Permitted Point Source Discharges Under TPDES, nine facilities within the Upper Reach of Segment 1245 hold permits to dis-charge wastewater (Table 3, Figure 4). Two additional facilities hold permits without provisions that allow wastewater discharge—the Texas Department of Criminal Justice (TDCJ) holds a permit (TXG920422) for a concentrated animal feeding operation (CAFO) with land application of solid and liquid waste and Bono Brothers, Inc. holds a permit (WQ0003742-000) for beneficial land application of sewage sludge and domestic septage. Finally, Hines Nurseries holds a permit (WQ0003015-000) to discharge storm/irrigation waters. These last three facilities are not included in Table 3.
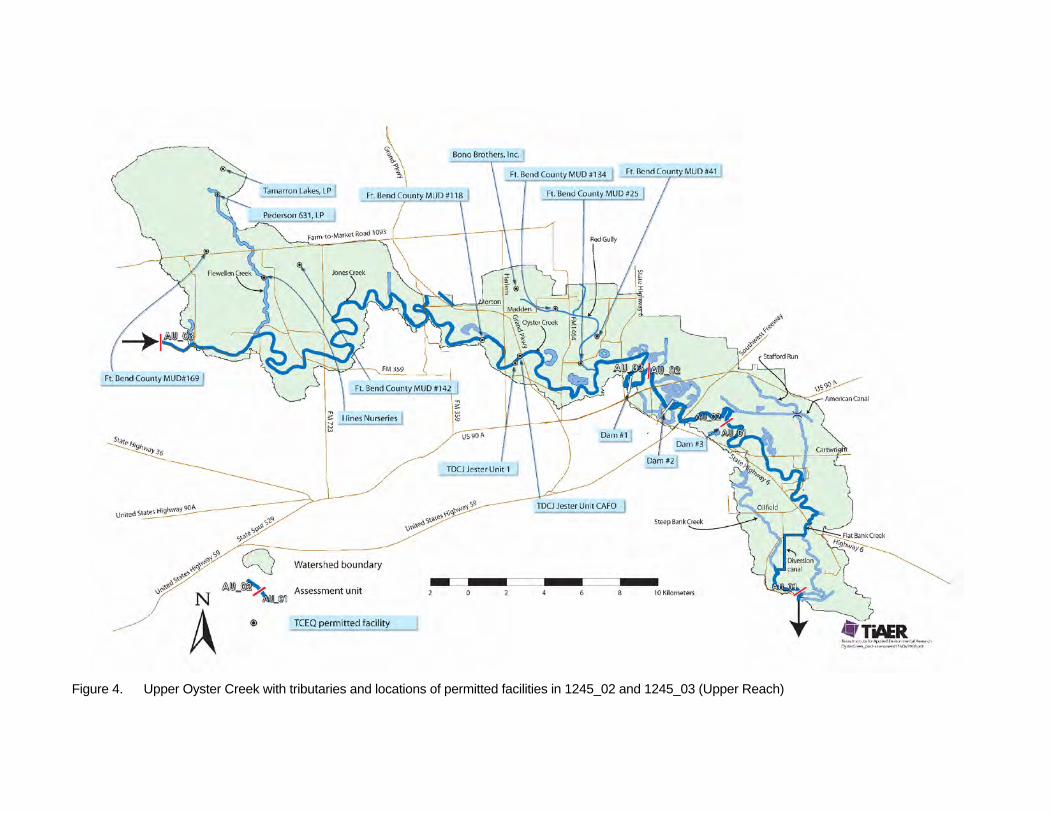
Figure 4. Upper Oyster Creek with tributaries and locations of permitted facilities in 1245_02 and 1245_03 (Upper Reach)
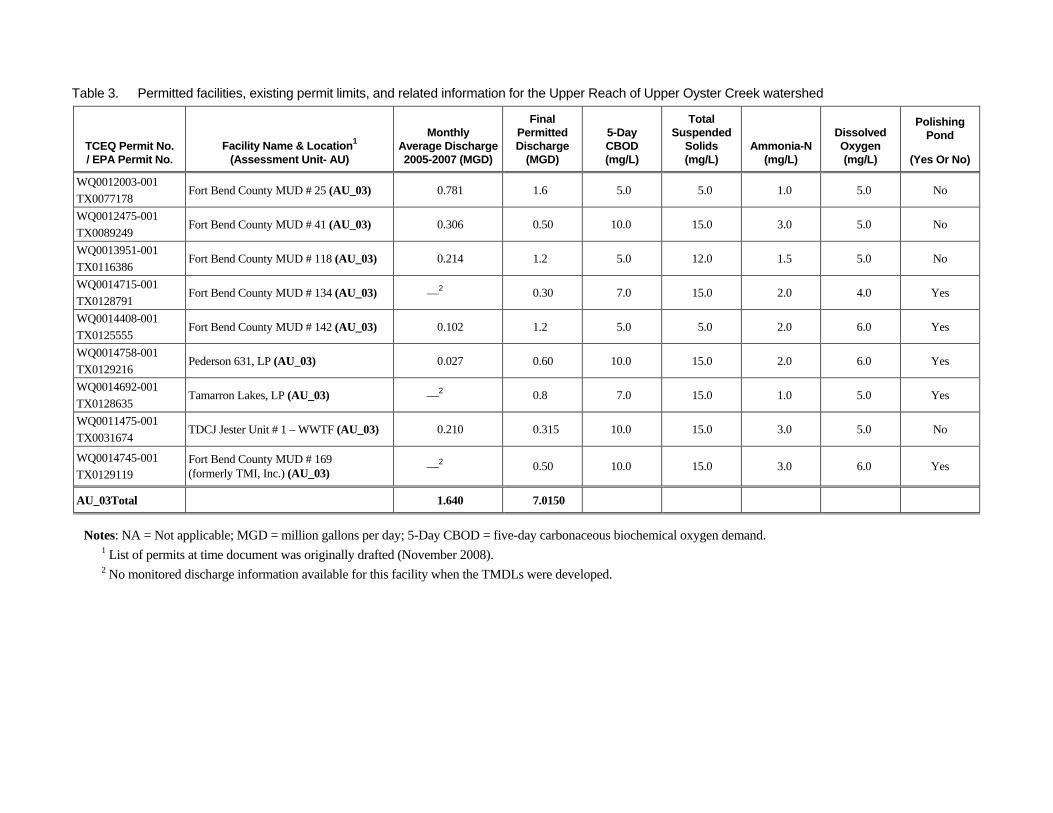
Table 3. Permitted facilities, existing permit limits, and related information for the Upper Reach of Upper Oyster Creek watershed
TCEQ Permit No. / EPA Permit No.
Facility Name & Location1Monthly
Average Discharge 2005-2007 (MGD)
(Assessment Unit- AU)
Final Permitted Discharge
(MGD)
5-Day CBOD (mg/L)
Total Suspended
Solids (mg/L)
Ammonia-N (mg/L)
Dissolved Oxygen (mg/L)
Polishing Pond
(Yes Or No)
WQ0012003-001 TX0077178
Fort Bend County MUD # 25 (AU_03) 0.781 1.6 5.0 5.0 1.0 5.0 No
WQ0012475-001 TX0089249
Fort Bend County MUD # 41 (AU_03) 0.306 0.50 10.0 15.0 3.0 5.0 No
WQ0013951-001 TX0116386
Fort Bend County MUD # 118 (AU_03) 0.214 1.2 5.0 12.0 1.5 5.0 No
WQ0014715-001 TX0128791
Fort Bend County MUD # 134 (AU_03) — 0.30 2 7.0 15.0 2.0 4.0 Yes
WQ0014408-001 TX0125555
Fort Bend County MUD # 142 (AU_03) 0.102 1.2 5.0 5.0 2.0 6.0 Yes
WQ0014758-001 TX0129216
Pederson 631, LP (AU_03) 0.027 0.60 10.0 15.0 2.0 6.0 Yes
WQ0014692-001 TX0128635
Tamarron Lakes, LP (AU_03) — 0.8 2 7.0 15.0 1.0 5.0 Yes
WQ0011475-001 TX0031674
TDCJ Jester Unit # 1 – WWTF (AU_03) 0.210 0.315 10.0 15.0 3.0 5.0 No
WQ0014745-001 TX0129119
Fort Bend County MUD # 169 (formerly TMI, Inc.) (AU_03) — 0.50 2 10.0 15.0 3.0 6.0 Yes
AU_03Total 1.640 7.0150
Notes: NA = Not applicable; MGD = million gallons per day; 5-Day CBOD = five-day carbonaceous biochemical oxygen demand. 1 List of permits at time document was originally drafted (November 2008). 2 No monitored discharge information available for this facility when the TMDLs were developed.

Two TMDLs for Dissolved Oxygen in Upper Oyster Creek, Segment 1245
Texas Commission on Environmental Quality 14 Adopted July 2010
All entities holding active TPDES discharge permits are domestic wastewater (sewage) treatment facilities. From approximately 2005 to 2007, the reported average daily domestic wastewater discharge to the Upper Reach of Segment 1245 was 1.6 million gallons per day (MGD). This is well below the permitted daily flow of 7.0 MGD. A number of facilities have recently become operational in the Upper Reach and no monitored discharge informa-tion is available for the most recent of these facilities. Increasing discharge limits for some municipal permittees within the segment and adding new discharge permits in recent years indicate a steadily increasing wastewater input of CBOD and NH3
-N loadings into the segment commensurate with the rapid urbanization of the watershed.
Within the Upper Reach watershed, three wastewater facilities are permitted to discharge greater than 1 MGD ─ Fort Bend County MUDs #s 25, 118, and 142. As indicated in Table 3, several facilities are designed such that effluent enters a polishing pond prior to final dis-charge. Based on the TCEQ evaluations of the facilities with polishing ponds, the final effluent from each facility was considered to be at background levels of 5-day CBOD (CBOD5; 1.3 mg/L) and NH3
-N (0.050 mg/L) (personal communications with Mr. Mark Rudolph, P.E., TCEQ, June 2007).
In 2001, the Texas Institute for Applied Environmental Research (TIAER) reviewed the TPDES permit files to identify enforcement actions or other persistent problems with per-mitted discharge facilities within Segment 1245. This review was updated in 2005 and October 2008 by reviewing the discharge monitoring reports (DMR) from the Permit Com-pliance System (PCS) downloaded from the EPA Envirofacts Data Warehouse (EPA 2005 & 2008). No enforcement actions were uncovered in the screening. Some minor violations were found in the review of TCEQ permit files in 2001. However, all these violations have been resolved as evidenced in the more recent reviews of permit information in PCS. Imperial Sugar Corporation resolved a recurring violation regarding the annual certification of accuracy for pumping capacity used to measure flow, which was observed on biannual inspections in 1996 and 1998. However, this facility ceased operation in late 2003 and is not listed in Table 3. Efforts to improve water quality problems have a long history in Upper Oyster Creek. A number of significant changes and improvements in water treatment and discharges have occurred, likely resulting in better water quality. Kolbe (1992) reports:
§ Prior to 1975, the City of Sugar Land operated three wastewater treatment facilities (WWTFs) that discharged into the Upper Reach; but, beginning in 1975, these facil-ities were closed and the sewage was piped to the Brazos River Authority’s (BRA) Sugar Land Regional WWTF, which does not discharge in Segment 1245.
§ The Hines Horticulture direct discharge was removed in 1990 and reduced to storm water overflow releases.
§ Wastewater treatment at the TDCJ unit has been improved since the late 1980s. At roughly the same time, animal waste was addressed through a consolidated feedlot permit issued by a predecessor agency to the TCEQ.
Two TMDLs for Dissolved Oxygen in Upper Oyster Creek, Segment 1245
Texas Commission on Environmental Quality 15 Adopted July 2010
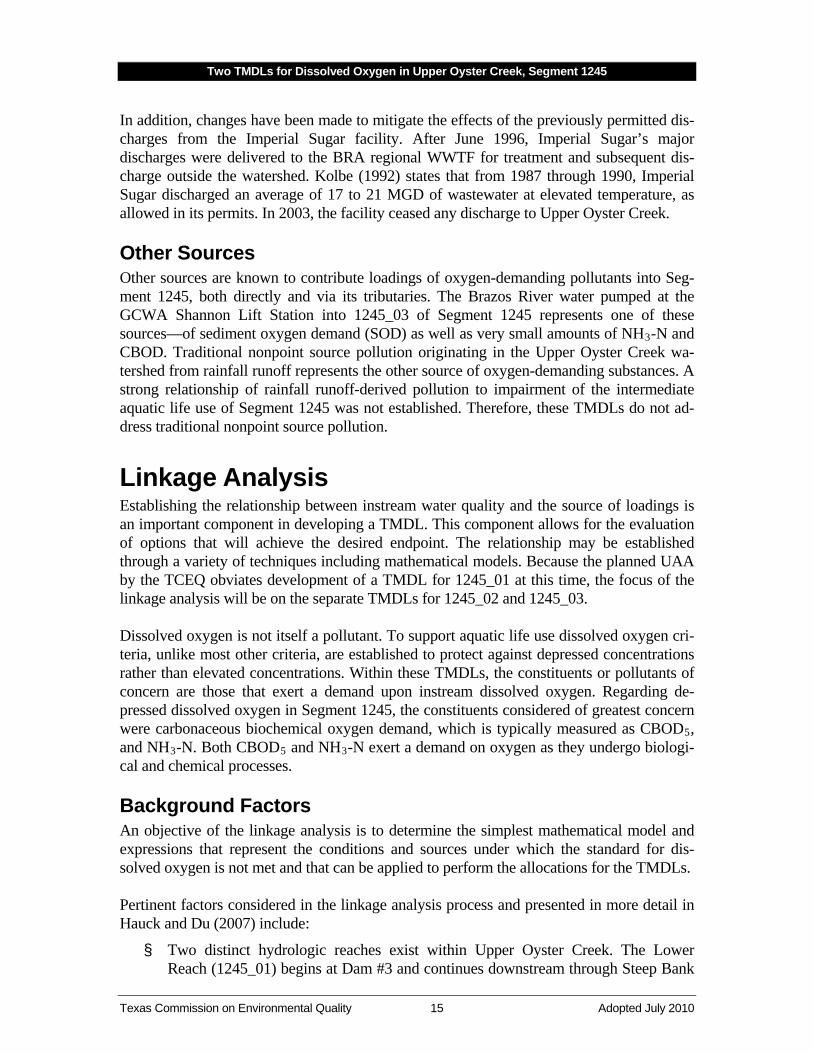
In addition, changes have been made to mitigate the effects of the previously permitted dis-charges from the Imperial Sugar facility. After June 1996, Imperial Sugar’s major discharges were delivered to the BRA regional WWTF for treatment and subsequent dis-charge outside the watershed. Kolbe (1992) states that from 1987 through 1990, Imperial Sugar discharged an average of 17 to 21 MGD of wastewater at elevated temperature, as allowed in its permits. In 2003, the facility ceased any discharge to Upper Oyster Creek. Other Sources Other sources are known to contribute loadings of oxygen-demanding pollutants into Seg-ment 1245, both directly and via its tributaries. The Brazos River water pumped at the GCWA Shannon Lift Station into 1245_03 of Segment 1245 represents one of these sources—of sediment oxygen demand (SOD) as well as very small amounts of NH3
-N and CBOD. Traditional nonpoint source pollution originating in the Upper Oyster Creek wa-tershed from rainfall runoff represents the other source of oxygen-demanding substances. A strong relationship of rainfall runoff-derived pollution to impairment of the intermediate aquatic life use of Segment 1245 was not established. Therefore, these TMDLs do not ad-dress traditional nonpoint source pollution.
Linkage Analysis Establishing the relationship between instream water quality and the source of loadings is an important component in developing a TMDL. This component allows for the evaluation of options that will achieve the desired endpoint. The relationship may be established through a variety of techniques including mathematical models. Because the planned UAA by the TCEQ obviates development of a TMDL for 1245_01 at this time, the focus of the linkage analysis will be on the separate TMDLs for 1245_02 and 1245_03. Dissolved oxygen is not itself a pollutant. To support aquatic life use dissolved oxygen cri-teria, unlike most other criteria, are established to protect against depressed concentrations rather than elevated concentrations. Within these TMDLs, the constituents or pollutants of concern are those that exert a demand upon instream dissolved oxygen. Regarding de-pressed dissolved oxygen in Segment 1245, the constituents considered of greatest concern were carbonaceous biochemical oxygen demand, which is typically measured as CBOD5, and NH3-N. Both CBOD5 and NH3
-N exert a demand on oxygen as they undergo biologi-cal and chemical processes.
Background Factors An objective of the linkage analysis is to determine the simplest mathematical model and expressions that represent the conditions and sources under which the standard for dis-solved oxygen is not met and that can be applied to perform the allocations for the TMDLs. Pertinent factors considered in the linkage analysis process and presented in more detail in Hauck and Du (2007) include:
§ Two distinct hydrologic reaches exist within Upper Oyster Creek. The Lower Reach (1245_01) begins at Dam #3 and continues downstream through Steep Bank
Two TMDLs for Dissolved Oxygen in Upper Oyster Creek, Segment 1245
Texas Commission on Environmental Quality 16 Adopted July 2010
Creek to its confluence with the Brazos River. The Upper Reach (1245_02 and 1245_03) extends downstream from the GCWA Shannon Pump Station on the Bra-zos River to Dam #3 within the City of Sugar Land.
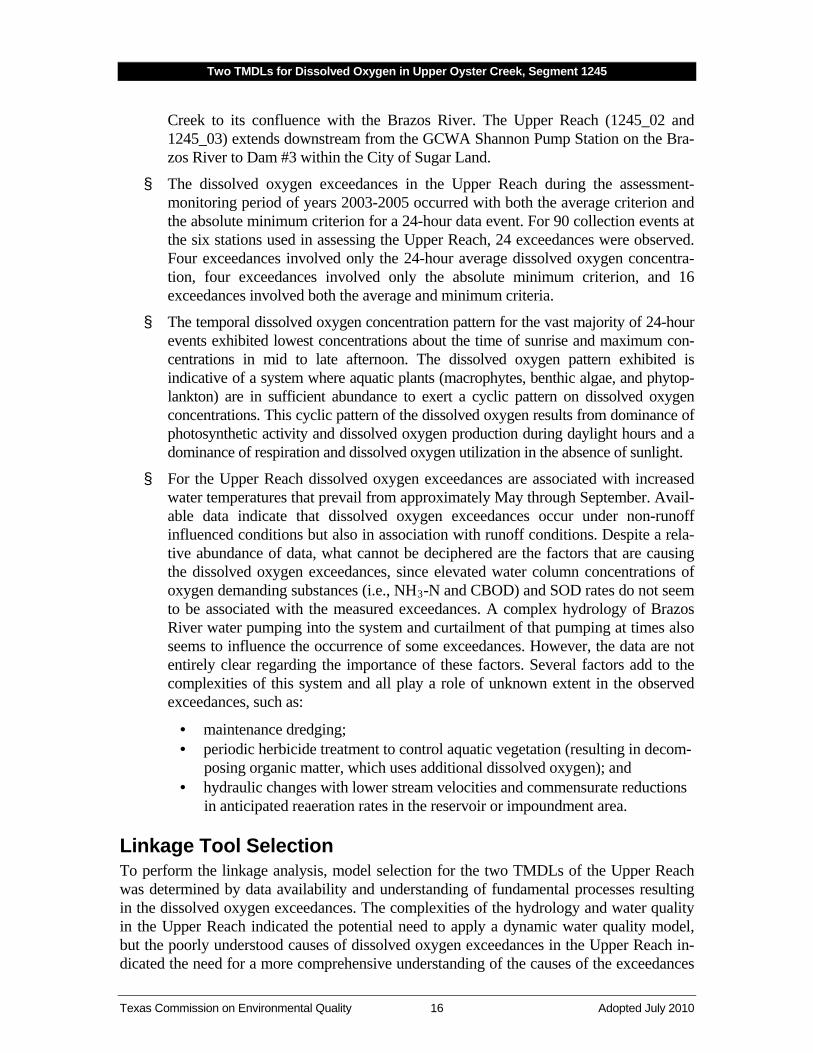
§ The dissolved oxygen exceedances in the Upper Reach during the assessment-monitoring period of years 2003-2005 occurred with both the average criterion and the absolute minimum criterion for a 24-hour data event. For 90 collection events at the six stations used in assessing the Upper Reach, 24 exceedances were observed. Four exceedances involved only the 24-hour average dissolved oxygen concentra-tion, four exceedances involved only the absolute minimum criterion, and 16 exceedances involved both the average and minimum criteria.
§ The temporal dissolved oxygen concentration pattern for the vast majority of 24-hour events exhibited lowest concentrations about the time of sunrise and maximum con-centrations in mid to late afternoon. The dissolved oxygen pattern exhibited is indicative of a system where aquatic plants (macrophytes, benthic algae, and phytop-lankton) are in sufficient abundance to exert a cyclic pattern on dissolved oxygen concentrations. This cyclic pattern of the dissolved oxygen results from dominance of photosynthetic activity and dissolved oxygen production during daylight hours and a dominance of respiration and dissolved oxygen utilization in the absence of sunlight.
§ For the Upper Reach dissolved oxygen exceedances are associated with increased water temperatures that prevail from approximately May through September. Avail-able data indicate that dissolved oxygen exceedances occur under non-runoff influenced conditions but also in association with runoff conditions. Despite a rela-tive abundance of data, what cannot be deciphered are the factors that are causing the dissolved oxygen exceedances, since elevated water column concentrations of oxygen demanding substances (i.e., NH3
· maintenance dredging;
-N and CBOD) and SOD rates do not seem to be associated with the measured exceedances. A complex hydrology of Brazos River water pumping into the system and curtailment of that pumping at times also seems to influence the occurrence of some exceedances. However, the data are not entirely clear regarding the importance of these factors. Several factors add to the complexities of this system and all play a role of unknown extent in the observed exceedances, such as:
· periodic herbicide treatment to control aquatic vegetation (resulting in decom-posing organic matter, which uses additional dissolved oxygen); and
· hydraulic changes with lower stream velocities and commensurate reductions in anticipated reaeration rates in the reservoir or impoundment area.
Linkage Tool Selection To perform the linkage analysis, model selection for the two TMDLs of the Upper Reach was determined by data availability and understanding of fundamental processes resulting in the dissolved oxygen exceedances. The complexities of the hydrology and water quality in the Upper Reach indicated the potential need to apply a dynamic water quality model, but the poorly understood causes of dissolved oxygen exceedances in the Upper Reach in-dicated the need for a more comprehensive understanding of the causes of the exceedances
Two TMDLs for Dissolved Oxygen in Upper Oyster Creek, Segment 1245
Texas Commission on Environmental Quality 17 Adopted July 2010
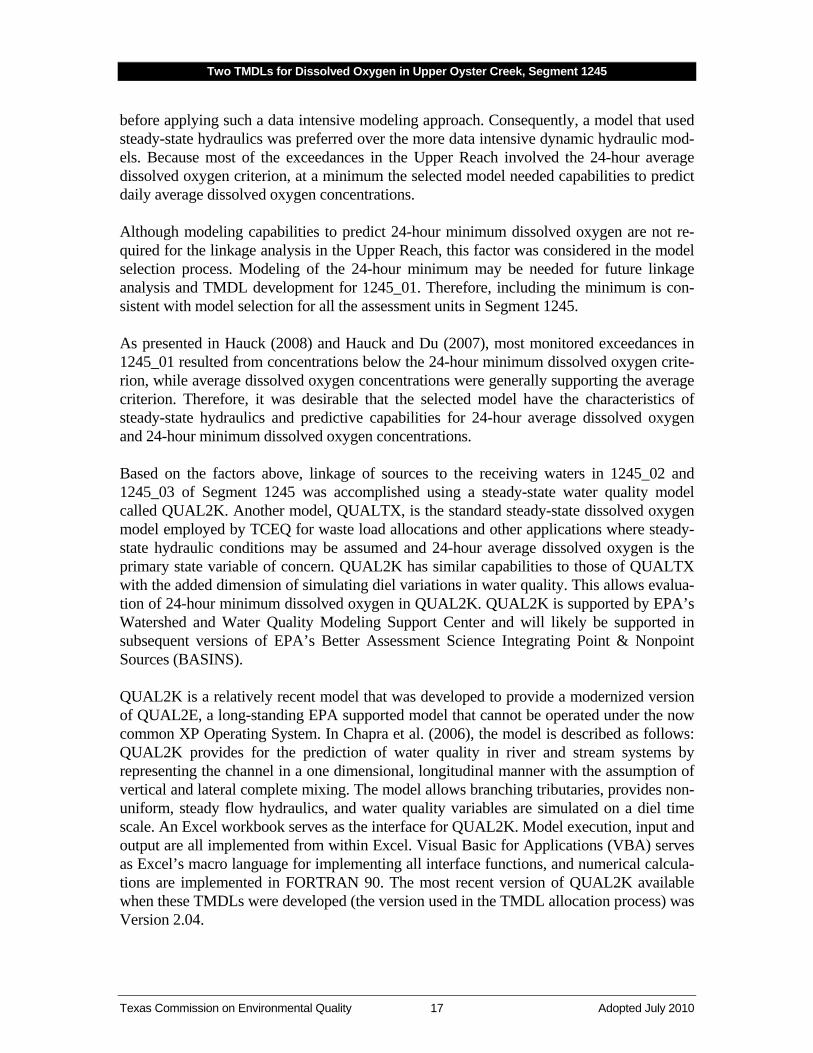
before applying such a data intensive modeling approach. Consequently, a model that used steady-state hydraulics was preferred over the more data intensive dynamic hydraulic mod-els. Because most of the exceedances in the Upper Reach involved the 24-hour average dissolved oxygen criterion, at a minimum the selected model needed capabilities to predict daily average dissolved oxygen concentrations. Although modeling capabilities to predict 24-hour minimum dissolved oxygen are not re-quired for the linkage analysis in the Upper Reach, this factor was considered in the model selection process. Modeling of the 24-hour minimum may be needed for future linkage analysis and TMDL development for 1245_01. Therefore, including the minimum is con-sistent with model selection for all the assessment units in Segment 1245. As presented in Hauck (2008) and Hauck and Du (2007), most monitored exceedances in 1245_01 resulted from concentrations below the 24-hour minimum dissolved oxygen crite-rion, while average dissolved oxygen concentrations were generally supporting the average criterion. Therefore, it was desirable that the selected model have the characteristics of steady-state hydraulics and predictive capabilities for 24-hour average dissolved oxygen and 24-hour minimum dissolved oxygen concentrations. Based on the factors above, linkage of sources to the receiving waters in 1245_02 and 1245_03 of Segment 1245 was accomplished using a steady-state water quality model called QUAL2K. Another model, QUALTX, is the standard steady-state dissolved oxygen model employed by TCEQ for waste load allocations and other applications where steady-state hydraulic conditions may be assumed and 24-hour average dissolved oxygen is the primary state variable of concern. QUAL2K has similar capabilities to those of QUALTX with the added dimension of simulating diel variations in water quality. This allows evalua-tion of 24-hour minimum dissolved oxygen in QUAL2K. QUAL2K is supported by EPA’s Watershed and Water Quality Modeling Support Center and will likely be supported in subsequent versions of EPA’s Better Assessment Science Integrating Point & Nonpoint Sources (BASINS). QUAL2K is a relatively recent model that was developed to provide a modernized version of QUAL2E, a long-standing EPA supported model that cannot be operated under the now common XP Operating System. In Chapra et al. (2006), the model is described as follows: QUAL2K provides for the prediction of water quality in river and stream systems by representing the channel in a one dimensional, longitudinal manner with the assumption of vertical and lateral complete mixing. The model allows branching tributaries, provides non-uniform, steady flow hydraulics, and water quality variables are simulated on a diel time scale. An Excel workbook serves as the interface for QUAL2K. Model execution, input and output are all implemented from within Excel. Visual Basic for Applications (VBA) serves as Excel’s macro language for implementing all interface functions, and numerical calcula-tions are implemented in FORTRAN 90. The most recent version of QUAL2K available when these TMDLs were developed (the version used in the TMDL allocation process) was Version 2.04.

Two TMDLs for Dissolved Oxygen in Upper Oyster Creek, Segment 1245
Texas Commission on Environmental Quality 18 Adopted July 2010
Validation of QUAL2K Model of the Upper Reach A QUAL2K model was developed for the Upper Reach that represented the hydraulic, physical, biological, and chemical characteristics of 1245_02 and 1245_03, major tributa-ries, and the WWTFs discharging into the Upper Reach (Figure 5). The model validation step establishes model reliability, acceptability, and robustness for use in developing the TMDL allocations. The QUAL2K model was developed using separate calibration and ve-rification steps, which collectively are referred to as validation, and which can be defined as follows:
§ Calibration—the first stage testing and tuning of a model to a set of observational data, such that the tuning results in a consistent and rational set of theoretically de-fensible input parameters.
§ Verification—Subsequent testing of a calibrated model to additional observational data to further examine model validity, preferably under different external condi-tions from those used during calibration (Thomann and Mueller 1987).
The validated model provided sufficiently good predictions of all relevant water quality consti-tuents. Therefore, the model is considered acceptable for use in determining TMDL allocations. Hence, calibration was performed as a systematic procedure of selecting model input para-meters that resulted in model predictions best matching the observational data. In addition, the adjustments of input parameters were restricted to be within literature-suggested ranges from such sources as TNRCC (1995) and Bowie et al. (1985). For any input parameters without direct measurement within the project area or literature values, professional judg-ment was used. Within the separate verification step, the input parameters defining such items as kinetic rates were kept at the values used in the calibration step and separate sets of observational data were used for comparison purposes. Observational data for validation of QUAL2K were available from intensive data collection efforts (intensive surveys) conducted in the Upper Oyster Creek system in May and August 2004. In recognition of the hydrologic separation provided by Dam #3, the surveys were con-ducted separately for the Lower and Upper Reaches. The two intensive dissolved oxygen surveys were performed at 21 stream monitoring stations (Upper Oyster Creek and tributa-ries) and at all nine permitted discharges in Segment 1245 that were active during the summer of 2004. Of these, 15 monitoring stations and four permitted facilities were located on the Upper Reach and its tributaries. These surveys occurred during relatively steady-flow conditions with minimal interference from rainfall runoff and under two different con-ditions of temperature and streamflow. The two surveys for the Upper Reach were conducted May 25–28, 2004, and August 16–19, 2004. Each intensive survey included:
§ 24-hour measurements of dissolved oxygen, temperature, specific conductance, and pH;
§ Ambient water quality grab samples collected at 6-hour intervals for compositing;
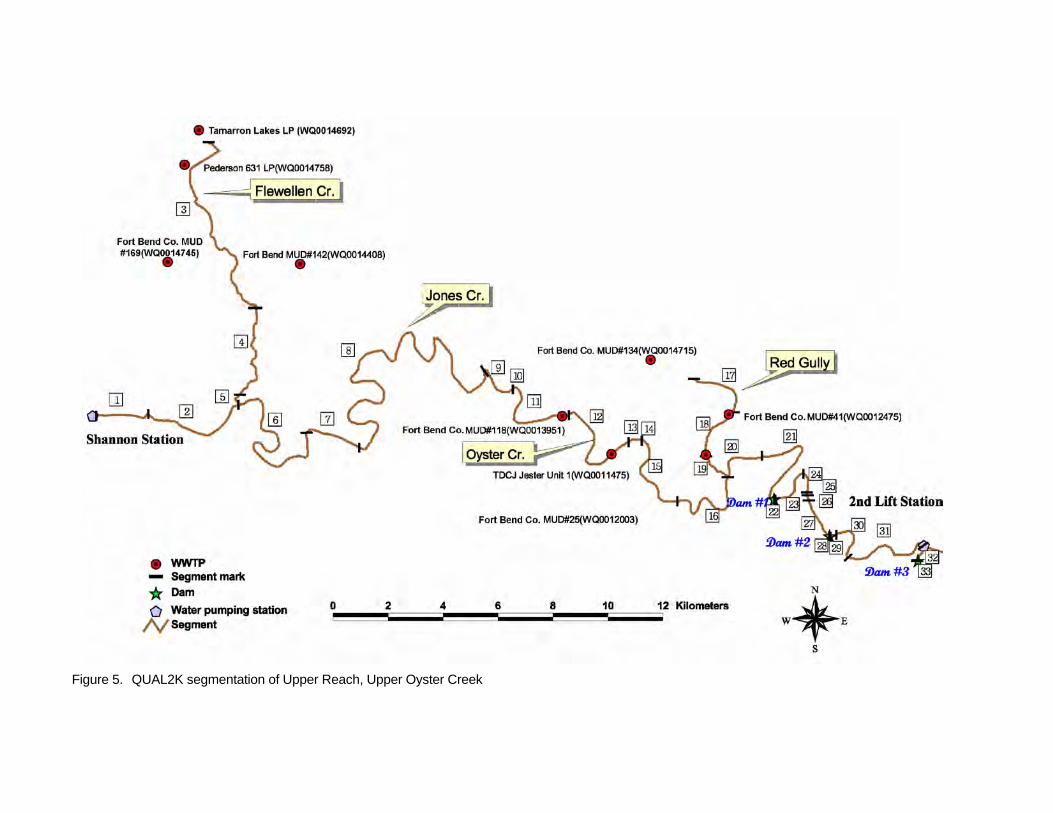
Figure 5. QUAL2K segmentation of Upper Reach, Upper Oyster Creek
Two TMDLs for Dissolved Oxygen in Upper Oyster Creek, Segment 1245
Texas Commission on Environmental Quality 20 Adopted July 2010
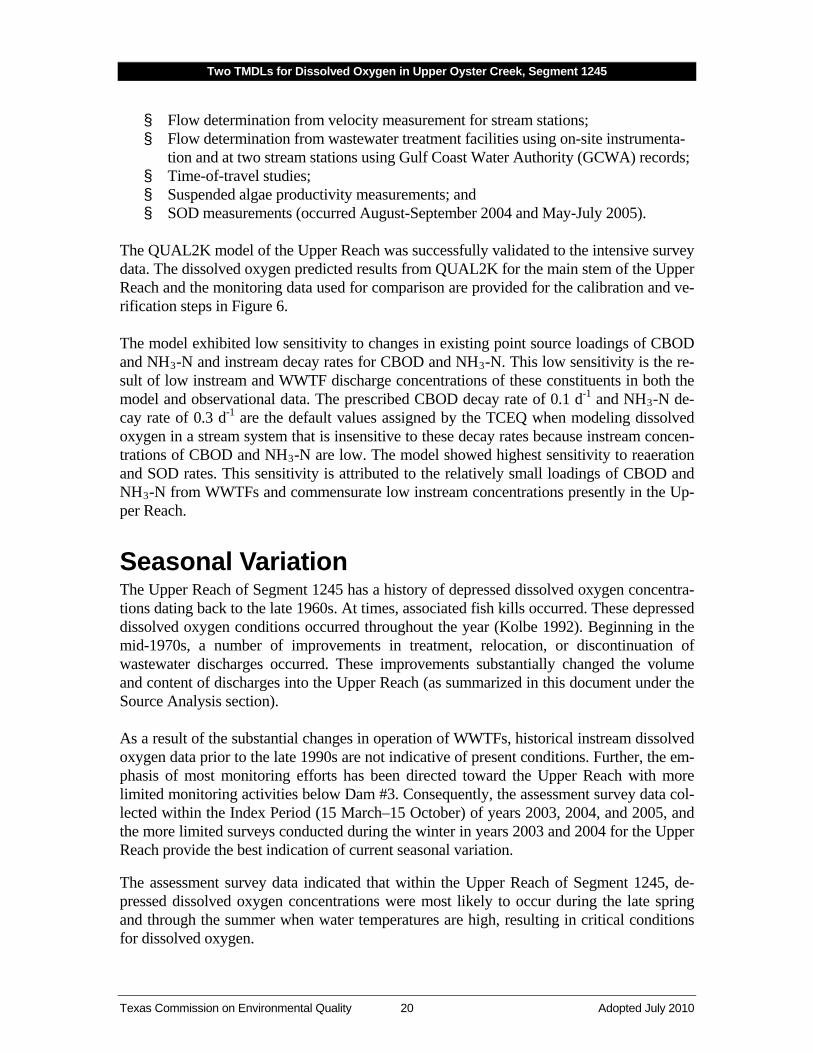
§ Flow determination from velocity measurement for stream stations; § Flow determination from wastewater treatment facilities using on-site instrumenta-
tion and at two stream stations using Gulf Coast Water Authority (GCWA) records; § Time-of-travel studies; § Suspended algae productivity measurements; and § SOD measurements (occurred August-September 2004 and May-July 2005).
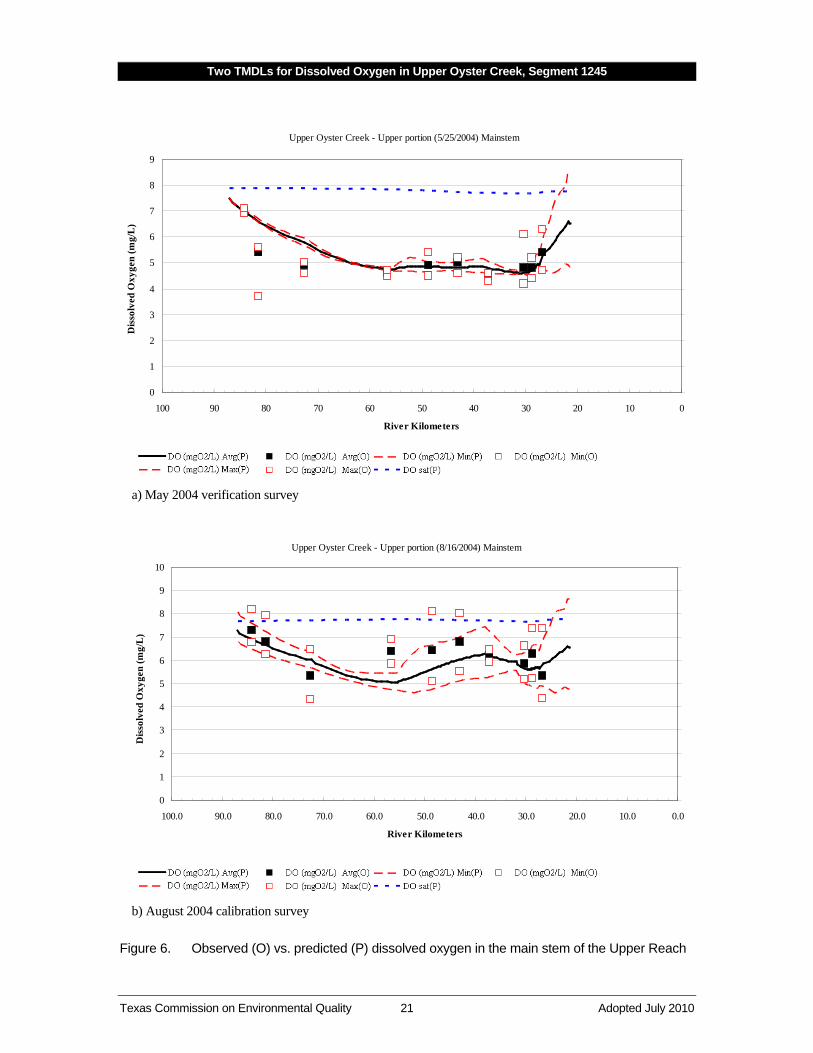
The QUAL2K model of the Upper Reach was successfully validated to the intensive survey data. The dissolved oxygen predicted results from QUAL2K for the main stem of the Upper Reach and the monitoring data used for comparison are provided for the calibration and ve-rification steps in Figure 6. The model exhibited low sensitivity to changes in existing point source loadings of CBOD and NH3-N and instream decay rates for CBOD and NH3-N. This low sensitivity is the re-sult of low instream and WWTF discharge concentrations of these constituents in both the model and observational data. The prescribed CBOD decay rate of 0.1 d-1 and NH3-N de-cay rate of 0.3 d-1 are the default values assigned by the TCEQ when modeling dissolved oxygen in a stream system that is insensitive to these decay rates because instream concen-trations of CBOD and NH3-N are low. The model showed highest sensitivity to reaeration and SOD rates. This sensitivity is attributed to the relatively small loadings of CBOD and NH3
-N from WWTFs and commensurate low instream concentrations presently in the Up-per Reach.
Seasonal Variation The Upper Reach of Segment 1245 has a history of depressed dissolved oxygen concentra-tions dating back to the late 1960s. At times, associated fish kills occurred. These depressed dissolved oxygen conditions occurred throughout the year (Kolbe 1992). Beginning in the mid-1970s, a number of improvements in treatment, relocation, or discontinuation of wastewater discharges occurred. These improvements substantially changed the volume and content of discharges into the Upper Reach (as summarized in this document under the Source Analysis section). As a result of the substantial changes in operation of WWTFs, historical instream dissolved oxygen data prior to the late 1990s are not indicative of present conditions. Further, the em-phasis of most monitoring efforts has been directed toward the Upper Reach with more limited monitoring activities below Dam #3. Consequently, the assessment survey data col-lected within the Index Period (15 March–15 October) of years 2003, 2004, and 2005, and the more limited surveys conducted during the winter in years 2003 and 2004 for the Upper Reach provide the best indication of current seasonal variation. The assessment survey data indicated that within the Upper Reach of Segment 1245, de-pressed dissolved oxygen concentrations were most likely to occur during the late spring and through the summer when water temperatures are high, resulting in critical conditions for dissolved oxygen.
Two TMDLs for Dissolved Oxygen in Upper Oyster Creek, Segment 1245
Texas Commission on Environmental Quality 21 Adopted July 2010
Upper Oyster Creek - Upper portion (5/25/2004) Mainstem
0
1
2
3
4
5
6
7
8
9
0102030405060708090100
River Kilometers
Dis
solv
ed O
xyge
n (m
g/L
)
a) May 2004 verification survey
Upper Oyster Creek - Upper portion (8/16/2004) Mainstem
0
1
2
3
4
5
6
7
8
9
10
0.010.020.030.040.050.060.070.080.090.0100.0
River Kilometers
Dis
solv
ed O
xyge
n (m
g/L
)
b) August 2004 calibration survey
Figure 6. Observed (O) vs. predicted (P) dissolved oxygen in the main stem of the Upper Reach
Two TMDLs for Dissolved Oxygen in Upper Oyster Creek, Segment 1245
Texas Commission on Environmental Quality 22 Adopted July 2010
Margin of Safety The margin of safety (MOS) should account for uncertainty in the analysis used to devel-op the TMDL and thus provide a higher level of assurance that the goal of the TMDL will be met. According to EPA guidance (EPA 1991), the MOS can be incorporated into the TMDL using two methods:
§ implicitly incorporating the MOS using conservative model assumptions to develop allocations; or
§ explicitly specifying a portion of the TMDL as the MOS and using the remainder for allocations.
The MOS is designed to account for any uncertainty that may arise in specifying water quality control strategies for the complex environmental processes that affect water quality. Quantification of this uncertainty, to the extent possible, is the basis for assigning a margin of safety. An implicit MOS based on conservative model assumptions is used in these two TMDLs. First, the evaluation was performed under full permitted limits during critical low-flow conditions, which is an extremely unlikely combination of circumstances. Second, conserv-ative assumptions were made regarding some model input parameters, such as:
§ specification of the settling velocities in the Upper Reach at values from the calibra-tion and verification cases that gave lower dissolved oxygen concentrations; and
§ use of the theoretical oxygen requirement for NH3
-N nitrification of 4.57-gram oxygen per gram of nitrogen (instead of the value of 4.33 used by the TCEQ in their modeling efforts for waste load evaluations).
Pollutant Load Allocation The TMDL represents the maximum amount of a pollutant that the stream can receive in a single day without exceeding the water quality standard. The load allocations for these TMDLs are calculated using the following equation:
TMDL = Σ WLA + Σ LA + MOS Where:
WLA = waste load allocation (point source contributions) LA = load allocation (nonpoint source contributions) MOS = margin of safety
Typically, several possible allocation strategies would achieve the TMDL endpoint and wa-ter quality standards. Available control options depend on the number, location, and character of pollutant sources. For dissolved oxygen exceedances, the pollutants most closely related to the impairment are CBOD5 and NH3
-N.
Two TMDLs for Dissolved Oxygen in Upper Oyster Creek, Segment 1245
Texas Commission on Environmental Quality 23 Adopted July 2010
Predominately the dissolved oxygen exceedances appeared to occur under flow conditions that approached steady state conditions as opposed to dynamic flow conditions under the influence of rainfall runoff. The TMDL allocation process, therefore, emphasized regulated point source contributions from WWTFs and contributions from the Brazos River water pumped into the system. For the TMDL allocation process as defined in the equation above, WLA and LA included various sources of CBOD5 and NH3
-N. WLA was defined as contributions from WWTFs. For 1245_03, LA was defined as critical low-flow background contributions from the wa-tershed of 1245_03 and from the pumped Brazos River water. For downstream 1245_02, LA was defined as critical low-flow background contributions from the watershed of 1245_02 plus the contributions entering the assessment unit in Oyster Creek from upstream 1245_03.
These TMDL allocations are for the critical low-flow condition. The allocations are not in-tended to characterize allowable loadings for regulated and unregulated storm water sources. Regulated storm water discharges are included in the Phase II permits for entities in the Upper Reach. These TMDLs presume that implementation of best management prac-tices (BMPs) identified in each of these Phase II permits will not cause or contribute to violation of water quality standards during the critical low-flow period. The WLA identi-fied in this document is for WWTFs, not regulated storm water discharges. Monitoring of the WWTF discharges and evaluation of BMP effectiveness over time will determine if this presumption is correct or needs to be modified. To determine maximum allowable loadings from WWTFs in the Upper Reach, the vali-dated QUAL2K model was applied. For this task of the pollutant load allocation, the model application was identical to a waste load evaluation process wherein the maximum allowa-ble loading of oxygen demanding pollutants from WWTFs was determined under the critical combination of water temperature and steady-state, low flow. The QUAL2K model of the Upper Reach was applied using the existing segmentation and kinetic rates developed during the model validation process. Applications of QUAL2K were made for low-flow conditions when minimum dissolved oxygen concentrations could occur. Defining Allocation Critical Flow The specification of headwater flows in the Upper Reach was based on “Critical low-flow values for dissolved oxygen for the eastern and southern Texas ecoregions”—Table 5 of Texas SWQS (not reproduced here)—which provides for determination of critical low flow based on 24-hour average dissolved oxygen criteria and average stream bedslope (TCEQ 2000). The critical low-flow values presented in the SWQS apply whenever the values are larger than the 7-day, 2-year low flow (7Q2). Therefore, values in this table and stream bed-slope were used to determine the critical low flow for the main stem and tributaries to the Upper Reach of Segment 1245. Based on bedslope and survey information for the main stem provided by Fort Bend County Drainage District, the critical low flow from the SWQS was determined to be 0.085 cms (3.0 cfs) for the Upper Reach.
Two TMDLs for Dissolved Oxygen in Upper Oyster Creek, Segment 1245
Texas Commission on Environmental Quality 24 Adopted July 2010
Critical low-flow determination for the headwater Upper Reach was, however, further complicated by the need to account for:
§ the absence of gauged daily streamflow records at any location in the Upper Reach; § the pumping of Brazos River water at the Shannon Pump Station; and § the procedure to meet demands at the Second Lift Station, when possible, from rain-
fall runoff and to curtail pumping at the Shannon Pump Station during runoff conditions.
The absence of historical streamflow records was also encountered in developing the adopted bacteria TMDL for Upper Oyster Creek (TCEQ 2007). This lack of records was addressed by applying the Soil & Water Assessment Tool (SWAT; Arnold et al. 1998) to predict daily streamflow at several locations within both reaches of Upper Oyster Creek for the 12-year period of 1993–2004. The calibration and application of SWAT to Upper Oys-ter Creek is provided in Section 4–Bacteria Allocation Tool Development of the bacteria TMDL technical support document (Hauck and Du 2006). The hydrologic predictions from application of SWAT to the Upper Oyster Creek wa-tershed were evaluated to determine the critical low flows in the Upper Reach. To determine the 7Q2 flow, the predicted daily flow data from SWAT for the period 1993–2004 were used as input for a TCEQ program developed to compute 7Q2 and harmonic means flows (7Q2HM). SWAT results for the following two locations were used:
§ a location just below the Shannon Pump Station; and § a location immediately above the Second Lift Station.
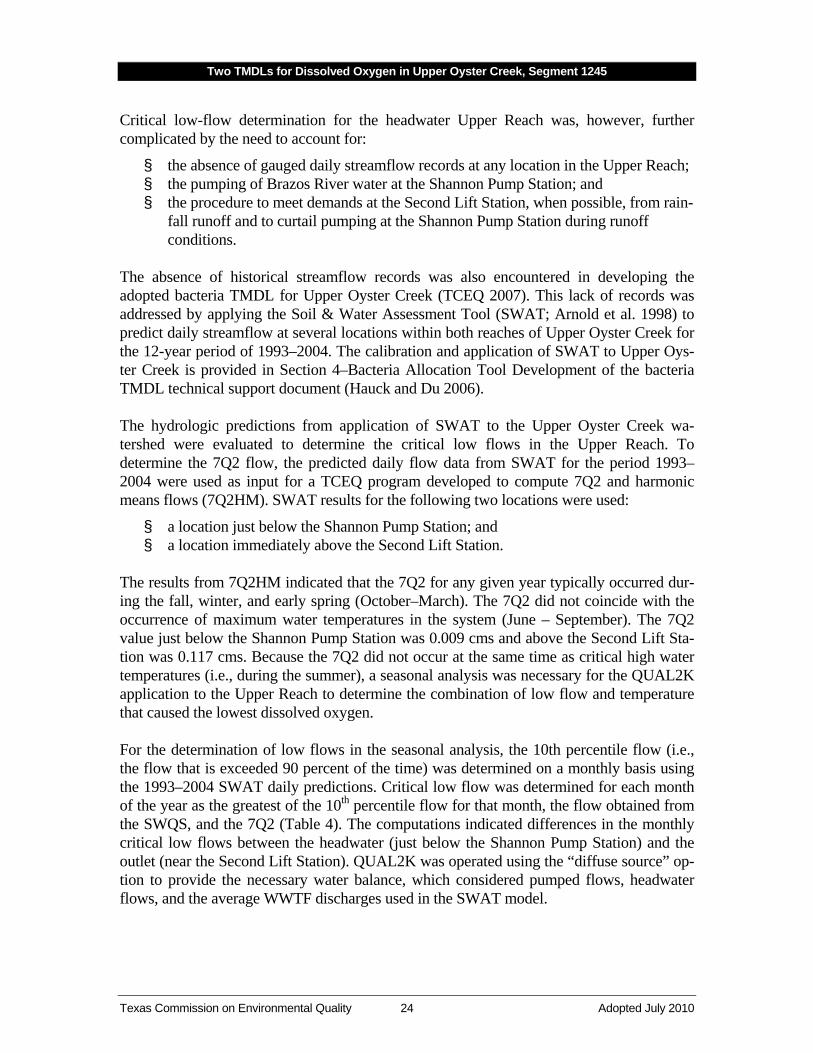
The results from 7Q2HM indicated that the 7Q2 for any given year typically occurred dur-ing the fall, winter, and early spring (October–March). The 7Q2 did not coincide with the occurrence of maximum water temperatures in the system (June – September). The 7Q2 value just below the Shannon Pump Station was 0.009 cms and above the Second Lift Sta-tion was 0.117 cms. Because the 7Q2 did not occur at the same time as critical high water temperatures (i.e., during the summer), a seasonal analysis was necessary for the QUAL2K application to the Upper Reach to determine the combination of low flow and temperature that caused the lowest dissolved oxygen. For the determination of low flows in the seasonal analysis, the 10th percentile flow (i.e., the flow that is exceeded 90 percent of the time) was determined on a monthly basis using the 1993–2004 SWAT daily predictions. Critical low flow was determined for each month of the year as the greatest of the 10th
percentile flow for that month, the flow obtained from the SWQS, and the 7Q2 (Table 4). The computations indicated differences in the monthly critical low flows between the headwater (just below the Shannon Pump Station) and the outlet (near the Second Lift Station). QUAL2K was operated using the “diffuse source” op-tion to provide the necessary water balance, which considered pumped flows, headwater flows, and the average WWTF discharges used in the SWAT model.
Table 4. Monthly headwater and diffuse sources flows information for Upper Reach All flows in units of cubic meters/second (cms)
Location Description Jan Feb Mar Apr May Jun Jul Aug Sep Oct Nov Dec
Headwater 10th 0.014 percentile flow 0.026 0.016 0.146 0.392 1.247 2.463 2.546 0.072 0.016 0.011 0.012
Critical low flow [maximum of SWQS (0.085 cms), 7Q2 (0.009 cms) and 10th
0.085
percentile flow]
0.085 0.085 0.146 0.392 1.247 2.463 2.546 0.085 0.085 0.085 0.085
2nd Lift Station
101
th 0.019 percentile flow 0.010 0.004 0.666 1.045 2.109 2.601 2.420 0.999 0.050 0.032 0.021
Critical low flow [maximum of SWQS (0.085 cms), 7Q2 (0.117 cms) and 10th
0.117
percentile flow]
0.117 0.117 0.666 1.045 2.109 2.601 2.420 0.999 0.117 0.117 0.117
Diffuse Sources 2
Computed by water balance
-0.097 3 -0.096 -0.097 0.390 0.524 0.739 0.014 -0.246 0.794 -0.089 -0.090 -0.091
Notes: 1 The 2nd Lift Station withdrawal location is used to define the most downstream location for critical flow determination, though physically the most downstream location is at Dam #3.
2 Negative diffuse sources flow is an abstraction or withdrawal. 3
Water balance considered flow at the 2nd Lift Station less headwater flow at Shannon Pump Station less headwater flows from Flewellen Creek and Red Gully less average WWTF discharges used in SWAT.
Table 5. Monthly water temperature information for Upper Reach
Description Jan Feb Mar Apr May Jun Jul Aug Sep Oct Nov Dec
Average (°C) 1 12.5 15.3 19.9 23.1 26.8 29.6 29.8 30.1 28.9 24.2 19.7 14.3
Standard Deviation (°C) 3.4 2.7 2.1 2.2 2.6 1.5 2.0 1.7 1.9 2.5 2.8 4.3
Sample Size (n) 41 62 36 39 99 64 70 129 30 31 50 41
90th percentile (°C) 16.9 2 18.8 22.6 26.0 30.2 N/A N/A N/A 31.4 27.5 23.3 19.9
3 hottest months temperature (°C)
31.6
3
Notes: 1 Water temperature data are for Segment 1245 for years 1988-2006 obtained from the TCEQ Web site <www.tceq.state.tx.us/compliance/monitoring/crp/data/samplequery.html>. 2 90th percentile estimated using Avg + STD x t-value assuming a normal or t-distribution using a one-tailed test. 3 Calculated using Avg of months 6, 7 and 8 + Avg of their STD values, and the 3 hottest months (6, 7, 8) are selected by the 90th percentile temperature.
Two TMDLs for Dissolved Oxygen in Upper Oyster Creek, Segment 1245
Texas Commission on Environmental Quality 26 Adopted July 2010
Defining Allocation Critical Water Temperature To perform the seasonal analysis, monthly water temperatures also needed to be consi-dered. All available historical water temperature data for 1245_02 and 1245_03 were obtained from the TCEQ water quality database for the period 1988 - 2006. For station 12083 in the immediate vicinity of the formerly operating Imperial Sugar facility, tempera-ture data prior to 1996 were excluded from subsequent analyses. Prior to 1996, Imperial Sugar discharged heated effluent into Oyster Creek, which would have improperly biased data in the vicinity of this discharge. The seasonal analysis of temperature followed TCEQ guidance. The guidance requires that a single, reasonable value be computed to represent the temperature for the three months with highest temperatures and that a reasonable high temperature be determined for each of the remaining nine months. The resulting critical water temperatures are defined as the monthly 90th
percentile temperatures (i.e., the temperature that is exceeded 10 percent of the time for the month being evaluated) except for the three hottest months. The critical wa-ter temperatures are provided with footnote explanations in Table 5 of this report.
Defining WLA and LA Inputs The municipal WWTFs were represented in the input data to QUAL2K at full permitted discharge and at existing permit limits for NH3-N, CBOD5, and dissolved oxygen (Table 3). TCEQ’s default multiplier of 2.3 was employed to convert CBOD5
to ultimate CBOD (CBODu) as needed for input to QUAL2K. Total phosphorus (total-P) in effluent was as-sumed to be 5 mg/L for all facilities. This assumption is considered a conservative number since the highest total-P concentration measured during the intensive surveys for model va-lidation was 4.3 mg/L and most facilities were discharging between about 3.5 and 4.0 mg/L of total-P.
Based on the intensive survey data for the WWTFs, 94 percent of the total-P was consi-dered to be in the soluble form as orthophosphate phosphorus (PO4-P) and the remainder as organic-P. Organic-N and nitrite + nitrate nitrogen (NO2+NO3-N) effluent concentrations were based on TCEQ guidance for estimating these constituents using permitted values of CBOD5 and NH3-N. Several recently constructed facilities in the Upper Reach have polish-ing ponds. Polishing ponds have been evaluated by TCEQ to discharge effluent that is at background levels of CBOD and NH3
-N with dissolved oxygen at approximately 5 mg/L (personal communications with Mr. Mark Rudolph, P.E., TCEQ, June 2007).
The facilities with polishing ponds are indicated in the last column of Table 3. For modeling purposes, the effluent from facilities with polishing ponds was assigned background concen-trations for ultimate CBOD and NH3-N, an organic-N concentration of 1 mg/L, and a chlorophyll-α concentration of 79.2 µg/L. The chlorophyll-α value selected is the average of the chlorophyll-α concentration measured at the outfall from the holding pond of the Quail Valley Utility District WWTF during the two model support surveys in the Lower Reach. This chlorophyll-α value was used because the facilities with polishing ponds in the Upper Reach were not operational during the intensive studies conducted for this project. The Quail Valley facility uses a pond that is similar to those ponds, and gave the best available meas-
Two TMDLs for Dissolved Oxygen in Upper Oyster Creek, Segment 1245
Texas Commission on Environmental Quality 27 Adopted July 2010
ured data for this study. To be conservative, and in lieu of any information, NO2+NO3-N and PO4
-P were left at high concentrations assuming no nutrient removal by the ponds.
The main stem headwater and diffuse source input flow data used in QUAL2K to define LA contributions were defined as previously discussed in the section titled “Defining Allo-cation Critical Flow.” Tributary headwater flows were defined in the models based on the critical low flow determined from the SWQS (see Table 6). Headwater water quality input data for the main stem and tributaries of the Upper Reach were obtained from various sources. For ultimate CBOD (CBODu), organic nitrogen, NH3-N, NO2+NO3
-N, dissolved oxygen as percent saturation (DO percent saturation), and chlorophyll-α (Chla), the default background concentrations used in TCEQ waste load evaluations were specified unless adequate (i.e., more than a couple of data points) site-specific information were available. Portions of the necessary water quality data from the headwaters of the main stem of the Upper Reach were obtained from monitoring stations in the Brazos River in proximity to the Shannon Pump Station. The Brazos River water quality data were obtained from the TCEQ Surface Water Quality Monitoring Information System (SWQMIS) database.
The default background concentration for total phosphorus of 0.02 mg/L was separated, as required in QUAL2K, into organic P and PO4
-P components based on ratios determined from the survey data sets for model validation and water quality data for the Brazos River. The headwater water quality input for QUAL2K is summarized in Table 7. Flewellen Creek is not included in Table 7, because no headwater flow contribution is associated with this tributary. Diffuse sources were given the same water quality characteristics as Red Gully (Table 7).
Applications of QUAL2K The validated QUAL2K model of the Upper Reach was applied to determine allowable loadings from municipal WWTFs. For the application, each WWTF was evaluated within QUAL2K at its full permit limits. Subsequent applications to determine allowable loadings would be made with more stringent permit limits if applicable dissolved oxygen criteria were not met. The permit limits would be adjusted until the criteria were not exceeded. The focus of the model (and in a broader context, the TMDL study) was on the 24-hour av-erage dissolved oxygen criterion, which was important to the majority of monitored exceedances in the assessment survey data sets in 1245_02 and 1245_03 and the major tri-butaries of Flewellen Creek and Red Gully. Load Reduction and Waste Load Allocation Since a seasonal analysis was required for the Upper Reach, QUAL2K was operated under conditions of existing permit loading for water temperature and headwater, diffuse sources and tributary flow conditions for the three hottest months (June – August), with the remain-ing months considered individually. The headwater and diffuse source flows for June were used in the simulation of the three hottest months, since these were the lowest monthly flows for June – August. The dissolved oxygen results for March were evaluated against the 24-hour average dissolved oxygen criterion to protect spawning. For all other months, dis-solved oxygen results were evaluated against the general dissolved oxygen criterion. The
Two TMDLs for Dissolved Oxygen in Upper Oyster Creek, Segment 1245
Texas Commission on Environmental Quality 28 Adopted July 2010
minimum 24-hour average dissolved oxygen predicted for the main stem 1245_02 and 1245_03, Flewellen Creek, and Red Gully are provided in Table 8 for each condition. These model predictions indicate no exceedances of the 24-hour average DO criterion, though for the September scenario the minimum predicted DO concentration in 1245_03 was at the criterion value of 4.0 mg/L (Table 8; Figure 7). The model predicted 24-hour av-erage DO for the March spawning scenario and June – August scenario are provided in Figures 8 and 9 for 1245_02 and 1245_03, Flewellen Creek, and Red Gully. The June – August scenario represents the critical summer conditions of temperature (Table 5) and the June headwater flow (Table 4), which is the lowest flow for the three months of June, July, and August. Table 6. Tributaries to Upper Reach, designated aquatic life use, bedslope, critical low flow, and
dissolved oxygen (DO) criteria
Tributary Name
Designated Aq-uatic Life Use
Bedslope (m/km)
Critical Low Flow
(cms)
General 24-hour Average/Minimum DO
Criteria (mg/L)
Spawning-Season 24-hour
Avg/Minimum DO Criteria (mg/L)
Flewellen Cr. No Significant 1.1 0.0000 2.0 / 2.0 2.0 / 2.0
Red Gully Intermediate 0.1* 0.0850 4.0 / 3.0 5.0 / 4.0
* The bedslope of 0.1 m/km used for Red Gully to determine the critical low flow from the SWQS (2000) is not the actual average bedslope of the creek, but rather reflects the constant backwater effects from Oyster Creek that greatly reduces the effective slope of the lower portion of Red Gully where DO mini-mums occur. This approach represents the same manner in which TCEQ has accounted for the backwater effect on Red Gully in waste load evaluations.
Table 7. Headwater water quality input to QUAL2K for main stem, tributaries, and diffuse sources
[Note: Flewellen Creek has no headwater flow (see Table 6) and is not included in this table.]
Constituent Upper Reach Headwater Red Gully
Diffuse Sources
DO (% sat.) 80 80 80
CBODu (mg/L) 3.0 3.0 3.0
Organic-N (mg/L) 0.5 0.5 0.5
NH3 0.05 -N (mg/L) 0.05 0.05
NO2+NO3 0.585 -N (mg/L) 0.200 0.200
Organic-P (mg/L) 0.021 0.019 0.019
PO4 0.025 -P (mg/L) 0.001 0.001
Chla (µg/L) 2 / 8.7* 2 2
*The chlorophyll-α data for the Brazos River in the vicinity of the Shannon Pump Station showed a season-al component, though no other input parameters exhibited this characteristic for the Brazos River. Based on analysis of these data, a concentration of 2 µg/L of chlorophyll-α was used for the months of Novem-ber through April and a concentration of 8.7 µg/L for May through October.
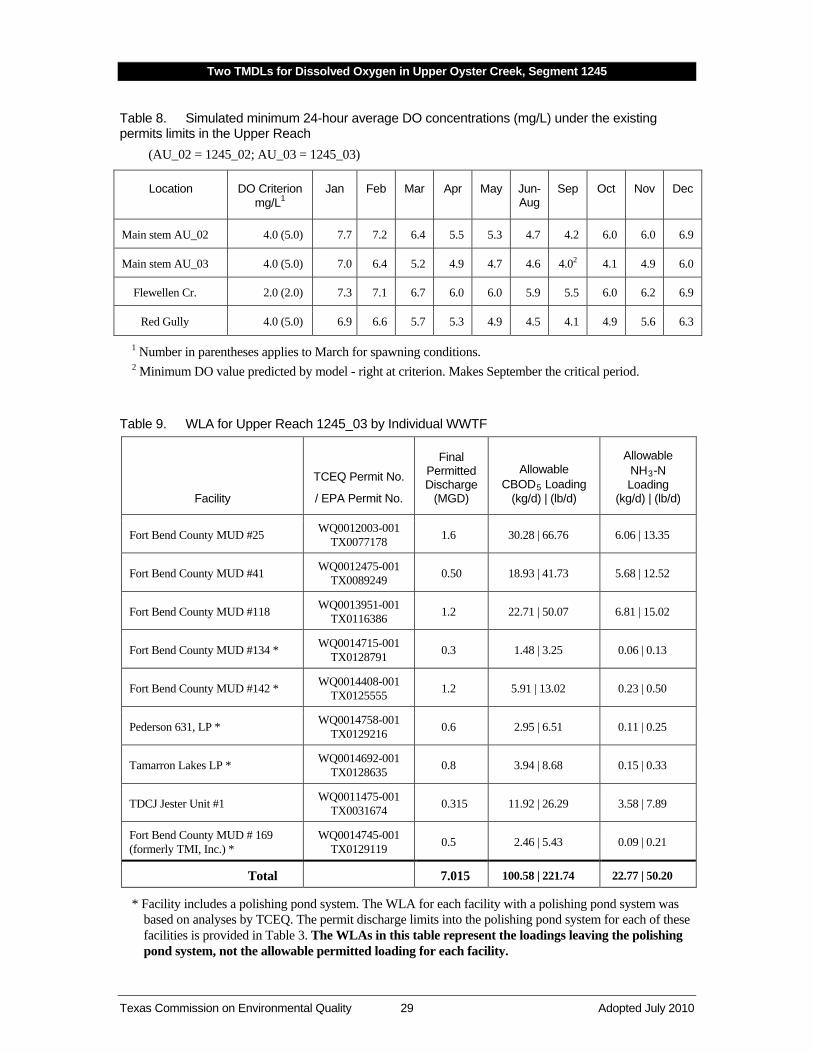
Two TMDLs for Dissolved Oxygen in Upper Oyster Creek, Segment 1245
Texas Commission on Environmental Quality 29 Adopted July 2010
Table 8. Simulated minimum 24-hour average DO concentrations (mg/L) under the existing permits limits in the Upper Reach
(AU_02 = 1245_02; AU_03 = 1245_03)
Location DO Criterion mg/L
Jan 1
Feb Mar Apr May Jun-Aug
Sep Oct Nov Dec
Main stem AU_02 4.0 (5.0) 7.7 7.2 6.4 5.5 5.3 4.7 4.2 6.0 6.0 6.9
Main stem AU_03 4.0 (5.0) 7.0 6.4 5.2 4.9 4.7 4.6 4.0 4.1 2 4.9 6.0
Flewellen Cr. 2.0 (2.0) 7.3 7.1 6.7 6.0 6.0 5.9 5.5 6.0 6.2 6.9
Red Gully 4.0 (5.0) 6.9 6.6 5.7 5.3 4.9 4.5 4.1 4.9 5.6 6.3
1 Number in parentheses applies to March for spawning conditions. 2
Minimum DO value predicted by model - right at criterion. Makes September the critical period.
Table 9. WLA for Upper Reach 1245_03 by Individual WWTF
Facility
TCEQ Permit No.
/ EPA Permit No.
Final Permitted Discharge
(MGD)
Allowable CBOD5
Allowable NH
Loading (kg/d) | (lb/d)
3
Fort Bend County MUD #25
-N Loading
(kg/d) | (lb/d)
WQ0012003-001 TX0077178 1.6 30.28 | 66.76 6.06 | 13.35
Fort Bend County MUD #41 WQ0012475-001 TX0089249 0.50 18.93 | 41.73 5.68 | 12.52
Fort Bend County MUD #118 WQ0013951-001 TX0116386 1.2 22.71 | 50.07 6.81 | 15.02
Fort Bend County MUD #134 * WQ0014715-001 TX0128791 0.3 1.48 | 3.25 0.06 | 0.13
Fort Bend County MUD #142 * WQ0014408-001 TX0125555 1.2 5.91 | 13.02 0.23 | 0.50
Pederson 631, LP * WQ0014758-001 TX0129216 0.6 2.95 | 6.51 0.11 | 0.25
Tamarron Lakes LP * WQ0014692-001 TX0128635 0.8 3.94 | 8.68 0.15 | 0.33
TDCJ Jester Unit #1 WQ0011475-001 TX0031674 0.315 11.92 | 26.29 3.58 | 7.89
Fort Bend County MUD # 169 (formerly TMI, Inc.) *
WQ0014745-001 TX0129119 0.5 2.46 | 5.43 0.09 | 0.21
Total 7.015 100.58 | 221.74 22.77 | 50.20
* Facility includes a polishing pond system. The WLA for each facility with a polishing pond system was based on analyses by TCEQ. The permit discharge limits into the polishing pond system for each of these facilities is provided in Table 3. The WLAs in this table represent the loadings leaving the polishing pond system, not the allowable permitted loading for each facility.
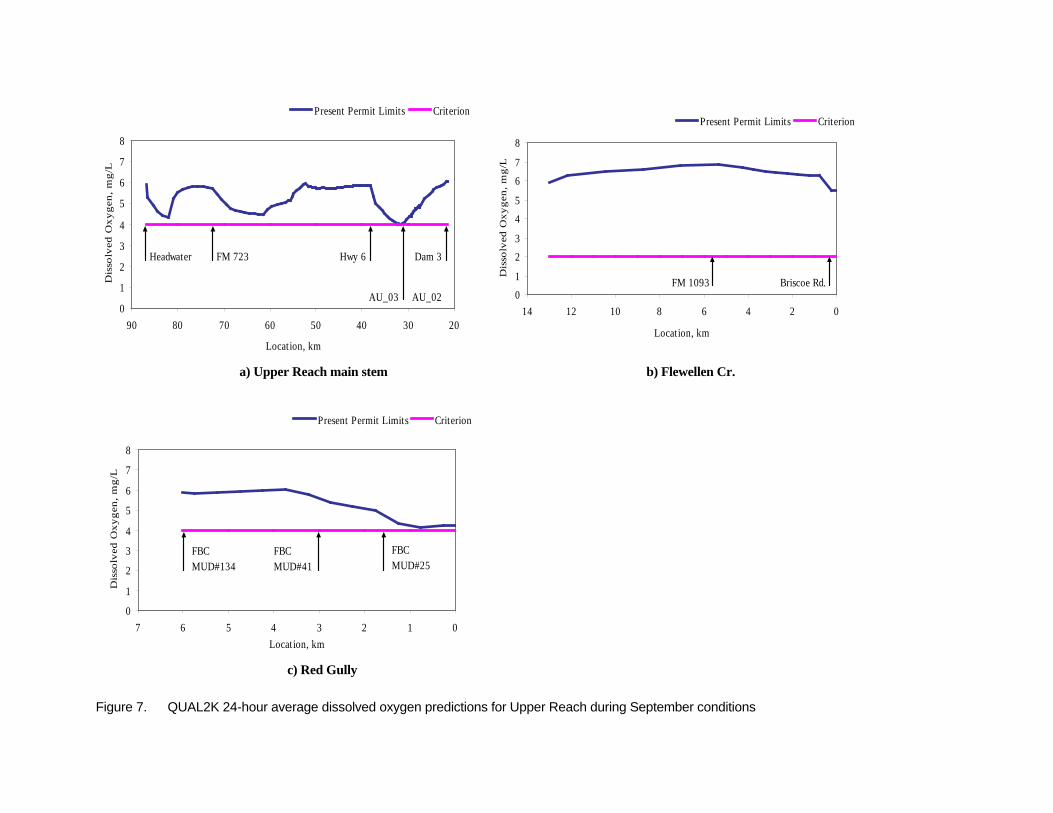
0
1
2
3
4
5
6
7
8
2030405060708090
Location, km
Dis
solv
ed O
xyge
n, m
g/L
Present Permit Limits Criterion
Headwater FM 723 Hwy 6
AU_03 AU_02
Dam 3
01
23
45
67
8
02468101214
Location, km
Dis
solv
ed O
xyge
n, m
g/L
Present Permit Limits Criterion
FM 1093 Briscoe Rd.
a) Upper Reach main stem b) Flewellen Cr.
0
1
2
3
4
5
6
7
8
01234567Location, km
Dis
solv
ed O
xyge
n, m
g/L
Present Permit Limits Criterion
FBC MUD#134
FBC MUD#41
FBC MUD#25
c) Red Gully
Figure 7. QUAL2K 24-hour average dissolved oxygen predictions for Upper Reach during September conditions

2030405060708090
Location, km
01
234
56
78
Dis
solv
ed O
xyge
n, m
g/L
Present Permit Limits Criterion
AU_03 AU_02
Headwater FM 723 Hwy 6 Dam 3
0
12
3
4
56
7
8
02468101214
Location, km
Dis
solv
ed O
xyge
n, m
g/L
Present Permit Limits Criterion
FM 1093 Briscoe Rd.
a) Upper Reach main site b) Flewellen Cr.
0
1
2
3
4
5
6
7
8
01234567
Location, km
Dis
solv
ed O
xyge
n, m
g/L
Present Permit Limits Criterion
FBC MUD#134
FBC MUD#41
FBC MUD#25
c) Red Gully
Figure 8. QUAL2K 24-hour average dissolved oxygen predictions for Upper Reach during spawning conditions (March)
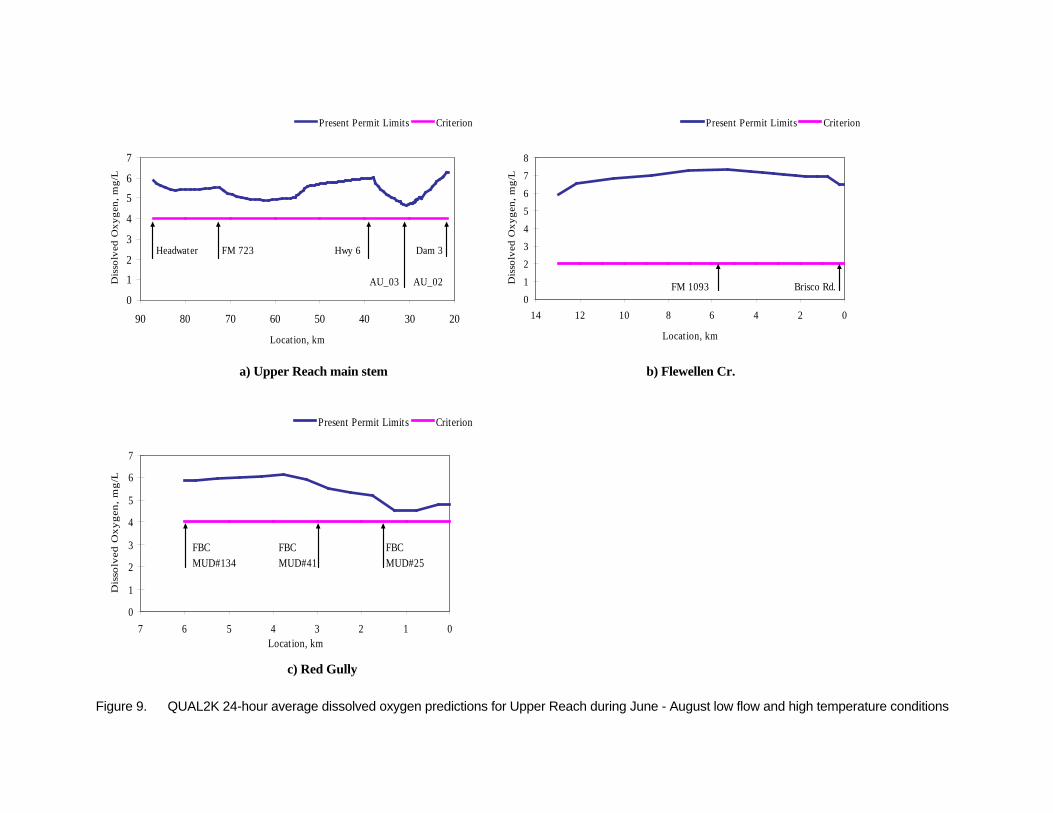
0
1
2
3
4
5
6
7
2030405060708090
Location, km
Dis
solv
ed O
xyge
n, m
g/L
Present Permit Limits Criterion
Headwater FM 723 Hwy 6
AU_03 AU_02
Dam 3
012345678
02468101214
Location, km
Dis
solv
ed O
xyge
n, m
g/L
Present Permit Limits Criterion
FM 1093 Brisco Rd.
a) Upper Reach main stem b) Flewellen Cr.
0
1
2
3
4
5
6
7
01234567Location, km
Dis
solv
ed O
xyge
n, m
g/L
Present Permit Limits Criterion
FBC MUD#134
FBC MUD#41
FBC MUD#25
c) Red Gully
Figure 9. QUAL2K 24-hour average dissolved oxygen predictions for Upper Reach during June - August low flow and high temperature conditions
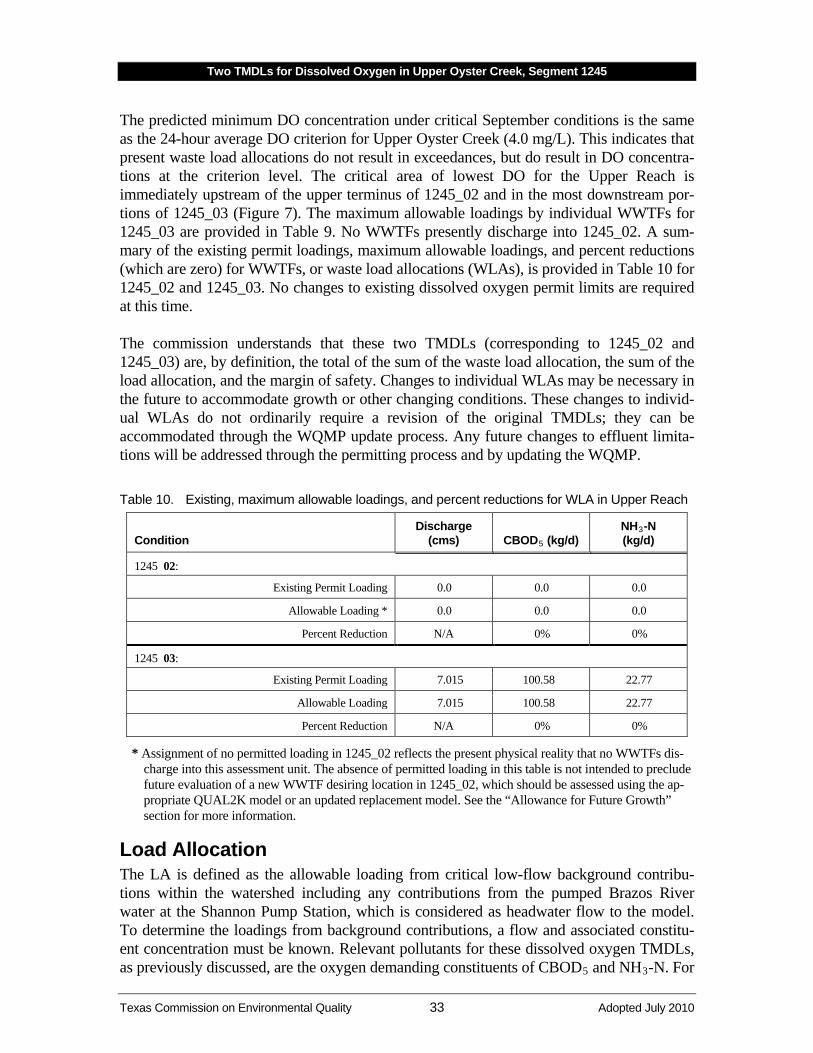
Two TMDLs for Dissolved Oxygen in Upper Oyster Creek, Segment 1245
Texas Commission on Environmental Quality 33 Adopted July 2010
The predicted minimum DO concentration under critical September conditions is the same as the 24-hour average DO criterion for Upper Oyster Creek (4.0 mg/L). This indicates that present waste load allocations do not result in exceedances, but do result in DO concentra-tions at the criterion level. The critical area of lowest DO for the Upper Reach is immediately upstream of the upper terminus of 1245_02 and in the most downstream por-tions of 1245_03 (Figure 7). The maximum allowable loadings by individual WWTFs for 1245_03 are provided in Table 9. No WWTFs presently discharge into 1245_02. A sum-mary of the existing permit loadings, maximum allowable loadings, and percent reductions (which are zero) for WWTFs, or waste load allocations (WLAs), is provided in Table 10 for 1245_02 and 1245_03. No changes to existing dissolved oxygen permit limits are required at this time. The commission understands that these two TMDLs (corresponding to 1245_02 and 1245_03) are, by definition, the total of the sum of the waste load allocation, the sum of the load allocation, and the margin of safety. Changes to individual WLAs may be necessary in the future to accommodate growth or other changing conditions. These changes to individ-ual WLAs do not ordinarily require a revision of the original TMDLs; they can be accommodated through the WQMP update process. Any future changes to effluent limita-tions will be addressed through the permitting process and by updating the WQMP. Table 10. Existing, maximum allowable loadings, and percent reductions for WLA in Upper Reach
Condition Discharge
(cms) CBOD5
NH (kg/d)
3
1245 02:
-N (kg/d)
Existing Permit Loading 0.0 0.0 0.0
Allowable Loading * 0.0 0.0 0.0
Percent Reduction N/A 0% 0%
1245 03:
Existing Permit Loading 7.015 100.58 22.77
Allowable Loading 7.015 100.58 22.77
Percent Reduction N/A 0% 0%
* Assignment of no permitted loading in 1245_02 reflects the present physical reality that no WWTFs dis-charge into this assessment unit. The absence of permitted loading in this table is not intended to preclude future evaluation of a new WWTF desiring location in 1245_02, which should be assessed using the ap-propriate QUAL2K model or an updated replacement model. See the “Allowance for Future Growth” section for more information.
Load Allocation The LA is defined as the allowable loading from critical low-flow background contribu-tions within the watershed including any contributions from the pumped Brazos River water at the Shannon Pump Station, which is considered as headwater flow to the model. To determine the loadings from background contributions, a flow and associated constitu-ent concentration must be known. Relevant pollutants for these dissolved oxygen TMDLs, as previously discussed, are the oxygen demanding constituents of CBOD5 and NH3-N. For
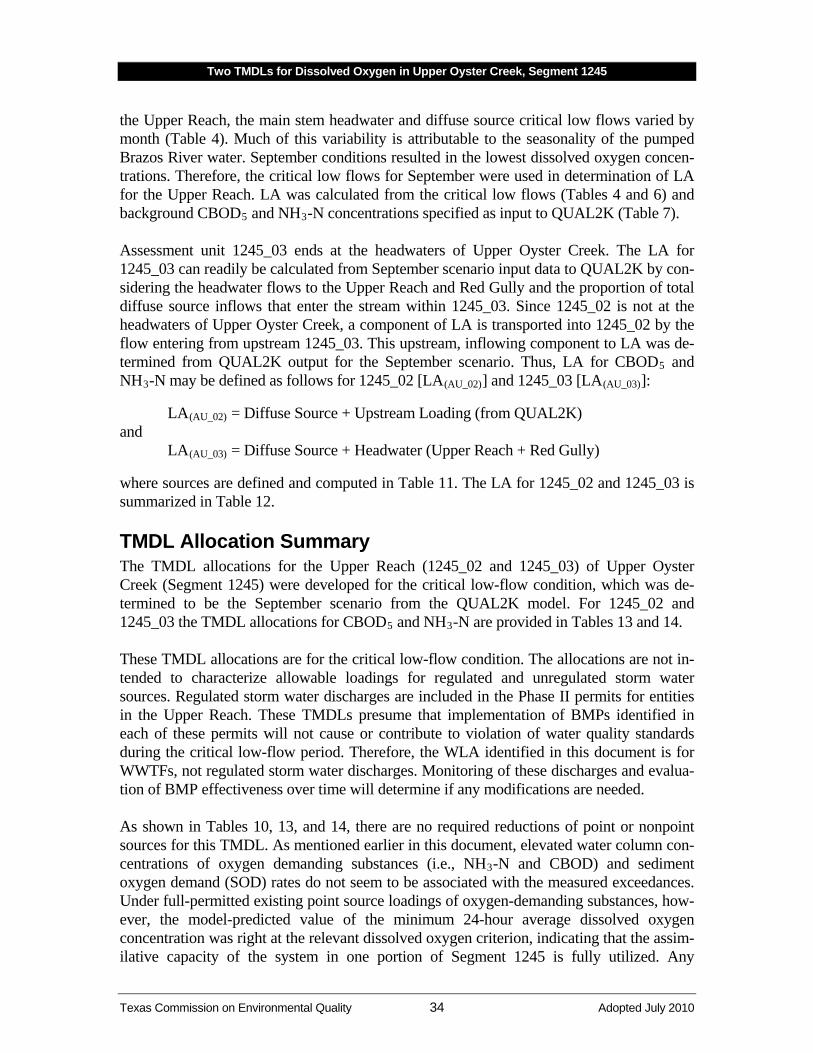
Two TMDLs for Dissolved Oxygen in Upper Oyster Creek, Segment 1245
Texas Commission on Environmental Quality 34 Adopted July 2010
the Upper Reach, the main stem headwater and diffuse source critical low flows varied by month (Table 4). Much of this variability is attributable to the seasonality of the pumped Brazos River water. September conditions resulted in the lowest dissolved oxygen concen-trations. Therefore, the critical low flows for September were used in determination of LA for the Upper Reach. LA was calculated from the critical low flows (Tables 4 and 6) and background CBOD5 and NH3
-N concentrations specified as input to QUAL2K (Table 7).
Assessment unit 1245_03 ends at the headwaters of Upper Oyster Creek. The LA for 1245_03 can readily be calculated from September scenario input data to QUAL2K by con-sidering the headwater flows to the Upper Reach and Red Gully and the proportion of total diffuse source inflows that enter the stream within 1245_03. Since 1245_02 is not at the headwaters of Upper Oyster Creek, a component of LA is transported into 1245_02 by the flow entering from upstream 1245_03. This upstream, inflowing component to LA was de-termined from QUAL2K output for the September scenario. Thus, LA for CBOD5 and NH3-N may be defined as follows for 1245_02 [LA(AU_02)] and 1245_03 [LA(AU_03)
]:
LA(AU_02)and
= Diffuse Source + Upstream Loading (from QUAL2K)
LA(AU_03)
= Diffuse Source + Headwater (Upper Reach + Red Gully)
where sources are defined and computed in Table 11. The LA for 1245_02 and 1245_03 is summarized in Table 12. TMDL Allocation Summary The TMDL allocations for the Upper Reach (1245_02 and 1245_03) of Upper Oyster Creek (Segment 1245) were developed for the critical low-flow condition, which was de-termined to be the September scenario from the QUAL2K model. For 1245_02 and 1245_03 the TMDL allocations for CBOD5 and NH3
-N are provided in Tables 13 and 14.
These TMDL allocations are for the critical low-flow condition. The allocations are not in-tended to characterize allowable loadings for regulated and unregulated storm water sources. Regulated storm water discharges are included in the Phase II permits for entities in the Upper Reach. These TMDLs presume that implementation of BMPs identified in each of these permits will not cause or contribute to violation of water quality standards during the critical low-flow period. Therefore, the WLA identified in this document is for WWTFs, not regulated storm water discharges. Monitoring of these discharges and evalua-tion of BMP effectiveness over time will determine if any modifications are needed. As shown in Tables 10, 13, and 14, there are no required reductions of point or nonpoint sources for this TMDL. As mentioned earlier in this document, elevated water column con-centrations of oxygen demanding substances (i.e., NH3-N and CBOD) and sediment oxygen demand (SOD) rates do not seem to be associated with the measured exceedances. Under full-permitted existing point source loadings of oxygen-demanding substances, how-ever, the model-predicted value of the minimum 24-hour average dissolved oxygen concentration was right at the relevant dissolved oxygen criterion, indicating that the assim-ilative capacity of the system in one portion of Segment 1245 is fully utilized. Any

Two TMDLs for Dissolved Oxygen in Upper Oyster Creek, Segment 1245
Texas Commission on Environmental Quality 35 Adopted July 2010
additional point source loadings from new facilities or permit expansions will have to be evaluated permit-by-permit to avoid controllable depressed oxygen conditions. Table 11. Computations of components of CBOD5 and NH3
Description
-N daily loadings (LA) for 1245_02 and 1245_03 based on September critical condition
Value
Conversion Factor (CF) to compute loading as kg/d: CF = (cu. meter /sec) (mg/L) (86,400 sec/d) (1000 L/cu meter) / (1 x 10⁶ 86.4 mg/Kg)
Diffuse Source Distribution to 1245_02 & 1245_03 (AU_02 & AU_03):
Distributed over stream length of Upper Reach (km 21.47 to km 87.00) 65.53 km
Diffuse source length in AU_02 (km 21.47 to km 30.50) 9.03 km
Fraction of total length in AU_02 = K 0.137799 (AU 02)
Diffuse source length in AU_03 (km 30.50 to km 87.00) 56.50 km
Fraction of total length in AU_03 = K 0.862201 (AU 03)
Total Diffuse Source Flow (Table 4) 0.7941 cms
CBOD5 1.30 mg/L concentration for diffuse source (Table 7)*
CBOD5 89.19 kg/d load = CF x Flow x Concentration
AU_02 CBOD5 Diffuse Source Load: K(AU 02) x CBOD5 12.29 kg/d load
AU_03 CBOD5 Diffuse Source Load: K(AU 03) x CBOD5 76.90 kg/d load
NH3 0.050 mg/L -N concentration for diffuse source (Table 7)
NH3 3.43 kg/d -N load = CF x Flow x Concentration
AU_02 NH3-N Diffuse Source Load: K(AU 02) x NH3 0.47 kg/d -N load
AU_03 NH3-N Diffuse Source Load: K(AU 03) x NH3 2.96 kg/d -N load
Upstream Loadings (from QUAL2K output); 1245_02:
Streamflow from AU_03 entering AU_02 1.2222 cms
CBOD5 1.34 mg/L concentration from AU_03 entering AU_02
CBOD5 141.41 kg/d load entering AU_2 = CF x Flow x Concentration
NH3 0.131 mg/L -N concentration from AU_03 entering AU_02
NH3 13.83 kg/d -N load entering AU_02 = CF x Flow x Concentration
Headwater Loading from Upper Reach and Red Gully; 1245_03:
Headwater flow to Upper Reach (Table 4) 0.0850 cms
Headwater flow to Red Gully (Table 6) 0.0850 cms
CBOD5 1.30 mg/L concentration for headwater sources (Table 7)*
CBOD5 19.09 kg/d load = CF x Total Headwater Flows x Concentration
NH3 0.050 mg/L -N concentration for diffuse source (Table 7)
NH3 0.73 kg/d -N load = CF x Flow x Concentration
* CBOD5 concentration = fast CBODu / 2.3 = 3.0 mg/L / 2.3 = 1.30 mg/L
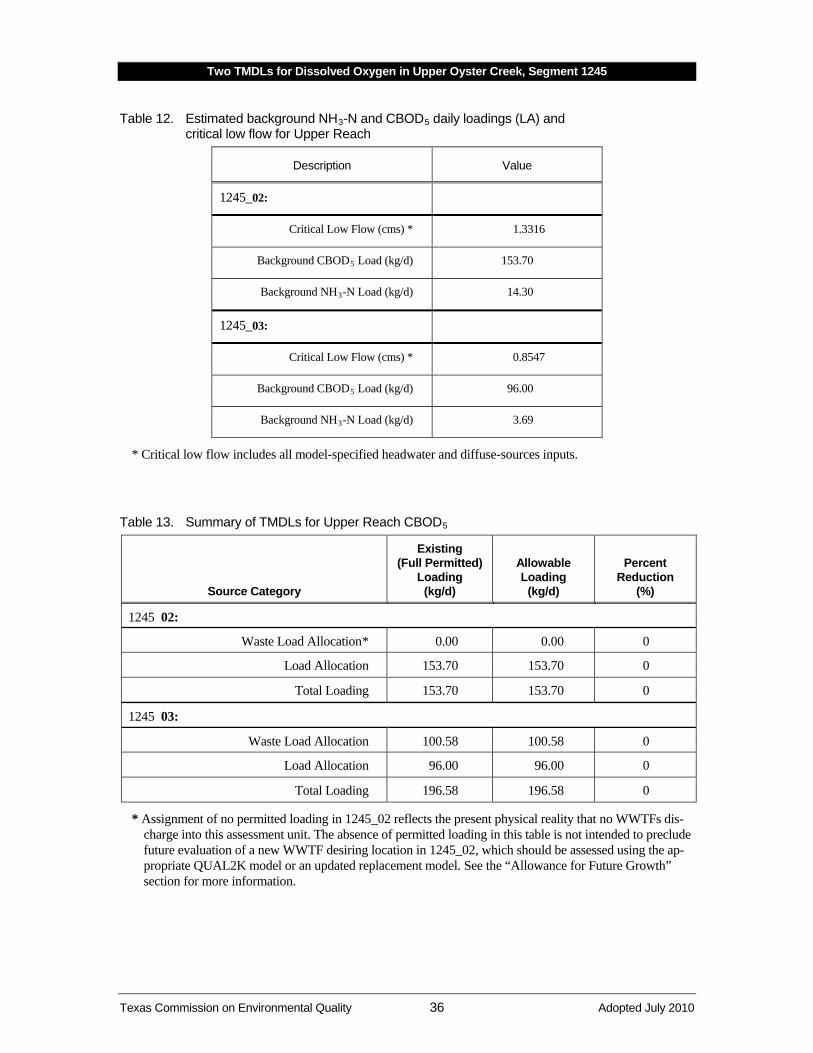
Two TMDLs for Dissolved Oxygen in Upper Oyster Creek, Segment 1245
Texas Commission on Environmental Quality 36 Adopted July 2010
Table 12. Estimated background NH3-N and CBOD5
Description
daily loadings (LA) and critical low flow for Upper Reach
Value
1245_02:
Critical Low Flow (cms) * 1.3316
Background CBOD5 153.70 Load (kg/d)
Background NH3 14.30 -N Load (kg/d)
1245_03:
Critical Low Flow (cms) * 0.8547
Background CBOD5 96.00 Load (kg/d)
Background NH3 3.69 -N Load (kg/d)
* Critical low flow includes all model-specified headwater and diffuse-sources inputs. Table 13. Summary of TMDLs for Upper Reach CBOD5
Source Category
Existing (Full Permitted)
Loading (kg/d)
Allowable Loading
(kg/d)
Percent Reduction
(%)
1245 02:
Waste Load Allocation * 0.00 0.00 0
Load Allocation 153.70 153.70 0
Total Loading 153.70 153.70 0
1245 03:
Waste Load Allocation 100.58 100.58 0
Load Allocation 96.00 96.00 0
Total Loading 196.58 196.58 0
* Assignment of no permitted loading in 1245_02 reflects the present physical reality that no WWTFs dis-charge into this assessment unit. The absence of permitted loading in this table is not intended to preclude future evaluation of a new WWTF desiring location in 1245_02, which should be assessed using the ap-propriate QUAL2K model or an updated replacement model. See the “Allowance for Future Growth” section for more information.
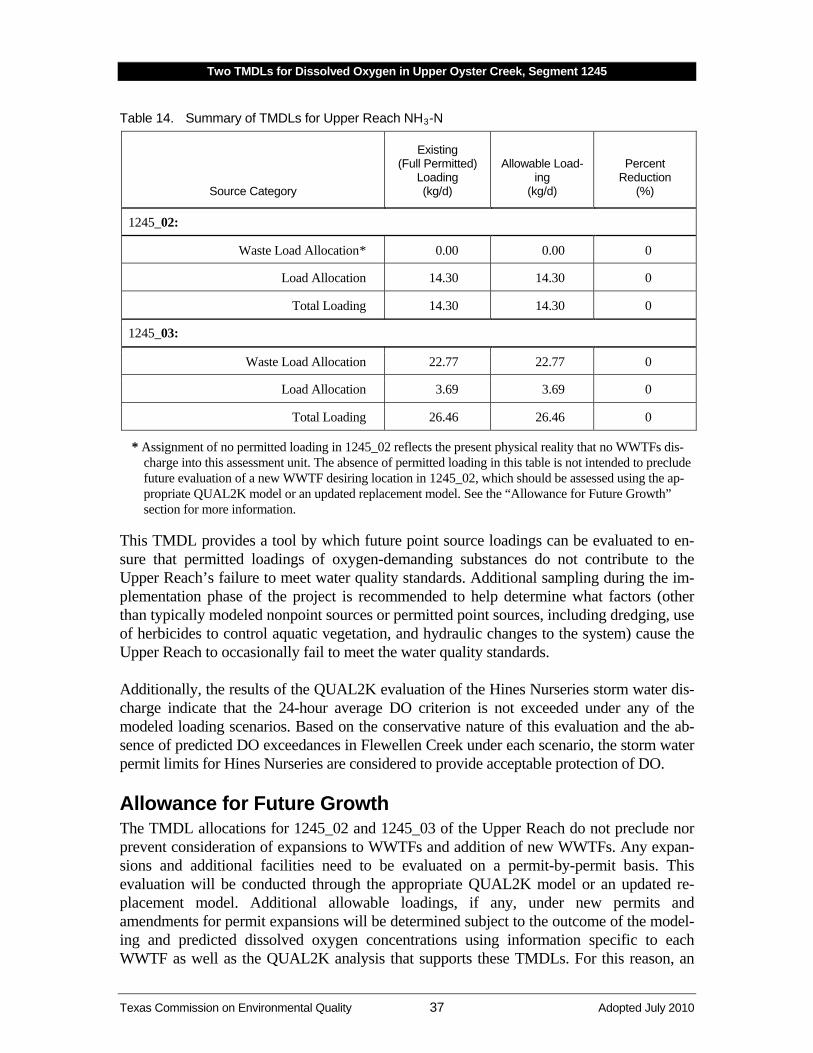
Two TMDLs for Dissolved Oxygen in Upper Oyster Creek, Segment 1245
Texas Commission on Environmental Quality 37 Adopted July 2010
Table 14. Summary of TMDLs for Upper Reach NH3
Source Category
-N
Existing (Full Permitted)
Loading (kg/d)
Allowable Load-ing
(kg/d)
Percent Reduction
(%)
1245_02:
Waste Load Allocation * 0.00 0.00 0
Load Allocation 14.30 14.30 0
Total Loading 14.30 14.30 0
1245_03:
Waste Load Allocation 22.77 22.77 0
Load Allocation 3.69 3.69 0
Total Loading 26.46 26.46 0
* Assignment of no permitted loading in 1245_02 reflects the present physical reality that no WWTFs dis-charge into this assessment unit. The absence of permitted loading in this table is not intended to preclude future evaluation of a new WWTF desiring location in 1245_02, which should be assessed using the ap-propriate QUAL2K model or an updated replacement model. See the “Allowance for Future Growth” section for more information.
This TMDL provides a tool by which future point source loadings can be evaluated to en-sure that permitted loadings of oxygen-demanding substances do not contribute to the Upper Reach’s failure to meet water quality standards. Additional sampling during the im-plementation phase of the project is recommended to help determine what factors (other than typically modeled nonpoint sources or permitted point sources, including dredging, use of herbicides to control aquatic vegetation, and hydraulic changes to the system) cause the Upper Reach to occasionally fail to meet the water quality standards. Additionally, the results of the QUAL2K evaluation of the Hines Nurseries storm water dis-charge indicate that the 24-hour average DO criterion is not exceeded under any of the modeled loading scenarios. Based on the conservative nature of this evaluation and the ab-sence of predicted DO exceedances in Flewellen Creek under each scenario, the storm water permit limits for Hines Nurseries are considered to provide acceptable protection of DO. Allowance for Future Growth The TMDL allocations for 1245_02 and 1245_03 of the Upper Reach do not preclude nor prevent consideration of expansions to WWTFs and addition of new WWTFs. Any expan-sions and additional facilities need to be evaluated on a permit-by-permit basis. This evaluation will be conducted through the appropriate QUAL2K model or an updated re-placement model. Additional allowable loadings, if any, under new permits and amendments for permit expansions will be determined subject to the outcome of the model-ing and predicted dissolved oxygen concentrations using information specific to each WWTF as well as the QUAL2K analysis that supports these TMDLs. For this reason, an
Two TMDLs for Dissolved Oxygen in Upper Oyster Creek, Segment 1245
Texas Commission on Environmental Quality 38 Adopted July 2010
explicit value for the allowance for future growth cannot be assigned for an entire assess-ment unit or segment. Further, the TMDL allocations are not intended to restrict or limit the GCWA pumping of Brazos River water into the Upper Reach at the Shannon Pump Station and associated load-ings of NH3-N and CBOD5
. Based on QUAL2K seasonal-analysis results for the Upper Reach (Table 8), a comparison can be made of model-predicted minimum 24-hour average dissolved oxygen concentrations for June – August to the minimum dissolved oxygen con-centrations for September.
Both sets of predictions were made with comparable model inputs except for headwater inflow. This comparison indicates that higher dissolved oxygen concentrations occur under the higher pumping rates experienced in the June – August scenario than the lower rates in September. These QUAL2K results indicate that any future increases to the critical headwa-ter pumped flows from the Brazos River due to increased water demands on the GCWA system should improve dissolved oxygen conditions in the Jones Creek/Oyster Creek por-tion of the Upper Reach. The three-tiered antidegradation policy in the water quality standards prohibits an increase in loading that would cause or contribute to degradation of an existing use. The antidegra-dation policy applies to both point and nonpoint source pollutant discharges. In general, antidegradation procedures establish a process for reviewing individual proposed actions to determine if the activity will degrade water quality. The TMDLs in this document will re-sult in protection of existing beneficial uses and conform to Texas’ antidegradation policy.
Public Participation The TCEQ maintains an inclusive public participation process. From the inception of the project, the project team sought to ensure that stakeholders were informed and involved. Communication and comments from the stakeholders in the watershed strengthen TMDL projects and their implementation. An official steering committee of stakeholders was established for the Upper Oyster Creek TMDL project in 2002. The first steering committee meeting was held in June 2003, and one to two meetings have been held each year since that time. Meetings were always held within the watershed. The steering committee members represent a broad array of interests in the watershed, such as local industries (including wastewater treatment facilities), lan-downers, environmental groups, and local and regional government groups. The stakeholder committee has had little turnover over the life of the project. Their know-ledge of the watershed and consistency in attending meetings and providing input have been—and will continue to be—a valuable resource for restoring the beneficial uses of Up-per Oyster Creek. To ensure that absent members and the public were informed of past meetings and pertinent material, a project Web page was established to provide meeting summaries, ground rules, and a list of steering committee members at <www.tceq.state. tx.us/implementation/water/tmdl/25-oystercreek_group.html>.
Two TMDLs for Dissolved Oxygen in Upper Oyster Creek, Segment 1245
Texas Commission on Environmental Quality 39 Adopted July 2010
Implementation and Reasonable Assurances TMDL development and implementation in Texas includes the preparation of two docu-ments:
1) a TMDL, which determines the maximum amount of pollutant a water body can re-ceive in a single day and still meet applicable water quality standards, and
2) an implementation plan (I-Plan), which is a detailed description and schedule of the regulatory and voluntary management measures necessary to achieve the pollu-tant loads identified in the TMDL.
Together, the TMDLs and I-Plan direct the correction of water quality conditions that exist in an impaired surface water. A TMDL identifies a total loading from the combination of point sources and nonpoint sources that allows attainment of the water quality standard. Achieving those loadings is addressed in the I-Plan. The TCEQ is committed to developing I-Plans for all TMDLs adopted by the commission and to ensuring the plans are implemented. I-Plans are critical to ensure water quality stan-dards are restored and maintained. EPA is not required to approve implementation plans for TMDLs. Periodic and repeated evaluations of the effectiveness of implementation methods assure that progress is occurring and may show that the original distribution of loading among sources should be modified to increase efficiency. This adaptive approach provides reason-able assurance that the necessary regulatory and voluntary activities to achieve the pollutant reductions will be implemented. The issuance of permits consistent with TMDLs through the Texas Pollutant Discharge Elimination System (TPDES) provides reasonable assurance that wasteload allocations in this TMDL report will be achieved. Consistent with federal requirements, each TMDL is a plan element of an update to Texas’ Water Quality Management Plan (WQMP). The TCEQ’s WQMP coordinates and directs the state’s efforts to manage water quality and maintain or restore designated uses throughout Texas. The WQMP is continually updated with new, more specifically focused plan elements, as identified in federal regulations (40 Code of Federal Regulations (CFR) Sec. 130.6(c)). Commission adoption of a TMDL is the state’s certification of the associated WQMP update. Implementing these TMDLS The I-Plan specifically identifies required or voluntary implementation actions that will be taken to achieve the pollutant loading goals of the TMDLs. Regulatory actions identified in the I-Plan could include:
§ adjustment of an effluent limitation in a wastewater permit; § a schedule for the elimination of a certain pollutant source; § identification of any nonpoint source discharge that would be regulated as a point
source; § a limitation or prohibition for authorizing a point source under a general permit; or

Two TMDLs for Dissolved Oxygen in Upper Oyster Creek, Segment 1245
Texas Commission on Environmental Quality 40 Adopted July 2010
§ a required modification to a storm water management program (SWMP) and pollu-tion prevention plan (PPP).
The TCEQ works with stakeholders to develop the strategies summarized in the I-Plan. I-Plans may use an adaptive management approach that achieves initial loading allocations from a subset of the source categories. Adaptive management allows for development or refinement of methods to achieve the environmental goal of the plan. Strategies to optimize compliance and oversight are identified in an I-Plan when necessary. Such strategies may include additional monitoring and reporting of effluent discharge quali-ty to evaluate and verify loading trends, adjustment of an inspection frequency or a response protocol to public complaints, and escalation of an enforcement remedy to require corrective action of a regulated entity contributing to an impairment. The complexity of the hydrodynamics for Segment 1245 suggests that additional investiga-tions to further the state’s understanding of dissolved oxygen dynamics in the segment and the best methods for protecting the designated aquatic life use of both the Lower and Upper Reaches may be useful. The dissolved oxygen issues for the Lower Reach (1245_01) are not addressed in these TMDLs, because the TCEQ has planned a UAA for this reach. For the Upper Reach (1245_02 and 1245_03), additional monitoring activities may be con-ducted during the implementation process to obtain a better understanding of the conditions resulting in the dissolved oxygen exceedances. This could include assessing the effects of pumping, maintenance dredging, periodic herbicide treatment to control aquatic vegetation, and low stream velocities on dissolved oxygen in the segment. The effects of changes to the number, density, and location of septic tanks might also be considered.
Two TMDLs for Dissolved Oxygen in Upper Oyster Creek, Segment 1245
Texas Commission on Environmental Quality 41 Adopted July 2010
References Arnold, J. G., R. Srinivasan, R. S. Muttiah, and J. R. Williams. 1998. Large-area hydrologic
modeling and assessment: Part I. Model development. J. American Water Resources Assoc. 34(1): 73-89.
Bowie, G.L., W.B. Mills, D.B. Porcella, C.L. Campbell, J.R. Pagenhoff, G.L. Rupp, K.M. Johnson, P.W.H. Chan, S.A. Gherini, and C.E. Chamberlin. 1985. Rate, Constants, and Kinetics Formulations in Surface Water Quality Modeling (Second Edition). EPA/600/3-85/040. Environmental Research Laboratory, Office of Research and De-velopment, U.S. Environmental Protection Agency, Athens, GA.
Chapra, S., G. Pelletier and H. Tao. 2006. QUAL2K: A Modeling Framework for Simulat-ing River and Stream Water Quality (Version 2.04) Documentation. Civil and Environmental Engineering Department, Tufts University, Medford, MA. March 7, 2006.
EPA 1991. Guidance for Water Quality-Based Decisions: The TMDL Process. <www.epa.gov/OWOW/tmdl/decisions/>.
EPA 2005. Envirofacts Warehouse–PCS. <www.epa-echo.gov/echo/>. (April 15, 2005).
EPA 2008. Envirofacts Warehouse–PCS. <www.epa-echo.gov/echo/>. (Oct. 3, 2008).
Hauck, L.M. 2008. Addendum to Technical Support Document: Upper Oyster Creek (1245) Dissolved Oxygen TMDL. Prepared for Texas Commission on Environmental Quality. Prepared by Texas Institute for Applied Environmental Research, Tarleton State University, Stephenville, Texas.
Hauck, L.M. and B. Du. 2006. Technical Support Document: Upper Oyster Creek (Seg-ment 1245) Bacteria TMDL. Prepared for Texas Commission on Environmental Quality. Prepared by Texas Institute for Applied Environmental Research, Tarleton State University, Stephenville, Texas.
Hauck, L.M. and B. Du. 2007. Technical Support Document: Upper Oyster Creek (Seg-ment 1245) Dissolved Oxygen TMDL. (TR0708). Prepared for: Texas Commission on Environmental Quality, TMDL Team. Prepared by: Texas Institute for Applied Environmental Research, Tarleton State University, Stephenville, TX.
Houston-Galveston Area Council, 2007 Land Use. Accessed April 8, 2009. <www.h-gac.com/rds/Land_Use/default.aspx>
Kolbe 1992. Texas Water Commission. An Assessment of Water Quality and Fish Kills in Upper Oyster Creek, Segment 1245. SR 92-05. Texas Water Commission, Austin, Texas.
NOAA. 2004. National Oceanic and Atmospheric Administration. <www.noaa.gov> (April 21, 2005).
TCEQ 1996. Texas Water Quality Inventory and 303(d) List. <www.tceq.state.tx.us/ compliance/monitoring/water/quality/data/wqm/305_303.html>.
Two TMDLs for Dissolved Oxygen in Upper Oyster Creek, Segment 1245
Texas Commission on Environmental Quality 42 Adopted July 2010
TCEQ 2000. Texas Surface Water Quality Standards, 2000 update, 30 TAC 307. <www.tceq.state.tx.us/permitting/water_quality/wq_assessment/standards/ WQ_standards_2000.html>.
TCEQ 2004. Texas Water Quality Inventory and 303(d) List. <www.tceq.state.tx.us/ compliance/monitoring/water/quality/data/wqm/305_303.html>.
TCEQ 2007. One Total Maximum Daily Load for Bacteria in Upper Oyster Creek <http://163.234.20.106/assets/public/implementation/water/tmdl/25oystercreek/ 25-upperoysterbacteria-approved-epa.pdf>.
TCEQ 2008a. Texas Water Quality Inventory and 303(d) List. <www.tceq.state.tx.us/ assets/public/compliance/monops/water/08twqi/2008_303d.pdf>.
TCEQ. 2008b. 2008 Guidance for Assessing and Reporting Surface Water Quality in Texas (March 19, 2008) <www.tceq.state.tx.us/assets/public/compliance/monops/water/ 08twqi/2008_guidance.pdf>.
Thomann, R.V. and J.A. Mueller. 1987. Principles of Surface Water Quality Modeling and Control. Harper & Row Publishers, New York, NY
TIAER (Texas Institute for Applied Environmental Research). 2002. Upper Oyster Creek (Segment 1245) Dissolved Oxygen & Bacteria TMDL Quality Assurance Project Plan Revision 0 (Approved by EPA Sep. 22, 2002), Tarleton State University, Ste-phenville, Texas.
TIAER (Texas Institute for Applied Environmental Research). 2004. Upper Oyster Creek (Segment 1245) Dissolved Oxygen TMDL Quality Assurance Project Plan Revision 1 (Approved by EPA Mar. 9, 20024), Tarleton State University, Stephenville, Texas.
TIAER (Texas Institute for Applied Environmental Research). 2005. Upper Oyster Creek (Segment 1245) Dissolved Oxygen TMDL Quality Assurance Project Plan Revision 2 (Approved by EPA Apr. 22, 2005), Tarleton State University, Stephenville, Texas.
TNRCC (Texas Natural Resource Conservation Commission). 1995. QUAL-TX User’s Manual Version 3.4 Update December, 1995. Austin, Texas.
TWDB (Texas Water Development Board). 2006. 2006 Regional Water Plan Population Projections 2000–2060; Region H. <www.twdb.state.tx.us/data/popwaterdemand/ 2003Projections/Population%20Projections/RegionH/Region_H_Pop.htm>. (April 19, 2006).
U.S. Census Bureau. 1990. <www.census.gov>. (accessed April 21, 2005)
U.S. Census Bureau. 2000. <www.census.gov>. (accessed April 21, 2005)


![Dissolved Oxygen [DO]](https://static.fdocuments.net/doc/165x107/5a6721977f8b9ab12b8b464b/dissolved-oxygen-do.jpg)