
One minute 7-22-04 - Berkeley Haasfaculty.haas.berkeley.edu › lyons › Carlson one minute.pdf ·...
29
July 2004, forthcoming JIMF One minute in the life of the DM/US$: public news in an electronic market John A. Carlson a, *, Melody Lo b a Purdue University, Department of Economics, West Lafayette, IN 47907, USA b University of Southern Mississippi, Dept. of Economics, Hattiesburg MS 39406, USA _________________________________________________________________________ Abstract Public news can be expected to change market prices but, unlike “public information,” there are differing expectations about the impact. Hence trading is necessary for the market to process these divergent views. A surprise announcement of an increase in German interest rates coupled with concurrent transactions data enables us to study in detail dealers’ reactions. The patterns observed are consistent with dealers’ practice to book targeted profits immediately if possible in the face of uncertainty. Evidence also shows that the speculative activity by traders in initial reaction to the news destabilized the market for the next two hours. JEL classification: F30; G14; G15 Keywords: Exchange rate; Public news; Public information; Electronic interdealer market; Order flows _________________________________________________________________________ * Corresponding author. Telephone: 765-494-4450; Fax: 765-494-9658; E-mail address: [email protected]
Transcript of One minute 7-22-04 - Berkeley Haasfaculty.haas.berkeley.edu › lyons › Carlson one minute.pdf ·...

July 2004, forthcoming JIMF
One minute in the life of the DM/US$: public news in an electronic market
John A. Carlson a, *, Melody Lo b
a Purdue University, Department of Economics, West Lafayette, IN 47907, USA
b University of Southern Mississippi, Dept. of Economics, Hattiesburg MS 39406, USA
_________________________________________________________________________
Abstract
Public news can be expected to change market prices but, unlike “public information,”
there are differing expectations about the impact. Hence trading is necessary for the
market to process these divergent views. A surprise announcement of an increase in
German interest rates coupled with concurrent transactions data enables us to study in
detail dealers’ reactions. The patterns observed are consistent with dealers’ practice to
book targeted profits immediately if possible in the face of uncertainty. Evidence also
shows that the speculative activity by traders in initial reaction to the news destabilized the
market for the next two hours.
JEL classification: F30; G14; G15
Keywords: Exchange rate; Public news; Public information; Electronic interdealer market;
Order flows
_________________________________________________________________________
* Corresponding author. Telephone: 765-494-4450; Fax: 765-494-9658; E-mail address:

2
1. Introduction
What causes asset prices, including foreign exchange rates, to change? What are
the mechanisms by which these changes occur? These questions have generated a huge
literature in both economics and finance. Here we will focus on the foreign exchange
market and, by concentrating in considerable detail on the transactions following a specific
news announcement, enhance our understanding of the relationships among public news,
dealer trading, and exchange-rate changes.
While short-run movements in exchange rates are not well correlated with changes
in macroeconomic variables, many announcements do appear to have significant impacts
on exchange rates. For a recent example, see Andersen, et al. (2003). In their thorough
study, they find that prices adjust fully to news immediately (within five minutes) while
volatilities adjust gradually with complete adjustment within about an hour. They
comment (p. 59) that it “will be of interest … to determine whether news affects exchange
rate via order flow or instantaneously.” Order flow in an interdealer market is buyer
initiated minus seller initiated trades.
As is well known, in principle a price response to new public information can take
place without any trades. According to Fleming and Remolona (1999, p. 1901), “Theory
(e.g., French and Roll (1986)) identifies public information as that which affects prices
before anyone can trade on it.” In a foreign exchange market, this might happen when
dealer quotes are only indicative and actual deals are struck over the telephone. If all
dealers agree on a new market value after a public announcement, all prior quotes become
obsolete. New quotes appear and trading can continue as usual around a markedly
changed market price, without order flow during the change. This concept constitutes a

3
standard simplification in the analysis of market microstructure that public information
does not affect the impact of concurrent order flows (see Hasbrouck (1991) as an
example).
We will use the term public news for a situation in which there is uncertainty about
the market impact of new information made available to all market participants at the same
time. This terminology will avoid any potential confusion with the French and Roll
concept of public information. The idea of divergent mappings from information to prices
is discussed by Lyons (2001, p. 21) as one reason why order flow conveys information to
the market and therefore tends to move price. See also Isard (1995, pp. 182-3)
Evans (2002) makes a useful distinction between common knowledge (CK) and
non-common knowledge public news. “CK news is characterized by the simultaneous
arrival of new information to all market participants and their homogeneous interpretation
of its implications for equilibrium prices.” (p. 2406). Based on his statistical analysis of
exchange rate changes and order flow, Evans concludes that CK news shocks are rarely the
predominant source of exchange rate movements over long or short horizons.
Love and Payne (2003) estimate more directly the impact of several types of public
announcements on the interactions between order flow and exchange-rate changes. They
conclude that nearly two thirds of price relevant public information is incorporated into
prices via the trading process. While Love and Payne look at directional effects, Evans
and Lyons (2003) have similar results in terms of variance of exchange rates induced by
news. Their bottom line in accounting for daily return variation is roughly: “10 percent
direct news effects, 20 percent news-related flow, 40 percent news-unrelated flow, and 30
percent still unaccounted for” (p. 33).

4
Clearly there is interest in the role of trading when a public announcement can be
expected to change the equilibrium exchange rate. The studies cited above generally
estimate fixed coefficient statistical models, but the process behind the coefficients is
largely conjecture. To enhance our understanding of the complex interactions that can take
place when news hits a foreign exchange market, we will examine the tick-by-tick
transactions in an electronic foreign exchange market for DM/US$ immediately following
a surprise announcement by the Bundesbank at 11:30 GMT on October 9, 1997, to raise a
key interest rate. Conventional wisdom tells us that this exchange rate should drop (DM
appreciation). How much of a drop is, of course, an open question.
Fig. 1 shows transactions prices for the DM/$ on the day of the announcement.
There does appear to be an almost immediate drop in price of the dollar near the time of
the 11:30 announcement. With considerable volatility, the price of the dollar drifts lower
until about 1:30 and then gradually recovers to end the day at about the same level as it had
immediately after the announcement.
There is a lot more to the story even during the first minute after the announcement.
In what follows, section 2 describes some remarkably detailed data and the nature of an
electronic interdealer market. There are two distinct phases of trading activity in the first
minute after 11:30. The first phase, lasting about 35 seconds and described in section 3, is
a flurry of trades and a hollowing out of the market, a strong indication of uncertainty
about the pending announcement. The second phase, discussed in section 4, is a large drop
in the dollar as sellers rapidly hit existing demand. What is surprising here is how little of
the demand was withdrawn during this period.

5
The speculative trading that took place during that first minute set in motion
subsequent dynamics, which are discussed in Section 5. In the second minute after the
announcement, something occurs that is quite contrary to the idea that price adjusts
without trades or order flow when there is new public information. In this case, order flow
was strongly negative throughout the second minute and yet price changed very little. We
offer an explanation that is consistent with the uncertainties generated by public news and
the prior speculative trading. Section 5 also reports evidence that it took about two hours
before the market again settled into more normal patterns. Section 6 concludes.
2. An electronic interdealer FX market
The interdealer market data we analyze come from what is known as the D2000-2
electronic market, maintained by Reuters. The data for the week of October 6 – 10, 1997,
for trading of the DM/$ were obtained from Reuters by the Financial Markets Group at the
London School of Economics. See Goodhart, et al. (1996), Danielsson and Payne (2002),
and Payne (2003) for additional details about the D2000-2 data.
At any time, a participating dealer can enter:
A bid, a limit order to buy at a specified price or lower,
An ask, a limit order to sell at a specified price or higher,
A hit, a market sell order at the best available bid price, or
A take, a market buy order at the best available ask price.
The dealer can also withdraw or cancel an unfilled bid or ask. The system records actual
transactions and keeps track of all the existing orders that have not been filled. The screen
that the dealers see shows only the highest bid, the lowest ask, the quantities available at

6
these best bid and ask prices, and the price of the most recent transaction. The data show
to the nearest 0.01 of a second the times when a transaction enters the market and when it
is removed or withdrawn.
An interdealer FX market provides a link between diverse buyers and sellers of
foreign exchange. For ease in exposition we will often refer to a bank’s dealing room as
the bank and, while several people may be involved, we will occasionally refer to a single
trader carrying out different transactions and representing the fiduciary interests of the
bank. See Lyons (2001) for a detailed discussion of the microstructure approach to
exchange rates.
Portfolio shifts and changing needs for different currencies by banks’ customers are
an ongoing process. Customers may deal regularly with one bank or may check with
several banks for the best prices before placing an order. A bank will typically quote both
bid and ask prices in response to a query and the caller may or may not choose to buy
foreign currency at the bank’s ask price or sell at the bank’s bid price. These quotes will
change over time in response to market changes and may be different for different types of
customers. There are now electronic broking systems for these customer markets that did
not exist in 1997.
For illustrative purposes, suppose the bank offers to sell dollars at 1.7520 DM/$
and to buy at 1.7510 DM/$. Consider what might happen if a customer decides to buy 2
million dollars with DM at a price of 1.7520. This is an example of what is known as
private information in the literature. In this case, the bank is now long in DM and short in
dollars and needs to decide what to do. A trader for the bank can put in a market take
order in the interdealer market to buy dollars right away. Or the trader can speculate by

7
putting in a limit bid order to buy dollars at a price below the current best offer price in the
market.
A decision to cover the bank’s position and buy dollars immediately in the
interdealer market is profitable for the bank because the “touch” or “inside spread”, the
difference between the lowest offer price and the highest bid price, is typically smaller than
the spread in the customer market. Suppose, for example, that the best offer price is
1.7516 and the best bid price is 1.7514. If the bank buys 2 million dollars at 1.7516, there
is an immediate profit of 800 DM ($2,000,000 times 0.0004 DM/$).
As evident in Fig. 1, the market price jumps around. If instead of immediately
covering the bank’s short position in dollars, the bank’s trader puts in a bid price to buy 2
million dollars at a price below 1.7516, say 1.7514, and waits for another dealer to agree to
sell 2 million at the limit price, this is a speculative position. The market may hit the price
and the profit is 1,200 DM. However, there may be a subsequent run of buyer-initiated
trades, and the trading prices may start to rise. In setting a limit order, the trader has to
weigh the tradeoff between the expected gain from waiting and the greater uncertainty
about the eventual price at which the bank’s position is covered. 1
Our example of a bank receiving an order from a customer to purchase 2 million
dollars is, as noted above, private information. If the bank immediately covers the position
in the interdealer market by making a purchase of dollars, this is known as a positive order
flow and in effect transmits to the market the bank’s private information. An order flow is
a signed transaction in the interdealer market. If a buyer initiates a trade, the order flow is
1 Costs and benefits of placing orders rather than dealing immediately are discussed in Handa and Schwartz
(1996), Foucault (1999), and Hollifield, et al. (2002), inter alia.

8
positive. If a seller initiates a trade, the order flow is negative. Over a period of time, the
net order flow is the difference between the quantity of buyer-initiated and seller-initiated
trades in the interdealer market.
Since all transactions in this interdealer market are in millions of dollars, in later
discussion we will refer to the transactions in units, where it is understood that one unit is
one million dollars.
3. The initial reactions
On Thursday, October 9, 1997, the Bundesbank had a council meeting to review its
policy positions. Based on the fact that German unemployment remained at a high level of
11.2% in September and there was no major inflation threat at the time, the market
consensus was for no immediate interest rate hike. Various presses repeatedly reported
that the majority of traders expected no changes in interest rates that day, thinking it more
likely to occur in a few weeks.
These expectations about the timing proved wrong. An 11:50 Greenwich Mean
Time (GMT) AP-Dow Jones News reported: “At 1130 GMT, the Bundesbank announced
that it had fixed the rate for its securities repurchase agreements at 3.30% for the next two
weeks, up from 3.00%. The German central bank said that the move had been aimed at
preempting higher inflation, and will help damp growth in the M3 money supply
aggregate.” This Bundesbank rate hike initiated an end to the five-year decline in
European rates.2
2 The English version of the press release along with a description of how the Bundesbank conveys its news
to the public is available on request.

9
For this particular Bundesbank interest-rate announcement, traders were not only
surprised by the decision of an interest rate hike, but also by the unusual release time of
11:30 GMT. Hardy (1998) documents that the Bundesbank Council reviews its interest
rates every other Thursday and decisions are announced later that afternoon or early the
next morning. The press center of the Bundesbank confirms this claim and says that the
most frequent timing for announcements is 3:00 in the afternoon (which would be 14:00
GMT). When the Bundesbank made its interest rate announcement, the array of open
orders appeared to be fairly normal. Thus, the unusual timing of unexpected news
provides an opportunity to study precisely how traders react to a surprise announcement.
In an electronic market, quotes are firm. If bids or offers are not canceled prior to
or during a public announcement, transactions can occur as the price adjusts in reaction to
new information. In the case of the surprise announcement by the Bundesbank on October
9, 1997, a huge volume of trading did occur in the minute of the announcement.
At any time in the interdealer market, there is an array of limit orders to buy and an
array of limit orders to sell. We will refer to unfilled buy orders as demand in the
interdealer market and to unfilled sell orders as supply. Panel (A) of Fig. 2 depicts the
situation at 11:30 am on Thursday, October 9, 1997. At precisely 11:30 am the highest
buy order was at 1.7530 DM for 5 units. The relatively flat demand schedule depicted in
the figure is the cumulative array of limit buy orders unfilled as of 11:30. The supply
schedule is the cumulative array of limit sell orders, beginning with 5 units at 1.7535. The
degree of liquidity in the market is reflected in both the inside spread and the flatness of
the curves. For the picture shown, the inside spread is 0.0005, and the spread at 10 units is
0.0021. These spreads were somewhat more than was typical for this market during active

10
hours, but not unusually so. (See Danielsson and Payne (2002) for a distribution of inside
spreads during the week and footnote 5 below.) The picture is one of fairly strong buying
support for the dollar at this time.
When the announcement by the Bundesbank reportedly began at 11:30, there are no
trades for the next 13 seconds and 6 units of sell offers are withdrawn. The absence of
trades suggests that dealers temporarily stopped trading to note that an announcement was
pending.
Over the next 22 seconds, from 11:30:13 to 11:30:35, 87 units are traded. (For
reference, average volume over the week in this market was about 20 units per minute
during active trading times.) These initial trades are both supply initiated and demand
initiated, and the price trend surprisingly is generally up during these 22 seconds, rising
from 1.7530 to 1.7560. The fact that the transactions prices rose indicates that many
traders did not yet expect that the news would precipitate a fall in the dollar.
Panel (A) of Fig. 2 shows considerably more demand than supply at 11:30:00. We
interpret this as indicative of a greater volume of open short positions in dollars than open
long positions that need to be covered in the interdealer market. The increase in the price
of the dollar during those 35 seconds undoubtedly represents more short covering by
buyer-initiated trades at the best offer prices than long covering by seller-initiated trades at
the best bid prices during this period.
As a result of this activity, there is a substantial hollowing out of the market from
11:30:00 to 11:30:35. This can be seen by comparing panel (A) and panel (B) in Fig. 2.
By 11:30:35, the inside spread grew to 0.0039 and the spread at 10 units to 0.0052. These

11
are very large for this market. Several dealers evidently covered speculative positions and
were waiting to see how to interpret the news.
4. A dramatic shift in trading activity
A notable change in behavior occurred at about 11:30:35, or 35 seconds after the
announcement reportedly began. Shortly after 11:30:35, the price of the dollar started to
drop. By 11:30:59.03, there is a trade at 1.7450 DM. That is a drop of over 0.6 percent in
25 seconds. [ln(1.756) – ln(1.745) = 0.006284.] To place the drop in perspective, consider
what Dominguez (2003) found when she examined 5-minute returns in the DM/$ rate from
1989 to 1995. A return of 0.006284 would have been the ninth largest in that six-year
period.
The full impact of the announcement apparently hits the market at about 11:30:35.
As seen by comparing panel (B) and panel (C) in Fig. 2, there is a dramatic shrinkage of
the demand curve between 11:30:35 and 11:31:00. Beginning at 11:30:37 until 11:30:59,
sellers rapidly hit buy orders along the demand curve, mostly by crossed limit orders rather
than by market orders.3 86 units along the demand curve that existed at 11:30:35 are
removed. Remarkably, only 5 of these units were removed by bidders withdrawing their
bids. All the rest were seller-initiated trades.
During these 25 seconds, there is also considerable activity by sellers testing the
market. If an offer does not immediately result in a transaction, many of these offers are
3 A market sell order trades at the best available bid price. In a rapidly changing market, there is uncertainty
about what the transaction price may be. A limit order to sell below existing bid prices will transact at any
bid prices above the limit order, up to the quantity specified, but assures that the selling price will not be
below the limit price.

12
withdrawn within a few seconds. A comparison of panel (B) and panel (C) in Fig. 2 shows
a few new offers that entered between 11:30:35 and 11:31 are still on the supply side of the
market at 11:31. All of the unfilled offers as of 11:30:35 are eventually withdrawn without
any sale.
In this electronic market, because buy orders were not withdrawn quickly, negative
order flow drove the price lower. By 11:30:35, many dealers, contrary to prior
expectations, expected the DM price of the dollar to fall. If that had been fully anticipated,
there would not have been such a high and flat demand curve at that time.
An interesting question is why more of the demand was not immediately
withdrawn after 11:30:35. To address this question, we need to distinguish limit orders by
whether or not they represent speculative cover for open positions. Some dealers may, at
that moment, be market makers without a long or short position. Their limit orders have
been entered in hopes of making profits by eventual transactions on both sides of their
spread. When new information arrives suggesting that the market price will fall, their bids
should be immediately withdrawn and new bids entered at a lower price, although these
dealers may wait to see where the market stabilizes before entering new bids. There is less
urgency about immediately replacing their ask prices in this situation. The fact that so few
units of demand were withdrawn as the price fell suggests that there were very few market
makers without open positions among the higher bid prices at 11:30:35.
From this we infer that most of the bids at the top of the demand curve were put in
by dealers with short positions in dollars. Their bid prices, if executed, would yield a
profit to the bank. The question then is why these dealers did not withdraw their bids,
which were based on prior information, and put in new lower ones to reap extra expected
13
profits. Since these bids represent speculative cover of open positions that are the result of
prior sales of dollars, the fall in the price of the dollar is good news for these traders whose
bids can shortly be executed if not withdrawn. If they get greedy, withdraw their existing
bids, and try to buy later at a lower price, they may miss a turning point and not realize the
profit at all. As an exercise in self-discipline, which is essential for success, dealers let
targeted profitable bids be hit. Conversations with dealers indicate that this is a common
practice, and in a practitioner’s guide for currency traders, Henderson (2002, p. 189)
stresses: “Trading discipline is at least as important as having the right view.”
For reasons of confidentiality, individual dealers are not identified in the data set,
so we cannot tell if dealers whose prior bids were hit also tried to make sales to other
bidders. There is no reason why they cannot join the crowd and make speculative sales if
they think additional expected profits are possible.
These considerations raise another point. While order flow drives the market price
given the existing limit orders, the source of the order flow can make a difference. Dealer-
driven order flow can have implications for subsequent market behavior that differ from
customer-driven order flow. When a seller-initiated transaction in the interdealer market
covers a bank’s prior sale to a customer, the bank’s position has been squared and there is
no subsequent potential trading because of that transaction. By dealer-driven order flow,
we mean speculative open positions taken by dealers. At some point those dealers will
need to cover their positions and that can induce further uncertainty and volatility in the
market. Thus, we expect subsequent effects well after the Bundesbank announcement.

14
5. Time to settle down
To begin an examination of the subsequent dynamics, we take a closer look at the
patterns of order flow and price changes during the two minutes after 11:30. Fig. 3 shows
cumulative order flow and transaction prices from 11:30 to 11:32. 4
As can be seen in Fig. 3, the pattern during the first minute is definitely one of
order flow driving price. The relatively big drop in price right after 11:30:35 was a bounce
from a prior buyer-initiated trade along the existing supply schedule to a seller-initiated
trade along the then much lower demand schedule.
At first glance, the second minute looks anomalous. Order flow continued to be
strongly negative but this did not drive price lower. There were trades at a price of 1.7450
DM/$ at 11:31:01.06 and again a minute later at 11:32:01.60. In between, price bounced
up occasionally but never very far above 1.7450. The negative flow is generated by the
fact that dealers were putting in new buy orders that were almost immediately hit by seller-
initiated trades. It is likely that these new buy orders were by dealers who had made
speculative sales during the price decline in the first minute. It looked as if a temporary
floor had been found, so they were booking their profit from the prior speculative sales.
The fact that there were also willing sellers at this price level reflects still divergent
views about when the price will stop falling. The evidence suggests the following
scenario. Some customers, who continuously monitor the market, decide to sell dollars.
This will give rise to customer-driven order flow in the interdealer market. The banks
4 This differs from Fig. 1 in two ways. First, Fig. 3 shows tick-by-tick data while Fig. 1 is accumulated over
5 second intervals and the price is the last transaction price during the interval. Second, in Fig. 3 order flow is
weighted by the size of a transaction, and in Fig. 1 order flow is unweighted.

15
receiving these orders have private information about selling pressure that they believe will
drive price still lower in the interdealer market. The dealers in these banks therefore want
to cover their long positions immediately by selling dollars in the interdealer market.
Some may also take speculative short positions. Thus, the decline in price in the first
minute could have been in anticipation of customer-driven order flow that would follow in
the second minute or later. For price to decline further then depends on ensuing decisions
by customers to sell dollars.
For the next two hours, with lots of bounces, the trend in price is down and order
flow is negative. Over time, as dealers try to square their positions, their purely
speculative order flows should tend to cancel each other. Therefore, a negative net order
flow over a period as long as two hours is very likely generated by outside customer sell
orders. In that case, the picture in Fig. 1 indicates that somewhat delayed portfolio shifts
out of dollars and into DMs drove the price of the dollar down.
This downward pressure on the dollar then drew central banks into the market.
According to an AFX news wire at 14:03 GMT: “A number of European central banks,
among them the Bundesbank, are reported by dealers to have been intervening in the
currency market in an effort to cap the strength of the mark following the decisions to raise
German and other core European interest rates, dealers said. They said that central banks
have been buying dollar/mark just below the 1.7400 level.”
In Fig. 1, the downward trend in the price of the dollar is reversed by about 13:30.
In addition to central bank demands for dollars, outside sellers of dollars are probably
buying them back. By the end of the day, the dollar has recovered to its level reached
shortly after the announcement.

16
Evidence indicates that it took about two hours for trading volume and price
volatility to settle down to normal in this market.5 Table 1 records mean trading volumes
per minute in 10 minute intervals from 11:00 to 14:00 on Thursday and on Monday,
Tuesday and Wednesday, as well as p-values for the hypotheses of equal means. Between
11:10 and 11:30 on Thursday, volume was slightly less than on the prior three days but not
significantly so. As we detailed above, volume rose dramatically during and immediately
after the announcement on Thursday, and significantly so compared with Monday through
Wednesday. Volume remained relatively high on Thursday until about 13:20.
For eight different hours of the day, Monday through Thursday from 7:30 to 15:30
GMT, for a total of 1920 minutes, average trading volume was 19.7 million dollars per
minute with a standard deviation of 17.7. The high standard deviation relative to the mean
reflects a few large outliers and a strong positive skewness of 2.5. In those 1920 minutes,
over half of the minutes with the largest 1 percent of total volume occurred on Thursday
within two hours after the announcement.
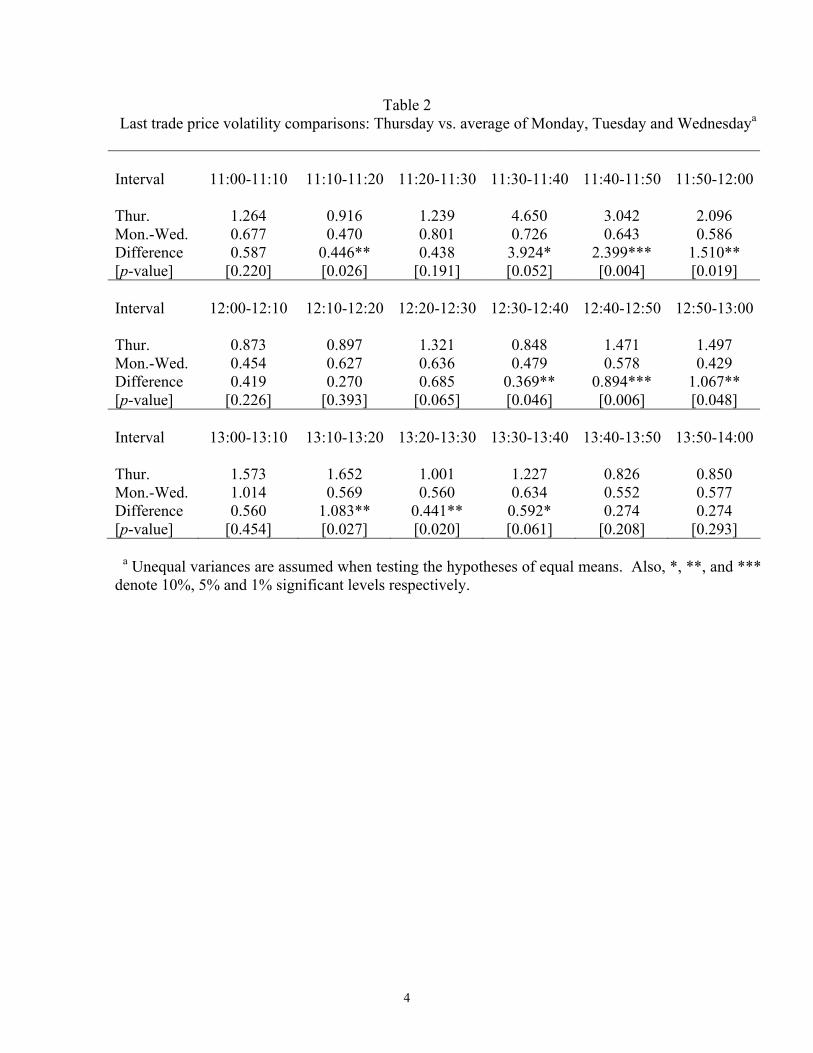
A similar story about the continuing effects of the surprise announcement can be
seen in data on price volatility, shown in Table 2. Price volatility is measured by the
average absolute values of the log change in end-of-minute prices. Thursday’s volatility
jumps for the 30 minutes following the announcement, to exceed substantially average
levels on Monday, Tuesday and Wednesday, and remains relatively high until at least
13:40. Of the 19 highest absolute values of log price changes on those four days, 14 or
5 There is a literature examining the link between the arrival of news and market activity, measured by
trading volume and price volatility. Berry and Howe (1994) and Mitchell and Mulherin (1994) are such
studies with a focus on a stock market, while Melvin and Yin (2000) deal with a foreign exchange market.
We complement this literature by an analysis of market activity in this electronic foreign exchange market
following the speculative activity by traders in the first minute after a surprise macro announcement.

17
them occurred within two hours after the announcement on Thursday and 11 of them
within the first half hour. The story is much the same in terms of within-minute price
volatility.
One other way of assessing market reactions to the news is to examine the spreads
between the supply and demand curves, such as those depicted in Fig. 2. Table 3 shows
the inside spread and spreads at 10 and 40 units at various times on Thursday. While the
inside spread remains fairly narrow after 11:40, there is an occasional widening at higher
numbers of units. By 13:10 a fairly normal depth to the market appears to have been
reestablished, although the spreads are still somewhat higher than for comparable times on
Monday, Tuesday and Wednesday. 6 A figure for demand and supply curves at 13:20, is
very much like the one at 11:30 shown by the panel (A) of Fig. 2, albeit at lower prices.
6. Concluding remarks
An announcement of an interest-rate increase by the Bundesbank beginning at
11:30 Thursday, October 9, 1997, is a good example of public news, in which uncertainty
about the impact results in substantial trading. It contains news that had evidently not been
anticipated at that time and therefore, together with a concurrent record of transactions in
an electronic DM/$ market, provides an opportunity to analyze in detail dynamic market
responses to news. Portfolio balance models predict that this should cause an immediate
appreciation of the DM, as portfolio managers try to switch from dollar to DM assets, but
no one knows for sure how much appreciation will occur.
6 For example, a sampling of spreads between 13:00 and 14:00 on Monday, Tuesday and Wednesday yields
are average inside spread of 2.0, an average spread at 10 units of 7.4 and an average spread at 40 units of
41.4.

18
The first to react to such public news will be the traders in the interdealer market.
If existing price quotes are all indicative and if there is a consensus on what the new price
should be, then the DM/$ price can in principle drop immediately without any trading (the
French and Roll (1986) view of public information) .
By contrast, in the case of the Bundesbank’s interest-rate announcement, the initial
reaction is an extremely high volume of trading, both supply and demand initiated, and an
increasing spread as some traders presumably cover speculative positions. Traders tell us
that it is common practice to cover open positions in times of considerable uncertainty
about pending news.
After 11:30:35, there begins a huge volume of seller initiated trades (negative order
flow) along much of the existing demand schedule. When most market participants
believe that the price of the dollar is about to drop, there is obviously no immediate need to
cancel high sell orders. However, dealers who are long in dollars will have an urgency to
sell quickly or risk losses on their positions. Hence they rush in to sell at existing bid
prices.
The news that the dollar will drop is good news for dealers who are short in dollars
and have open bids to buy dollars. Their choice is either (1) to withdraw their bids and
wait until the price does drop or (2) to let the market hit their bids, book their profits, and
perhaps speculate with sell orders of their own. The fact in this instance that very few bids
were withdrawn indicates that dealers with short positions in dollars overwhelmingly chose
the second option. This is consistent with a practice by dealers, as an exercise in self
discipline, to book profits targeted by the original bids in the face of continuing uncertainty
about price changes. Dealers with whom we have consulted assure us that this particular

19
episode is representative and that the dealer behavior we identify is, in fact, standard for
this type of situation.
These considerations lead us to hypothesize that, in a reverse situation in which
public news suddenly calls for the appreciation of the currency being traded, offers in an
electronic market will be taken more quickly by eager buyers than existing sell orders will
be withdrawn.
We also attribute the continued high volume and price volatility of the DM/$ after
11:31 on Thursday, October 9, 1997, to the speculative activity prior to 11:31. Except for
those who were covering long positions in the dollar, dealers who sold as the price was
dropping now have short positions. They represent a base of support as dealers try to
decide when to square their positions. As dealers adjust positions, waves of trades and
price bounces can readily follow.
From evidence in the D2000-2 data, it took about two hours after the
announcement before the market settled down from the dealer generated speculative
activity. Some of the extra volume after 11:31 can be the result of outside desired portfolio
shifts and central bank interventions, but the extra price volatility is very likely generated
by dealer speculation.
One last point to emphasize is that in a real-time electronic market, everyone does
not react at once to news. First movers can influence the subsequent dynamics. In the case
of the German interest rate announcement in October 1997, speculative selling hit existing
demand in the interdealer market faster than demand was withdrawn and well before
outside portfolio shifts could be implemented.

20
Acknowledgements
We thank Charles Goodhart, Rich Lyons, Carol Osler, Neven Valev and an anonymous
referee for their helpful comments on earlier drafts.
21
References
Andersen, T.G., Bollerslev, T., Diebold, F.X., Vega, C., 2003. Micro effects of macro
announcements: real-time price discovery in foreign exchange. American Economic
Review 93, 38-62.
Berry, T.D., Howe M.K., 1994. Public information arrival. Journal of Finance 49, 1331-
1346.
Danielsson, J., Payne, R., 2002. Real trading patterns and prices in spot foreign exchange
markets. Journal of International Money and Finance 21, 203-222.
Dominguez, K.M., 2003. The market microstructure of central bank intervention. Journal
of International Economics 59, 25-45.
Evans, M.D.D., 2002 . FX trading and exchange rate dynamics. Journal of Finance 57,
2405-2447.
Evans, M.D.D., Lyons, R.K., 2003. How is macro news transmitted to exchange eates?
typescript, U.C. Berkeley, December 2003.
Fleming, M. J., Remolona, E.M., 1999. Price formation and liquidity in the U.S. treasury
market: the response to public information. Journal of Finance 54, 1901-1915.
Foucault, T., 1999. Order flow composition and trading costs in a dynamic limit order
market. Journal of Financial Markets 2, 99-134.
French, K., Roll, R., 1986. Stock return variances: the arrival of information and the
reaction of traders. Journal of Financial Economics 17, 5-26.
Goodhart, C., Ito, T., Payne, R., 1996. One day in June 1993: a study of the working of the
Reuters 2000-2 electronic foreign exchange trading system. In Frankel, J.A., Galli, G.,

22
Giovannini, A., (Eds.), The Microstructure of Foreign Exchange Markets. University
of Chicago Press, pp. 107-179.
Handa, P., Schwartz, R. A., 1996. Limit order trading. Journal of Finance 51, 1835-1861.
Hardy, D.C., 1998. Anticipations and surprises in central bank interest rate policy: the
case of the Bundesbank. IMF Working Paper No. 98/43.
Hasbrouck, J., 1991. Measuring the information content of stock trades. Journal of
Finance, 179-207.
Henderson, C., 2002. Currency Strategy: The Practitioner’s Guide to Currency Investing,
Hedging and Forecasting. John Wiley & Sons.
Hollifield, B., Miller, R., Sandas, P., Slive, J., 2002. Liquidity supply and demand in limit
order markets. Rodney White Center for Financial Research Working Paper,
University of Pennsylvania.
Isard, P., 1995. Exchange Rate Economics. Cambridge University Press.
Love, R., Payne, R. “Macroeconomic news, order flows and exchange rates,” Working
paper, LSE, December 2003.
Lyons, R.K., 2001. The Microstructure Approach to Exchange Rates. MIT Press.
Melvin, M., Yin, X., 2000. Public information arrival, exchange rate volatility and quote
frequency. The Economic Journal 110, 644-661.
Mitchell, M. L., Mulherin, J.H., 1994. The impact of public information on the stock
market. Journal of Finance 49, 923-950.
Payne, R., 2003. Informed trade in spot foreign exchange markets: an empirical
investigation. Journal of International Economics 61, 307-339.

23
1.720
1.726
1.732
1.738
1.744
1.750
1.756
06:0
1:49
.830
"
07:2
2:53
.230
"
08:2
9:44
.350
"
09:5
0:35
.270
"
11:3
0:29
.910
"
12:0
7:23
.060
"
12:4
5:37
.300
"
13:2
7:34
.780
"
14:2
0:23
.690
"
15:3
2:51
.850
"
DM
/US
$
-600
-300
0
300
600
Cum
ulat
ive
orde
r flo
ws
DM/US$ Cumulative order flows
Time: 11:32:56.930 Price: 1.7420
Time: 11:30:29.910 Price: 1.7555

1.72
1.73
1.74
1.75
1.76
1.77
0 30 60 90 120 150Units (millions)
DM
/US$
Panel (A): At 11:30:00
1.72
1.73
1.74
1.75
1.76
1.77
0 30 60 90 120 150Units (millions)
DM
/US$
Panel (B): At 11:30:35
1.72
1.73
1.74
1.75
1.76
1.77
0 30 60 90 120 150Units (millions)
DM
/US$
Panel (C): At 11:31:00
Demand Demand
Demand
Supply Supply Supply
11:30:00 11:30:35 11:31:00 11:30:13
Phase 1 Hollowing out the market
Phase 2 Hitting the existing demand
Absence of trades
87 units are traded (both buyer and seller initiated traders)
81 units along the demand curve that existed at 11:30:35 are removed by seller initiated trades; and only 5 units of existing demand withdrawn

1.740
1.745
1.750
1.755
1.760
1.76511
:30:
13.6
80"
11:3
0:23
.190
"
11:3
0:25
.920
"
11:3
0:31
.210
"
11:3
0:34
.330
"
11:3
0:42
.760
"
11:3
0:46
.140
"
11:3
0:49
.480
"
11:3
0:56
.400
"
11:3
1:06
.230
"
11:3
1:19
.040
"
11:3
1:36
.060
"
11:3
1:42
.310
"
11:3
1:50
.050
"
11:3
1:56
.520
"
DM
/US
$
-150
-90
-30
30
Wei
ghte
d cu
mul
ativ
e or
der f
low
Limit bid entered prior to 11:30 Limit offer entered prior to 11:30DM/US$ Weighted cumulative order flows

2
Figure 1. The price of DM/US$ and cumulative order flows for Thursday of Oct. 9th, 1997
Figure.2. Demand, supply, and associated timeline of events for Thursday 11:30-11:31 Figure.3. The price of DM/US$ and weighted cumulative order flows for Thursday 11:30-11:32.

3
Table 1
Average per-minute trading volumes: Thursday vs. Monday, Tuesday and Wednesdaya Interval
11:00-11:10
11:10-11:20
11:20-11:30
11:30-11:40
11:40-11:50
11:50-12:00
Thur 19.750 13.250 12.050 82.350 67.300 40.300 Mon.-Wed. 17.167 15.667 18.267 16.750 17.933 15.967 Difference 2.583 -2.417 -6.217 65.600*** 49.367*** 24.333*** [p-value] [0.685] [0.458] [0.115] [0.001] [0.001] [0.002] Interval
12:00-12:10
12:10-12:20
12:20-12:30
12:30-12:40
12:40-12:50
12:50-13:00
Thur. 24.750 38.350 48.400 35.200 28.150 17.500 Mon.-Wed. 11.550 16.967 34.433 18.050 27.967 21.733 Difference 13.200*** 21.383** 13.967* 17.150** 0.183 -4.233 [p-value] [0.001] [0.013] [0.085] [0.023] [0.971] [0.280] Interval
13:00-13:10
13:10-13:20
13:20-13:30
13:30-13:40
13:40-13:50
13:50-14:00
Thur. 44.950 55.100 25.050 21.050 19.700 24.750 Mon.-Wed. 28.583 28.717 23.367 22.533 22.117 23.700 Difference 16.367 26.383*** 1.683 -1.483 -2.417 1.050 [p-value] [0.359] [0.001] [0.623] [0.726] [0.505] [0.840] a Unequal variances are assumed when testing the hypotheses of equal means. Also, *, **, and *** denote 10%, 5% and 1% significant levels respectively.
4
Table 2 Last trade price volatility comparisons: Thursday vs. average of Monday, Tuesday and Wednesdaya
Interval
11:00-11:10
11:10-11:20
11:20-11:30
11:30-11:40
11:40-11:50
11:50-12:00
Thur. 1.264 0.916 1.239 4.650 3.042 2.096 Mon.-Wed. 0.677 0.470 0.801 0.726 0.643 0.586 Difference 0.587 0.446** 0.438 3.924* 2.399*** 1.510** [p-value] [0.220] [0.026] [0.191] [0.052] [0.004] [0.019] Interval
12:00-12:10
12:10-12:20
12:20-12:30
12:30-12:40
12:40-12:50
12:50-13:00
Thur. 0.873 0.897 1.321 0.848 1.471 1.497 Mon.-Wed. 0.454 0.627 0.636 0.479 0.578 0.429 Difference 0.419 0.270 0.685 0.369** 0.894*** 1.067** [p-value] [0.226] [0.393] [0.065] [0.046] [0.006] [0.048] Interval
13:00-13:10
13:10-13:20
13:20-13:30
13:30-13:40
13:40-13:50
13:50-14:00
Thur. 1.573 1.652 1.001 1.227 0.826 0.850 Mon.-Wed. 1.014 0.569 0.560 0.634 0.552 0.577 Difference 0.560 1.083** 0.441** 0.592* 0.274 0.274 [p-value] [0.454] [0.027] [0.020] [0.061] [0.208] [0.293] a Unequal variances are assumed when testing the hypotheses of equal means. Also, *, **, and *** denote 10%, 5% and 1% significant levels respectively.

5
Table 3 Spreads between supply and demand curves on Thursdaya
Time
11:29
11:30
11:31:35
11:31
11:35
11:40
11:45
Inside Spread 3 5 39 15 4 1 3 Spread at 10 units 18 21 52 62 4 10 40 Spread at 40 units 64 60 132 405 none 179 none Time
11:50
12:00
12:10
12:20
12:30
12:40
12:50
Inside Spread 3 2 1 3 3 1 1 Spread at 10 units 14 23 10 6 11 9 4 Spread at 40 units 70 80 26 50 75 72 45 Time
13:00
13:10
13:20
13:30
13:40
13:50
14:00
Inside Spread 3 3 2 2 2 4 2 Spread at 10 units 22 6 15 9 11 21 10 Spread at 40 units 75 25 60 58 55 75 60 a Spreads are shown as 1000 times the actual spreads.