one hour 15 min Measuring ROI in the Public Sector ROI in the Public Sector ... Percent of Programs...
23
Measuring ROI in the Public Sector Jack J. Phillips, Ph.D. Copyright © 2008. No part of this may be reproduced, stored in a retrieval system, or transmitted in any form or by a means without written permission. Phone: 205‐678‐8101 • Fax: 205‐678‐8102 Email: [email protected] Agenda After attending this session, you will be able to: • Identify the steps, elements, and standards involved in the ROI methodology • Select particular programs for appropriate levels of analysis • Explain the benefits of the use of ROI methodology • Describe how ROI has been applied in Public Sector organizations
Transcript of one hour 15 min Measuring ROI in the Public Sector ROI in the Public Sector ... Percent of Programs...
Measuring ROI in the Public Sector
Jack J. Phillips, Ph.D. Copyright © 2008. No part of this may be reproduced, stored in a retrieval system, or transmitted in any form or by a means without written permission.
Phone: 205‐678‐8101 • Fax: 205‐678‐8102 Email: [email protected]
Agenda After attending this session, you will be able to:
• Identify the steps, elements, and standards involved in the ROI
methodology • Select particular programs for appropriate levels of analysis • Explain the benefits of the use of ROI methodology • Describe how ROI has been applied in Public Sector organizations

1
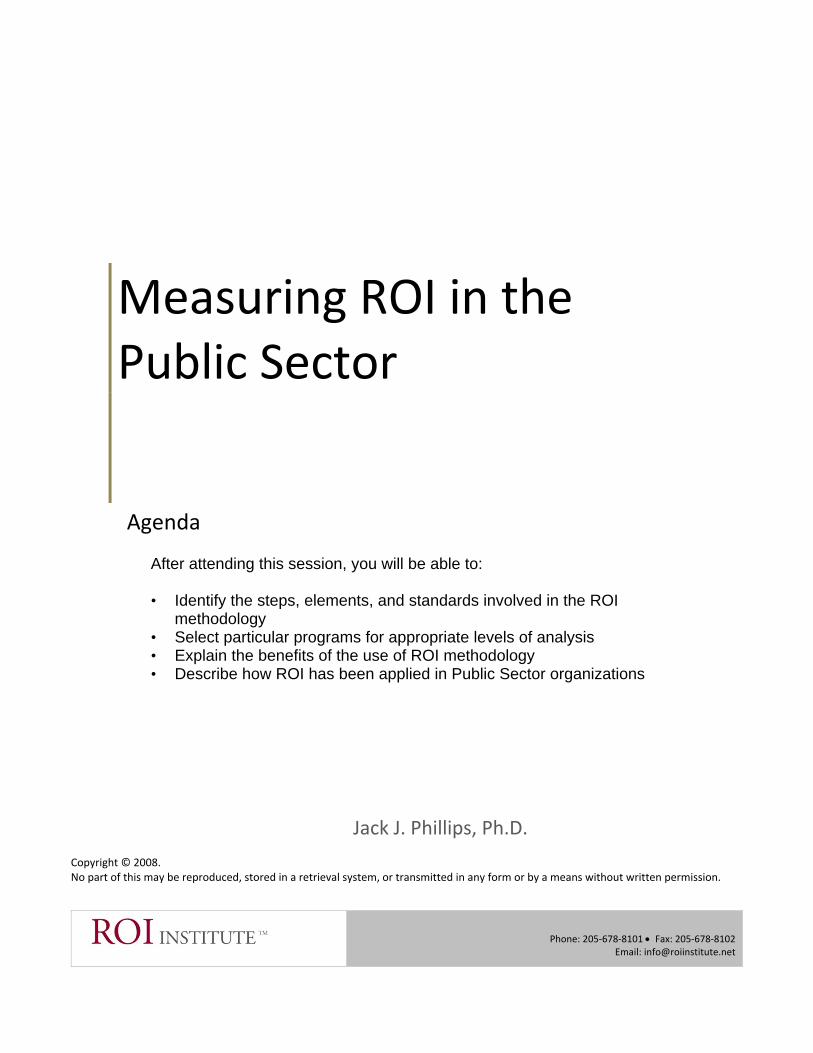
The “New” Definition of Value Value Must: • Be balanced, with qualitative and quantitative data • Contain financial and non-financial perspectives • Reflect strategic and tactical issues • Represent different time frames • Satisfy all key stakeholders • Be consistent in collection and analysis • Be grounded in conservative standards • Come from credible sources • Reflect efficiency in its development • Create a call for action
What is your definition of value?
The “Show Me” Evolution
Term Issue Show Me! Collect Impact Data
Show Me the Money! And Convert Data to Money
Show Me the Real Money!
And Isolate the Effects of the Project
Show Me the Real Money, And Make me Believe it!
And Compare the Money
to the Cost of the Project Is it possible to “show the money” in the Public Sector? Could you “show the money”?
2
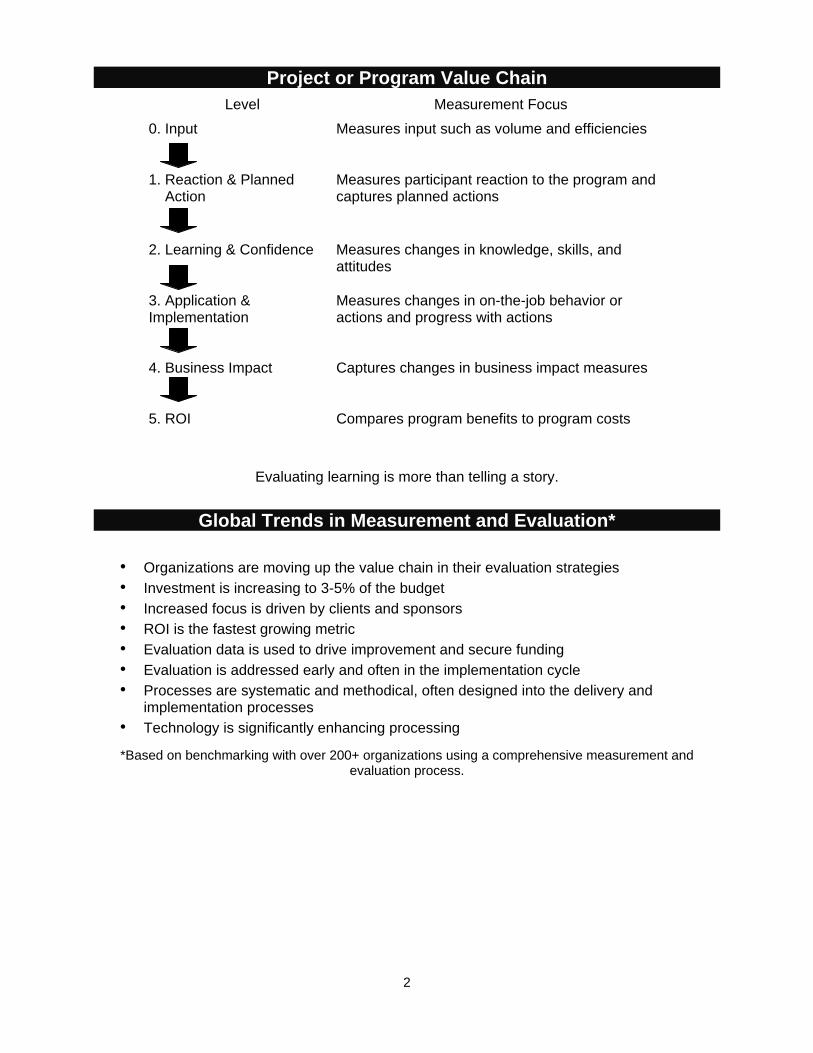
Project or Program Value Chain Level Measurement Focus
0. Input
Measures input such as volume and efficiencies
1. Reaction & Planned Action
Measures participant reaction to the program and captures planned actions
2. Learning & Confidence Measures changes in knowledge, skills, and attitudes
3. Application & Implementation
Measures changes in on-the-job behavior or actions and progress with actions
4. Business Impact Captures changes in business impact measures
5. ROI Compares program benefits to program costs
Evaluating learning is more than telling a story.
Global Trends in Measurement and Evaluation*
• Organizations are moving up the value chain in their evaluation strategies • Investment is increasing to 3-5% of the budget • Increased focus is driven by clients and sponsors • ROI is the fastest growing metric • Evaluation data is used to drive improvement and secure funding • Evaluation is addressed early and often in the implementation cycle • Processes are systematic and methodical, often designed into the delivery and
implementation processes • Technology is significantly enhancing processing
*Based on benchmarking with over 200+ organizations using a comprehensive measurement and evaluation process.
3
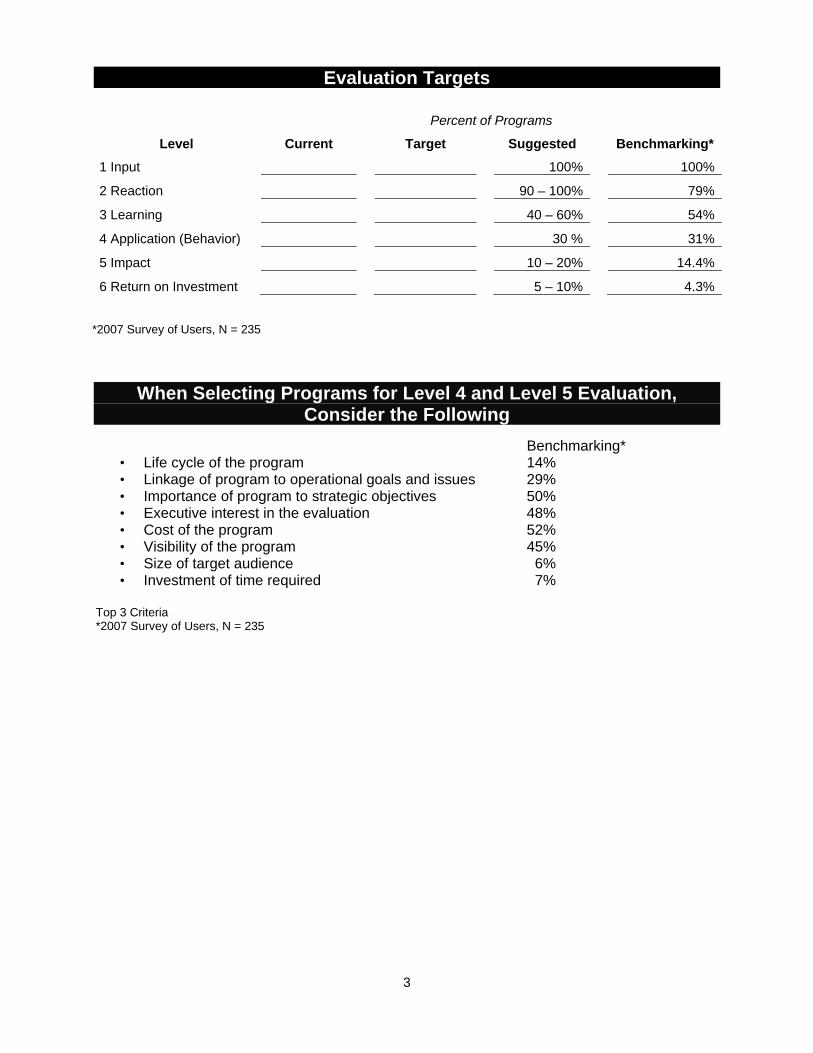
Evaluation Targets
Percent of Programs
Level Current Target Suggested Benchmarking*
1 Input 100% 100%
2 Reaction 90 – 100% 79%
3 Learning 40 – 60% 54%
4 Application (Behavior) 30 % 31%
5 Impact 10 – 20% 14.4%
6 Return on Investment 5 – 10% 4.3% *2007 Survey of Users, N = 235
When Selecting Programs for Level 4 and Level 5 Evaluation, Consider the Following
Benchmarking*
• Life cycle of the program 14% • Linkage of program to operational goals and issues 29% • Importance of program to strategic objectives 50% • Executive interest in the evaluation 48% • Cost of the program 52% • Visibility of the program 45% • Size of target audience 6% • Investment of time required 7%
Top 3 Criteria *2007 Survey of Users, N = 235
4
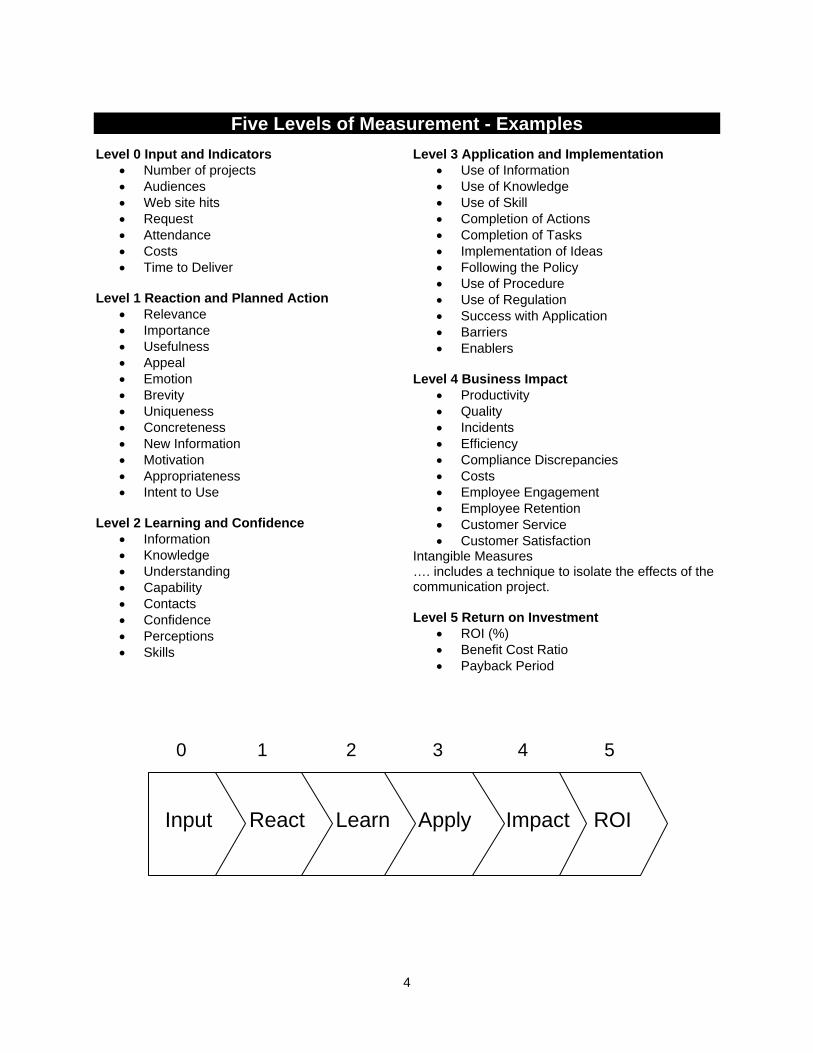
Five Levels of Measurement - Examples
Level 0 Input and Indicators • Number of projects • Audiences • Web site hits • Request • Attendance • Costs • Time to Deliver
Level 1 Reaction and Planned Action
• Relevance • Importance • Usefulness • Appeal • Emotion • Brevity • Uniqueness • Concreteness • New Information • Motivation • Appropriateness • Intent to Use
Level 2 Learning and Confidence
• Information • Knowledge • Understanding • Capability • Contacts • Confidence • Perceptions • Skills
Level 3 Application and Implementation • Use of Information • Use of Knowledge • Use of Skill • Completion of Actions • Completion of Tasks • Implementation of Ideas • Following the Policy • Use of Procedure • Use of Regulation • Success with Application • Barriers • Enablers
Level 4 Business Impact
• Productivity • Quality • Incidents • Efficiency • Compliance Discrepancies • Costs • Employee Engagement • Employee Retention • Customer Service • Customer Satisfaction
Intangible Measures …. includes a technique to isolate the effects of the communication project. Level 5 Return on Investment
• ROI (%) • Benefit Cost Ratio • Payback Period
0 1 2 3 4 5
Input
React
Learn
Apply
Impact
ROI
5
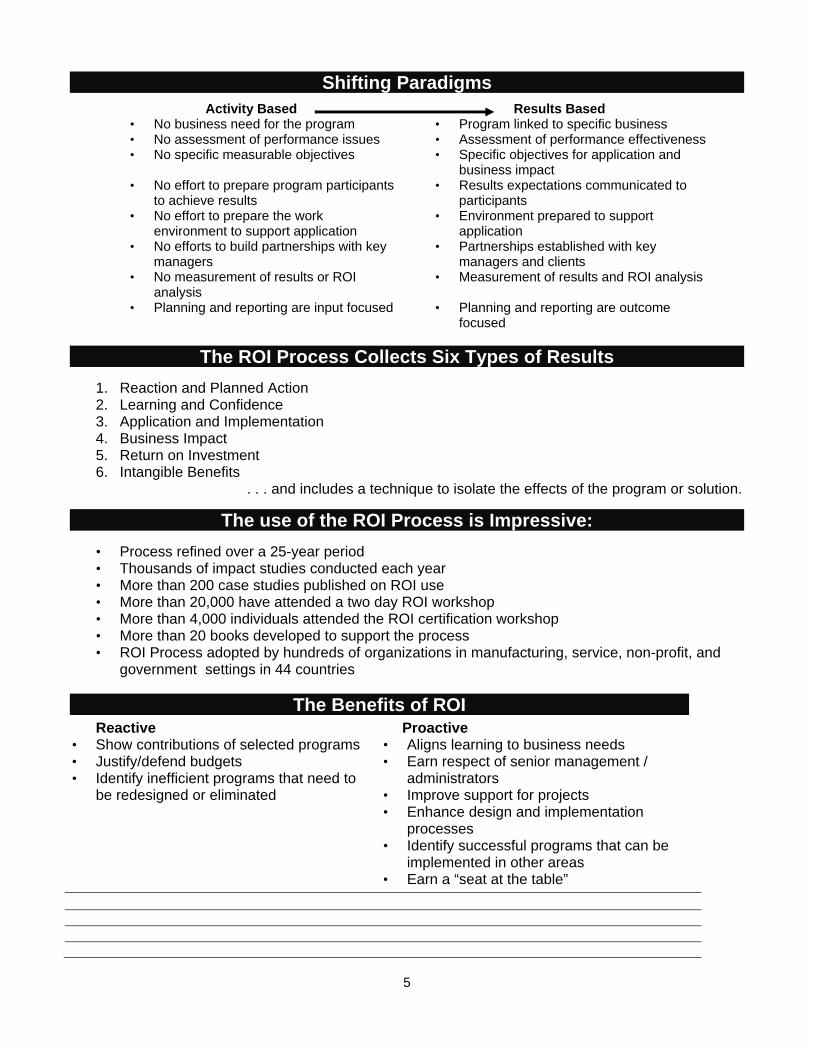
Shifting Paradigms Activity Based Results Based
• No business need for the program • Program linked to specific business • No assessment of performance issues • Assessment of performance effectiveness • No specific measurable objectives • Specific objectives for application and
business impact • No effort to prepare program participants
to achieve results • Results expectations communicated to
participants • No effort to prepare the work
environment to support application • Environment prepared to support
application • No efforts to build partnerships with key
managers • Partnerships established with key
managers and clients • No measurement of results or ROI
analysis • Measurement of results and ROI analysis
• Planning and reporting are input focused • Planning and reporting are outcome focused
The ROI Process Collects Six Types of Results
1. Reaction and Planned Action 2. Learning and Confidence 3. Application and Implementation 4. Business Impact 5. Return on Investment 6. Intangible Benefits
. . . and includes a technique to isolate the effects of the program or solution.
The use of the ROI Process is Impressive:
• Process refined over a 25-year period • Thousands of impact studies conducted each year • More than 200 case studies published on ROI use • More than 20,000 have attended a two day ROI workshop • More than 4,000 individuals attended the ROI certification workshop • More than 20 books developed to support the process • ROI Process adopted by hundreds of organizations in manufacturing, service, non-profit, and
government settings in 44 countries
The Benefits of ROI Reactive
• Show contributions of selected programs • Justify/defend budgets • Identify inefficient programs that need to
be redesigned or eliminated
Proactive • Aligns learning to business needs • Earn respect of senior management /
administrators • Improve support for projects • Enhance design and implementation
processes • Identify successful programs that can be
implemented in other areas • Earn a “seat at the table”
6
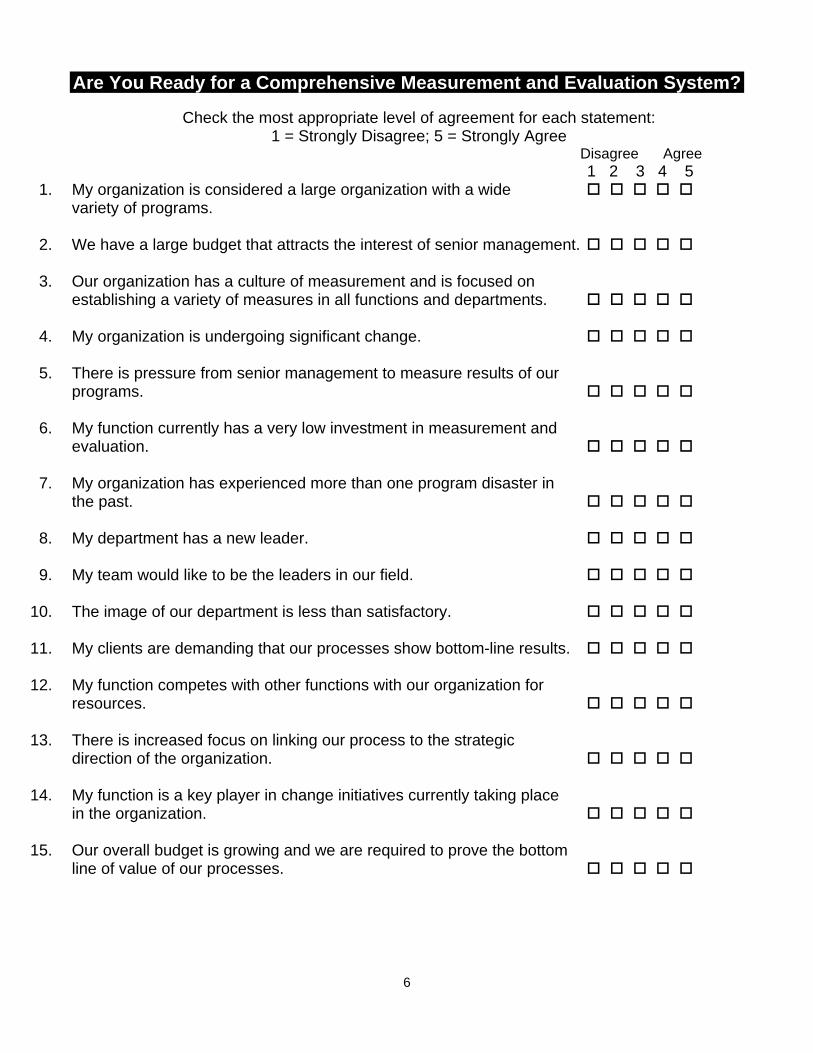
Are You Ready for a Comprehensive Measurement and Evaluation System?
Check the most appropriate level of agreement for each statement: 1 = Strongly Disagree; 5 = Strongly Agree Disagree Agree
1 2 3 4 5 1. My organization is considered a large organization with a wide variety of programs.
2. We have a large budget that attracts the interest of senior management. 3. Our organization has a culture of measurement and is focused on establishing a variety of measures in all functions and departments. 4. My organization is undergoing significant change. 5. There is pressure from senior management to measure results of our
programs.
6. My function currently has a very low investment in measurement and evaluation. 7. My organization has experienced more than one program disaster in the past. 8. My department has a new leader. 9. My team would like to be the leaders in our field. 10. The image of our department is less than satisfactory. 11. My clients are demanding that our processes show bottom-line results. 12. My function competes with other functions with our organization for resources. 13. There is increased focus on linking our process to the strategic direction of the organization. 14. My function is a key player in change initiatives currently taking place in the organization. 15. Our overall budget is growing and we are required to prove the bottom line of value of our processes.
7
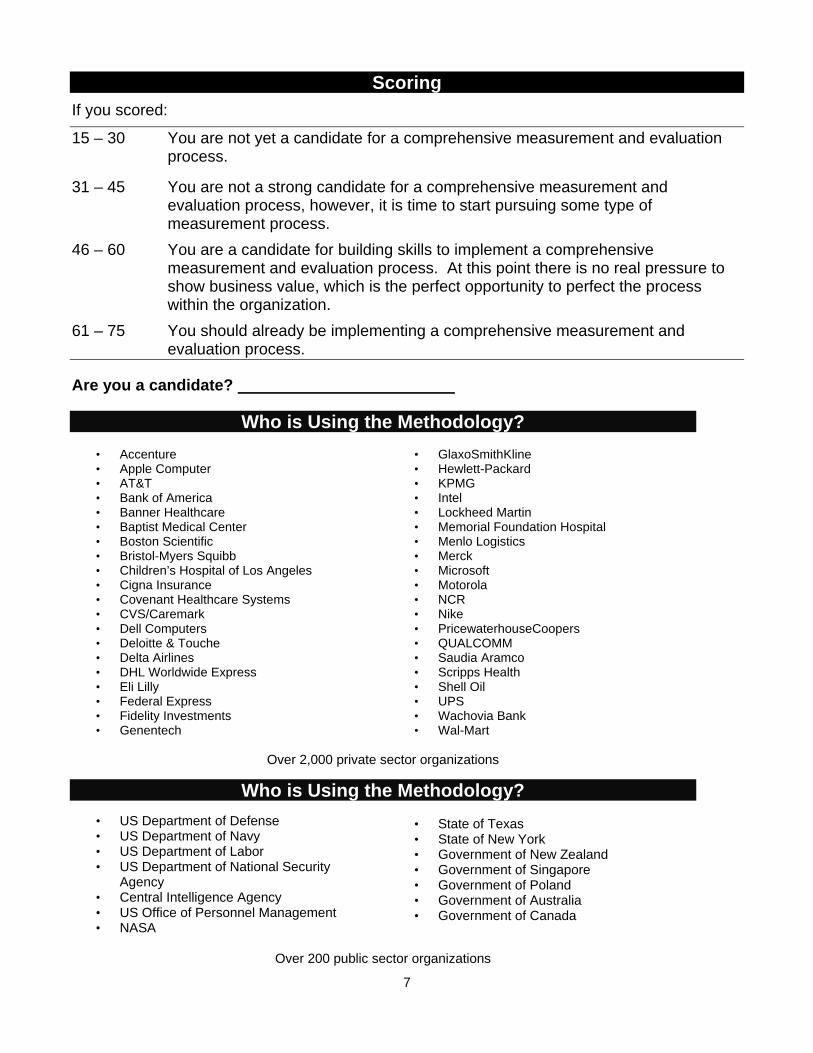
Scoring
If you scored:
15 – 30 You are not yet a candidate for a comprehensive measurement and evaluation process.
31 – 45 You are not a strong candidate for a comprehensive measurement and
evaluation process, however, it is time to start pursuing some type of measurement process.
46 – 60 You are a candidate for building skills to implement a comprehensive measurement and evaluation process. At this point there is no real pressure to show business value, which is the perfect opportunity to perfect the process within the organization.
61 – 75 You should already be implementing a comprehensive measurement and evaluation process.
Are you a candidate?
Who is Using the Methodology? • Accenture • Apple Computer • AT&T • Bank of America • Banner Healthcare • Baptist Medical Center • Boston Scientific • Bristol-Myers Squibb • Children’s Hospital of Los Angeles • Cigna Insurance • Covenant Healthcare Systems • CVS/Caremark • Dell Computers • Deloitte & Touche • Delta Airlines • DHL Worldwide Express • Eli Lilly • Federal Express • Fidelity Investments • Genentech
• GlaxoSmithKline • Hewlett-Packard • KPMG • Intel • Lockheed Martin • Memorial Foundation Hospital • Menlo Logistics • Merck • Microsoft • Motorola • NCR • Nike • PricewaterhouseCoopers • QUALCOMM • Saudia Aramco • Scripps Health • Shell Oil • UPS • Wachovia Bank • Wal-Mart
Over 2,000 private sector organizations
Who is Using the Methodology? • US Department of Defense • US Department of Navy • US Department of Labor • US Department of National Security
Agency • Central Intelligence Agency • US Office of Personnel Management • NASA
• State of Texas • State of New York • Government of New Zealand • Government of Singapore • Government of Poland • Government of Australia • Government of Canada
Over 200 public sector organizations
8
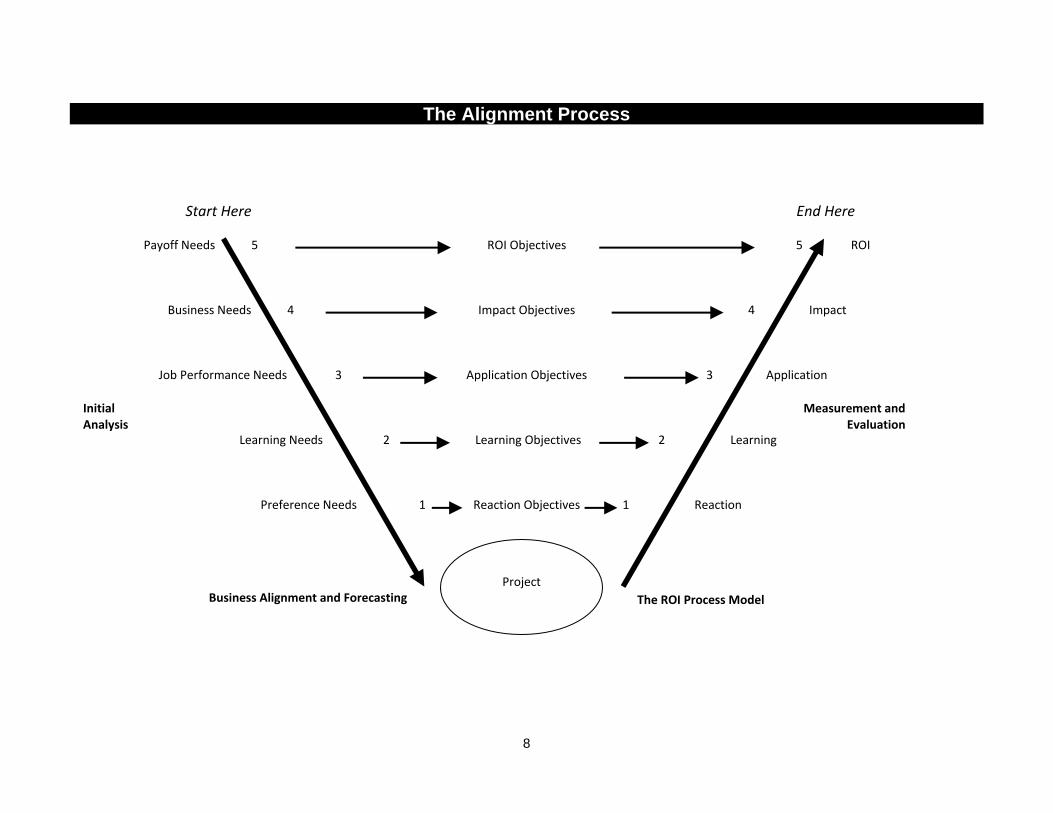
The Alignment Process
Start Here End Here
Payoff Needs 5 ROI Objectives 5 ROI
Business Needs 4 Impact Objectives 4 Impact
Job Performance Needs 3 Application Objectives 3 Application
Learning Needs 2 Learning Objectives 2 Learning
Preference Needs 1 Reaction Objectives 1 Reaction
Project
Initial Analysis
Measurement and Evaluation
Business Alignment and Forecasting The ROI Process Model
9
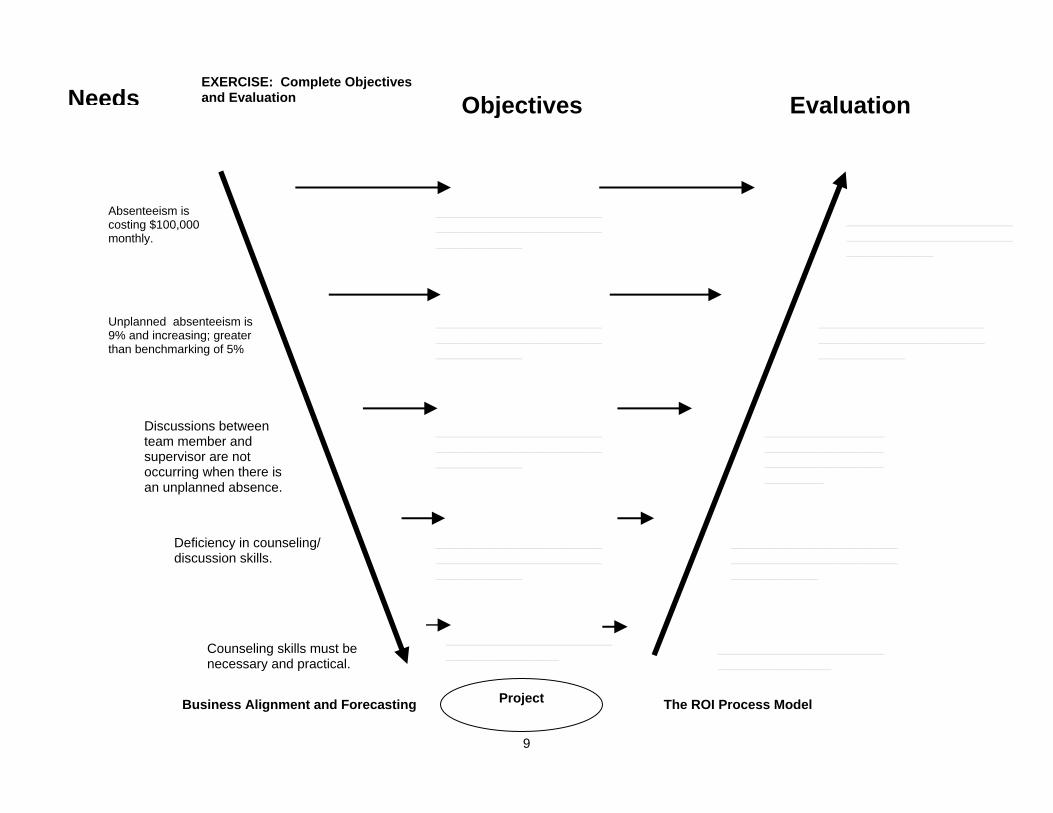
_______________________________________________________________
Project Business Alignment and Forecasting The ROI Process Model
Absenteeism is costing $100,000 monthly.
Unplanned absenteeism is 9% and increasing; greater than benchmarking of 5%
Discussions between team member and supervisor are not occurring when there is an unplanned absence.
Deficiency in counseling/ discussion skills.
Counseling skills must be necessary and practical.
_______________________________________________________________
_______________________________________________________________
_______________________________________________________________
__________________________________________
_______________________________________________________________
_______________________________________________________________
_______________________________________________________________
__________________________________________
Needs Objectives EvaluationEXERCISE: Complete Objectives and Evaluation
_______________________________________________________________
10
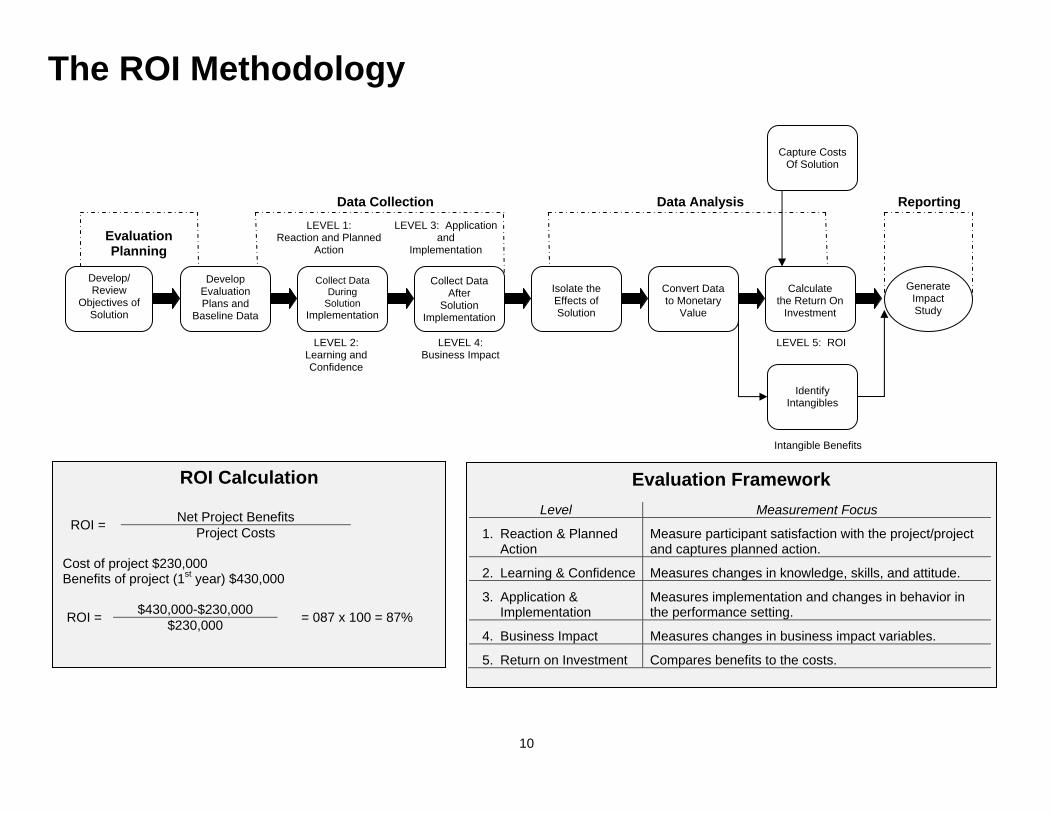
The ROI Methodology
ROI Calculation
ROI = Net Project Benefits Project Costs
Cost of project $230,000 Benefits of project (1st year) $430,000
ROI = $430,000-$230,000 = 087 x 100 = 87% $230,000
Evaluation Framework
Level Measurement Focus
1. Reaction & Planned Action
Measure participant satisfaction with the project/project and captures planned action.
2. Learning & Confidence Measures changes in knowledge, skills, and attitude.
3. Application & Implementation
Measures implementation and changes in behavior in the performance setting.
4. Business Impact Measures changes in business impact variables.
5. Return on Investment Compares benefits to the costs.
Reporting Data Analysis
LEVEL 5: ROI
Data Collection
LEVEL 4: Business Impact
LEVEL 2: Learning and Confidence
LEVEL 3: Application and
Implementation
LEVEL 1: Reaction and Planned
Action Evaluation Planning
Develop Evaluation Plans and
Baseline Data
Collect Data During
Solution Implementation
Collect Data After
Solution Implementation
Isolate the Effects of Solution
Convert Data to Monetary
Value
Calculate the Return On
Investment
Generate Impact Study
Capture Costs Of Solution
Identify
Intangibles
Intangible Benefits
Develop/ Review
Objectives of Solution
11
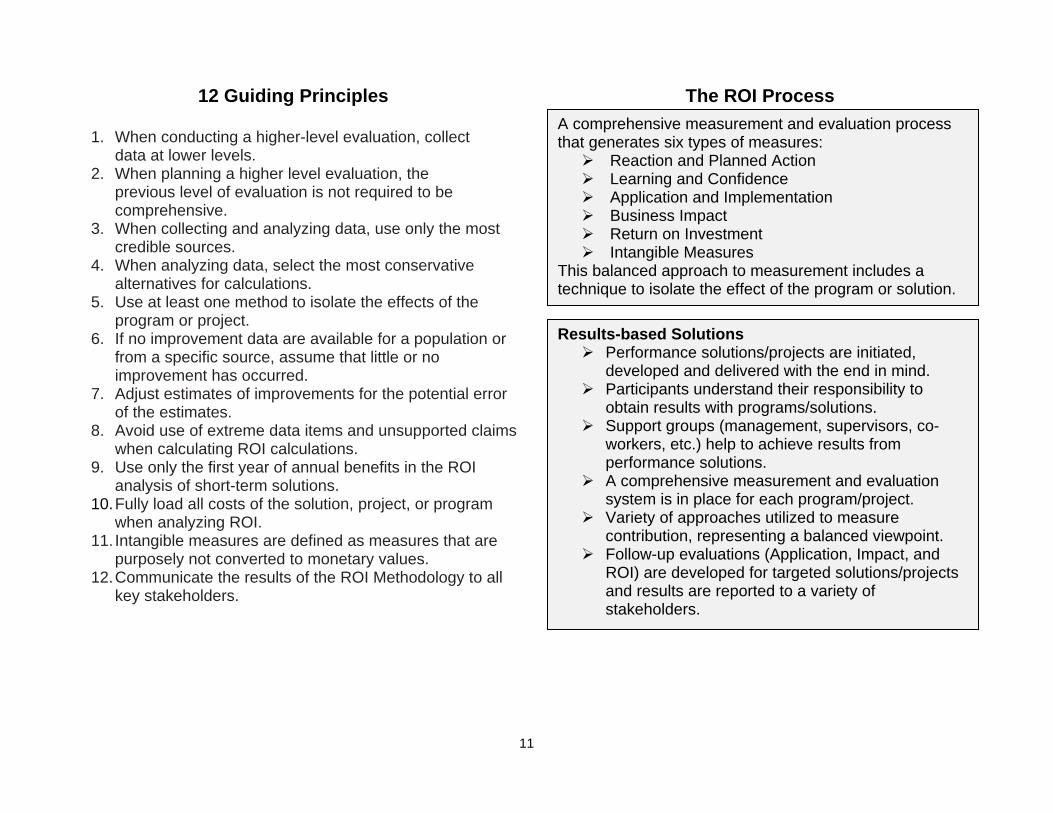
12 Guiding Principles
1. When conducting a higher-level evaluation, collect data at lower levels.
2. When planning a higher level evaluation, the previous level of evaluation is not required to be comprehensive.
3. When collecting and analyzing data, use only the most credible sources.
4. When analyzing data, select the most conservative alternatives for calculations.
5. Use at least one method to isolate the effects of the program or project.
6. If no improvement data are available for a population or from a specific source, assume that little or no improvement has occurred.
7. Adjust estimates of improvements for the potential error of the estimates.
8. Avoid use of extreme data items and unsupported claims when calculating ROI calculations.
9. Use only the first year of annual benefits in the ROI analysis of short-term solutions.
10. Fully load all costs of the solution, project, or program when analyzing ROI.
11. Intangible measures are defined as measures that are purposely not converted to monetary values.
12. Communicate the results of the ROI Methodology to all key stakeholders.
The ROI Process
A comprehensive measurement and evaluation process that generates six types of measures:
Reaction and Planned Action Learning and Confidence Application and Implementation Business Impact Return on Investment Intangible Measures
This balanced approach to measurement includes a technique to isolate the effect of the program or solution.
Results-based Solutions Performance solutions/projects are initiated,
developed and delivered with the end in mind. Participants understand their responsibility to
obtain results with programs/solutions. Support groups (management, supervisors, co-
workers, etc.) help to achieve results from performance solutions.
A comprehensive measurement and evaluation system is in place for each program/project.
Variety of approaches utilized to measure contribution, representing a balanced viewpoint.
Follow-up evaluations (Application, Impact, and ROI) are developed for targeted solutions/projects and results are reported to a variety of stakeholders.
12
0%
10%
20%
30%
40%
50%
60%
1 2 3 4 5 6 7 8
32% 29%
5%
55%
37%
11% 13% 11%
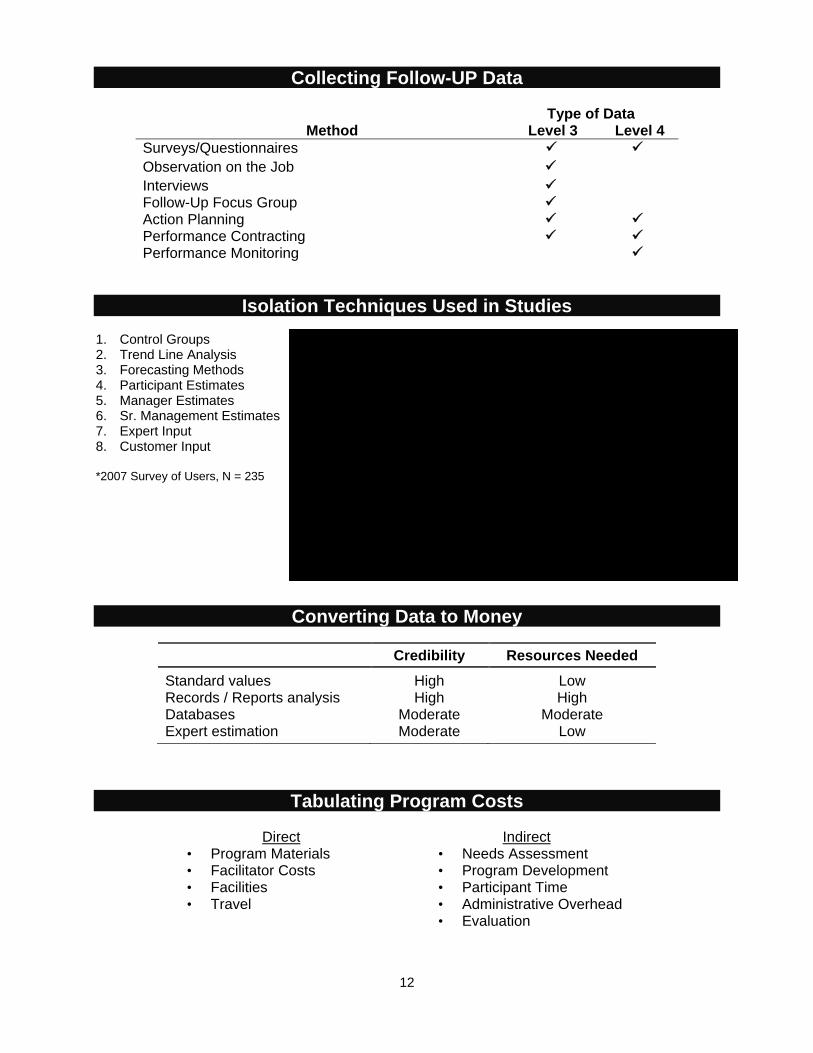
Collecting Follow-UP Data
Type of Data Method Level 3 Level 4
Surveys/Questionnaires Observation on the Job Interviews Follow-Up Focus Group Action Planning Performance Contracting Performance Monitoring
Isolation Techniques Used in Studies 1. Control Groups 2. Trend Line Analysis 3. Forecasting Methods 4. Participant Estimates 5. Manager Estimates 6. Sr. Management Estimates 7. Expert Input 8. Customer Input
*2007 Survey of Users, N = 235
Converting Data to Money
Credibility Resources Needed Standard values Records / Reports analysis Databases Expert estimation
High High
Moderate Moderate
Low High
Moderate Low
Tabulating Program Costs
Direct • Program Materials • Facilitator Costs • Facilities • Travel
Indirect
• Needs Assessment • Program Development • Participant Time • Administrative Overhead • Evaluation
13
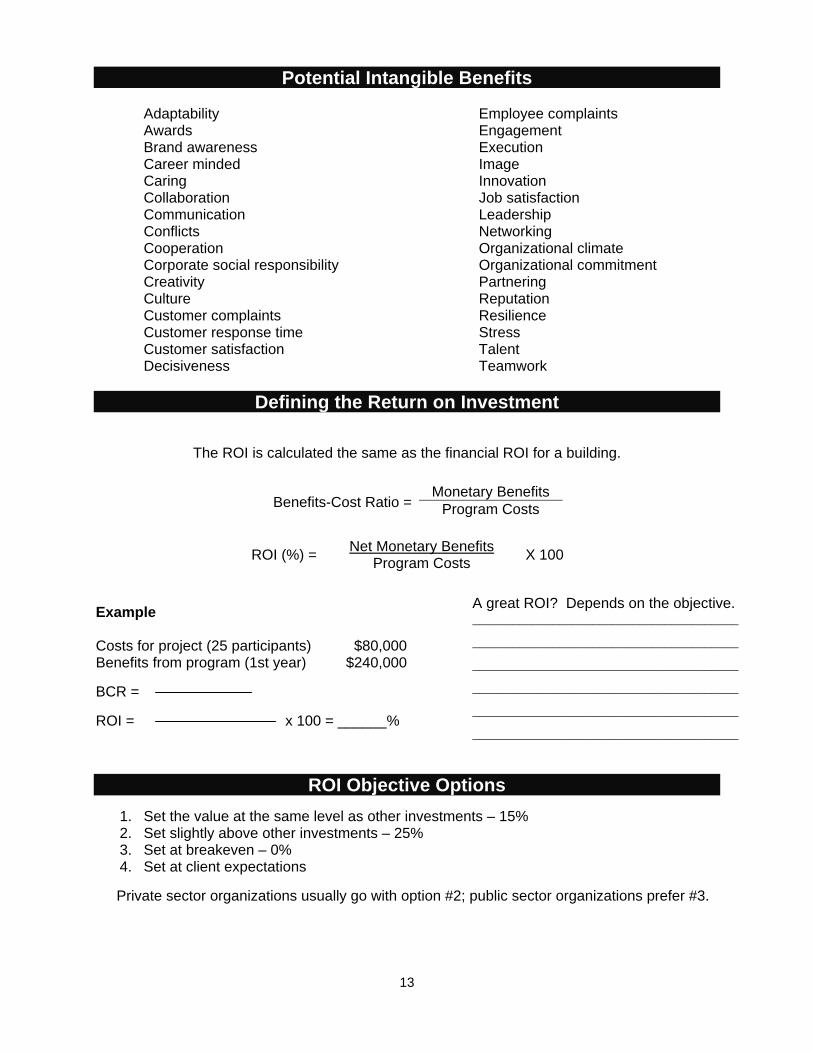
Potential Intangible Benefits Adaptability Awards Brand awareness Career minded Caring Collaboration Communication Conflicts Cooperation Corporate social responsibility Creativity Culture Customer complaints Customer response time Customer satisfaction Decisiveness
Employee complaints Engagement Execution Image Innovation Job satisfaction Leadership Networking Organizational climate Organizational commitment Partnering Reputation Resilience Stress Talent Teamwork
Defining the Return on Investment
The ROI is calculated the same as the financial ROI for a building.
Benefits-Cost Ratio =Monetary Benefits
Program Costs
ROI (%) = Net Monetary Benefits Program Costs X 100
Example Costs for project (25 participants) $80,000 Benefits from program (1st year) $240,000 BCR = ROI = x 100 = ______%
ROI Objective Options 1. Set the value at the same level as other investments – 15% 2. Set slightly above other investments – 25% 3. Set at breakeven – 0% 4. Set at client expectations
Private sector organizations usually go with option #2; public sector organizations prefer #3.
A great ROI? Depends on the objective. ________________________________________
________________________________________
________________________________________
________________________________________
________________________________________
________________________________________
14
0%
20%
40%
60%
80%
Yes No
71%
29%
0%
10%
20%
30%
40%
50%
1 2 3
38%
18%
44%
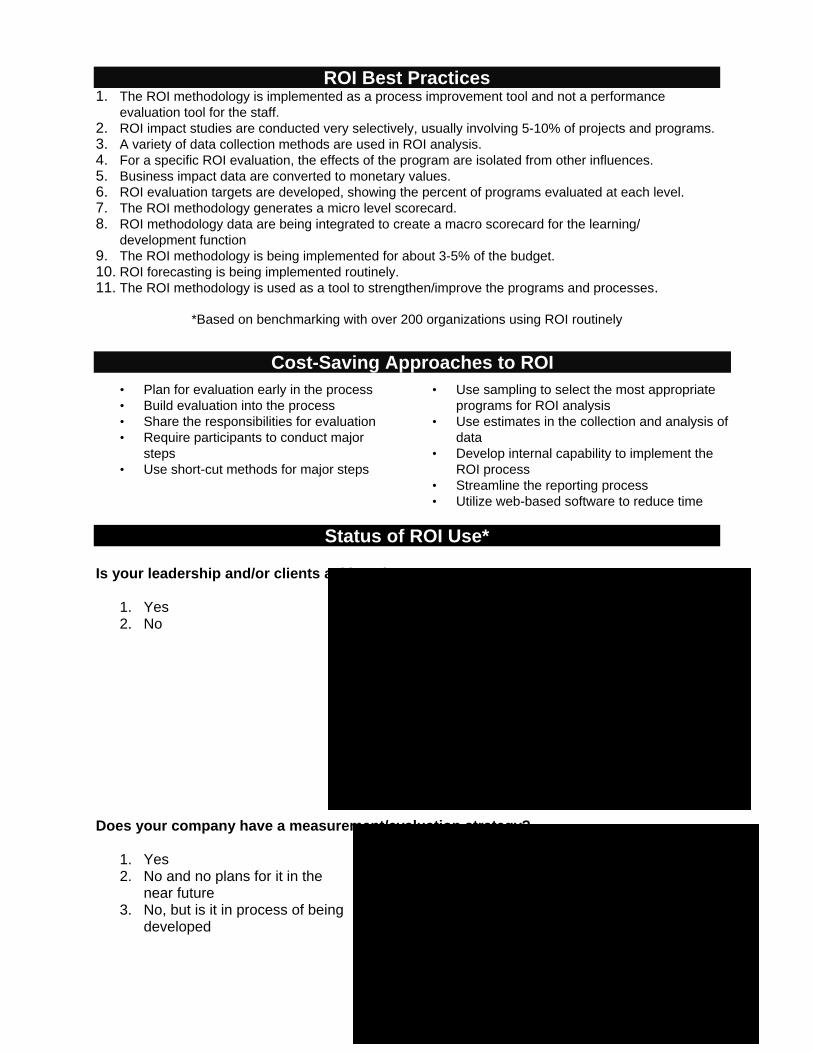
ROI Best Practices 1. The ROI methodology is implemented as a process improvement tool and not a performance
evaluation tool for the staff. 2. ROI impact studies are conducted very selectively, usually involving 5-10% of projects and programs. 3. A variety of data collection methods are used in ROI analysis. 4. For a specific ROI evaluation, the effects of the program are isolated from other influences. 5. Business impact data are converted to monetary values. 6. ROI evaluation targets are developed, showing the percent of programs evaluated at each level. 7. The ROI methodology generates a micro level scorecard. 8. ROI methodology data are being integrated to create a macro scorecard for the learning/
development function 9. The ROI methodology is being implemented for about 3-5% of the budget. 10. ROI forecasting is being implemented routinely. 11. The ROI methodology is used as a tool to strengthen/improve the programs and processes.
*Based on benchmarking with over 200 organizations using ROI routinely
Cost-Saving Approaches to ROI • Plan for evaluation early in the process • Build evaluation into the process • Share the responsibilities for evaluation • Require participants to conduct major
steps • Use short-cut methods for major steps
• Use sampling to select the most appropriate programs for ROI analysis
• Use estimates in the collection and analysis of data
• Develop internal capability to implement the ROI process
• Streamline the reporting process • Utilize web-based software to reduce time
Status of ROI Use*
Is your leadership and/or clients asking about ROI?
1. Yes 2. No
Does your company have a measurement/evaluation strategy?
1. Yes 2. No and no plans for it in the
near future 3. No, but is it in process of being
developed
15
0%
10%
20%
30%
40%
50%
1 2 3
49%35%
16%
0%
10%
20%
30%
40%
50%
1 2 3 4 5
46%
17% 17%9% 11%
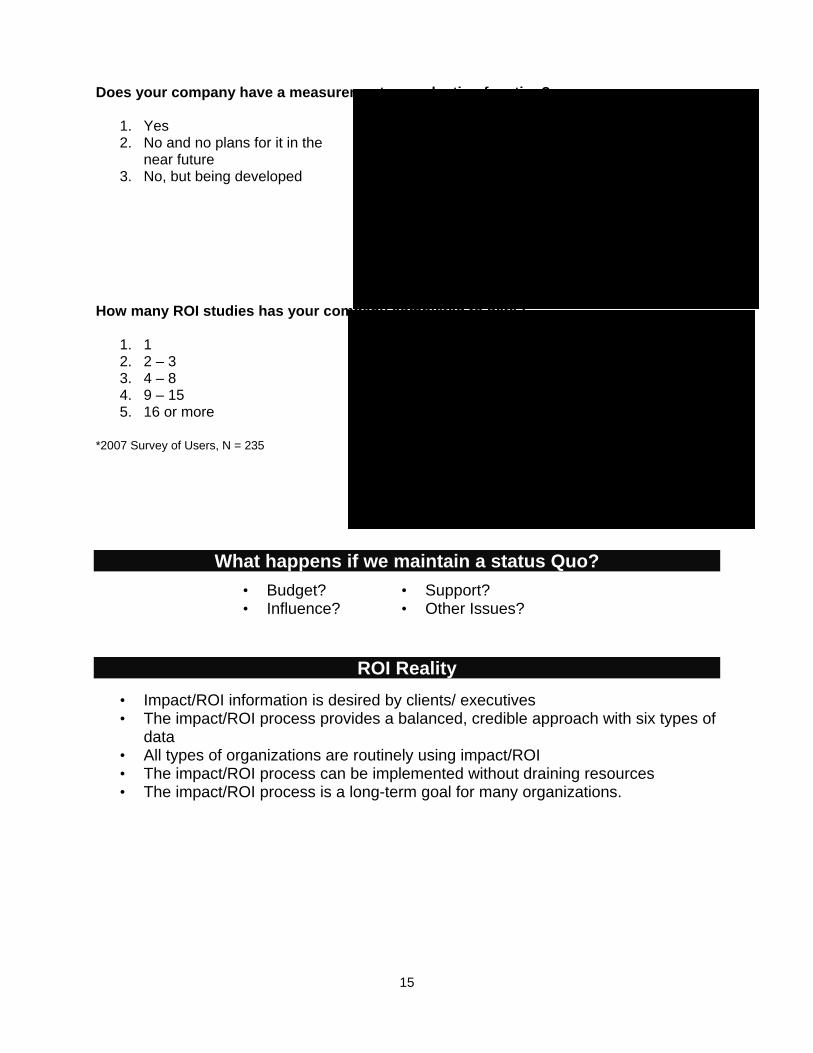
Does your company have a measurement or evaluation function?
1. Yes 2. No and no plans for it in the
near future 3. No, but being developed
How many ROI studies has your company completed to date?
1. 1 2. 2 – 3 3. 4 – 8 4. 9 – 15 5. 16 or more
*2007 Survey of Users, N = 235
What happens if we maintain a status Quo?
ROI Reality
• Impact/ROI information is desired by clients/ executives • The impact/ROI process provides a balanced, credible approach with six types of
data • All types of organizations are routinely using impact/ROI • The impact/ROI process can be implemented without draining resources • The impact/ROI process is a long-term goal for many organizations.
• Budget? • Influence?
• Support? • Other Issues?

16
17
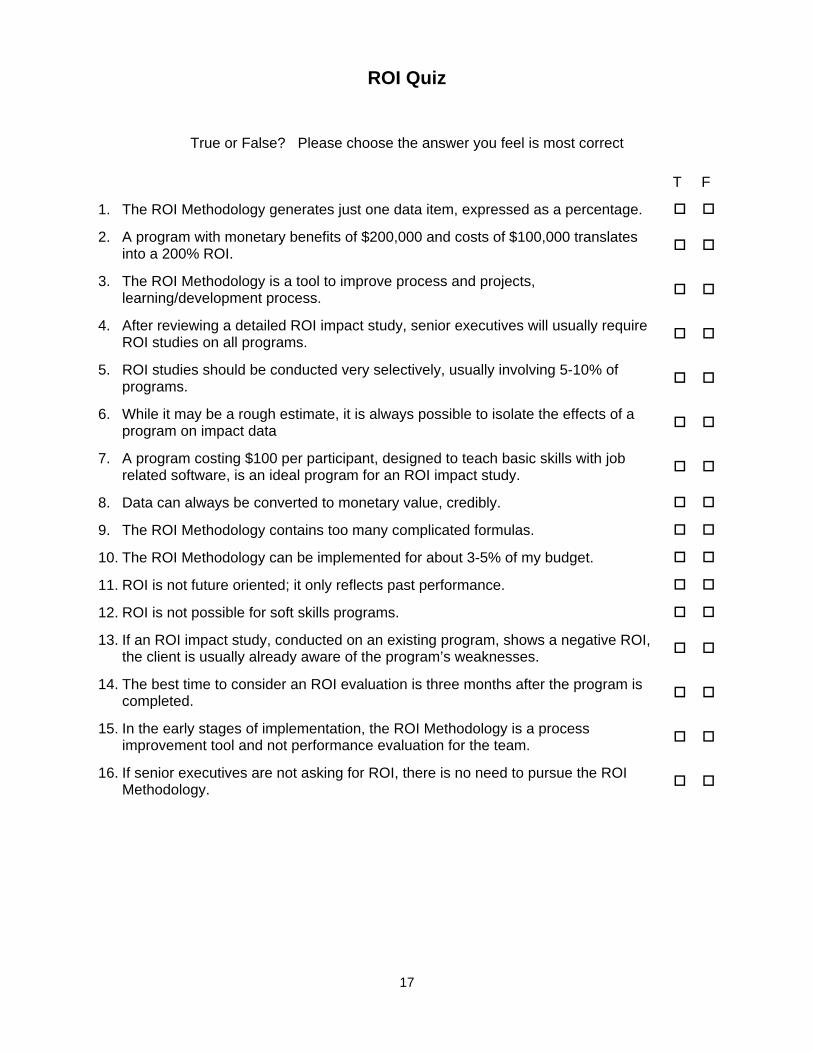
ROI Quiz
True or False? Please choose the answer you feel is most correct
T F
1. The ROI Methodology generates just one data item, expressed as a percentage.
2. A program with monetary benefits of $200,000 and costs of $100,000 translates into a 200% ROI.
3. The ROI Methodology is a tool to improve process and projects, learning/development process.
4. After reviewing a detailed ROI impact study, senior executives will usually require ROI studies on all programs.
5. ROI studies should be conducted very selectively, usually involving 5-10% of programs.
6. While it may be a rough estimate, it is always possible to isolate the effects of a program on impact data
7. A program costing $100 per participant, designed to teach basic skills with job related software, is an ideal program for an ROI impact study.
8. Data can always be converted to monetary value, credibly.
9. The ROI Methodology contains too many complicated formulas.
10. The ROI Methodology can be implemented for about 3-5% of my budget.
11. ROI is not future oriented; it only reflects past performance.
12. ROI is not possible for soft skills programs.
13. If an ROI impact study, conducted on an existing program, shows a negative ROI, the client is usually already aware of the program’s weaknesses.
14. The best time to consider an ROI evaluation is three months after the program is completed.
15. In the early stages of implementation, the ROI Methodology is a process improvement tool and not performance evaluation for the team.
16. If senior executives are not asking for ROI, there is no need to pursue the ROI Methodology.
18
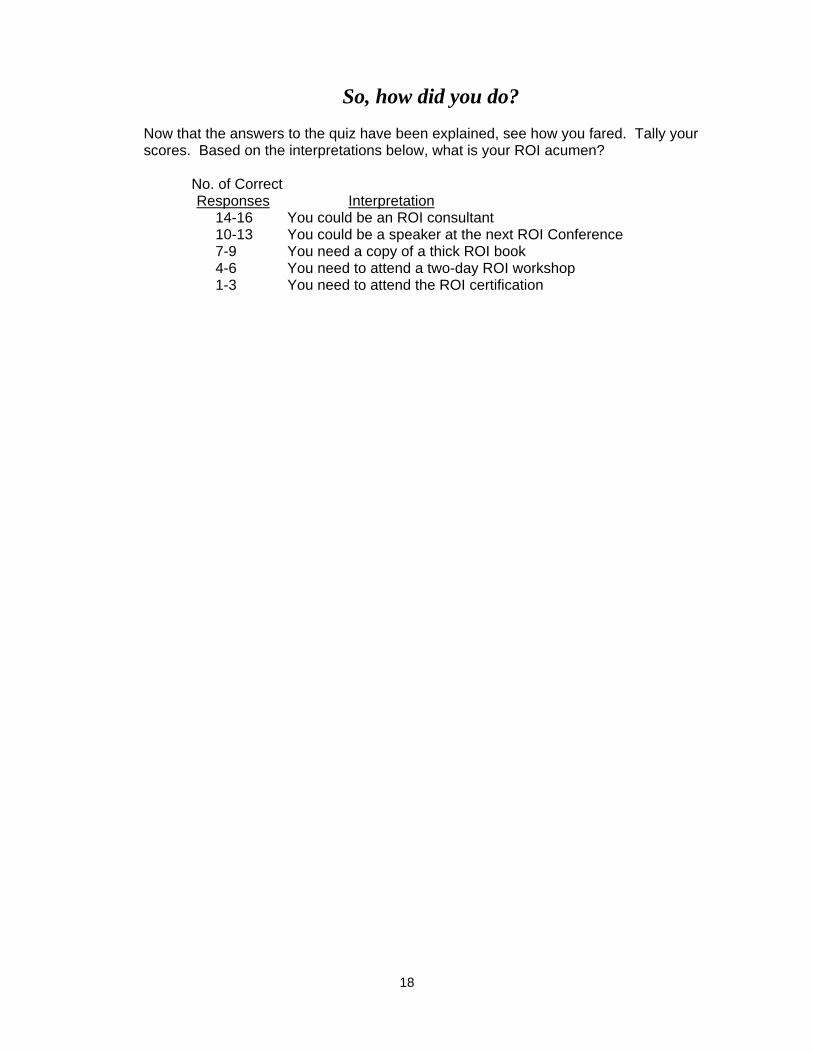
So, how did you do?
Now that the answers to the quiz have been explained, see how you fared. Tally your scores. Based on the interpretations below, what is your ROI acumen? No. of Correct Responses Interpretation 14-16 You could be an ROI consultant 10-13 You could be a speaker at the next ROI Conference 7-9 You need a copy of a thick ROI book 4-6 You need to attend a two-day ROI workshop 1-3 You need to attend the ROI certification
19
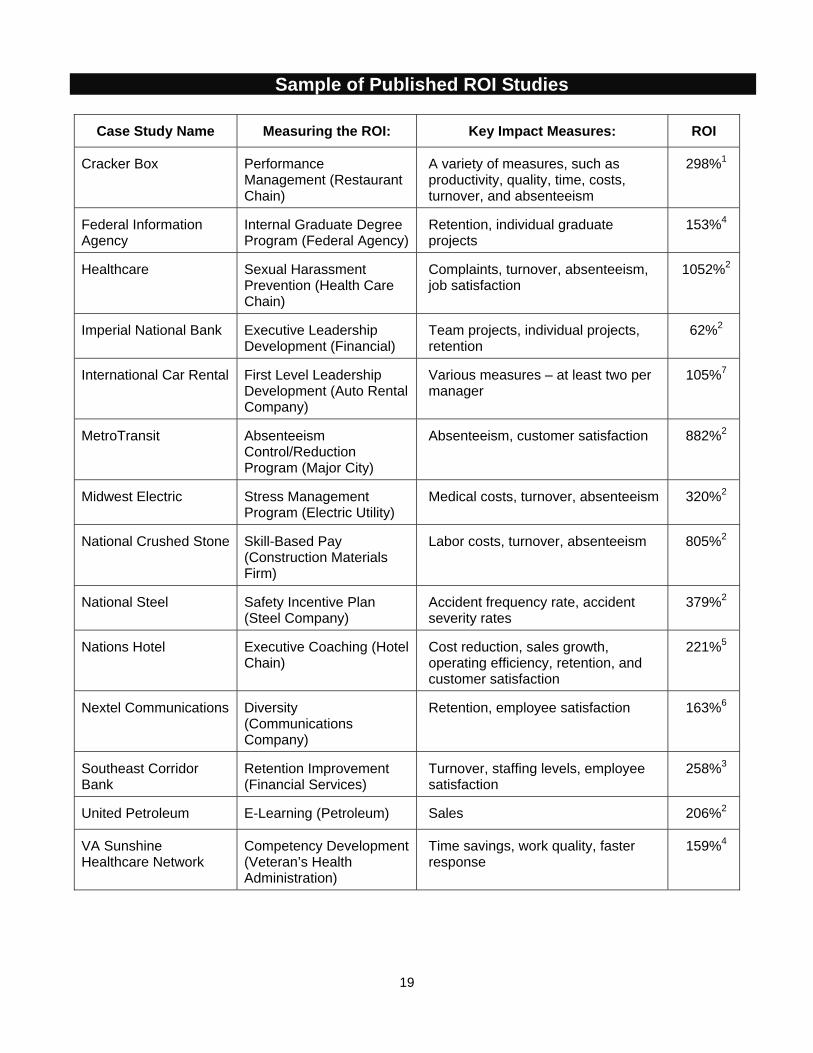
Sample of Published ROI Studies
Case Study Name Measuring the ROI: Key Impact Measures: ROI
Cracker Box Performance Management (Restaurant Chain)
A variety of measures, such as productivity, quality, time, costs, turnover, and absenteeism
298%1
Federal Information Agency
Internal Graduate Degree Program (Federal Agency)
Retention, individual graduate projects
153%4
Healthcare Sexual Harassment Prevention (Health Care Chain)
Complaints, turnover, absenteeism, job satisfaction
1052%2
Imperial National Bank Executive Leadership Development (Financial)
Team projects, individual projects, retention
62%2
International Car Rental First Level Leadership Development (Auto Rental Company)
Various measures – at least two per manager
105%7
MetroTransit Absenteeism Control/Reduction Program (Major City)
Absenteeism, customer satisfaction 882%2
Midwest Electric Stress Management Program (Electric Utility)
Medical costs, turnover, absenteeism 320%2
National Crushed Stone Skill-Based Pay (Construction Materials Firm)
Labor costs, turnover, absenteeism 805%2
National Steel Safety Incentive Plan (Steel Company)
Accident frequency rate, accident severity rates
379%2
Nations Hotel Executive Coaching (Hotel Chain)
Cost reduction, sales growth, operating efficiency, retention, and customer satisfaction
221%5
Nextel Communications Diversity (Communications Company)
Retention, employee satisfaction 163%6
Southeast Corridor Bank
Retention Improvement (Financial Services)
Turnover, staffing levels, employee satisfaction
258%3
United Petroleum E-Learning (Petroleum) Sales 206%2
VA Sunshine Healthcare Network
Competency Development (Veteran’s Health Administration)
Time savings, work quality, faster response
159%4
20
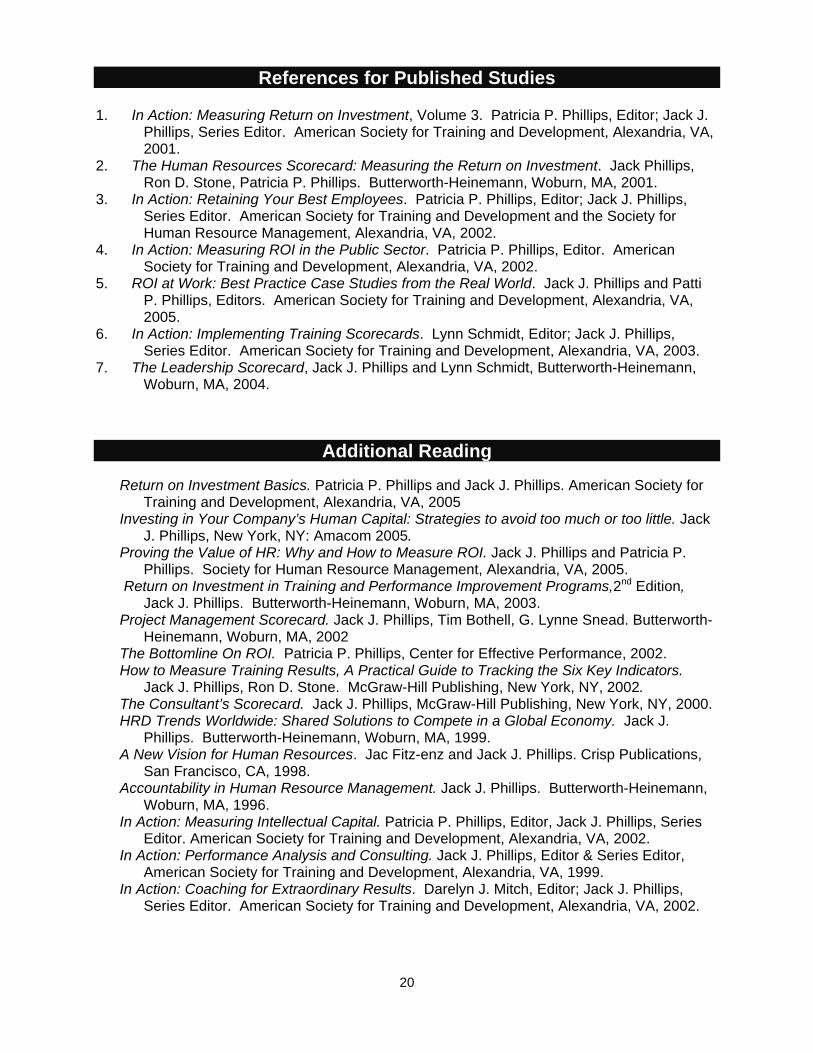
References for Published Studies
1. In Action: Measuring Return on Investment, Volume 3. Patricia P. Phillips, Editor; Jack J. Phillips, Series Editor. American Society for Training and Development, Alexandria, VA, 2001.
2. The Human Resources Scorecard: Measuring the Return on Investment. Jack Phillips, Ron D. Stone, Patricia P. Phillips. Butterworth-Heinemann, Woburn, MA, 2001.
3. In Action: Retaining Your Best Employees. Patricia P. Phillips, Editor; Jack J. Phillips, Series Editor. American Society for Training and Development and the Society for Human Resource Management, Alexandria, VA, 2002.
4. In Action: Measuring ROI in the Public Sector. Patricia P. Phillips, Editor. American Society for Training and Development, Alexandria, VA, 2002.
5. ROI at Work: Best Practice Case Studies from the Real World. Jack J. Phillips and Patti P. Phillips, Editors. American Society for Training and Development, Alexandria, VA, 2005.
6. In Action: Implementing Training Scorecards. Lynn Schmidt, Editor; Jack J. Phillips, Series Editor. American Society for Training and Development, Alexandria, VA, 2003.
7. The Leadership Scorecard, Jack J. Phillips and Lynn Schmidt, Butterworth-Heinemann, Woburn, MA, 2004.
Additional Reading
Return on Investment Basics. Patricia P. Phillips and Jack J. Phillips. American Society for Training and Development, Alexandria, VA, 2005
Investing in Your Company’s Human Capital: Strategies to avoid too much or too little. Jack J. Phillips, New York, NY: Amacom 2005.
Proving the Value of HR: Why and How to Measure ROI. Jack J. Phillips and Patricia P. Phillips. Society for Human Resource Management, Alexandria, VA, 2005.
Return on Investment in Training and Performance Improvement Programs,2nd Edition, Jack J. Phillips. Butterworth-Heinemann, Woburn, MA, 2003.
Project Management Scorecard. Jack J. Phillips, Tim Bothell, G. Lynne Snead. Butterworth-Heinemann, Woburn, MA, 2002
The Bottomline On ROI. Patricia P. Phillips, Center for Effective Performance, 2002. How to Measure Training Results, A Practical Guide to Tracking the Six Key Indicators.
Jack J. Phillips, Ron D. Stone. McGraw-Hill Publishing, New York, NY, 2002. The Consultant’s Scorecard. Jack J. Phillips, McGraw-Hill Publishing, New York, NY, 2000. HRD Trends Worldwide: Shared Solutions to Compete in a Global Economy. Jack J.
Phillips. Butterworth-Heinemann, Woburn, MA, 1999. A New Vision for Human Resources. Jac Fitz-enz and Jack J. Phillips. Crisp Publications,
San Francisco, CA, 1998. Accountability in Human Resource Management. Jack J. Phillips. Butterworth-Heinemann,
Woburn, MA, 1996. In Action: Measuring Intellectual Capital. Patricia P. Phillips, Editor, Jack J. Phillips, Series
Editor. American Society for Training and Development, Alexandria, VA, 2002. In Action: Performance Analysis and Consulting. Jack J. Phillips, Editor & Series Editor,
American Society for Training and Development, Alexandria, VA, 1999. In Action: Coaching for Extraordinary Results. Darelyn J. Mitch, Editor; Jack J. Phillips,
Series Editor. American Society for Training and Development, Alexandria, VA, 2002.
21
JJAACCKK JJ.. PPHHIILLLLIIPPSS,, PPHH..DD.. Jack J. Phillips is a world-renowned expert on accountability, measurement, and evaluation. Phillips provides consulting services for Fortune 500 companies and major global organizations. The author or editor of more than fifty books, he conducts workshops and presents at conferences throughout the world. Phillips has received several awards for his books and work. On two occasions, Meeting News named him one of the 25 Most Influential People in the Meetings and Events Industry, based on his work on ROI. The Society for Human Resource Management presented him an award for one of his books and honored a Phillips ROI study with its highest award for creativity. The American Society for Training and Development gave him its highest award, Distinguished Contribution to Workplace Learning and Development for his work on ROI. His expertise in measurement and evaluation is based on more than 27 years of corporate experience in the aerospace, textile, metals, construction materials, and banking industries. Dr. Phillips has served as training and development manager at two Fortune 500 firms, as senior human resource officer at two firms, as president of a regional bank, and as management professor at a major state university. This background led Dr. Phillips to develop the ROI Methodology⎯a revolutionary process that provides bottom-line figures and accountability for all types of learning, performance improvement, human resource, technology, and public policy programs. Dr. Phillips regularly consults with clients in manufacturing, service, and government organizations in 44 countries in North and South America, Europe, Africa, Australia, and Asia. Phillips and his wife, Dr. Patti P. Phillips, recently served as authors and series editors for the Measurement and Evaluation Series published by Pfeiffer (2008), which includes a six-book series on the ROI Methodology and a companion book of 14 best-practice case studies. Other books recently authored by Phillips include ROI for Technology Projects: Measuring and Delivering Value (Butterworth-Heinemann, 2008); Return on Investment in Meetings and Events: Tools and Techniques to Measure the Success of all Types of Meetings and Events (Butterworth-Heinemann, 2008); Show Me the Money: How to Determine ROI in People, Projects, and Programs (Berrett-Koehler, 2007); The Value of Learning (Pfeiffer, 2007); How to Build a Successful Consulting Practice (McGraw-Hill, 2006); Investing in Your Company’s Human Capital: Strategies to Avoid Spending Too Much or Too Little (Amacom, 2005); Proving the Value of HR: How and Why to Measure ROI (SHRM, 2005); The Leadership Scorecard (Elsevier Butterworth-Heinemann, 2004); Managing Employee Retention (Elsevier Butterworth-Heinemann, 2003); Return on Investment in Training and Performance Improvement Programs, 2nd ed. (Elsevier Butterworth-Heinemann, 2003); The Project Management Scorecard, (Elsevier Butterworth-Heinemann, 2002); How to Measure Training Results (McGraw-Hill, 2002); The Human Resources Scorecard: Measuring the Return on Investment (Elsevier Butterworth-Heinemann, 2001); The Consultant’s Scorecard (McGraw-Hill, 2000); and Performance Analysis and Consulting (ASTD, 2000). Phillips served as series editor for ASTD’s In Action casebook series, an ambitious publishing project featuring 30 titles. He currently serves as series editor for Elsevier Butterworth-Heinemann’s Improving Human Performance series. Dr. Phillips has undergraduate degrees in electrical engineering, physics, and mathematics; a master’s degree in Decision Sciences from Georgia State University; and a Ph.D. in Human Resource Management from the University of Alabama. He has served on the boards of several private businesses—including two NASDAQ companies—and several nonprofits and associations, including the American Society for Training and Development. He is chairman of the ROI Institute, Inc., and can be reached at (205) 678-8101, or by e-mail at [email protected].