ON24 DIGITAL EXPERIENCE PLATFORM
28
© 2021 ON24, Inc. | Confidential ON24 DIGITAL EXPERIENCE PLATFORM August 2021
Transcript of ON24 DIGITAL EXPERIENCE PLATFORM
© 2021 ON24, Inc. | Confidential
ON24
DIGITAL EXPERIENCE PLATFORM
August 2021
© 2021 ON24, Inc. | Confidential
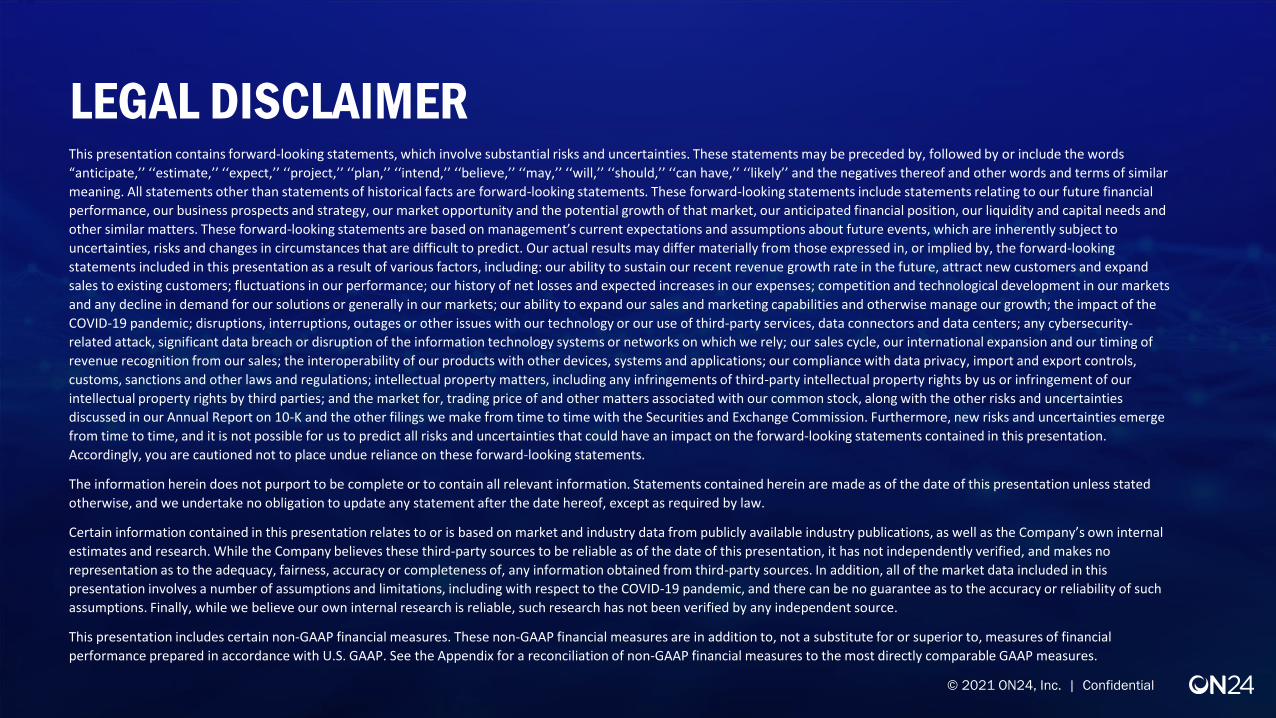
LEGAL DISCLAIMERThis presentation contains forward-looking statements, which involve substantial risks and uncertainties. These statements may be preceded by, followed by or include the words
“anticipate,’’ ‘‘estimate,’’ ‘‘expect,’’ ‘‘project,’’ ‘‘plan,’’ ‘‘intend,’’ ‘‘believe,’’ ‘‘may,’’ ‘‘will,’’ ‘‘should,’’ ‘‘can have,’’ ‘‘likely’’ and the negatives thereof and other words and terms of similar
meaning. All statements other than statements of historical facts are forward-looking statements. These forward-looking statements include statements relating to our future financial
performance, our business prospects and strategy, our market opportunity and the potential growth of that market, our anticipated financial position, our liquidity and capital needs and
other similar matters. These forward-looking statements are based on management’s current expectations and assumptions about future events, which are inherently subject to
uncertainties, risks and changes in circumstances that are difficult to predict. Our actual results may differ materially from those expressed in, or implied by, the forward-looking
statements included in this presentation as a result of various factors, including: our ability to sustain our recent revenue growth rate in the future, attract new customers and expand
sales to existing customers; fluctuations in our performance; our history of net losses and expected increases in our expenses; competition and technological development in our markets
and any decline in demand for our solutions or generally in our markets; our ability to expand our sales and marketing capabilities and otherwise manage our growth; the impact of the
COVID-19 pandemic; disruptions, interruptions, outages or other issues with our technology or our use of third-party services, data connectors and data centers; any cybersecurity-
related attack, significant data breach or disruption of the information technology systems or networks on which we rely; our sales cycle, our international expansion and our timing of
revenue recognition from our sales; the interoperability of our products with other devices, systems and applications; our compliance with data privacy, import and export controls,
customs, sanctions and other laws and regulations; intellectual property matters, including any infringements of third-party intellectual property rights by us or infringement of our
intellectual property rights by third parties; and the market for, trading price of and other matters associated with our common stock, along with the other risks and uncertainties
discussed in our Annual Report on 10-K and the other filings we make from time to time with the Securities and Exchange Commission. Furthermore, new risks and uncertainties emerge
from time to time, and it is not possible for us to predict all risks and uncertainties that could have an impact on the forward-looking statements contained in this presentation.
Accordingly, you are cautioned not to place undue reliance on these forward-looking statements.
The information herein does not purport to be complete or to contain all relevant information. Statements contained herein are made as of the date of this presentation unless stated
otherwise, and we undertake no obligation to update any statement after the date hereof, except as required by law.
Certain information contained in this presentation relates to or is based on market and industry data from publicly available industry publications, as well as the Company’s own internal
estimates and research. While the Company believes these third-party sources to be reliable as of the date of this presentation, it has not independently verified, and makes no
representation as to the adequacy, fairness, accuracy or completeness of, any information obtained from third-party sources. In addition, all of the market data included in this
presentation involves a number of assumptions and limitations, including with respect to the COVID-19 pandemic, and there can be no guarantee as to the accuracy or reliability of such
assumptions. Finally, while we believe our own internal research is reliable, such research has not been verified by any independent source.
This presentation includes certain non-GAAP financial measures. These non-GAAP financial measures are in addition to, not a substitute for or superior to, measures of financial
performance prepared in accordance with U.S. GAAP. See the Appendix for a reconciliation of non-GAAP financial measures to the most directly comparable GAAP measures.
3 © 2021 ON24, Inc. | Confidential
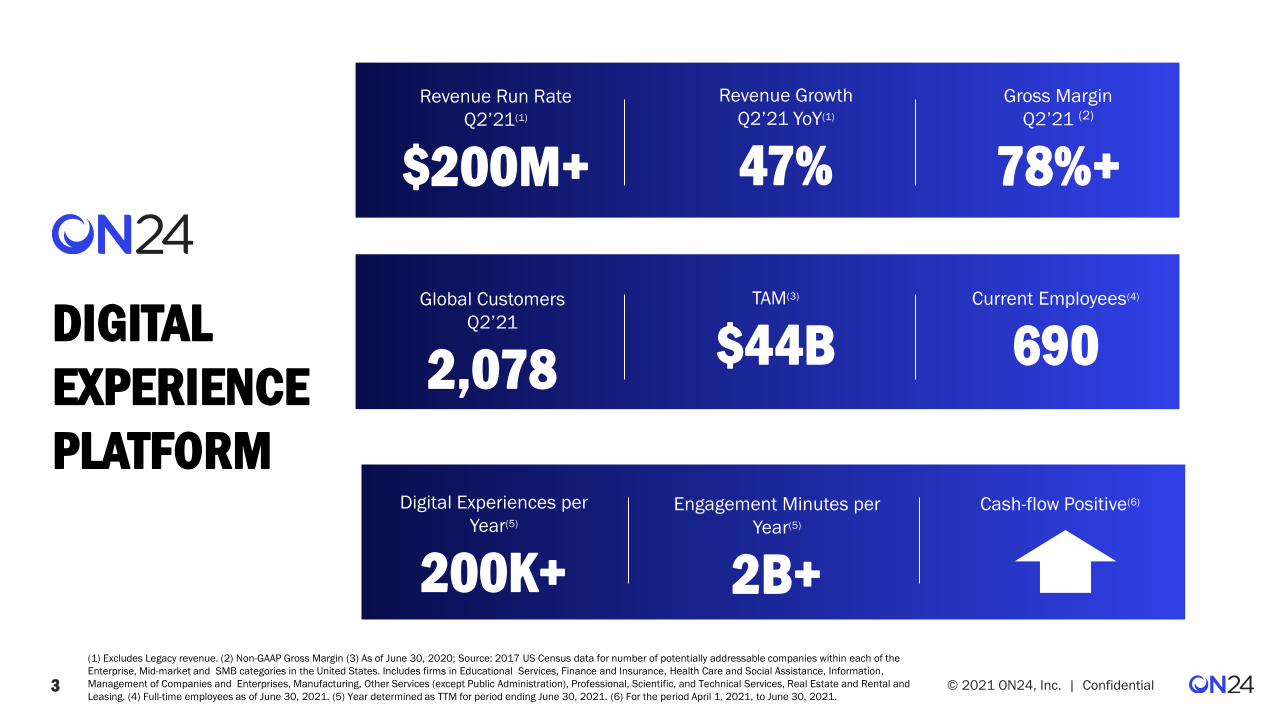
DIGITAL
EXPERIENCE
PLATFORM
Revenue Run Rate
Q2’21(1)
$200M+
Revenue Growth
Q2’21 YoY(1)
47%
Gross Margin
Q2’21 (2)
78%+
Global Customers
Q2’21
2,078
Current Employees(4)
690TAM(3)
$44B
Digital Experiences per
Year(5)
200K+
Engagement Minutes per
Year(5)
2B+
Cash-flow Positive(6)
(1) Excludes Legacy revenue. (2) Non-GAAP Gross Margin (3) As of June 30, 2020; Source: 2017 US Census data for number of potentially addressable companies within each of the
Enterprise, Mid-market and SMB categories in the United States. Includes firms in Educational Services, Finance and Insurance, Health Care and Social Assistance, Information,
Management of Companies and Enterprises, Manufacturing, Other Services (except Public Administration), Professional, Scientific, and Technical Services, Real Estate and Rental and
Leasing. (4) Full-time employees as of June 30, 2021. (5) Year determined as TTM for period ending June 30, 2021. (6) For the period April 1, 2021, to June 30, 2021.
4 © 2021 ON24, Inc. | Confidential
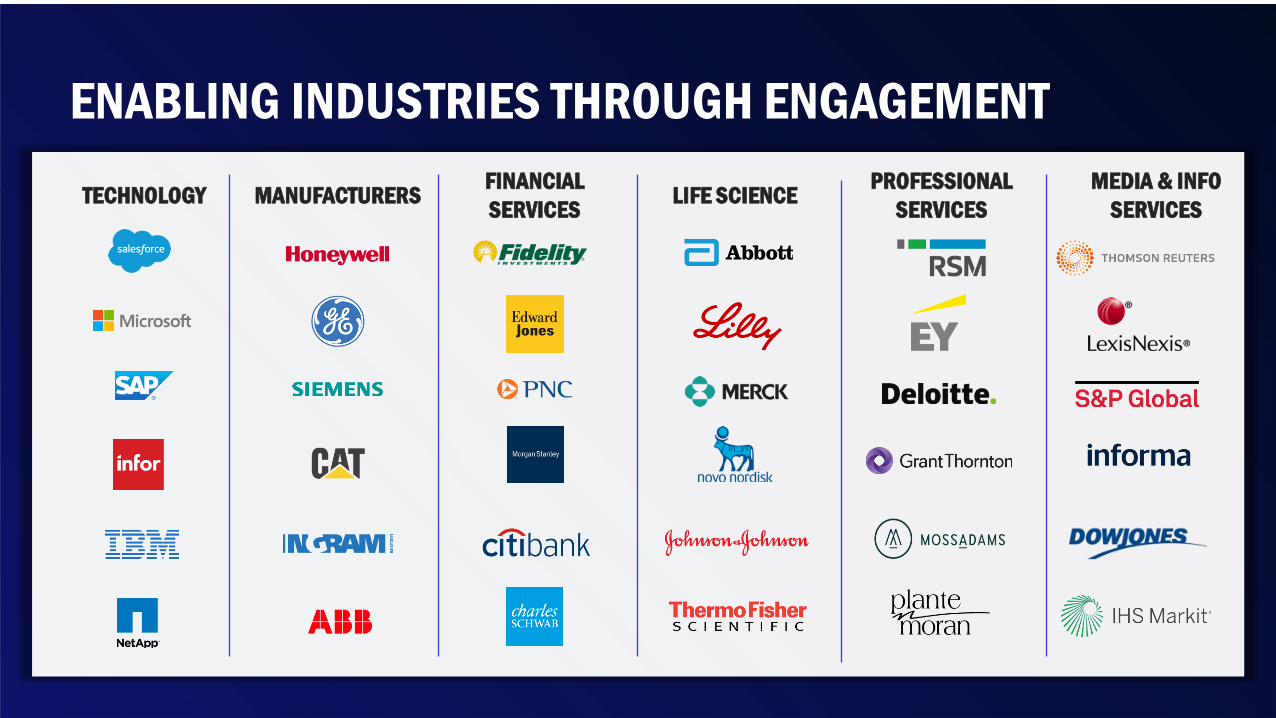
TECHNOLOGY MANUFACTURERSFINANCIAL
SERVICESLIFE SCIENCE
PROFESSIONAL
SERVICES
MEDIA & INFO
SERVICES
ENABLING INDUSTRIES THROUGH ENGAGEMENT
© 2021 ON24, Inc. | Confidential
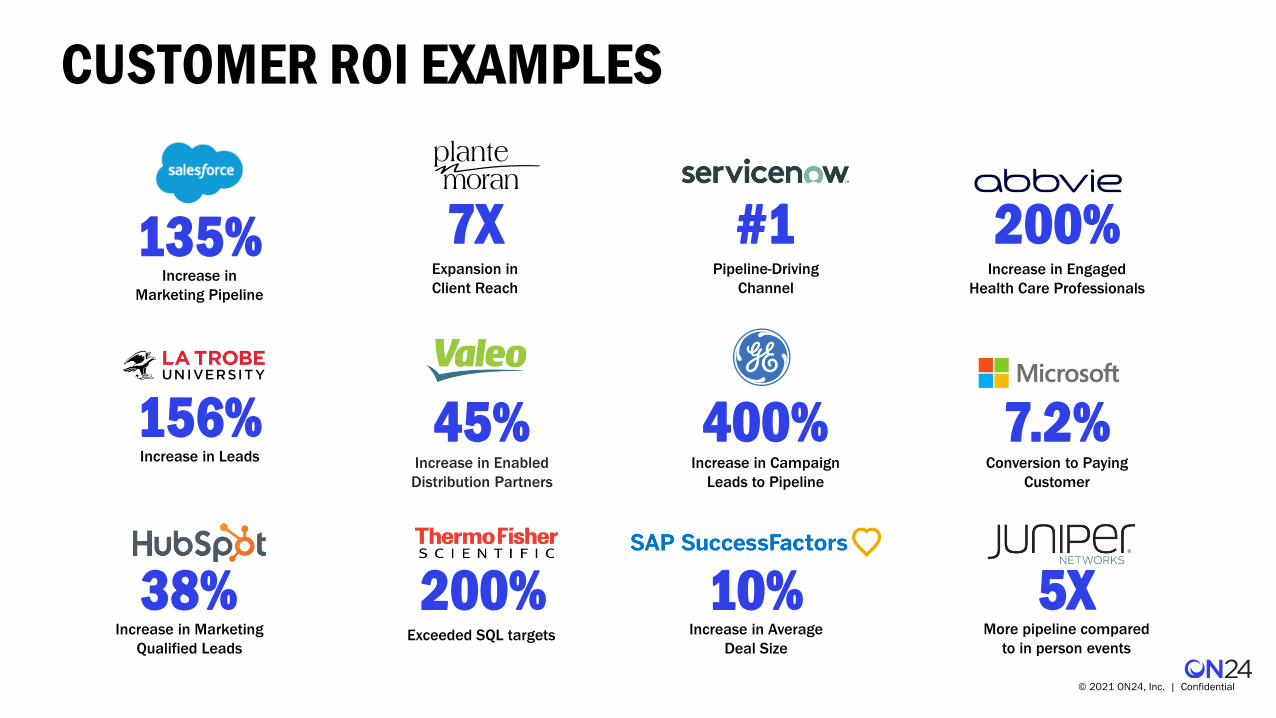
135%Increase in
Marketing Pipeline
200%Increase in Engaged
Health Care Professionals
#1Pipeline-Driving
Channel
156%Increase in Leads
400%Increase in Campaign
Leads to Pipeline
38% 200% 10%
7XExpansion in
Client Reach
5XIncrease in Marketing
Qualified LeadsExceeded SQL targets Increase in Average
Deal Size
More pipeline compared
to in person events
7.2%Conversion to Paying
Customer
45%Increase in Enabled
Distribution Partners
CUSTOMER ROI EXAMPLES
6 © 2021 ON24, Inc. | Confidential
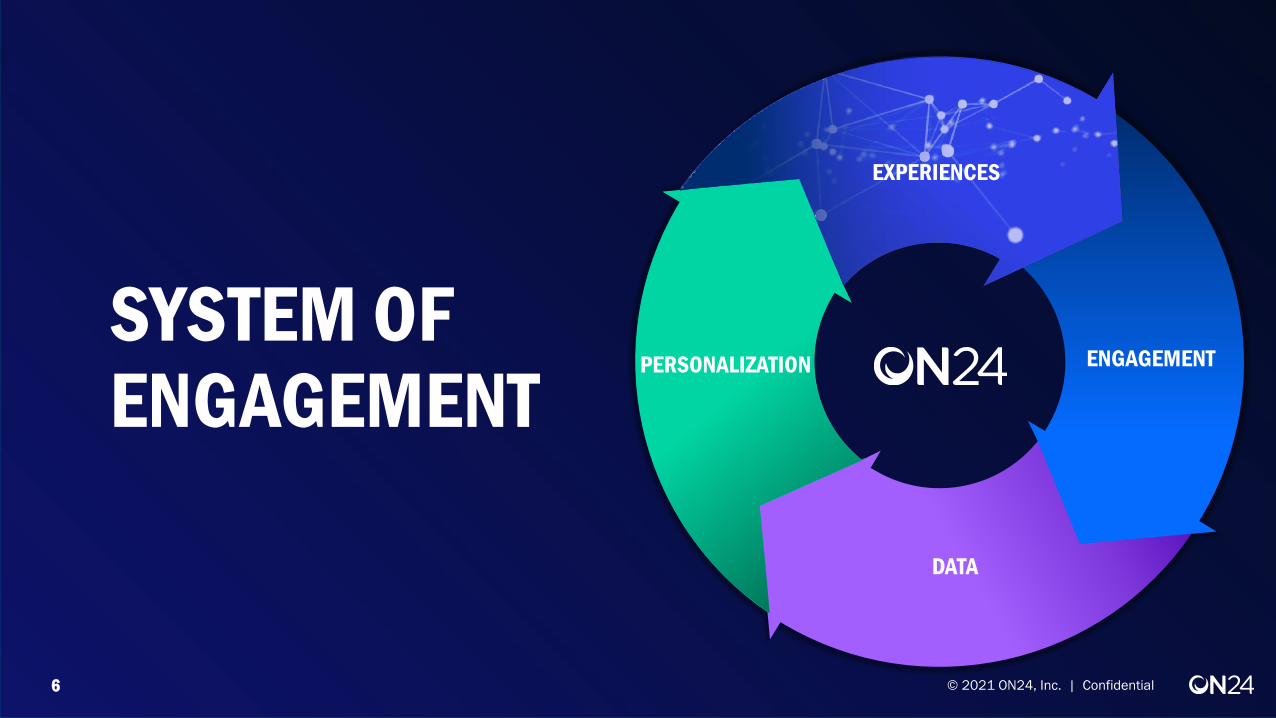
SYSTEM OF ENGAGEMENT
DATA
ENGAGEMENTPERSONALIZATION
EXPERIENCES
7 © 2021 ON24, Inc. | Confidential
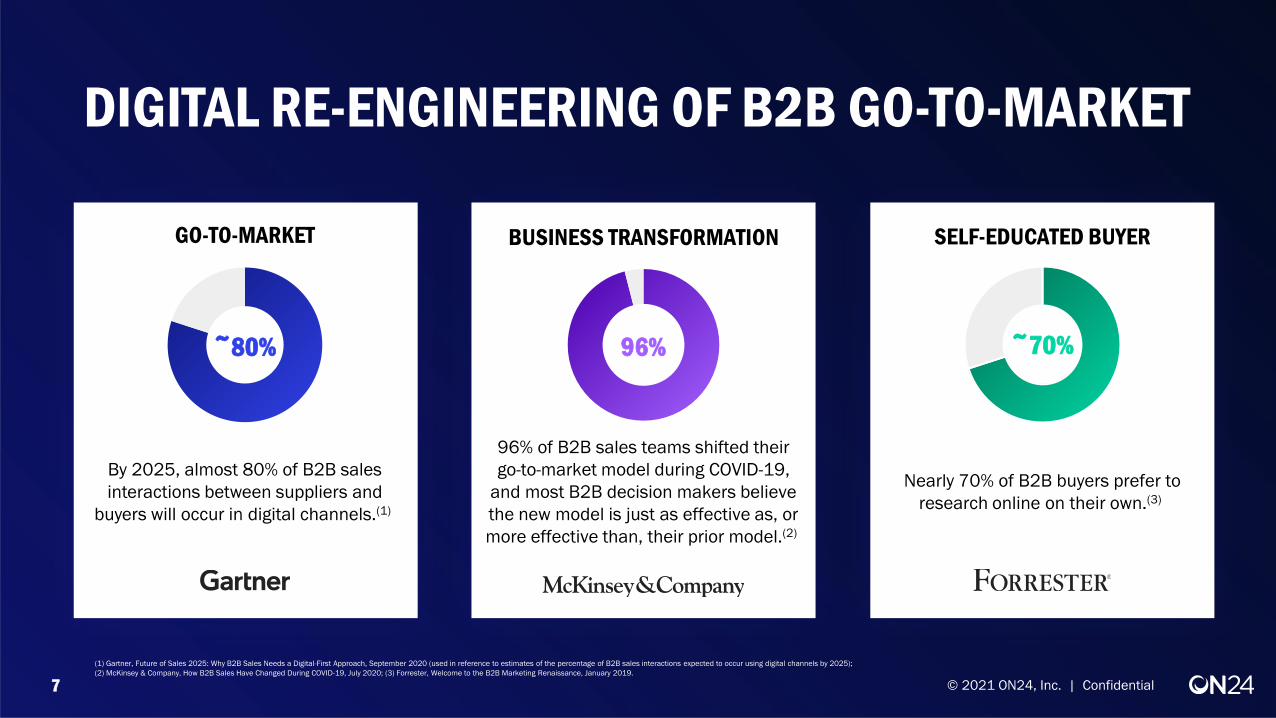
DIGITAL RE-ENGINEERING OF B2B GO-TO-MARKET
96% of B2B sales teams shifted their
go-to-market model during COVID-19,
and most B2B decision makers believe
the new model is just as effective as, or
more effective than, their prior model.(2)
96%
BUSINESS TRANSFORMATION
~80%
By 2025, almost 80% of B2B sales
interactions between suppliers and
buyers will occur in digital channels.(1)
GO-TO-MARKET
Nearly 70% of B2B buyers prefer to
research online on their own.(3)
~70%
SELF-EDUCATED BUYER
(1) Gartner, Future of Sales 2025: Why B2B Sales Needs a Digital-First Approach, September 2020 (used in reference to estimates of the percentage of B2B sales interactions expected to occur using digital channels by 2025);
(2) McKinsey & Company, How B2B Sales Have Changed During COVID-19, July 2020; (3) Forrester, Welcome to the B2B Marketing Renaissance, January 2019.

8 © 2021 ON24, Inc. | Confidential(1) Average number based on experiences with more than 5 attendees for period ending Jan 1, 2020, to June 30, 2021; (2) Represents the minimum number of datapoints per attendee collected for events for the year
determined as TTM for period ending June 30, 2021; (3) Year determined as TTM for period ending June 30, 2021.
THE ERA OF ENGAGEMENT IS HERE
Customer Data
Cu
sto
me
r E
ng
ag
em
en
t
Websites
Advertising
Social
Physical Events
200+ 50+ 20+
2B+ 3M+
Attendees(1) Minutes(1) Data points
per attendee(2)
Engagement min
per year(3)
Professionals
per month(3)
THE ON24 MULTIPLIER EFFECT
Engagement of Average ON24 Live Experience
Engagement Across ON24 Network
9 © 2021 ON24, Inc. | Confidential
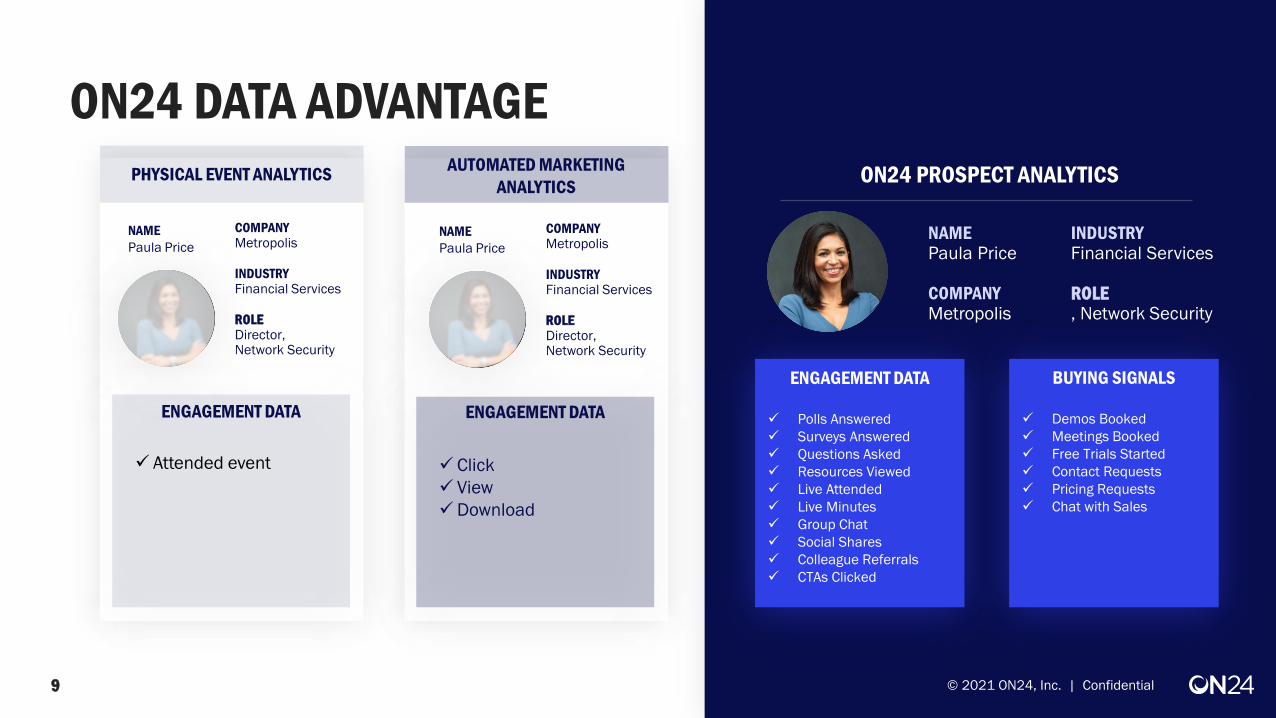
ON24 DATA ADVANTAGE
✓ Click
✓ View
✓Download
COMPANYMetropolis
INDUSTRYFinancial Services
ROLEDirector, Network Security
ENGAGEMENT DATA
NAME
Paula Price
AUTOMATED MARKETING
ANALYTICS
✓ Attended event
ENGAGEMENT DATA
PHYSICAL EVENT ANALYTICS
COMPANYMetropolis
INDUSTRYFinancial Services
ROLEDirector, Network Security
NAME
Paula Price
✓ Polls Answered
✓ Surveys Answered
✓ Questions Asked
✓ Resources Viewed
✓ Live Attended
✓ Live Minutes
✓ Group Chat
✓ Social Shares
✓ Colleague Referrals
✓ CTAs Clicked
ENGAGEMENT DATA
NAMEPaula Price
COMPANYMetropolis
INDUSTRYFinancial Services
ROLE, Network Security
ON24 PROSPECT ANALYTICS
✓ Demos Booked
✓ Meetings Booked
✓ Free Trials Started
✓ Contact Requests
✓ Pricing Requests
✓ Chat with Sales
BUYING SIGNALS
© 2021 ON24, Inc. | Confidential
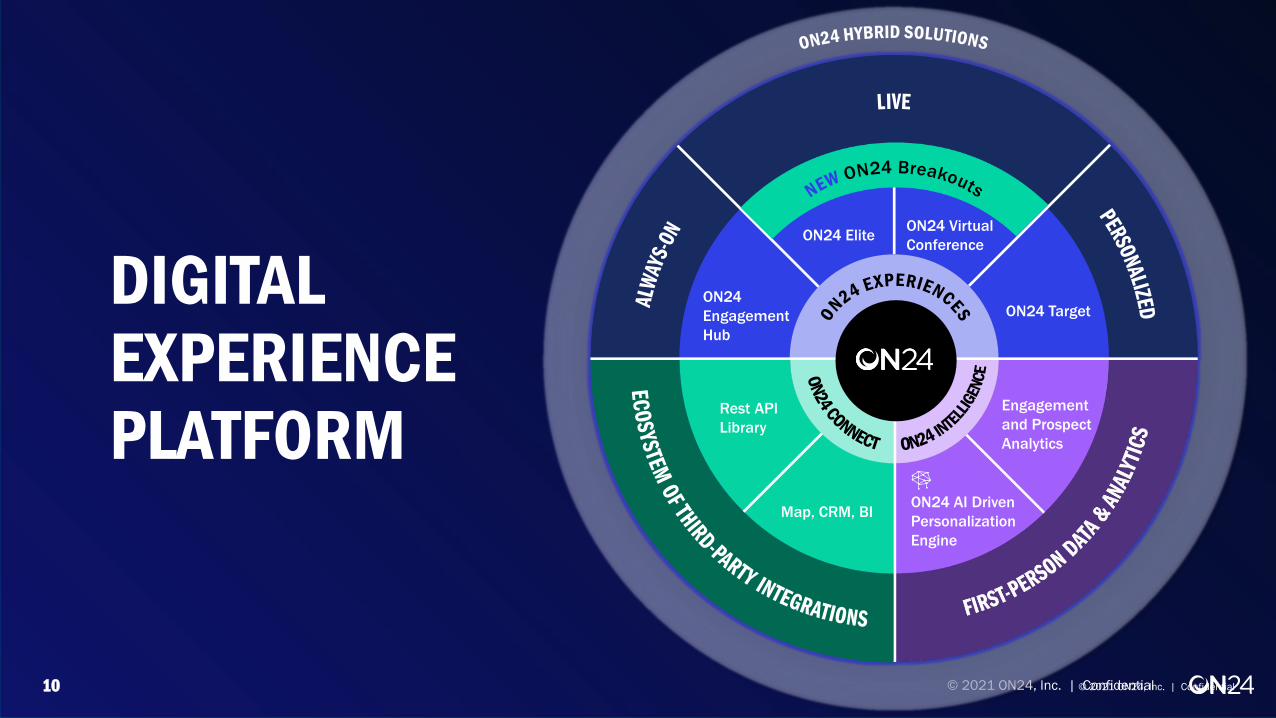
10 © 2021 ON24, Inc. | Confidential
DIGITAL EXPERIENCE PLATFORM
Rest API
Library
Map, CRM, BI
ON24
Engagement
Hub
ON24 EliteON24 Virtual
Conference
ON24 Target
ON24 AI Driven
Personalization
Engine
Engagement
and Prospect
Analytics
© 2021 ON24, Inc. | Confidential

11 © 2021 ON24, Inc. | Confidential
TURN ENGAGEMENT INTO ACTIONABLE DATA WITH ON24
TARGET PERSONA
Paula Price
COMPANYMetropolis
INDUSTRYFinancialServices
ROLEVice President,
Network Security
© 2021 ON24, Inc. | Confidential

ENGAGEMENT TOOLS
BUYING SIGNALS
CONVERSATIONAL
INTELLIGENCE
VIDEO BREAKOUTS
1:1 MEETINGS
PERSONALIZATION
Welcome! Would you like
to speak to a sales rep
about CloudTek
solutions?
Yes, I’m ready!
Not yet.
AUTOMATED
CAPTIONING
LIVE EXPERIENCE PERSONALIZED EXPERIENCE LIVE EXPERIENCEALWAYS-ON EXPERIENCE
Attends “TekTALKS” and signs
up for Cloudtek Free Trial
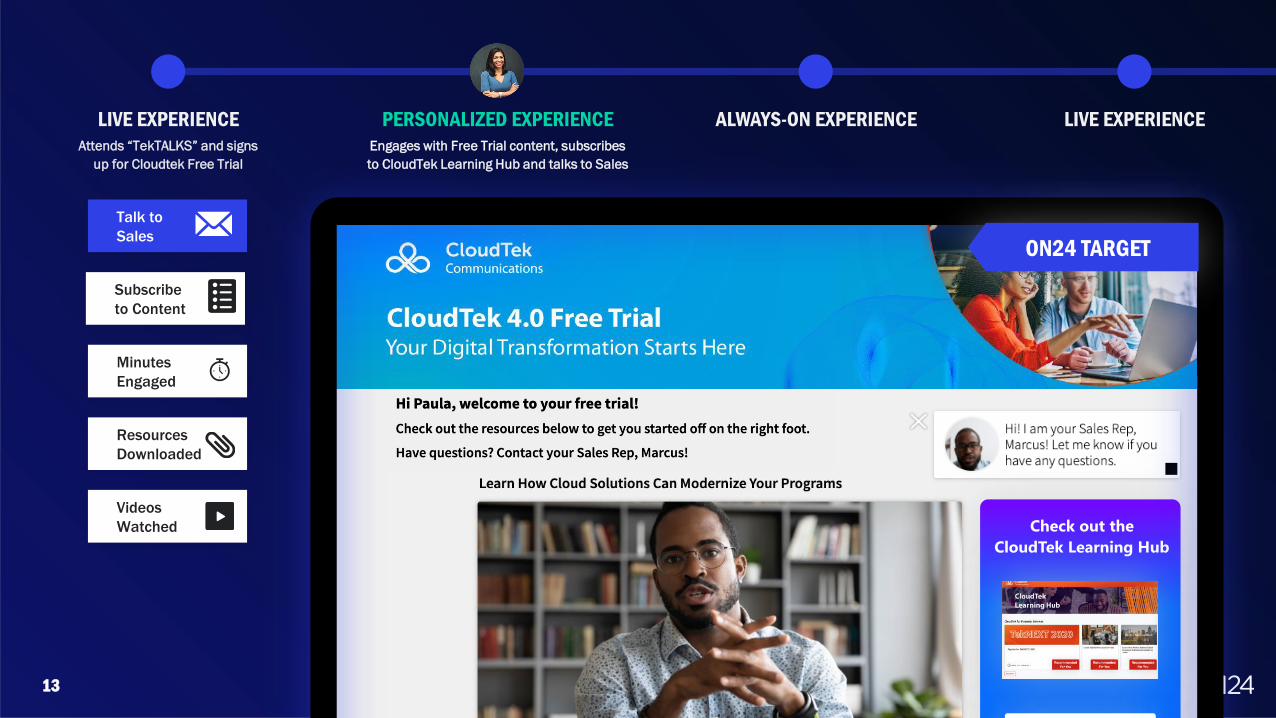
13 © 2021 ON24, Inc. | Confidential
ON24 TARGET
Engages with Free Trial content, subscribes
to CloudTek Learning Hub and talks to Sales
Check out the
CloudTek Learning Hub
Subscribe Now
ON24 TARGET
Attends “TekTALKS” and signs
up for Cloudtek Free Trial
LIVE EXPERIENCE PERSONALIZED EXPERIENCE LIVE EXPERIENCEALWAYS-ON EXPERIENCE
Talk to
Sales
Videos
Watched
Resources
Downloaded
Minutes
Engaged
Subscribe
to Content
14 © 2021 ON24, Inc. | Confidential
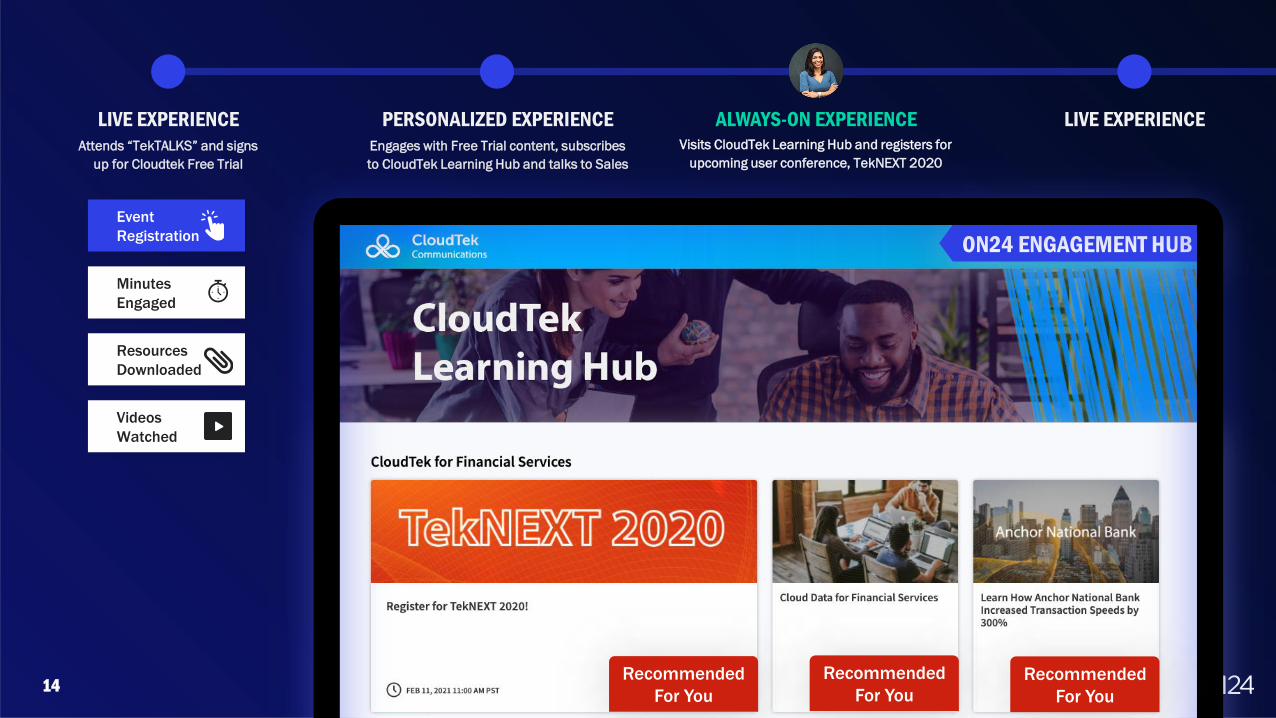
Visits CloudTek Learning Hub and registers for
upcoming user conference, TekNEXT 2020
ON24 ENGAGEMENT HUB
Recommended
For You
Recommended
For You
Recommended
For You
Engages with Free Trial content, subscribes
to CloudTek Learning Hub and talks to Sales
Attends “TekTALKS” and signs
up for Cloudtek Free Trial
LIVE EXPERIENCE PERSONALIZED EXPERIENCE LIVE EXPERIENCEALWAYS-ON EXPERIENCE
Event
Registration
Videos
Watched
Resources
Downloaded
Minutes
Engaged
15 © 2021 ON24, Inc. | Confidential
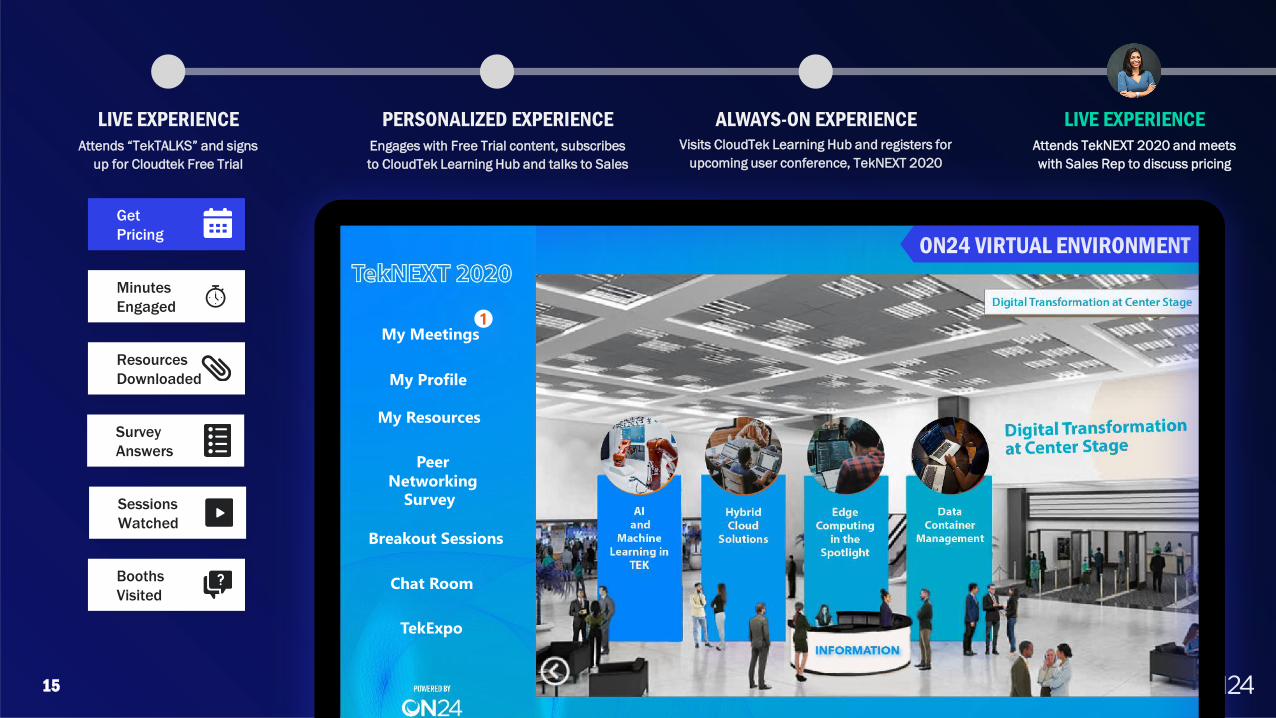
Attends TekNEXT 2020 and meets
with Sales Rep to discuss pricing
ON24 VIRTUAL ENVIRONMENT
TekExpo
Breakout Sessions
Survey
Peer
Networking
My Resources
Chat Room
My Meetings1
My Profile
Visits CloudTek Learning Hub and registers for
upcoming user conference, TekNEXT 2020
Engages with Free Trial content, subscribes
to CloudTek Learning Hub and talks to Sales
Attends “TekTALKS” and signs
up for Cloudtek Free Trial
LIVE EXPERIENCE PERSONALIZED EXPERIENCE LIVE EXPERIENCEALWAYS-ON EXPERIENCE
Get
Pricing
Minutes
Engaged
Resources
Downloaded
Sessions
Watched
Survey
Answers
Booths
Visited
16
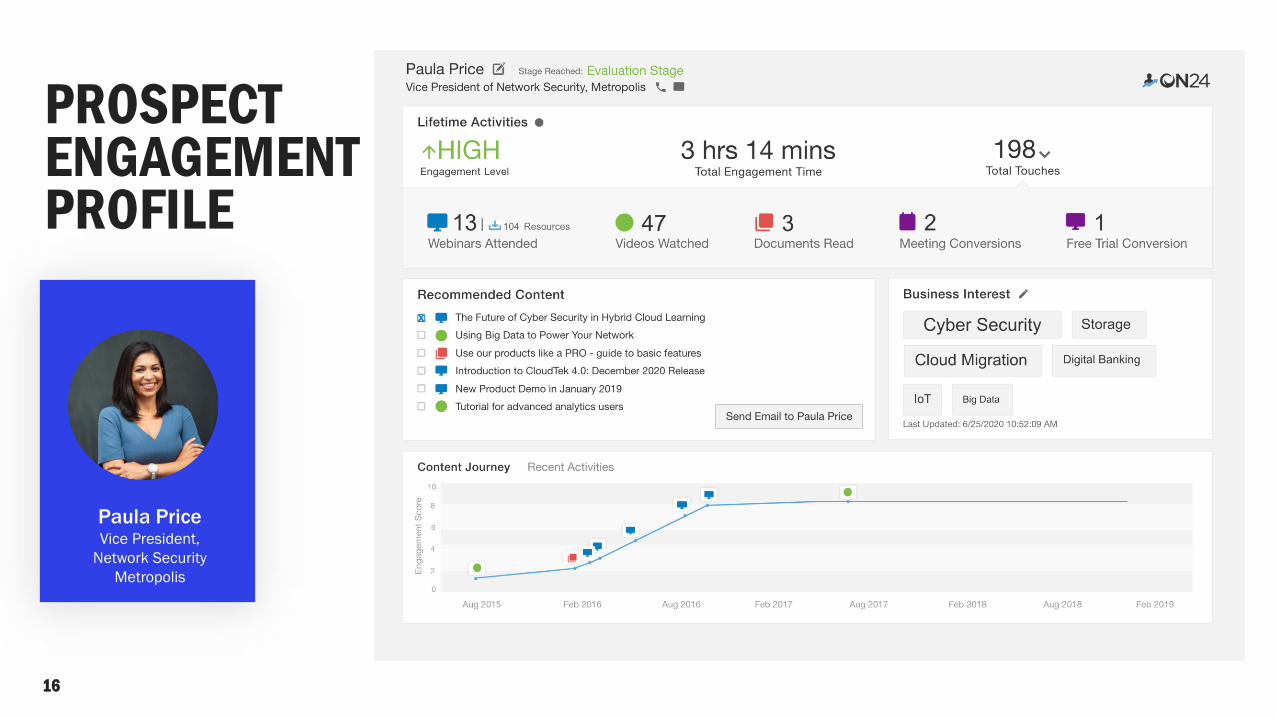
PROSPECT ENGAGEMENT PROFILE
Paula PriceVice President,
Network Security
Metropolis
17 © 2021 ON24, Inc. | Confidential
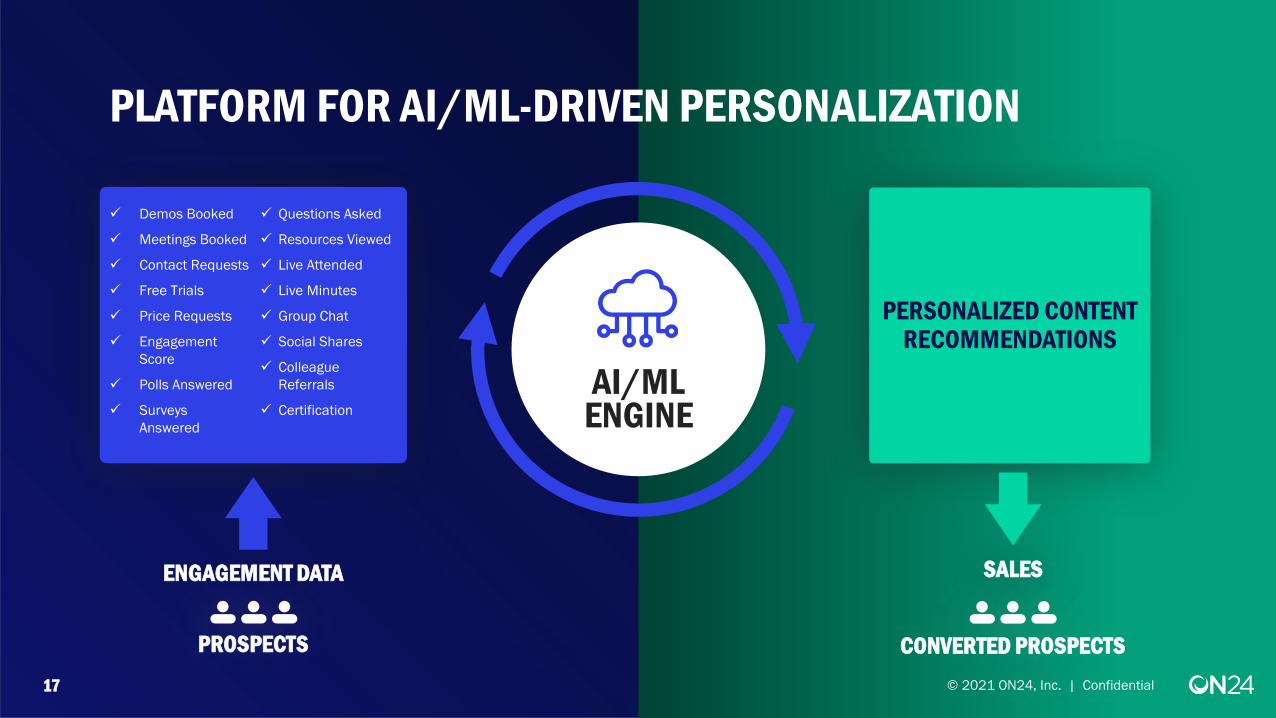
PLATFORM FOR AI/ML-DRIVEN PERSONALIZATION
✓ Demos Booked
✓ Meetings Booked
✓ Contact Requests
✓ Free Trials
✓ Price Requests
✓ Engagement
Score
✓ Polls Answered
✓ Surveys
Answered
✓ Questions Asked
✓ Resources Viewed
✓ Live Attended
✓ Live Minutes
✓ Group Chat
✓ Social Shares
✓ Colleague
Referrals
✓ Certification
ENGAGEMENT DATA
AI/MLENGINE
PERSONALIZED CONTENT RECOMMENDATIONS
SALES
PROSPECTS CONVERTED PROSPECTS
© 2021 ON24, Inc. | Confidential

18 © 2021 ON24, Inc. | Confidential18 © 2021 ON24, Inc. | Confidential
ON24 CONNECT: LARGE ECOSYSTEM OF 3RD PARTY INTEGRATIONS
ON24 REST API
BUSINESS INTELLIGENCEENGAGEMENT DATA &
360° PROSPECT VIEWREAL-TIME
BUYING SIGNALS
FLEXIBLE AUDIENCE REGISTRATION
MARKETER SALES
REAL-TIME, DEEP INTEGRATIONS WITH
CRM & MARKETING AUTOMATION PLATFORMS

19 © 2021 ON24, Inc. | Confidential
CRM &
Marketing
Automation
Platform
Customer
Experience
Management
Video
Conferencing &
Collaboration Tools
ON24 IS AT THE EPICENTER OF CUSTOMER ENGAGEMENT

20 © 2021 ON24, Inc. | Confidential
US Market TAM = $22B
SMB
Mid-Market
Enterprise
International Markets
AverageSpendPotential
(2,000+ Employees)
(200-1,999 employees)
(50-199 employees)
~1x of US Market $44B
International TAM = $22B
As of June 30, 2021; Source: 2017 US Census data for number of potentially addressable companies within each of the Enterprise, Mid-market and SMB categories in the United
States. Includes Firms in Educational Services, Finance and Insurance, Health Care and Social Assistance, Information, Management of Companies and Enterprises, Manufacturing,
Other Services (except Public Administration), Professional, Scientific, and Technical Services, Real Estate and Rental and Leasing
MASSIVE GLOBAL TAM

21 © 2021 ON24, Inc. | Confidential
In-Person Engagement Digital Engagement
PRE-COVID TODAY A HYBRID WORLD
EVOLUTION OF ENGAGEMENT
22 © 2021 ON24, Inc. | Confidential
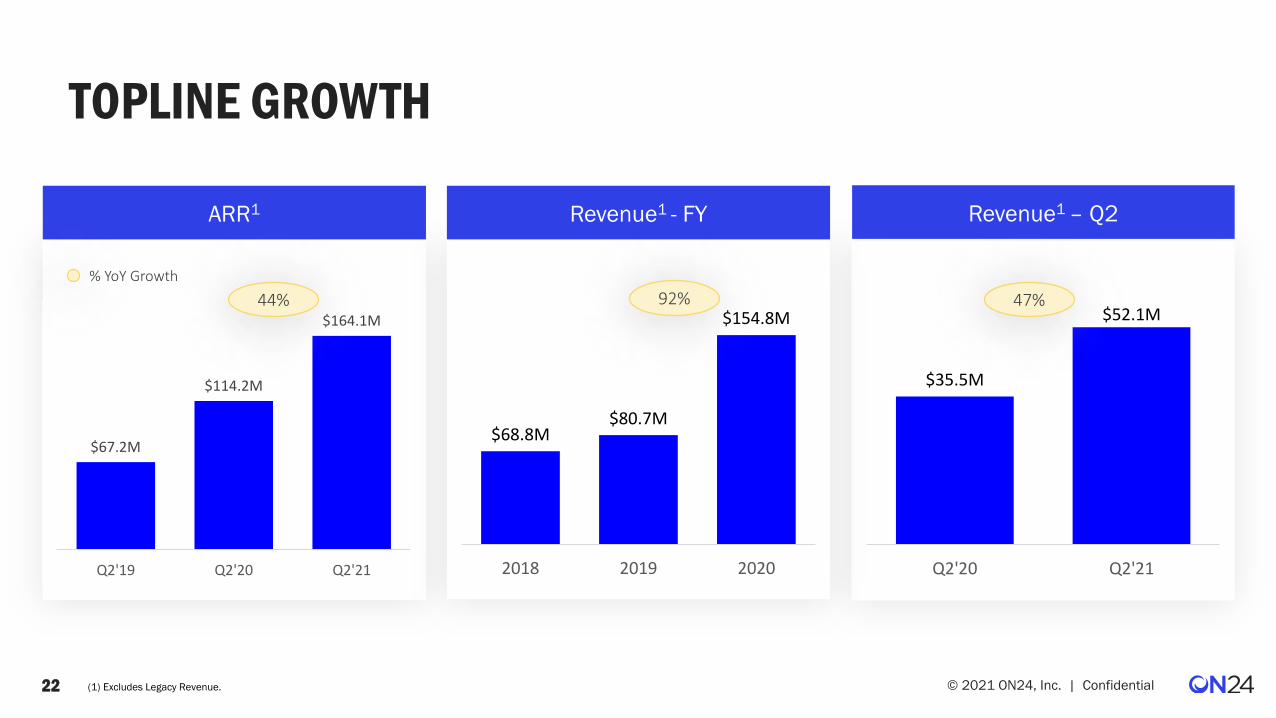
$67.2M
$114.2M
$164.1M
Q2'19 Q2'20 Q2'21
$35.5M
$52.1M
Q2'20 Q2'21
$68.8M $80.7M
$154.8M
2018 2019 2020
TOPLINE GROWTH
ARR1 Revenue1 - FY Revenue1 – Q2
44% 92% 47%
% YoY Growth
(1) Excludes Legacy Revenue.
23 © 2021 ON24, Inc. | Confidential
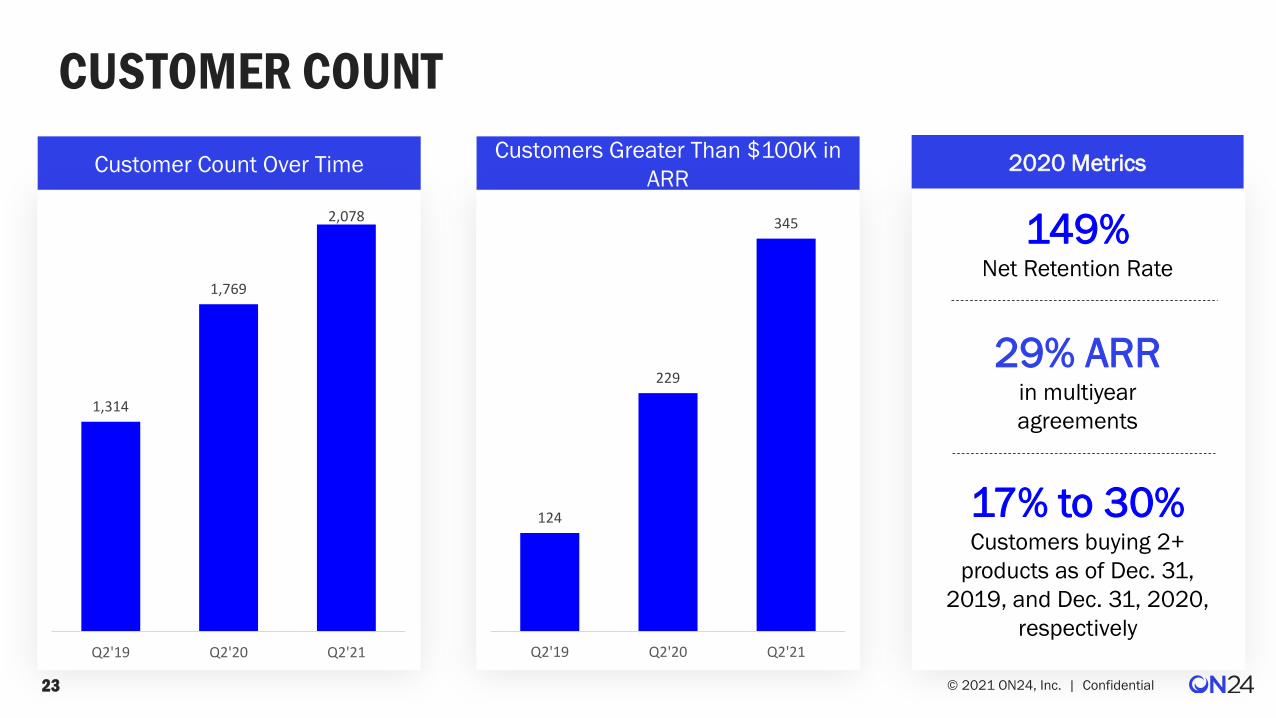
CUSTOMER COUNT
Customer Count Over TimeCustomers Greater Than $100K in
ARR
149%Net Retention Rate
29% ARRin multiyear
agreements
2020 Metrics
17% to 30%Customers buying 2+
products as of Dec. 31,
2019, and Dec. 31, 2020,
respectively
1,314
1,769
2,078
Q2'19 Q2'20 Q2'21
124
229
345
Q2'19 Q2'20 Q2'21
24 © 2021 ON24, Inc. | Confidential
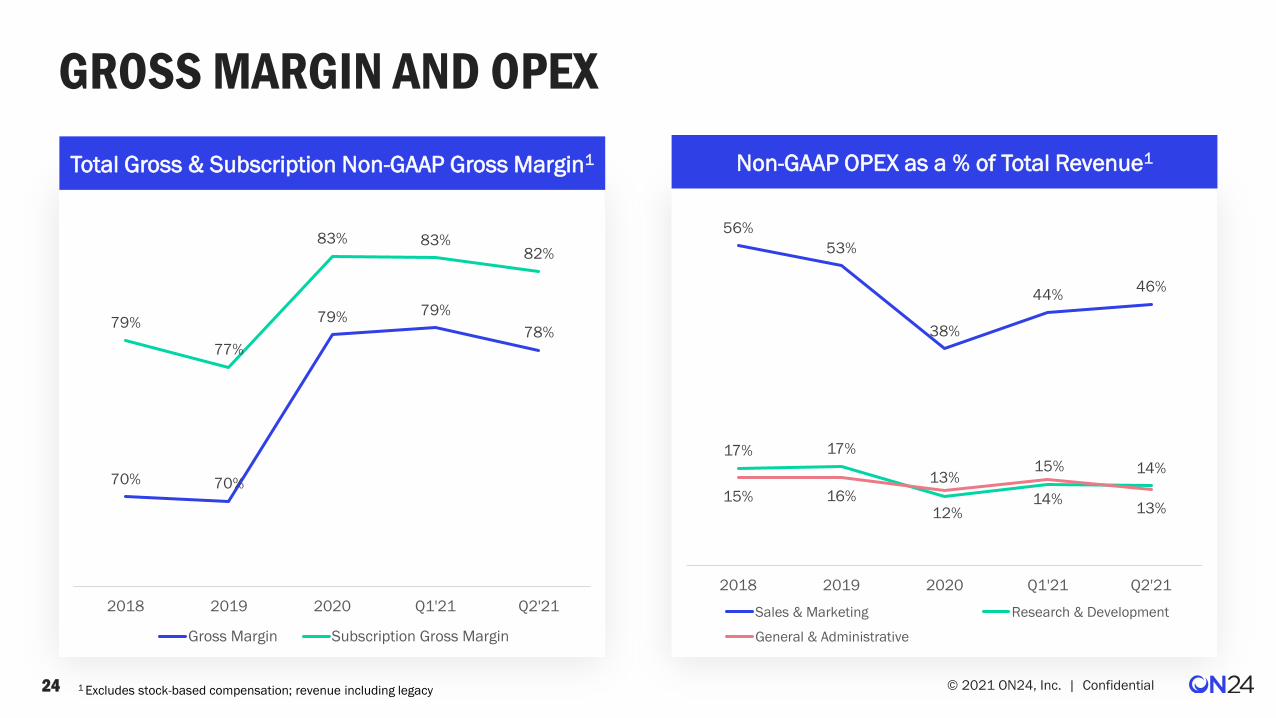
GROSS MARGIN AND OPEX
Total Gross & Subscription Non-GAAP Gross Margin1 Non-GAAP OPEX as a % of Total Revenue1
1 Excludes stock-based compensation; revenue including legacy
70% 70%
79% 79%
78%79%
77%
83% 83%82%
2018 2019 2020 Q1'21 Q2'21
Gross Margin Subscription Gross Margin
56%
53%
38%
44%46%
17% 17%
12%14%
14%
15% 16%
13%15%
13%
2018 2019 2020 Q1'21 Q2'21
Sales & Marketing Research & Development
General & Administrative

APPENDIX
26 © 2021 ON24, Inc. | Confidential
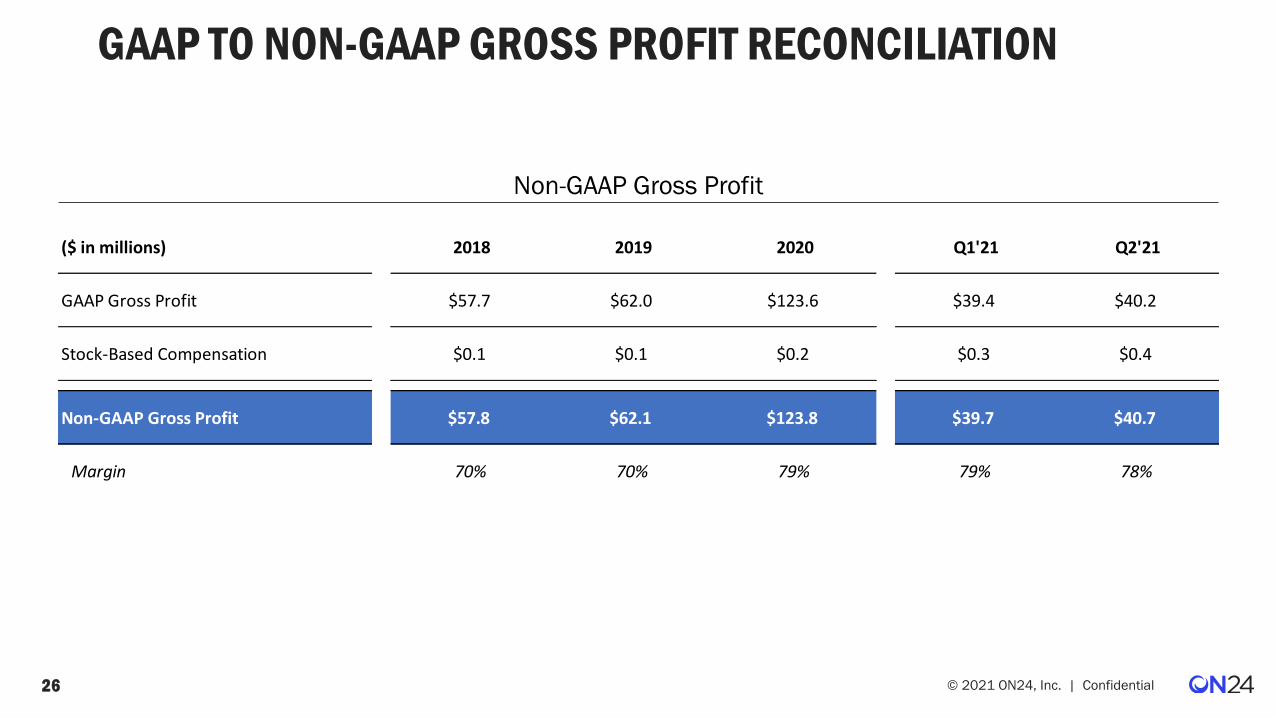
GAAP TO NON-GAAP GROSS PROFIT RECONCILIATION
Non-GAAP Gross Profit
($ in millions) 2018 2019 2020 Q1'21 Q2'21
GAAP Gross Profit $57.7 $62.0 $123.6 $39.4 $40.2
Stock-Based Compensation $0.1 $0.1 $0.2 $0.3 $0.4
Non-GAAP Gross Profit $57.8 $62.1 $123.8 $39.7 $40.7
Margin 70% 70% 79% 79% 78%

27 © 2021 ON24, Inc. | Confidential
GAAP TO NON-GAAP SUBSCRIPTION GROSS PROFIT RECONCILIATION
Non-GAAP Subscription Gross Profit
($ in millions) 2018 2019 2020 Q1'21 Q2'21
Subscription Gross Profit $51.8 $55.9 $101.9 $35.4 $36.2
Stock-Based Compensation $0.1 $0.1 $0.2 $0.2 $0.3
Non-GAAP Subscription Gross Profit $51.9 $56.0 $102.0 $35.7 $36.5
Margin 79% 77% 83% 83% 82%

28 © 2021 ON24, Inc. | Confidential
GAAP TO NON-GAAP OPERATING EXPENSE RECONCILIATION
Sales and Marketing Research and Development
General and Administrative
($ in millions) 2018 2019 2020 Q1'21 Q2'21
GAAP Sales and Marketing $47.0 $47.8 $60.6 $23.9 $25.5
Stock-based compensation $0.6 $0.9 $1.1 $1.7 $1.6
Non-GAAP Sales and Marketing $46.3 $46.9 $59.6 $22.2 $23.9
% of Total Revenue 56% 53% 38% 44% 46%
($ in millions) 2018 2019 2020 Q1'21 Q2'21
GAAP Research and Development $14.3 $15.7 $19.3 $7.9 $8.2
Stock-based compensation $0.2 $0.2 $0.4 $0.8 $0.9
Non-GAAP Research and Development $14.1 $15.5 $18.9 $7.2 $7.3
% of Total Revenue 17% 17% 12% 14% 14%
($ in millions) 2018 2019 2020 Q1'21 Q2'21
GAAP General and Administrative $13.3 $14.6 $21.9 $9.8 $9.1
Stock-based compensation $0.5 $0.7 $1.3 $2.2 $2.1
Non-GAAP General and Administrative $12.8 $13.9 $20.5 $7.6 $7.0
% of Total Revenue 15% 16% 13% 15% 13%