On theprogenitor of SN 2005gl and thenatureof TypeIIn ... · – 2 – ABSTRACT We present a study...
28
arXiv:astro-ph/0608029v1 2 Aug 2006 On the progenitor of SN 2005gl and the nature of Type IIn supernovae Avishay Gal-Yam 1 Astronomy Department, MS 105-24, California Institute of Technology, Pasadena, CA 91125 [email protected] D. C. Leonard Department of Astronomy, San Diego State University, San Diego, California 92182 D. B. Fox Department of Astronomy and Astrophysics, Pennsylvania State University, 525 Davey Lab, University Park, PA 16802 S. B. Cenko, A. M. Soderberg, D.-S. Moon Division of Physics, Mathematics and Astronomy, California Institute of Technology, Pasadena, CA 91125 D. J. Sand 2 Steward Observatory, University of Arizona, 933 North Cherry Avenue, Tucson, AZ 85721 (the CCCP) and W. Li, A. V. Filippenko Department of Astronomy, 601 Campbell Hall, University of California, Berkeley, CA 94720-3411 G. Aldering E. O. Lawrence Berkeley National Laboratory, 1 Cyclotron Road, Berkeley, CA 94720 Y. Copin (for the SNfactory team) Institut de Physique Nucleaire de Lyon, France
Transcript of On theprogenitor of SN 2005gl and thenatureof TypeIIn ... · – 2 – ABSTRACT We present a study...

arX
iv:a
stro
-ph/
0608
029v
1 2
Aug
200
6
On the progenitor of SN 2005gl and the nature of Type IIn
supernovae
Avishay Gal-Yam1
Astronomy Department, MS 105-24, California Institute of Technology, Pasadena, CA
91125
D. C. Leonard
Department of Astronomy, San Diego State University, San Diego, California 92182
D. B. Fox
Department of Astronomy and Astrophysics, Pennsylvania State University, 525 Davey
Lab, University Park, PA 16802
S. B. Cenko, A. M. Soderberg, D.-S. Moon
Division of Physics, Mathematics and Astronomy, California Institute of Technology,
Pasadena, CA 91125
D. J. Sand2
Steward Observatory, University of Arizona, 933 North Cherry Avenue, Tucson, AZ 85721
(the CCCP)
and
W. Li, A. V. Filippenko
Department of Astronomy, 601 Campbell Hall, University of California, Berkeley, CA
94720-3411
G. Aldering
E. O. Lawrence Berkeley National Laboratory, 1 Cyclotron Road, Berkeley, CA 94720
Y. Copin (for the SNfactory team)
Institut de Physique Nucleaire de Lyon, France
– 2 –
ABSTRACT
We present a study of the type IIn supernova (SN) 2005gl, in the relatively
nearby (d ≈ 66 Mpc) galaxy NGC 266. Photometry and spectroscopy of the SN
indicate it is a typical member of its class. Pre-explosion Hubble Space Telescope
(HST) imaging of the location of the SN, along with a precise localization of this
event using the Laser-Guide-Star assisted Adaptive Optics (LGS-AO) system at
Keck Observatory, are combined to identify a luminous (MV = −10.3) point
source as the possible progenitor of SN 2005gl. If the source is indeed a single
star, it was likely a member of the class of luminous blue variable stars (LBVs).
This finding leads us to consider the possible general association of SNe IIn with
LBV progenitors. We find this is indeed supported by observations of other SNe,
and the known properties of LBV stars. For example, we argue that should the
prototypical Galactic LBV η Carina explode in a phase similar to its current
state, it will likely produce a type IIn SN. We discuss our findings in the context
of current ideas about the evolution of massive stars, and review the census of
SNe with identified progenitors. We introduce the concept of the progenitor-SN
map as a convenient means to discuss the present status and future prospects
of direct searches for SN progenitors. We conclude that this field has matured
considerably in recent years, and the transition from anecdotal information about
rare single events to robust associations of progenitor classes with specific SN
types has already begun.
Subject headings: supernovae: general
1. Introduction
It is generally assumed that supernovae (SNe) can be divided into two physical classes.
Type Ia SNe are assumed to result from the thermonuclear explosion of a degenerate white
dwarf star, reaching the critical ignition density as it approaches the Chandrasekhar limit
by accretion from, or merger with, a binary companion. Direct observational evidence shows
that all other types of SNe result from the gravitational core-collapse of young, massive stars.
These progenitors are expected to be relatively luminous, and are thus potentially detectable
1Hubble Fellow.
2Chandra Fellow.

– 3 –
in images of sufficient spatial resolution and depth obtained before these core-collapse SNe
explode.
The impact of the study of SN progenitors was poignantly illustrated by the watershed
case of SN 1987A and its blue supergiant progenitor (White & Malin 1987). Initial surprise
at the color (blue rather than red) and compactness of this progenitor led to revisions in our
understanding of massive star evolution and SN explosion physics. During the next 15 years
progress was slow, with but a single additional progenitor identified (SN 1993J; Aldering,
Humphreys, & Richmond 1994; Van Dyk et al. 2002; Maund et al. 2004). Pioneering
work by Van Dyk and collaborators (Barth et al. 1996; Van Dyk et al. 1999; Van Dyk,
Li, & Filippenko 2003a) utilized a new resource - the sensitivity and resolution afforded
by pre-explosion images obtained by the Hubble Space Telescope (HST). Several possible
progenitors have been identified, but these associations were often inconclusive due to the SN
astrometry being limited by post-explosion ground based images of relatively poor quality.
In the last few years, breakthrough results were presented by two groups (the California
group, e.g., Van Dyk et al. 2002; Van Dyk, Li, & Filippenko 2003b, Li et al. 2006, and the
UK group, e.g., Smartt et al. 2004; Hendry et al. 2006) using mostly post-explosion HST
imaging to precisely determine the location of SNe and securely identify progenitor stars in
pre-explosion HST images.
Most recently, we have introduced the use of laser guide star assisted adaptive optics
(LGS-AO) as an alternative means for precise SN localization that is independent of HST
scheduling and operations, and not subject to saturation by the brightness of a young SN
(Gal-Yam et al. 2005a,b). Here, we report the second result from our program at Keck
Observatory, the discovery of a luminous point source in pre-explosion images of the type
IIn SN 2005gl. The paper layout is as follows. In § 2 we present our observations, including
analysis of archival pre-explosion HST images of the location of this event, and our Keck
LGS-AO post-explosion observations leading to precise localization of the SN on the pre-
explosion grid. In § 3 we present the discovery of a point source consistent with being a very
luminous LBV-type progenitor of this SN. We conclude in § 4 with a discussion of our result
in the context of accumulated information about SNe IIn and all available SN progenitor
identifications to date.
– 4 –
2. Observations
2.1. Discovery and photometry
SN 2005gl was discovered on 2005 Oct. 5.18 UT by Puckett & Ceravolo, and indepen-
dently by Sano (Puckett et al. 2005). We identified this event as a type IIn SN (Blanc et al.
2005; § 2.4) using a spectrum obtained with the SNIFS spectrograph mounted on the UH
2.2m telescope (Fig. 2) on 2005 Oct. 13.5 UT. Pre-explosion imaging (Puckett et al. 2005)
places the explosion date of this SN between 2005 Sep. 10 and 2005 Oct. 5.
Unfortunately, the photometric coverage of this event is quite poor, and a light curve
in any standard filter cannot be derived from the data currently available to us. However,
we are able to extract the light curve of this object from unfiltered survey images of the
host galaxy, routinely obtained by the Katzman Automatic Imaging Telescope (KAIT; Li et
al. 2000; Filippenko et al. 2001; Filippenko 2005) at Lick observatory. We use the image-
subtraction-based photometry methods of Gal-Yam et al. (2004a) to remove the underlying
host galaxy light and measure the luminosity of this event. The unfiltered light curve has
been placed on an R-band-equivalent zeropoint, anchored to four nearby stars for which we
obtained photometric calibration with the robotic 60 inch telescope at Palomar Observatory
on July 26, 2006 UT (see Appendix). We find that SN 2005gl peaked at R ≈ 17 mag around
Oct. 20, 2006 UT. Fig. 1 shows a comparison between our light curve and those of SN 2004dh,
a typical SN II-P (Nugent et al. 2006; Gal-Yam et al. in preparation) and SN 2004ex, a
linearly-declining SN IIb (Gal-Yam et al. in preparation). As is often seen in SNe IIn, the
light curve of SN 2005gl does not show a long plateau phase similar to those of SNe II-P,
but it does declines quite slowly for ∼ 50 days, compared to other linearly-declining events
(SNe II-L/IIb). This slow decline is often attributed to emission contributed by ongoing
circumstellar shocks.
2.2. Spectroscopy
Shortly after its discovery, on 2005 Oct. 13.5 UT, we observed SN2005gl with the Su-
perNova Integral Field Spectrograph (SNIFS), a high-throughput dual-channel lenslet-based
instrument optimized for automated observation of point sources on a diffuse background
(Aldering et al. 2002). The single 1000s exposure was obtained close to zenith (secz=1.1),
and covers a fully-filled 6′′ × 6′′ field-of-view in the 3300− 10000 A extended optical domain
with a moderate spectral resolution of 2.5 A between 3300 − 5100 A and 3.4 A between
5100− 10000 A .

– 5 –
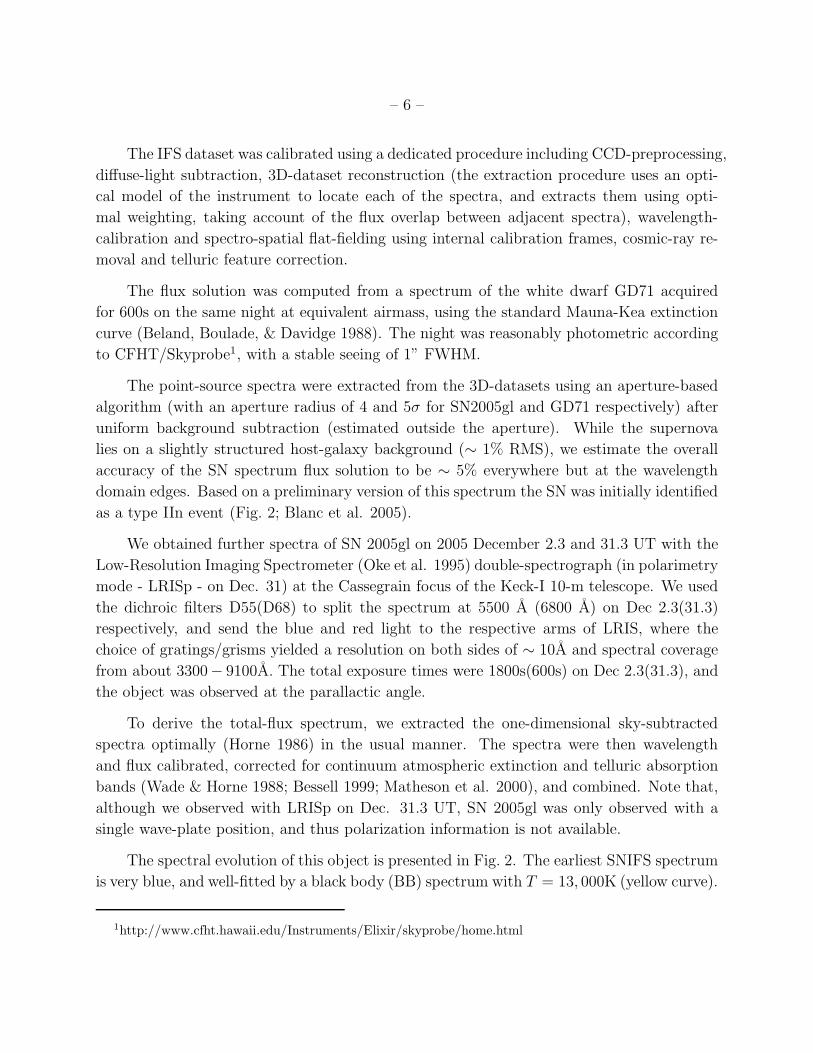
80 100 120 140 160 180 200 220 240 260
16
17
18
19
20
21
22
JD−2417000 [day]
Unf
ilter
ed m
agni
tude
[mag
]
SN 2005gl unfilteredDate of LGS observationSN 2004ex (IIb; scaled R)SN 2004dh (II−P; R−1.5)
Fig. 1.— A comparison of the scaled unfiltered KAIT light curve of SN 2005gl (blue circles)
with those of two SNe studied by the CCCP (Gal-Yam et al. 2004b; Gal-Yam et al. in
preparation). SN 2004dh is a typical SN II-P, displaying the characteristic long plateau in
its R-band light curve (magenta stars; Nugent et al. 2006; Gal-Yam et al. in preparation),
while the R-band light curve of SN 2004ex (red squares; Gal-Yam et al. in preparation)
shows a rapid linear decline, typical for SNe IIb and II-L events. The light curve of SN
2005gl is intermediate, as is often seen for SNe IIn. A possible interpretation is that the
light curve represents the combination of a rapidly declining “linear” component, similar
to those observed in other partially-stripped SNe of types IIb and II-L, augmented by an
additional contribution from long-lasting circumstellar shocks, which cause the light curve
to decline more slowly. The light curves were aligned to have approximately the same peak
date, and were arbitrarily scaled for clarity. Error bars are typically smaller than the symbol
size, and upper limits are denoted by inverted triangles.
– 6 –
The IFS dataset was calibrated using a dedicated procedure including CCD-preprocessing,
diffuse-light subtraction, 3D-dataset reconstruction (the extraction procedure uses an opti-
cal model of the instrument to locate each of the spectra, and extracts them using opti-
mal weighting, taking account of the flux overlap between adjacent spectra), wavelength-
calibration and spectro-spatial flat-fielding using internal calibration frames, cosmic-ray re-
moval and telluric feature correction.
The flux solution was computed from a spectrum of the white dwarf GD71 acquired
for 600s on the same night at equivalent airmass, using the standard Mauna-Kea extinction
curve (Beland, Boulade, & Davidge 1988). The night was reasonably photometric according
to CFHT/Skyprobe1, with a stable seeing of 1” FWHM.
The point-source spectra were extracted from the 3D-datasets using an aperture-based
algorithm (with an aperture radius of 4 and 5σ for SN2005gl and GD71 respectively) after
uniform background subtraction (estimated outside the aperture). While the supernova
lies on a slightly structured host-galaxy background (∼ 1% RMS), we estimate the overall
accuracy of the SN spectrum flux solution to be ∼ 5% everywhere but at the wavelength
domain edges. Based on a preliminary version of this spectrum the SN was initially identified
as a type IIn event (Fig. 2; Blanc et al. 2005).
We obtained further spectra of SN 2005gl on 2005 December 2.3 and 31.3 UT with the
Low-Resolution Imaging Spectrometer (Oke et al. 1995) double-spectrograph (in polarimetry
mode - LRISp - on Dec. 31) at the Cassegrain focus of the Keck-I 10-m telescope. We used
the dichroic filters D55(D68) to split the spectrum at 5500 A (6800 A) on Dec 2.3(31.3)
respectively, and send the blue and red light to the respective arms of LRIS, where the
choice of gratings/grisms yielded a resolution on both sides of ∼ 10A and spectral coverage
from about 3300− 9100A. The total exposure times were 1800s(600s) on Dec 2.3(31.3), and
the object was observed at the parallactic angle.
To derive the total-flux spectrum, we extracted the one-dimensional sky-subtracted
spectra optimally (Horne 1986) in the usual manner. The spectra were then wavelength
and flux calibrated, corrected for continuum atmospheric extinction and telluric absorption
bands (Wade & Horne 1988; Bessell 1999; Matheson et al. 2000), and combined. Note that,
although we observed with LRISp on Dec. 31.3 UT, SN 2005gl was only observed with a
single wave-plate position, and thus polarization information is not available.
The spectral evolution of this object is presented in Fig. 2. The earliest SNIFS spectrum
is very blue, and well-fitted by a black body (BB) spectrum with T = 13, 000K (yellow curve).
1http://www.cfht.hawaii.edu/Instruments/Elixir/skyprobe/home.html
– 7 –
Assuing a very hot intrinsic (unreddened) spectrum (BB with T = 5× 10⁵K; red curve) we
find that any dust reddening cannot be stronger than EB−V = 0.3(AV = 1.05) without the
resulting model spectrum (reddened BB) underpredicting the blue flux. AV = 1.05 therefore
represents a robust upper limit on the amount of possible dust extinction towards this object
(see below).
By Dec. 2, the spectrum has evolved and is now dominated by Balmer and Ca lines
with P-Cygni profiles and prominent Fe-II absorption lines near 5000A typical to type II
SNe at this age (∼ 50 days after explosion). The last spectrum (Dec. 31) is dominated by
emission lines of H and He, while absorption features are weak or have disappeared.
2.3. Pre-explosion Hubble Space Telescope observations
The host galaxy of SN 2005gl, NGC 266, was observed by HST in 1997 as part of a
program to study nearby galaxies with active nuclei (GO 6837, PI Ho). Imaging was obtained
in UV (F218W; data archive designation u3mj0101m and u3mj0102m, 900 seconds each) and
V (F547M; u3mj0103m and u3mj0104m, 200 and 160 seconds, respectively) bands using the
Wide-Field and Planetary Camera 2 (WFPC2) instrument. While the galaxy nucleus (the
target) was positioned on the PC chip, the location of SN 2005gl was fortunately placed on
wide-field chip 2 (WF2). Following the explosion of SN 2005gl in October 2005, we have
located and retrieved these data from the HST archive.
The frames were preprocessed through the standard Space Telescope Science Institute
pipeline using the latest calibrations as of 2005 Dec 24. The images were further processed
using the suite of programs designed specifically for the reduction of WFPC2 data that
are available as part of the HSTphot (Dolphin 2000) software package (version 1.1.5b; our
implementation includes all updates through 2003 May 28), following the procedure outlined
by Leonard et al. 2003. When possible, hstphot returns magnitudes in standard Johnson-
Cousins photometric bands as output. For our observations, the complete transformation to
standard V is not possible since color information is not available (i.e., I-band observations
were not taken); however, comparison of the flight-system magnitudes with standard V for
a different dataset (see below) reveals that the color-correction is generally under 0.03 mag
for most objects, so that our flight-system magnitude should be quite close to the standard
V magnitude.
We ran hstphot with option flag 14, which combines turning on local sky determination,
turning off empirically determined aperture corrections (using default values instead), and
turning off PSF-residual determination; these are the recommended settings for a galaxy well
– 8 –
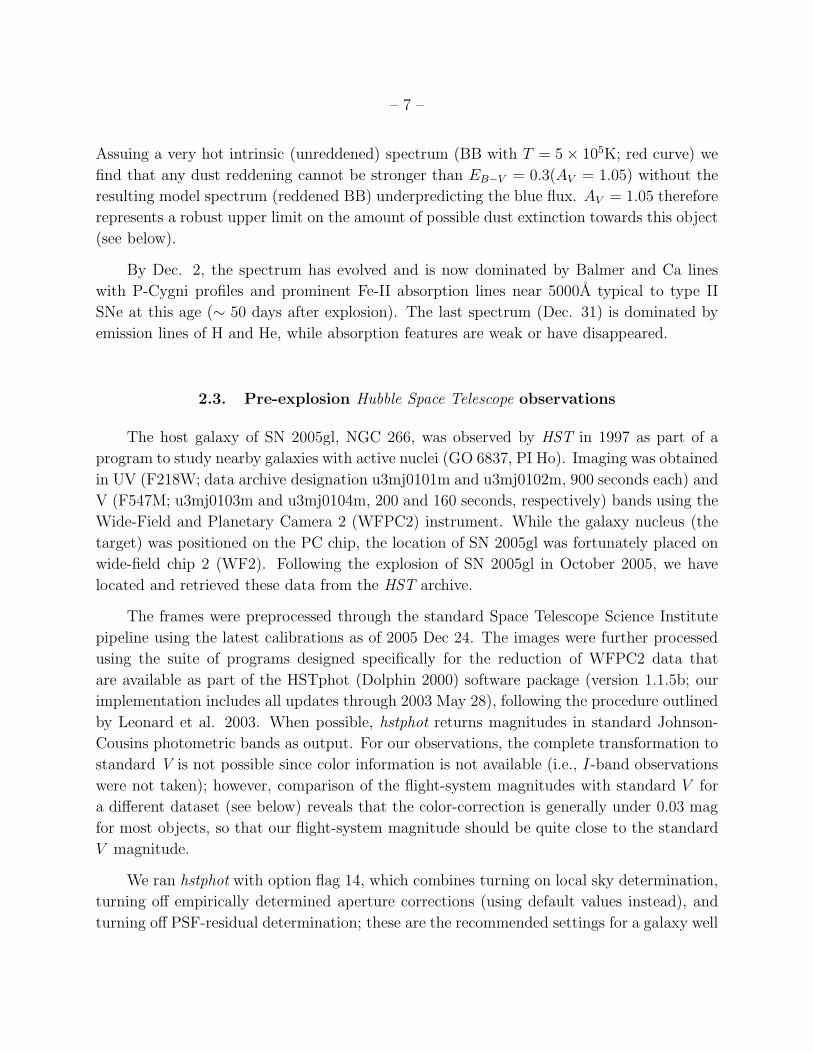
3500 4000 4500 5000 5500 6000 6500 7000 7500 8000 8500 90000
0.5
1
x 10−15
Rest Wavelength [Ang]
Fλ [e
rg s
−1 c
m−
2 Ang
−1 ]
5850 5900 59500.95
1
1.05
1.1
1.15x 10
−16
Dec 31Dec 2 (× 2)Oct 13 (× 1.2)
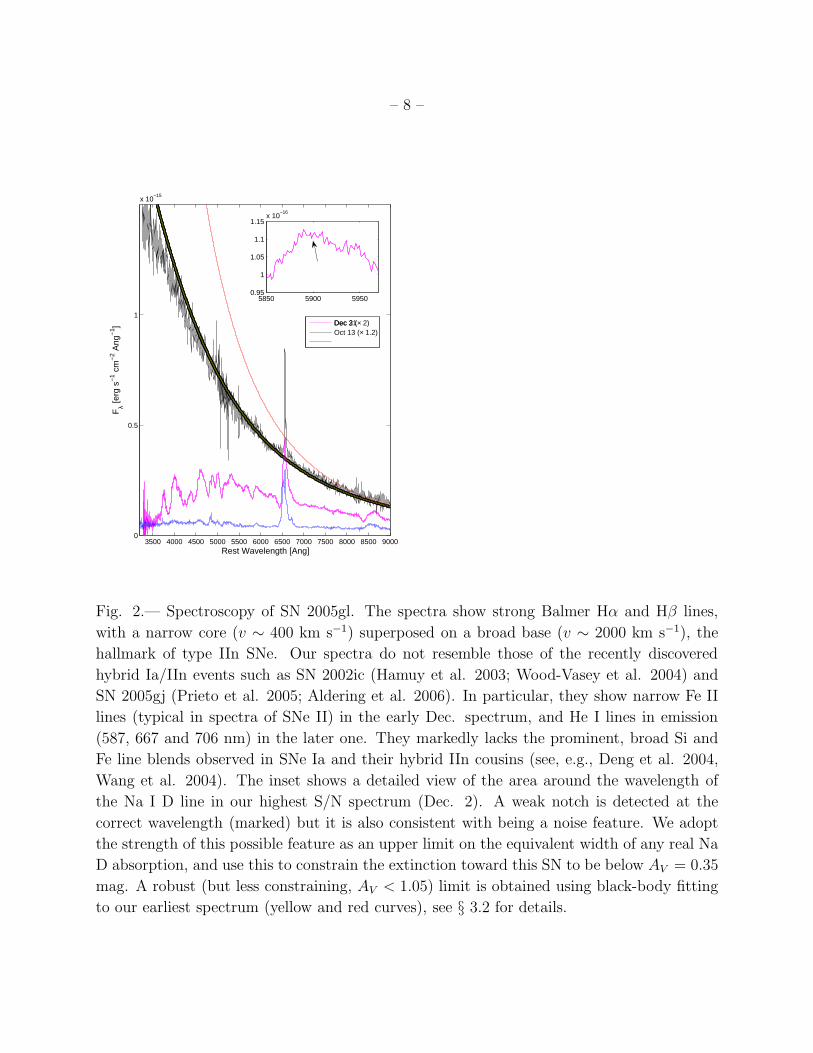
Fig. 2.— Spectroscopy of SN 2005gl. The spectra show strong Balmer Hα and Hβ lines,
with a narrow core (v ∼ 400 km s−1) superposed on a broad base (v ∼ 2000 km s−1), the
hallmark of type IIn SNe. Our spectra do not resemble those of the recently discovered
hybrid Ia/IIn events such as SN 2002ic (Hamuy et al. 2003; Wood-Vasey et al. 2004) and
SN 2005gj (Prieto et al. 2005; Aldering et al. 2006). In particular, they show narrow Fe II
lines (typical in spectra of SNe II) in the early Dec. spectrum, and He I lines in emission
(587, 667 and 706 nm) in the later one. They markedly lacks the prominent, broad Si and
Fe line blends observed in SNe Ia and their hybrid IIn cousins (see, e.g., Deng et al. 2004,
Wang et al. 2004). The inset shows a detailed view of the area around the wavelength of
the Na I D line in our highest S/N spectrum (Dec. 2). A weak notch is detected at the
correct wavelength (marked) but it is also consistent with being a noise feature. We adopt
the strength of this possible feature as an upper limit on the equivalent width of any real Na
D absorption, and use this to constrain the extinction toward this SN to be below AV = 0.35
mag. A robust (but less constraining, AV < 1.05) limit is obtained using black-body fitting
to our earliest spectrum (yellow and red curves), see § 3.2 for details.

– 9 –
beyond the Local Group. By turning off empirical aperture corrections, default values for
each filter are applied to the photometry, and are accurate, in general, to 0.02 mag. Hstphot
was run with a S/N threshold of 1.0. We identify several point sources near the location of
the SN on WF chip 1 (Fig. 3 and Table 1).
Photometry produced by HSTphot has been compared with that generated by other
packages, including DoPHOT (Schechter, Mateo, & Saha 1993) and DAOPHOT/ALLFRAME
(Stetson 1987, 1994), and the results show excellent agreement (Dolphin 2000). This is not
surprising, since most of the machinery of HSTphot, including the star-finding and PSF-
fitting algorithms, are in fact modeled after these older packages. The primary advantage of
HSTphot is that it has built-in knowledge of WFPC2 instrumental characteristics and hence
runs with far less user interaction and produces robust results that are easily reproducible
by different users.
However, as far as we are aware, no direct comparisons exist in the literature between
HSTphot and other photometry packages for WFPC2 observations using the F547M filter.
As a “sanity check” on our implementation of HSTphot, then, we reduced and analyzed
the archival HST WFPC2 data acquired for the Small Magellanic Cloud as part of a stel-
lar populations study (program GO-8196) using the F547M and F814W filters (datasets
u5ct0201r, u5ct0202r, u5ct0203r, u5ct020dr, u5ct020er, and u5ct020fr). A comparison be-
tween our hstphot V and I magnitudes with the values derived by McCumber et al. (2005)
using the IRAF task APPHOT.PHOT for a sample of stars listed in Table 8 of McCumber
et al. (2005) yields overall agreement to within 0.06 mag in both filters, building confidence
in the robustness of our results.
Table 1. Point sources near the location of SN 2005gl
# Chip position (x,y) Signal-to-noise ratio Counts Magnitude (flight system) Error (mag)
1 (56.72,157.95) 7.2 36.401 24.036 0.150
2 (53.67,157.22) 4.8 21.295 24.607 0.226
3 (58.03,161.12) 4.3 19.427 24.702 0.255
4 (55.47,162.42) 2.4 12.922 25.133 0.455
5 (61.63,156.34) 3.0 12.198 25.195 0.357
Note. — The X and Y positions reported by HSTphot follow the convention that an integer value is assigned to a star that
is centered in the lower left corner of a pixel; this is similar to the output from DoPHOT, but 0.5 lower in both X and Y than
DAOPHOT.

– 10 –
Fig. 3.— Sources near the location of SN 2005gl as seen in pre-explosion HST imaging. In
black we mark the location and apparent magnitudes of the 5 point sources identified by
HSTphot (§ 2.1 and Table 1). In blue we plot the 5σ error circle around the location of the
SN, as determined from registration of high-resolution post-explosion Keck-AO images onto
the pre-explosion HST grid (see § 3.1 and Fig. 4). A single point source is consistent with
being the progenitor of SN 2005gl. The HST image section shown in approximately 1′′ on
the side, north is up and east is to the left.
– 11 –
2.4. Keck Laser-Guide-Star assisted Adaptive Optics Observations
We observed SN2005gl on the night of 11 November 2005 UT with the wide-field channel
(plate scale 0.04′′ pixel−1) of the Near Infra-Red Camera 2 (NIRC2) operated behind the
Laser Guide Star-Assisted Adaptive Optics System (LGSAO; Wizinowich et al. 2006) on the
Keck II 10-m telescope on Mauna Kea, Hawaii. At that time (∼ 20 days after peak, Fig. 1)
we estimate the brightness of the SN was K ≈ 16 ± 0.2mag in the NIR (see Appendix
for calibration details) and R ≈ 17.5mag in the optical (Fig. 1). We observed for 25 ×
30 s in a 5-point box dither pattern through the Kp (2.1 µm) filter; the mean epoch of our
observations was 07:40 UT.
Calibration products included bias images, afternoon dome flats taken both with and
without dome-lamp illumination – to enable subtraction of the underlying thermal signature
– and a bad pixel map, initially derived from the flatfields and then refined during subsequent
analysis. After bias-subtraction and flat-fielding, the sky background of individual science
frames was estimated and used as a normalization for the purpose of calculating a single
fringe image. Note that the domination of the sky background at NIR wavelengths by bright
emission lines inevitably produces fringes, and that since fringes are an additive background
it is not strictly appropriate to derive flat fields from night sky images in the NIR.
Fringe subtraction was followed by image registration (shift and add), cosmic ray iden-
tification, refinement of the bad pixel mask, cosmic ray and bad-pixel masking, and image
combination (imcombine) managed using custom software within the Pyraf environment.
The resulting coadded image has a full-width at half maximum (FWHM) of 0.10′′ (2.6 pix-
els), with a peak signal of 8000 DN from SN2005gl, which is well below detector and ADC
(32-bit) saturation. The overall cosmetic quality of the image is not ideal, mainly because
diffuse emission from the host galaxy NGC266 was incorporated into the fringe image, caus-
ing misestimation of the sky background in individual frames, with this effect exacerbated by
the simple dither pattern. However, these defects are not expected to impact the astrometric
utility of the image, and were judged to be sufficiently negligible within the region of interest
that a more refined analysis of the data was not attempted.
3. Results
3.1. A possible luminous progenitor for SN 2005gl
We have registered the post-explosion Keck-LGS images to pre-explosion HST images
following the procedures described in Gal-Yam et al. (2005a). Briefly, the process included

– 12 –
the identification of nearby compact sources (marked in Fig. 4), detected in both images,
which are used to calculate the geometric registration solution using the task geomap within
IRAF. The final solution we obtained had an RMS residual of ∼ 0.33 pixel in X and 0.36
pixel in Y, using the 5 stars circled in black in Fig. 4. In magenta we mark 3 additional
sources that match well but were excluded from the final fit due to being too faint in one of
the images, or elongated with mismatched centers. Registration using various subsets of the
black and magenta sources yield consistent results. The small overlap area between the HST
and Keck-LGS images, and small number of available common sources, does not require or
justify high order geometric solutions, so we have solved only for a shift and scale correction
between the distortion-corrected HST and Keck-LGS frames.
The blue circle in Fig. 3 shows the 5-sigma error circle (with radius ∼ 0.06′′) around the
localization of SN 2005gl, as derived from the HST-LGS registration demonstrated in Fig. 4.
The SN location was determined using the centroiding algorithm within IRAF. The centroid-
ing error was estimated by comparing centroid positions obtained using different algorithms
and extraction apertures around the SN location, and found to be negligible compared to the
uncertainty introduced by the geometric solution. The final uncertainty reported above and
presented in Fig. 4 was calculated by adding the centroiding and registration uncertainty in
quadrature.
A single point source is consistent with the SN location. We measure a flight-system
magnitude of 24.04 ± 0.15 for this object, (statistical error only). Although we are unable
to make a formal color-correction to translate this flight-system magnitude into standard V ,
we believe this value is within 0.03 mag of the V magnitude (§ 2.1). Adding a conservative
value of 0.05 mag to the Poisson uncertainty yields a final, V -band magnitude of 24.04±0.16
mag.
Since the host is relatively distant (z = 0.015547± 0.000017, Huchra, Vogeley, & Geller
Fig. 4.— Registration of the post-explosion Kp-band Keck-LGS image (top panel) onto the
pre-explosion V -band HST image (bottom panel). 8 common nearby compact sources are
identified and outlined. The 3 sources marked in magenta were excluded from the final fits
(see text). The SN location is determined from the unsaturated Keck image using centroiding
algorithms within IRAF, and projected onto the pre-explosion HST grid using the geometric
solution. The red circle marks the 5σ error circle with the uncertainty accounting for both
the estimated centroiding and registration errors. (Removed due to arXiv limits. See JPEG
version of this figure)
– 13 –
1999, via NED2) we use Hubble’s law to calculate a distance of 66±4 Mpc (for H=70 km s−1
Mpc−1) to this galaxy, where the error is dominated by the effects of our adopted peculiar
velocity uncertainty, v = ±300 km s−1. The distance modulus is µ = 34.1±0.15 and thus the
absolute magnitude of the putative progenitor is MV = −10.3± 0.2, where we also account
for AV = 0.23 magnitudes of galactic extinction, as derived from the Schlegel, Finkbeiner
& Davis (1998) dust maps. If this is a single star, it most likely belongs to the class of
luminous blue variables (LBVs, with bolometric absolute magnitudes above M = −9.5), to
which belong all known stars of such high luminosities, including all the well-studied cases
in our Galaxy (see below). Red supergiants (RSGs; M > −9), blue supergiants (BSGs;
e.g., the progenitor of SN 1987A, M ∼ −8) and even the so-called rare “cool hypergiants”
(M > −10) are all fainter than this source (see, e.g., Humphreys & Davidson 1994; their
Fig. 9).
3.2. Caveats and future prospects
The magnitude given above is not corrected for possible extinction in NGC 266, the
host galaxy of SN 2005gl. Since objects near the SN location are detected only in a single
band in the pre-explosion image, they do not constrain the amount of extinction close to this
line of sight. However, the spectroscopy of the SN itself indicates this value is small. Our
data do not show strong Na D absorption lines (Fig. 2, inset), which are correlated with dust
extinction (see Turatto et al. 2003 for the latest compilation). The notch seen at the location
of the Na D line in our spectrum is consistent with a noise feature. Adopting its strength
as an upper limit on any real Na D absorption, the measured equivalent width (EW= 0.03
A) implies EB−V = 0 using the latest formulas from Turatto et al. (2003). As can be seen
in Fig. 3 of that work, all SNe with Na D lines weaker than EW= 0.2 A have measured
EB−V . 0.1, which we therefore adopt as a conservative upper limit on dust extinction along
this line of sight, implying AV < 0.35 mag.
Additionally, the very blue spectrum of the SN at early time argues against significant
extinction. We follow Leonard et al. (2002) in quantifying this observation in the following
manner. Fig. 2 shows that the early spectrum of SN 2005gl is well-fit by a black body
spectrum with T = 13000K (yellow curve). Also plotted is the black body curve for a source
with T = 500000K, representing the hottest intrinsic spectrum one can suggest for a SN
a few days after explosion (red curve). Reddening this putative hot spectrum using the
Cardelli, Clayton & Mathis (1989) law with R=3.08 and extinction values of EB−V > 0.3
2http://nedwww.ipac.caltech.edu/

– 14 –
results in model observed spectra that are redder (underpredict the blue flux) than our SNIFS
spectrum. We therefore conclude that EB−V = 0.3 (AV ≈ 1.05) is a robust upper limit on
the optical extinction of SN 2005gl (the likely value, as argued above, is much smaller). Note,
that such modest host extinction would drive up the magnitude of the putative progenitor
star, making an LBV identification stronger yet.
The main caveat remaining is establishing that the point source we have detected in the
pre-explosion HST imaging is the progenitor of SN 2005gl is the possibility that this source
is a compact, luminous star cluster, rather than a single star. Compact luminous clusters
with properties similar to those we measure (often called “super star clusters”, or SSCs) are
observed in very active galaxies (such as starburst or interacting galaxies). However, they
are generally rare in more normal galaxies (with but a single SSC candidate, Westerlund 1,
observed in our galaxy) and are expected to be even less frequent in earlier-type galaxies such
as NGC 266 (an Sa galaxy, Nilson 1973; via NED). The majority of massive SN progenitors
in early spirals are not found in SSCs, and thus we believe that SN 2005gl probably did not
explode in such an environment. However, this possibility cannot be ruled out at this time.
Additional HST imaging obtained once SN 2005gl declines should provide decisive evidence,
with the point source at the SN location either gone (if it was a single star) or remaining
approximately at the same magnitude, if it is indeed an SSC.
Additional support for the association between SNe IIn (such as SN 2005gl) and LBV
progenitors could arise if additional such cases are discovered. While SNe IIn are intrinsically
rare (Cappellaro et al. 1997), they tend to be over-represented in observed SN sampled due
to their high average luminosity. In addition, the luminosity of LBV progenitors makes them
visible in galaxies which are far more distant than hosts of less luminous stars. The number
of such galaxies in the HST archive is higher than the number of nearby ones (d < 20
Mpc) usually considered as likely candidates for progenitor studies, again increasing the
opportunity to test the association of SNe IIn with LBV progenitors in the future.
4. Discussion and Conclusions
4.1. SNe IIn from LBVs
We now examine the hypothesis that LBV stars explode as SN IIn. The class of type IIn
SNe is known to be a heterogeneous group of events. At least two subsets represent specific
and probably unrelated phenomena to the one we consider here, namely, the core-collapse-
driven explosion of a massive LBV star, similar, for example, to the well-known η-Carina in
our Galaxy. The first unrelated class are the so-called “SN impostors”, which are believed

– 15 –
to be super-outbursts of LBVs which do not result in total disruption of the progenitor star
(see, e.g., Van Dyk 2005 and Maund et al. 2006, and references therein). These events
are typically faint (compared to a normal SN) with absolute magnitudes between −10 and
−14 (Van Dyk 2005), while “genuine” type IIn explosions (Schlegel 1990), are much brighter
(sometime reaching M = −20; SN 2005gl has M ∼ −17). The second group of events
which are also probably irrelevant to our discussion are the recently discovered class of
“hybrid” Ia/IIn SNe, including the prototype SN 2002ic (Hamuy et al. 2003; Wood-Vasey
et al. 2004) along with its recent (SN 2005gj, Prieto et al. 2005; Aldering et al. 2006)
and past (SN 1997cy, Germany et al. 2000, Turrato et al. 2000; SN 1999E, Rigon et al.
2003) clones (Hamuy et al. 2003, Deng et al. 2004, Wang et al. 2004). These SNe display
spectral properties similar to those of thermonuclear SNe Ia, along with narrow Balmer lines
that probably result from strong interaction with circumstellar material in the immediate
vicinity of the exploding star. Such events have been suggested to be thermonuclear SNe
Ia, exploding either in close proximity to recently stripped gas from a binary companion
with intense mass loss (e.g., an AGB star, Hamuy et al. 2003); within a symbiotic system;
or perhaps thermonuclear explosion that occur while the envelope of the exploding star is
still intact (”SNe 1.5”, Iben & Renzini 1983). In any case, SN 2005gl does not share the
spectroscopic properties of these hybrid events, and does not appear to be related to this IIn
sub-class (Fig. 2). We note that both of the sub-groups discussed above comprise a minority
within the observed population of SNe IIn.
So, we can reformulate our question to be: can LBVs be the progenitors of most SN IIn
explosions? We focus on the best-studied example of an LBV in our Galaxy, η Carina. The
envelope of this star still contains large quantities of hydrogen (e.g., Davidson et al. 1986),
so, had it exploded now, it would result in a type II (H-rich) SN. In addition, we observe
the results of copious mass loss around this system, of order several solar masses of ejected
material, mostly H. Were an energetic explosion to occur at the center of such a huge debris
cloud, we would expect strong interaction leading to strong narrow H lines - the hallmark
of type IIn SNe. Thus, we conclude that an LBV exploding during the active mass-ejection
phase, or shortly thereafter, would indeed appear to distant observers as a type IIn SN.
The rates of SNe IIn may shed some light on our proposed progenitor association. Let
us consider a simplistic massive star evolutionary scheme, for single stars with approximately
solar metallicity, broadly following, e.g., Maeder and Conti (1994). We use the customary
notations RSG for red supergiants, WN for N-rich (and usually also He-rich) Wolf-Rayet
stars, WC for C-rich W-R stars, and WO for O-rich W-R stars.
80M⊙ < M < 150M⊙ : O → LBV → SNIIn(?) (1)
– 16 –
40M⊙ < M < 80M⊙ : O → LBV → WN → WC/WO → SNIc (2)
25M⊙ < M < 40M⊙ : O → LBV → (early)WN → SNIb (3)
15M⊙ < M < 25M⊙ : O → RSG → (late)WN → SNIIL/IIb (4)
8M⊙ < M < 15M⊙ : B/O → RSG → SNIIP (5)
We note that SNe IIn can, in this picture, occur in two distinct cases. First, it is believed
that massive stars undergo short LBV phases, involving rapid and strong mass loss which
transform H-rich supergiants to W-R stars, as well as during the early W-R evolution stages
(while the stars still have significant amounts of H, i.e., are WN stars; see, e.g., Maeder &
Conti 1994). Furthermore, since the evolution of the inner core is decoupled from that of the
envelope during these stages, in some cases the core might collapse during those short-lived
transition phase, resulting in SNe IIn from stars in the mass range, comparable to that of
the progenitors of SNe IIb/L and Ib/c. In this context we note the recent work by Chugai
& Chevalier (2006) interpreting the observations of SN 2001em, which exploded as a SN
Ic, and then developed strong interaction signatures (a bright radio signal accompanied by
SN IIn-like narrow Hα lines, Stockdale et al. 2004; Soderberg, Gal-Yam, & Kulkarni 2004;
Bietenholz & Bartel 2005). Models by these authors suggest that SN 2001em underwent a
violent and intense, hydrogen-rich, mass ejection episode, shortly ( <∼ 1000) years before the
SN explosion. It appears SN 2001em exploded shortly after it exited a recent LBV phase,
and a similar event, occurring slightly (on stellar evolution timescales) earlier, would appear
as a SN IIn.
The second case is a speculative option which we now describe. We hypothesize that
in the case of the most massive stars (Eq. 1) the evolution of the core might be rapid
enough to overtake the progress of envelope mass loss, and that these stars might undergo
core-collapse while in their first LBV phase, before they are significantly stripped. SNe
IIn in this case take the place of SNe Ic as the end products of the rare, most massive
stars. It is interesting to note in this context that explosion models of SNe Ic, including
the most energetic ones associated with GRBs (e.g., Deng et al. 2005; Mazzali et al. 2006)
require massive progenitors (with zero-age mass <∼ 50M⊙), but not as massive as the claimed
masses of the most extreme LBVs (> 80M⊙), e.g., η-Carina (Figer et al. 1998), LBV 1806
(Eikenberry et al. 2004) or the Pistol star (Figer et al. 1998). We note that this scenario, in
which the core evolution overtakes the envelope stripping, is not in accord with current stellar
evolution models. Still, we think it is an interesting option that merits further theoretical
and observational examination.
We note that Chugai et al. (2004) interpret their observations of the type IIn SN 1994W
as indicating that the progenitor underwent an explosive mass ejection shortly before its core

– 17 –
collapsed and led to its final explosion as a SN. This would fit well with the above picture of
SNe IIn resulting from LBVs like η-Carina (which are known to undergo extreme and violent
massive loss episodes) during or shortly after their active phase.
In either of the above cases, we expect these SNe from LBV progenitors to be rare
(either because LBVs are short-lived phases, or because the progenitors are very rare stars).
For example, the total number of stars with initial mass above 80M⊙ is ∼ 3% of the total
core-collapse progenitor population (8M⊙ < M < 150M⊙) for a Salpeter (1955) initial mass
function. This is similar to the estimated fraction of SNe IIn of the total core-collapse
population (∼ 2%, Cappellaro et al. 1997). We conclude that the notion that some or
most of SNe IIn result from explosions of LBVs appears broadly consistent with available
observational data.
4.2. SN 2005gl in context: The SN-Progenitor map
In Fig. 5 we summarize the accumulated knowledge from direct observations of SN
progenitor stars in the form of a progenitor-SN map. As possible progenitor classes we
consider red and blue supergiants (RSGs and BSGs), LBVs, early (He rich) and late (C/O
rich) Wolf-Rayet (W-R) stars, and massive binaries. On the SN side we list all the major
well-defined sub-classes of core-collapse SNe. Among the H-rich type II subclasses, SNe II-P
have extended plateau optical light curves, while SN 1987A-like events are fainter and have
a late hump-like peak in their optical light curves. SNe IIn (excluding the specific subsets
described in § 4.1 above) generally have blue and rather featureless spectra with Balmer
emission-line profiles which include a narrow component (< 1000 km s−1) and are often
very luminous in the optical, consistent with a strong contribution from shocked CSM. The
transition class of SNe IIL/IIb have rapidly declining light curves and often display strong
He lines, developing into events with spectra similar to SNe Ib (see below). Of the H-poor
type I SNe, type Ib events are dominated by He lines, while type Ic lack both H and He and
are dominated by intermediate-mass elements such as O, Mg, Si and Ca. It must be stressed
that this is, by necessity, a simplified presentation of the core-collapse SN “zoo”, and that
many peculiar objects which do not strictly fit into this picture, or transition objects that are
either intermediate or evolve between classes, are known. Still, this scheme should include
the majority of observed objects.
We suggest this is a useful tool to present and discuss this topic. Of course, we have
no guaranties that this map is complete (perhaps more progenitor classes or SN types are
required) nor that it is a 1-to-1 mapping. Most likely this version will evolve and change.
Let us use it for the time being as a basis for discussion. We note that the association of
– 18 –
type II-P SNe with low-mass RSG progenitors is well-supported by 4 observed events, with
no counter examples, and maintain this association is now progressing from suggestive to
robust (including also numerous supporting upper limits; Smartt et al. 2006). Studies of
the (H and He-poor) type Ic SN 2004gt (Gal-Yam et al. 2005; Maund et al. 2005) and
to a lesser degree SN 2002ap (Smartt et al. 2002) suggest these had highly evolved (i.e.,
optically less-luminous) W-R progenitors, perhaps of the WC or WO subclasses. This may
fit well with the population of less-evolved W-R stars (late WN) exploding as He-rich type
Ib events, consistent with recent explosion models by Tominaga et al. (2005). This picture
is consistent with that expected from stellar evolution theory. The case of the transition
class of type IIb objects (which evolve from having H-dominated type II spectra toward the
He-dominated type Ib class) is less clear. Observations of the prototypical event SN 1993J
in M81 suggest a possible massive binary progenitor (Aldering et al. 1994; Van Dyk et al.
2002; Smartt et al. 2004) with some support from the recent work on SN 2001ig (Ryder et
al. 2004; 2006). However, it is unclear whether the nearby putative binaries were indeed
physically important or even bound to the SN progenitors, or perhaps (some) SNe IIb arise
from single WN (H rich) W-R stars (Soderberg et al. 2005).
Finally, we note that type IIn events, which show evidence for intense interaction with
circumstellar material, suggesting heavy mass-loss from the progenitor, appear to require a
different progenitor from those so far discussed. Red supergiants have little mass loss, and
so had the blue supergiant progenitor of SN 1987A. While LBVs are not the only option,
they provide an elegant solution, as discussed above. It would appear that our putative
map now encompasses all main SN types. Of course, more data are required to establish
a robust mapping, and we would like each line to be supported by several progenitor-SN
associations (as is the case for SNe II-P and red supergiants). Additional cases may also
allow an attempt to understand the effects of other parameters (beyond initial mass) such
as metallicity, rotation and binarity.
4.3. Conclusions
We have identified a luminous point source in pre-explosion images of the location of
the typical type IIn SN 2005gl. If this was a single star it was most likely an LBV, based
on luminosity considerations. We have discussed a major caveat - the possibility that this
point-like source is actually a compact luminous cluster - and ways by which this progenitor
identification can be tested by future observations. We suggest that an association of SNe IIn
with LBV progenitors accommodates much of what is currently known about both LBVs
and SNe IIn. We introduce the progenitor-SN map and use it as a basis to discuss our

– 19 –
Fig. 5.— The progenitor-SN map, presenting associations of SNe with progenitor stars
based on direct observations of the progenitors in pre-explosion images. The association of
the most common type of core-collapse events, SNe II-P, with (relatively) low-mass (8M⊙ <
M < 15M⊙) red supergiants (RSGs) appears to be quite robust. The connections between
fainter SN II events (1987A-like) and the type IIn sub-class, with blue supergiants and
LBVs, respectively, is but suggestive, based on a single event in each case. The progenitors
of stripped-envelope events (type Ib/c) are yet to be observed, but analysis of available
upper limits suggest that the progenitors of the more highly stripped (type Ic) SNe are more
evolved (and less luminous) “early” W-R stars, while SNe Ib, which still retain much of their
He envelope, result from somewhat less evolved (and often more luminous) “late” W-R stars.
Data used are from White & Malin 1987; Aldering et al. 1994; Van Dyk et al. 2002; Maund
et al. 2004; Smartt et al. 2004; Van Dyk et al. 2003b; Li et al. 2005; Maund et al. 2005a; Li
et al. 2006; Hendry et al. 2006; Gal-Yam et al. 2005a; Maund et al. 2005b; and this work.

– 20 –
finding. This field has rapidly progressed in recent years and should evolve from a collection
of isolated fragmented pieces of information to become based on more solid concepts (such as
the progenitor-SN map). These should soon begin to provide useful constraints on models,
and drive additional progress in understanding the last stages of massive star evolution and
the physics of SNe.
Acknowledgments
We are grateful to V. Dwarkadas, R. de Grijs, D. Maoz, P. Nugent, E. O. Ofek, S. Smartt
and N. Smith for useful advice. K. Dawson and K. Barbary are thanked for assistance with
LRIS observations at Keck. This research has made use of the NASA/IPAC Extragalactic
Database (NED) which is operated by the Jet Propulsion Laboratory, California Institute of
Technology, under contract with the National Aeronautics and Space Administration. A.G.
acknowledges support by NASA through Hubble Fellowship grant #HST-HF-01158.01-A
awarded by STScI, which is operated by AURA, Inc., for NASA, under contract NAS 5-
26555. A.G. further acknowledges the hospitality of the community of Cefalu and the efforts
of the organizers of the 2006 Cefalu international astronomy conference, during which this
work has come to fruition. D.C.L. acknowledges support from an NSF Astronomy and As-
trophysics Postdoctoral Fellowship (award AST-0401479), under which part of this work
was completed. D.J.S. acknowledges support provided by NASA through Chandra Postdoc-
toral Fellowship grant number PF5-60041. The work of A.V.F.’s group at UC Berkeley is
supported by National Science Foundation (NSF) grant AST-0307894, as well as by NASA
grant AR-10690 from the Space Telescope Science Institute, which is operated by AURA,
Inc., under NASA contract NAS5-26555. KAIT and its ongoing research were made possible
by generous donations from Sun Microsystems, Inc., the Hewlett-Packard Company, Auto-
Scope Corporation, Lick Observatory, NSF, the University of California, the Sylvia & Jim
Katzman Foundation, and the TABASGO Foundation. This work was supported in part
by the Director, Office of Science, Office of High Energy and Nuclear Physics, of the U.S.
Department of Energy under Contracts No. DE-FG02-92ER40704, with additional support
from the Gordon & Betty Moore Foundation and the CNRS/IN2P3, CNRS/INSU and PNC
agencies in France.
REFERENCES
Aldering, G., Humphreys, R. M., & Richmond, M. 1994, AJ, 107, 662
Aldering, G., et al. 2002, Proc. SPIE, 4836, 61

– 21 –
The Nearby Supernova Factory Collaboration: G. Aldering, et al. 2006, ApJ, in press, ArXiv
Astrophysics e-prints, arXiv:astro-ph/0606499
Barth, A. J., van Dyk, S. D., Filippenko, A. V., Leibundgut, B., & Richmond, M. W. 1996,
AJ, 111, 2047
Beland, S., Boulade, O., & Davidge, T. 1988, Bulletin d’information du telescope Canada-
France-Hawaii, 19, 16
Bessell, M. S. 1999, PASP, 111, 1426
Bietenholz, M. F., & Bartel, N. 2005, ApJ, 625, L99
Blanc, N., et al. 2005, The Astronomer’s Telegram, 630, 1
Cappellaro, E., Turatto, M., Tsvetkov, D. Y., Bartunov, O. S., Pollas, C., Evans, R., &
Hamuy, M. 1997, A&A, 322, 431
Cardelli, J. A., Clayton, G. C., & Mathis, J. S. 1989, ApJ, 345, 245
Chugai, N. N., et al. 2004, MNRAS, 352, 1213
Chugai, N. N., & Chevalier, R. A. 2006, ApJ, 641, 1051
Davidson, K., Dufour, R. J., Walborn, N. R., & Gull, T. R. 1986, ApJ, 305, 867
Deng, J., et al. 2004, ApJ, 605, L37
Deng, J., Tominaga, N., Mazzali, P. A., Maeda, K., & Nomoto, K. 2005, ApJ, 624, 898
Dolphin, A. E. 2000, PASP, 112, 1383
Eikenberry, S. S., et al. 2004, ApJ, 616, 506
Figer, D. F., Najarro, F., Morris, M., McLean, I. S., Geballe, T. R., Ghez, A. M., & Langer,
N. 1998, ApJ, 506, 384
Filippenko, A. V. 2005, in The Fate of the Most Massive Stars, ed. R. Humphreys and K.
Stanek (San Francisco: ASP), 34
Filippenko, A. V., Li, W., Treffers, R. R., & Modjaz, M. 2001, in Small-Telescope Astronomy
on Global Scales, ed. W.-P. Chen, C. Lemme, & B. Paczynski (San Francisco: ASP),
121
Gal-Yam, A., et al. 2004a, ApJ, 609, L59

– 22 –
Gal-Yam, A., Cenko, S. B., Fox, D. W., Leonard, D. C., Moon, D.-S., Sand, D. J., &
Soderberg, A. M. 2004b, Bulletin of the American Astronomical Society, 36, 1408
Gal-Yam, A., et al. 2005a, ApJ, 630, L29
Gal-Yam, A., et al. 2005b, American Astronomical Society Meeting Abstracts, 207, #78.01
Germany, L. M., Reiss, D. J., Sadler, E. M., Schmidt, B. P., & Stubbs, C. W. 2000, ApJ,
533, 320
Hamuy, M., et al. 2003, Nature, 424, 651
Hendry, M. A., et al. 2006, MNRAS, 529
Horne, K. 1986, PASP, 98, 609
Huchra, J. P., Vogeley, M. S., & Geller, M. J. 1999, ApJS, 121, 287
Humphreys, R. M., & Davidson, K. 1994, PASP, 106, 1025
Iben, I., & Renzini, A., 1983, ARA&A, 21, 271
Krist, J. 1995, ASP Conf. Ser. 77: Astronomical Data Analysis Software and Systems IV,
77, 349
Leonard, D. C., et al. 2002, AJ, 124, 2490
Leonard, D. C., Kanbur, S. M., Ngeow, C. C., & Tanvir, N. R. 2003, ApJ, 594, 247 bibitem
Li, W., et al. 2000, in Cosmic Explosions, ed. S. S. Holt & W. W. Zhang (New York:
AIP), 103
Li, W., Van Dyk, S. D., Filippenko, A. V., & Cuillandre, J.-C. 2005, PASP, 117, 121
Li, W., Van Dyk, S. D., Filippenko, A. V., Cuillandre, J.-C., Jha, S., Bloom, J. S., Riess,
A. G., & Livio, M. 2006, ApJ, 641, 1060
Maeder, A., & Conti, P. S. 1994, ARA&A, 32, 227
Matheson, T., Filippenko, A. V., Ho, L. C., Barth, A. J., & Leonard, D. C. 2000, AJ, 120,
1499
Maund, J. R., Smartt, S. J., Kudritzki, R. P., Podsiadlowski, P., & Gilmore, G. F. 2004,
Nature, 427, 129
Maund, J. R., Smartt, S. J., & Danziger, I. J. 2005a, MNRAS, 364, L33

– 23 –
Maund, J. R., Smartt, S. J., & Schweizer, F. 2005b, ApJ, 630, L33
Maund, J. R., et al. 2006, MNRAS, 369, 390
Mazzali, P. A., et al. 2006, ArXiv Astrophysics e-prints, arXiv:astro-ph/0603516
McCumber, M. P., Garnett, D. R., & Dufour, R. J. 2005, AJ, 130, 1083
Nilson, P. 1973, the Uppsala General Catalogue of Galaxies, Nova Acta Regiae Soc. Sci. Up-
saliensis Ser. V, 0
Nugent, P., et al. 2006, ApJ, 645, 841
Oke, J. B., et al. 1995, PASP, 107, 375
Puckett, T., George, D., Ceravolo, P., Nakano, S., Sano, Y., Kushida, Y., & Kushida, R.
2005, IAU Circ., 8615, 1
Prieto, J., Garnavich, P., Depoy, D., Marshall, J., Eastman, J., & Frank, S. 2005, IAU Circ.,
8633, 1
Rigon, L., et al. 2003, MNRAS, 340, 191
Ryder, S. D., Sadler, E. M., Subrahmanyan, R., Weiler, K. W., Panagia, N., & Stockdale,
C. 2004, MNRAS, 349, 1093
Ryder, S. D., Murrowood, C. E., & Stathakis, R. A. 2006, MNRAS, 369, L32
Salpeter, E. E. 1955, ApJ, 121, 161
Schechter, P. L., Mateo, M., & Saha, A. 1993, PASP, 105, 1342
Schlegel, E. M. 1990, MNRAS, 244, 269
Schlegel, D. J., Finkbeiner, D. P., & Davis, M. 1998, ApJ, 500, 525
Smartt, S. J., Vreeswijk, P. M., Ramirez-Ruiz, E., Gilmore, G. F., Meikle, W. P. S., Ferguson,
A. M. N., & Knapen, J. H. 2002, ApJ, 572, L147
Smartt, S. J., Maund, J. R., Hendry, M. A., Tout, C. A., Gilmore, G. F., Mattila, S., &
Benn, C. R. 2004, Science, 303, 499
Smartt S. J., et al. 2006, in Massive stars: From PopIII and GRBs to the Milky Way, STScI
May 2006 (Cambridge: Cam. Univ. Press)

– 24 –
Soderberg, A. M., Gal-Yam, A., & Kulkarni, S. R. 2004, GRB Coordinates Network, 2586,
1
Soderberg, A. M., Chevalier, R. A., Kulkarni, S. R., & Frail, D. A. 2005, ArXiv Astrophysics
e-prints, arXiv:astro-ph/0512413
Stetson, P. B. 1987, PASP, 99, 191
Stetson, P. B. 1994, PASP, 106, 250
Stockdale, C. J., Van Dyk, S. D., Sramek, R. A., Weiler, K. W., Panagia, N., Rupen, M. P.,
& Paczynski, B. 2004, IAU Circ., 8282, 2
Tominaga, N., et al. 2005, ApJ, 633, L97
Turatto, M., et al. 2000, ApJ, 534, L57
Turatto, M., Benetti, S., & Cappellaro, E. 2003, in “From Twilight to Highlight: The
Physics of Supernovae”, ESO ASTROPHYSICS SYMPOSIA, Eds. W. Hillebrandt &
B. Leibundgut, Springer-Verlag, p. 200
Van Dyk, S. D., Peng, C. Y., Barth, A. J., & Filippenko, A. V. 1999, AJ, 118, 2331
Van Dyk, S. D., Garnavich, P. M., Filippenko, A. V., Hoflich, P., Kirshner, R. P., Kurucz,
R. L., & Challis, P. 2002, PASP, 114, 1322
Van Dyk, S. D., Li, W., & Filippenko, A. V. 2003a, PASP, 115, 1
Van Dyk, S. D., Li, W., & Filippenko, A. V. 2003b, PASP, 115, 1289
van Dyk, S. D. 2005, ASP Conf. Ser. 332: The Fate of the Most Massive Stars, 332, 47
Wade, R. A. & Horne, K. 1988, ApJ, 324, 411
Wang, L., Baade, D., Hoflich, P., Wheeler, J. C., Kawabata, K., & Nomoto, K. 2004, ApJ,
604, L53
White, G. L., & Malin, D. F. 1987, Nature, 327, 36
Wizinowich, P. L., et al. 2006, PASP, 118, 297
Wood-Vasey, W. M., Wang, L., & Aldering, G. 2004, ApJ, 616, 339
This preprint was prepared with the AAS LATEX macros v5.2.

– 25 –
Appendix: photometric calibrations
We calibrated the field of SN 2005gl in V R using observations of Landolt (1992) standard
fields (PG 1657+078, PG 0231+051 and SA 95) obtained with the robotic 60 inch telescope
at Palomar Observatory on the night of July 25, 2006. The IRAF procedure meastan by D.
Maoz was used to calculate photometric solutions, which are well-behaved, indicating the
night was probably photometric. The overall zeropoint calibration error is ∼ 5%. Table 2
and Fig. 6 report the locations and magnitudes of stars near the SN location.
The following equations were used to calculate the calibrated magnitudes:
R = −2.5× log(counts/s) + 22.112− airmass× 0.136− (V −R)× 0.065 (6)
V = −2.5× log(counts/s) + 21.952− airmass× 0.222 + (V −R)× 0.023 (7)
We calibrated the Kp-band magnitude of SN 2005gl in our NIRC2 LGS image by boot-
strap calibration, based on two common objects detected in the deep and narrow NIRC2
image and in a wider, more shallow Ks-band image of the area obtained with the Wide-field
Infra Red Camera (WIRC) mounted on the 200 inch Hale telescope at Palomar Observa-
tory on July 20, 2006 (UT). The WIRC image was reduced using the CCCP IR pipeline, in
a similar manner to that described above for the NIRC2 data, and calibrated against the
2MASS catalog using the methods described, e.g., in Gal-Yam et al. (2005a).
Fig. 6.— Field calibration. Nine stars close to the host galaxy of SN 2005gl, NGC 266, with
magnitudes list in Table 2 are circled. Only stars 2,5,6 and 7 appeared in the smaller KAIT
field of view and were used to derive the light curve of this object. (Removed due to arXiv
limits. See JPEG version of this figure)

– 26 –
Table 2. Calibration stars near SN 2005gl
Star # R.A. (2000) Declination V [mag] R [mag]
1 00:49:57.24 +32:18:53.1 15.57 15.36
2 00:49:52.45 +32:18:43.4 16.51 16.39
3 00:49:43.61 +32:19:01.0 14.40 14.26
4 00:49:43.74 +32:18:48.0 14.76 15.02
5 00:49:44.32 +32:18:10.0 15.43 15.23
6 00:49:36.00 +32:18:01.6 17.02 17.06
7 00:49:40.69 +32:14:20.7 16.53 16.75
8 00:49:59.84 +32:14:23.0 15.81 15.64
9 00:49:59.21 +32:16:57.4 17.56 18.44
This figure "f4.jpg" is available in "jpg" format from:
http://arxiv.org/ps/astro-ph/0608029v1

This figure "f6.jpg" is available in "jpg" format from:
http://arxiv.org/ps/astro-ph/0608029v1