
On the Water Electrolysis with Photovoltaic Solar Energy...
14
World Journal of Applied Chemistry 2017; 2(2): 34-47 http://www.sciencepublishinggroup.com/j/wjac doi: 10.11648/j.wjac.20170202.11 On the Water Electrolysis with Photovoltaic Solar Energy for Hydrogen Production A. Benghnia * , B. Nabil, R. Ben Slama, B. Chaouachi Research Unit: Environment Catalyzes and Process Analysis, National School of Engineers of Gabes (ENIG), University of Gabes, Gabes, Tunisia Email address: [email protected] (B. Afef) * Corresponding author To cite this article: A. Benghnia, B. Nabil, R. Ben Slama, B. Chaouachi. On the Water Electrolysis with Photovoltaic Solar Energy for Hydrogen Production. World Journal of Applied Chemistry. Vol. 2, No. 2, 2017, pp. 34-47. doi: 10.11648/j.wjac.20170202.11 Received: October 31, 2016; Accepted: December 29, 2016; Published: March 10, 2017 Abstract: In this paper we investigated the parameters determining the performance of hydrogen production by using the solar water electrolysis system (SWES), without the need of high additional electrical energy. The electrolyte after and before using in solar electrolysis was described to understand the mechanism responsible on the hydrogen production enhancement. Additionally, the employed electrolyte (deposit) was characterized by FT-IR, UV-visible and electrochemical impedance spectroscopy. As results the salt addition can obtained 40% more hydrogen efficiency. Also the pH values that varied between 3 to 6 and 8.5 to 12 could further improve hydrogen yield. The deposit provided a discriminate environment which is proposed to be responsible for the hydrogen production improvement. In addition, hydroxyl ions are mainly transported through the exchange anion, to maintain charge neutrality, and thus the anode and cathode electrode resulting in a low transport resistance. This can be assumed that the proton transport facilitated by water permeation can lower the transport resistance, and consequently increase hydrogen production. Keywords: Solar Electrolysis, Hydrogen Production, Deposit, Electrochemical Impedance Spectroscopy 1. Introduction These days, there is a great concern regarding the depletion of fossil oil reserves and the pollution caused by the growing demand for energy generation. In this way, a large-scale substitution of petroleum-based fuels as well as improved efficiency in energy conversion is required. In this context, fuel cells for mobile and stationary applications are highly valued due to their high theoretical efficiency and only steam as by product [1, 2]. Hydrogen is widely recognized as an alternative portable energy medium to fossil fuels. It can be utilized for road transport applications presenting high energy efficiencies in combination with a proton exchange membrane fuel cell with zero emissions at the point of use [3]. Despite the vast potential of the use of hydrogen as an energy vector in the so-called hydrogen economy, its widespread implementation is currently limited by the capacity limitations of current hydrogen storage technologies and by the safety issues associated with its storage and transportation [3, 4]. Although the water splitting process used to simultaneously generate hydrogen and oxygen has been demonstrated by the utilization, the technology is not mature enough to bring it to demonstration level. Much fundamental research remains to be done [5]. A long sought goal of energy research has been the search for a method to produce hydrogen fuel economically by splitting water using sunlight as the primary energy source. One of the main domains of solar energy research concerns the development of a process for the production of solar fuels. Among the solar fuel candidates, hydrogen holds a pre-eminent position because of its high energy content, environmental compatibility and ease of storage and distribution. The different approaches for splitting water have been summarized by Bockris as follows: electrolysis, plasmolysis, magnetolysis, thermal approach (direct, catalytic and cyclic decomposition of water, as well as magmalysis), use of light (photosensitized decomposition using dyes, plasmainduced photolysis, photoelectrolysis, photo-aided electrolysis, the indirect path towards hydrogen by photoelectrolysis: the photoelectrochemical reduction of CO 2 and photovoltaic electrolysis), biocatalytic
Transcript of On the Water Electrolysis with Photovoltaic Solar Energy...

World Journal of Applied Chemistry 2017; 2(2): 34-47
http://www.sciencepublishinggroup.com/j/wjac
doi: 10.11648/j.wjac.20170202.11
On the Water Electrolysis with Photovoltaic Solar Energy for Hydrogen Production
A. Benghnia*, B. Nabil, R. Ben Slama, B. Chaouachi
Research Unit: Environment Catalyzes and Process Analysis, National School of Engineers of Gabes (ENIG), University of Gabes, Gabes,
Tunisia
Email address: [email protected] (B. Afef) *Corresponding author
To cite this article: A. Benghnia, B. Nabil, R. Ben Slama, B. Chaouachi. On the Water Electrolysis with Photovoltaic Solar Energy for Hydrogen Production.
World Journal of Applied Chemistry. Vol. 2, No. 2, 2017, pp. 34-47. doi: 10.11648/j.wjac.20170202.11
Received: October 31, 2016; Accepted: December 29, 2016; Published: March 10, 2017
Abstract: In this paper we investigated the parameters determining the performance of hydrogen production by using the
solar water electrolysis system (SWES), without the need of high additional electrical energy. The electrolyte after and before
using in solar electrolysis was described to understand the mechanism responsible on the hydrogen production enhancement.
Additionally, the employed electrolyte (deposit) was characterized by FT-IR, UV-visible and electrochemical impedance
spectroscopy. As results the salt addition can obtained 40% more hydrogen efficiency. Also the pH values that varied between
3 to 6 and 8.5 to 12 could further improve hydrogen yield. The deposit provided a discriminate environment which is proposed
to be responsible for the hydrogen production improvement. In addition, hydroxyl ions are mainly transported through the
exchange anion, to maintain charge neutrality, and thus the anode and cathode electrode resulting in a low transport resistance.
This can be assumed that the proton transport facilitated by water permeation can lower the transport resistance, and
consequently increase hydrogen production.
Keywords: Solar Electrolysis, Hydrogen Production, Deposit, Electrochemical Impedance Spectroscopy
1. Introduction
These days, there is a great concern regarding the
depletion of fossil oil reserves and the pollution caused by
the growing demand for energy generation. In this way, a
large-scale substitution of petroleum-based fuels as well as
improved efficiency in energy conversion is required. In this
context, fuel cells for mobile and stationary applications are
highly valued due to their high theoretical efficiency and
only steam as by product [1, 2].
Hydrogen is widely recognized as an alternative portable
energy medium to fossil fuels. It can be utilized for road
transport applications presenting high energy efficiencies in
combination with a proton exchange membrane fuel cell with
zero emissions at the point of use [3]. Despite the vast
potential of the use of hydrogen as an energy vector in the
so-called hydrogen economy, its widespread implementation
is currently limited by the capacity limitations of current
hydrogen storage technologies and by the safety issues
associated with its storage and transportation [3, 4].
Although the water splitting process used to
simultaneously generate hydrogen and oxygen has been
demonstrated by the utilization, the technology is not mature
enough to bring it to demonstration level. Much fundamental
research remains to be done [5]. A long sought goal of
energy research has been the search for a method to produce
hydrogen fuel economically by splitting water using sunlight
as the primary energy source. One of the main domains of
solar energy research concerns the development of a process
for the production of solar fuels. Among the solar fuel
candidates, hydrogen holds a pre-eminent position because of
its high energy content, environmental compatibility and ease
of storage and distribution. The different approaches for
splitting water have been summarized by Bockris as follows:
electrolysis, plasmolysis, magnetolysis, thermal approach
(direct, catalytic and cyclic decomposition of water, as well
as magmalysis), use of light (photosensitized decomposition
using dyes, plasmainduced photolysis, photoelectrolysis,
photo-aided electrolysis, the indirect path towards hydrogen
by photoelectrolysis: the photoelectrochemical reduction of
CO2 and photovoltaic electrolysis), biocatalytic

35 A. Benghnia et al.: On the Water Electrolysis with Photovoltaic Solar Energy for Hydrogen Production
decomposition of water, radiolysis and other approaches [6].
Hydrogen is used as a fuel and in the future, the role of
hydrogen may become more important, as some researchers
suggest that the world’s energy systems may undergo a
transition to an era in which the main energy carriers are
hydrogen and electricity [7, 8]. The production of hydrogen
has been identified as in need of substantial research [9].
The status of research, development and demonstration of
energetic solar hydrogen systems and their components were
presented, including both scientific and technical aspects.
Solar hydrogen is a clean energy carrier. Electrolytic
hydrogen is made from water and becomes water again.
Hydrogen obtained from solar energy (solar hydrogen) is
ecologically responsible along its entire energy conversion
chain. At only one link of the chain can a pollutant, nitrogen
oxide, arise; and this occurs only if the hydrogen is not
recombined with pure oxygen, but using air as an oxidant,
such as in reciprocating piston engines or gas turbines on
board automobiles or aircraft.
In this field, water electrolysis is one of the most important
industrial processes for hydrogen production today, and is
expected to become even more important in the future. As
example, solar water electrolysis system (SWES) is an
emerging “green” technology for hydrogen production from
various types of waste materials, such as wastewater and
other renewable resources. Electrons travel through external
circuit to the cathode where H2 is produced using protons in
the solution. In order to produce hydrogen at the cathode
from the combination of these protons and electrons, SWES
require an externally supplied voltage under an assisted
condition of pH, temperature, and pressure. However, SWES
require relatively low energy input (1.23 e 1.8 V). Recently,
a significant number of researchers have reported that the
performance of water electrolysis is greatly influenced by
several factors, such as initial pH, temperature [10, 11],
electrolyte solution [12-15], substrates and anode surface
area [16-18], electrode materials and electrode spacing [19,
20], cell internal and external resistance [21-24], and
activated sludge concentration [25]. This is done by the input
of a voltage via a solar power supply. It was then confirmed
that the water permeation across the membrane induced by
the osmotic pressure difference between the anode and
cathode chambers, can expedite proton transport into the
cathode chamber, thereby decreasing the pH imbalance.
On the other hand, the internal resistance, which consists
of ohmic, charge transfer, and mass transfer resistances,
increases the required voltage to be applied and inhibits
performance in bioelectrochemical systems [26]. Because the
internal resistance is an intrinsic property, it cannot be
removed though it can be reduced depending on the
membrane types [27]. Unfavorable ionic transport across the
membrane can result in a high transport resistance, and
ultimately decreasing the hydrogen production rate in [28].
Furthermore, [29] reported that hydrogen production can be
enhanced by exchanging a cation exchange membrane for an
anion exchange membrane due to the decrease in internal
resistance [29]. Hydroxyl ions are mainly transported
through the anion exchange membrane, to maintain charge
neutrality, resulting in a low transport resistance [30, 31].
Indeed, it can be assumed that the proton transport facilitated
by water permeation can lower the transport resistance, and
consequently increase hydrogen production.
Of these factors, cathode material type with the high
performance is the most important factor in the performance
of water electrolysis where H2 as well as other value-added
chemical compounds are produced. According to a number
of studies, noble metals such as platinum (Pt), copper (Cu),
aluminum (Al) are typically used as cathode in water
electrolysis studies.
The focus of this study was to quantify the characteristics of
the photovoltaic panel (PV) and the electrolyzer in order to
improve the hydrogen production. Different factors are
affected, which are going to be discussed in the following
sections of this paper. In addition, requirements for successful
hydrogen production can therefore be summarized as follows;
create the environmental conditions for the formation of
produced hydrogen, discuss the change between pH after and
before H2 production and characterize the deposit electrolysis
for the development of hydrogen producing organisms.
For this work, we used an integrated photovoltaic pane
(PV) and electrolyzer design to emulate a solar water
electrolysis system (SWES). Also, these integrated systems
allow us to study the issues involving the effects of current
density, solar intensity variability, and salt concentration on
the overall efficiency for hydrogen production.
2. Methods and Materials
2.1. Electrolyzer Description and Operation
A large single-chamber (1000mL) was used to carry out
the experiments. A copper fiber was used as anode (4.8m2)
and a cathode (4.8m2) was made with aluminum. The
electrode spacing was 30 mm between the anode/cathode
electrodes, and a rubber gasket installed with the membrane
to allow it to be tightened.
Both electrodes were arranged concentrically with the
cathode in the outer perimeter, so that all ends of the anode
were at the same distance from the cathode. The electrolyzer
operated in batch mode, with constant agitation and an
applied potential of 1.2 V between anode and cathode. The
medium used (for different pH values and salt concentration)
was operated with the addition of H2SO4, NaCl and NaOH
(Sigma-Aldrich, USA). Afterwards, the electrolyte was
placed on the electrolyzer to produce the gas like hydrogen.
The photovoltaic panel (PV) was the basic unit that
converts light energy into electrical energy. The PV is
formed by 36 polycrystalline silicon cells, supplying a
current and voltage of 3.4 and L5V respectively. In order to
improve the resources (adapting the desired voltage), the
used PV was protected by regulators and converters Figure 1.
Here, the aims of the regulators were to prevent the overload
and the discharges of battery. Also, the regulators can protect
the reversals polarity and solar polarity of battery.

World Journal of Applied Chemistry 2017; 2(2): 34-47 36
Figure 1. Conception of the used solar water electrolysis system.
2.2. Hydrogen Production
Solar water electrolysis tests were conducted using an
electrolyzer connected to the generator with highest voltage
U = 2 V and gradually decrease. The electrodes are separated
by an ion-conducting electrolyte which allows ionic transfer
between the electrodes. During this process, the electric
energy supplied to the system is converted into chemical
energy as hydrogen.
The water electrolysis tests were conducted at room
temperature using an aqueous solution as electrolyte, which
results in splitting water molecules into H2 and oxygen (O2).
Hydrogen produced by electrolysis of water is of relatively
high quality, as no carbon or nitrogenous compounds are
generated in the process. The electrolyte for different pH
values and salinity degrees were run for each of these
solutions. Also, hydrogen productions were measured,
depending on the case; the electrochemical half-reactions that
occur at each electrode are different.
The hydrogen production tests are conducted to operate
the hydrogen production efficiency, hydrogen production
flow, absorbed power and the consumed electrical energy per
volume unit Table A1.
2.3. Chemical Analysis
Deposit and powder of this deposit were analyzed by i;
FT-IR spectroscopy using a KBr cell Fourier transformed IR
equipment and infrared spectroscopy (NICOLET IR200),
with wave ranged from 4000 to 400 cm-1
, ii; UV-VISIBLE
spectrophotometer used to have more information on the
different electrolytes (SHIMADZU, UV-1650PC) and iii; the
pH of the electrolyte was checked at the start and end point
of each step using a pH meter (Orion, USA) (Figure 2).
Figure 2. Deposit image with different salinity values (a), (b) and deposit
powder (c).
2.4. Electrochemical Impedance Spectroscopy (EIS)
Measurement
A potentiostat (PGSTAT302N, Autolab, Netherlands) was
used to measure the impedance under open circuit voltage
conditions of the electrolysis deposit. EIS was conducted
over a frequency range of 10 mHz –1 kHz, stack potential
(Ag/AgCl reference electrodes) and a sinusoidal amplitude of
10 mV measured using a frequency response analyser.
Impedance analyses were performed under two electrode
systems where the working electrode is connected to the
cathode and reference electrodes is connected to the anode in
which the cell voltage.

37 A. Benghnia et al.: On the Water Electrolysis with Photovoltaic Solar Energy for Hydrogen Production
3. Results and Discussion
3.1. Characteristics of the Electrolyzer and Photovoltaic
Panel
The characteristics curve of the electrolyzer is shown in
Figure 3, allows us to determine the value of the open circuit
voltage (Voc) to start the electrolysis. This curve varies according
to the electrolyzer, and its surface which can limit the progress
of the hydrogen composition reaction recorded by [32]. Thus,
the surveys tell us that the trigger voltage electrolysis was 18 V
and 1.50 A as intensity. This reference determine for the
modeling, the power required by the electrolyzer.
Figure 3. Characteristic curve of the electrolyzer.
Figure 4. Characteristic curve of the PV.
On the other hand, the characteristic of the PV is shown in
Figure 4, which reflects its energy behavior under the
influence of incident radiation, temperature and load. The
experiment is carried out under conditions known as 'natural'
as follows: direct sunlight and not in halogen lamp with
variable power. In fact, for the first steps, the module is fixed
in a position and an orientation with an inclination of 35° to
the horizontal. As result, choose among the measurements at
a maximum variation of solar radiation, the Voc varied
between 18 and 20 V. Additionally, the short-circuiting
varies according to sunlight. Indeed, the operating point is
the intersection of the PV and electrolyzer curve [33].
Graphically discloses the operating point at the following
coordinates (17.92 V; 1.50 A).
3.2. Electrolyzer Performance
Optimization of design parameters such as the height (h)
between the electrode and the test tube were operated in
terms of hydrogen yield in the electrolyzer at the applied
voltages and current of 17 V and 1.5 A, respectively. The

World Journal of Applied Chemistry 2017; 2(2): 34-47 38
height can enhance the performance of the hydrogen
production and appeared as an important parameter to control
the hydrogen production. Figure 5 reported the results of
some tests at different heights. As seen the increases in the
efficiency depended to the height and reaches a value of 3.5%
when h = 3 cm and was proportional to the distance between
the test tube and the electrode.
At 17 V, the current densities of the cathodes decreased
slightly with the decrease of height getting larger (0.5 ± 0.05
A m-2
for h=3cm vs. 0.16 ± 0.05 A m-2
for h=1cm), which
could result from the larger electrochemically area of
electrolyzer.
Figure 5. Variation of the used power (a) and the hydrogen efficiency (b) at different height.
Therefore, the measuring current has been increased by
increasing h Figure 6 and above h=3cm current values
decrease. This result is due to the low contact between both
test tube and electrode, where the maximum charge in the
electrolyte is developed, thus decreased to enter the test tube.
Here these results can be explained by the role of the water
quantity in contact with the electrode where is limited only
inset the test tube and attributed by the charge number in water.

39 A. Benghnia et al.: On the Water Electrolysis with Photovoltaic Solar Energy for Hydrogen Production
Figure 6. Variation of the current as a function of the height.
In this section, it is found out that the higher efficiency of
water electrolysis arises in the smaller height between
electrolyzer base and test tube, when current density is rather
large. Summarizing these results, it can be explained by the
hydrogen and oxygen bubbles densely pack at the upper part
between electrolyzer base and test tube. It is also means the
existence of optimum space depends on not only the current
density but also the height of electrodes.
3.3. Hydrogen Production and Applied Energy
3.3.1. Hydrogen Gas Production
In order to quantify and improve the hydrogen efficiency
from a direct conversion of PV/ electrolysis process. The
solar cell must provide sufficient voltage to drive the water
reactions, and also provide any additional voltage needed to
overcome the overvoltage losses resulting from the hydrogen
and oxygen evolution reactions.
The experiments, the area of the electrolyzer system and
the PV is identical. These integrated systems allow us to
study the issues involving the effects of current density,
sunshine variability, salt concentration and pH value on the
overall efficiency for hydrogen production.
Table 1 shows the hydrogen efficiency, and hydrogen flow at a
fixed voltage input of 12 V and different salinity degrees. The
hydrogen production efficiency was (25%) at 200gL-1 of NaCl
and it was higher than some results presented in previous research.
Table 1. Variation of hydrogen flow (Φ) and hydrogen efficiency (η) with different salinity values.
Salinity (gL-1) 5 50 70 90 110 130 150 170 190 210
Φ (cm3s-1) 0.10 0.45 0.20 0.15 0.11 0.09 0.19 0.30 0.39 0.4
η (%) 10 29 19 11 9 12 17 20 21 25
In this area, the salinity is strongly influenced the
hydrogen production by solar water electrolysis. In fact, the
current was increased with increases in salt concentration. It
was shown in a previous study [34] that high salt
concentration of input solution resulted in high conductivity
of electrolyte. Herein, salinity was strongly correlated to the
conductivity.
As a result, the addition of salt decreased the hydrogen
production efficiency with increasing salinity of the medium.
When the salinity increased the output increased, while the
holding time decreases. This trend continues until a mass of
salt is 50 g L-1
, around which the performance has a
maximum value and where she uncrossed with the addition
of NaCl. In addition, if we continue increased salinity,
hydrogen efficiency and throughput decreases. From 130 g L-
1, both values began to grow with the addition of NaCl up to
saturation of the electrolyte. This highlights the existence of
changing the medium nature. Such pH difference was in
accordance with the change of the current generations per
tests in the electrolyzer. This change is resulted in more
electrons reaching the cathode electrode and more hydroxide
ion production due to oxygen reduction [35].
Figure A1 shown that electrolysis also decreased the pH
value of electrolyte, thus this decrease was probably due to
generations of chlorine gas, hypochlorous acid and
hydrochloric acid. Total residual chlorine increased with
increases of salt concentration and decreases of water flow.
Increasing salt concentration increased chloride concentration
of input water while decreasing flow rate increased residence
time of the electrolyte in the electrolysis cells.

World Journal of Applied Chemistry 2017; 2(2): 34-47 40
Figure 7. Hydrogen efficiency at applied voltage.
Figure 8. Evolution of electrical energy as function of salinity.
3.3.2. Energy Efficiency
Hydrogen production yield increased with the applied
voltage of 10% at 8V to 40% at 18V (Figure 7). The
production flow increased with the higher conductivity
solution in part due to a decreased internal resistance. In
contrast, results were reproducible when changing to any
other applied potential for a voltage < 15 V.
The electrical energy efficiency for the conversion of
water into hydrogen at different salinity degrees are shown in
Figure 8. Under batch conditions, the overall energy
decreased from 98 Jcm-3
at a 50gL-1
concentration of NaCl to
58 Jcm-3
at 70 gL-1
.
Using the results found this far in combination with
literature values and we have assessed reasonable thickness
between conductivity, pH values and degrees salinity values
of the electrolyte to the improvement energy.
The variation of consumed energy per volume and the
hydrogen flow with different pH values is reported in (Table
A2). The salinity degrees and pH values variation offered the
energy for the hydrogen production, while the input
electricity provided the energy for the hydrogen production.
The hydrogen production consumed 70 Jcm-3
in the salinity
area around of 50 to 70 and 130 to 210gL-1
, which was much
higher than that in the area of 50-130gL-1
(57 Jcm-3
. On the
other term, the hydrogen production consumed more energy
118 Jcm-3
, 133 Jcm-3
for basic and acidic electrolyte

41 A. Benghnia et al.: On the Water Electrolysis with Photovoltaic Solar Energy for Hydrogen Production
compared to the neutral medium 60.75 Jcm-3
, indicating that
reaction mixture played an important role in boosting the
performance of hydrogen production.
3.4. Deposit Characterization
3.4.1. FT-IR Analysis
Figure A2 shown the infrared spectra of the used electrolyte
after and before hydrogen production. The band centered at
about 3298 cm-1
and 1641 cm-1
associated to the stretching
vibrations υOH, and the deformation vibration δOH,
respectively. After hydrogen production the spectra shows a
slight shift towards the low wavenumber with compared
relative before production. Here, this result can be explained
by the existing of interaction between chemical species and
OH groups in electrolyte. Therefore, this difference indicate
the metallic particles dispersion on electrolyte, which provides
further evidence providing insights into strong interactions
between hydrogen and oxygen [36].
Figure 9. Comparative FT-IR spectra of deposit powder (1) and electrolyte before solar electrolysis
On the other hand, the infrared spectra recorded to the
powder deposit samples and electrolyte after use (filing) are
shown in Figure 9, reveals the presence of a band at 1600 cm-1
attributed to the deformation vibrations δOH for powder of
deposit, while this band is largely shifted to lower wavelengths.
Also, a broad absorption band around 3350 cm-1
associated to
the stretching vibration υOH. A reduction of this band was
signaled of the powder deposit that explained by drying the
films in the open area. These results were confirmed the
presence of free absorption band of OH groups at 3667 cm-1
[37, 38]. Thus the study by infrared spectroscopy confirms
the presence of hydroxyl species in the film [39-41]. The
lowest intensity as 600 and 445 cm-1
is attributed to
stretching vibration of υCu-O is persisted for the powder
which is not the case for the deposit before filtration
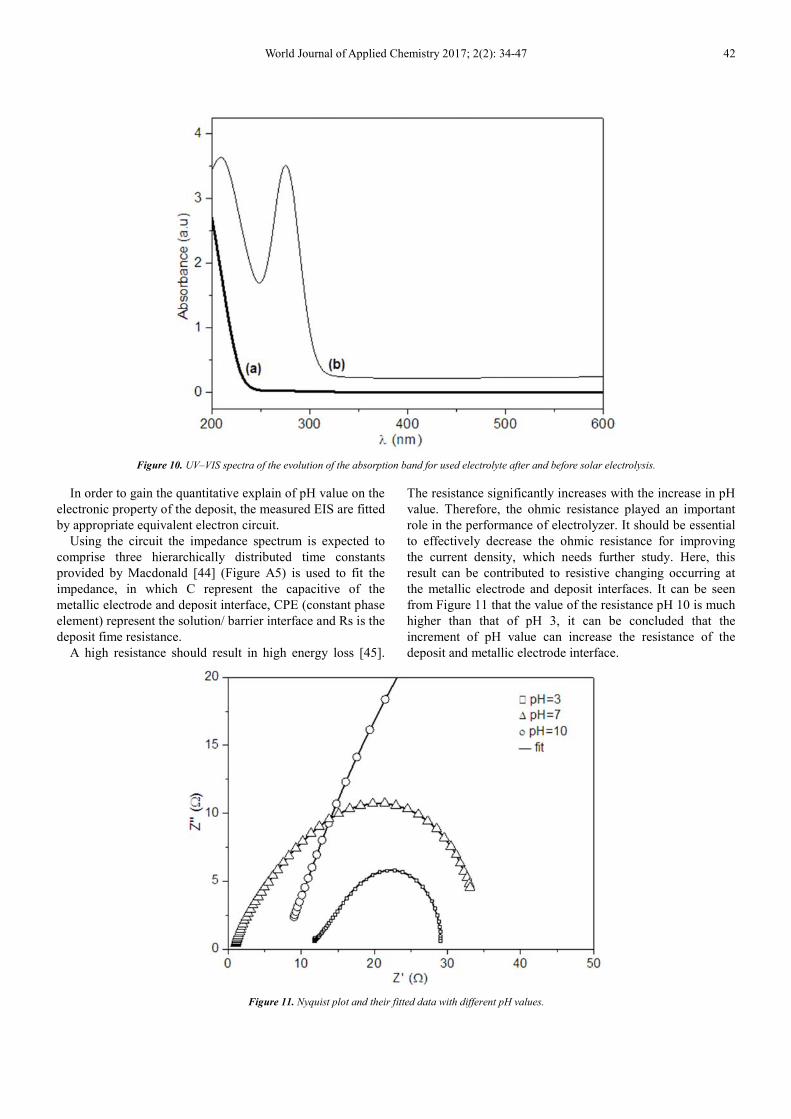
3.4.2. UV-visible Analysis
Figure 10 shows the UV spectrum of the electrolyte before
and after hydrogen production, the only identifiable complex
by UV-visible is AlOH3 complex, which has an absorption
band at 290 nm attributed to transitions load, and which
caused the transfer of electrons promotes with a length
difference of Al-OH bond. Among other things, this band is
assigned to the electronic transition of the strong conjugation
resulting hydroxyl group between electrolyte and electrodes.
The effect of the pH value was shown in Figure A3, which
provides comparative studies of the UV-visible spectra of
electrolyte for different pH values. The absorbance of all the
samples having absorption bands around 220 nm, which is
more intense to pH = 3, and which moves towards higher
energy while increasing the pH value. This decrease can be
explained by the exchange rate of existing charges in the
electrolyte intensity of the transition which is significantly
reduced. Contrary, for pH = 8, two bands are loaded at 320
and 360 nm due to the detected hydroxyl-compounds.
The effect of the salinity degrees value was shown in
Figure A4, which prove the intensity variation of detected
bands at 220 nm is higher for the masses of NaCl: 6 and 210
gL-1
, that explained by the development of acid-base game,
while recording the band at 290 nm. However it is gone for
other mass concentrations following dependence of the
species disappearance.
3.4.3. Electrochemical Impedance Spectroscopy
Measurement (EIS)
To insight into the influence of pH value on the electronic
property of the deposit film, Figure 11 displays the Nyquist
plots and the corresponded Bode diagrams of deposit. It can
be seen that the Nyquist plots show a depressed semicircle,
and the presence of the depressed semicircles is often
referred to as frequency dispersion, which has been attributed
to high roughness of the deposit surface [42, 43].
World Journal of Applied Chemistry 2017; 2(2): 34-47 42
Figure 10. UV–VIS spectra of the evolution of the absorption band for used electrolyte after and before solar electrolysis.
In order to gain the quantitative explain of pH value on the
electronic property of the deposit, the measured EIS are fitted
by appropriate equivalent electron circuit.
Using the circuit the impedance spectrum is expected to
comprise three hierarchically distributed time constants
provided by Macdonald [44] (Figure A5) is used to fit the
impedance, in which C represent the capacitive of the
metallic electrode and deposit interface, CPE (constant phase
element) represent the solution/ barrier interface and Rs is the
deposit fime resistance.
A high resistance should result in high energy loss [45].
The resistance significantly increases with the increase in pH
value. Therefore, the ohmic resistance played an important
role in the performance of electrolyzer. It should be essential
to effectively decrease the ohmic resistance for improving
the current density, which needs further study. Here, this
result can be contributed to resistive changing occurring at
the metallic electrode and deposit interfaces. It can be seen
from Figure 11 that the value of the resistance pH 10 is much
higher than that of pH 3, it can be concluded that the
increment of pH value can increase the resistance of the
deposit and metallic electrode interface.
Figure 11. Nyquist plot and their fitted data with different pH values.

43 A. Benghnia et al.: On the Water Electrolysis with Photovoltaic Solar Energy for Hydrogen Production
Figure 12 (a-b) show respectively, the variations of Z' and Z"
as a frequency function for different pH values. In fact, Z' values
is quite high in the low frequency region, which is due to the
free charges accumulation at the electrode-electrolyte interface.
While for high frequencies, Z' tends towards values close to zero,
which indicates the decrease in the material dielectric constant.
Furthermore, Z" factor has significant values at low frequencies
and increases to another pH, but high frequency curves Z" show
similar behavior at different pH approaching zero.
4. Conclusions
This study intensively investigated the hydrogen
production by solar water electrolysis system (SWES). The
primary goal was to demonstrate the capability of SWES to
produce hydrogen. When the applied voltage was 17 V, the
electrolyzer can accomplished a hydrogen production
efficiency of 40% at volumetric current density of 0.3 A m-2
.
Figure 12. Variation of the real (a) and imaginary (b) part of impedance as function of frequency with different pH values.

World Journal of Applied Chemistry 2017; 2(2): 34-47 44
These results demonstrate that H2 production in the
electrolyzer is seriously affected by the salinity degrees and
pH values. Moreover, at higher and low concentration of
NaCl, the hydrogen flow is improved and the activity
decreased. Also the salinity has a strong effect in reducing
the activation energy of the reaction such us for the salinity
degrees around 70 to 130gL-1
. These results are accompanied
by the presence of a deposit film. A combination of
characterization methods to the deposit show that UV-visible
spectra of the solution before and after the hydrogen
production presents an absorption band at 290 nm assigned to
transitions load, causing promoted electrons transfer. Infrared
spectroscopy shows a shift in the OH absorption band which
was a positive indicator of the metal particles interaction
dispersed on the electrolyte. In the other hand, the study by
complex impedance spectroscopy displayed that Nyquist
diagrams saved a capacitive impedance loop and at high
frequency domain followed by an inductive loop to the field
of low frequencies and a capacitive behavior show the
interface in the examined frequency range.
5. Supporting Information
5.1. Calculations
Table A1. Parameters used in this study.
Calculated parameters Symbol Formula
Hydrogen flow Q V/t (m3s-1)
Absorptive power by the electrolyzer Pa U*I (w)
Consumed electric Energy W Pa*t in (J)
Hydrogen efficiency η PCI (Jkg-1)
Consumed Energy per volume W/v Pa*t/V = Pab/Q (Jcm-3) Pa*t*22.4/V = (KJmol-1)
Where; V is the volume of the test tube (m3); t is the filling time of the tube (s); PCI is the lower calorific value of hydrogen
= (119.9 10 6 JKg-1
); ρ is the density of hydrogen (0.09 Kgm-3
); I is the electrical current (A) and U is the tension (V).
5.2. Hydrogen Production
Figure A1. Dependences of pH values before (1) and after (2) electrolysis.
5.3. Consumed Energy
Table A2. Hydrogen flow and consumed energy per volume with different pH values.
pH t (min) I (A) Φ (cm3min-1) W/V (Jcm-1)
2 18 0.66 4.44 133.65
3 33 0.25 2.42 92.81
6 45 0.12 1.77 60.75
10 30 0.30 2.66 101.25
12 15 0.70 5.33 118.12

45 A. Benghnia et al.: On the Water Electrolysis with Photovoltaic Solar Energy for Hydrogen Production
5.4. Deposit Characterization
5.4.1. FT-IR Analysis
Figure A2. FT-IR spectra of used electrolyte after (1) and before (2) solar electrolysis.
5.4.2. UV-visible Analysis
Figure A3. Evolution of the absorption band for used electrolyte with different pH values.

World Journal of Applied Chemistry 2017; 2(2): 34-47 46
Figure A4. Evolution of the absorption band for used electrolyte with different salinity values.
5.4.3. Electrochemical Impedance Spectroscopy (EIS)
Measurement
Figure A5. Equivalent circuit model of the deposit compound.
References
[1] Larminie J, Dicks A. Fuel cell systems explained. New York: Wiley, (2000).
[2] Dunn S. Int J Hydrogen Energy, 27 (2002) 235-64.
[3] Schlapbach L, Zuttel A. Nature, 414 (2001) 353-8.
[4] Suh MP, Park HJ, Prasad TK, Lim DW. Chem Rev, 112 (2012) 782-835.
[5] Serpone N, Lawless D, Terzian R. Solar Energy, 49 (1992) 221.
[6] Bockris JOM, Dandapani B, Cocke D, Ghoroghchian J. Int J Hydrogen Energy, 10 (1985) 79.
[7] Barbir, F., Plass, H. J. Jr. and Veziroglu, T. N., Int J Hydrogen Energy, 18 (1993) 87-195.
[8] Scott, D. S., Int J Hydrogen Energy, 18 (1993) 191-204.
[9] Hassmann, K. and Kuhne, H.-M., Primary energy sources for hydrogen production, Int J Hydrogen Energy, 18 (1993) 635-640.
[10] Kyazze G, Popov A, Dinsdale R, Esteves S, Hawkes F, Premier G, et al. Int J Hydrogen Energy, 35 (2010) 7716-22.
[11] Ribot-Llobet E, Nam J-Y, Tokash JC, Guisasola A, Logan BE. Int J Hydrogen Energy, 38 (2013) 2951-6.
[12] Merrill MD, Logan BE. J Power Sources, 191 (2009) 203-8.
[13] Nam J-Y, Logan BE. Int J Hydrogen Energy, 36 (2011) 15105-10.
[14] Nam J-Y, Logan BE. Int J Hydrogen Energy, 37 (2012) 18622-8.
[15] Yossan S, Xiao L, Prasertsan P, He Z. Int J Hydrogen Energy, 38 (2013) 9619-24.
[16] Cheng S, Logan BE. Proc Natl Acad Sci, 104 (2007) 18871-3.
[17] Darus L. Indo J Biotech, 16 (2011) 53-9.
[18] Croese E, Jeremiasse AW, Marshall IP, Spormann AM, Euverink GJ, Geelhoed JS,. Enzyme Microb Technol, 62 (2014) 67-75.
[19] Wang A, Liu W, Ren N, Zhou J, Cheng S. Int J Hydrogen Energy, 35 (2010) 13481-7.
[20] Selembo PA, Merrill MD, Logan BE. J Power Sources, 190 (2009) 271-8.
[21] Cheng S, Logan BE. Bioresour Technol, 102 (2011) 3571-4.
[22] Wang A, Liu W, Ren N, Cheng H, Lee D-J. Int J Hydrogen Energy, 35 (2010) 13488-92.
[23] Jung S, Regan JM. Appl Environ Microbiol, 77 (2011) 564-71.

47 A. Benghnia et al.: On the Water Electrolysis with Photovoltaic Solar Energy for Hydrogen Production
[24] Lee MY, Kim KY, Yang E, Kim IS. Bioresour Technol, 187 (2015) 106-12.
[25] Chae KJ, Choi MJ, Kim KY, Ajayi FF, Chang IS, Kim IS. Environ Sci Technol, 43 (2009) 9525-30.
[26] ElMekawy, A., Hegab, H. M., Dominguez-Benetton, X., Pant, D., Bioresour. Technol. 142 (2013) 672–682.
[27] Kim, K.-Y., Chae, K.-J., Choi, M.-J., Yang, E.-T., Hwang, M. H., Kim, I. S., Chem. Eng. J. 218 (2013) 19–23.
[28] Liu, H., Logan, B. E.,. Environ. Sci. Technol. 38 (2004) 4040–4046.
[29] Sleutels, T. H. J. A., Hamelers, H. V. M., Rozendal, R. A., Buisman, C. J. N., Int. J. Hydrogen Energy 34 (2009) 3612–3620
[30] Werner, C. M., Logan, B. E., Saikaly, P. E., Amy, G. L., J. Membr. Sci. 428 (2013) 116–122.
[31] Zhang, F., Brastad, K. S., He, Z., Environ. Sci. Technol. 45 (2011) 6690–6696.
[32] R. Rozendal, H. Hamelers, G. Euverink, S. Metz, and C. Buisman, Int J Hydrogen Energy, vol. 31 (2006) 1632-40.
[33] P. Millet, F. Andolfatto and R. Durand, Int J Hydrogen Energy, 21 (1996) 87.
[34] S. Y. Hsu, Journal of Food Engineering, 60 (2003) 469–473.
[35] Min Su, Liling Wei, Zhaozheng Qiu, Gang Wang, Jianquan Shen, Journal of Power Sources 301 (2016) 29–34.
[36] Adrian. S, Claion. R, Spectro-chemical analysis, 18 (2013) 114 – 126.
[37] Rand. D, Dell. R, Hydrogen, RSC publishing (2008).
[38] Aníbal. M, Slavutsky. M, Bertuzzi. A, Margarita. A, María. G, García. N, A. Ochoa, 35 (2013) 270-278.
[39] del Arco. M, Trujillano. R, Rives. V, J, Chem, 8 (1998) 761.
[40] Uzunova. E, Klissurski. D, Mitov. I, Stefanov. P, J, Chem. Mater, 5 (1993) 576.
[41] Hansen. H. C. B, Koch. C. B, Taylor. R. M, J. Solid State Chem, 113 (1994) 46.
[42] Ju¨ ttner K. Electrochim Acta. 35 (1990) 1501.
[43] Ameer MA, Fekry AM, Taib Heakal FEI. Electrochim Acta (2004) 50: 43.
[44] Priyantha N, Jayaweera P, Macdonald DD, Sun A. J Electroanal Chem (2004) 572: 409.
[45] Sharma, M., Bajracharya, S., Gildemyn, S., Patil, S. A., Alvarez-Gallego, Y., Pant, D., Rabaey, K., Dominguez-Benetton, X., Electrochim. Acta 140 (2014) 191–208.


