On the soil water characteristic curves of poorly graded granular...
14
RESEARCH PAPER On the soil water characteristic curves of poorly graded granular materials in aqueous polymer solutions Junnan Cao 1 • Jongwon Jung 2 • Xiaoyu Song 3 • Bate Bate 1,4 Received: 22 September 2016 / Accepted: 12 June 2017 Ó Springer-Verlag GmbH Germany 2017 Abstract Tempe cell with a self-developed horizontal hanging column attachment was used to measure the soil water characteristic curves (SWCCs) of granular materials initially saturated with either water or polymer solutions. For SWCCs of six poorly graded granular materials with d 50 ranging from 0.04 to 0.7 mm in water, it was found that (1) as grain size decreases, air entry value increases, and matric suction (w) for the funicular and pendular regimes increases and that (2) steep desaturation curves over narrow w range in the funicular regime were observed. Air entry values obtained from the fitting parameter 1/a in van Genuchten SWCC equation fall in the boundaries calculated from the pore throat sizes in both simple cubic and face-centered cubic packings. A toroidal meniscus water model, which incorporates the measured surface tension and contact angle values between aqueous solutions and solid surfaces, was proposed for the SWCC in pendular regime and was compared to well-received numerical methods. This toroid model successfully depicts SWCC of poorly graded granular materials in water. However, SWCCs predicted by this toroid model under- estimate the degree of saturation in the pendular regime for Ottawa 20–30 sands in polymer solutions. Herschel– Bulkley fluid, which is a type of non-Newtonian fluids, is postulated to increase the w needed to drain the polymer solution due to the nonzero shear stress intercept. In addition, it is also postulated by scanning electron micro- scopy and optical confocal imaging results that the rough surfaces of Ottawa 20–30 sand, which have many micron- sized ‘‘kinks’’, together with the possible chemical attrac- tions, help retain the polymer solutions on the solid sur- faces, or water film. Keywords Meniscus Polymer solutions Poorly graded Sand Soil–water characteristic curves Toroid model 1 Introduction Polymeric solutions retention and transporting in porous media are commonly seen phenomena found in many engineering fields, such as ground improvement [4, 22, 35], soil contaminant containment barriers [8, 19, 44, 55], bioremediation of geomaterials [17, 53], and chemically enhanced oil recovery (EOR) [5, 21, 39]. Most of current work on polymer modified geomaterials focused on eval- uating their swelling/shrinkage, large strain strength, small strain stiffness, hydraulic conductivity and erosion resis- tance properties in either saturated or compacted condition. & Bate Bate [email protected] Junnan Cao [email protected] Jongwon Jung [email protected] Xiaoyu Song [email protected]fl.edu 1 Department of Civil, Architectural, and Environmental Engineering, Missouri University of Science and Technology, 1401 North Pine Street, Rolla, MO 65409-0030, USA 2 Department of Civil and Environmental Engineering, Louisiana State University, Baton Rouge, LA 70803, USA 3 Department of Civil and Coastal Engineering, University of Florida, Gainesville, FL 32611, USA 4 Institute of Geotechnical Engineering, College of Civil Engineering and Architecture, Zhejiang University, An- Zhong Building, 866 Yuhangtang Road, Hangzhou 310058, China 123 Acta Geotechnica DOI 10.1007/s11440-017-0568-7
Transcript of On the soil water characteristic curves of poorly graded granular...
RESEARCH PAPER
On the soil water characteristic curves of poorly graded granularmaterials in aqueous polymer solutions
Junnan Cao1• Jongwon Jung2
• Xiaoyu Song3• Bate Bate1,4
Received: 22 September 2016 / Accepted: 12 June 2017
� Springer-Verlag GmbH Germany 2017
Abstract Tempe cell with a self-developed horizontal
hanging column attachment was used to measure the soil
water characteristic curves (SWCCs) of granular materials
initially saturated with either water or polymer solutions.
For SWCCs of six poorly graded granular materials with
d50 ranging from 0.04 to 0.7 mm in water, it was found
that (1) as grain size decreases, air entry value increases,
and matric suction (w) for the funicular and pendular
regimes increases and that (2) steep desaturation curves
over narrow w range in the funicular regime were
observed. Air entry values obtained from the fitting
parameter 1/a in van Genuchten SWCC equation fall in the
boundaries calculated from the pore throat sizes in both
simple cubic and face-centered cubic packings. A toroidal
meniscus water model, which incorporates the measured
surface tension and contact angle values between aqueous
solutions and solid surfaces, was proposed for the SWCC
in pendular regime and was compared to well-received
numerical methods. This toroid model successfully depicts
SWCC of poorly graded granular materials in water.
However, SWCCs predicted by this toroid model under-
estimate the degree of saturation in the pendular regime for
Ottawa 20–30 sands in polymer solutions. Herschel–
Bulkley fluid, which is a type of non-Newtonian fluids, is
postulated to increase the w needed to drain the polymer
solution due to the nonzero shear stress intercept. In
addition, it is also postulated by scanning electron micro-
scopy and optical confocal imaging results that the rough
surfaces of Ottawa 20–30 sand, which have many micron-
sized ‘‘kinks’’, together with the possible chemical attrac-
tions, help retain the polymer solutions on the solid sur-
faces, or water film.
Keywords Meniscus � Polymer solutions � Poorly graded �Sand � Soil–water characteristic curves � Toroid model
1 Introduction
Polymeric solutions retention and transporting in porous
media are commonly seen phenomena found in many
engineering fields, such as ground improvement [4, 22, 35],
soil contaminant containment barriers [8, 19, 44, 55],
bioremediation of geomaterials [17, 53], and chemically
enhanced oil recovery (EOR) [5, 21, 39]. Most of current
work on polymer modified geomaterials focused on eval-
uating their swelling/shrinkage, large strain strength, small
strain stiffness, hydraulic conductivity and erosion resis-
tance properties in either saturated or compacted condition.
& Bate Bate
Junnan Cao
Jongwon Jung
Xiaoyu Song
1 Department of Civil, Architectural, and Environmental
Engineering, Missouri University of Science and
Technology, 1401 North Pine Street, Rolla, MO 65409-0030,
USA
2 Department of Civil and Environmental Engineering,
Louisiana State University, Baton Rouge, LA 70803, USA
3 Department of Civil and Coastal Engineering, University of
Florida, Gainesville, FL 32611, USA
4 Institute of Geotechnical Engineering, College of Civil
Engineering and Architecture, Zhejiang University, An-
Zhong Building, 866 Yuhangtang Road, Hangzhou 310058,
China
123
Acta Geotechnica
DOI 10.1007/s11440-017-0568-7

Only a few studies controlled the unsaturation conditions,
such as matric suction [5, 20, 43]. In the field condition,
however, soils are not always saturated due to seasonal
groundwater level change, precipitation, and evaporation,
or in the applications like soil vapor sparging, CO2
sequestration, shale gas production, imbibition, contami-
nant transport and petroleum leakage onto soil particle
surface, and projects involving methane hydrate [7, 9]. Due
to the variability of polymeric solutions, the viscosity,
surface tension and the contact angle between liquid and
porous media vary. This will lead to highly variable flow
behaviors and liquid retention capability of the hosting
porous media. Once desaturation occurs, the mechanical
properties of geomaterials could change drastically
[2, 12, 30, 31, 33, 36].
On the other hand, granular materials have been widely
used in a variety of engineering applications, such as liq-
uefaction resistance enhancement in sandy materials by
biomediation [40] due to the compatibility between the
pore throat size and the bacteria size [37], proppants (ce-
ramic beads or sands) to prop open the geophysical for-
mation for the injection of polymers and surfactants in
chemical EOR, and the granular materials for state-of-the-
art porous pavement materials. Therefore, the characteri-
zation of geomaterials under unsaturated condition is
warranted.
Soil–water characteristic curve (SWCC) exhibits the
relationship between matric suction (w) and volumetric
water content of a soil [11, 32], where matric suction is the
difference between air pressure (ua) and water pressure
(uw), or w ¼ ua � uw. It is worth noting that osmotic suc-
tion, another component of total suction, relates to the
chemical properties of bulk solution and is usually negli-
gible for diluted bulk solutions and coarse-grained geo-
materials. Other soil properties, such as hydraulic
conductivity and shear strength, can be estimated from
SWCC [10, 13, 31]. SWCC of water adsorption or des-
orption (wetting or drying) has been documented previ-
ously. However, SWCC of geomaterials in polymer
solutions was rarely studied [20, 54]. Many SWCC equa-
tions were proposed as summarized in Leong and Rahardjo
[25] and Ba [1]. Particularly, van Genuchten SWCC
equation [52] is expressed as
S ¼ Sr þ1
1þ ðawÞn� �m
ð1Þ
where S is degree of saturation, subscription ‘‘r’’ means
residual, a relates to the inverse of the air entry value
(AEV = 1/a); n relates to the pore size distribution of the
soil, with poorly graded soils yield high n values; m relates
to the asymmetry of the model.
A typical SWCC consists of four states or regimes,
namely saturation, capillary, funicular and pendular
(Fig. 1) [36]. A saturated soil (saturation regime) transits
into capillarity regime when the matric suction increases
from zero, where only little water was expelled due to
water meniscus deformation at the soil surface (Fig. 1).
When matric suction exceeds the air entry value (AEV, a
matric suction value corresponding to the beginning of air
entering the pore spaces), soil reaches the funicular regime
where the major water desaturation occurs. Surpassing the
residual matric suction (wr) or snap-off suction [28, 41, 51],
pendular regime is reached where water phase resides
primarily in the toroidal meniscus and on the solid surface
(Fig. 1). Besides, at extreme high matric suction (ap-
proaching 1000 MPa), only surface attached water (thick-
ness on the order of a few nanometers) exists [28]. AEV
and wr can be determined graphically shown in Fig. 1.
Toroid model, which assuming the water resides in a
toroid ring near the contacts between particles in the pen-
dular regime (Fig. 2b), is the basic model used in many
studies [28, 38, 45]. The geometrical configuration of the
toroid ring depends on the surface tension (Ts) and contact
angle (b) as dictated by Laplace equation:
w ¼ 2 � Ts � cos bq � g � r ð2Þ
where q, g and r are density of the pore fluid, gravity
constant and pore throat radius, respectively. Surface ten-
sion and contact angle of the bulk fluid are influenced by
the solute. Therefore, toroidal water content should be
different for poorly graded granular materials in different
polymer solutions.
Most laboratory techniques of measuring SWCC of a
soil are based on high air entry ceramic disk with applied
matric suction ranges of 0–1500 kPa, such as Tempe cell
(0–100 kPa), pressure plate (0–1500 kPa), Fredlund
SWCC cell (0–1500 MPa), Wille pressure plate cell and
0
0.1
0.2
0.3
0.4
0.5
0.6
0.01 0.1 1 10 100 1000 10000 100000 1000000
Volu
met
ric W
ater
Con
tent
Matric Suction (kPa)
2
1
4
3
5
funicular pendular capillary
air-entry value, AEV
residual water content, r
air-water interface
Fig. 1 A typical soil water characteristic curve for a granular
material (revised from Fredlund and Rahardjo [11]). Three regimes
of water content shown: capillary state, funicular state and pendular
state (inset modified from Fredlund et al. [12])
Acta Geotechnica
123

Barcelona cell [12]. In a conventional ceramic disk-based
SWCC device, SWCC measurement of coarse-grained
materials is limited by their low air entry value (usually
\1 kPa) and by the accuracy of the pressure regulators as
satisfactory matric suction reading usually starts from
5 kPa [12]. Hanging column, in which the water level is
lowered below the base of the soil sample to apply low
water pressure, is used for creating accurate low matric
suction values (\5 kPa) ([12]; ASTM D6836). A simplified
hanging column setup was also used by Li et al. [26].
This study aims at three objectives: (1) Develop a
hanging column attachment to use in conjunction with
Tempe cell to investigate the soil–water characteristic
curve of poorly graded sands that were initially immersed
with different polymer solutions. (2) Derive a toroidal
meniscus water equation, which incorporates the measured
surface tension and contact angle between aqueous solution
and solid surface, to model SWCC in pendular regime. (3)
Identify other forms of water retention mechanisms with
scanning electron microscopy and optical confocal images.
2 Materials
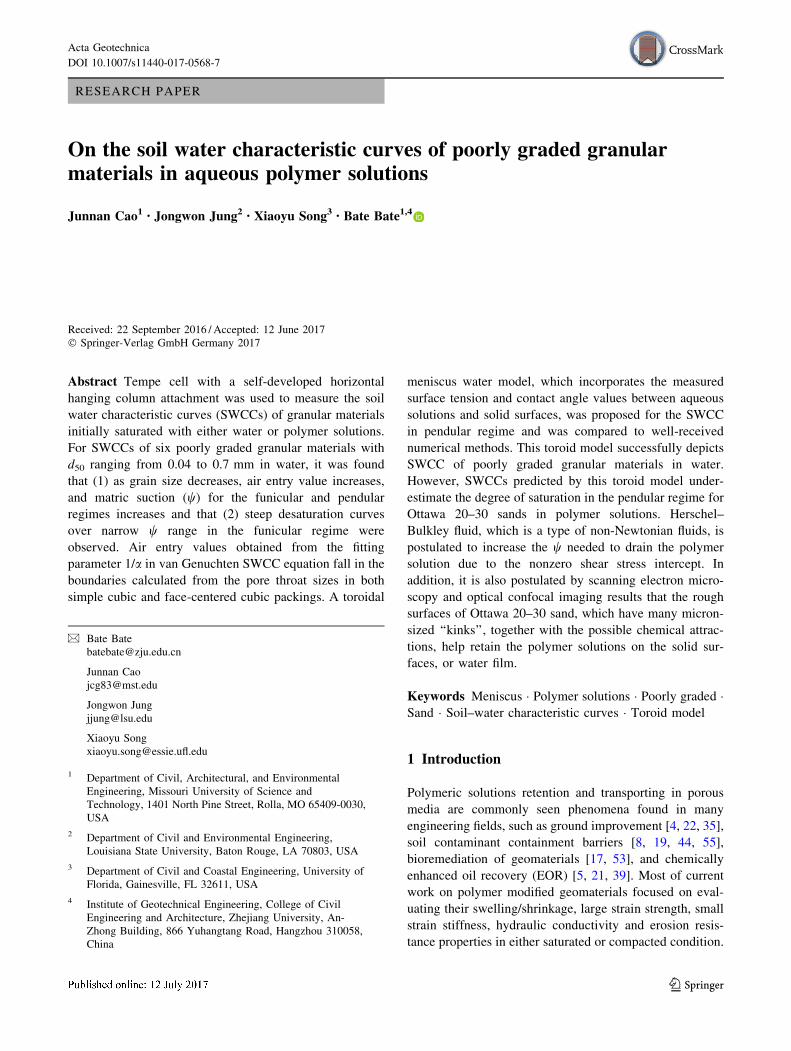
Ottawa 20–30 and 50–70 sands (US Silica, Frederick, MD,
USA) were used as received. Their specific gravity of both
sands is 2.65. Ottawa 20–30 sand is composed of 99.8%
SiO2, 0.06% Al2O3, 0.020% Fe2O3, 0.01% TiO2, other
trace amount (\0.01%) of metal oxides, and 0.1% loss on
ignition (US Silica datasheet). Ottawa 50–70 sand is
composed of 99.7% SiO2, 0.06% Al2O3, 0.020% Fe2O3,
0.01% TiO2, other trace amount (\0.01%) of metal oxides,
and 0.1% loss on ignition (US Silica datasheet). Their grain
size distribution curves are shown in Fig. 3. The d50 values
for Ottawa 20–30 and 50–70 sands are 0.7 and 0.23 mm,
respectively.
Polyethylene oxide (PEO), polyacrylamine (PAM),
polyacrylic acid (PAA), xanthan gum and chitosan (Fisher
Scientific) were used as received. Polymer solutions were
made by dissolving the prescribed mass of polymer pow-
ders into a 1000 ml volumetric flask (Table 1), and then the
mixtures were mechanically stirred (Isotemp Stirring
(a) (c)
(d)
(e)
(b)
Fig. 2 a Geometry of toroidal fluid near a sphere contact, b free body diagram w.r.t. meniscus, and c–e triangles used for integration
Acta Geotechnica
123
Hotplate 4 9 4 in. model, Fisher Scientific). Some poly-
mers with high molecular weight, such as PAM and xan-
than gum, took at least 24 h and ultrasonic bath (Branson
Ultrasonic Cleaner, Model 8800, Branson Ultrasonics
Corp., Danbury, CT) to completely dissolve.
3 Experimental methods
The surface tension of polymer solutions was measured by
a dynamic surface tensiometer (SensaDyne QC6000, Sen-
saDyne Instrument Division, Mesa, AZ, USA). Sessile
drop method with a Rame-hart goniometer and an optical
system were used to capture the contact angle of a high-
purity polymer drop on a quartz slide surface. A quartz
slide (containing 99.8% SiO2) (Fisher Scientific), contain-
ing almost identical mineral composition as that of both
sands used in this study, was used.
Scanning electron microscopy (SEM) test was carried
out for Ottawa 20–30 sand by the SEM S-4700 (Hitachi).
Sand particles were coated with gold powder using a
sputter-coater (Hitachi E-1030) before testing. The surface
roughness of Ottawa 20–30 sand was measured with an
optical confocal microscope (KH-8700, Hirox-USA, inc.,
Hackensack, NJ) and a middle range (509–4009)
objective lens. Three-dimensional confocal images were
reconstructed by KH-8700 3DViewer software.
Tempe cell (Soil moisture, Santa Barbara, CA, USA)
with ceramic disk (130 kPa air entry pressure) was used
with a self-developed hanging horizontal column attach-
ment to measure the soil water characteristic curve of sands
(Fig. 4). Loose sand specimens for SWCC tests were pre-
pared in a stainless steel ring (2.5 inch 9 0.5 inch, inner
diameter 9 height) by air pluviation method with identical
free fall height (about 2 cm), pouring speed (hand scoop)
and funnel opening [2] to maintain the same initial void
ratios. Polymer solutions were added slowly from the top
of the specimen until Tempe cell was filled up to the top of
the specimen. Residual solution on top of the specimen was
blotted with lint-free tissues.
The steps of matric suctions during desaturation are as
follows: 0.05, 0.1, 1, 2, 4, 6.89, 12, 25, 50, and 100 kPa.
The outflow volume reading from the horizontal tube
over time was monitored to identify the cessation of the
outflow under each matric suction step. Small matric
suction (B4 kPa) was applied by lowering the elevation
of a horizontal tube below the bottom of the sand spec-
imen (Fig. 4). When the applied matric suction exceeds
5 kPa, air pressure (ua) was applied through the air reg-
ulator to the top of the specimen while maintaining the
water pressure below the ceramic disk atmospheric
(uw = 0).
The height change of the specimen was at most 0.5 mm
(2.5% by volume) during the tests. This height change was
similar to those in the SWCC tests done on similar sands
[15, 29, 42], which were deemed negligible to influence
total specimen volume. Therefore, the total volume was
considered constant during all SWCC tests in this study. It
is noted, however, that in rigorous numerical study the
SWCC also depends on soil deformation (strain)
[3, 46–50]. On the other hand, the evaporation of water
through the open end of the horizontal tube was calibrated
by taking readings of the horizontal tube every 2–3 h, up to
20 h. Given the limited temperature variations (22–24 �C)in the laboratory, the evaporation rate was assumed to be
constant and was measured and corrected.
0
20
40
60
80
100
0.01 0.1 1 10
Perc
ent P
assin
g (%
)
Sieve Size (mm)
20-30 sand
50-70 sand
0.25-0.60mm glass bead, Manahiloh and Meehan 2015 0.250-0.300 mm glass bead, Jaafar and Likos 2011 0.075-0.090 mm glass bead, Jaafar and Likos 2011 0.032-0.045 mm glass bead, Jaafar Likos 2011
Fig. 3 Grain size distributions of Ottawa 20–30 and 50–70 sands,
and four uniformly sized glass beads
Table 1 Measured surface tension and contact angle values of different polymer solutions
Aqueous solution Concentration
(g/L)
Surface tension
(dyne/cm)
Contact angle
(degree)
Deionized water 0 73.1 38.1
PEO 10 61.8 37.2
Chitosan 2 74.0 31.7
PAA 2 74.1 38.6
PAM 2 76.1 21.3
Xanthan gum 2 76.0 34.8
Acta Geotechnica
123

4 Results
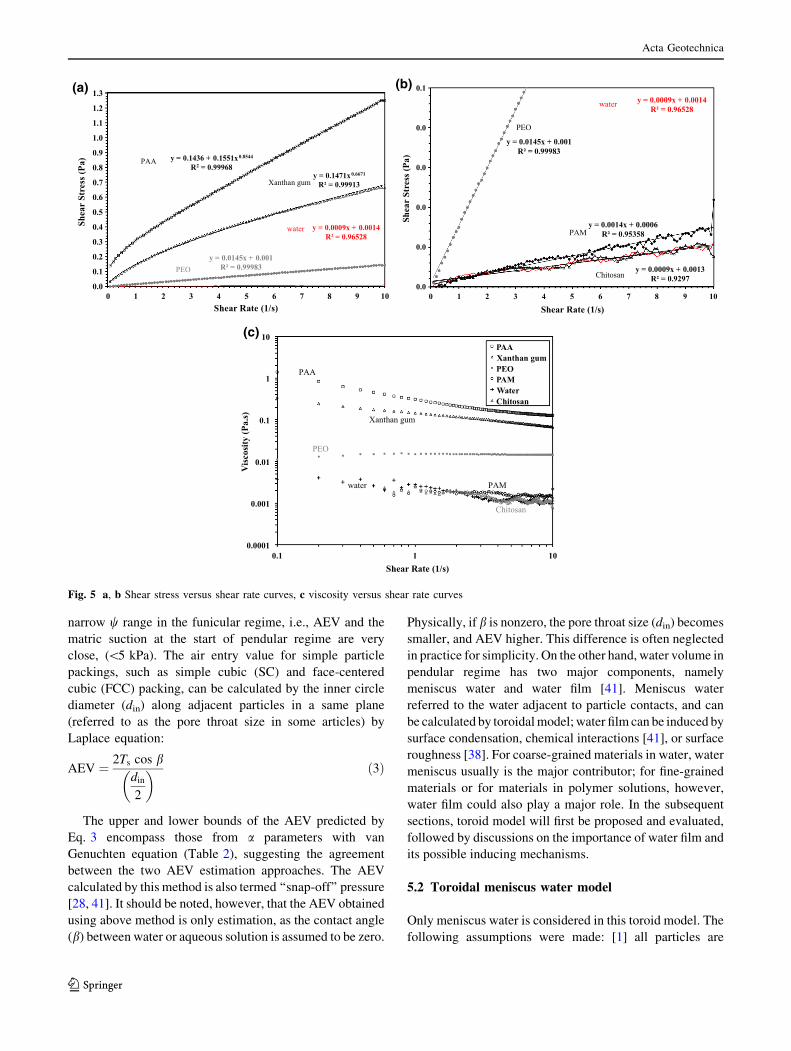
Surface tension, contact angle, and viscosity values of
different polymer solutions are shown in Table 1 and
Fig. 5, respectively. The contact angle ranges from 21.3� to41.3�, and surface tension from 61.8 to 80.5 dyne/cm,
respectively. Noticeable differences were observed when
comparing with water (contact angle of 38.1�, surface
tension of 73.1 dyne/cm).
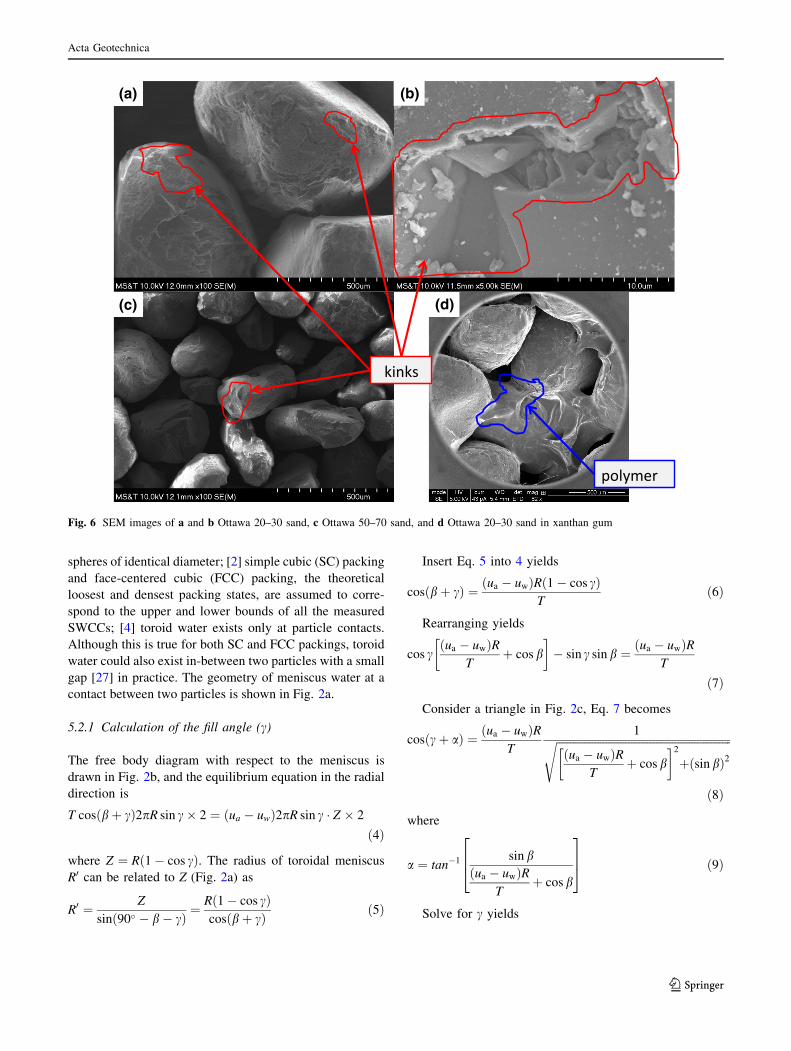
The majority of the particles of both Ottawa 20–30 and
50–70 sands is round or sub-round as revealed by SEM
images (Fig. 6a, c). Small ‘‘kinks,’’ i.e., the micron-sized
dents or defects on the sand surfaces, were observed for
Ottawa 20–30 sand by high-magnification SEM images
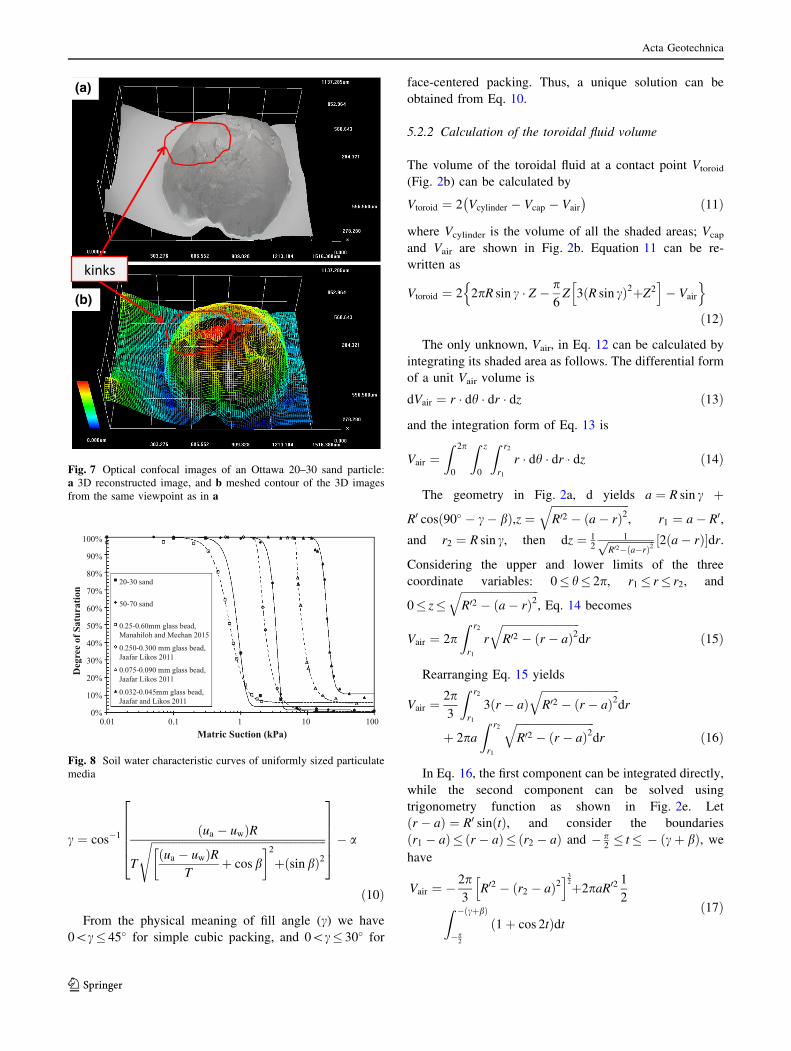
(Fig. 6c). Such kinks on Ottawa 20–30 sand were also
observed from the 3D reconstructed confocal image
(Fig. 7a) or the meshed contour of the 3D image (Fig. 7b).
Polymers, such as xanthan gum, were found to adhere to
the surface of Ottawa 20–30 sand (Fig. 6d).
SWCCs for Ottawa 20–30 and 50–70 sands in water are
shown in Fig. 8. The corresponding fitting parameters with
van Genuchten model are listed in Table 2. SWCCs for
Ottawa 20–30 sand in polymer solutions are shown in
Figs. 9 and 10. These measured SWCC results will be
compared with other poorly graded granular materials and
discussed in details in ‘‘Discussion’’.
5 Discussion
5.1 SWCC of poorly graded granular materials
in water
The grain size distribution curves and the drying soil–water
characteristic curves of Ottawa 20–30 and 50–70 sands
were compared with those of other uniformly sized (poorly
graded) glass beads, including 0.25–0.60 mm glass bead
(d50 = 0.6 mm) used in Manahiloh and Meehan [34],
0.25–0.30 mm (d50 = 0.25 mm), 0.075–0.090 mm
(d50 = 0.09 mm), and 0.032–0.045 mm (d50 = 0.04 mm)
glass beads used in Jaafar and Likos [18] (Figs. 3, 8). Three
independently fitted parameters, namely a (inverse of air
entry value), n and m, in van Genuchten SWCC equation
for all six granular materials are tabulated in Table 2. It
was observed that: (1) as grain size (characterized by d50)
decreases, air entry value (AEV) increases, and matric
suction for the funicular and pendular regimes increases;
(2) all six SWCCs have steep desaturation curves over
air pressure
pressureregulator
ψ =γwh h
Fig. 4 Schematic setup of low suction device for SWCC measurement
Acta Geotechnica
123
narrow w range in the funicular regime, i.e., AEV and the
matric suction at the start of pendular regime are very
close, (\5 kPa). The air entry value for simple particle
packings, such as simple cubic (SC) and face-centered
cubic (FCC) packing, can be calculated by the inner circle
diameter (din) along adjacent particles in a same plane
(referred to as the pore throat size in some articles) by
Laplace equation:
AEV ¼ 2Ts cos bdin
2
� � ð3Þ
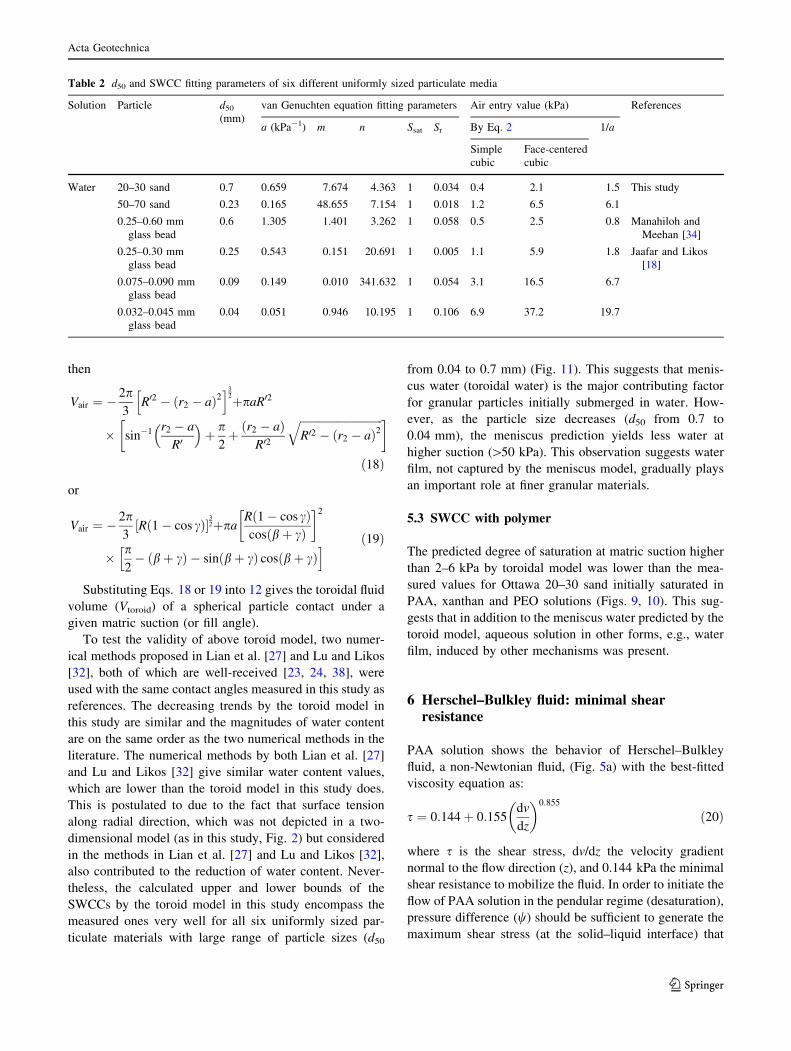
The upper and lower bounds of the AEV predicted by
Eq. 3 encompass those from a parameters with van
Genuchten equation (Table 2), suggesting the agreement
between the two AEV estimation approaches. The AEV
calculated by this method is also termed ‘‘snap-off’’ pressure
[28, 41]. It should be noted, however, that the AEV obtained
using above method is only estimation, as the contact angle
(b) between water or aqueous solution is assumed to be zero.
Physically, if b is nonzero, the pore throat size (din) becomes
smaller, and AEV higher. This difference is often neglected
in practice for simplicity. On the other hand, water volume in
pendular regime has two major components, namely
meniscus water and water film [41]. Meniscus water
referred to the water adjacent to particle contacts, and can
be calculated by toroidalmodel; water film can be induced by
surface condensation, chemical interactions [41], or surface
roughness [38]. For coarse-grained materials in water, water
meniscus usually is the major contributor; for fine-grained
materials or for materials in polymer solutions, however,
water film could also play a major role. In the subsequent
sections, toroid model will first be proposed and evaluated,
followed by discussions on the importance of water film and
its possible inducing mechanisms.
5.2 Toroidal meniscus water model
Only meniscus water is considered in this toroid model. The
following assumptions were made: [1] all particles are
y = 0.1471x0.6671
R² = 0.99913
y = 0.0009x + 0.0014 R² = 0.96528
y = 0.0145x + 0.001 R² = 0.99983
0.0
0.1
0.2
0.3
0.4
0.5
0.6
0.7
0.8
0.9
1.0
1.1
1.2
1.3
0 1 2 3 4 5 6 7 8 9 10
Shea
r St
ress
(Pa)
Shear Rate (1/s)
PAA
Xanthan gum
y = 0.1436 + 0.1551x0.8544
R2 = 0.99968
PEO
water
(a)
y = 0.0009x + 0.0013 R² = 0.9297
y = 0.0014x + 0.0006 R² = 0.95358
y = 0.0009x + 0.0014 R² = 0.96528
y = 0.0145x + 0.001 R² = 0.99983
0.0
0.0
0.0
0.0
0.0
0.1
0 1 2 3 4 5 6 7 8 9 10
Shea
r St
ress
(Pa)
Shear Rate (1/s)
Chitosan
PAM
water
PEO
(b)
0.0001
0.001
0.01
0.1
1
10
0111.0
Vis
cosi
ty (P
a.s)
Shear Rate (1/s)
PAA Xanthan gum PEO PAM Water Chitosan
water
PEO
PAA
Xanthan gum
Chitosan
PAM
(c)
Fig. 5 a, b Shear stress versus shear rate curves, c viscosity versus shear rate curves
Acta Geotechnica
123
spheres of identical diameter; [2] simple cubic (SC) packing
and face-centered cubic (FCC) packing, the theoretical
loosest and densest packing states, are assumed to corre-
spond to the upper and lower bounds of all the measured
SWCCs; [4] toroid water exists only at particle contacts.
Although this is true for both SC and FCC packings, toroid
water could also exist in-between two particles with a small
gap [27] in practice. The geometry of meniscus water at a
contact between two particles is shown in Fig. 2a.
5.2.1 Calculation of the fill angle (c)
The free body diagram with respect to the meniscus is
drawn in Fig. 2b, and the equilibrium equation in the radial
direction is
T cos bþ cð Þ2pR sin c� 2 ¼ ua � uwð Þ2pR sin c � Z � 2
ð4Þ
where Z ¼ R 1� cos cð Þ. The radius of toroidal meniscus
R0 can be related to Z (Fig. 2a) as
R0 ¼ Z
sin 90� � b� cð Þ ¼R 1� cos cð Þcos bþ cð Þ ð5Þ
Insert Eq. 5 into 4 yields
cos bþ cð Þ ¼ ua � uwð ÞR 1� cos cð ÞT
ð6Þ
Rearranging yields
cos cua � uwð ÞR
Tþ cos b
� �� sin c sinb ¼ ua � uwð ÞR
T
ð7Þ
Consider a triangle in Fig. 2c, Eq. 7 becomes
cos cþ að Þ ¼ ua � uwð ÞRT
1ffiffiffiffiffiffiffiffiffiffiffiffiffiffiffiffiffiffiffiffiffiffiffiffiffiffiffiffiffiffiffiffiffiffiffiffiffiffiffiffiffiffiffiffiffiffiffiffiffiffiffiffiffiffiffiffiffiffiffiffiffiffiffiua � uwð ÞR
Tþ cos b
� �2þ sin bð Þ2
s
ð8Þ
where
a ¼ tan�1 sin bua � uwð ÞR
Tþ cos b
264
375 ð9Þ
Solve for c yields
kinks
(a) (b)
(c) (d)
polymer
Fig. 6 SEM images of a and b Ottawa 20–30 sand, c Ottawa 50–70 sand, and d Ottawa 20–30 sand in xanthan gum
Acta Geotechnica
123
c ¼ cos�1 ua � uwð ÞR
T
ffiffiffiffiffiffiffiffiffiffiffiffiffiffiffiffiffiffiffiffiffiffiffiffiffiffiffiffiffiffiffiffiffiffiffiffiffiffiffiffiffiffiffiffiffiffiffiffiffiffiffiffiffiffiffiffiffiffiffiffiffiffiffiua � uwð ÞR
Tþ cos b
� �2þ sin bð Þ2
s
266664
377775� a
ð10Þ
From the physical meaning of fill angle (c) we have
0\c� 45� for simple cubic packing, and 0\c� 30� for
face-centered packing. Thus, a unique solution can be
obtained from Eq. 10.
5.2.2 Calculation of the toroidal fluid volume
The volume of the toroidal fluid at a contact point Vtoroid
(Fig. 2b) can be calculated by
Vtoroid ¼ 2 Vcylinder � Vcap � Vair
� �ð11Þ
where Vcylinder is the volume of all the shaded areas; Vcap
and Vair are shown in Fig. 2b. Equation 11 can be re-
written as
Vtoroid ¼ 2 2pR sin c � Z � p6Z 3 R sin cð Þ2þZ2h i
� Vair
n o
ð12Þ
The only unknown, Vair, in Eq. 12 can be calculated by
integrating its shaded area as follows. The differential form
of a unit Vair volume is
dVair ¼ r � dh � dr � dz ð13Þ
and the integration form of Eq. 13 is
Vair ¼Z 2p
0
Z z
0
Z r2
r1
r � dh � dr � dz ð14Þ
The geometry in Fig. 2a, d yields a ¼ R sin c þ
R0 cos 90� � c� bð Þ,z ¼ffiffiffiffiffiffiffiffiffiffiffiffiffiffiffiffiffiffiffiffiffiffiffiffiffiffiffiffiR02 � a� rð Þ2
q, r1 ¼ a� R0,
and r2 ¼ R sin c, then dz ¼ 12
1ffiffiffiffiffiffiffiffiffiffiffiffiffiffiffiffiffiR02� a�rð Þ2
p 2 a� rð Þ½ �dr.
Considering the upper and lower limits of the three
coordinate variables: 0� h� 2p, r1 � r� r2, and
0� z�ffiffiffiffiffiffiffiffiffiffiffiffiffiffiffiffiffiffiffiffiffiffiffiffiffiffiffiffiR02 � a� rð Þ2
q, Eq. 14 becomes
Vair ¼ 2pZ r2
r1
r
ffiffiffiffiffiffiffiffiffiffiffiffiffiffiffiffiffiffiffiffiffiffiffiffiffiffiffiffiR02 � r � að Þ2
qdr ð15Þ
Rearranging Eq. 15 yields
Vair ¼2p3
Z r2
r1
3 r � að ÞffiffiffiffiffiffiffiffiffiffiffiffiffiffiffiffiffiffiffiffiffiffiffiffiffiffiffiffiR02 � r � að Þ2
qdr
þ 2paZ r2
r1
ffiffiffiffiffiffiffiffiffiffiffiffiffiffiffiffiffiffiffiffiffiffiffiffiffiffiffiffiR02 � r � að Þ2
qdr ð16Þ
In Eq. 16, the first component can be integrated directly,
while the second component can be solved using
trigonometry function as shown in Fig. 2e. Let
r � að Þ ¼ R0 sin tð Þ, and consider the boundaries
r1 � að Þ� r � að Þ� r2 � að Þ and � p2� t� � cþ bð Þ, we
have
Vair ¼ � 2p3
R02 � r2 � að Þ2h i3
2þ2paR02 1
2Z � cþbð Þ
�p2
1þ cos 2tð Þdtð17Þ
kinks
(a)
(b)
Fig. 7 Optical confocal images of an Ottawa 20–30 sand particle:
a 3D reconstructed image, and b meshed contour of the 3D images
from the same viewpoint as in a
0%
10%
20%
30%
40%
50%
60%
70%
80%
90%
100%
0.01 0.1 1 10 100
Deg
ree
of S
atur
atio
n
Matric Suction (kPa)
20-30 sand
50-70 sand
0.25-0.60mm glass bead, Manahiloh and Meehan 2015
0.250-0.300 mm glass bead, Jaafar Likos 2011
0.075-0.090 mm glass bead, Jaafar Likos 2011
0.032-0.045mm glass bead, Jaafar and Likos 2011
Fig. 8 Soil water characteristic curves of uniformly sized particulate
media
Acta Geotechnica
123
then
Vair ¼ � 2p3
R02 � r2 � að Þ2h i3
2þpaR02
� sin�1 r2 � a
R0
þ p
2þ r2 � að Þ
R02
ffiffiffiffiffiffiffiffiffiffiffiffiffiffiffiffiffiffiffiffiffiffiffiffiffiffiffiffiffiffiR02 � r2 � að Þ2
q� �
ð18Þ
or
Vair ¼ � 2p3
R 1� cos cð Þ½ �32þpa
R 1� cos cð Þcos bþ cð Þ
� �2
� p2� bþ cð Þ � sin bþ cð Þ cos bþ cð Þ
h i ð19Þ
Substituting Eqs. 18 or 19 into 12 gives the toroidal fluid
volume (Vtoroid) of a spherical particle contact under a
given matric suction (or fill angle).
To test the validity of above toroid model, two numer-
ical methods proposed in Lian et al. [27] and Lu and Likos
[32], both of which are well-received [23, 24, 38], were
used with the same contact angles measured in this study as
references. The decreasing trends by the toroid model in
this study are similar and the magnitudes of water content
are on the same order as the two numerical methods in the
literature. The numerical methods by both Lian et al. [27]
and Lu and Likos [32] give similar water content values,
which are lower than the toroid model in this study does.
This is postulated to due to the fact that surface tension
along radial direction, which was not depicted in a two-
dimensional model (as in this study, Fig. 2) but considered
in the methods in Lian et al. [27] and Lu and Likos [32],
also contributed to the reduction of water content. Never-
theless, the calculated upper and lower bounds of the
SWCCs by the toroid model in this study encompass the
measured ones very well for all six uniformly sized par-
ticulate materials with large range of particle sizes (d50
from 0.04 to 0.7 mm) (Fig. 11). This suggests that menis-
cus water (toroidal water) is the major contributing factor
for granular particles initially submerged in water. How-
ever, as the particle size decreases (d50 from 0.7 to
0.04 mm), the meniscus prediction yields less water at
higher suction ([50 kPa). This observation suggests water
film, not captured by the meniscus model, gradually plays
an important role at finer granular materials.
5.3 SWCC with polymer
The predicted degree of saturation at matric suction higher
than 2–6 kPa by toroidal model was lower than the mea-
sured values for Ottawa 20–30 sand initially saturated in
PAA, xanthan and PEO solutions (Figs. 9, 10). This sug-
gests that in addition to the meniscus water predicted by the
toroid model, aqueous solution in other forms, e.g., water
film, induced by other mechanisms was present.
6 Herschel–Bulkley fluid: minimal shearresistance
PAA solution shows the behavior of Herschel–Bulkley
fluid, a non-Newtonian fluid, (Fig. 5a) with the best-fitted
viscosity equation as:
s ¼ 0:144þ 0:155dv
dz
� �0:855
ð20Þ
where s is the shear stress, dv/dz the velocity gradient
normal to the flow direction (z), and 0.144 kPa the minimal
shear resistance to mobilize the fluid. In order to initiate the
flow of PAA solution in the pendular regime (desaturation),
pressure difference (w) should be sufficient to generate the
maximum shear stress (at the solid–liquid interface) that
Table 2 d50 and SWCC fitting parameters of six different uniformly sized particulate media
Solution Particle d50(mm)
van Genuchten equation fitting parameters Air entry value (kPa) References
a (kPa-1) m n Ssat Sr By Eq. 2 1/a
Simple
cubic
Face-centered
cubic
Water 20–30 sand 0.7 0.659 7.674 4.363 1 0.034 0.4 2.1 1.5 This study
50–70 sand 0.23 0.165 48.655 7.154 1 0.018 1.2 6.5 6.1
0.25–0.60 mm
glass bead
0.6 1.305 1.401 3.262 1 0.058 0.5 2.5 0.8 Manahiloh and
Meehan [34]
0.25–0.30 mm
glass bead
0.25 0.543 0.151 20.691 1 0.005 1.1 5.9 1.8 Jaafar and Likos
[18]
0.075–0.090 mm
glass bead
0.09 0.149 0.010 341.632 1 0.054 3.1 16.5 6.7
0.032–0.045 mm
glass bead
0.04 0.051 0.946 10.195 1 0.106 6.9 37.2 19.7
Acta Geotechnica
123

overcomes the minimal shear resistance of PAA solution
(0.144 kPa). This w requirement could be very high for
PAA solutions residing in spaces with small pore throat
size, as the degree of saturation remains at 0.1 even though
w reaches 100 kPa (Fig. 10a). As a result, higher degree of
saturation (more liquid) was observed in pendular regime
for SWCC of sand in a PAA solution than in water
(Fig. 10a).
7 Water retention due to surface roughness
Although not a Herschel–Bulkley fluid, xanthan gum
solution exhibits shear-thinning behavior as expressed in
Eq. 21:
s ¼ 0:147dv
dz
� �0:667
ð21Þ
An even higher residual degree of saturation was
observed than that of the SWCC curve in PAA solution
(Fig. 10). SEM and optical confocal imaging investigations
on the surface roughness of the Ottawa 20–30 sand
revealed that the sand surfaces contain small kinks
(Figs. 6b, 7b), which might trap xanthan fluids and
therefore retain a portion of aqueous solution on the
particle surface, or, water film.
Apart from above mechanisms, the thickness of surface
water film depends on Van der Waals force between the
solid surface and fluid [6]. Xanthan gum solution is sticky
and is widely used as food thickening agent. The
0.0
0.1
0.2
0.3
0.4
0.5
0.6
0.7
0.8
0.9
1.0
0.01 0.1 1 10 100
Deg
ree
of S
atur
atio
n
Matric suction (kPa)
Chitosan water SC, toroid, this study FC, toroid, this study SC, Lian et al. 1993 FC, Lian et al. 1993 SC, Lu and Likos 2004 FC, Lu and Likos 2004
0.0
0.1
0.2
0.3
0.4
0.5
0.6
0.7
0.8
0.9
1.0
0.01 0.1 1 10 100
Deg
ree
of S
atur
atio
n
Matric suction (kPa)
PAM water SC, toroid, this study FC, toroid, this study SC, Lian et al. 1993 FC, Lian et al. 1993 SC, Lu and Likos 2004 FC, Lu and Likos 2004
0.0
0.1
0.2
0.3
0.4
0.5
0.6
0.7
0.8
0.9
1.0
0.01 0.1 1 10 100
Deg
ree
of S
atur
atio
n
Matric suction (kPa)
PEO water SC, toroid, this study FC, toroid, this study SC, Lian et al. 1993 FC, Lian et al. 1993 SC, Lu and Likos 2004 FC, Lu and Likos 2004
(a)
(c)
(b)
Fig. 9 Soil water characteristic curves for Ottawa sand saturated with a chitosan, b PAM, and c PEO solutions
Acta Geotechnica
123

chemical interaction, possibly van der Waals force,
between the polymer solutions and sand surfaces might
also contribute to the water retention [14, 16]. The SEM
image also revealed that xanthan gum stuck at the sand
surfaces (Fig. 6d). Above observations lead to the postu-
lation that due to the adhesiveness (possibly originated
from van der Waals force), higher matric suction is nee-
ded to desaturate the xanthan gum in Ottawa 20–30 sand.
Similarly, PEO also showed residual degree of saturation,
which might also be due to the adhesion to the rough sand
surfaces.
PAM and chitosan solutions have similar surface
tension, contact angle and viscosity as water. But both
showed high degree of saturation than water at matric
suction less than 25 kPa. The adhesion (due to van der
Waals interaction and rough surface) might contribute to
the water retention. At matric suction of 50 kPa, the
majority of both solutions were desaturated, indicating
the weak effects of the adhesion of chitosan and PAM
solutions. High degree of saturation at similar matric
suction range (0–50 kPa) was also reported for F-75 sand
(d50 = 0.3 mm) in PAM solutions by Jung and Jang
[20].
To sum up, besides surface tension and contact angle,
which are the two major parameters for SWCC of water
saturated uniformly sized particulate media, viscosity, the
kinks on the rough surface, and the apparent adhesive
force could also play an important role in SWCC of
polymer solution saturated uniformly sized particulate
media.
8 Conclusions
In this study, Tempe cell with self-developed horizontal
hanging column attachment was used to determine the soil
water characteristic curves of uniformly sized sands ini-
tially saturated with water and polymer solutions. Air entry
values predicted by the pore throat size are similar to those
from a parameters with van Genuchten equation. A toroidal
meniscus water model, incorporating the measured surface
tension and contact angle values, was proposed to calculate
the volume of water in pendular regime and was compared
to well-received numerical methods. The calculated upper
and lower bounds by this toroidal water model encom-
passed all six measured SWCCs of uniformly sized gran-
ular materials with a wide d50 range (0.7–0.04 mm) in
water, which suggests meniscus water is dominant in this
case.
For the case of water in pendular regime at SWCCs of
poorly graded Ottawa 20–30 sand initially saturated with
polymer solutions, the proposed toroidal model predicted
lower water contents than the measured ones. Other form
of aqueous solution, such as water film surrounding the
particle surfaces, could be present. Through viscosity
measurement, SEM, and optical confocal imaging
(a) (b)
0.0
0.1
0.2
0.3
0.4
0.5
0.6
0.7
0.8
0.9
1.0
0.01 0.1 1 10 100
Deg
ree
of S
atur
atio
n
Matric suction (kPa)
PAA water SC, toroid, this study FC, toroid, this study SC, Lian et al. 1993 FC, Lian et al. 1993 SC, Lu and Likos 2004 FC, Lu and Likos 2004
0.0
0.1
0.2
0.3
0.4
0.5
0.6
0.7
0.8
0.9
1.0
0.01 0.1 1 10 100
Deg
ree
of S
atur
atio
n
Matric suction (kPa)
xanthan gum
water
SC, toroid, this study
FC, toroid, this study
SC, Lian et al. 1993
FC, Lian et al. 1993
SC, Lu and Likos 2004
FC, Lu and Likos 2004
Fig. 10 Soil water characteristic curves for Ottawa sand saturated with a PAA and b xanthan gum solutions
Acta Geotechnica
123

0.0
0.1
0.2
0.3
0.4
0.5
0.6
0.7
0.8
0.9
1.0
0.01 0.1 1 10 100
Deg
ree
of S
atur
atio
n
Matric suction (kPa)
0.25-0.3mm GB, Jaafar and Likos 2011
SC, Lian et al. 1993
FC, Lian et al. 1993
SC, toroid, this study
FC, toroid, this study
SC, Lu and Likos 2004
FC, Lu and Likos 2004
0.0
0.1
0.2
0.3
0.4
0.5
0.6
0.7
0.8
0.9
1.0
0.01 0.1 1 10 100
Deg
ree
of S
atur
atio
n
Matric suction (kPa)
0.075-0.09mm GB, Jaafar and Likos 2011
SC, toroid, this study
FC, toroid, this study
SC, Lian et al. 1993
FC, Lian et al. 1993
SC, Lu and Likos 2004
FC, Lu and Likos 2004
0.0
0.1
0.2
0.3
0.4
0.5
0.6
0.7
0.8
0.9
1.0
0.01 0.1 1 10 100
Deg
ree
of S
atur
atio
n
Matric suction (kPa)
0.032-0.045m m GB, Jaafar and Likos 2011
SC, toroid, this study
FC, toroid, this study
SC, Lian et al. 1993
FC, Lian et al. 1993
SC, Lu and Likos 2004
FC, Lu and Likos 2004
0.0
0.1
0.2
0.3
0.4
0.5
0.6
0.7
0.8
0.9
1.0
0.01 0.1 1 10 100
Deg
ree
of S
atur
atio
n
Matric suction (kPa)
0.25-0.60mm GB, Manahiloh and Meehan 2015 SC, toroid, this study
FC, toroid, this study
SC, Lian et al. 1993
FC, Lian et al. 1993
SC, Lu and Likos 2004
FC, Lu and Likos 2004
0.0
0.1
0.2
0.3
0.4
0.5
0.6
0.7
0.8
0.9
1.0
0.01 0.1 1 10 100
Volu
met
ric
wat
er c
onte
nt
Matric suction (kPa)
50-70 sand SC, toroid, this study FC, toroid, this study SC, Lian et al. 1993 FC, Lian et al. 1993 SC, Lu and Likos 2004 FC, Lu and Likos 2004
0.0
0.1
0.2
0.3
0.4
0.5
0.6
0.7
0.8
0.9
1.0
0.01 0.1 1 10 100
Volu
met
ric
wat
er c
onte
nt
Matric suction (kPa)
20-30 sand SC, Toroid, this study FC, Toroid, this study SC, Lian et al. 1993 FC, Lian et al. 1993 SC, Lu and Likos 2004 FC, Lu and Likos 2004
(a) (b)
(c) (d)
(e) (f)
Fig. 11 Calculated soil water characteristic curves of different uniformly sized particulate media with simple cubic and face-centered packing
Acta Geotechnica
123
investigations, it was concluded that Herschel–Bulkley
fluid, surface roughness, and the possible chemical inter-
actions (such as van der Waals interaction between the
polymer solution and solid surface) could contribute to
retention of aqueous solution.
Acknowledgements Firstly, the authors would like to acknowledge
the comments and suggestions from the anonymous reviewers, which
help improve the quality of this manuscript. Secondly, Dr. Min Zhang
helped with the setup and instruction of using SWCC device, Mr.
Xiaoyi Zhao performed most of the SWCC tests during his master
study, and Dr. Xin Kang helped with repeating selected SWCC tests.
Their contributions are greatly appreciated. Finally, the financial
supports by both the One-Thousand-Young-Talents Program of the
Organization Department of the CPC Central Committee and the
100-Talents Program of Zhejiang University to the corresponding
author are deeply appreciated.
References
1. Ba-Te (2004) Flow of air-phase in soils and its application in
emergent stabilization of soil slopes. Hong Kong University of
Science and Technology, Hong Kong
2. Bate B, Zhang LM (2013) Use of vacuum for the stabilization of
dry sand slopes. J Geotech Geoenviron Eng 139(1):143–151
3. Borja RI, Song X, Wu W (2013) Critical state plasticity. Part VII:
Triggering a shear band in variably saturated porous media.
Comput Methods Appl Mech Eng 261:66–82
4. Cabalar AF, Canakci H (2005) Ground improvement by bacteria.
In: Proceedings of 3rd Biot conference on poromechanics. A.A.
Balkema, pp 707–712
5. Cao SC, Bate B, Hu JW, Jung J (2016) Engineering behavior and
characteristics of water-soluble polymers: implication on soil
remediation and enhanced oil recovery. Sustainability 8(3):205
6. ChoGC, Santamarina JC (2001)Unsaturated particulatematerials—
particle-level studies. J Geotech Geoenviron Eng 127(1):84–96
7. Dai S, Santamarina JC, Waite WF, Kneafsey TJ (2012) Hydrate
morphology: physical properties of sands with patchy hydrate
saturation. J Geophys Res 117(B11):B11205
8. Di Emidio G, Mazzieri F, Verastegui-Flores RD, Van Impe W,
Bezuijen A (2015) Polymer-treated bentonite clay for chemical-
resistant geosynthetic clay liners. Geosynth Int 22(1):125–137
9. Espinoza DN, Santamarina JC (2010) Water–CO2-mineral sys-
tems: interfacial tension, contact angle, and diffusion—implica-
tions to CO2 geological storage. Water Resour Res 46:W07537
10. Fredlund DG, Morgenstern NR, Widger A (1978) Shear strength
of unsaturated soils. Can Geotech J 15:313–321
11. Fredlund DG, Rahardjo H (1993) Soil mechanics for unsaturated
soils. Wiley, New York
12. Fredlund DG, Rahardjo H, Fredlund MD (2012) Unsaturated soil
mechanics in engineering practice. Wiley, New York
13. Fredlund DG, Xing A, Huang S (1994) Predicting the perme-
ability function for unsaturated soils using the soil–water char-
acteristic curve. Can Geotech J 31:533–546
14. Gee ML, Healy TW (1990) Hydrophobicity effects in the con-
densation of water films on quartz. J Colloid Interface Sci
140(2):450–465
15. Gitirana GDFN, Fredlund DG (2004) Soil–water characteristic
curve equation with independent properties. J Geotech Geoen-
viron Eng 130(2):209–212
16. Gotze T, Sonntag H (1988) Forces between quartz surfaces
bearing adsorbed macromolecules in good solvents. Colloids Surf
31(88):181–201
17. Ivanov V, Chu J (2008) Applications of microorganisms to
geotechnical engineering for bioclogging and biocementation of
soil in situ. Rev Environ Sci Bio/Technol 7(2):139–153
18. Jaafar R, Likos WJ (2011) Estimating water retention charac-
teristics of sands from grain size distribution using idealized
packing conditions. Geotech Test J 34(5):1–14
19. Javadi S, Ghavami M, Zhao Q, Bate B (2017) Advection and
retardation of non-polar contaminants in compacted clay barrier
material with organoclay amendment. Appl Clay Sci 142:30–39
20. Jung J, Jang J (2016) Soil–water characteristic curve of sediments
containing a polyacrylamide solution. Geotech Lett 6(1):89–94
21. Jung J, Jang J, Ahn J (2016) Characterization of a polyacrylamide
solution used for remediation of petroleum contaminated soils.
Materials 9(1):16
22. Kang X, Bate B (2016) shear wave velocity and its anisotropy of
polymer modified high-volume class-F fly ash–kaolinite mix-
tures. J Geotech Geoenviron Eng. doi:10.1061/(ASCE)GT.1943-
5606.0001562
23. Lechman J, Lu N (2008) Capillary force and water retention
between two uneven-sized particles. J Eng Mech 134(5):374–384
24. Lechman J, Lu N, Wu D (2006) Hysteresis of matric suction and
capillary stress in monodisperse disk-shaped particles. J Eng
Mech 132(5):565–577
25. Leong EC, Rahardjo H (1997) Review of water characteristic
curve functions. Geotech Geoenviron Eng 123:1106–1117
26. Li X, Zhang LM, Li JH (2009) Development of a modified axis
translation technique for measuring SWCCs for gravel soils at
very low suctions. Geotech Test J 32(6):478–488
27. Lian G, Thornton C, Adams MJ (1993) A theoretical study of the
liquid bridge forces between two rigid spherical bodies. J Colloid
Interface Sci 161(1):138–147
28. Likos WJ, Jaafar R (2013) Pore-scale model for water retention
and fluid partitioning of partially saturated granular soil.
J Geotech Geoenviron Eng 139(5):724–737
29. Lins Y, Schanz T, Fredlund DG (2009) Modified pressure plate
apparatus and column testing device for measuring SWCC of
sand. Geotech Test J 32(5):450–464
30. Lu N (2016) Generalized soil water retention equation for
adsorption and capillarity. J Geotech Geoenviron Eng
142(10):04016051
31. Lu N, Kim T-H, Sture S, Likos WJ (2009) Tensile strength of
unsaturated sand. J Eng Mech 135(12):1410–1419
32. Lu N, Likos WJ (2004) Unsaturated soil mechanics. Wiley, New
York
33. Lu N, Wu B, Tan CP (2007) Tensile strength characteristics of
unsaturated sands. J Geotech Geoenviron Eng 133(2):144–154
34. Manahiloh KN, Meehan CL (2015) Evolution of interphase
contact angle in partially saturated granular soils using digital
analysis of X-ray computed tomography images. Geotechnical
Special Publication, pp 2092–2101
35. Martin GR, Yen TF, Karimi S (1996) Application of biopolymer
technology in silty soil matrices to form impervious barriers. In:
Proceedings of 7th Australia–New Zealand geomechanics con-
ference, Adelaide, Australia
36. Mitarai N, Nori F (2006) Wet granular materials. Adv Phys
55(1–2):1–45
37. Mitchell JK, Santamarina JC (2005) Biological considerations in
geotechnical engineering. J Geotech Geoenviron Eng
131(10):1222–1233
38. Molenkamp F, Nazemi AH (2003) Interactions between two
rough spheres, water bridge and water vapor. Geotechnique
53(2):255–264
39. Mollaei A, Lake LW, Delshad M (2011) Application and vari-
ance based sensitivity analysis of surfactant–polymer flooding
using modified chemical flood predictive model. J Pet Sci Eng
79(1–2):25–36
Acta Geotechnica
123

40. Montoya BM, DeJong JT, Boulanger RW (2013) Dynamic
response of liquefiable sand improved by microbial-induced
calcite precipitation. Geotechnique 63(4):302–312
41. Or D, Tuller M (1999) Liquid retention and interfacial area in
variably saturated porous media: upscaling from single-pore to
sample-scale model. Water Resour Res 35(12):3591–3605
42. Pham HQ (2005) A volume-mass constitutive model for unsat-
urated soils. PhD, University of Saskatchewan
43. Puppala AJ, Punthutaecha K, Vanapalli SK (2006) Soil–water
characteristic curves of stabilized expansive soils. J Geotech
Geoenviron Eng 132(6):736–751
44. Scalia J, Benson CH, Bohnhoff GL, Edil TB, Shackelford CD
(2014) Long-term hydraulic conductivity of a bentonite-polymer
composite permeated with aggressive inorganic solutions.
J Geotech Geoenviron Eng 140(3):04013025
45. Scheel M, Seemann R, Brinkmann M, Di Michiel M, Sheppard
A, Breidenbach B, Herminghaus S (2008) Morphological clues to
wet granular pile stability. Nat Mater 7(3):189–193
46. Song X (2017) Transient bifurcation condition of partially satu-
rated porous media at finite strain. Int J Numer Anal Methods
Geomech 41:135–156. doi:10.1002/nag.2552
47. Song X, Borja RI (2014) Mathematical framework for unsatu-
rated flow in the finite deformation range. Int J Numer Methods
Eng 14(9):658–682
48. Song X, Borja RI (2014) Finite deformation and fluid flow in
unsaturated soils with random heterogeneity. Vadose Zone J
13(5). doi:10.2136/vzj2013.07.0131
49. Song X, Ye M, Wang K (2017) Strain localization in a solid-
water-air system with random heterogeneity via stabilized mixed
finite elements. Int J Numer Methods Eng. doi:10.1002/nme.5590
50. Song X, Wang K, Ye M (2017) Localized failure in unsaturated
soils under non-isothermal conditions. Acta Geotech. doi:10.
1007/s11440-017-0534-4
51. Tokunaga TK, Wan J, Jung J-W, Kim TW, Kim Y, Dong W
(2013) Capillary pressure and saturation relations for supercritical
CO2 and brine in sand: high-pressure Pc(Sw) controller/meter
measurements and capillary scaling predictions. Water Resour
Res 49:1–14
52. van Genuchten MT (1980) A closed form equation for predicting
the hydraulic conductivity of unsaturated soils. Soil Sci Soc Am J
44:892–898
53. Yeom SH, Daugulis AJ, Lee SH (2010) Bioremediation of phe-
nol-contaminated water and soil using magnetic polymer beads.
Process Biochem 45(9):1582–1586
54. Zhao X (2014) Measurements and transient multistep outflow
simulation of soil–water characteristic curve for soils modified
with biopolymers. Master of Science, Missouri University of
Science and Technology
55. Zhao Q, Choo H, Bhatt A, Burns SE, Bate B (2017) Review of
the fundamental geochemical and physical behaviors of organ-
oclays in barrier applications. Appl Clay Sci 142:2–20
Acta Geotechnica
123


![Engineering Behavior and Characteristics of Water …web.mst.edu/~bateba/Bate_Js/Bate2016Sustainability.pdfenhanced oil recovery [39–41]. Considering their lower cost and higher](https://static.fdocuments.net/doc/165x107/5f7ee071038f5d0c0c35d3b6/engineering-behavior-and-characteristics-of-water-webmstedubatebabatejsba.jpg)