On the practical identifiability of a two-parameter model ...
15
On the practical identifiability of a two‑parameter model of pulmonary gas exchange Axel Riedlinger, Jörn Kretschmer * and Knut Möller Abstract Background: Successful application of mechanical ventilation as a life-saving therapy implies appropriate ventilator settings. Decision making is based on clinicians’ knowl- edge, but can be enhanced by mathematical models that determine the individual patient state by calculating parameters that are not directly measurable. Evaluation of models may support the clinician to reach a defined treatment goal. Bedside applica- bility of mathematical models for decision support requires a robust identification of the model parameters with a minimum of measuring effort. The influence of appropri- ate data selection on the identification of a two-parameter model of pulmonary gas exchange was analyzed. Methods: The model considers a shunt as well as ventilation-perfusion-mismatch to simulate a variety of pathologic pulmonary gas exchange states, i.e. different severities of pulmonary impairment. Synthetic patient data were generated by model simulation. To incorporate more realistic effects of measurement errors, the simulated data were corrupted with additive noise. In addition, real patient data retrieved from a patient data management system were used retrospectively to confirm the obtained findings. The model was identified to a wide range of different FiO 2 settings. Just one single measurement was used for parameter identification. Subsequently prediction perfor- mance was obtained by comparing the identified model predicted oxygen level in arterial blood either to exact data taken from simulations or patients measurements. Results: Structural identifiability of the model using one single measurement for the identification process could be demonstrated. Minimum prediction error of blood oxygenation depends on blood gas level at the time of system identification i.e. the measurement situation. For severe pulmonary impairment, higher FiO 2 settings were required to achieve a better prediction capability compared to less impaired pulmo- nary states. Plausibility analysis with real patient data could confirm this finding. Discussion and conclusions: Dependent on patients’ pulmonary state, the influence of ventilator settings (here FiO 2 ) on model identification of the gas exchange model could be demonstrated. To maximize prediction accuracy i.e. to find the best individu- alized model with as few data as possible, best ranges of FiO 2 -settings for parameter identification were obtained. A less effort identification process, which depends on the pulmonary state, can be deduced from the results of this identifiability analysis. Keywords: Physiological modeling, Gas exchange model, Parameter identification Open Access © 2015 Riedlinger et al. This article is distributed under the terms of the Creative Commons Attribution 4.0 International License (http://creativecommons.org/licenses/by/4.0/), which permits unrestricted use, distribution, and reproduction in any medium, provided you give appropriate credit to the original author(s) and the source, provide a link to the Creative Commons license, and indicate if changes were made. The Creative Commons Public Domain Dedication waiver (http://creativecommons.org/publicdo- main/zero/1.0/) applies to the data made available in this article, unless otherwise stated. RESEARCH Riedlinger et al. BioMed Eng OnLine (2015) 14:82 DOI 10.1186/s12938‑015‑0077‑6 *Correspondence: [email protected] Institute of Technical Medicine, Furtwangen University, Jakob-Kienzle-Straße 17, 78054 Villingen-Schwenningen, Germany
Transcript of On the practical identifiability of a two-parameter model ...

On the practical identifiability of a two‑parameter model of pulmonary gas exchangeAxel Riedlinger, Jörn Kretschmer* and Knut Möller
Abstract
Background: Successful application of mechanical ventilation as a life-saving therapy implies appropriate ventilator settings. Decision making is based on clinicians’ knowl-edge, but can be enhanced by mathematical models that determine the individual patient state by calculating parameters that are not directly measurable. Evaluation of models may support the clinician to reach a defined treatment goal. Bedside applica-bility of mathematical models for decision support requires a robust identification of the model parameters with a minimum of measuring effort. The influence of appropri-ate data selection on the identification of a two-parameter model of pulmonary gas exchange was analyzed.
Methods: The model considers a shunt as well as ventilation-perfusion-mismatch to simulate a variety of pathologic pulmonary gas exchange states, i.e. different severities of pulmonary impairment. Synthetic patient data were generated by model simulation. To incorporate more realistic effects of measurement errors, the simulated data were corrupted with additive noise. In addition, real patient data retrieved from a patient data management system were used retrospectively to confirm the obtained findings. The model was identified to a wide range of different FiO2 settings. Just one single measurement was used for parameter identification. Subsequently prediction perfor-mance was obtained by comparing the identified model predicted oxygen level in arterial blood either to exact data taken from simulations or patients measurements.
Results: Structural identifiability of the model using one single measurement for the identification process could be demonstrated. Minimum prediction error of blood oxygenation depends on blood gas level at the time of system identification i.e. the measurement situation. For severe pulmonary impairment, higher FiO2 settings were required to achieve a better prediction capability compared to less impaired pulmo-nary states. Plausibility analysis with real patient data could confirm this finding.
Discussion and conclusions: Dependent on patients’ pulmonary state, the influence of ventilator settings (here FiO2) on model identification of the gas exchange model could be demonstrated. To maximize prediction accuracy i.e. to find the best individu-alized model with as few data as possible, best ranges of FiO2-settings for parameter identification were obtained. A less effort identification process, which depends on the pulmonary state, can be deduced from the results of this identifiability analysis.
Keywords: Physiological modeling, Gas exchange model, Parameter identification
Open Access
© 2015 Riedlinger et al. This article is distributed under the terms of the Creative Commons Attribution 4.0 International License (http://creativecommons.org/licenses/by/4.0/), which permits unrestricted use, distribution, and reproduction in any medium, provided you give appropriate credit to the original author(s) and the source, provide a link to the Creative Commons license, and indicate if changes were made. The Creative Commons Public Domain Dedication waiver (http://creativecommons.org/publicdo-main/zero/1.0/) applies to the data made available in this article, unless otherwise stated.
RESEARCH
Riedlinger et al. BioMed Eng OnLine (2015) 14:82 DOI 10.1186/s12938‑015‑0077‑6
*Correspondence: [email protected] Institute of Technical Medicine, Furtwangen University, Jakob-Kienzle-Straße 17, 78054 Villingen-Schwenningen, Germany

Page 2 of 15Riedlinger et al. BioMed Eng OnLine (2015) 14:82
BackgroundMechanical ventilation is a life-saving intervention in intensive care, maintaining pulmo-nary function in critically ill patients. Appropriate ventilator settings need to be found by the clinician to ensure both sufficient oxygenation and carbon dioxide removal. Tar-get values for arterial partial pressures of oxygen (PaO2) and carbon dioxide (PaCO2) can be reached by changing inspired oxygen fraction (FiO2) and minute ventilation (MV). Removal of CO2 and therefore PaCO2 in the patient is mainly regulated by adjust-ing MV. In critically ill patients, e.g. patients suffering from acute respiratory distress syndrome (ARDS), high levels of FiO2 and appropriate PEEP are usually necessary to ensure sufficient oxygenation. Finding the appropriate FiO2 setting follows a trial-and-error approach that may not only be tedious but also exposes the patient to the potential risk of hypoxia and hyperoxia [1–4]. Pulse oximetry allows a continuous measurement of peripheral oxygen saturation (SpO2), however this method has limitations in sensitiv-ity and accuracy due to calibration assumptions, optical interference, and signal artifact [5]. Therefore, an invasive blood gas analysis is required at the end of each trial to evalu-ate the individual effect of a change in FiO2 accurately.
In mechanical ventilation therapy, both the risk of ventilator induced lung injury (VILI) and the effort to find adequate settings may be reduced if medical decision sup-port would provide recommendations on how to adjust a patient’s settings to reach a prescribed treatment goal. In general, decision support can be divided into knowledge based (KDSS) and model based systems (MDSS). KDSS builds on rules of typical i.e. average patient behavior to represent reactions to changes of ventilator settings. In con-trast, MDSS that are adapted to patient specific physiologic properties can simulate the individual reaction to changes in therapy settings. Using the inverse model, MDSS there-fore suggests individualized ventilator settings by evaluating the approximated physiol-ogy of the patient.
Parameters of a model contain compact information about the individual patient state and dynamics once they are quantified in a parameter identification process (PIP). Parameter identification requires information from patient measurements often obtained during certain clinical maneuvers. Success and robustness of the PIP strongly depends on the properties of the model to reflect the required dynamics of the patient, the signal quality and amount of data available at the bedside. As the identified param-eters are used for forward calculation of the model equations, they directly influence prediction performance of the model. While using multiple and even redundant meas-urements helps compensating noise induced errors, measurement efforts and applying the necessary maneuvers should not interfere with clinical processes. Thus, those meas-urements should be kept to the minimum necessary to ensure a robust PIP.
Models of pulmonary gas exchange are able to predict the effect of FiO2 and MV on PaO2 and PaCO2 in the patient. One-parameter models [6, 7] usually only consider shunt, i.e. the amount of venous blood that is mixed with the oxygenated blood, to describe a patient’s oxygenation status and to predict the effect of an increase of FiO2 on PaO2. However, using only one parameter to describe gas exchange impairments fails at low FiO2 when mismatches between alveolar ventilation (V) and perfusion (Q) occur. Several studies [8, 9] have come to the conclusion that PaO2/FiO2 ratio, usually used to categorize lung impairment, changes with FiO2. Thus, besides shunt, mathematical

Page 3 of 15Riedlinger et al. BioMed Eng OnLine (2015) 14:82
models of gas exchange should either include a parameter to describe oxygen diffusion limitation [10, 11] or a parameter to characterize V /Q mismatch [9, 12–14]. Latter have shown to reproduce measurements at different oxygenation levels with sufficient accu-racy compared to more complex models or MIGET measurements [15]. A two-parame-ter model of pulmonary gas exchange including shunt and V /Q mismatch has previously been published by Kjaergaard et al. [12]. Karbing et al. [16] evaluated this model with data of severely ill intensive care patients. The model has been found to be identifiable with four pulse oxymetric (SpO2) measurements at different levels of FiO2 and one blood gas analysis (BGA) providing PaO2 and PaCO2 together with the acid–base parameters pH, base excess (BE) and the hemoglobin concentration (cHb) as well as the end-tidal gas fractions of oxygen (FetO2) and carbon dioxide (FetCO2). Although systems have been built to perform the necessary measurements in 10–15 min [17], lowering the number of measurements required for identification and therefore minimizing the required time and effort is highly relevant. Therefore we investigated if the number of measurements that are necessary to identify the model can be reduced to one FiO2-setting. Addition-ally, we evaluated the influence of the chosen level of FiO2 during model identification.
MethodsGas exchange model with V/Q‑mismatch and shunt
The mathematical model of human pulmonary gas exchange consists of two alveo-lar compartments that are perfused and ventilated and one shunt compartment that is perfused but not ventilated. The alveolar compartments are separated into a compart-ment with high V /Q-ratio and a compartment with low V /Q-ratio. This allows the consideration and simulation of limitations in gas exchange for both oxygen (O2) and carbon dioxide (CO2) concentrations in blood. Shunt, i.e. the fraction of venous blood not participating in gas exchange, is quantified by model parameter fs multiplied with blood flow Q. 90 % of the non-shunted blood ((1 − fs)*Q) is distributed to the low V /Q compartment, 10 % of the non-shunted blood is delivered to the high V /Q compart-ment. Model parameter fA represents the fraction of alveolar ventilation VA that reaches the low V /Q compartment. Figure 1 shows the model structure of the pulmonary gas exchange model.
The model assumes equilibrium in blood gas concentrations as well as constant alve-olar ventilation and perfusion without separating ventilation into phases of inspiration and expiration. Model inputs are FiO2 as well as end-tidal blood gas fractions of oxygen (FetO2) and carbon dioxide (FetCO2), respectively. Inspired carbon dioxide is set to 0. Tidal volume Vtid and respiratory frequency fR are assumed to be constant during simu-lation and are provided as additional model inputs. Model outputs are the resulting arte-rial blood gas parameters PaO2 and PaCO2.
Alveolar ventilation VA is calculated from fR and the difference between tidal volume Vtid and the anatomic dead space volume Vds:
FetO2 and FetCO2 are composed of alveolar gas fractions FAO2 and FACO2 in both compartments, such that
(1)VA = fR ∗ (Vtid − Vds)
(2)Fetx = (1− fA) ∗ FAx,1 + fA ∗ FAx,2

Page 4 of 15Riedlinger et al. BioMed Eng OnLine (2015) 14:82
Index x represents O2 and CO2 in Eq. 2 and in all following equations. Index 1 refers to the alveolar compartment with high V /Q, while index 2 denotes the low V /Q compart-ment. Oxygen consumption VO2 and carbon dioxide production VCO2 are derived from alveolar air flow to each of the compartments and the difference between inspired and alveolar gas fractions as described in Eqs. (3) and (4):
Capillary blood gas concentrations Ccx are derived from alveolar gas fractions using O2 and CO2 dissociation curves [18, 19] (T—temperature):
Venous blood gas concentrations are then calculated as described in Eqs. (6) and (7).
Cardiac output Q is measured at the bedside or estimated from the patient’s body sur-face area.
(3)Vx,1 =(1− fA
)∗ VA ∗ (Fix − FAx,1)
(4)Vx,2 = fA ∗ VA ∗ (Fix − FAx,2)
(5)Ccx = blood(FAx, pH ,T , cHb)
(6)Cvx,1 = Ccx,1 − Vx,1/(Q ∗(1− fs
)∗ 0.1)
(7)Cvx,2 = Ccx,2 − Vx,2/(Q ∗(1− fs
)∗ 0.9)
Fig. 1 Schematic representation of the gas exchange model. The model consists of two alveolar compart-ments, one with low and one with high ratio between ventilation V and perfusion Q respectively. Blood flow is distributed among the shunt fs and the two alveolar compartments. The low V/Q-compartment is perfused with a fixed fraction fQ of 90 % of the non-shunted blood and ventilated with fraction fA. FiO2 describes the fraction of oxygen in inspired air. PaO2 and PaCO2 are arterial partial pressures of oxygen and carbon dioxide respectively

Page 5 of 15Riedlinger et al. BioMed Eng OnLine (2015) 14:82
FAO2 and FACO2 are solved numerically for a given measured FetO2 and FetCO2 with the condition that venous concentration in both compartments is equal. Finally, arterial blood gas concentrations CaO2 and CaCO2 are calculated as:
Arterial partial pressures of oxygen and carbon dioxide are then calculated from the reversed dissociation curves:
Model simulation
Forward calculation of the model equations is termed as model simulation. The flow-chart of the model simulation process MΘ is depicted in Fig. 2 on the left. Vector Ψ sum-marizes physical constants for measurements needed for model simulation:
Here, minute ventilation MV is calculated as:
Vector Θ includes model parameters fs and fA as well as Ψ:
Output values PaO2,sim and PaCO2,sim are calculated depending on Θ and FiO2:
Model identification
Parameters that need to be identified in the presented model are shunt fraction (fs) and the fraction of alveolar ventilation that is distributed to the alveolar compartment with low V /Q-ratio (fA). The process of model identification (Ma) is shown on the right of Fig. 2. (Ma) is a minimization process of an objective function. FiO2, i.e. the level of inspired oxygen at the time of the measurement, as well as the other constant physi-ological values required during identification, are represented in vector α:
(8)Cax = Ccx,1 ∗(1− fs
)∗ 0.1+ Ccx,2 ∗
(1− fs
)∗ 0.9+ Cvx ∗ fs
(9)Pax = blood(Cac, pH ,T , cHb)
� = (MV ,Vtid ,Vds,Q, cHb, pH ,T , FetO2, FetCO2).
(10)MV = Vtid ∗ fR
Θ = (fs, fA,Ψ ).
(PaO2,sim,PaCO2,sim
)= MΘ(FiO2).
α = (FiO2,Ψ ).
Fig. 2 Flowcharts of model simulation (left) and model identification (right). In model simulation, blood gas levels are calculated with respect to FiO2. Model parameters fs and fA are known. Vector Θ summarizes parameters as well as other physical constants necessary for model calculation. Model identification process Mα minimizes an objective function for measured blood gas levels at a specific FiO2. Identified parameters are fs
* and fA*

Page 6 of 15Riedlinger et al. BioMed Eng OnLine (2015) 14:82
PaO2,meas and PaCO2,meas are the measured blood gases obtained at a specific condi-tion described by α. They are used to determine fs
* and fA* that best reproduce the meas-
urements in the forward model:
Parameter identification was performed by minimizing the sum of the squared error (SSE) between measured (meas) and predicted (pred) partial blood gas pressures in arte-rial blood:
The weighting factor of 3 for PaCO2 was chosen to avoid imbalanced influence of PaO2 data on the identification process, as dimension of PaCO2 is approximately three times smaller than PaO2. Minimization of the above described objective function was carried out using fminsearchbnd in MATLAB (R2012a, The Mathworks, Natick, MA, USA). fminsearchbnd is distributed under the BSD license and is based on fminsearch, the MATLAB function that employs the Nelder-Mead simplex search method [20]. Accord-ing to [21] a shunt of 50 % and above leads to increases in FiO2 having no effect on PaO2. Additionally, fA values above 0.9 lead to a swap of the high V /Q-compartment with the low V /Q-compartment, essentially mirroring V /Q-values of fA below 0.9. Thus param-eter constraints for {fs, fA} were set as nonnegative lower boundaries LB = {0, 0} and as upper boundaries UB = {0.5, 0.9}.
Structural identifiability of the model using multiple measuring points was shown in a previous report [22]. Initial fs was set to 0.2, which showed to lead to the global mini-mum of the objective function in all test cases. Initial fA was set arbitrarily to 0.5 to start the minimization process at a certain initial mismatch between ventilation and perfu-sion. Constant patient state for the time of model prediction is assumed.
Model prediction
Prediction of blood gas levels depending on FiO2 is done using forward calculation of the model MΘ* with Θ* = (fs
*, fA*, Ψ):
Data
We have employed both simulated and recorded real patient data to evaluate how well the described model is identifiable with data obtained at one single FiO2 level.
Simulated data The same two-parameter model of pulmonary gas exchange was used to create experimental data. It allows calculating the impact of noise in the data because the correct results for parameter identification are known a priori. Twelve classes of patient data sets have been generated, that differ in the parameter combinations of fs and fA. Those have been chosen to represent different stages of pulmonary disease. Model parameters used for data generation, resulting FiO2/PaO2-ratios and the classifications of pulmonary impairment [24] are listed in Table 1. BGA and physiological standard
Θ∗ =(f ∗s , f
∗A ,Ψ
)= Mα(PaO2,meas,PaCO2,meas).
(PaO2,pred ,PaCO2,pred
)= MΘ∗(FiO2)
(11)SSE = (PaO2,meas − PaO2,pred)2 + 3 ∗ (PaCO2,meas − PaCO2,pred)
2
(PaO2,pred ,PaCO2,pred
)= MΘ∗(FiO2).

Page 7 of 15Riedlinger et al. BioMed Eng OnLine (2015) 14:82
values of an adult man were used for data generation. These physical constants are listed and explained in Table 2.
More formally, we define twelve patient classes by the model parameters
For each of the twelve patient classes, 1000 simulated measurements equidistant between FiO2 of 21 % and 100 % were determined. Depending on FiO2 settings, model simulation led to
Measuring PaO2 and PaCO2 via blood gas samples drawn from the arterial line is the current gold standard in clinical practice [25, 26], while measuring arterial oxygen saturation via pulse oximetry is accurate within ±2 % of the true value [27]. Thus, to
Θj =
(fsj , fAj ,Ψ
)with 1 ≤ j ≤ 8.
(PaO
j2,sim,PaO
j2,sim
)= MΘj (FiO2).
Table 1 Parameters used for simulation of patient data
Parameter values for shunt fraction fs and fraction of ventilation distribution fA as well as the resulting V/Q‑ratios are shown. Classification of pulmonary state is based upon V/Q‑ratio and PaO2/FiO2‑ratio [24]
Patient no. (j) fS fA High V/Q Low V/Q PaO2/FiO2‑ratio Classification of impairment
1 0.05 0.90 1.15 1.15 412 Healthy
2 0.10 0.70 3.64 0.94 303 Mild
3 0.15 0.70 3.85 1.00 227 Mild
4 0.20 0.70 4.09 1.06 169 Moderate
5 0.20 0.50 6.82 0.76 162 Moderate
6 0.25 0.50 7.27 0.81 123 Moderate
7 0.25 0.30 10.18 0.48 114 Moderate
8 0.30 0.50 7.79 0.87 95 Severe
9 0.30 0.30 10.91 0.52 89 Severe
10 0.35 0.50 8.39 0.93 74 Severe
11 0.35 0.30 11.75 0.56 72 Severe
12 0.35 0.15 14.27 0.28 70 Severe
Table 2 Constants used for generation of data sets
Physiological constants of an adult man were used for generation of patient data sets
Item Abbreviation Value Unit
Minute volume MV 6 l/min
Tidal volume Vtid 0.5 l
Dead space volume Vds 0.15 l
Cardiac output Q 5.5 l/min
Hemoglobin concentration cHb 140 g/l
Alveolar pH value pH 7.4 –
Base excess BE 0 mmol/l
Temperature T 37 °C
Respiratory quotient RQ 0.8 –

Page 8 of 15Riedlinger et al. BioMed Eng OnLine (2015) 14:82
account for measurement noise that would be present in a real setting, both PaO2,sim and PaCO2,sim data were superimposed with uniformly distributed noise in a range of ±5 %:
The quality of system identification was assessed with a test set (ts) of 17 distinct FiOts2
values ranging from 21 to 100 % in steps of 5 %:
Real patient data: Two real patient data sets were used for the plausibility check of the results obtained from the theoretical analysis. Real patient data including at least four blood gas measurements at different FiO2 settings in mandatory ventilation mode were retrieved from a patient data management system of the university medical centre in Kiel [7]. Two data sets, a mild (Pat R1) and a critically ill patient (Pat R2), met those demands. The recorded levels of FiO2 were applied on a therapeutical basis, thus not systematically in the context of a clinical trial. The data sets included measurements of PaO2, PaCO2, fR, Q, Vtid, Vds, cHb, pH, T and FetCO2 at each of the applied FiO2 levels. Patient data did not include FetO2 measurements, thus FetO2 was approximated from:
Here, the respiratory quotient RQ was assumed to be 0.8. As with the simulated data sets, initial conditions of {fs, fA} for parameter identification were set to {0.2, 0.5}.
Analysis of structural identifiability
To verify structural identifiability of a model system, uniqueness of the solution of parameter identification has to be proven. The simplicity of the two-parameter model allows a numerical calculation and two-dimensional visualization of the objective func-tion. The SSE is calculated and plotted for different parameter combinations to visualize the contour of the error surface. A single global minimum of the objective function indi-cates structural identifiability of the model.
Structural identifiability of the model using one measurement point at one FiO2 level was analyzed with the synthetic as well as the two real patient data sets. The error sur-faces (SSE) were plotted as a function of model parameters fs and fA with a resolution of 90 × 90.
Evaluation of quality of fit
Besides quantity, quality of measurements used for model identification is essential for the accuracy of parameter identification. To verify practical identifiability, the influence of measuring errors on identification behavior of the model system was evaluated using the 1000 virtual measurements (PaOj
2,meas,PaCOj2,meas) in each of the eight classes of
virtual patients.For every patient class the gas exchange model was identified with only one single of
the 1000 noisy measurements. Please note that each of those measurements belongs to one FiO2 setting:
(PaO
j2,meas,PaO
j2,meas
)= noise
(PaO
j2,sim,PaO
j2,sim
).
(PaOts
2,simi,PaCOts
2,simi
)= MΘ(FiO
ts2i) for 1 ≤ i ≤ 17.
(12)FetO2 = FiO2 −FetCO2
RQ

Page 9 of 15Riedlinger et al. BioMed Eng OnLine (2015) 14:82
With the identified parameters fs* and fA
*, the evaluations PaOts2,predi
as well as PaCOts2,predi
were calculated for all 1 ≤ i ≤ 17 FiO2-values in the test set:
Predictive performance for blood oxygenation as well as partial pressure of carbon dioxide was evaluated by comparing PaOts
2,sim and PaCOts2,sim, i.e. the values of the origi-
nal simulation set, with PaOts2,pred and PaCOts
2,pred respectively. Mean deviations were cal-culated with
and
For statistical evaluation, the 1000 FiO2 levels, ranging from 21 % to 100 %, were divided into eight clusters (21–30, 30–40,…, 90–100 %), each cluster containing 125 val-ues. Mean and standard deviations of �PaO2 for each cluster were calculated.
Verification of results with patient data
Two real patient data sets were used to confirm the findings obtained with simulated data. Identification was conducted at each FiO2 value that was recorded in the particular patient. Predictive performance was evaluated by comparing measured and predicted PaO2 and PaCO2 at all four recorded FiO2 levels:
ResultsVisualizing the objective function
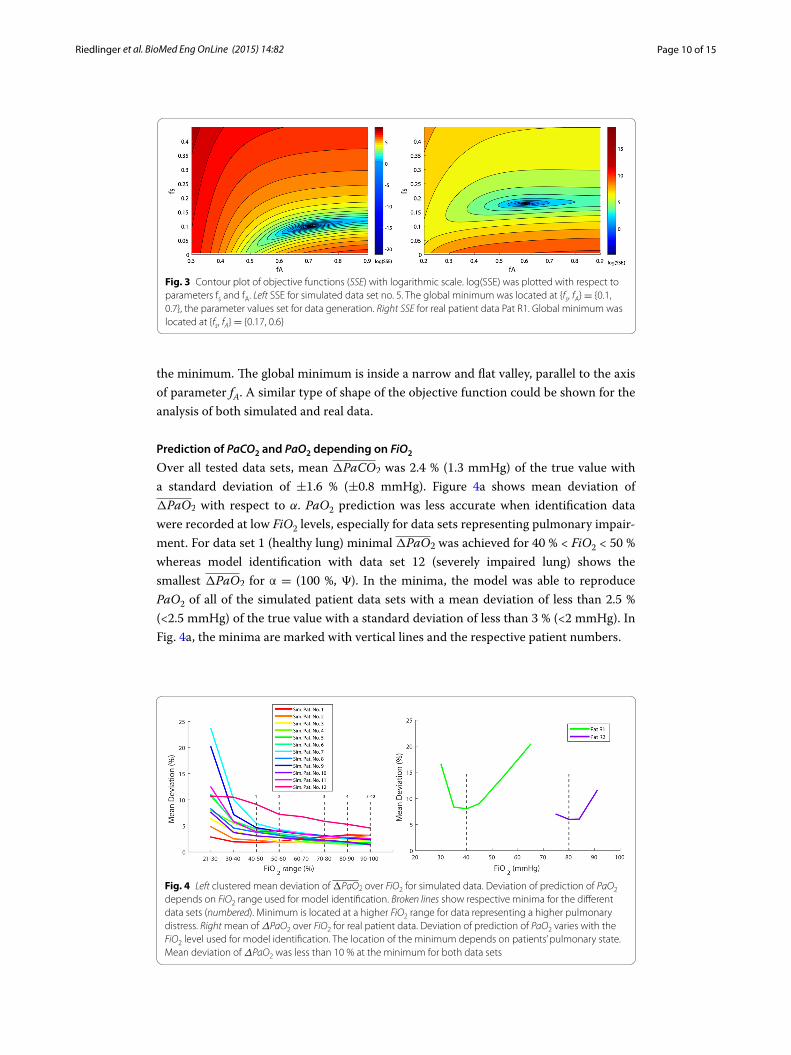
Figure 3 visualizes the contour of the objective function evaluated at one single measur-ing point. Figure 3a shows synthetic patient data, while Fig. 3b is devoted to real patient data. The contour lines (SSE) are scaled logarithmically to improve visibility of the mini-mum. For all analyzed data sets, a single global minimum in the error surface as a func-tion of the model parameters fs and fA could be detected. The parameter combination leading to the global minimum was in agreement with the parameters used for data gen-eration. Within accuracy of numerical representation (double), the SSE value was zero at
Θ∗j =
(f ∗sj , f
∗Aj,Ψ
)= Mα(PaO
j2,meas,PaCO
j2,meas) for 1 ≤ j ≤ 8.
(PaOts
2,predi,PaCOts
2,predi
)= MΘ∗
j(FiOts
2i) for 1 ≤ i ≤ 17.
�PaO2 =1
17
17∑
i=1
�PaO2i =1
17
17∑
i=1
∣∣∣PaOts2,predi
− PaOts2,simi
∣∣∣
�PaCO2 =1
17
17∑
i=1
�PaCO2i =1
17
17∑
i=1
∣∣∣PaCOts2,predi
− PaCOts2,simi
∣∣∣.
�PaO2n =
∣∣∣PaOts2,predn
− PaOreal2,measn
∣∣∣
�PaCO2n =
∣∣∣PaCOts2,predn
− PaCOreal2,measn
∣∣∣ with n = 6 for Pat R1 and
n = 4 for Pat R2.
Page 10 of 15Riedlinger et al. BioMed Eng OnLine (2015) 14:82
the minimum. The global minimum is inside a narrow and flat valley, parallel to the axis of parameter fA. A similar type of shape of the objective function could be shown for the analysis of both simulated and real data.
Prediction of PaCO2 and PaO2 depending on FiO2
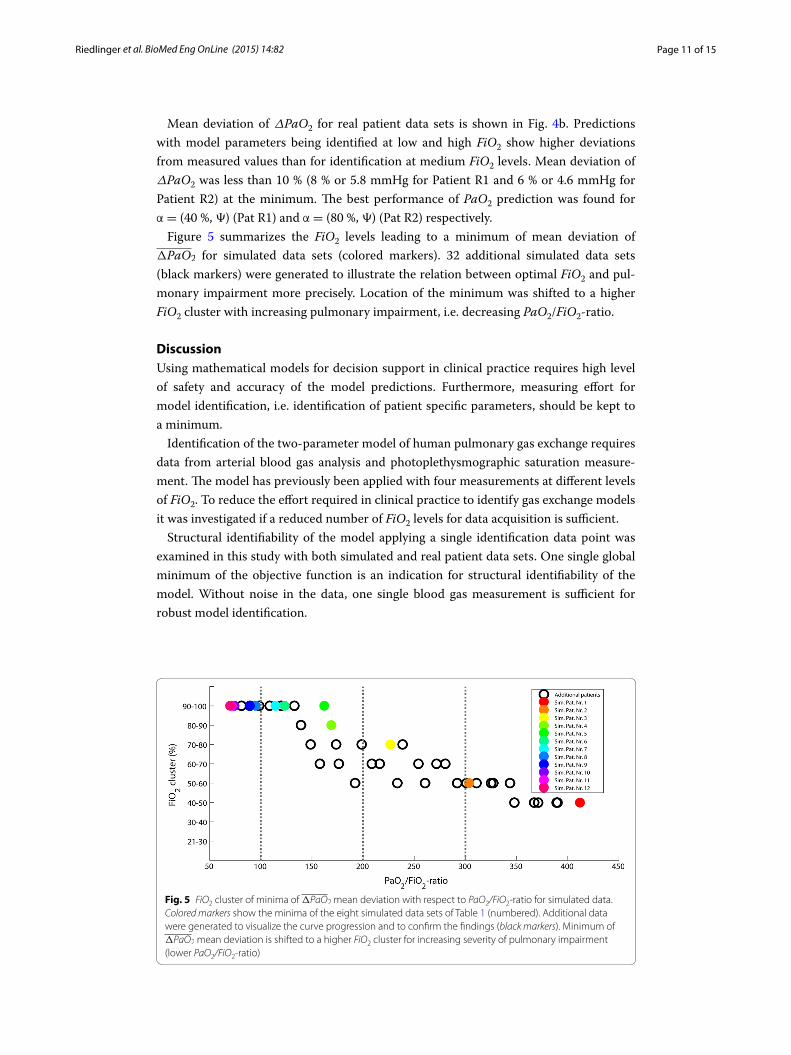
Over all tested data sets, mean �PaCO2 was 2.4 % (1.3 mmHg) of the true value with a standard deviation of ±1.6 % (±0.8 mmHg). Figure 4a shows mean deviation of �PaO2 with respect to α. PaO2 prediction was less accurate when identification data were recorded at low FiO2 levels, especially for data sets representing pulmonary impair-ment. For data set 1 (healthy lung) minimal �PaO2 was achieved for 40 % < FiO2 < 50 % whereas model identification with data set 12 (severely impaired lung) shows the smallest �PaO2 for α = (100 %, Ψ). In the minima, the model was able to reproduce PaO2 of all of the simulated patient data sets with a mean deviation of less than 2.5 % (<2.5 mmHg) of the true value with a standard deviation of less than 3 % (<2 mmHg). In Fig. 4a, the minima are marked with vertical lines and the respective patient numbers.
Fig. 3 Contour plot of objective functions (SSE) with logarithmic scale. log(SSE) was plotted with respect to parameters fs and fA. Left SSE for simulated data set no. 5. The global minimum was located at {fs, fA} = {0.1, 0.7}, the parameter values set for data generation. Right SSE for real patient data Pat R1. Global minimum was located at {fs, fA} = {0.17, 0.6}
Fig. 4 Left clustered mean deviation of �PaO2 over FiO2 for simulated data. Deviation of prediction of PaO2 depends on FiO2 range used for model identification. Broken lines show respective minima for the different data sets (numbered). Minimum is located at a higher FiO2 range for data representing a higher pulmonary distress. Right mean of ΔPaO2 over FiO2 for real patient data. Deviation of prediction of PaO2 varies with the FiO2 level used for model identification. The location of the minimum depends on patients’ pulmonary state. Mean deviation of ΔPaO2 was less than 10 % at the minimum for both data sets
Page 11 of 15Riedlinger et al. BioMed Eng OnLine (2015) 14:82
Mean deviation of ΔPaO2 for real patient data sets is shown in Fig. 4b. Predictions with model parameters being identified at low and high FiO2 show higher deviations from measured values than for identification at medium FiO2 levels. Mean deviation of ΔPaO2 was less than 10 % (8 % or 5.8 mmHg for Patient R1 and 6 % or 4.6 mmHg for Patient R2) at the minimum. The best performance of PaO2 prediction was found for α = (40 %, Ψ) (Pat R1) and α = (80 %, Ψ) (Pat R2) respectively.
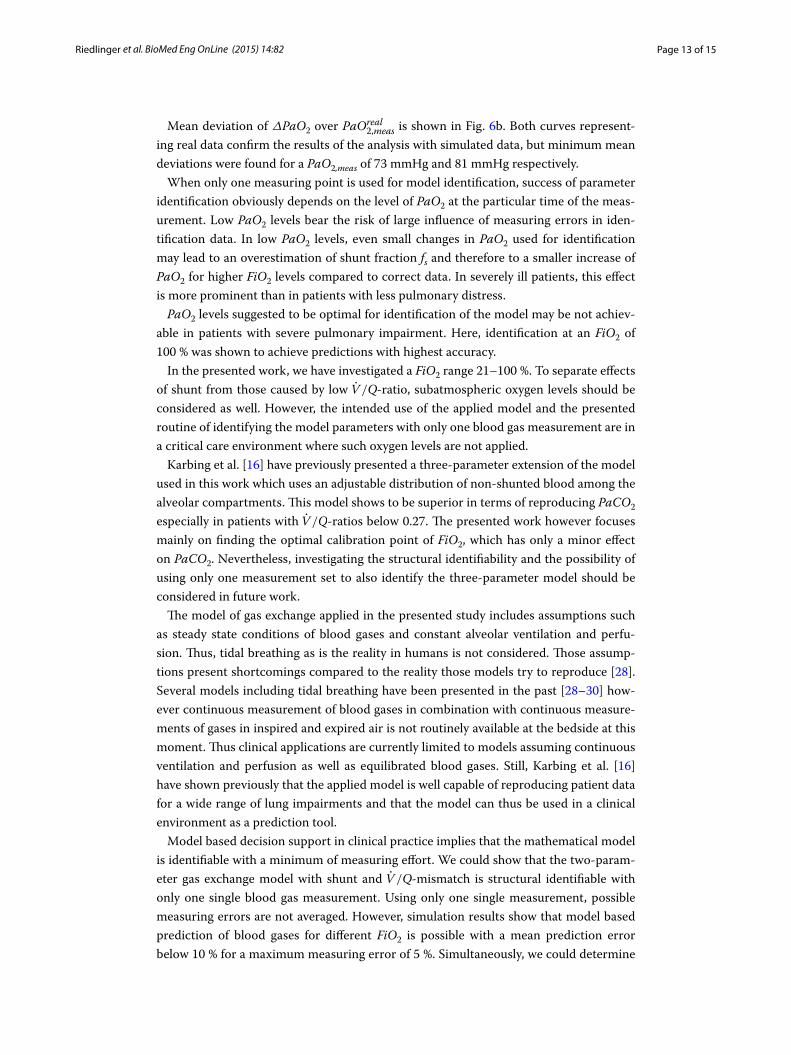
Figure 5 summarizes the FiO2 levels leading to a minimum of mean deviation of �PaO2 for simulated data sets (colored markers). 32 additional simulated data sets (black markers) were generated to illustrate the relation between optimal FiO2 and pul-monary impairment more precisely. Location of the minimum was shifted to a higher FiO2 cluster with increasing pulmonary impairment, i.e. decreasing PaO2/FiO2-ratio.
DiscussionUsing mathematical models for decision support in clinical practice requires high level of safety and accuracy of the model predictions. Furthermore, measuring effort for model identification, i.e. identification of patient specific parameters, should be kept to a minimum.
Identification of the two-parameter model of human pulmonary gas exchange requires data from arterial blood gas analysis and photoplethysmographic saturation measure-ment. The model has previously been applied with four measurements at different levels of FiO2. To reduce the effort required in clinical practice to identify gas exchange models it was investigated if a reduced number of FiO2 levels for data acquisition is sufficient.
Structural identifiability of the model applying a single identification data point was examined in this study with both simulated and real patient data sets. One single global minimum of the objective function is an indication for structural identifiability of the model. Without noise in the data, one single blood gas measurement is sufficient for robust model identification.
Fig. 5 FiO2 cluster of minima of �PaO2 mean deviation with respect to PaO2/FiO2-ratio for simulated data. Colored markers show the minima of the eight simulated data sets of Table 1 (numbered). Additional data were generated to visualize the curve progression and to confirm the findings (black markers). Minimum of �PaO2 mean deviation is shifted to a higher FiO2 cluster for increasing severity of pulmonary impairment (lower PaO2/FiO2-ratio)

Page 12 of 15Riedlinger et al. BioMed Eng OnLine (2015) 14:82
The effect of a change in FiO2 on the concentration of carbon dioxide in arterial blood is negligible. PaCO2 data could be reproduced by the model with high accuracy. Pre-diction error of CO2 data was below the noise level of ±5 % for all data sets. However, measuring errors may decrease the accuracy of parameter identification and therefore model prediction of PaO2, especially if identification is based on only one measurement. Results show that the gas exchange model with shunt and V /Q-mismatch is able to fit both the synthetic and the real patient data with good accuracy, as already presented in former work [16]. Oxygenation data of all data sets could be reproduced by the model with a mean deviation below 10 % in spite of measuring errors in the identification data. However, when identifying the model with noisy data, the FiO2 setting influences the prediction accuracy of PaO2. This influence was therefore examined to find a guideline how to choose an appropriate FiO2 level for data acquisition in the identification process.
The identification processes of both simulated and real patient data sets representing a variety of different disease states showed surprisingly similar results. It could be pointed out that accuracy of model prediction of blood gas concentration is related to the FiO2 setting when recording identification data. The optimum FiO2 level depends on the level of pulmonary impairment whereupon FiO2 should be increased with increasing severity of pulmonary impairment. In severely ill patients, oxygenation of arterial blood is inhib-ited, thus higher FiO2 levels are required in order to achieve adequate PaO2 levels.
Figure 6a shows the mean deviation of �PaO2 with respect to PaOj2,meas. It could be
observed that a minimal prediction error is achieved for PaOj2,meas in the range of 150–
200 mmHg for the entire simulated data sets. Identification at higher levels leads to a small increase of mean deviation. However, mean deviation of �PaO2 was found to be still below 5 % for all tested patient cases. Identifying the model with PaO2 levels of less than 100 mmHg is potentially leading to an increase in both mean and standard devia-tion of model prediction. Because of the high severity of pulmonary impairment, data sets 7 and 8 do not achieve a PaO2 of 100 mmHg, even when a FiO2 of 100 % is applied. Patients with such high pulmonary impairment have to be ventilated using the highest FiO2 possible to achieve a sufficient oxygenation.
Fig. 6 Left clustered mean deviation of �PaO2 over PaOj2,meas for simulated data. Minimum in prediction
error of PaO2 data is in the range of 150–200 mmHg for data sets 1–7. Because of the high severity of pulmo-nary impairment, data sets 8–12 do not achieve this oxygenation range, even when a FiO2 of 100 % is applied. Right mean of ΔPaO2 over PaOreal
2,meas. Real patient data tested in our study confirm the curve progression of the study with the simulated data. The best prediction performance is shown for identification in the PaO2 range of 70–80 mmHg
Page 13 of 15Riedlinger et al. BioMed Eng OnLine (2015) 14:82
Mean deviation of ΔPaO2 over PaOreal2,meas is shown in Fig. 6b. Both curves represent-
ing real data confirm the results of the analysis with simulated data, but minimum mean deviations were found for a PaO2,meas of 73 mmHg and 81 mmHg respectively.
When only one measuring point is used for model identification, success of parameter identification obviously depends on the level of PaO2 at the particular time of the meas-urement. Low PaO2 levels bear the risk of large influence of measuring errors in iden-tification data. In low PaO2 levels, even small changes in PaO2 used for identification may lead to an overestimation of shunt fraction fs and therefore to a smaller increase of PaO2 for higher FiO2 levels compared to correct data. In severely ill patients, this effect is more prominent than in patients with less pulmonary distress.
PaO2 levels suggested to be optimal for identification of the model may be not achiev-able in patients with severe pulmonary impairment. Here, identification at an FiO2 of 100 % was shown to achieve predictions with highest accuracy.
In the presented work, we have investigated a FiO2 range 21–100 %. To separate effects of shunt from those caused by low V /Q-ratio, subatmospheric oxygen levels should be considered as well. However, the intended use of the applied model and the presented routine of identifying the model parameters with only one blood gas measurement are in a critical care environment where such oxygen levels are not applied.
Karbing et al. [16] have previously presented a three-parameter extension of the model used in this work which uses an adjustable distribution of non-shunted blood among the alveolar compartments. This model shows to be superior in terms of reproducing PaCO2 especially in patients with V /Q-ratios below 0.27. The presented work however focuses mainly on finding the optimal calibration point of FiO2, which has only a minor effect on PaCO2. Nevertheless, investigating the structural identifiability and the possibility of using only one measurement set to also identify the three-parameter model should be considered in future work.
The model of gas exchange applied in the presented study includes assumptions such as steady state conditions of blood gases and constant alveolar ventilation and perfu-sion. Thus, tidal breathing as is the reality in humans is not considered. Those assump-tions present shortcomings compared to the reality those models try to reproduce [28]. Several models including tidal breathing have been presented in the past [28–30] how-ever continuous measurement of blood gases in combination with continuous measure-ments of gases in inspired and expired air is not routinely available at the bedside at this moment. Thus clinical applications are currently limited to models assuming continuous ventilation and perfusion as well as equilibrated blood gases. Still, Karbing et al. [16] have shown previously that the applied model is well capable of reproducing patient data for a wide range of lung impairments and that the model can thus be used in a clinical environment as a prediction tool.
Model based decision support in clinical practice implies that the mathematical model is identifiable with a minimum of measuring effort. We could show that the two-param-eter gas exchange model with shunt and V /Q-mismatch is structural identifiable with only one single blood gas measurement. Using only one single measurement, possible measuring errors are not averaged. However, simulation results show that model based prediction of blood gases for different FiO2 is possible with a mean prediction error below 10 % for a maximum measuring error of 5 %. Simultaneously, we could determine

Page 14 of 15Riedlinger et al. BioMed Eng OnLine (2015) 14:82
the range of PaO2 level where prediction error is minimized for data representing a wide range of different pulmonary states. Our work provides scientific findings in developing a robust parameter identification process for the gas exchange model with low measur-ing effort. For a given accuracy of the blood gas measurements used for identification it will be possible to estimate the accuracy of the model prediction of blood gases.
This study is faced with the limitation that only two real patient data sets were avail-able to confirm the findings from the study with simulated data. Furthermore, the real data were not from a systematic patient study, but retrieved from a patient data manage-ment system, giving no information about the interventions of the clinicians between the measurements. Therefore, a change in the patients’ pulmonary state cannot be excluded. A systematic study with a higher number of mechanically ventilated patients is neces-sary to consolidate our findings.
ConclusionsThe study showed that the identification point has a significant impact on the predictive performance of the presented gas exchange model. Measuring errors, i.e. noise in iden-tification data, could lead to prediction errors when only one measurement is applied. A combination of simulated and real patient data provides a valuable tool in determining the optimal identification point where influence of measurement errors is minimal.
List of abbreviationsARDS: acute respiratory distress syndrome; BE: base excess; BGA: blood gas analysis; Cc: capillary concentration; cHB: concentration of hemoglobin; CO2: carbon dioxide; Cv: venous concentration; fA: fraction of ventilation distribution; FA: alveolar fraction; Fet: end-tidal fraction; FiO2: inspired oxygen fraction; fQ: fraction of perfusion distribution; fR: respiratory frequency; fs: shunt fraction; KDSS: knowledge based decision support system; LB: lower boundaries; MBSS: model based decision support system; MIGET: multiple inert gas elimination technique; MV: minute ventilation; O2: oxygen; Pa: arterial partial pressure; PIP: parameter identification process; Q: cardiac output; RQ: respiratory quotient; SpO2: peripheral oxy-gen saturation; SSE: sum of the squared errors; T: patient temperature; UB: upper boundaries; V: ventilation; VA: alveolar ventilation; VCO2: carbon dioxide production; Vds: dead space volume; VILI: ventilator induced lung injury; VO2: oxygen consumption; Vtid: tidal volume.
Authors’ contributionsAR carried out the analysis and drafted the manuscript. JK participated in the implementation of the model as well as representation and appraisal of the results. KM conceived of the study, and participated in the design of the study. All authors read and approved the final manuscript.
AcknowledgementsThis work was partially supported by the Bundesministerium für Bildung und Forschung under Grant 01IB10002D (WiM-Vent) as well as the FP7-IRSES 318943 (eTime). The authors express their gratitude to Dr. Schädler and Dr. Becher from the Department of Anesthesiology and Intensive Care Medicine at the University Medical Center of Schleswig–Holstein, Campus Kiel, Germany, for providing the anonymous made patient data for this study.
Compliance with ethical guidelines
Competing interestsThere are no significant competing interests that might have influenced the results of the work described in this manuscript.
Received: 8 May 2015 Accepted: 12 August 2015
References 1. Edmark L, Kostova-Aherdan K, Enlund M, Hedenstierna G. Optimal oxygen concentration during induction of gen-
eral anesthesia. Anesthesiology. 2003;98(1):28–33. 2. Nash G, Blennerhassett JB, Pontoppidan H. Pulmonary lesions associated with oxygen therapy and artificial ventila-
tion. N Engl J Med. 1967;276(7):368–74.

Page 15 of 15Riedlinger et al. BioMed Eng OnLine (2015) 14:82
3. Rinaldo JE, Rogers RM. Adult respiratory-distress syndrome: changing concepts of lung injury and repair. N Engl J Med. 1982;306(15):900–9.
4. Altemeier WA, Sinclair SE. Hyperoxia in the intensive care unit: why more is not always better. Curr Opin Crit Care. 2007;13(1):73–8.
5. Sinex JE. Pulse oximetry: principles and limitations. The American Journal of Emergency Medicine. 1999;17(1):59–66. 6. Benatar SR, Hewlett AM, Nunn JF. The use of iso-shunt lines for control of oxygen therapy. Br J Anaesth.
1973;45(7):711–8. 7. Kretschmer J, Becher T, Riedlinger A, Schadler D, Weiler N, Moller K. A simple gas exchange model predicting arterial
oxygen content for various FiO2 levels. Conf Proc IEEE Eng Med Biol Soc. 2013;2013:465–8. 8. Karbing DS, Kjaergaard S, Smith BW, Espersen K, Allerod C, Andreassen S, Rees SE. Variation in the PaO2/FiO2 ratio
with FiO2: mathematical and experimental description, and clinical relevance. Crit Care. 2007;11(6):R118. 9. Whiteley JP, Gavaghan DJ, Hahn CE. Variation of venous admixture, SF6 shunt, PaO2, and the PaO2/FiO2 ratio with
FiO2. Br J Anaesth. 2002;88(6):771–8. 10. Andreassen S, Egeberg J, Schroter MP, Andersen PT. Estimation of pulmonary diffusion resistance and shunt in an
oxygen status model. Comput Methods Programs Biomed. 1996;51(1–2):95–105. 11. Andreassen S, Rees SE, Kjaergaard S, Thorgaard P, Winter SM, Morgan CJ, Alstrup P, Toft E. Hypoxemia after coronary
bypass surgery modeled by resistance to oxygen diffusion. Crit Care Med. 1999;27(11):2445–53. 12. Kjaergaard S, Rees SE, Nielsen JA, Freundlich M, Thorgaard P, Andreassen S. Modelling of hypoxaemia after gynaeco-
logical laparotomy. Acta Anaesthesiol Scand. 2001;45(3):349–56. 13. Petros AJ, Dore CJ, Nunn JF. Modification of the iso-shunt lines for low inspired oxygen concentrations. Br J Anaesth.
1994;72(5):515–22. 14. Riley RL, Cournand A. Ideal alveolar air and the analysis of ventilation-perfusion relationships in the lungs. J Appl
Physiol. 1949;1(12):825–47. 15. Loeppky JA, Caprihan A, Altobelli SA, Icenogle MV, Scotto P, Vidal Melo MF. Validation of a two-compartment model
of ventilation/perfusion distribution. Respir Physiol Neurobiol. 2006;151(1):74–92. 16. Karbing DS, Kjaergaard S, Andreassen S, Espersen K, Rees SE. Minimal model quantification of pulmonary gas
exchange in intensive care patients. Med Eng Phys. 2011;33(2):240–8. 17. Thomsen LP, Karbing DS, Smith BW, Murley D, Weinreich UM, Kjaergaard S, Toft E, Thorgaard P, Andreassen S, Rees SE.
Clinical refinement of the automatic lung parameter estimator (ALPE). J Clin Monit Comput. 2013;27(3):341–50. 18. Kelman GR. Digital computer subroutine for the conversion of oxygen tension into saturation. J Appl Physiol.
1966;21(4):1375–6. 19. Sharan M, Singh MP, Aminataei A. A mathematical model for the computation of the oxygen dissociation curve in
human blood. Biosystems. 1989;22(3):249–60. 20. Lagarias JC, Reeds JA, Wright MH, Wright PE. Convergence properties of the Nelder–Mead simplex method in low
dimensions. SIAM J Optim. 1998;9(1):112–47. 21. Lumb AB. Distribution of pulmonary ventilation and perfusion. In: Nunn’s applied respiratory physiology. 7th ed.
Edinburgh: Elsevier; 2010. 22. Riedlinger A, Schranz C, Möller K: Robustness analysis of a mathematical gas exchange model. Biomed Tech (Berl)
2013; 58 (Suppl 1). 23. Schranz C, Knobel C, Kretschmer J, Zhao Z, Moller K. Hierarchical parameter identification in models of respiratory
mechanics. IEEE Trans Biomed Eng. 2011;58(11):3234–41. 24. Ranieri VM, Rubenfeld GD, Thompson BT, Ferguson ND, Caldwell E, Fan E, Camporota L, Slutsky AS. Acute respiratory
distress syndrome: the Berlin definition. JAMA. 2012;307(23):2526–33. 25. Byrne AL, Bennett M, Chatterji R, Symons R, Pace NL, Thomas PS. Peripheral venous and arterial blood gas analysis in
adults: are they comparable? A systematic review and meta-analysis. Respirology. 2014;19(2):168–75. 26. Honarmand A, Safavi M. Prediction of arterial blood gas values from arterialized earlobe blood gas values in patients
treated with mechanical ventilation. Indian J Crit Care Med. 2008;12(3):96–101. 27. Criticare Systems inc: Gebrauchsanweisung 504/504-US, 504P/504-USP. 1993. 28. Hahn CE, Farmery AD. Gas exchange modelling: no more gills, please. Br J Anaesth. 2003;91(1):2–15. 29. Benallal H, Denis C, Prieur F, Busso T. Modeling of end-tidal and arterial PCO2 gradient: comparison with experimen-
tal data. Med Sci Sports Exerc. 2002;34(4):622–9. 30. Whiteley JP, Farmery AD, Gavaghan DJ, Hahn CE. A tidal ventilation model for oxygenation in respiratory failure.
Respir Physiol Neurobiol. 2003;136(1):77–88.
Submit your next manuscript to BioMed Centraland take full advantage of:
• Convenient online submission
• Thorough peer review
• No space constraints or color figure charges
• Immediate publication on acceptance
• Inclusion in PubMed, CAS, Scopus and Google Scholar
• Research which is freely available for redistribution
Submit your manuscript at www.biomedcentral.com/submit