
On the Potential Large-Scale Comercial Deployment of ...
22
1 On the Potential Large-Scale Commercial Deployment of Carbon Dioxide Capture and Storage Technologies: Findings from Phase 2 of the Global Energy Technology Strategy Project James J Dooley ([email protected]) Joint Global Change Research Institute Pacific Northwest National Laboratory Battelle February 8, 2007 PNNL-SA-52404
Transcript of On the Potential Large-Scale Comercial Deployment of ...

1
On the Potential Large-Scale Commercial Deployment of Carbon Dioxide Capture and
Storage Technologies: Findings from Phase 2 of the Global Energy Technology Strategy Project
James J Dooley ([email protected])
Joint Global Change Research InstitutePacific Northwest National Laboratory
Battelle
February 8, 2007PNNL-SA-52404
2
Climate change is a long-term strategic problem with implications for today
-
5
10
15
20
1850 1900 1950 2000 2050 2100 2150 2200 2250 2300
Glo
bal F
ossi
l Fue
l Car
bon
Em
issi
ons
Gig
aton
s pe
r Yea
r
Historical EmissionsGTSP_750GTSP_650GTSP_550GTSP_450GTSP Reference Case
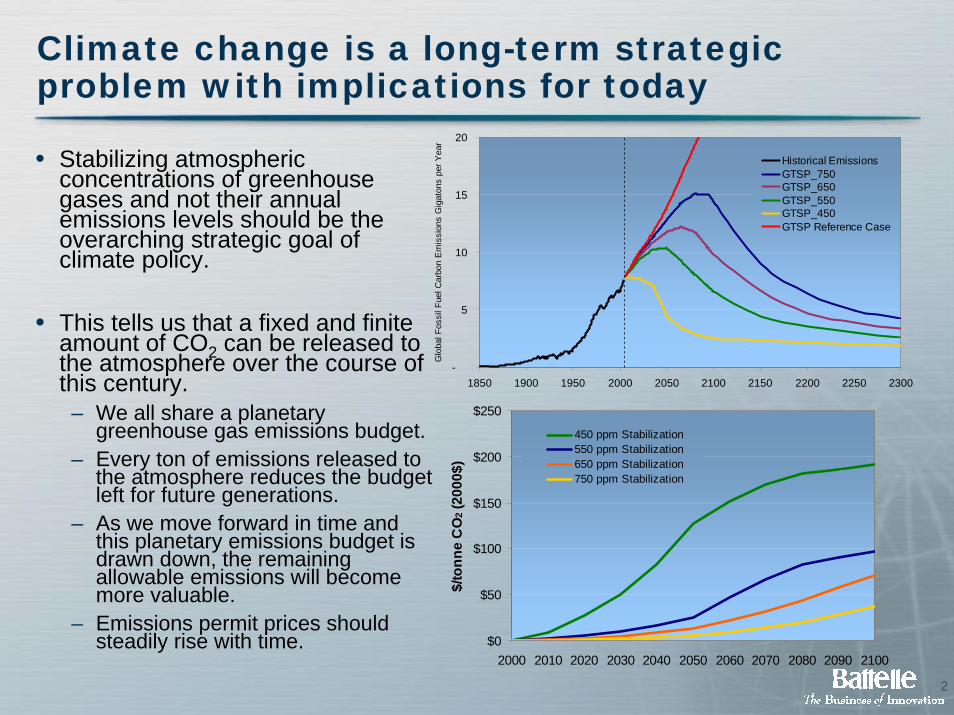
• Stabilizing atmospheric concentrations of greenhouse gases and not their annual emissions levels should be the overarching strategic goal of climate policy.
• This tells us that a fixed and finite amount of CO2 can be released to the atmosphere over the course of this century.
– We all share a planetary greenhouse gas emissions budget.
– Every ton of emissions released to the atmosphere reduces the budget left for future generations.
– As we move forward in time and this planetary emissions budget is drawn down, the remaining allowable emissions will become more valuable.
– Emissions permit prices should steadily rise with time. $0
$50
$100
$150
$200
$250
2000 2010 2020 2030 2040 2050 2060 2070 2080 2090 2100
$/to
nne
CO
2 (20
00$)
450 ppm Stabilization550 ppm Stabilization650 ppm Stabilization750 ppm Stabilization

3
Stabilization of CO2 concentrations means fundamental change to the global energy system
History and Reference Case
0
200
400
600
800
1000
1200
1400
1600
1850 1900 1950 2000 2050 2100
Glo
bal P
rimar
y E
nerg
y 18
50-2
100
(Exa
joul
es)
FutureHistory
Oil Oil + CCSNatural Gas Natural Gas + CCSCoal Coal + CCSBiomass Energy Nuclear EnergyNon-Biomass Renewable Energy End-use Energy
Preindustrial280ppm
1950311 ppm
1900296 ppm
Today380 ppm
2050509 ppm
2100717 ppm
Stabilization of CO2 at 550 ppm
0
200
400
600
800
1000
1200
1400
1600
1850 1900 1950 2000 2050 2100
Glo
bal P
rimar
y E
nerg
y 18
50-2
100
(Exa
joul
es)
.
FutureHistory
Preindustrial280ppm
1950311 ppm
1900296 ppm
Today380 ppm
2050488 ppm
2100547 ppm
4
Stabilization of CO2 concentrations means fundamental change to the global energy system…
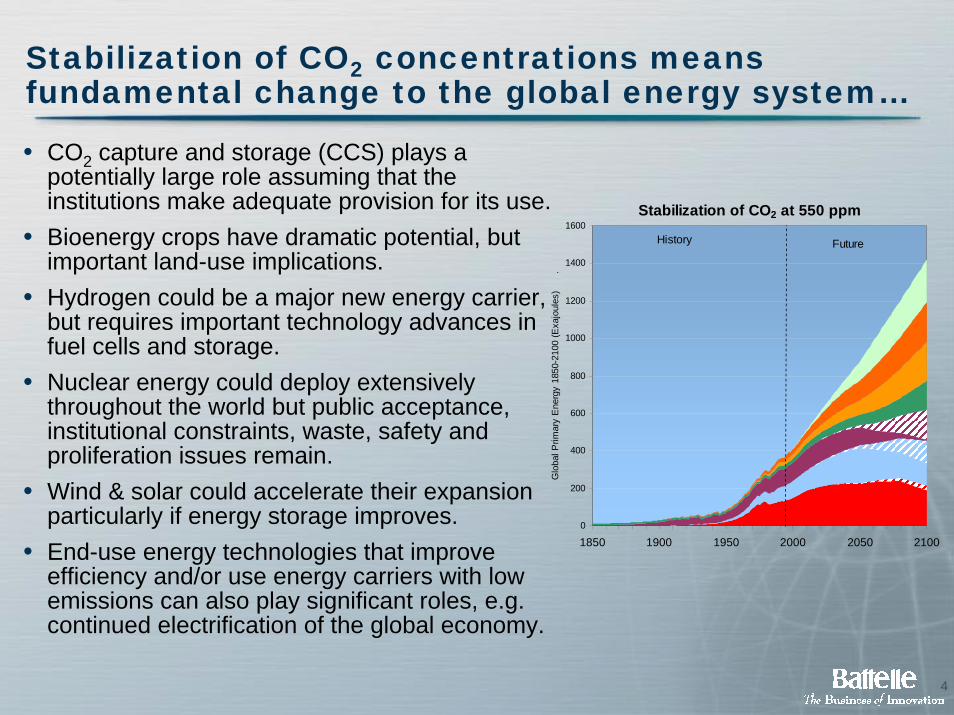
• CO2 capture and storage (CCS) plays a potentially large role assuming that the institutions make adequate provision for its use.
• Bioenergy crops have dramatic potential, but important land-use implications.
• Hydrogen could be a major new energy carrier, but requires important technology advances in fuel cells and storage.
• Nuclear energy could deploy extensively throughout the world but public acceptance, institutional constraints, waste, safety and proliferation issues remain.
• Wind & solar could accelerate their expansion particularly if energy storage improves.
• End-use energy technologies that improve efficiency and/or use energy carriers with low emissions can also play significant roles, e.g. continued electrification of the global economy.
Stabilization of CO2 at 550 ppm
0
200
400
600
800
1000
1200
1400
1600
1850 1900 1950 2000 2050 2100G
loba
l Prim
ary
Ene
rgy
1850
-210
0 (E
xajo
ules
)
.
FutureHistory

5
The Macroeconomic Role of CCS Technologies in Addressing Climate Change
• Plenty of theoretical CO2 storage capacity; however this natural resource is not evenly distributed around the world
• Knowing whether a country, region, or specific locale has suitable geologic CO2 storage reservoirs provides a powerful insight into how that region’s energy infrastructure will evolve in a greenhouse gas constrained world.
• The potential market for CCS technologies is and will remain very heterogeneous.
• Baseload coal-fired power plants and potential coal-to-liquids facilities are the largest potential market for CCS technologies.
• The potential deployment of CCS technologies could be massive.

6
CO2 Capture and Storage: Not Nearly this Simple

7
Overview of Carbon Dioxide Capture and Storage (CCS)
Courtesy of CO2CRC
8
Global CO2 Storage Capacity:Abundant, Valuable and Very Heterogeneous Natural ResourceGlobal CO2 Storage Capacity:Abundant, Valuable and Very Heterogeneous Natural Resource
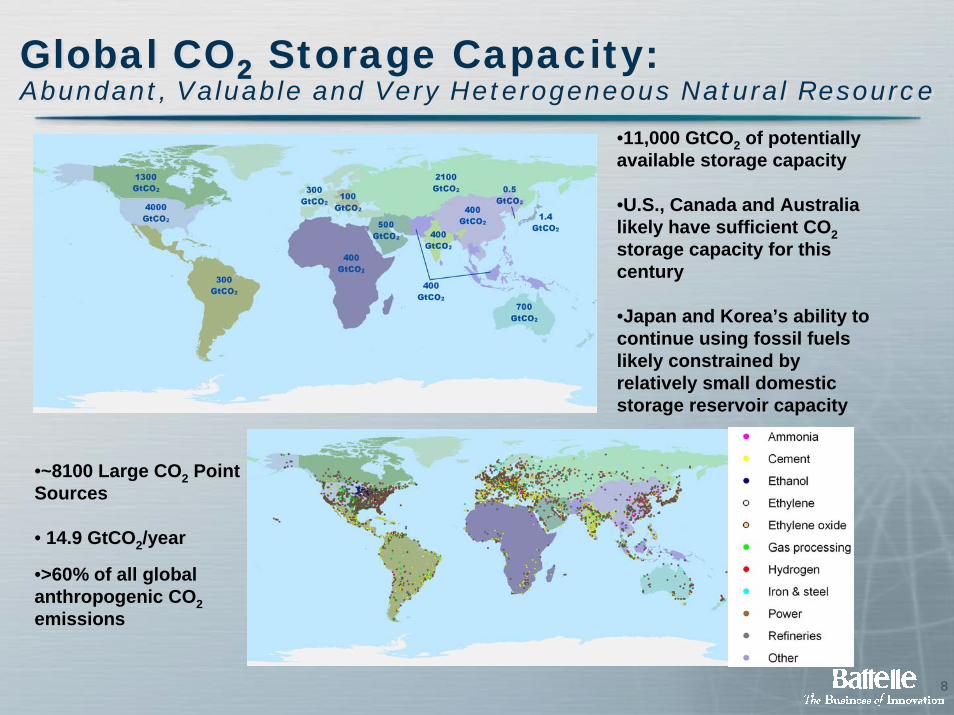
•~8100 Large CO2 Point Sources
• 14.9 GtCO2/year
•>60% of all global anthropogenic CO2emissions
•11,000 GtCO2 of potentially available storage capacity
•U.S., Canada and Australia likely have sufficient CO2storage capacity for this century
•Japan and Korea’s ability to continue using fossil fuels likely constrained by relatively small domestic storage reservoir capacity
9
Global CO2 Storage Capacity:Abundant, Valuable and Very Heterogeneous Natural Resource
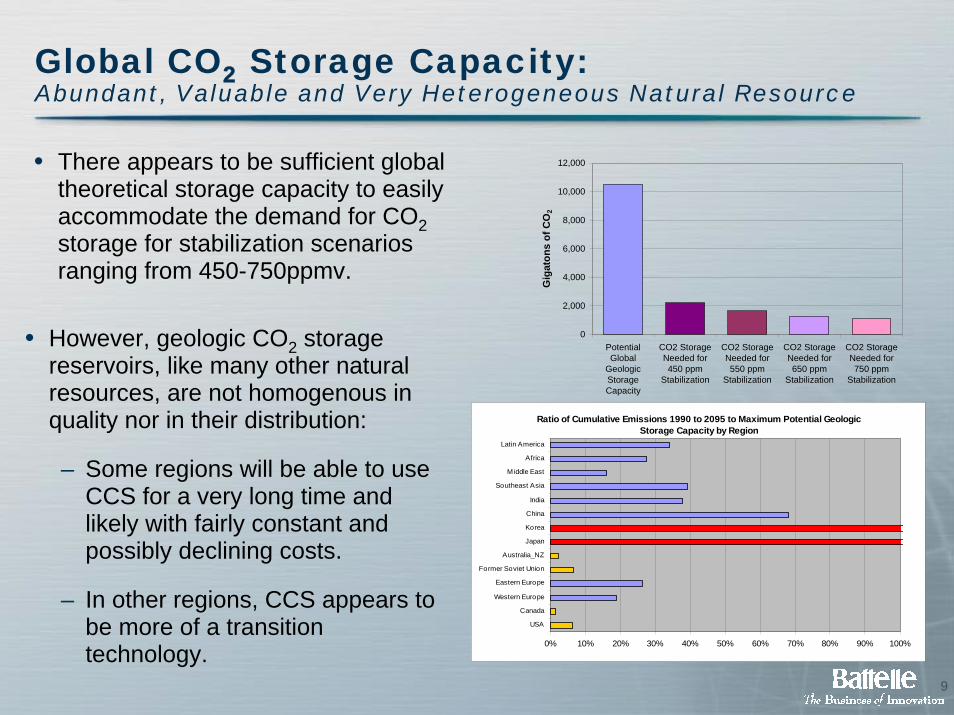
• There appears to be sufficient global theoretical storage capacity to easily accommodate the demand for CO2storage for stabilization scenarios ranging from 450-750ppmv.
0
2,000
4,000
6,000
8,000
10,000
12,000
PotentialGlobal
GeologicStorageCapacity
CO2 StorageNeeded for450 ppm
Stabilization
CO2 StorageNeeded for550 ppm
Stabilization
CO2 StorageNeeded for650 ppm
Stabilization
CO2 StorageNeeded for750 ppm
Stabilization
Gig
aton
s of
CO
2
Ratio of Cumulative Emissions 1990 to 2095 to Maximum Potential Geologic Storage Capacity by Region
0% 10% 20% 30% 40% 50% 60% 70% 80% 90% 100%
USA
Canada
Western Europe
Eastern Europe
Former Soviet Union
Australia_NZ
Japan
Korea
China
India
Southeast Asia
M iddle East
Africa
Latin America
• However, geologic CO2 storage reservoirs, like many other natural resources, are not homogenous in quality nor in their distribution:
– Some regions will be able to use CCS for a very long time and likely with fairly constant and possibly declining costs.
– In other regions, CCS appears to be more of a transition technology.
10
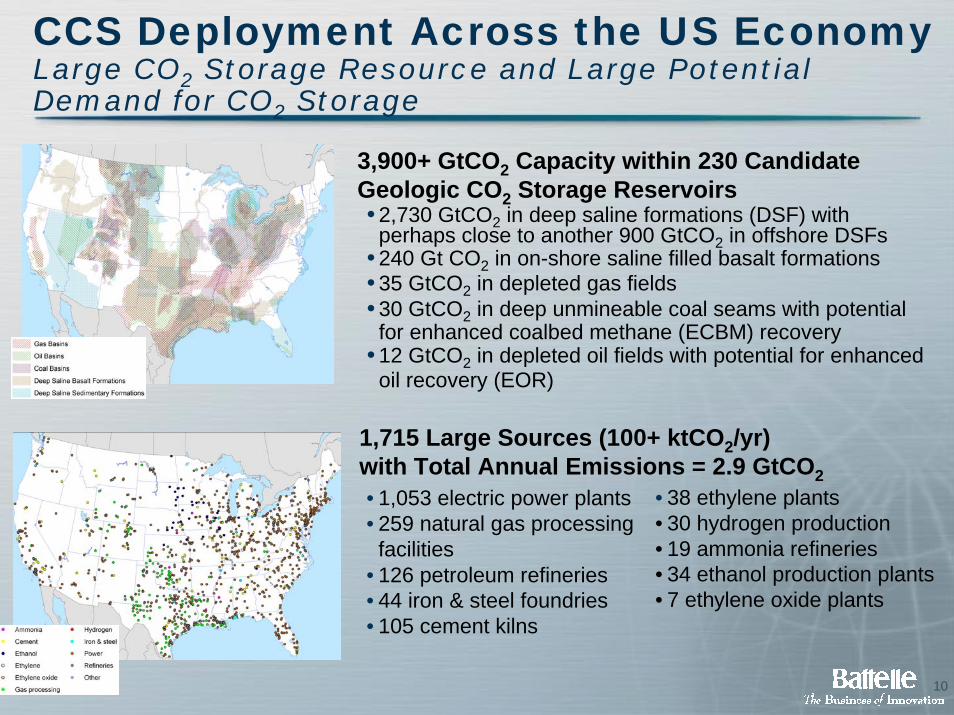
CCS Deployment Across the US EconomyLarge CO2 Storage Resource and Large Potential Demand for CO2 Storage
• 2,730 GtCO2 in deep saline formations (DSF) with perhaps close to another 900 GtCO2 in offshore DSFs
• 240 Gt CO2 in on-shore saline filled basalt formations • 35 GtCO2 in depleted gas fields• 30 GtCO2 in deep unmineable coal seams with potential
for enhanced coalbed methane (ECBM) recovery• 12 GtCO2 in depleted oil fields with potential for enhanced
oil recovery (EOR)
• 1,053 electric power plants • 259 natural gas processing
facilities• 126 petroleum refineries • 44 iron & steel foundries• 105 cement kilns
• 38 ethylene plants• 30 hydrogen production • 19 ammonia refineries• 34 ethanol production plants• 7 ethylene oxide plants
1,715 Large Sources (100+ ktCO2/yr) with Total Annual Emissions = 2.9 GtCO2
3,900+ GtCO2 Capacity within 230 Candidate Geologic CO2 Storage Reservoirs
11
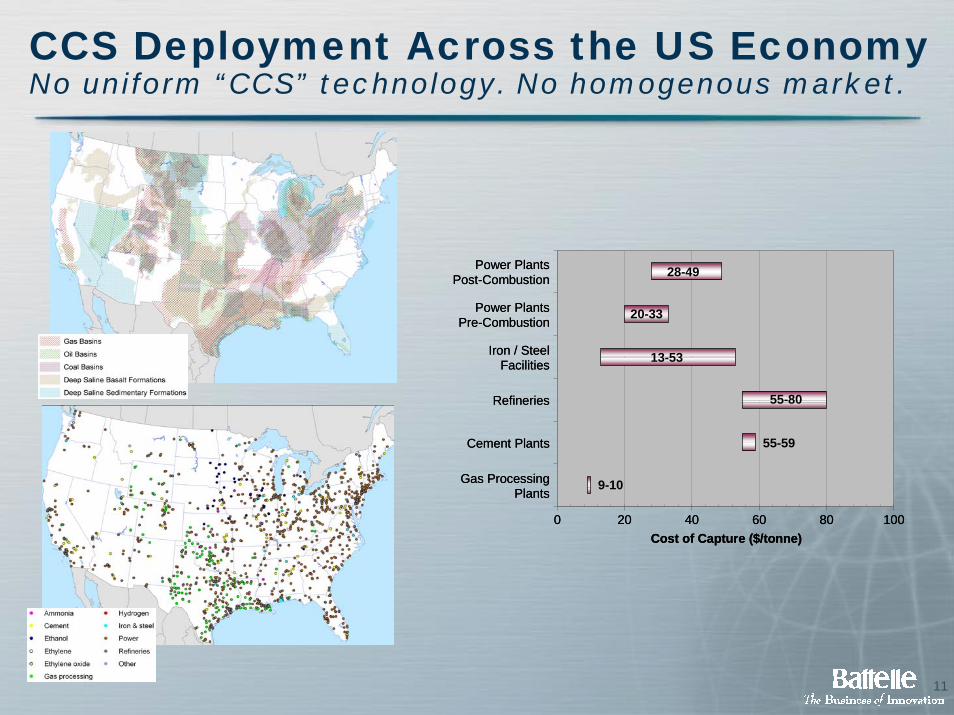
CCS Deployment Across the US EconomyNo uniform “CCS” technology. No homogenous market.
0 20 40 60 80 100
Gas ProcessingPlants
Cement Plants
Refineries
Iron / SteelFacilities
Power PlantsPre-Combustion
Power PlantsPost-Combustion
Cost of Capture ($/tonne)
28-49
20-33
13-53
55-80
55-59
9-10
0 20 40 60 80 100
Gas ProcessingPlants
Cement Plants
Refineries
Iron / SteelFacilities
Power PlantsPre-Combustion
Power PlantsPost-Combustion
Cost of Capture ($/tonne)
28-49
20-33
13-53
55-80
55-59
9-10
12
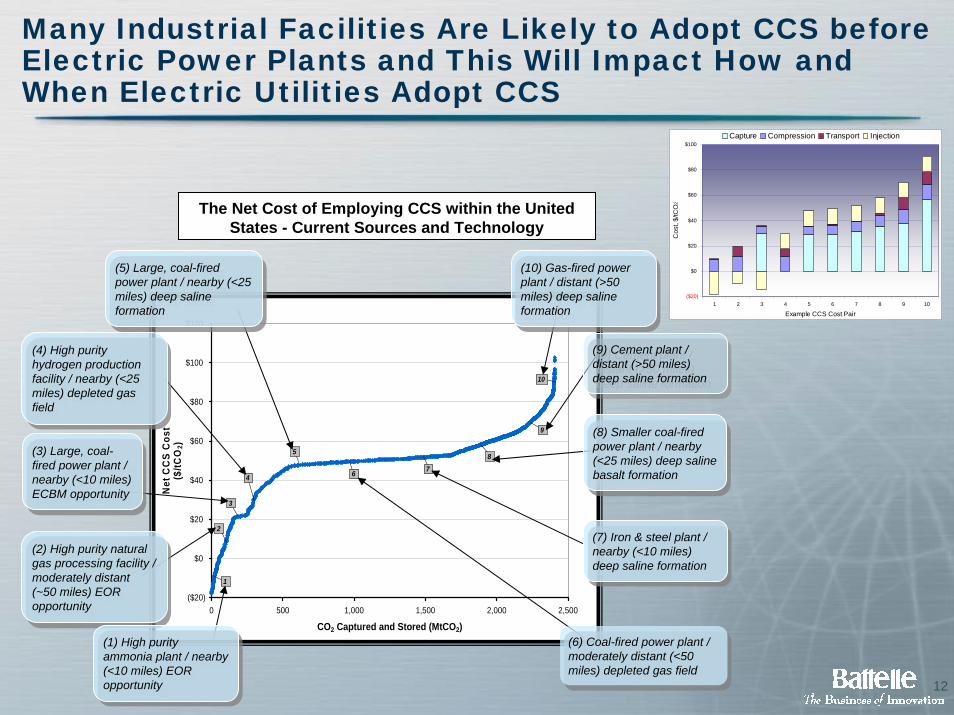
Many Industrial Facilities Are Likely to Adopt CCS before Electric Power Plants and This Will Impact How and When Electric Utilities Adopt CCS
($20)
$0
$20
$40
$60
$80
$100
$120
0 500 1,000 1,500 2,000 2,500
CO2 Captured and Stored (MtCO2)
Net
CC
S C
ost
($/tC
O2)
2
10
9
876
5
4
3
1
The Net Cost of Employing CCS within the United States - Current Sources and Technology
(8) Smaller coal-fired power plant / nearby (<25 miles) deep saline basalt formation
(8) Smaller coal-fired power plant / nearby (<25 miles) deep saline basalt formation
(7) Iron & steel plant / nearby (<10 miles) deep saline formation
(7) Iron & steel plant / nearby (<10 miles) deep saline formation
(6) Coal-fired power plant / moderately distant (<50 miles) depleted gas field
(6) Coal-fired power plant / moderately distant (<50 miles) depleted gas field
(5) Large, coal-fired power plant / nearby (<25 miles) deep saline formation
(5) Large, coal-fired power plant / nearby (<25 miles) deep saline formation
(4) High purity hydrogen production facility / nearby (<25 miles) depleted gas field
(4) High purity hydrogen production facility / nearby (<25 miles) depleted gas field
(3) Large, coal-fired power plant / nearby (<10 miles) ECBM opportunity
(3) Large, coal-fired power plant / nearby (<10 miles) ECBM opportunity
(2) High purity natural gas processing facility / moderately distant (~50 miles) EOR opportunity
(2) High purity natural gas processing facility / moderately distant (~50 miles) EOR opportunity
(1) High purity ammonia plant / nearby (<10 miles) EOR opportunity
(1) High purity ammonia plant / nearby (<10 miles) EOR opportunity
(10) Gas-fired power plant / distant (>50 miles) deep saline formation
(10) Gas-fired power plant / distant (>50 miles) deep saline formation
(9) Cement plant / distant (>50 miles) deep saline formation
(9) Cement plant / distant (>50 miles) deep saline formation
($20)
$0
$20
$40
$60
$80
$100
1 2 3 4 5 6 7 8 9 10
Example CCS Cost Pair
Cos
t, $/
tCO
2
Capture Compression Transport Injection

13
The US Electric Utility Sector is going through and will continue to go through significant changes all of which impact the adoption of CCS technologies
$-
$1.00
$2.00
$3.00
$4.00
$5.00
$6.00
$7.00
$8.00
$9.00
$10.00
1985 1995 2005 2015 2025 2035 2045
$/m
mB
tu
.
Coal
Constrained Gas
(FP2)
Base Case Gas(FP1)
Historical US Average
Delivered Prices
Most NERC Regions have significant CO2 storage potential
Current and projected natural gas prices have fundamentally altered dispatch economics
$-
$10
$20
$30
$40
$50
$60
2005 2015 2025 2035 2045
$/tC
O2
.
CP1CP2
The possible imposition of constraints on CO2 emissions represents an additional factor that will fundamentally alter dispatch
0
100
200
300
400
500
600
700
800
900
2005 2015 2025 2035 2045
Gig
awat
ts o
f Ins
talle
d C
oal-f
ired
Elec
trici
ty C
apac
ity in
the
Con
tinen
tal U
SA
Reference CaseCP1FP1CP1FP2CP2FP1CP2FP2
Coal-fired electricity capacity could even expand beyond the no climate policy
reference case

14
Existing and New CO2-Venting Fossil Plants will still have Value (ECAR CP1FP1 as an Example)
• In the near term, only conventional (i.e., venting power plants) are capable of generating competitively priced electricity.
• ECAR investment to 2015 is limited to gas CCs and CTs for intermediate and peaking.
• While by 2025– The modeled carbon tax is
sufficient to induce some builds of IGCC+CCS where low-cost storage is available.
– Once built, running an IGCC + CCS is cheaper than a PC plant and paying the carbon tax for the vented CO2, but
– Existing PC plants are still economically viable means of generating electricity.
Dispatch Cost
0.0
10.0
20.0
30.0
40.0
50.0
60.0
70.0
80.0
90.0
0 20000 40000 60000 80000 100000 120000 140000 160000
MW
$/M
Wh
Renewables
Nuclear
PC
Gas Steam
PCGas CC
PC
Min Dispatch 50 pctile 90 pctile
PCNew
Gas CC
Gas CT2015
Dispatch Cost
0.0
10.0
20.0
30.0
40.0
50.0
60.0
70.0
80.0
90.0
0 20000 40000 60000 80000 100000 120000 140000 160000 180000
MW
$/M
Wh
Renewables
Nuclear
PC
Gas CT Gas Steam
PC Gas CC PC
Min Dispatch 50 pctile 90 pctile
PCNew Gas
CC
IGCC CCS
2025
15
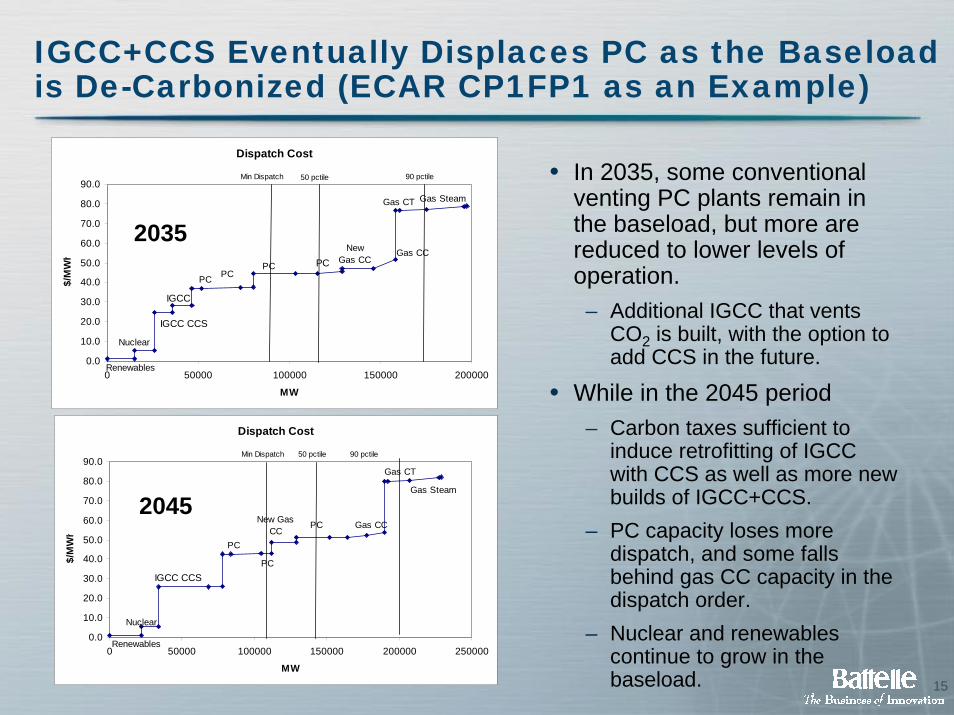
IGCC+CCS Eventually Displaces PC as the Baseload is De-Carbonized (ECAR CP1FP1 as an Example)
• In 2035, some conventional venting PC plants remain in the baseload, but more are reduced to lower levels of operation.
– Additional IGCC that vents CO2 is built, with the option to add CCS in the future.
• While in the 2045 period– Carbon taxes sufficient to
induce retrofitting of IGCC with CCS as well as more new builds of IGCC+CCS.
– PC capacity loses more dispatch, and some falls behind gas CC capacity in the dispatch order.
– Nuclear and renewablescontinue to grow in the baseload.
2015
Dispatch Cost
0.0
10.0
20.0
30.0
40.0
50.0
60.0
70.0
80.0
90.0
0 50000 100000 150000 200000
MW
$/M
Wh
Renewables
Nuclear
PC
Gas CT Gas Steam
PCGas CC
PC
Min Dispatch 50 pctile 90 pctile
PCNew
Gas CC
IGCC CCS
IGCC
2035
Dispatch Cost
0.0
10.0
20.0
30.0
40.0
50.0
60.0
70.0
80.0
90.0
0 50000 100000 150000 200000 250000
MW
$/M
Wh
Renewables
Nuclear
PC
New Gas CC
Gas CT
Gas Steam
PC Gas CC
PC
Min Dispatch 50 pctile 90 pctile
IGCC CCS
2045
16
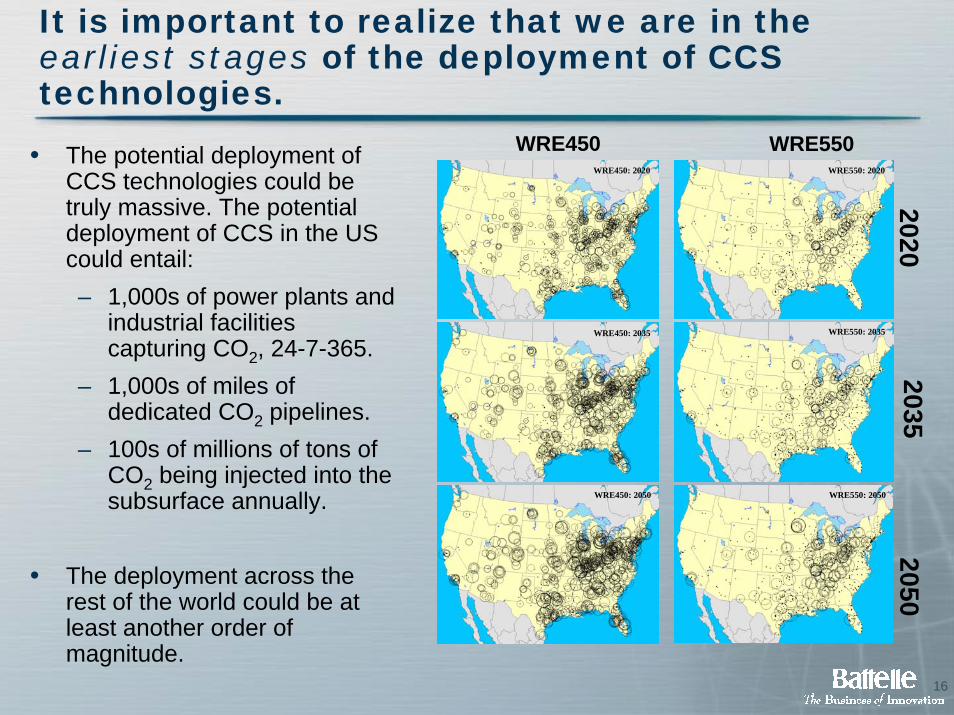
It is important to realize that we are in the earliest stages of the deployment of CCS technologies.
WRE450 WRE550• The potential deployment of CCS technologies could be truly massive. The potential deployment of CCS in the US could entail: – 1,000s of power plants and
industrial facilities capturing CO2, 24-7-365.
– 1,000s of miles of dedicated CO2 pipelines.
– 100s of millions of tons of CO2 being injected into the subsurface annually.
• The deployment across the rest of the world could be at least another order of magnitude.
20202035
2050
WRE450: 2020
WRE450: 2035
WRE450: 2050
WRE550: 2020
WRE550: 2035
WRE550: 2050
17
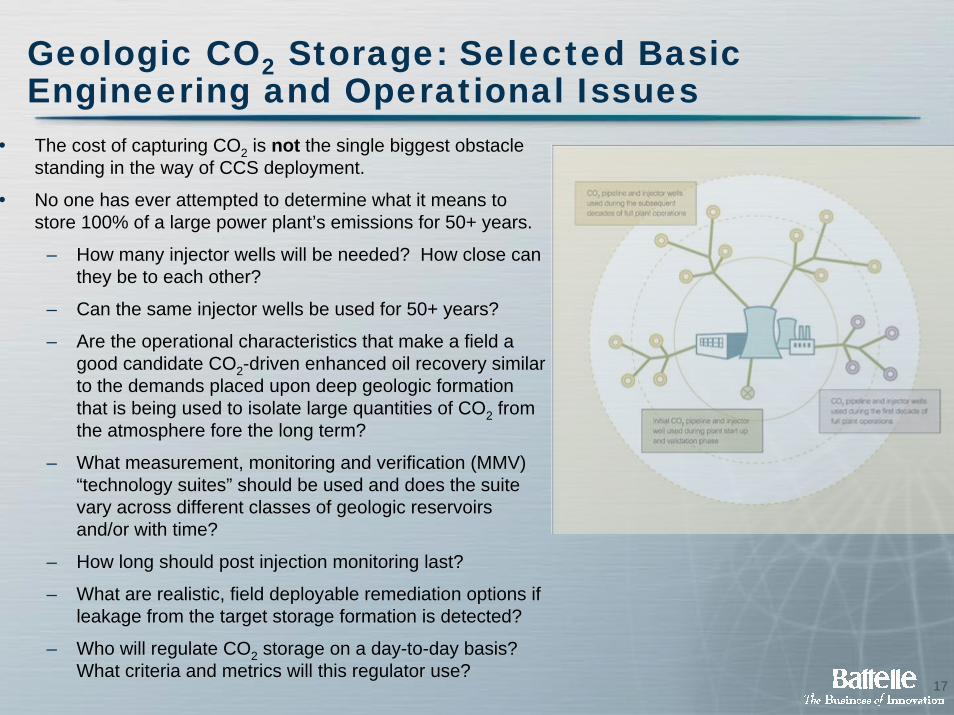
Geologic CO2 Storage: Selected Basic Engineering and Operational Issues
• The cost of capturing CO2 is not the single biggest obstacle standing in the way of CCS deployment.
• No one has ever attempted to determine what it means to store 100% of a large power plant’s emissions for 50+ years.
– How many injector wells will be needed? How close can they be to each other?
– Can the same injector wells be used for 50+ years?
– Are the operational characteristics that make a field a good candidate CO2-driven enhanced oil recovery similar to the demands placed upon deep geologic formation that is being used to isolate large quantities of CO2 from the atmosphere fore the long term?
– What measurement, monitoring and verification (MMV) “technology suites” should be used and does the suite vary across different classes of geologic reservoirs and/or with time?
– How long should post injection monitoring last?
– What are realistic, field deployable remediation options if leakage from the target storage formation is detected?
– Who will regulate CO2 storage on a day-to-day basis? What criteria and metrics will this regulator use?
18
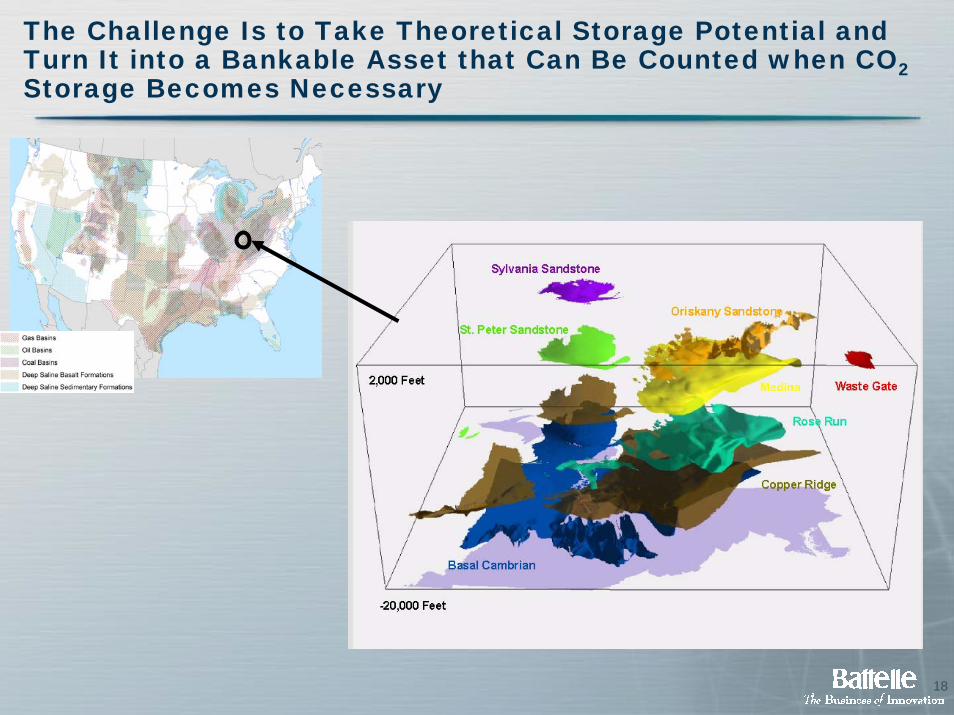
The Challenge Is to Take Theoretical Storage Potential and Turn It into a Bankable Asset that Can Be Counted when CO2 Storage Becomes Necessary

19
The Challenge Is to Take Theoretical Storage Potential and Turn It into a Bankable Asset that Can Be Counted when CO2 Storage Becomes Necessary
Horizontal Well Configuration for the Rose Run Formation
Vertical Well Configuration for the Rose Run Formation 700 days

20
The Scope of the Scale-up Challenge
World CCS ProjectsProjected Lifetime CO2 Storage
0-10 MtCO2
10-20 MtCO2
20-30 MtCO2
250 Million tons CO2 (approximate amount CO2 storage needs of one 1000MW IGCC operating for 50 years
1: Big Sky Partnership* 12: RECOPOL 2: CO2SINK 13: Salt Creek / NPR-3 3: Frio 14: Sleipner 4: Gorgon 15: Snohvit 5: Illinois Basin Partnership* 16: Southeast Partnership* 6: In Salah 17: Southwest Partnership* 7: K12B 18: Surat 8: Midwest Partnership* 19: West Coast Partnership* 9: Minama-Nagaoka 20: Weyburn 10: Otway 21: Yubari 11: Plains Partnership* *Denotes US DOE Regional Carbon Sequestration Partnerships Bold text denotes existing or completed projects
World CCS ProjectsProjected Lifetime CO2 Storage
0-10 MtCO2
10-20 MtCO2
20-30 MtCO2
250 Million tons CO2 (approximate amount CO2 storage needs of one 1000MW IGCC operating for 50 years
World CCS ProjectsProjected Lifetime CO2 Storage
0-10 MtCO2
10-20 MtCO2
20-30 MtCO2
250 Million tons CO2 (approximate amount CO2 storage needs of one 1000MW IGCC operating for 50 years
1: Big Sky Partnership* 12: RECOPOL 2: CO2SINK 13: Salt Creek / NPR-3 3: Frio 14: Sleipner 4: Gorgon 15: Snohvit 5: Illinois Basin Partnership* 16: Southeast Partnership* 6: In Salah 17: Southwest Partnership* 7: K12B 18: Surat 8: Midwest Partnership* 19: West Coast Partnership* 9: Minama-Nagaoka 20: Weyburn 10: Otway 21: Yubari 11: Plains Partnership* *Denotes US DOE Regional Carbon Sequestration Partnerships Bold text denotes existing or completed projects
1: Big Sky Partnership* 12: RECOPOL 2: CO2SINK 13: Salt Creek / NPR-3 3: Frio 14: Sleipner 4: Gorgon 15: Snohvit 5: Illinois Basin Partnership* 16: Southeast Partnership* 6: In Salah 17: Southwest Partnership* 7: K12B 18: Surat 8: Midwest Partnership* 19: West Coast Partnership* 9: Minama-Nagaoka 20: Weyburn 10: Otway 21: Yubari 11: Plains Partnership* *Denotes US DOE Regional Carbon Sequestration Partnerships Bold text denotes existing or completed projects
Stabilizing at 550 ppmvCumulative Global
Carbon StoredBetween 2005 and 2050:
33,000 MtCO2
Stabilizing at 550 ppmvCumulative U.S.Carbon Stored
Between 2005 and 2050:8,000 MtCO2

21
GTSP Phase II Capstone Report on Carbon Dioxide Capture and Storage• CCS technologies have tremendous potential
value for society.
• CCS is, at its core, a climate-change mitigation technology and therefore the large-scale deployment of CCS is contingent upon the timing and nature of future GHG emission control policies.
• The next 5-10 years constitute a critical window in which to amass needed real-world operational experience with CCS systems.
• The electric power sector is the largest potential market for CCS technologies and its potential use of CCS has its own characteristics that need to be better understood.
• Much work needs to be done to ensure that the potential large and rapid scale-up in CCS deployment will be safe and successful.

22
CO2 Capture and Storage: Not Nearly this Simple
Dispatch Cost
0.0
10.0
20.0
30.0
40.0
50.0
60.0
70.0
80.0
90.0
0 50000 100000 150000 200000 250000
MW
$/M
Wh
Renewables
Nuclear
PC
New Gas CC
Gas CT
Gas Steam
PC Gas CC
PC
Min Dispatch 50 pctile 90 pctile
IGCC CCS
≠Stabilization of CO2 at 550 ppm
0
200
400
600
800
1000
1200
1400
1600
1850 1900 1950 2000 2050 2100
Glo
bal P
rimar
y E
nerg
y 18
50-2
100
(Exa
joul
es)
.
FutureHistory
World CCS ProjectsProjected Lifetime CO2 Storage
0-10 MtCO2
10-20 MtCO2
20-30 MtCO2
250 Million tons CO2 (approximate amount CO2 storage needs of one 1000MW IGCC operating for 50 years
1: Big Sky Partnership* 12: RECOPOL 2: CO2SINK 13: Salt Creek / NPR-3 3: Frio 14: Sleipner 4: Gorgon 15: Snohvit 5: Illinois Basin Partnership* 16: Southeast Partnership* 6: In Salah 17: Southwest Partnership* 7: K12B 18: Surat 8: Midwest Partnership* 19: West Coast Partnership* 9: Minama-Nagaoka 20: Weyburn 10: Otway 21: Yubari 11: Plains Partnership* *Denotes US DOE Regional Carbon Sequestration Partnerships Bold text denotes existing or completed projects
World CCS ProjectsProjected Lifetime CO2 Storage
0-10 MtCO2
10-20 MtCO2
20-30 MtCO2
250 Million tons CO2 (approximate amount CO2 storage needs of one 1000MW IGCC operating for 50 years
World CCS ProjectsProjected Lifetime CO2 Storage
0-10 MtCO2
10-20 MtCO2
20-30 MtCO2
250 Million tons CO2 (approximate amount CO2 storage needs of one 1000MW IGCC operating for 50 years
1: Big Sky Partnership* 12: RECOPOL 2: CO2SINK 13: Salt Creek / NPR-3 3: Frio 14: Sleipner 4: Gorgon 15: Snohvit 5: Illinois Basin Partnership* 16: Southeast Partnership* 6: In Salah 17: Southwest Partnership* 7: K12B 18: Surat 8: Midwest Partnership* 19: West Coast Partnership* 9: Minama-Nagaoka 20: Weyburn 10: Otway 21: Yubari 11: Plains Partnership* *Denotes US DOE Regional Carbon Sequestration Partnerships Bold text denotes existing or completed projects
1: Big Sky Partnership* 12: RECOPOL 2: CO2SINK 13: Salt Creek / NPR-3 3: Frio 14: Sleipner 4: Gorgon 15: Snohvit 5: Illinois Basin Partnership* 16: Southeast Partnership* 6: In Salah 17: Southwest Partnership* 7: K12B 18: Surat 8: Midwest Partnership* 19: West Coast Partnership* 9: Minama-Nagaoka 20: Weyburn 10: Otway 21: Yubari 11: Plains Partnership* *Denotes US DOE Regional Carbon Sequestration Partnerships Bold text denotes existing or completed projects