
On the Nature of Manganese in Mn-S-1 and Mn-ZSM-5 Zeolites · from petroleum reforming and gas...
24
75 4 On the Nature of Manganese in Mn-S-1 and Mn-ZSM-5 Zeolites Abstract Manganese-containing silicalite-1 (Mn-S-1) and Mn-ZSM-5 zeolites have been hydrothermally synthesized. The influence of the silicon source, the manganese source and the template were investigated. X-ray diffraction (XRD) shows that there is no effect of the incorporation of Mn on the crystal structure and lattice parameters. Scanning Electron Microscopy (SEM) shows that the morphology and texture of the zeolite crystals is strongly affected by the template used, but the texture is not visibly affected by the different sources of silica and manganese, nor by the addition of alumina. On the other hand, the combination of scanning transmission electron microscopy (STEM) electron energy-loss spectroscopy (EELS) shows that Mn is spread in an inhomogeneous manner over the zeolite material, including the existence of a 2-3 nm thin Mn-rich layer covering the Si-rich crystals.
Transcript of On the Nature of Manganese in Mn-S-1 and Mn-ZSM-5 Zeolites · from petroleum reforming and gas...

75
4On the Nature of Manganese inMn-S-1 and Mn-ZSM-5 Zeolites
Abstract
Manganese-containing silicalite-1 (Mn-S-1) and Mn-ZSM-5 zeolites have been hydrothermally synthesized. The infl uence of the silicon source, the manganese source and the template were investigated. X-ray diffraction (XRD) shows that there is no effect of the incorporation of Mn on the crystal structure and lattice parameters. Scanning Electron Microscopy (SEM) shows that the morphology and texture of the zeolite crystals is strongly affected by the template used, but the texture is not visibly affected by the different sources of silica and manganese, nor by the addition of alumina. On the other hand, the combination of scanning transmission electron microscopy (STEM) electron energy-loss spectroscopy (EELS) shows that Mn is spread in an inhomogeneous manner over the zeolite material, including the existence of a 2-3 nm thin Mn-rich layer covering the Si-rich crystals.

Chapter 4
76
4.1. Introduction
Microporous materials have great industrial importance, ranging from petroleum reforming and gas separation processes to the production of bulk and fi ne chemicals. This is true for pure silicalite (S-1), as well as its aluminium-doped analogue ZSM-5, both belonging to the MFI topology. In many cases, metal ions are added to the ZSM-5 structure. The preparation of these metal-doped ZSM-5 materials can make either use of direct synthesis, impregnation or ion exchange methods. Synthesis of e.g. titanium silicalite-1 [1] (TS-1) through Ti isomorphous substitution of the network silicon atoms opened a new era in the preparation and application of these metal-containing zeolites. Other important catalysts include Fe-ZSM-5 [2] and Cu-ZSM-5 [3]. In addition, a range of other metal ions is added to S-1 and ZSM-5 zeolites, for example the substitution of Si with B or Ge in the ZSM-5-zeolite yields a more selective membrane in separation of n-C4H10/i-C4H10 compared with S-1 [4]. The amount of the metal ions that are incorporated can strongly affect their activity, for example in the case of molybdenum incorporated in S-1, where a low loading of 0.5 wt% presents no activity, whereas a 11 wt% loading has excellent catalytic properties in the epoxidation of the olefi ns [5]. Cobalt-incorporated ZSM-5 has good performance in the propylene oligomerization and can be synthesized using rapid crystallization methods [6] or through direct synthesis from aqueous fl uoride gels [7]. Fe-ZSM-5 systems are excellent catalysts in various applications, such as the decomposition of N2O, the selective catalytic reduction of NOx with hydrocarbons [8], the oxidation of benzene to phenol [9] and the oxidation of volatile organic compounds [10]. Much research is dedicated to the identifi cation of the active sites in Cu-ZSM-5 and the NO decomposition reaction mechanism. A 100% selective conversion of NO into N2 and O2 can be achieved over Cu-ZSM-5 above 623 K with maximum activity in the temperature range 723– 773 K [11-13].In contrast, only a few studies are published on Mn-doped zeolites, including the Selective Catalytic Reduction of NOx using different hydrocarbons as propane [14] or methane [15,16], the epoxidation of styrene [17], the oxidation of SO2 in the aqueous phase [18], the benzene hydroxylation to phenol [19], the simultaneous isomerization and dehydrogenation of n-

On the Nature of Manganese in Mn-S-1 and Mn-ZSM-5 Zeolites
77
butane [20] or the oxidative conversion of methane [21]. A range of synthesis methods were developed, including the recrystallization of ion exchanged zeolite systems [22], direct synthesis from aqueous fl uoride gels [7] and hydrothermal synthesis [23]. In this chapter the infl uence of the silicon source (Si), manganese source (Mn), and the structure-directing agent for MnS-1 and Mn-ZSM-5 synthesis are investigated.Scientifi c questions that we would like to address include: (a) How much Mn is inserted?; (b) What is the valence state of Mn?; (c) Do the Mn ions modify the structure and morphology?; (d) How are the Mn ions spread over the material? Question (a) will be answered by elemental analysis, for example X-Ray Fluorescence (XRF). Structural characteristics have been investigated with X-Ray Diffraction (XRD) and the morphology with Scanning Electron Microscopy (SEM). The spreading of Mn over the zeolite needs a tool that has both the capability for elemental analysis and a good spatial resolution. This combination of characterization possibilities is provided by Scanning Transmission Electron Microscopy (STEM), equipped with an Electron Energy Loss Spectroscopy (EELS) detector. The combination of these characterization tools provides a detailed picture of the nature of the Mn in both S-1 and ZSM-5 zeolite and as such allows investigating the synthesis procedure on the incorporation process.
4.2. Experiment
4.2.1. Catalyst preparation
Mn-S-1 and Mn-ZSM-5 zeolite were hydrothermally synthesized from a gel containing a manganese source, a silica source, a template molecule plus an aluminium source for the ZSM-5 synthesis. In order to optimize the fi nal structure, different sources of silica and manganese, as well as different zeolite templates were used (Table 1). The silica sources used were SiO2 (CabOsil, Grade M5) and tetraethyl orthosilicate (TEOS), from Aldrich (> 98%). As manganese sources we have used tetrahydrated manganese acetate (Mn(ac)2·4H2O), from Acros (> 99%) and manganese nitrate (Mn(NO3)2·9H2O), from Aldrich (> 98%). Aluminium nitrate (Al(NO3)3·9H2O), from Aldrich (98%+) was used as Al source. Two different templates were
Chapter 4
78
used, tetraethyl ammonium hydroxide (TEAOH) (Alfa Aesar, 35% w/w in water) and tetrapropyl ammonium hydroxide (TPAOH) (Alfa Aesar, 40% w/w in water). In addition, NaCl (Alfa Aesar, > 99%) and H2O were used in the synthesis. The molar composition ratio of Mn-S-1 was 1:50:15 for MnO: SiO2: template dissolved within 2000 units of water. When ZSM-5 is prepared the same ratio was used, were 1 unit of Al2O3 was added. In case CabOsil was used as silica source, the gel was prepared by dissolving the NaCl in 2/3 of the total amount of the water. The template molecules (TEAOH or TPAOH) were added and 90% of the silica source was added dropwise during heating and steering in order to facilitate the dissolution of the silica. The Mn(ac)2, respectively, Mn(NO3)2 was dissolved in the remaining 1/3 of the water and, in case of ZSM-5, Al(NO3)3 was added. When the composition containing the silica source becomes a clear solution and all the silica was dissolved, the manganese solution was added dropwise under continuous steering. After the manganese addition, the remaining 10% of the silica source was added and the gel was kept under steering for another hour in order to have a homogeneous gel. When TEOS was used as silica source, a different gel preparation method was used. NaCl was added to the TEOS and the template solution. The Mn and (if used) the Al sources were dissolved in the total volume of water. The Mn/Al solution was dropwise added to the Si/template solution under continuous steering for 1 h. The gel resulting from both methods was transferred to a Tefl on autoclave, which was heated in static conditions for 3 days at 448 K. The template was removed by pyrolysis in a dried fl ow of nitrogen at 793 K for 2 h and consecutive calcination in a fl ow of air at the same temperature for another 2.5 h.

79
4.2.2. Characterization techniques
X-ray fl uorescence spectroscopy
Elemental analysis was carried out using a Goffi n Meyvis X-lab 2000 X-Ray Fluorescence (XRF) spectrometer in order to determine the Mn loading and the Si and Al content in the synthesized materials.
X-ray diffraction
X-Ray Diffraction (XRD) was measured using an Enraf-Nonius CPS 120 powder diffraction apparatus with Cu Kα radiation (λ=1.540 Å). XRD patterns were measured of Mn-S-1 and Mn-ZSM-5 materials as-made and template free. The XRD patterns were collected in the 2Θ range of 5-35 degree in steps of 0.01 degree with 2s/step.
On the Nature of Manganese in Mn-S-1 and Mn-ZSM-5 Zeolites
Table 1.Samples obtained by combining different parameters as silica source, manganese source and template molecules, associated with their
corresponding sample code. The code CEA stands for e.g. CabOsil-TEAOH-Acetate, etc.
Al source Si source Template Mn source Sample code
-
-
-
-
CabOsil TEAOH Acetate MnS1CEA
Nitrate MnS1CEN
TEOS TEAOH Acetate MnS1TEA
Nitrate MnS1TEN
CabOsil TPAOH Acetate MnS1CPA
Nitrate MnS1CPN
TEOS TPAOH Acetate MnS1TPA
Nitrate MnS1TPN
Nitrate TEOS TPAOH Acetate Mn-ZSM5TPA
Nitrate Mn-ZSM5TPN
Chapter 4
80
Scanning electron microscopy
The size and morphology of as-synthesized and template free crystals were investigated using a Scanning Electron Microscope (SEM). Scanning Electron Micrographs were obtained on a JEOL 840 electron microscope at an accelerating voltage of 15 kV. The samples were sputtered with gold before taking the images.
Transmission electron microscopy and electron energy loss spectroscopy
Scanning Transmission Electron Microscopy (STEM) - Electron Energy-Loss Spectroscopy (EELS) measurements were performed in Orsay (France) with a 100 keV STEM instrument (VG HB 501) equipped with a fi eld emission electron source. Mounted on the STEM instrument was a parallel electron energy-loss spectrometer (Gatan 666) optically coupled to a CCD camera generating an EELS spectrum with a 0.5-0.7 eV energy resolution and 0.5 nm spatial resolution within a typical acquisition time down to 1 ms per pixel [24]. In these experiments, the oxygen K edge, silicon L edge and manganese L edge were monitored. The solids were fi rst sonicated in ethanol and then dropped on a holey amorphous carbon fi lm supported on a copper grid. After the sample was scanned, appropriate areas were selected for the measurement of detailed 2-D STEM-EELS images. An energy range of 15 eV was used to quantify the EELS spectra.
Diffuse refl ectance UV-Vis-NIR spectroscopy
After template removal, the samples were introduced in a quartz fl ow cell equipped with a UV-Vis-NIR transparent window. Two O-ring valves were used in order to make the cell airtight and allow us to make in-situ measurements. UV-Vis-NIR diffuse refl ectance (DR) spectra were recorded on a Varian Cary 500 spectrometer in the range 5000 – 50000 cm-1 (200-2000 nm).

81
Table 2. Overview of the characterization techniques used for each of the prepared samples.
Sample code XRF XRD SEM STEM -EELS
UV-Vis
MnS1CEA am am, tf amMnS1CEN am am, tfMnS1TEA am am, tf
am
MnS1TEN am am, tfMnS1CPA am am, tfMnS1CPN am am, tfMnS1TPA am am, tf am
tf,N2O/NO
MnS1TPN am am, tfMn-ZSM5TPA am am, tf tf tf
tf,N2O,/NO
Mn-ZSM5TPN am am, tf
am=as-made; tf= template free; N2O/NO= after treatment with N2O/NO
Catalytic testing
Catalytic activity was measured using a quartz fl ow reactor in which typically 0.1 g catalyst was placed on a frit. The reactor was placed in an oven that can be controlled within ±1 K from the desired temperature using a West 6810 temperature controller. Concentrations and fl ow rate (total fl ow rate of 80 ml/min) were controlled by means of Brooks mass fl ow controllers. The inlet concentration of N2O was 3750 ppm balanced with He until the desired fl ow. Before each run, the catalyst was pre-treated by heating up to 673 K in a He fl ow for 1 h. Then the catalyst was cooled down to the reaction temperature. A typical catalytic experiment consists of exposures to N2O for 1 h, followed for 10 min fl ushing with He in order to eliminate the traces of N2O from the system. At the end of the fl ushing period, 3750 ppm of NO was introduced in the gas fl ow for 1 h, followed again by a 10 min period of fl ushing with He. These steps were repeated three times, generating three consecutive cycles of N2O/NO treatments. Product analysis was carried out using an Interscience Compact GC system, equipped with two different columns (a Molsieve 5A and a Porabond Q) each having a TCD detector. In
On the Nature of Manganese in Mn-S-1 and Mn-ZSM-5 Zeolites
Chapter 4
82
addition, a Thermo Environment Instruments 42C NOx chemoluminescence analyzer was connected in parallel with the GC in order to determine the NO and NOx concentrations and could be operated simultaneously.
4.3. Results
4.3.1. Synthesis using TEAOH and TPAOH
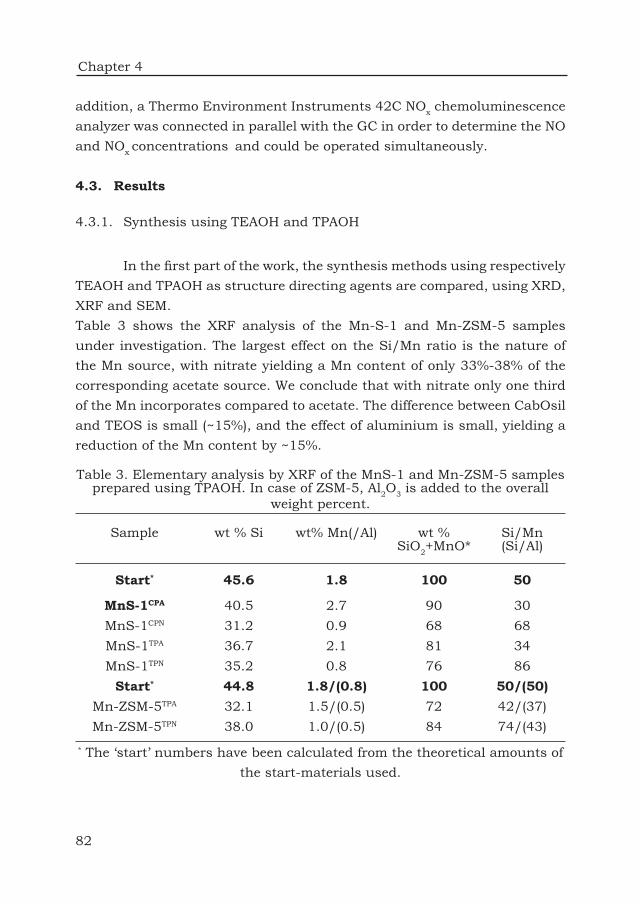
In the fi rst part of the work, the synthesis methods using respectively TEAOH and TPAOH as structure directing agents are compared, using XRD, XRF and SEM. Table 3 shows the XRF analysis of the Mn-S-1 and Mn-ZSM-5 samples under investigation. The largest effect on the Si/Mn ratio is the nature of the Mn source, with nitrate yielding a Mn content of only 33%-38% of the corresponding acetate source. We conclude that with nitrate only one third of the Mn incorporates compared to acetate. The difference between CabOsil and TEOS is small (~15%), and the effect of aluminium is small, yielding a reduction of the Mn content by ~15%.
Table 3. Elementary analysis by XRF of the MnS-1 and Mn-ZSM-5 samples prepared using TPAOH. In case of ZSM-5, Al2O3 is added to the overall
weight percent.
Sample wt % Si wt% Mn(/Al) wt %SiO2+MnO*
Si/Mn(Si/Al)
Start* 45.6 1.8 100 50
MnS-1CPA 40.5 2.7 90 30MnS-1CPN 31.2 0.9 68 68MnS-1TPA 36.7 2.1 81 34MnS-1TPN 35.2 0.8 76 86
Start* 44.8 1.8/(0.8) 100 50/(50)Mn-ZSM-5TPA 32.1 1.5/(0.5) 72 42/(37)Mn-ZSM-5TPN 38.0 1.0/(0.5) 84 74/(43)
* The ‘start’ numbers have been calculated from the theoretical amounts of the start-materials used.

83
The use of TEAOH as template
Tušar et al. [23] reported for the fi rst time the synthesis of Mn-ZSM-5 materials using TEAOH as a structure directing agent. Figure 1 shows the XRD pattern and SEM image of MnS-1CEA. The broad rising background in XRD shows the presence of an amorphous phase and the superimposed sharp lines indicates the simultaneous presence of a crystalline phase. In addition, the SEM image shows the presence of amorphous-looking small particles. The MnS-1CEA sample has been synthesized a number of times and Figure 2 presents XRD patterns for different samples prepared using the same preparation protocol. It is observed that the reproducibility of the method is poor. The top XRD pattern indicates mainly an amorphous phase, whereas the bottom spectrum shows mainly the crystalline phase with a minor amorphous fraction.In the case of TEOS as silica source and Mn nitrate as Mn source, things got even worse and Figure 3 shows that for those samples only an amorphous phase was synthesized.
A B
Figure 1. XRD pattern (A) and SEM picture (B) of the as-synthesized MnS-1CEA sample when TEAOH is used as a structure directing agent.
On the Nature of Manganese in Mn-S-1 and Mn-ZSM-5 Zeolites

Chapter 4
84
Figure 2. XRD patterns of the as-synthesized MnS-1CEA sample obtained when reproducibility was investigated.
Figure 3. (A) XRD patterns of the as-synthesized MnS-1TEA (a), MnS-1TEN (b) and MnS-1CEN (c) samples obtained using TEAOH as a structure directing agent. (B) SEM image of the as-synthesized MnS-1TEA corresponding to the
XRD pattern (a).
A B

85
The use of TPAOH as template
Searching through the zeolite synthesis literature it was observed that there is another compound, which can be used for making MFI zeolites: This is TPAOH. Figure 4 shows that the use of TPAOH yields a single-phase crystalline material. The SEM image shows beautiful rounded crystals of approximately 200 nm diameter. Figure 5 shows that this single-phase material was also obtained when the alternative silica and manganese sources were used indicating that the TPAOH template is in all cases a successful directing agent for the synthesis of MnS-1 materials.
Figure 4. XRD pattern (A) and SEM picture (B) of the as-synthesized MnS-1CPA sample when TPAOH is used as a structure directing agent.
BA
Figure 5. XRD patterns of the as-synthesized MnS-1CPA (a), MnS-1TPN (B) and MnS-1TPA (c) samples obtained using
TPAOH as a structure directing agent.
On the Nature of Manganese in Mn-S-1 and Mn-ZSM-5 Zeolites

Chapter 4
86
Figure 6. (A) XRD patterns of MnS-1TPA (a) and Mn-ZSM-5TPA (b) compared with diffraction pattern of pure phase compounds as ZSM-5 [25] (c)
structure and different manganese oxide phases-MnO (d), Mn2O3 (e) and MnO2 (f). (B) Zoom in the region of 23 to 25 theta for MnS-1TPA (top pattern)
and Mn-ZSM-5TPA (bottom pattern).
BA
The XRD patterns have been further analyzed. Figure 6 presents the diffraction pattern of a pure ZSM-5 phase [25] along with the diffraction pattern for manganese oxide phases MnO (99%, Aldrich), Mn2O3 (99%, Aldrich) and MnO2 (99.99%, Aldrich) and compared with MnS-1TPA and Mn-ZSM-5TPA samples.
No evidence for the presence of other manganese oxide phases is obtained and the MFI structure is confi rmed as seen from the characteristic MFI region between of 23 to 25 degrees (Figure 6B). The small systematic shift of 0.07 2 θ degrees observed lies within the experimental accuracy. Figure 7 shows the XRD pattern and SEM picture of Mn-ZSM-5TPA after template removal. As seen, the removal of the template has no detectable infl uence over the peak positions. The intensity of the small-angle peaks (7 to 10 degrees) is increased, while the intensity of the wide angle peaks, (23 to 25 degrees) is decreased. These intensity changes can be viewed as an increase in the long range order and a decrease in the short range order. This behaviour is expected to occur when the structure directing agent is removed. Also, from SEM picture we can observe a large distribution of crystal sizes, having dimensions between 200 to 600 nm.

87
4.3.3. Scanning transmission electron microscopy electron energy-loss spectroscopy
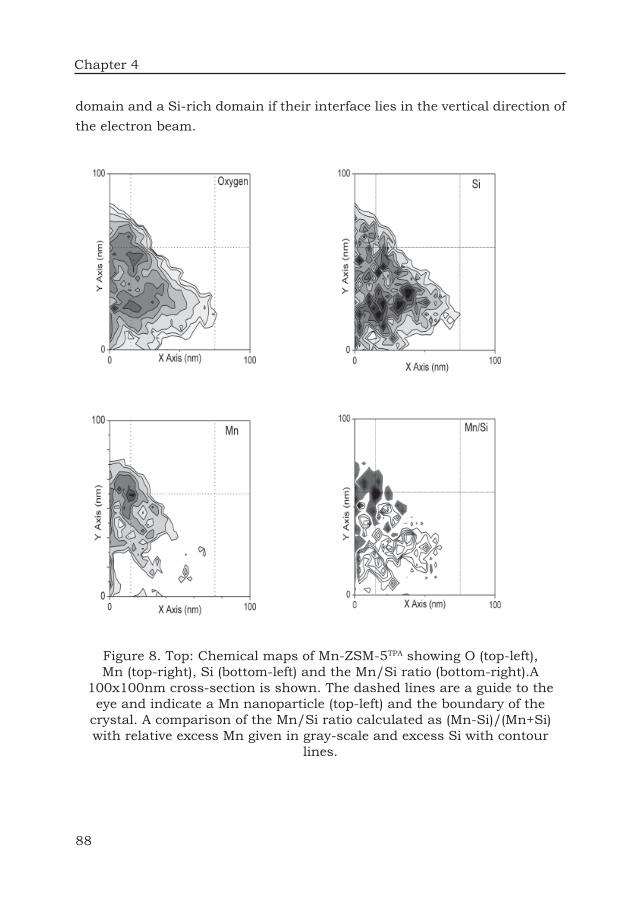
STEM-EELS measurements were performed in order to determine the distribution of manganese in the zeolite crystals. STEM has a spatial resolution of 0.5 nm and detailed Oxygen K edge (530 eV), Silicon L edge (100 eV) and Manganese L edge (640 eV) EELS spectra have been measured. Quantifi cation of the EELS spectra allows for a detailed 2D scan of the relative amounts of O, Si and Mn. Energy ranges of 15 eV at the O, Si and Mn edges have been used to quantify their relative amounts. In Figure 8 we show the 100 nm by 100 nm EELS chemical maps of Mn-ZSM-5TPA after template removal. Maps are given for oxygen (top-left), manganese (top-right), silicon (bottom-left) and the Si/Mn ratio (bottom-right). The Mn/Si ratio has been quantifi ed by fi rst normalizing the Mn and Si maps to 1.0, followed by the calculation of (Mn-Si)/(Mn+Si). This yields the excess Mn, respectively Si for each pixel. It is noted that the STEM-EELS experiments are performed in transmission and hence indicate elemental columns through the crystals. This implies that one only obtains a clear distinction between a Mn-rich
A
a
b
B
Figure 7. XRD pattern (A) of Mn-ZSM-5TPA as synthesized (a) and Mn-ZSM-5TPA template free (b) along with a SEM picture (B) of Mn-ZSM-5TPA after
template removal.
On the Nature of Manganese in Mn-S-1 and Mn-ZSM-5 Zeolites
Chapter 4
88
domain and a Si-rich domain if their interface lies in the vertical direction of the electron beam.
Figure 8. Top: Chemical maps of Mn-ZSM-5TPA showing O (top-left), Mn (top-right), Si (bottom-left) and the Mn/Si ratio (bottom-right).A
100x100nm cross-section is shown. The dashed lines are a guide to the eye and indicate a Mn nanoparticle (top-left) and the boundary of the
crystal. A comparison of the Mn/Si ratio calculated as (Mn-Si)/(Mn+Si) with relative excess Mn given in gray-scale and excess Si with contour
lines.

89
The oxygen map shows the distribution of oxygen atoms. The outer boundary of the oxygen map can be interpreted as the edge of the Mn-ZSM-5TPA particle and the intensity as the samples thickness. At fi rst inspection, the Si map seems to follow the oxygen map, indicating the SiO2 bulk material of the zeolite. The manganese map shows high Mn concentration in the top left of the zeolite particle. At the position indicated at the crossing of the dashed lines, the Mn concentration is highest and exactly at this point the Si concentration has a minimum. This effect is highlighted by the (normalized) Mn/Si ratio map. One observes areas of excess of Mn, where the Mn seems to be interwoven with Si, suggesting the intergrowth of MnOx particles with the zeolite. Similar intergrowth and MnOx particles were seen for different position for fi ve different zeolite crystals.
4.3.4. UV-Vis-NIR Diffuse Refl ectance Spectroscopy
Figure 9 shows that UV-Vis-NIR DRS measurements of the template free MnS1TPA. An absorption band at 20200 cm-1 was observed, which is characteristic for a 5Eg � 5T2g transition of (distorted) trivalent manganese. A similar band has been observed for MnIII/Al2O3 [26] and Mn(PO3)3 [27]. More details are given in Table 2 of Chapter 3. Treatments of the sample with N2O and with NO have no effect on the shape and intensity of the UV-Vis-NIR DRS spectrum. This is illustrated in Figure 9. The Mn-ZSM-5TPA sample shows similar UV-Vis-NIR DRS spectra, with the mention that the band at 20200 cm-1 has a lower intensity (not shown). During N2O and NO treatments, the Mn-ZSM-5TPA sample shows also the same inert behavior as in the case of the silicalite.
On the Nature of Manganese in Mn-S-1 and Mn-ZSM-5 Zeolites
Chapter 4
90
4.4. Catalytic testing
N2O decomposition
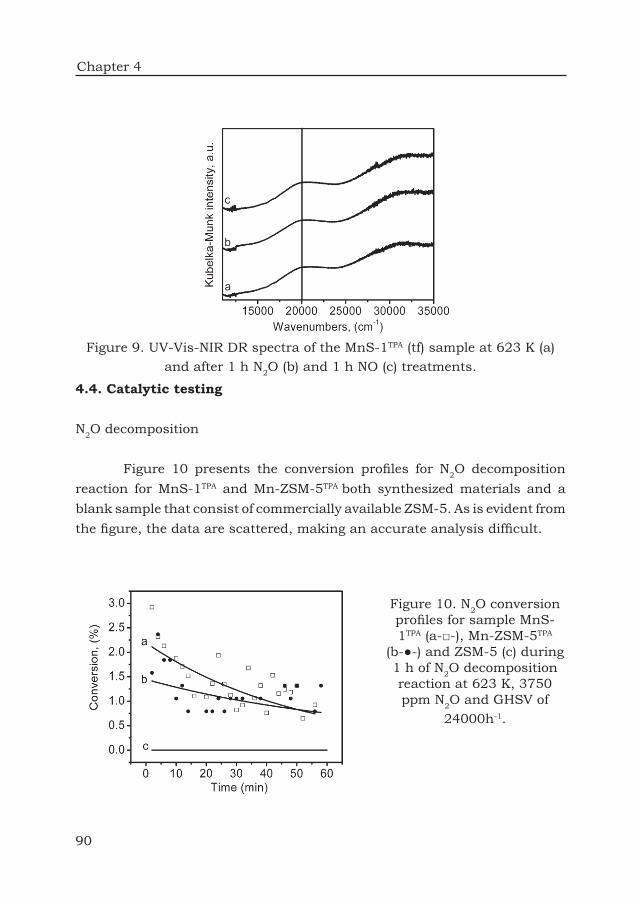
Figure 10 presents the conversion profi les for N2O decomposition reaction for MnS-1TPA and Mn-ZSM-5TPA both synthesized materials and a blank sample that consist of commercially available ZSM-5. As is evident from the fi gure, the data are scattered, making an accurate analysis diffi cult.
Figure 9. UV-Vis-NIR DR spectra of the MnS-1TPA (tf) sample at 623 K (a) and after 1 h N2O (b) and 1 h NO (c) treatments.
Figure 10. N2O conversion profi les for sample MnS-1TPA (a-□-), Mn-ZSM-5TPA
(b-●-) and ZSM-5 (c) during 1 h of N2O decomposition reaction at 623 K, 3750 ppm N2O and GHSV of
24000h-1.

91
It is noticed that the blank sample presents no activity towards N2O decomposition, while MnS-1TPA presents a somewhat higher activity than Mn-ZSM-5TPA. As notice in the N2O conversion profi les after 10 minutes a steady state level is reached with a conversion value of 1.5 % for MnS-1TPA and 1% for Mn-ZSM-5TPA.The only observed products formed during these catalytic tests were nitrogen and oxygen, according to the decomposition reaction:
2N2O � 2N2 + O2
During multiple catalytic cycles, no signifi cant decrease in the activity is observed for both MnS-1TPA and Mn-ZSM-5TPA. Figure 11 shows the results from MnS-1TPA, which again are rather scattered preventing a fi rm conclusion.
Figure 11.N2O conversion profi les for sample MnS-1TPA during 1 h of N2O decomposition reaction at 623 K, 3750 ppm N2O and GHSV of 24000h-1
for the fi rst (a-□-) and second (b-●-)) catalytic cycle. The third cycle has a similar behavior as the second catalytic cycle (not shown).
On the Nature of Manganese in Mn-S-1 and Mn-ZSM-5 Zeolites

Chapter 4
92
NO oxidation
As stated in the experimental section, the introduction of NO takes place after the N2O exposure and is carried out at the same reaction conditions as the N2O decomposition reaction.As we can observe in Figure 12, MnS-1TPA sample presents a higher activity compared to Mn-ZSM-5TPA for the oxidation on NO. However, both samples show the same profi le, with an induction time of about 5 min, after which the activity of these materials reaches a stable value.The low activity observed for Mn-ZSM-5TPA sample is maintained also during multiple catalytic cycles, while the MnS-1TPA sample presents a small
decrease of the activity with an increasing number of catalytic cycles. An unexpected result was observed during this reaction, namely, that the only products of this reaction were NO2 and N2O. The presence of N2O in the reactor output gas indicates the possibility that NO is involved in a disproportionation reaction.Figure 13 presents the concentrations observed for the N2O and NO2 compared with the amount of NO consumed during this reaction.
Figure 12. NO conversion profi les for sample MnS-1TPA (a), Mn-ZSM-5TPA (b) and ZSM-5 (c) during 1 h of NO exposure at 623 K, 3750 ppm NO and
GHSV of 24000h-1.

93
A similar behavior has been observed by Bell et al. [28], who investigated NO adsorption over Mn-ZSM-5 samples and observed traces of N2O and NO2 while desorption of NO was carried out at different temperature .
Discussion
1. Comparison of TEAOH and TPAOH
Hydrothermal synthesis of MnS-1 using TEAOH as a template showed that the material that we obtained is characterized by the presence of both amorphous and crystalline phases (Figure 1), similar to results obtained by Tusar et al [23]. The simultaneous formation of both amorphous and crystalline phase can be explained by the fact that TEAOH exists in solution in two conformations, tt. tt and tg. tg as demonstrated by Naudin et al.[29]. This hypothesis was confi rmed recently by O’Brien et al. [30] who found that depending on the conformation isomer of TEAOH present in solution, different types of molecular sieves can be obtained. The infl uence of these two isomers can explain also the poor reproducibility observed for this
Figure 13. Concentration profi les for N2O (-□-) and NO2 (-◊-) as observed at the output of the reactor, compared with the amount of NO (-●-) consumed
for sample MnS-1TPA during 1 h of NO exposure at 623 K, 3750 ppm NO and GHSV of 24000 h-1.
On the Nature of Manganese in Mn-S-1 and Mn-ZSM-5 Zeolites

Chapter 4
94
preparation procedure. On the other hand, the use of TPAOH during the synthesis procedure yields a single-phase crystalline material (Figure 4). Based on this result it can be stated that the use of TEAOH as a structure directing agent is not successful for the synthesis of MnS-1 materials.
2. Position of the Mn in Mn-ZSM-5 and MnS-1
For a better understanding of the nature of the manganese in these materials, a Rietveld refi nement of the XRD patterns was performed. The results are presented in Table 4.
Table 4. Results of the Rietveld refi nement for MnS-1TPA and Mn-ZSM-5TPA as compared with pure ZSM-5 presented in the crystallographic database
[25]. The Rietveld refi nement has been explained in Chapter 2.
Sample Mn Loading Cell parameters
(wt %) α a b c
MFI[25] 0 90 20.02 19.89 13.38MnS-1TPA 1.8 90 20.02 19.90 13.38
Mn-ZSM-5TPA 1.5 90 20.02 19.91 13.39
These results imply that no detectable infl uence of Mn on the lattice was observed. The inclusion of transition metal ions has been correlated with a change in the unit cell dimensions as discussed by Weckhuysen et al. [31]. Assuming a similar effect on MFI compared to the microporous aluminophosphate materials as discussed in reference [31] one would expect a change of the cell parameter (a) from 20.02 to 20.06 for a 1.8 wt% loading. This increase would have been detectable from the Rietveld analysis. The absence of this infl uence on the lattice parameters suggests that the loading of the manganese in the zeolite framework is less then the total loading of the sample. Using STEM-EELS measurement we were able to construct chemical maps for the Mn-ZSM-5TPA sample. Having the individual maps for manganese and silicon one can construct a relative comparison of the Mn/Si ratio by using a mathematical procedure as presented in the STEM-

95
EELS section. After normalization to 1 of the EELS signal, by calculating the (Mn-Si)/(Mn+Si) ratio, we obtain values in the range of -1 and 1. The values included in the -1 to 0 range are representing regions where silicon have a higher concentration then Mn, where the values contained in the 0 to 1 range are representing the regions where manganese has a higher concentration compared to silicon. By plotting these values we obtain a relative Mn/Si ratio map (see Figure 11 bottom-right). This map provides the answer to the question regarding the position of the manganese in Mn-ZSM-5 samples indicating the presence of manganese-rich domains along with silicon-rich domains, implying a non-equal distribution of Mn throughout the Mn-ZSM-5TPA sample. The UV-Vis spectra revealed an absorption band situated at 20200 cm-1, which is characteristic for compounds containing Mn3+ (Table 2 of Chapter 3). The exposure of the samples to N2O and NO has no effect on the observed UV-Vis band, indicating that these materials are not able to produce α–oxygen species.This speculation is confi rmed by the catalytic testing of the materials. During exposure to N2O, MnS-1TPA and Mn-ZSM-5TPA are presenting modest conversion values (Figure 10). However, an unexpected result was obtained when MnS-1TPA was exposed to NO. It seems that NO is involved in a disproportionation reaction, as suggested by the presence of both N2O and NO2 in the output gas (Figure 13). With a conversion rate of ~8 %, this material has a selectivity to N2O of ~75 % and to NO2 of 16 %. These high selectivities suggest that this material could potentially be used as a novel NO catalyst removal, where N2O can be transformed to N2 and O2 by another type of catalyst, while NO2 can be purifi ed and used further on.
4.5. Concluding remarks
We have shown that the Mn source is important for the synthesis, with Mn-acetate yielding the highest degree of incorporation. SEM showed that the texture of the crystals is strongly affected by the template used, but the texture is not affected by the different sources of silica and manganese, nor by the addition of alumina or the template removal. The same conclusion
On the Nature of Manganese in Mn-S-1 and Mn-ZSM-5 Zeolites

Chapter 4
96
applies to the crystal structure as revealed by XRD. A very interesting result was obtained on the spreading of Mn over
the material. One would expect that in a set of materials with a single-phase XRD pattern and equivalent SEM images with clean-shaped crystals of ~200 nm size these materials have a uniform distribution of their constituents. The STEM-EELS results clearly show the opposite. The Mn/Si ratio changes drastically throughout the same crystal. The STEM-EELS images show, for example, the existence of thin Mn-rich layers covering the Si-rich crystals. The thickness of these Mn-rich layers is only in the order of a few nanometers. Actually, the fact that they are only a few nm thin, prevents their detection as a separate phase in XRD. Because these Mn-rich layers seem to either cover crystallites or fi ll holes in other crystallites, this also implies that, the overall texture of the crystals does not degrade, implying similar SEM images.
An important lesson from this analysis is that if one studies the inclusion of metal ions in zeolites, identical XRD patterns and equivalent SEM images cannot be used to assume that the metal ions have been incorporated in a uniform, or almost uniform, manner. These results on Mn-ZSM-5 show the opposite. This implies that the distribution of metal ions in zeolites can only be determined from an element specifi c microscopic technique with (sub)nanometer resolution.
Although these materials are not able to form α–oxygen species, the MnS-1TPA sample opens the door to a possible novel catalyst for NO removal.
Acknowledgements
Dr. R. F. Lobo of the Department of Chemical Engineering, University of Delaware is kindly acknowledged for his hospitality during the visit in his department and the valuable input that led to the synthesis of the materials presented in this Chapter. Financial support was provided by the Netherlands Organization for Scientifi c Research – Chemical Sciences (NWO-CW) and the Netherlands Research School Combination on Catalysis (NRSCC).

97
References
[1] M. Taramasso; G. Perego; B. Notari, U.S. Patent 4410501, 1983.[2] A. K. Uriarte; M. A. Rodkin; M. J. Gross; A. S. Kharitonov; G. I. Panov, Direct hydroxylation of benzene to phenol by nitrous oxide. In 3rd World Congress on Oxidation Catalysis, 1997; Vol. 110; pp 857.[3] M. Iwamoto; H. Furukawa; Y. Mine; F. Uemura; S. Mikuriya; S. Kagawa, J.Chem. Soc. Chem. Commun., (1986), 1272.[4] V. A. Tuan; J. L. Falconer; R. D. Noble, Micropor. Mesopor. Mat., 41, (2000), 269.[5] M. Masteri-Farahani; F. Farzaneh; M. Ghandi, J. Mol. Catal. A Chem., 192, (2003), 103.[6] T. Inui; J. B. Kim; T. Takeguchi, Zeolites, 17, (1996), 354.[7] C. I. Round; C. D. Williams; C. V. A. Duke, Chem. Commun., (1997), 1849.[8] H. Y. Chen; W. M. H. Sachtler, Catal. Today, 42, (1998), 73.[9] G. I. Panov; A. S. Kharitonov; V. I. Sobolev, Appl. Catal. A Gen., 98, (1993), 1.[10] J. Halasz; M. Hodos; I. Hannus; G. Tasi; I. Kiricsi, Colloids Surf. A:Physicochem. Eng. Aspects, 265, (2005), 171.[11] M. H. Groothaert; J. A. van Bokhoven; A. A. Battiston; B. M. Weckhuysen; R. A. Schoonheydt, J. Am. Chem. Soc., 125, (2003), 7629.[12] H. Yahiro; M. Iwamoto, Appl. Catal. A Gen., 222, (2001), 163.[13] M. H. Groothaert; K. Lievens; H. Leeman; B. M. Weckhuysen; R. A. Schoonheydt, J. Catal., 220, (2003), 500.[14] A. De Lucas; J. L. Valverde; F. Dorado; A. Romero; I. Asencio, J. Mol. Catal. A Chem., 225, (2005), 47.[15] M. C. Campa; D. Pietrogiacomi; S. Tuti; G. Ferraris; V. Indovina, Appl. Catal. B Envir., 18, (1998), 151.[16] Q. Sun; W. M. H. Sachtler, Appl. Catal. B Envir., 42, (2003), 393.[17] Q. H. Zhang; Y. Wang; S. Itsuki; T. Shishido; K. Takehira, J. Mol. Catal. A Chem., 188, (2002), 189.[18] J. Garcia-Martinez; D. Cazorla-Amoros; A. Linares-Solano, Appl. Catal. B Envir., 47, (2004), 203.
On the Nature of Manganese in Mn-S-1 and Mn-ZSM-5 Zeolites

Chapter 4
98
[19] J. S. Choi; T. H. Kim; M. B. Saidutta; J. S. Sung; K. I. Kim; R. V. Jasra; S. D. Song; Y. W. Rhee, J. Ind. Eng. Chem., 10, (2004), 445.[20] Y. X. Wei; G. W. Wang; Z. M. Liu; P. Xie; Y. L. He; L. Xu, Catal. Lett., 91, (2003), 35.[21] P. Kovacheva; N. Davidova, React. Kinet. Catal. Lett., 53, (1994), 277.[22] Y. H. Ko; S. J. Kim; M. H. Kim; J. H. Park; J. B. Parise; Y. S. Uh, Micropor. Mesopor. Mat., 30, (1999), 213.[23] N. N. Tusar; N. Z. Logar; I. Arcon; F. Thibault-Starzyk; A. Ristic; N. Rajic; V. Kaucic, Chem. Mater., 15, (2003), 4745.[24] O. Stephan; A. Gloter; D. Imhoff; M. Kociak; C. Mory; K. Suenaga; M. Tence; C. Colliex, Surf. Rev. Lett., 7, (2000), 475.[25] H. van Koningsveld; H. van Bekkum; J. C. Jansen, Acta Crystallogr., B43, (1987), 127.[26] D. S.McClure, J. Phys. Chem., 36, (1962), 2757.[27] H. Thauern, Phosphate des ein-und zweiwertingen Indiumn und Einbau von Chrom(III) und Mangan(III) in Indium(III)-phospate. PhD, Rheinischen Friedrich-Wilhelms-Universitat Bonn, 2006.[28] A. T. Bell; A. W. Aylor; L. J. Lobree; J. A. Reimer, J. Catal., 170, (1997), 390.[29] C. Naudin; F. Bonhomme; J. L. Bruneel; L. Ducasse; J. Grondin; J. C. Lassegues; L. Servant, J. Raman Spectrosc., 31, (2000), 979.[30] M. G. O’Brien; A. M. Beale; C. R. A. Catlow; B. M. Weckhuysen, J. Am. Chem. Soc., 128, (2006), 11744.[31] B. M. Weckhuysen; R. R. Rao; J. A. Martens; R. A. Schoonheydt, Eur. J. Inorg. Chem., (1999), 565.