ON THE MODELING OF WCDMA SYSTEM …lib.tkk.fi/Diss/2004/isbn9512270870/isbn9512270870.pdf · ON THE...
45
Electromagnetics Laboratory Report Series Espoo, April 2004 REPORT 430 ON THE MODELING OF WCDMA SYSTEM PERFORMANCE WITH PROPAGATION DATA Kari Heiska Dissertation for the degree of Doctor of Science in Technology to be presented with due permission for public examination and debate in Auditorium S4, Department of Electrical and Communications Engineering, Helsinki University of Technology, Espoo, Finland, on the 23 nd April 2004, at 12 o’clock noon. Helsinki University of Technology Department of Electrical and Communications Engineering Electromagnetics Laboratory
-
Upload
hoangthien -
Category
Documents
-
view
226 -
download
0
Transcript of ON THE MODELING OF WCDMA SYSTEM …lib.tkk.fi/Diss/2004/isbn9512270870/isbn9512270870.pdf · ON THE...
Electromagnetics Laboratory Report Series
Espoo, April 2004 REPORT 430
ON THE MODELING OF WCDMA SYSTEM PERFORMANCE WITH PROPAGATION DATA Kari Heiska Dissertation for the degree of Doctor of Science in Technology to be presented with due permission for public examination and debate in Auditorium S4, Department of Electrical and Communications Engineering, Helsinki University of Technology, Espoo, Finland, on the 23nd April 2004, at 12 o’clock noon. Helsinki University of Technology Department of Electrical and Communications Engineering
Electromagnetics Laboratory
Distribution: Helsinki University of Technology Electromagnetics Laboratory P.O. Box 3000 FIN-02015 HUT Tel. +358 9 451 2264 Fax +358 9 451 2267 ISBN 951-22-7063-3 ISSN 1456-632X Picaset Oy Helsinki 2004

On the Modeling of WCDMA System Performance with Propagation Data
KARI HEISKA

2
ABSTRACT
he aim of this study was to develop calculation methods for estimating the most important system level performance characteristics of the WCDMA radio network (i.e. network
capacity and coverage) in the presence of interference from various sources. The calculation methods described in this work enable the fast design of radio systems with a reasonable degree of accuracy, where different system parameters, propagation conditions and networks as well as frequency scenarios can be easily tested. The work also includes the development and verification of a propagation model for a microcellular environment. Traditionally, system level performance figures have been retrieved using system simulations where the radio network has been modeled as accurately as possible. This has included base stations and mobile stations, propagation models, traffic models and mobility models. Various radio resource management (RRM) algorithms, such as power controls and handovers have also been modeled. However, these system simulations are very complex and time consuming and typically the models are difficult to modify. The idea behind this work is to use the main statistical parameters retrieved from accurate, case specific propagation models and to use these statistics as input for the developed analytical radio network models. When used as output from these analytical models we are able to obtain the performance measures of the network.
The specific application area for the developed methods is the evaluation of the effect of the interference from the adjacent frequency channels. Adjacent channel interference decreases the efficiency of the usage of the electromagnetic spectrum i.e. the spectral efficiency. The aim of a radio system design is to ensure that the reduction in the spectral efficiency is as low as possible. This interference may originate from the same or a different radio system and from the same or another operator’s network. The strength of this interference is dependent on the system parameters and the network layout.
The standard questions regarding adjacent system interference between different operators’ network are what guard band is needed between the radio carriers in order to maintain the quality of the network or what are the main mobile and network parameters, such as adjacent channel emission levels or adjacent channel selectivity, required in order to achieve satisfactory network performance. With the developed method proposed here it is possible to answer these questions with reasonable accuracy.
One important aspect of network performance is the radio wave propagation environment for which the radio systems are designed. This thesis presents methods evaluating radio wave propagation, especially for cases where the base station antenna is below the rooftops, i.e. in the case of microcellular network environments. The developed microcellular propagation model has been developed for network planning purposes and it has been verified using numerous field propagation measurements. The model can be used in cases where the mobile station is located either indoors or outdoors.
Keywords: Radio Wave Propagation, WCDMA, Capacity, Coverage, Adjacent Channel Interference
T
3
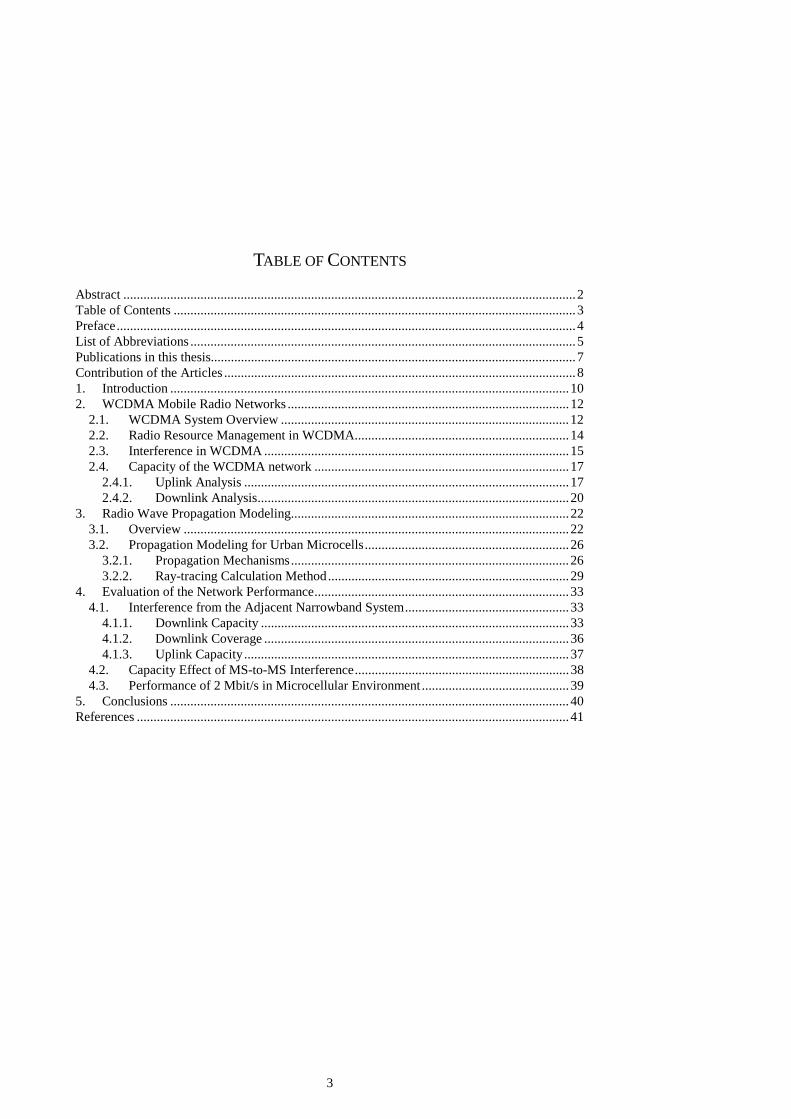
TABLE OF CONTENTS
Abstract .......................................................................................................................................2 Table of Contents ........................................................................................................................3 Preface.........................................................................................................................................4 List of Abbreviations ...................................................................................................................5 Publications in this thesis.............................................................................................................7 Contribution of the Articles .........................................................................................................8 1. Introduction .......................................................................................................................10 2. WCDMA Mobile Radio Networks ....................................................................................12
2.1. WCDMA System Overview ......................................................................................12 2.2. Radio Resource Management in WCDMA................................................................14 2.3. Interference in WCDMA ...........................................................................................15 2.4. Capacity of the WCDMA network ............................................................................17
2.4.1. Uplink Analysis .................................................................................................17 2.4.2. Downlink Analysis.............................................................................................20
3. Radio Wave Propagation Modeling...................................................................................22 3.1. Overview ...................................................................................................................22 3.2. Propagation Modeling for Urban Microcells.............................................................26
3.2.1. Propagation Mechanisms...................................................................................26 3.2.2. Ray-tracing Calculation Method........................................................................29
4. Evaluation of the Network Performance............................................................................33 4.1. Interference from the Adjacent Narrowband System.................................................33
4.1.1. Downlink Capacity ............................................................................................33 4.1.2. Downlink Coverage ...........................................................................................36 4.1.3. Uplink Capacity .................................................................................................37
4.2. Capacity Effect of MS-to-MS Interference................................................................38 4.3. Performance of 2 Mbit/s in Microcellular Environment ............................................39
5. Conclusions .......................................................................................................................40 References .................................................................................................................................41
4
PREFACE
he work presented in this thesis was carried out at Nokia Networks between 1994 and 2003. I carried out the first part of the work, the propagation model development, at Radio
Network Tools (RNT) where Petri Jolma worked as my supervisor. I would like to thank him for giving me free rein to develop methods for coverage prediction in microcells. As a result of this work I wrote a Licentiate’s Thesis in 1996. From 1998 to the present date I have been working for Nokia as a senior research engineer concentrating on the WCDMA radio system and conducting various research projects, such as link level and system level simulations and tool development for network planning. I would like to thank all of my colleagues for their support during my studies.
In particular, I would like to thank Kari Sipilä who has supported me since I started at Nokia, participating closely in my work on the development of the propagation model. He was one of the key people involved in developing the mathematical methods used to analyse the WCDMA system. By following the work done by him I was able to acquire a good working knowledge of radio system engineering and the WCDMA system in particular.
Next, I would like to thank my boss in the network system research group, Peter Muszynski, who gave me a very interesting research project in August 2000. He suggested that I should start to analyze possible performance degradation when deploying other systems adjacent to the WCDMA carrier. I was greatly influenced by his enthusiasm during the interference study and this helped me to finalize the project. I would like to thank all of the other people involved in the project: Pauli Aikio, Jussi Numminen and Harri Posti.
I would also like to give my warmest thanks to all the staff working on the same projects as myself at the group during this time: Harri Holma, Jaana Laiho and Achim Wacker. I would like to acknowledge the financial support of the Nokia foundation which allowed me to finish the thesis and Jean-Philippe Kermoal for commenting the manuscript. I would also like to thank my tutor, Professor Keijo Nikoskinen who has helped me with my work and encouraged me to finish the project. I am very grateful to my wife Riikka for supporting me in my work and I would also like to thank my children and my parents for their support. 28.3.2004, Helsinki Kari Heiska
T

5
LIST OF ABBREVIATIONS
2G 2nd generation mobile communication systems 3G 3rd generation mobile communication systems 3GPP 3rd Generation partnership project (produces WCDMA standard) AC Admission control ACI Adjacent channel interference ACIR Adjacent channel interference ratio ACLR Adjacent channel leakage ratio ACS Adjacent channel selection BS Base station cdma2000 IS-2000 CN Core network DECT Digital enhanced cordless telephone DL Downlink DP Diffraction polygon EDGE Enhanced data rates for GSM evolution FDD Frequency division duplex FER Frame error ratio GO Geometrical optics GPRS General packet radio system GSM Global system for mobile telecommunications GSM1800 GSM for 1800 MHz frequency band HO Handover IMT-2000 International mobile telephony, 3rd generation networks referred as IMT-2000
within ITU IP Internet protocol IS-2000 IS-95 evolution standard IS95 cdmaOne, one of the 2nd generation systems, mainly in Americas and in Korea ISI Intersymbol interference ITU International telecommunications union LC Load control LOS Line of sight LP LOS polygons MRC Maximum ratio combining MAI Multiple access interference MCL Minimum coupling loss
6
Mbps 106 bits per second Mcps 106 chips per second MMS Multimedia message service MS Mobile station MSS Mobile-satellite service NB Narrowband NLOS Non line of sight NMS Network management system OH Okumura-Hata PC Power control PCS Personal communications systems PHS Personal handy phone system PS Packet scheduling QoS Quality of service RAN Radio access network RF Radio frequency RNC Radio network controller RP Reflection polygon RRM Radio resource management SIR Signal-to-interference ratio SMS Short Message Service TCP Transport control protocol TDD Time division duplex Tx Transmitter UDP User datagram protocol UE User equipment (3GPP terminology for MS) UL Uplink UMTS Universal mobile telecommunications system UTRAN UMTS terrestrial RAN WCDMA Wideband code division multiple access WWW World wide web

7
PUBLICATIONS IN THIS THESIS
This doctoral thesis is a collection of the following scientific articles. [P1] Kari Heiska, Harri Posti, Peter Muszynski, Pauli Aikio, Jussi Numminen and Miikka
Hämäläinen, “Capacity Reduction of WCDMA Downlink in the Presence of Interference From Adjacent Narrow-Band System,” IEEE Transactions on Vehicular Technology, Vol. 51, No. 1, January 2002, pp. 37-51.
[P2] Kari Heiska, Harri Posti, Peter Muszynski, Terhi Rautiainen and Jussi Numminen, “WCDMA Downlink Coverage Reduction Due to Adjacent Channel Interference,” Wireless Personal Communications, Vol. 23, No.2, November 2002, pp. 217-242.
[P3] Kari Heiska, “Effect of Adjacent IS-95 Network to WCDMA Uplink Capacity,” IEEE Transactions on Vehicular Technology, Vol. 52, No. 2, March 2003, pp. 326-332.
[P4] Kari Heiska, Kari Rikkinen, Peter Muszynski and Uwe Schwarz, “Modeling of UE-UE Interference at 2.5 GHz WCDMA,” Proceedings of Personal Indoor and Mobile Radio Communications, PIMRC'03, Beijing, China, September 2003, pp. 69-73.
[P5] Kari Heiska and Harri Holma, “Performance of 2 Mbit/s Packet Data With WCDMA in Small Microcellular Environment,” Proceedings. of the Wireless Personal Multimedia Communications, WPMC’98, Yokosuka, Japan, November 1998, pp. 64-69.
[P6] Kari Heiska and Arto Kangas, “Microcell Propagation Model for Network Planning,” Proceedings of Personal Indoor and Mobile Radio Communications, PIMRC'96, Taipei, Taiwan, 1996, pp. 148-152.
[P7] Jussi Rajala, Kari Sipilä and Kari Heiska, “Predicting In-Building Coverage for Microcells and Small Macrocells,” Proceedings of the IEEE 49th Vehicular Technology Conference VTC'99, Houston Texas USA, 1999, May 16-19, 180 –184.
[P8] Kari Heiska, “Interference between GSM/EDGE and other cellular radio technologies, ” GSM, GPRS and EDGE Performance - Evolution Towards 3G/UMTS, Appendix D, John Wiley & Sons, 2002, pp. 557-568.
[P9] Kari Heiska, “Narrowband and WCDMA System Operation in Adjacent Frequency Bands,” Radio Network Planning and Optimization for UMTS, Section 5.4, John Wiley & Sons, 2002, pp. 232-258.
8
CONTRIBUTION OF THE ARTICLES
aper P1 introduces the analytical model for the evaluation of capacity reduction in the WCDMA (Wideband Code Division Multiple Access) system in downlink (DL) in cases
where there are narrowband, interfering base stations at the adjacent frequency bands. The model has been used in cases where there are other systems spectrally close to the WCDMA system, such as in the PCS band in the United States or when deploying WCDMA in the existing GSM band in Europe. The results show that capacity reduction can be decreased by appropriate mobile station design or by using a suitable radio network scenario. The developed model is relatively simple to use for network performance evaluation purposes.
Paper P2 uses this analytical model in order to compute the coverage reduction due to adjacent channel interference. The effect of various interference mechanisms is studied in Papers P1 and P2.
In Paper P3 the interference coupling model between WCDMA and IS-95 systems in the uplink (UL) direction is developed. The model takes into account the power control coupling between two CDMA systems and the adjacent channel interference due to mobile station emission masks and base station receive filtering. The model can be used to compute the needed guard band between IS95 and WCDMA systems if they are operated at adjacent frequency bands. Paper P4 describes a method for estimating capacity reduction in the WCDMA system in the DL direction due to mobile-to-mobile interference. This interference scenario takes place in the case of possible 2.5 GHz band usage for WCDMA in the future. The paper describes a simple analytical method which takes into account non-uniform user distribution over the network area.
The first author developed the mathematical models for papers P1-P4, carried out the simulations, performed the analysis and reported the results. In Paper 2 the second author also co-wrote the report and the fourth author provides the propagation maps for the study. Other authors advised on the work and provided some corrections for papers P1-P4.
The effect of radio channel time dispersion on the link level performance of WCDMA is studied in Paper P5. The ray-tracing model was developed in order to collect statistical information from the radio channel time dispersion in a typical microcellular network environment. The link level baseband model, with various reference channel profiles, was used to study the performance of the 2 Mbps downlink connection using multicode transmission. The probability of having channels in microcellular environment with significant intersymbol was then computed based on link level simulation and the ray-tracing simulations. The first author of the paper carried out the link level simulations and implemented the required ray-tracing propagation model. The analysis and the writing of the report was carried out by both authors.
Paper P6 reports the development of the microcellular propagation model for network planning purposes. The model is based on the ray-tracing technique but the method includes novel techniques for increasing the computational efficiency of the algorithm. The presented model was verified by measurements and the agreement was shown to be relatively good. The first author developed the model and the calculation algorithms, was involved in carrying out the propagation measurements and reported the results. The second author implemented the propagation model algorithm in C programming language.
The propagation model reported in paper P6 was extended in paper P7 to take into account radio wave penetration into buildings. Thus, it is assumed here that the transmitter (base
P
9
station) is located outdoors and the receiver (mobile) is located indoors. This penetration model uses the outdoor propagation data as input when estimating the indoor field strength. The model was verified by indoor measurements carried out in various different building types. The third author developed the first draft propagation model, which was improved by the first two authors. The third author was also involved when the measurements were carried out and prepared the final paper for the conference and presented it.
Papers P8 and P9 are chapters from books covering GSM/EDGE and WCDMA system performance and network planning issues published by Wiley. These papers provide a general overview of adjacent channel interference when mixing different technologies using different operators. Paper P8 covers interference from WCDMA to GSM/EDGE and from GSM/EDGE to IS-95 (CDMA2000) for cases when these technologies are utilized within the same frequency band. The paper shows results from Monte-Carlo simulations in which measured mobile station transmission power data sets from a real GSM1800 network were used in order to estimate the interference levels at the IS-95 base station.
Paper P9 introduces the interference mechanisms associated with the utilization of the narrowband systems adjacent to WCDMA. A comparison of the different interference mechanisms by means of a simple worst case analysis is presented with additional simulation results computed with a static WCDMA network simulator. The capacity reduction of WCDMA due to presence of narrowband interference sources was simulated for both macrocellular and microcellular network environments. Paper P9 presents results from the analytical capacity reduction estimation for both uplink and downlink directions. It also proposes some general network planning principles from the WCDMA performance point of view in cases of refarming1 2G networks with the WCDMA system. In both P8 and P9 the work was carried out and reported by the author.
1 Refarming: re-using of the electromagnetic spectrum. For example if part of the current GSM dedicated spectrum
is allocated for other systems e.g. WCDMA.
10
1. INTRODUCTION
he mobile telecommunication industry has undergone great changes and seen significant developments over the past few years. The whole industry has changed from making
marginal military and vehicle oriented products to delivering mobiles and network components to mass markets. Analog systems have evolved into digital ones, backpack sized terminals have become compact, fashionable communication devices which are now part of our everyday lives. The information carried through mobile communication systems is no longer just speech, but also short messages (SMS), multimedia messages (MMS), data, and e-mail etc. In the future, it will also be possible to communicate through video, retrieve streaming music or browse the World Wide Web via a mobile Internet. Also, the borders between computers, cameras, videos and mobile phones is becoming fuzzy.
Are there any limits to the development of wireless personal communications? The answer to the question has to be yes due to the following limitations: limited electromagnetic spectrum, limitations in the technology required for storing electrical energy within stringent size constraints, and what is perhaps the most important factor, the amount of money and time spent by people on mobile communications. The size of mobile devices is a critical factor as well; they have to be light and small enough to be carried, but also large enough to be useful in everyday life.
Of the above frequency limitation is perhaps the most obvious limiting factor. Mobile radio communication is only possible within a relatively narrow frequency band, in the radio wave part of the electromagnetic spectrum, approximately between 0.1 to 5 GHz. For the lower frequencies there is no free spectrum available and electronic devices as well as antennas become quite large in size. For the upper frequencies radio wave attenuation is too great to allow for the building of cost-effective networks. Buildings, vegetation and even rain attenuate radio wave propagation to such a large extent that the coverage area of the transmitter becomes too small to be economically feasible. The usage of frequencies for telecommunication above 5 GHz is mainly for indoor communication purposes and for fixed line-of-sight radio links.
The remaining 4 to 5 GHz of the electromagnetic spectrum in which cellular mobile radio can be utilized is, however, also needed for other purposes: radio, television, radio navigation, weather satellites, military radios, radio links, private radio for officials, remote controlling, remote sensing, satellite navigation, amateur radio, satellite mobile applications, wireless cameras and military radars. Thus, there are lots of other applications which use the same physical resource, i.e. the electromagnetic spectrum in the region in which radio wave propagation attenuation is sufficiently low enough. Because the spectrum is a finite natural resource, one of the most important targets of radio system design is to obtain maximum spectrum efficiency. This means that the overall information flow through a communications system (or several systems) for a given amount of RF spectrum has to be maximized within a given geographical area. Of course it is possible although not economical to increase the density of the radio cells. This method, however, reaches its limits quite quickly since the interference between adjacent cells becomes more difficult to control and hence this starts degrading the system performance. The propagation environment has a large influence on interference and this is what this work is mostly concerned with: studying the usage of environment specific propagation models within the area of mobile radio system design.
This work consists of two separate study items: radio wave propagation modeling and WCDMA radio network performance studies. Section 2 introduces the basic characteristics of
T
11
WCDMA radio technology and the most important variables describing its performance. Section 3 concentrates on radio wave propagation in the urban microcellular environment. This section describes the basic characteristics of urban radio propagation and introduces the subsequently developed microcellular propagation model. The radio wave propagation modeling is reported earlier in [1] and in papers [P6] and [P7]. The main emphasis in this work is, however, on the analysis of WCDMA performance in the presence of adjacent channel interference by using the propagation model data. The summary of that work is shown in Section 4 and this part of the work is reported in papers [P1]-[P5], [P8] and in [P9]. Conclusions of the thesis will be drawn in Section 5.
12
2. WCDMA MOBILE RADIO NETWORKS
2.1. WCDMA System Overview enerally speaking third generation mobile communication systems (3G) refer to those cellular mobile technologies which have been introduced after second generation systems
such as GSM (Global system for mobile telecommunications), and which have several additional services related to high-speed data transport. 3G systems are expected to provide mobile multimedia services within similar quality, coverage and user cost constraints to those that exist today for implemented speech services, e.g. the GSM system. The acronym for 3G systems in Europe is UMTS (Universal Mobile Telecommunications System), which has been standardized by the 3GPP (3rd Generation partnership project) organization. The respective international (in ITU, International Telecommunication Union) abbreviation for 3G is IMT-2000. UMTS utilizes WCDMA (Wideband Code Division Multiple Access) as radio access technology. This section describes the characteristics of the WCDMA system in general. For a more detailed description, see [2] or [3], for the UMTS system and [4] for mobile communication systems in general. The further evolution of the GSM system will enable some of the 3G services to be offered by an evolved GSM based radio system as well. The usage of GSM, GPRS (General packet radio system) and EDGE (Enhanced data rates for GSM evolution) for 3G services is studied in [5]. Even though UMTS was meant to be a universal system, the different spectrum allocations for different parts of the world complicates its straightforward usage.
The 3G network will be able to transfer data for various kinds of services with considerably higher bit-rates than second generation (2G) systems. UMTS will be able to support both circuit switched and packet switched transmission modes. In circuit switched traffic the connection between both ends is always open and data flows from one end to another at a constant rate and in real time, i.e. without any delays. Speech or video telephony is an example of these real time traffic applications. In a packet switched connection, data is split into small portions (packets) and the data rate of each packet may not be constant. This means that there can be delays between the packets and this transport mode can therefore be referred to as non-real time. Examples of packet data applications are web browsing and downloading e-mail. Typically, the transport layer protocol used for packet data services is either TCP (Transport control protocol) or UDP (User datagram protocol). Also, conversational or streaming services, such as speech, can be carried over non-real time connections, however this requires very tight delay requirements, i.e. the delay between packets should not exceed a certain maximum value. The success of internet protocol based technologies during the past few years will also be extended to mobile data communications by UMTS. With UMTS high-speed packet data services it will be possible to provide real time services such as voice and video that are based on packet data transport through radio access as well. Delay, bit-rate and data error rate requirements differ, however, among these services and thus, the radio bearer, which comprises the physical properties of the used transmission mode, depends on the requested service. At the beginning of each (data) call the application will ask the network to establish a radio bearer with appropriate Quality of Service (QoS) requirements for the requested service and the network will subsequently check the available radio resources and will either reject or accept the request. The network is also able to change the bearer automatically, for example in handover situations where the mobile moves from one cell to another.
UMTS specifications include two different duplexing modes: FDD (Frequency division duplex) and TDD (Time division duplex). At the moment, deployment of the FDD mode is by
G
13
far the more widespread as it is more suitable for fulfilling outdoor and large area coverage requirements. The usage of the UMTS TDD mode has been considered for indoor usage only. Only the UMTS FDD mode will be considered in this thesis.
In WCDMA the information bits are spread over a wide bandwidth W by applying channel coding and by subsequently multiplying them with a spreading code. The chip2 rate of the code is 3.84 Mchip/s and the carrier bandwidth is nominally 5 MHz. Each symbol in the WCDMA air interface contains a variable number of constant duration chips. The spreading factor, which is the ratio of the chip rate and the symbol rate across the air interface varies, hence different services with different bit rates can be obtained by changing the spreading factor. The processing gain is defined as 10⋅log10(W/R), with R the user bit-rate. The processing gain includes both bandwidth enlarging effects, channel coding and spreading. For a speech user with a bit-rate of 12.2 kbps the processing gain is thus 25 dB, which means that in WCDMA the receiver base-band processing the received level of the desired signal will be increased by 25 dB relative to the thermal noise and interference. On the other hand, in high bit-rate packet access the data bit rate and therefore the processing gain might change during the user session due to different service requirements, which means that the receiver’s ability to extract the signal from interference changes as well. The total bit-rate that the system can support is therefore dependent on the current interference level. The data rate can be changed on a frame-to-frame basis. The duration of a WCDMA radio frame is 10 ms.
The 3G mobile telecommunication system includes user equipment (UE), the radio access network (RAN), core network (CN) and the network management system (NMS). UE is 3GPP terminology and refers to mobile station (MS). The RAN is responsible for setting up the radio connection and maintaining the connection subject to the chosen QoS requirements. This is a quite complicated task since the mobile terminal has to be able to move freely around the geographical network area and the network has to be able to support a large number of different users with varying service requirements. The CN takes care of switching the connection to other telecommunication networks, public telephone networks or to and from the internet. When modeling the capacity and the coverage of the radio system, the CN is typically assumed not to be limiting the radio performance. In other words, the transmission, switching and controlling systems are assumed to have infinite capacity.
The RAN in UMTS (i.e. UMTS Terrestrial RAN, UTRAN) consists of base stations (node B) and radio network controllers (RNC). Node B is 3GPP terminology and refers to base station (BS). The RNC is responsible for controlling and allocating the radio resources for each user, managing handovers and acting as a service access point from the core network point of view. Under each RNC there are several BS through which the signal is transported to the user equipment via the air interface. Thus, a BS performs the processing of the bit stream coming from the RNC for the air interface. This includes the channel coding, interleaving, rate adaptation, spreading modulation, and radio frequency (RF) processing. The base station also includes some radio resource management (RRM) functionalities.
The performance of the radio system is governed by the system parameters (minimum requirements usually defined in system specifications), radio network planning as well as the RRM algorithms and parameterization. The RRM functionalities are responsible for allocating radio resources (such as RF power, time, codes and radio carrier frequencies) for each user so that the QoS targets for each user are met. In the following section a brief introduction to the RRM in the WCDMA system will be given.
2 Chip: the smallest data unit in CDMA transmission. The carrier bandwidth equals to inverse of chip period.
14
2.2. Radio Resource Management in WCDMA Power Control
The WCDMA radio link between the MS and the RAN is designed so as to maintain a constant quality which can be defined for example by the frame error rate (FER). Constant quality is justified by the fact that if the link quality were to be too high (the FER is below its target value) the link specific power allocated for one user would be higher than necessary. This causes additional interference to other users of the network, which in turn decreases the overall network capacity. The constant quality in the uplink and in the downlink is ensured by an outer power control (PC) loop.
In the uplink direction (from the MS to the BS) the RNC asks the BS to decrease the SIR (Signal-to-Interference Ratio) target in case the measured quality (FER) is above the FER target and increase the SIR target if the measured quality (FER) is below the FER target. In the closed PC loop the BS asks the MS to change its transmitting power based on the SIR measurements. The measured SIR is compared periodically to the SIR-target sent by the RNC.
In the downlink direction (BS to MS), the MS measures the SIR, compares it with the target SIR set by the downlink outer loop PC, and asks the BS to increase or decrease the power dedicated to that particular mobile accordingly. The MS and BS change their transmitting power for every transmitted slot so that the power control frequency is 1.5 kHz for both directions. With slow moving terminals the fast power control loop is able to follow the fast fading of the radio signal, however, this increases the average transmitted power of the MS as indicated in [6]. The fast power control also provides automatic link adaptation for fast changes in the radio channel caused by multipath fading and variations of other user interference. This fast adaptation stabilizes the received signal level and decreases the probability of frame errors, and thus increases the system capacity as well. On the other hand, fast power adaptation in response to changes in the own (MS to BS) link causes power peaks in transmission which disturbs adjacent cells in uplink direction.
Handovers
In order to allow high mobility for the user the system enables several types of handovers (HO). The MS can make the HO from one cell/sector to another (soft/softer HO), from one frequency to another (inter-frequency HO) and from one system to another (inter-system HO). In addition to this, the mobile is able to make intra-frequency HO (hard HO). This is needed for those cases in which soft HO is not possible (e.g. due to a lack of radio resources) or is disabled by the operator for some other reason (e.g. cell maintenance). During soft handover, the mobile is connected to two base stations simultaneously. This is possible in a CDMA system since adjacent cells use the same frequency.
To initiate soft handover the mobile selects the preferred cells (active set) based on its common pilot power measurements or more specifically the wideband SIR measurements from the pilot channel and the BS either accepts or rejects the suggested cell selection. The mobile can be connected to one or more base stations (soft handover) or one or more base station sectors (softer handover) at the same time. In the former case the uplink FER-level for the outer loop power control in RNC is computed with selection combining of signals coming from different base stations. In the latter case the uplink combining (maximum ratio combining) is done at the base station. The soft(er) handover increases the cell capacity in uplink compared to hard HO because it decreases the interference coming from adjacent cells. The most likely interfering mobiles are typically at the cell border (i.e. those using the highest Tx (transmit) powers) and during soft(er) HO they are power controlled by two (or more) adjacent base stations. The soft(er) HO provides also a seamless handover across the cell borders. On the
15
other hand, soft(er) handover consumes base station processing and RF transmission power resources and also increases the need for signaling between the base station and RNC.
In addition to soft handover, the system is able to support hard handovers between different carriers and between different systems (WCDMA↔GSM handovers, for example). For a UMTS operation the operator typically has a licensed spectrum for 3-4 5 MHz WCDMA carriers available, which supports the flexible utilization of different frequencies in different cell layers. For efficient usage of the total bandwidth the network operator has to utilize hierarchical cell structures, where different cellular layers geographically overlap. In practice, this means that the same area has been covered with macrocellular, microcellular and picocellular networks. The RAN controls the loading, throughput and coverage of each layer and selects the most suitable layer to which a particular mobile will be connected. Other Radio Resource Control Algorithms
In the WCDMA system each user induces interference to other users. This subsequently reduces the capacity and the coverage of the network compared to an unloaded network. In order to achieve the predefined targets for the performance (i.e. coverage, capacity, QoS) and to keep the MS and BS transmit powers stable at all times, the interference levels throughout the system have to be managed in a controlled way. Hence, in addition to the above mentioned handover and power control, there are other RRM functionalities in the system managing the multiple access interference (MAI): the admission control (AC), the load control (LC) and the packet scheduling (PS) functionalities, which are located in the RNC and/or in the BS.
The AC either accepts or rejects the establishment of a new radio bearer. This is subject to the constraint of keeping the coverage and the capacity of the RAN at a planned target. This may happen when a new bearer is requested or when an existing bearer is modified (e.g. a change in the bit-rate). The AC estimates the total interference levels if a user requesting the service is to be allowed to enter the system. If the total interference levels are above the predefined target values, the request is denied.
The PS controls the bit-rates and the load of the non-real-time traffic. The packet scheduler estimates the acceptable bit-rates and loading for an additionally requested packet data service and also controls the total load by changing bit-rates or dropping bearers. The PS schedules also transmit periods for the packet data usage.
The LC only takes place when, for some reason, the admission control or the packet scheduler can not control the load and the system has been driven into an overload situation. In this case the LC asks the users to decrease the target SIR or it reduces the data throughput or, in extreme cases, drops the calls.
2.3. Interference in WCDMA The air interface capacity of a CDMA cell is not pre-determined from the available spectrum
amount and thus it cannot be planned very accurately. That is, the capacity is dependent on the performance of the receivers in a time varying environment and also on the interference within its own network and the spectrally adjacent network. The capacity might also be limited by the maximum available number of spreading codes and hardware resources. One of the most challenging parts of radio network planning is the estimation of the required traffic since the radio network planner has to know, at least approximately, what kind of services are going to be used, the likely user locations and hot-spot areas. It is also crucial to know the degree of asymmetry in multimedia services. In web-browsing, for example, the downlink traffic is larger than the uplink traffic and this has to be taken into account during network planning as well.
In most cases the WCDMA network is interference limited and thus the radio network

16
planning can be considered as being the control of the interference throughout the system. When the number of users (or user bit-rates) increases the interference increases, meanwhile the required MS and BS transmission powers have to increase, in order to achieve a required performance. The change of the cell range due to change of the load of the cell is usually referred as “cell breathing”. When the load of the cell and therefore the interference increases, the coverage threshold increases as well, shrinking the coverage area. In order to achieve the required coverage area for a given service level, the coverage areas have to be planned assuming maximum loading of the system in order to avoid coverage holes due to the cell breathing effect. Thus, in the coverage planning phase, the possible load (number of users or used throughput) has to be taken into account.
For both uplink and downlink the interference present at the receivers also varies in time. Some interference sources can be nearly invariant in time whereas other sources may be very “peaky”. This includes strong short-term variations of the received signal. These large fluctuations happen especially with higher bit-rates and with packet transmissions where the transmitter sends short packets by using relatively high power. For instance the data transported via TCP/IP throughout the internet consists of packets and tends to be very bursty. Hence, this internet related data traffic also causes interference peaks in the radio network. The interference sources can be grouped as follows:
1) Inter symbol interference (ISI). This interference is due to overlapping symbols in the same bit-stream caused by multipath radio propagation.
2) Own cell interference caused by other users connected to the same cell. 3) Other cell interference caused by users connected to other cells in the same system. 4) Power leakage from the adjacent carrier in the same system. This includes intra
operator interference and inter operator interference. Intra operator interference is usually rather small since the interference sources are controllable.
5) Interference from other systems (such as GSM, WCDMA TDD, CDMA2000, etc) 6) Interference from other, non-controllable sources such as traffic, illegal transmissions,
radar systems, electronic devices, etc. All these interference types decrease the system performance (coverage and capacity) and
have to be minimized if possible in order to increase the spectral efficiency of the network. ISI and own cell interference can be decreased with improved receiver algorithms. Other cell
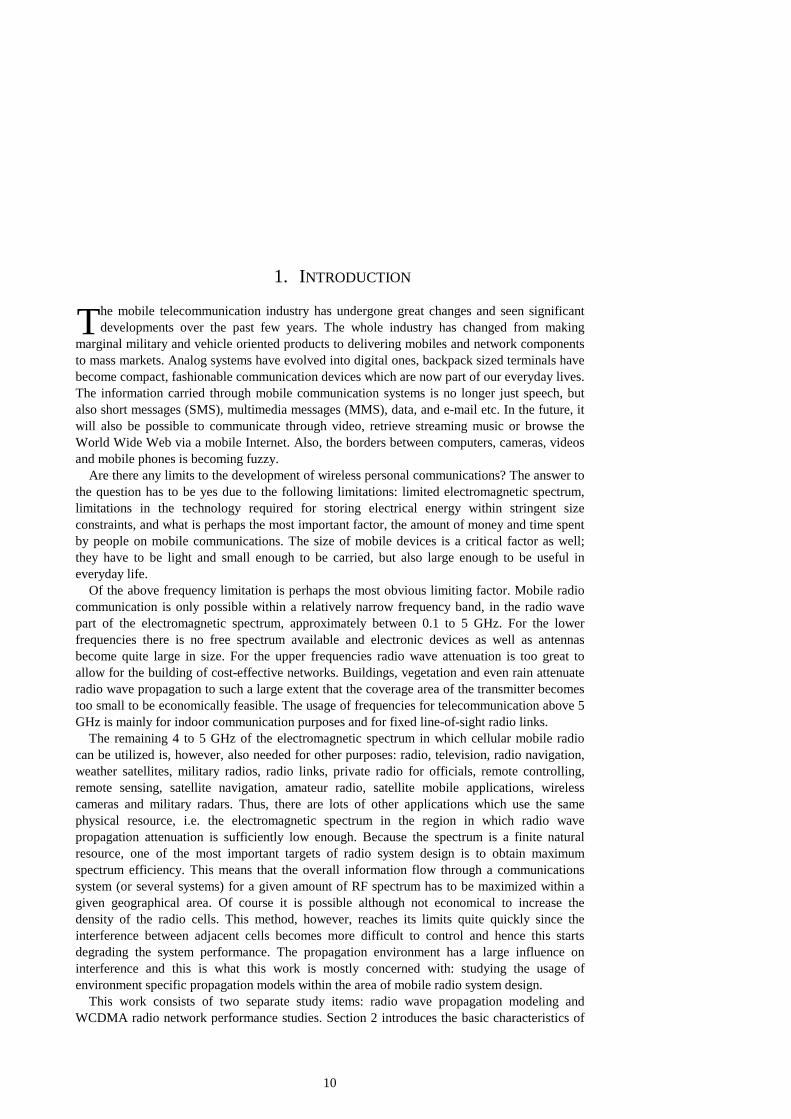
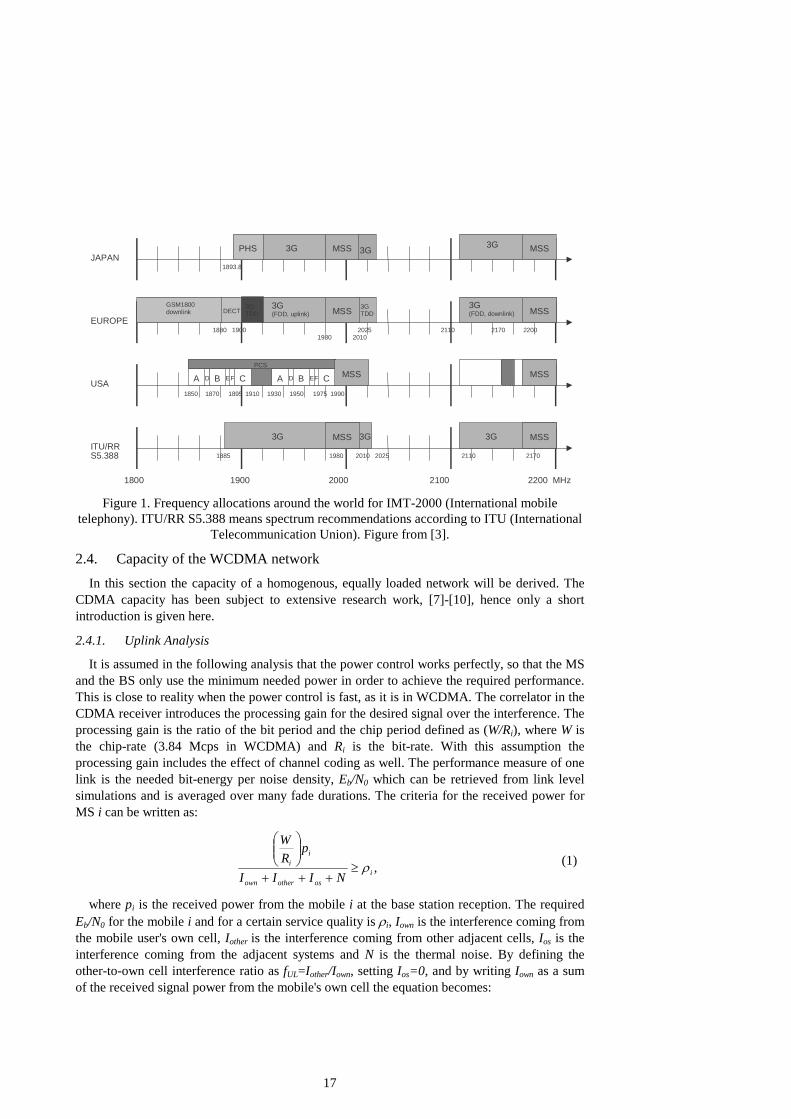
interference can be minimized, for example, by proper site planning, antenna selections, handover parameter optimization and with frequency planning. Figure 1 shows the frequency allocations for 3G mobile communications systems. The UMTS TDD allocation is adjacent to the UMTS FDD uplink allocation which causes interference phenomena between these two modes. In North America there are no specific frequency allocations for IMT-2000 services. This means that existing PCS frequencies (frequency blocks A-F) have to be utilized for 3G purposes (re-farming of 2G systems). The potential interference between 2G and 3G systems causes the performance reduction of both systems under certain circumstances. The capacity effect of intersystem interference has been studied in Papers [P1]-[P4] in specific circumstances. A more general description of the intersystem interference and various interference sources can be found from Papers [P8] and [P9].
17
1800 1900 2000 2100 2200 MHz
MSS MSS
A B C A B C D E F D F E PCS
MSS 1850 1870 1895 1910 1930 1950 1975 1990
MSS
MSS MSS DECT GSM1800 downlink
1880 1900 1980 2010 2025 2110 2170 2200
1885 1980 2010 2025 2110 2170 2200
PHS 1893.8 JAPAN
EUROPE
USA
ITU/RR S5.388
MSS MSS 3G
3G 3G
3G (FDD, downlink)
3G
3G (FDD, uplink)
3G
3G
3G TDD 3G
TDD
Figure 1. Frequency allocations around the world for IMT-2000 (International mobile
telephony). ITU/RR S5.388 means spectrum recommendations according to ITU (International Telecommunication Union). Figure from [3].
2.4. Capacity of the WCDMA network In this section the capacity of a homogenous, equally loaded network will be derived. The
CDMA capacity has been subject to extensive research work, [7]-[10], hence only a short introduction is given here.
2.4.1. Uplink Analysis
It is assumed in the following analysis that the power control works perfectly, so that the MS and the BS only use the minimum needed power in order to achieve the required performance. This is close to reality when the power control is fast, as it is in WCDMA. The correlator in the CDMA receiver introduces the processing gain for the desired signal over the interference. The processing gain is the ratio of the bit period and the chip period defined as (W/Ri), where W is the chip-rate (3.84 Mcps in WCDMA) and Ri is the bit-rate. With this assumption the processing gain includes the effect of channel coding as well. The performance measure of one link is the needed bit-energy per noise density, Eb/N0 which can be retrieved from link level simulations and is averaged over many fade durations. The criteria for the received power for MS i can be written as:
,iosotherown
ii
NIII
pRW
ρ≥+++
(1)
where pi is the received power from the mobile i at the base station reception. The required Eb/N0 for the mobile i and for a certain service quality is ρi, Iown is the interference coming from the mobile user's own cell, Iother is the interference coming from other adjacent cells, Ios is the interference coming from the adjacent systems and N is the thermal noise. By defining the other-to-own cell interference ratio as fUL=Iother/Iown, setting Ios=0, and by writing Iown as a sum of the received signal power from the mobile's own cell the equation becomes:
18
,)1(
1
i
UL
k
ijj
jj
ii
Nfp
pRW
ρν
≥++⋅
∑≠=
(2)
where νj is the average voice activity factor indicating the portion of time when the user is actively transmitting and k is the number of users in the cell. When every user has the same service (constant R,ν and ρ) the received power can be written as:
.)1()1( ULfk
RW
Np+⋅−⋅⋅−
=ρν
ρ (3)
The own cell interference is the total power received from the own cell users. This equation gives the minimum allowed received power at the BS from MS as a function of the number of users in a cell in order to obtain a satisfactory link performance for a certain service.
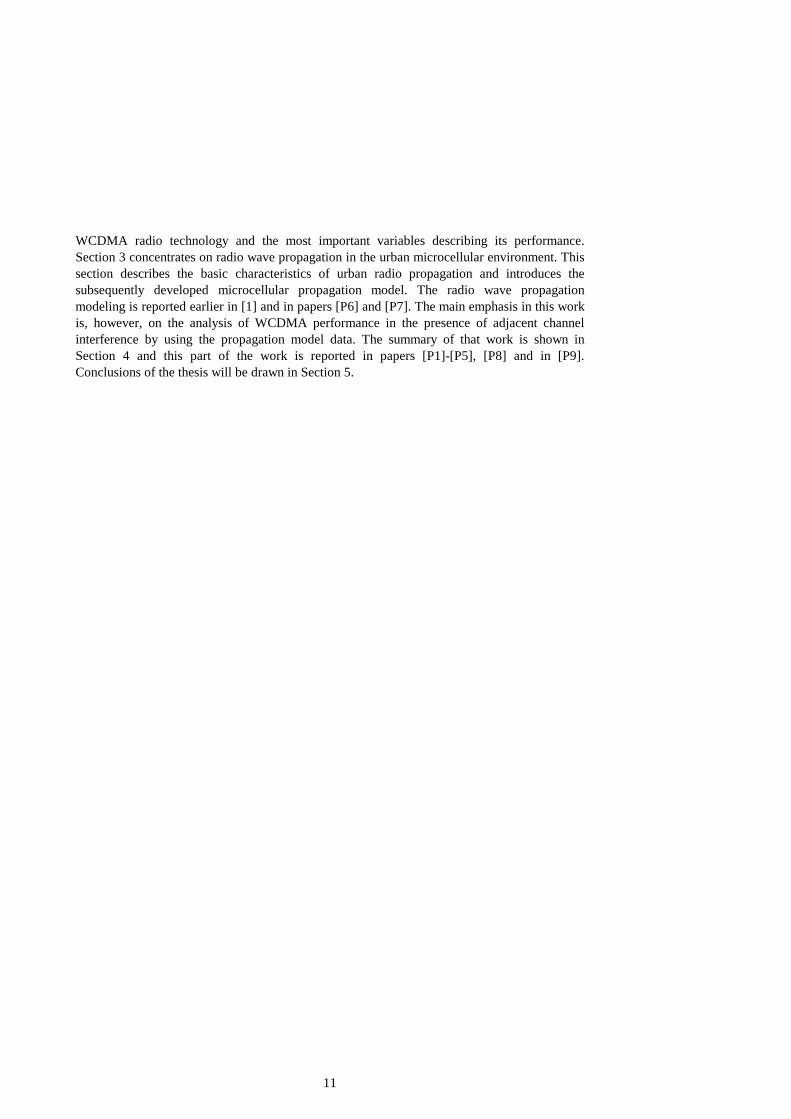
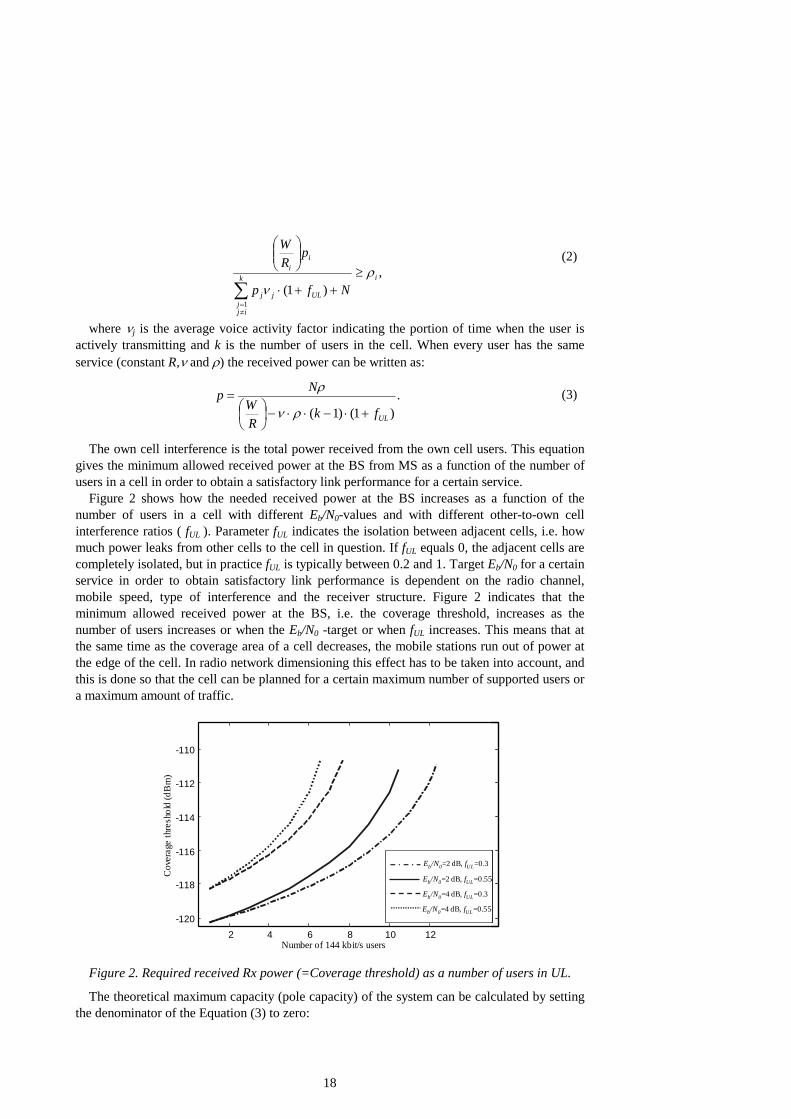
Figure 2 shows how the needed received power at the BS increases as a function of the number of users in a cell with different Eb/N0-values and with different other-to-own cell interference ratios ( fUL ). Parameter fUL indicates the isolation between adjacent cells, i.e. how much power leaks from other cells to the cell in question. If fUL equals 0, the adjacent cells are completely isolated, but in practice fUL is typically between 0.2 and 1. Target Eb/N0 for a certain service in order to obtain satisfactory link performance is dependent on the radio channel, mobile speed, type of interference and the receiver structure. Figure 2 indicates that the minimum allowed received power at the BS, i.e. the coverage threshold, increases as the number of users increases or when the Eb/N0 -target or when fUL increases. This means that at the same time as the coverage area of a cell decreases, the mobile stations run out of power at the edge of the cell. In radio network dimensioning this effect has to be taken into account, and this is done so that the cell can be planned for a certain maximum number of supported users or a maximum amount of traffic.
2 4 6 8 10 12-120
-118
-116
-114
-112
-110
Number of 144 kbit/s users
Cov
erag
e th
resh
old
(dB
m)
Eb/N0=2 dB, fUL=0.3
Eb/N0=2 dB, fUL=0.55
Eb/N0=4 dB, fUL=0.3
Eb/N0=4 dB, fUL=0.55
2 4 6 8 10 12-120
-118
-116
-114
-112
-110
Number of 144 kbit/s users
Cov
erag
e th
resh
old
(dB
m)
Eb/N0=2 dB, fUL=0.3
Eb/N0=2 dB, fUL=0.55
Eb/N0=4 dB, fUL=0.3
Eb/N0=4 dB, fUL=0.55
Figure 2. Required received Rx power (=Coverage threshold) as a number of users in UL.
The theoretical maximum capacity (pole capacity) of the system can be calculated by setting the denominator of the Equation (3) to zero:
19
.1)1(
++⋅⋅
=ULfv
RW
kρ
(4)
The total interference in UL is the sum of the own and other cell interferences + thermal noise N. If we use the previous formula for the own cell interference and fUL as the other-to-own cell interference ratio in uplink we get:
=+= otherown III (5)
,1)1)(1(1
)1)(1(
UL
UL
UL
ULN
WfkR
WfkRN
ηη
ρ
ρ
−=
+−−
+−
=
(6)
where ηUL is defined as the loading of the system. Therefore the total system interference at the BS is:
ULUL
UL NNN
NIηη
η−
=+−
=+11
. (7)
Equation (7) hence gives the total UL interference level of the system as a function of the cell loading. The additional loading margin for the uplink link budgets can then be defined as:
).1(log10 10 ULIL η−= (8)
The typical maximum loading value of the network is around 0.6, which gives about a 4dB reduction in the link budget. In order to compute what the effect is on the cell range the appropriate propagation model has to be utilized. The capacity of the system in uplink can be defined as the maximum number of users for which the loading value is lower than a certain maximum value. The UL loading of the system, which is equivalently defined as:
,)1)(1(W
fkR ULUL
+−=
ρη (9)
is thus dependent on the number of users, user bit-rate, target Eb/N0 value (ρ), other-to-own cell interference ratio (fUL) and the used chip rate. From these variables ρ and fUL are dependent on the propagation environment, i.e. mobile speed, radio channel conditions (multipath), radio network topology etc. The target Eb/N0 is dependent on the particular service and the mobile speed but it is also dependent on the characteristics of the radio channel and the power control. When the radio channel is time dispersive or, equivalently, frequency selective, so that there are several resolvable (delay more than one chip) multipath components (taps) present, the RAKE receiver is able to allocate several demodulating branches and to combine the energies from them coherently, which provides multipath diversity. The combined signal fades less and hence the signal estimation and decoding are more accurate. The combining method used is the maximum ratio combining (MRC), which maximizes the signal to noise ratio of the combined signal. In the case of only a single resolvable channel tap (i.e. flat fading channel) the channel fading is Rayleigh and multipath diversity is not present [11]. In this case the signal estimation is less accurate and the needed received Eb/N0 is larger in order to obtain a given frame error rate (FER) performance. However, due to fast power control in the WCDMA the Eb/N0 is relatively low even in flat fading channels. The needed Eb/N0 is also dependent on whether the mobile is in SHO or not. In the case of SHO the Eb/N0 is lower due to additional diversity in reception

20
[3], [6]. The other-to-own cell interference ratio (fUL) is also strongly dependent on the propagation environment. When the cells are well isolated fUL is small and the capacity is higher. When the adjacent cells are less isolated and/or the border of the adjacent cells is not well defined, as in the case of macrocells, fUL tends to be large and the capacity is hence relatively lower. This is the case when the traffic is uniformly distributed over the network, which is the basic assumption in this approach, see for example [12], [13]. The adjacent macrocells can be isolated from each other by using an appropriate antenna configuration, as shown in [14]. When the adjacent cell is less loaded, fUL is lower, hence giving an additional capacity gain to the own cell.
2.4.2. Downlink Analysis
The total transmitted power P needed in the base station in order to maintain k simultaneous connections each having a bit rate of Ri and Eb/N0 requirement of ρi will be computed here. The total power P is the sum of the link specific powers of the dedicated channels and the power of the common channels, such as the pilot channel. The power criteria for a single user i with an allocated downlink power of pi can be written as in [15]:
i
othi
ii
i
i NILPL
pRW ρ
α≥
++− )1(
1 , (10)
where W is the chip rate, Li is the path loss from BS to MS i, Ioth is the other cell interference, N is the thermal noise and αi is the average orthogonality factor. The orthogonality factor describes the ability of the receiver to remove the own cell interference in the downlink by using orthogonal codes. When the channel time delay variation is much less than the chip period, Tc there is only one resolvable multipath i.e. tap present and there are no additional replicas of the received signal, the codes of different downlink users are orthogonal with respect to each other. In this case the own cell interference can be removed and the orthogonality factor is 1. In reality, there are usually several multipaths with independent fading processes present, and thus the orthogonality is a time dependant variable. The average orthogonality factor and the Eb/N0 requirement can be estimated from link level simulations [3]. The needed average required Tx power for MS i is then:
( )NLILPW
Rp iothii
iii ++−= )1( α
ρ. (11)
By summing pi over all users in the considered cell and adding the constant power Pc describing all the common channel powers, such as the pilot power, we get:
( ) .)1(1
c
k
iiothii
ii PNLILPW
RP +++−=∑=
αρ (12)
If it is assumed that there are neighboring cells with the same transmitting power P, the other cell interference from M other cells around the own cell, Ioth is:
∑≠=
=M
inn ni
oth LPI
1, (13)
where Lni is the path loss from cell n to the MS i of the own cell. The total BS power P can then be solved as:
21
,)1(1
1,
1
∑
∑
=
=
+−−
+= k
iiDLi
ii
k
ic
iii
fW
R
PNW
LR
Pαρ
ρ (14)
where fDL,i is the other-to-own cell interference ratio in downlink. Equation (14) can be simplified by using equal services and average path loss values and this approximated formulation of the average BS transmission power can be used for dimensioning purposes especially when the number of users is assumed to be large:
,)1(1 DL
c
fW
Rk
PLNW
RkP
+−−
+≅
αρ
ρ (15)
where L is the average path loss of the cell. The variables DLf and α are the average downlink other-to-own cell interference ratio and the average orthogonality, respectively. The average downlink Eb/N0-target is ρ. In fact DLf and α do not represent exact average values, but typical values for the considered environment. The orthogonality changes as the multipath profile of the radio channel changes thus accurate average values are very difficult to estimate. When the multipath propagation increases, the orthogonality of the channel decreases, which decreases the overall downlink capacity.
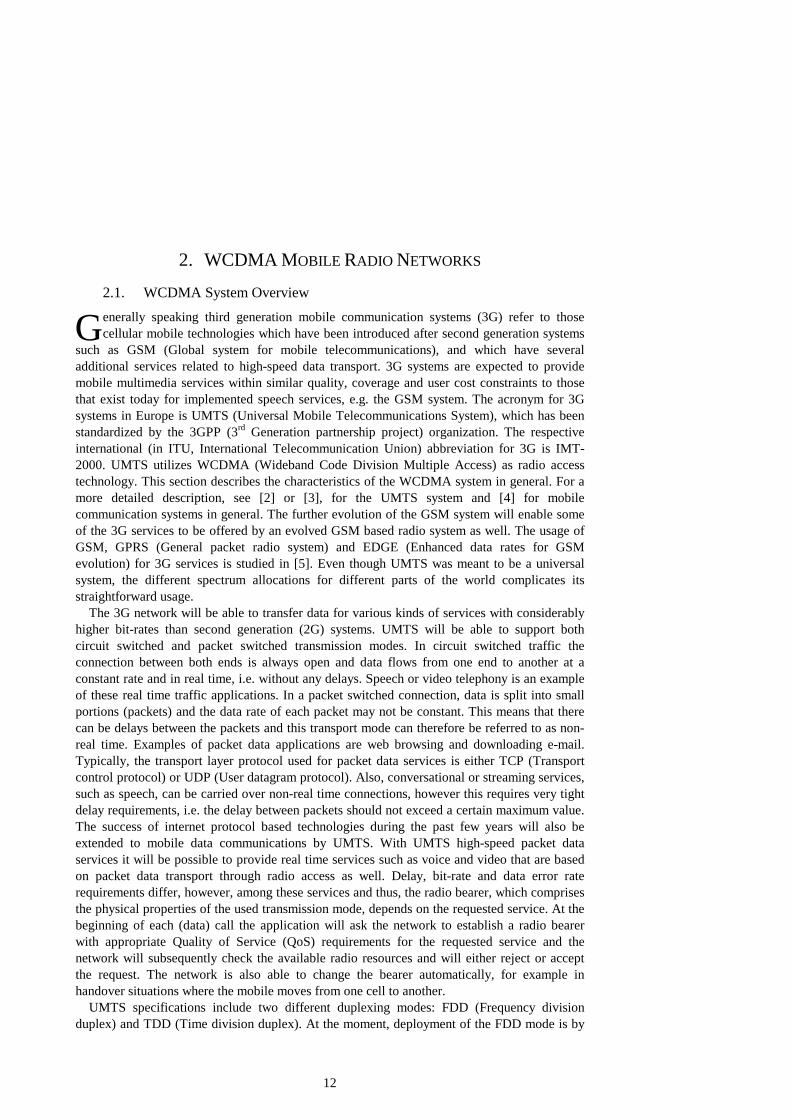
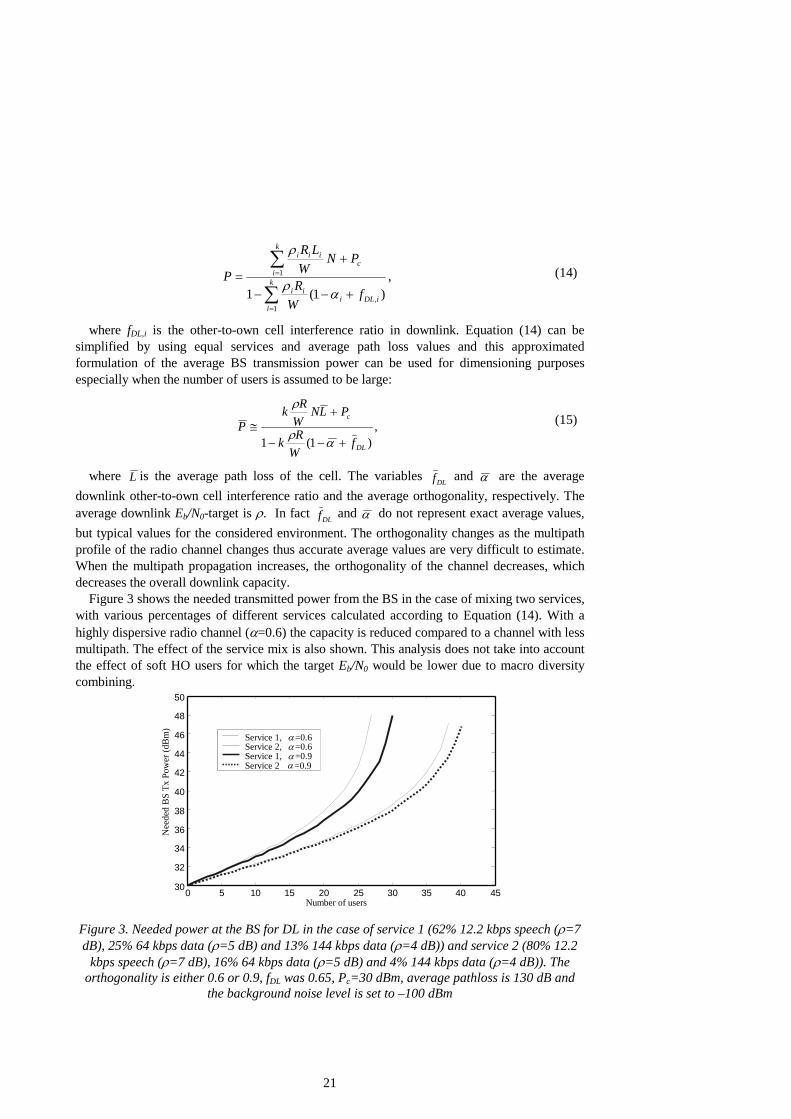
Figure 3 shows the needed transmitted power from the BS in the case of mixing two services, with various percentages of different services calculated according to Equation (14). With a highly dispersive radio channel (α=0.6) the capacity is reduced compared to a channel with less multipath. The effect of the service mix is also shown. This analysis does not take into account the effect of soft HO users for which the target Eb/N0 would be lower due to macro diversity combining.
Figure 3. Needed power at the BS for DL in the case of service 1 (62% 12.2 kbps speech (ρ=7 dB), 25% 64 kbps data (ρ=5 dB) and 13% 144 kbps data (ρ=4 dB)) and service 2 (80% 12.2
kbps speech (ρ=7 dB), 16% 64 kbps data (ρ=5 dB) and 4% 144 kbps data (ρ=4 dB)). The orthogonality is either 0.6 or 0.9, fDL was 0.65, Pc=30 dBm, average pathloss is 130 dB and
the background noise level is set to –100 dBm
0 5 10 15 20 25 30 35 40 45 30 32 34 36 38 40 42 44 46 48 50
Number of users
Nee
ded
BS
Tx P
ower
(dB
m)
Service 1, α =0.6 Service 2, α =0.6 Service 1, α =0.9 Service 2 α =0.9

22
3. RADIO WAVE PROPAGATION MODELING
his section describes the basic characteristics of urban radio propagation and introduces the developed microcellular propagation model. The radio wave propagation modeling is
reported earlier in [1] and in papers [P6] and [P7].
3.1. Overview In order to estimate the performance of any radio system the physical properties of the radio
channel have to be known. Typically, the radio channel can be characterized by several factors such as its average attenuation, narrowband fading properties, wideband propagation properties and by its direction of arrival properties [16].
In the case of the average attenuation the average path loss (typically expressed in dB) between the transmitter and the receiver is of interest. It includes the cable losses, antenna gains, and the distance attenuation due to radiowave propagation attenuation but not the effect of multipath propagation i.e. fast fading. The average attenuation includes the effect of the local environment or so called slow fading due to the shadowing effect of the buildings, trees and terrain height variations.
In the case of narrowband fading we are interested in the effect of multipath fading on the signal envelope over a narrow frequency band, which should be less than the coherence bandwidth of the channel. Typically, this fast fading can be modeled with Rayleigh distribution (e.g.[11], [17]). The wideband characteristics of the radio channel gives information about the delay characteristics of the radio channel, i.e. what are the multipath propagation conditions in the radio channel. The direction of the arrival properties of the radio channel give information about the spatial distribution of the incoming radio paths.
Propagation models are used either for radio system design or for radio network planning purposes. These two application areas present different requirements for the model. For radio system design purposes the mean electric field, the signal variance and the precise estimation of the short term fading are usually required whereas in network planning only the mean value of the electric field is needed. On the other hand, in network planning the model has to be computationally efficient in order to estimate the received field strength values for a large geographical area.
The path loss in decibels can be defined as:
LPPdB
t
r=
10 10log ,
(16)
where Pt and Pr are the transmitted power and the received power respectively. The path loss is dependent on the gain patterns and polarization states of the used transmitting and receiving antennas. In reality the propagation environment is changing all the time because of moving vehicles, pedestrians, moving trees, etc. and thus the received power and the path loss are functions of time and the location of the receiver.
If the electromagnetic wave propagates in a free space the power density [W/m2] of the wave is:
,4
),(2r
GPS tt
πθφ
= (17)
where Gt(φ,θ) is the antenna pattern to the direction (φ,θ) and r is the distance between the transmitter and the receiver. When the polarizations of the incoming wave and the antenna of
T

23
the receiver are matched:
P S A SG
P G Grr eff
rt t r= = =
λπ
φ θλπ
2 2
4 4( , ) , (18)
where Aeff is the effective area of the receive antenna [m2] and λ is the wave length [m]. Gt and Gr are gains from the transmitting and receiving antenna respectively. The free space path loss can be then computed:
LP
P G Grt
r t r0
24=
( , )φ θπλ
. (19)
In practical situations there are almost always obstructions or reflecting surfaces in the way of the propagation path. In these situations the environment affects the propagating wave in many ways and these can be categorized according to different propagation mechanisms. In the case of mobile telecommunication where the used frequency is around 2 GHz and both the transmitter and the receiver are close to the ground surface the effective propagation mechanisms can be classified as follows: 1) free space propagation (in line-of-sight, LOS), 2) reflections, 3) diffractions, 4) scattering and 5) penetration. This general treatment of the wave propagation where the signal travels from different paths from the transmitter to the receiver is called multipath propagation.
Propagation models used in radio network planning for the urban environment are either theoretical or semi-empirical. In macrocell planning (macrocell refers to the cell where the BS antenna is above rooftop level) semi-empirical models are preferred because of the complexity of the propagation environment and the greater statistical nature of the propagation phenomena. The multipath propagation consists of many propagation routes due to multiple reflections, diffractions and incoherent scattering effects and various combinations of the aforementioned. Additionally, these mechanisms change rapidly over time when the MS moves. Thus, it is generally not feasible to model macrocellular propagation with any analytical method but it is more practical to use empirical or semi-empirical models, such as the Okumura-Hata model [18].
In microcells where the base station antenna is below the rooftops the radio wave propagates mainly through street canyons via reflections and diffractions from building walls and corners. In this scenario an analytical approach is justified due to the fact that the number of significant propagation mechanisms is limited. In the case of microcells the attenuation due to buildings is large and the used transmit powers at the base station are low. Therefore the cell size is usually small. At the used frequencies (900 MHz and 1800 MHz in GSM and around 2 GHz in UMTS) the propagation of the radio wave can be analyzed by using the ray-optical theory. The propagation routes from the transmitter to the receiver can be computed with the ray-tracing algorithms.
In urban areas with high user density the capacity of the overall network can be increased by using picocells, where the base-station antenna or antenna systems have been installed inside the buildings. In this case the propagation can be characterized with indoor propagation models which are, however, outside of the scope of this study. The effect of indoor propagation on network performance has been reported in [19]. Macrocellular propagation modelling
The Okumura-Hata (OH) model is widely used in coverage calculation in macrocell network planning. It is based on measurements made by Okumura [18] in Tokyo. The original graphical
24
database by Okumura was described using mathematical formulas derived by Hata [20]. Further developments of the model were made by COST 231 [21] to extend the validity range of the model in the 1.8 GHz band.
In the original OH model the path loss was computed by calculating the empirical attenuation correction factor for urban areas. It is a function of the distance between the base station and the mobile station and the frequency. This factor was added to the free space loss. The result was corrected by the factors for the base station antenna height and the mobile station antenna height. Further correction factors were provided for street orientation, suburban, open areas and propagation over irregular terrain.
Hata’s formulas are valid when the frequency is between 150 to 1000 MHz (for COST 231-Hata mode the range is 1.5-2.0 GHz), the base station height is between 30 to 200 meters, the mobile station height is between 1 to 10 meters and the distance is between 1 to 20 kilometers. The base station antenna height must be above the rooftop level of the buildings adjacent to the base station. Thus, the model is proposed as being usable for propagation studies in macrocells.
The Walfish-Ikegami model provides a semi-empirical approach based on the assumption that the transmitted wave propagates over the rooftops by a process of multiple diffraction for non-line-of-sight conditions (NLOS). The buildings on the line between the transmitter and the receiver are characterized as diffracting half screens with an equal height and range separation [22]. For the LOS situation the original model [22] were added to using the street canyon model [23] and [24]. The resulting model is called the COST-231-Walfish-Ikegami model.
Although the Walfish-Ikegami model is considered to be a microcell model it should not be used when the antenna of the transmitter is below the rooftops of the surrounding buildings. In this case the transmitting wave travels through street canyons and not over the rooftops as is assumed in the model. For obstructed paths in microcells the model only implies a rough empirical function versus a base station antenna height. The assumptions used in the Walfish-Ikegami model restrict its usability in those cases where the dimensions of the buildings are identical and they are uniformly spaced. Also, the terrain height must be constant in the calculation area.
Ray-tracing modeling
There are several weaknesses in the empirical or semi-empirical models for propagation studies in microcellular environments. If the mobile antenna height is below the rooftops of the surrounding buildings, the nature of the propagation phenomena changes. This situation can not be analyzed with statistical methods anymore because the size of the individual building is large compared to the cell size and the exact geometrical properties of the building can not be ignored as in the case of macrocellular models. Furthermore, the near environment of the base station antenna also has a strong effect on propagation. The effect of the nearest buildings on the radiowave propagation buildings can be taken into account by using ray-tracing models.
Ray-tracing models are based on the ray optical approximation where the radiowaves have been assumed to propagate through rays. In the ray optical approximation the fields are known to travel along rays and the radio wave propagation can be calculated according to geometrical principles. The scattering can then be calculated by assuming that each part of the scattering object can be considered as an infinite plane interface, and the incoming wave can be treated locally as a plane wave. These approximations are valid when the scattering object is large compared to the wavelength, the surface roughness is small compared to the wavelength and the distances between the source, the scattering object and the observation point are large compared to the wavelength. These assumptions are valid when studying radio wave propagation in urban environments at typical mobile radio frequencies (1-2 GHz).
25
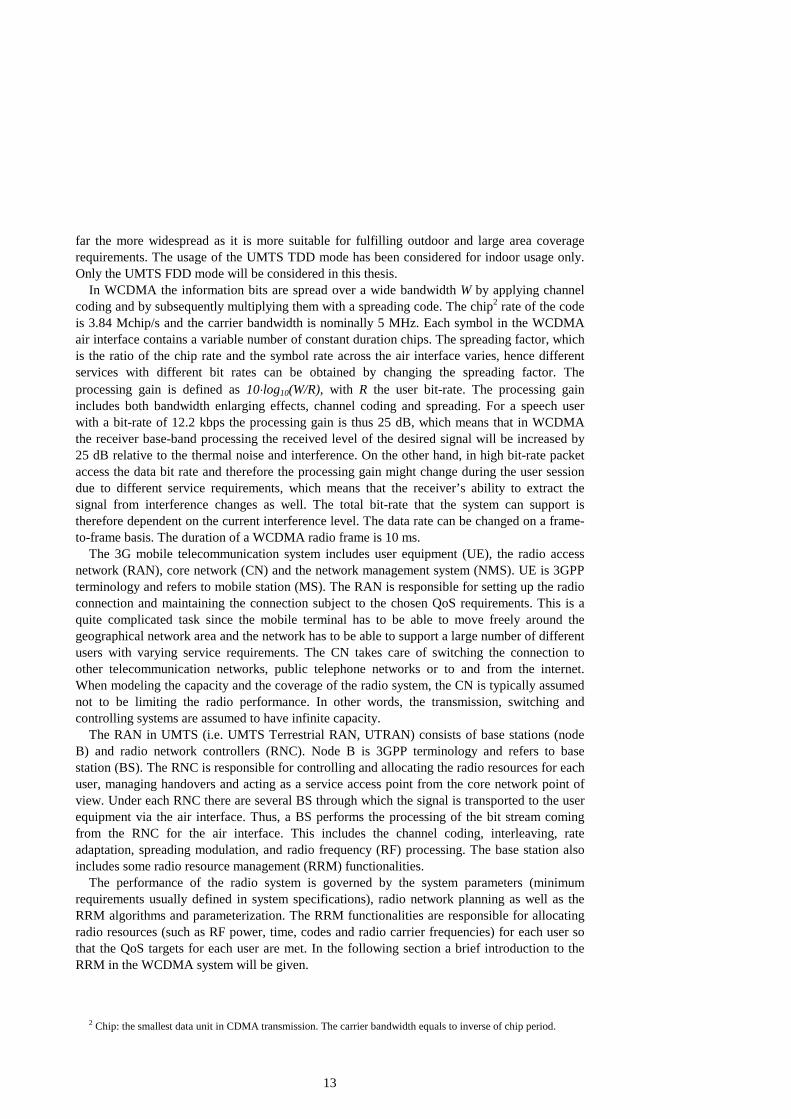
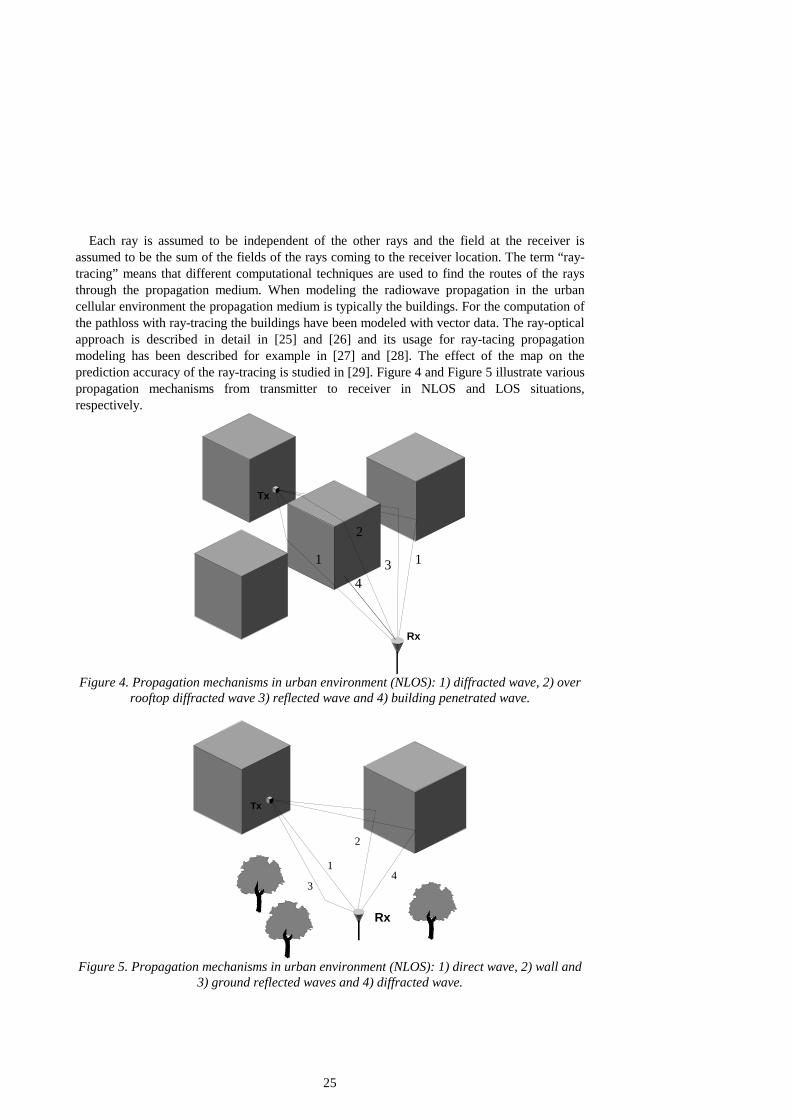
Each ray is assumed to be independent of the other rays and the field at the receiver is assumed to be the sum of the fields of the rays coming to the receiver location. The term “ray-tracing” means that different computational techniques are used to find the routes of the rays through the propagation medium. When modeling the radiowave propagation in the urban cellular environment the propagation medium is typically the buildings. For the computation of the pathloss with ray-tracing the buildings have been modeled with vector data. The ray-optical approach is described in detail in [25] and [26] and its usage for ray-tacing propagation modeling has been described for example in [27] and [28]. The effect of the map on the prediction accuracy of the ray-tracing is studied in [29]. Figure 4 and Figure 5 illustrate various propagation mechanisms from transmitter to receiver in NLOS and LOS situations, respectively.
Tx
Rx
1
2
3 1
4
Figure 4. Propagation mechanisms in urban environment (NLOS): 1) diffracted wave, 2) over
rooftop diffracted wave 3) reflected wave and 4) building penetrated wave.
Tx
Rx
1
2
4 3
Figure 5. Propagation mechanisms in urban environment (NLOS): 1) direct wave, 2) wall and
3) ground reflected waves and 4) diffracted wave.
26
3.2. Propagation Modeling for Urban Microcells 3.2.1. Propagation Mechanisms
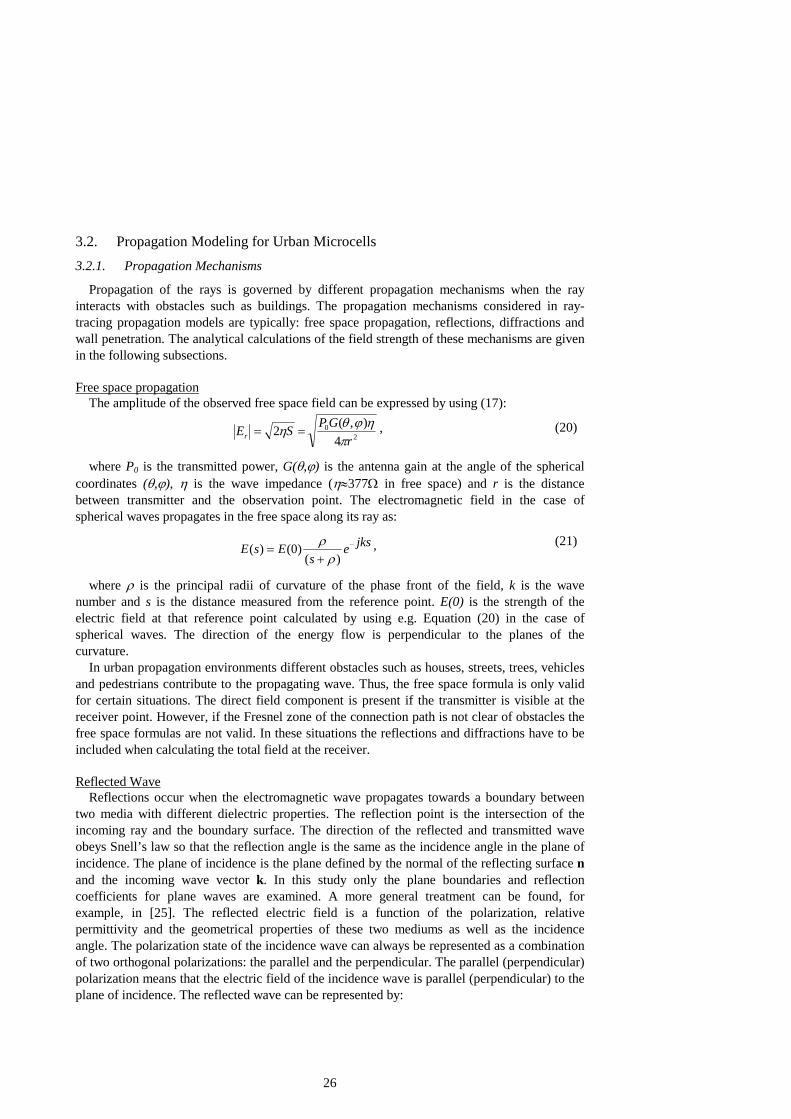
Propagation of the rays is governed by different propagation mechanisms when the ray interacts with obstacles such as buildings. The propagation mechanisms considered in ray-tracing propagation models are typically: free space propagation, reflections, diffractions and wall penetration. The analytical calculations of the field strength of these mechanisms are given in the following subsections. Free space propagation
The amplitude of the observed free space field can be expressed by using (17):
20
4),(2
rGPSEr π
ηϕθη == , (20)
where P0 is the transmitted power, G(θ,ϕ) is the antenna gain at the angle of the spherical coordinates (θ,ϕ), η is the wave impedance (η≈377Ω in free space) and r is the distance between transmitter and the observation point. The electromagnetic field in the case of spherical waves propagates in the free space along its ray as:
jkses
EsE −
+=
)()0()(
ρρ , (21)
where ρ is the principal radii of curvature of the phase front of the field, k is the wave number and s is the distance measured from the reference point. E(0) is the strength of the electric field at that reference point calculated by using e.g. Equation (20) in the case of spherical waves. The direction of the energy flow is perpendicular to the planes of the curvature.
In urban propagation environments different obstacles such as houses, streets, trees, vehicles and pedestrians contribute to the propagating wave. Thus, the free space formula is only valid for certain situations. The direct field component is present if the transmitter is visible at the receiver point. However, if the Fresnel zone of the connection path is not clear of obstacles the free space formulas are not valid. In these situations the reflections and diffractions have to be included when calculating the total field at the receiver. Reflected Wave
Reflections occur when the electromagnetic wave propagates towards a boundary between two media with different dielectric properties. The reflection point is the intersection of the incoming ray and the boundary surface. The direction of the reflected and transmitted wave obeys Snell’s law so that the reflection angle is the same as the incidence angle in the plane of incidence. The plane of incidence is the plane defined by the normal of the reflecting surface n and the incoming wave vector k. In this study only the plane boundaries and reflection coefficients for plane waves are examined. A more general treatment can be found, for example, in [25]. The reflected electric field is a function of the polarization, relative permittivity and the geometrical properties of these two mediums as well as the incidence angle. The polarization state of the incidence wave can always be represented as a combination of two orthogonal polarizations: the parallel and the perpendicular. The parallel (perpendicular) polarization means that the electric field of the incidence wave is parallel (perpendicular) to the plane of incidence. The reflected wave can be represented by:
27
,REE ⋅= ir (20)
where Ei and Er are the incident and reflected field strength (vectors) at the reflection point, R is the reflection coefficient which is dyadic. The field strength at the observation point after the reflection can be computed by using Equations (20) and (21). The reflection coefficient can be written by using the parallel and perpendicular unit vectors,
⊥⊥+= eeeeR TETM RR |||| (21)
where RTM and RTE are the reflection coefficients for boundary conditions, where either the magnetic field or the electric field is perpendicular to the normal of the reflecting surface n respectively. Unit vectors ||e and ⊥e are parallel and perpendicular to the plane of incidence.
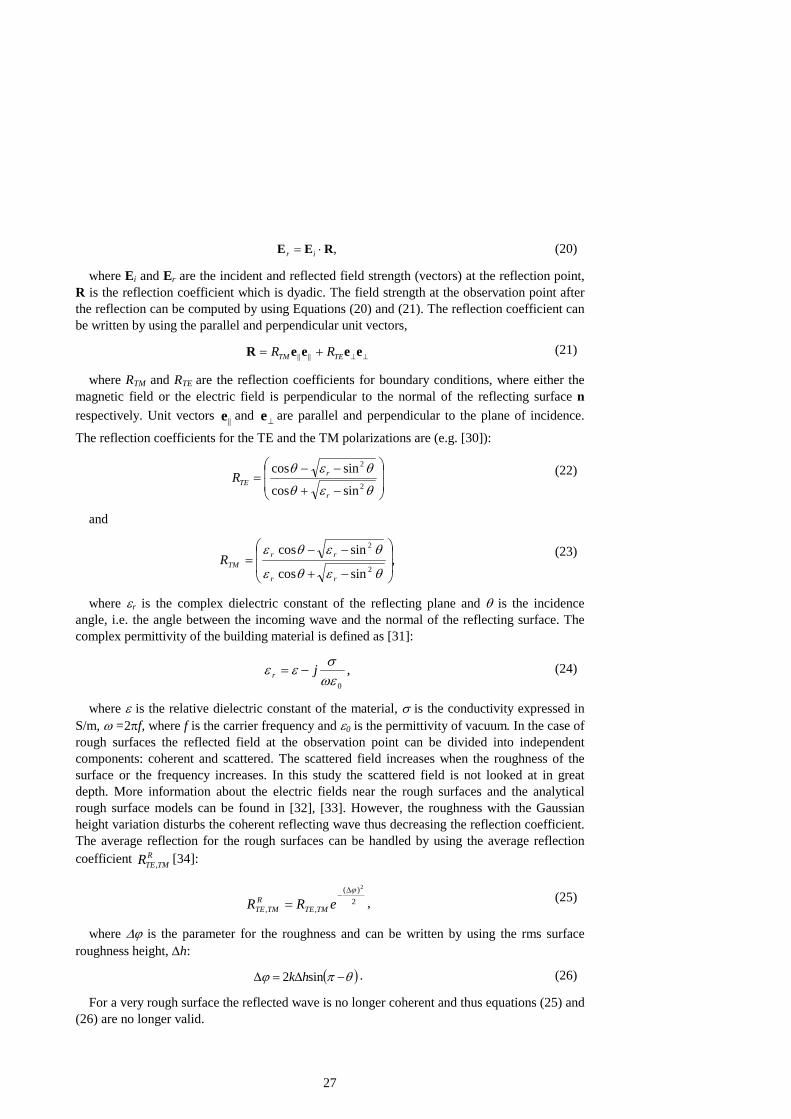
The reflection coefficients for the TE and the TM polarizations are (e.g. [30]):
−+
−−=
θεθ
θεθ2
2
sincos
sincos
r
rTER (22)
and
,sincos
sincos2
2
−+
−−=
θεθε
θεθε
rr
rrTMR (23)
where εr is the complex dielectric constant of the reflecting plane and θ is the incidence angle, i.e. the angle between the incoming wave and the normal of the reflecting surface. The complex permittivity of the building material is defined as [31]:
,0ωε
σεε jr −= (24)
where ε is the relative dielectric constant of the material, σ is the conductivity expressed in S/m, ω =2πf, where f is the carrier frequency and ε0 is the permittivity of vacuum. In the case of rough surfaces the reflected field at the observation point can be divided into independent components: coherent and scattered. The scattered field increases when the roughness of the surface or the frequency increases. In this study the scattered field is not looked at in great depth. More information about the electric fields near the rough surfaces and the analytical rough surface models can be found in [32], [33]. However, the roughness with the Gaussian height variation disturbs the coherent reflecting wave thus decreasing the reflection coefficient. The average reflection for the rough surfaces can be handled by using the average reflection coefficient R
TMTER , [34]:
2)(
,,
2ϕ∆−
= eRR TMTER
TMTE , (25)
where ∆ϕ is the parameter for the roughness and can be written by using the rms surface roughness height, ∆h:
( )θπϕ −∆=∆ sin2 hk . (26)
For a very rough surface the reflected wave is no longer coherent and thus equations (25) and (26) are no longer valid.
28
Diffracted Wave
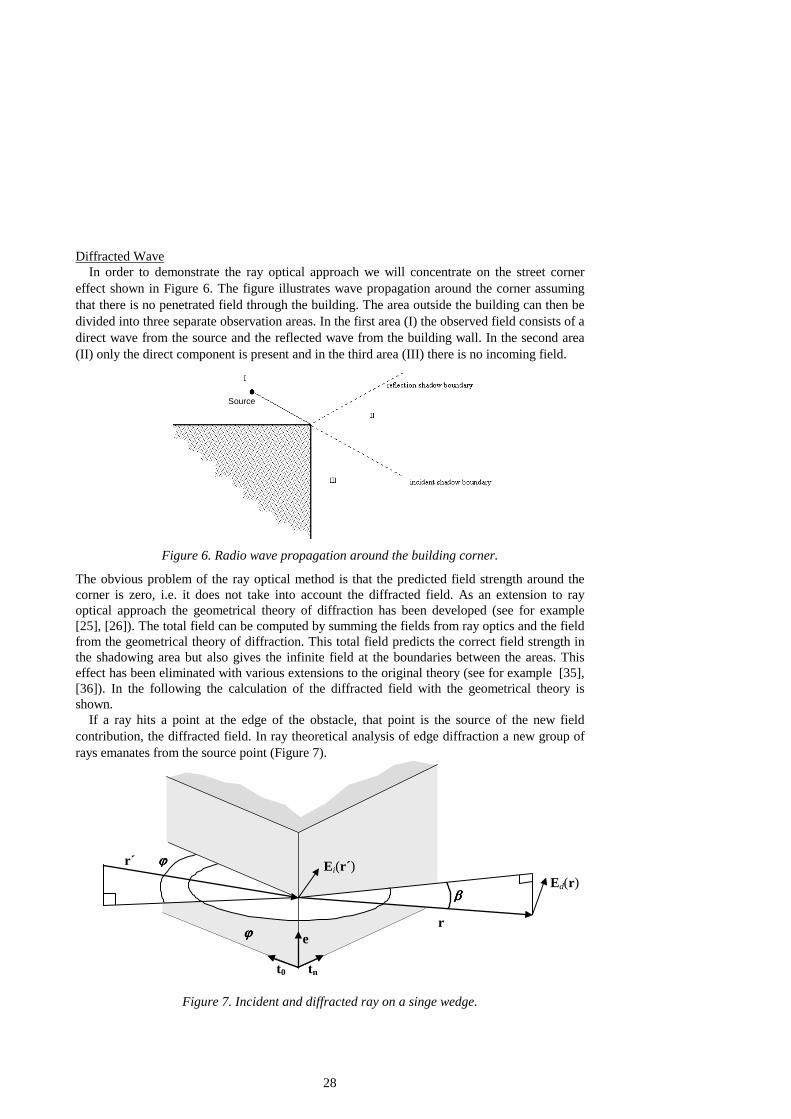
In order to demonstrate the ray optical approach we will concentrate on the street corner effect shown in Figure 6. The figure illustrates wave propagation around the corner assuming that there is no penetrated field through the building. The area outside the building can then be divided into three separate observation areas. In the first area (I) the observed field consists of a direct wave from the source and the reflected wave from the building wall. In the second area (II) only the direct component is present and in the third area (III) there is no incoming field.
Source
Figure 6. Radio wave propagation around the building corner.
The obvious problem of the ray optical method is that the predicted field strength around the corner is zero, i.e. it does not take into account the diffracted field. As an extension to ray optical approach the geometrical theory of diffraction has been developed (see for example [25], [26]). The total field can be computed by summing the fields from ray optics and the field from the geometrical theory of diffraction. This total field predicts the correct field strength in the shadowing area but also gives the infinite field at the boundaries between the areas. This effect has been eliminated with various extensions to the original theory (see for example [35], [36]). In the following the calculation of the diffracted field with the geometrical theory is shown.
If a ray hits a point at the edge of the obstacle, that point is the source of the new field contribution, the diffracted field. In ray theoretical analysis of edge diffraction a new group of rays emanates from the source point (Figure 7).
r´
r
ϕϕϕϕ
ββββ
' t0
tn
e ϕϕϕϕ
Ei(r´) Ed(r)
Figure 7. Incident and diffracted ray on a singe wedge.

29
Diffracted electric field is given by following expression [35]: jkr
id errA −⋅⋅= )',()'()( DrErE , (27)
where Ei and Ed are the incident and diffracted electric fields at the wedge point and the observation point and D is the diffraction coefficient of the wedge for a given angles ϕ, ϕ´ and β. The direction of the edge diffracted rays is defined by the Keller’s law of edge diffraction: r´⋅e= r⋅e. The polarization of the incident wave is transformed due to the diffraction process so that the diffraction coefficient becomes a dyad:
⊥⊥+= eeeeD |||| TETM DD , (28)
where DTM and DTE are the diffraction coefficients for the field polarizations where the magnetic and electric fields are perpendicular to the plane of incident respectively. The wave number is k and r is the distance between the diffraction point and the observation point (r=|r|). The plane of incident is the plane defined by the edge vector e and the incident ray r´. The unit vectors ||e and ⊥e are parallel and perpendicular to the plane of incidence respectively. A(r,r’)
describes how the amplitude of the diffracted ray decreases over the distance from the wedge. For a spherical wave incidence the attenuation factor is defined as the following:
A r r rr r r
( , ' ) '( ' )
=+
. (29)
The diffraction coefficients DTM and DTE have been defined in [35], in the case of a diffraction in a straight vertical edge with infinite conductivity. 3.2.2. Ray-tracing Calculation Method
The computational efficiency is one of the most important measures when evaluating the usability of ray-optical approximation in operational propagation studies. The developed ray-tracing algorithm used in this study and reported in [P6] is based on the usage of polygons, namely LOS-polygons (LP), diffraction polygons (DP) and reflection polygons (RP). LP refers to those receiver points which are visible from the transmitter (Tx) and where the direct ray-component is calculated (Figure 8a). Every corner visible from the transmitter in the model is treated as a secondary diffraction source. Those computation points that are visible from the particular corner, c1, are bounded by the DP (Figure 8b). The diffraction component from the corner c1 is calculated only for those points in the map which are inside the polygon. The double diffraction component is calculated by using all the corners visible from the first corner as a virtual source. The double diffraction component is computed for those points which are inside the polygons of the double diffraction corner. It is noteworthy that the corner polygons are map-specific information and thus the polygon information has to be calculated only once for a certain building database.
The reflection algorithm checks those walls segments that are completely or partially visible from the Tx point. The model computes the mirror images of the transmitter with respect to these walls segments after which the sectors produced by the mirror images and the corresponding reflecting wall segments are computed. A reflection polygon is produced by checking those walls inside this sector which are completely or partially visible from the image source after the reflecting wall. These wall segments act as the second reflectors for this iterative algorithm. The first reflecting wall segment, the sector and the second wall segments produce a polygon and by checking which of the receiving points are inside this polygon we
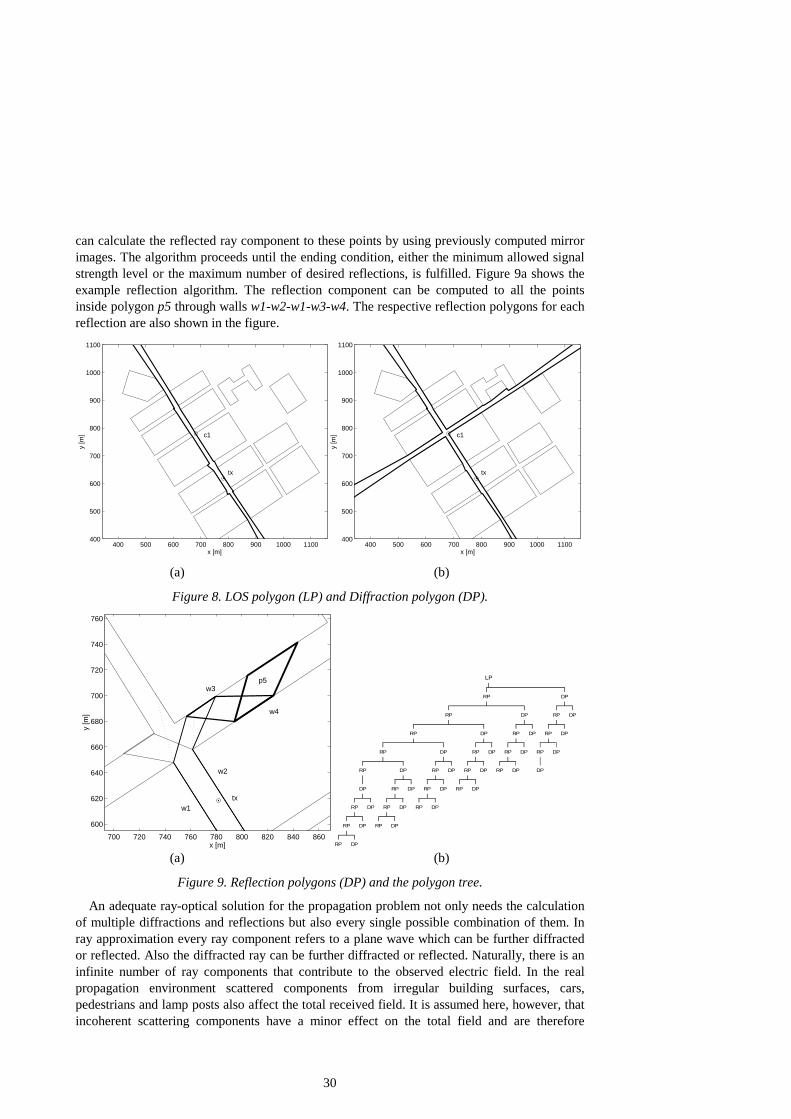
30
can calculate the reflected ray component to these points by using previously computed mirror images. The algorithm proceeds until the ending condition, either the minimum allowed signal strength level or the maximum number of desired reflections, is fulfilled. Figure 9a shows the example reflection algorithm. The reflection component can be computed to all the points inside polygon p5 through walls w1-w2-w1-w3-w4. The respective reflection polygons for each reflection are also shown in the figure.
400 500 600 700 800 900 1000 1100400
500
600
700
800
900
1000
1100
tx
c1
x [m]
y [m
]
400 500 600 700 800 900 1000 1100400
500
600
700
800
900
1000
1100
tx
c1
x [m]
y [m
]
(a) (b)
Figure 8. LOS polygon (LP) and Diffraction polygon (DP).
700 720 740 760 780 800 820 840 860
600
620
640
660
680
700
720
740
760
tx
x [m]
y [m
]
w1
w2
w3
w4
p5
RP DP
RP DP
RP DP
DP
RP
RP DP
RP DP
RP DP
DP
RP
RP DP
RP DP
RP DP
DP
RP
RP DP
RP DP
RP DP
DP
RP
RP DP
RP DP
RP DP
DP
RP
DP
RP DP
RP DP
RP DP
DP
LP
(a) (b)
Figure 9. Reflection polygons (DP) and the polygon tree.
An adequate ray-optical solution for the propagation problem not only needs the calculation of multiple diffractions and reflections but also every single possible combination of them. In ray approximation every ray component refers to a plane wave which can be further diffracted or reflected. Also the diffracted ray can be further diffracted or reflected. Naturally, there is an infinite number of ray components that contribute to the observed electric field. In the real propagation environment scattered components from irregular building surfaces, cars, pedestrians and lamp posts also affect the total received field. It is assumed here, however, that incoherent scattering components have a minor effect on the total field and are therefore

31
neglected. By defining the maximum number of diffractions and reflections a hierarchical structure can be defined where every corner and wall of the preceding ray-mechanism produces a new diffraction or reflection polygon until the ending condition is true. Figure 9b shows an example of a polygon tree.
The method introduced above can be used when predicting the outdoor field strength at street level. Paper [P7] introduces a method of computing the signal strength inside the buildings by using the sample points from the outdoor predictions just outside the building wall. The total signal strength at the observation point inside the building can be estimated as the sum of the field contributions coming via different propagation routes through the building. One signal component (or ray) from each wall visible at the observation point is computed. The selected ray corresponds to the strongest signal component from all signal components coming to the receiver. The developed model has been validated with measurements carried out in six different buildings and with four transmitter locations. The mean standard deviation of the prediction error i.e. the average difference between measured and predicted path loss values was 6.6 dB, which is a relatively good result for network planning purposes.
The developed model can be used for network planning because of the fast, computationally efficient calculation algorithm. The accuracy of the model is adequate for most network planning purposes. However, the developed model is a two-dimensional model and is therefore not suitable for environments with variable building heights and for situations where the transmitting antenna is above the rooftops. For those purposes 3D ray-tracing or a semi-empirical propagation model should be utilized. It should also be noted that the usefulness of the ray-tracing model is dependent on the availability of an appropriate vectorized map.
Because the ray-tracing propagation model calculates the total received electric field as a sum of the ray components, the model can be utilized when calculating the time and angular dispersion of the received signal.
The time dispersion contains information about the impulse response of the propagation channel and the model can therefore be distinguished as either a narrowband or a wideband model. In the narrowband model the transmitted wave mode is assumed to be the single carrier and the frequency dependence of the fading of the signal envelope is not considered. This means in practice that only the value of the signal envelope at every receiver point is computed. In the wideband model the transmitted wave model is assumed to be an impulse function with infinite bandwidth. Every single ray has a unique propagation path with a different path length and a combination of different propagation mechanisms. Thus, each ray is induced with its unique attenuation and phase changes in its propagation path. This ray response can be used to estimate the wideband model of the radio channel. This is merely an approximation of the impulse response as it is using the constant carrier wave frequency to calculate all of the propagation mechanisms and the real impulse includes "all" frequencies. In the wideband model in the time domain the received signal can be understood as a sum of the delayed components coming to a receiver via different propagation paths. In the frequency domain the spectrum of the transmitted wave is distorted by frequency selective fading. The effect of multipath propagation on the link level performance of WCDMA is reported in [37] and in [P5], where the channel wideband response has been calculated with the ray-tracing program. Paper [38] compares the measured and modeled fading characteristics in microcellular propagation environments at 900 and 1805 MHz carrier frequencies. Results show that when the distance between the transmitter and receiver are short ray-tracing can predict the fading characteristics well both in LOS and in NLOS conditions.
The angular dispersion of the radio channel can also be studied with ray-tracing because the ray model also includes information about the direction of arrival of each ray segment. The

32
ability of the ray-tracing program to estimate the correct angular spreading in an urban environment is reported in [39]. In the study the measured and modeled field direction-delay-spread functions were compared in LOS and in NLOS conditions in an urban environment. The field direction-delay-spread function includes information about the direction and the delay of each propagation path. Results show that ray-tracing can find the main propagation paths reasonably well, at least when the distance between the transmitter and the receiver is short. When the distance is long the real signal consists of components caused by non-coherent scattering from rough building surfaces, from trees and etc, which can not be modeled with the ray-tracing model. The direction data of the ray-tracing model can also be utilized in antenna design. In papers [40], [41] the ray-tracing model is utilized for the verification of different antenna array concepts for microcells.
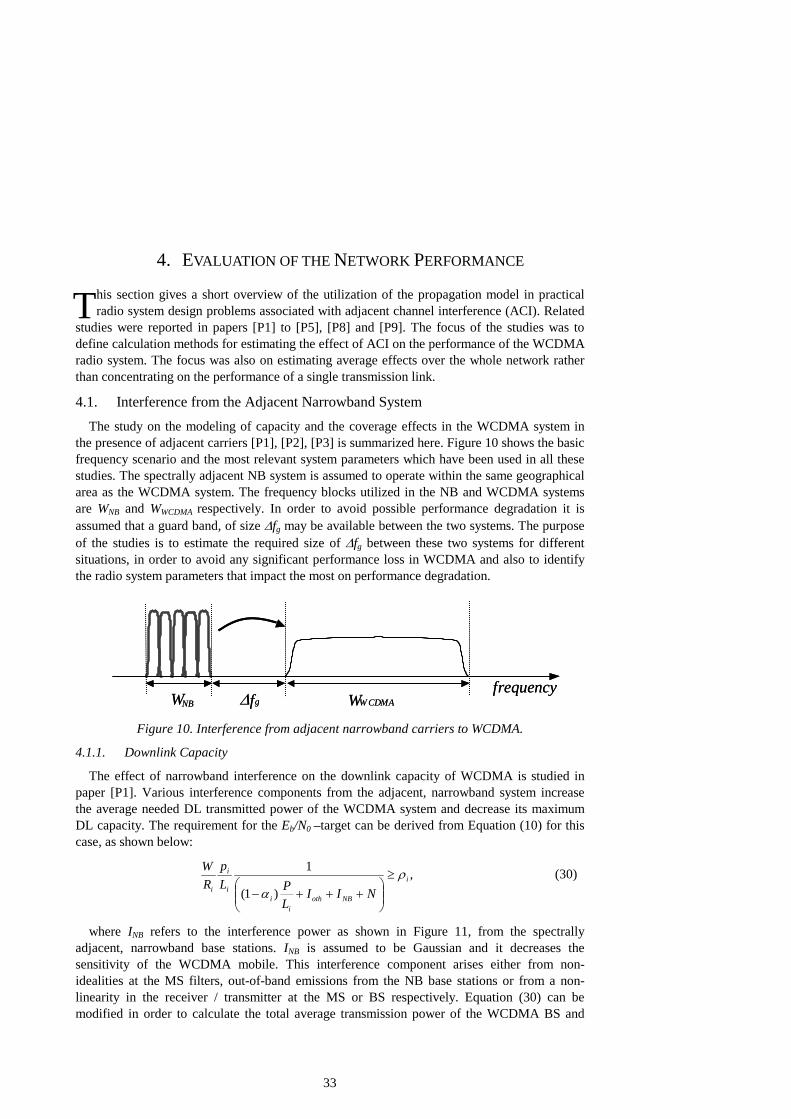
33
4. EVALUATION OF THE NETWORK PERFORMANCE
his section gives a short overview of the utilization of the propagation model in practical radio system design problems associated with adjacent channel interference (ACI). Related
studies were reported in papers [P1] to [P5], [P8] and [P9]. The focus of the studies was to define calculation methods for estimating the effect of ACI on the performance of the WCDMA radio system. The focus was also on estimating average effects over the whole network rather than concentrating on the performance of a single transmission link.
4.1. Interference from the Adjacent Narrowband System The study on the modeling of capacity and the coverage effects in the WCDMA system in
the presence of adjacent carriers [P1], [P2], [P3] is summarized here. Figure 10 shows the basic frequency scenario and the most relevant system parameters which have been used in all these studies. The spectrally adjacent NB system is assumed to operate within the same geographical area as the WCDMA system. The frequency blocks utilized in the NB and WCDMA systems are WNB and WWCDMA respectively. In order to avoid possible performance degradation it is assumed that a guard band, of size ∆fg may be available between the two systems. The purpose of the studies is to estimate the required size of ∆fg between these two systems for different situations, in order to avoid any significant performance loss in WCDMA and also to identify the radio system parameters that impact the most on performance degradation.
∆fgfrequency
WNB WW CDMA∆fgfrequency
WNB WW CDMA Figure 10. Interference from adjacent narrowband carriers to WCDMA.
4.1.1. Downlink Capacity
The effect of narrowband interference on the downlink capacity of WCDMA is studied in paper [P1]. Various interference components from the adjacent, narrowband system increase the average needed DL transmitted power of the WCDMA system and decrease its maximum DL capacity. The requirement for the Eb/N0 –target can be derived from Equation (10) for this case, as shown below:
,)1(
1i
NBothi
ii
i
i NIILPL
pRW ρ
α≥
+++−
(30)
where INB refers to the interference power as shown in Figure 11, from the spectrally adjacent, narrowband base stations. INB is assumed to be Gaussian and it decreases the sensitivity of the WCDMA mobile. This interference component arises either from non-idealities at the MS filters, out-of-band emissions from the NB base stations or from a non-linearity in the receiver / transmitter at the MS or BS respectively. Equation (30) can be modified in order to calculate the total average transmission power of the WCDMA BS and
T
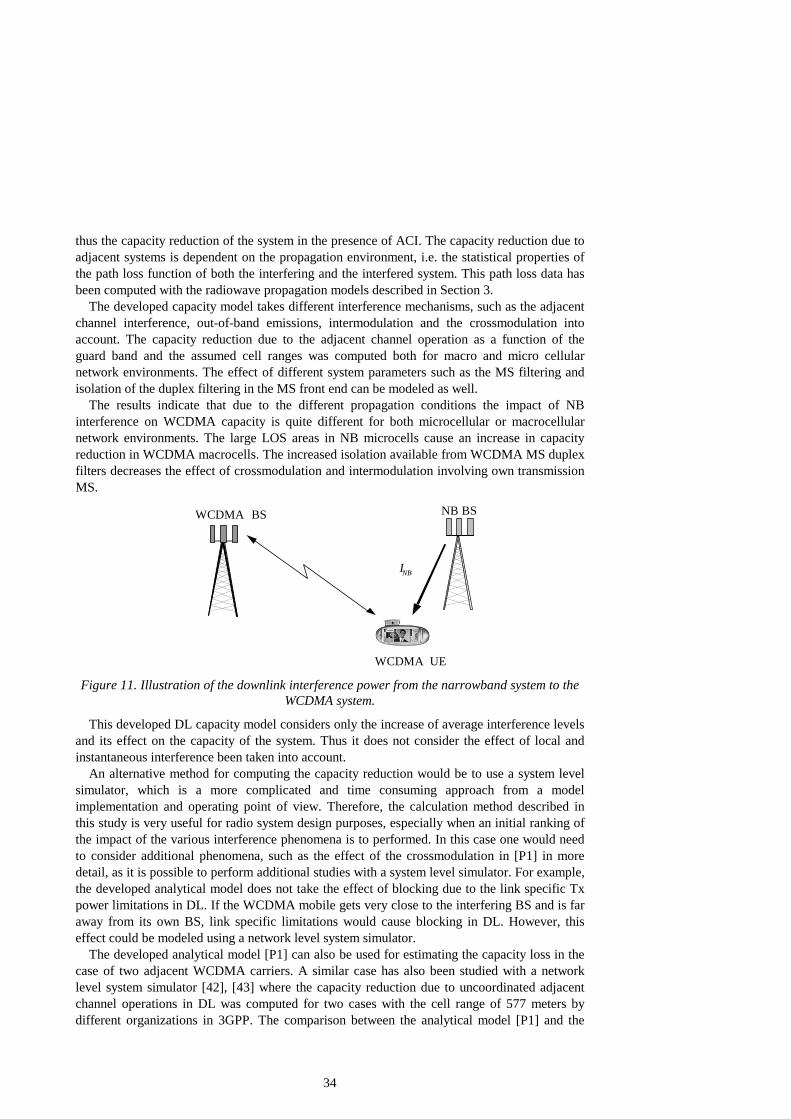
34
thus the capacity reduction of the system in the presence of ACI. The capacity reduction due to adjacent systems is dependent on the propagation environment, i.e. the statistical properties of the path loss function of both the interfering and the interfered system. This path loss data has been computed with the radiowave propagation models described in Section 3.
The developed capacity model takes different interference mechanisms, such as the adjacent channel interference, out-of-band emissions, intermodulation and the crossmodulation into account. The capacity reduction due to the adjacent channel operation as a function of the guard band and the assumed cell ranges was computed both for macro and micro cellular network environments. The effect of different system parameters such as the MS filtering and isolation of the duplex filtering in the MS front end can be modeled as well.
The results indicate that due to the different propagation conditions the impact of NB interference on WCDMA capacity is quite different for both microcellular or macrocellular network environments. The large LOS areas in NB microcells cause an increase in capacity reduction in WCDMA macrocells. The increased isolation available from WCDMA MS duplex filters decreases the effect of crossmodulation and intermodulation involving own transmission MS.
WCDMA UE
NB BS WCDMA BS
I NB
Figure 11. Illustration of the downlink interference power from the narrowband system to the
WCDMA system.
This developed DL capacity model considers only the increase of average interference levels and its effect on the capacity of the system. Thus it does not consider the effect of local and instantaneous interference been taken into account.
An alternative method for computing the capacity reduction would be to use a system level simulator, which is a more complicated and time consuming approach from a model implementation and operating point of view. Therefore, the calculation method described in this study is very useful for radio system design purposes, especially when an initial ranking of the impact of the various interference phenomena is to performed. In this case one would need to consider additional phenomena, such as the effect of the crossmodulation in [P1] in more detail, as it is possible to perform additional studies with a system level simulator. For example, the developed analytical model does not take the effect of blocking due to the link specific Tx power limitations in DL. If the WCDMA mobile gets very close to the interfering BS and is far away from its own BS, link specific limitations would cause blocking in DL. However, this effect could be modeled using a network level system simulator.
The developed analytical model [P1] can also be used for estimating the capacity loss in the case of two adjacent WCDMA carriers. A similar case has also been studied with a network level system simulator [42], [43] where the capacity reduction due to uncoordinated adjacent channel operations in DL was computed for two cases with the cell range of 577 meters by different organizations in 3GPP. The comparison between the analytical model [P1] and the
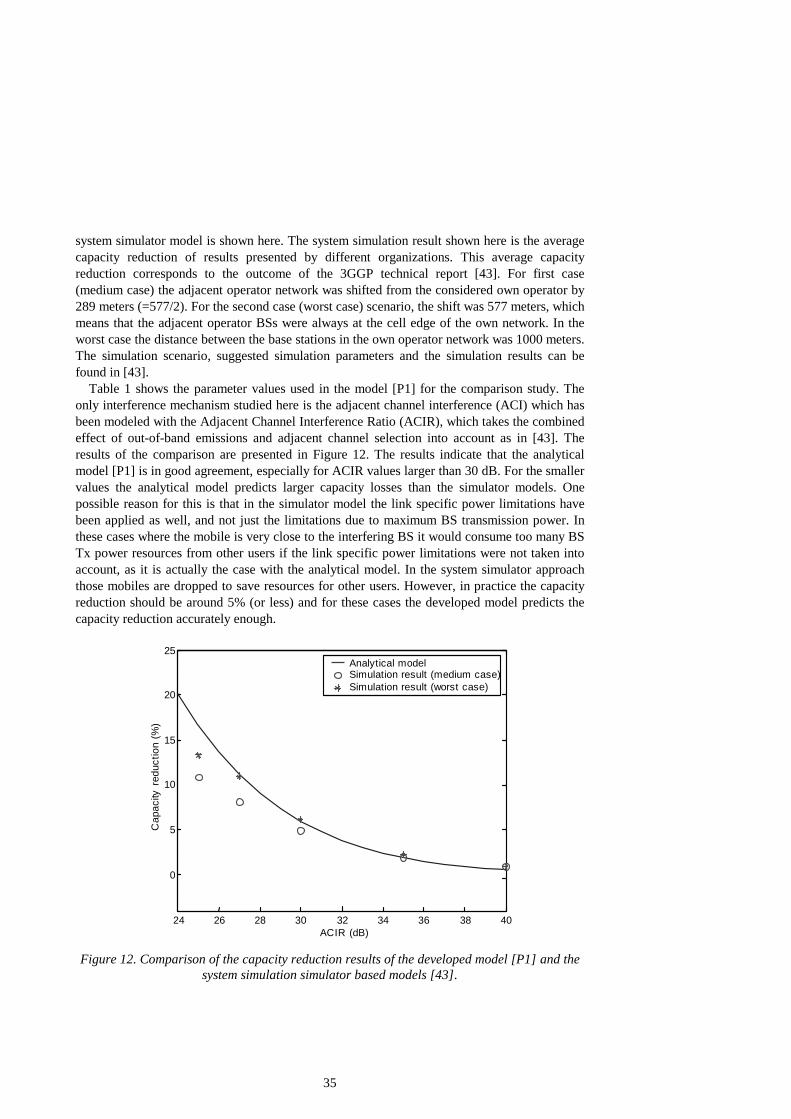
35
system simulator model is shown here. The system simulation result shown here is the average capacity reduction of results presented by different organizations. This average capacity reduction corresponds to the outcome of the 3GGP technical report [43]. For first case (medium case) the adjacent operator network was shifted from the considered own operator by 289 meters (=577/2). For the second case (worst case) scenario, the shift was 577 meters, which means that the adjacent operator BSs were always at the cell edge of the own network. In the worst case the distance between the base stations in the own operator network was 1000 meters. The simulation scenario, suggested simulation parameters and the simulation results can be found in [43].
Table 1 shows the parameter values used in the model [P1] for the comparison study. The only interference mechanism studied here is the adjacent channel interference (ACI) which has been modeled with the Adjacent Channel Interference Ratio (ACIR), which takes the combined effect of out-of-band emissions and adjacent channel selection into account as in [43]. The results of the comparison are presented in Figure 12. The results indicate that the analytical model [P1] is in good agreement, especially for ACIR values larger than 30 dB. For the smaller values the analytical model predicts larger capacity losses than the simulator models. One possible reason for this is that in the simulator model the link specific power limitations have been applied as well, and not just the limitations due to maximum BS transmission power. In these cases where the mobile is very close to the interfering BS it would consume too many BS Tx power resources from other users if the link specific power limitations were not taken into account, as it is actually the case with the analytical model. In the system simulator approach those mobiles are dropped to save resources for other users. However, in practice the capacity reduction should be around 5% (or less) and for these cases the developed model predicts the capacity reduction accurately enough.
24 26 28 30 32 34 36 38 40
0
5
10
15
20
25
ACIR (dB)
Cap
acity
redu
ctio
n (%
)
Analytical modelSimulation result (medium case)Simulation result (worst case)
24 26 28 30 32 34 36 38 40
0
5
10
15
20
25
ACIR (dB)
Cap
acity
redu
ctio
n (%
)
Analytical modelSimulation result (medium case)Simulation result (worst case)
Figure 12. Comparison of the capacity reduction results of the developed model [P1] and the
system simulation simulator based models [43].

36
Table 1. Parameters of the analytical model used in the verification simulations Ptx, Tx power of the WCDMA BS 43 dBm α, orthogonality factor of the macrocell 0.6 N0, thermal noise at the MS including the noise figure -99 dBm fDL, average other to own cell interference ratio 0.55 R, DL user bit-rate 8 kbps DL Eb/N0 target 7.9 dB PtxI , transmitting power of the microcell BS 42 dBm
4.1.2. Downlink Coverage
When the WCDMA mobile moves close to the interfering NB base station, its own base station has to increase the dedicated link specific powers in order to compensate for the effect of interference and to guarantee the quality of service. At some point the link specific power reaches its upper limit and the own base station is no longer able to guarantee the link quality. As explained in section 2.2 the radio resource management will reduce the bit-rate of the service or, in an extreme case will drop the call. Thus, the interfering, adjacent channel NB base stations will produce dead zones in the WCDMA coverage, especially when the path loss between the interfering BS and the WCDMA MS is small. The size of the dead zone is dependent on the services, path losses and the propagation environment. This phenomena shown in Figure 13 is studied in [P2].
NB BS
WCDMA BS NB BS
dead zones
WCDMA coverage area
INB,i Li
pmax
Figure 13. Dead zones in the WCDMA coverage due to downlink narrowband interferers.
When a narrowband interference is present, the received Eb/N0 in WCDMA MS should fulfill the following equation:
,)1(
)/()/(
,
1
1 ,
maxi
iNB
K
j iji
i
ii
NILP
LP
LpRW ρα
=+++−
⋅
∑−
=
(31)
37
where ρi is the Eb/N0 -requirement of the downlink for the service Ri, pmax is the maximum allowed link specific DL power, Li is the path loss from the own base station to the MS i, Lj,i is the path loss from the WCDMA base station j to the MS i, P is the Tx power of the equally loaded network, INB,i is the interference component from the adjacent interfering network and N is the thermal noise power. The orthogonality factor for the user i is αi and K is the number of cells in the WCDMA system.
By providing expressions for INB,i for each of the interference mechanisms, it is possible to solve the minimum allowed path loss problem from the jamming, adjacent base stations. These path loss curves can then be converted to the physical size of the dead zone area by using appropriate propagation model maps. The analysis shows the dead-zone areas for both interfering microcellular and macrocellular base stations. Paper [P9] shows the existence of dead zones in urban environment by using the static system simulator.
The results show that the site locations of the narrowband network have a large impact on the interference levels in the WCDMA MS. Also, the cell size used for WCDMA significantly affects the dead-zone areas. 4.1.3. Uplink Capacity
The uplink interference from a TDMA system, such as GSM or WCDMA is non-continuous. Therefore proper channel coding in WCDMA will decrease or remove the effect of pulsed interference. This is not the case when the interference is continuous, e.g. in cases where an IS-95 mobile (Narrowband CDMA system) is the main source of uplink interference. In [P3] the uplink interference levels in two coupled CDMA systems (IS95 and WCDMA) are studied by writing a pair of coupled equations for the WCDMA system with:
WWISothWownW INIII =+++ 95 (32)
and respectively for the IS-95 system with:
IIWCDMAothIownI INIII =+++ . (33)
IownW, IownI is the interference from the own cell and IothW, IothI is the interference from the other cells in the case of WCDMA and IS95 systems respectively. IIS95 is the interference from the IS95 system to WCDMA system and IWCDMA is the interference from the WCDMA to the IS95 system. NW and NI are the thermal noise power in the WCDMA and IS95 systems respectively.
The interference levels at the WCDMA BS are dependent on the intra-system interference and the IS-95 interference due to the power leakage from the adjacent channel and vice versa. The interference levels can then be solved from the above equations (32) and (33) as a function of the coupling loss ratios between these two systems. The statistics from the coupling loss ratios can be retrieved from the path loss maps. Also the effect of downlink blocking has been introduced into this analysis. This means that when an IS-95 MS is close to a WCDMA BS it can become blocked by the out of band emissions from the WCDMA BS and hence, the interference contribution from that MS should be ignored. The uplink capacity is defined here as the maximum number of users for which the coverage reduction is below a certain predefined threshold that guarantees the quality of the network.
The results show that the network structure has a large impact on the capacity reduction because of the different propagation conditions in the macrocells and microcells. Macrocells are much better protected from uplink interference, since the minimum coupling loss (MCL) is large when compared to microcells. It is also observed that the microcell users do not interfere
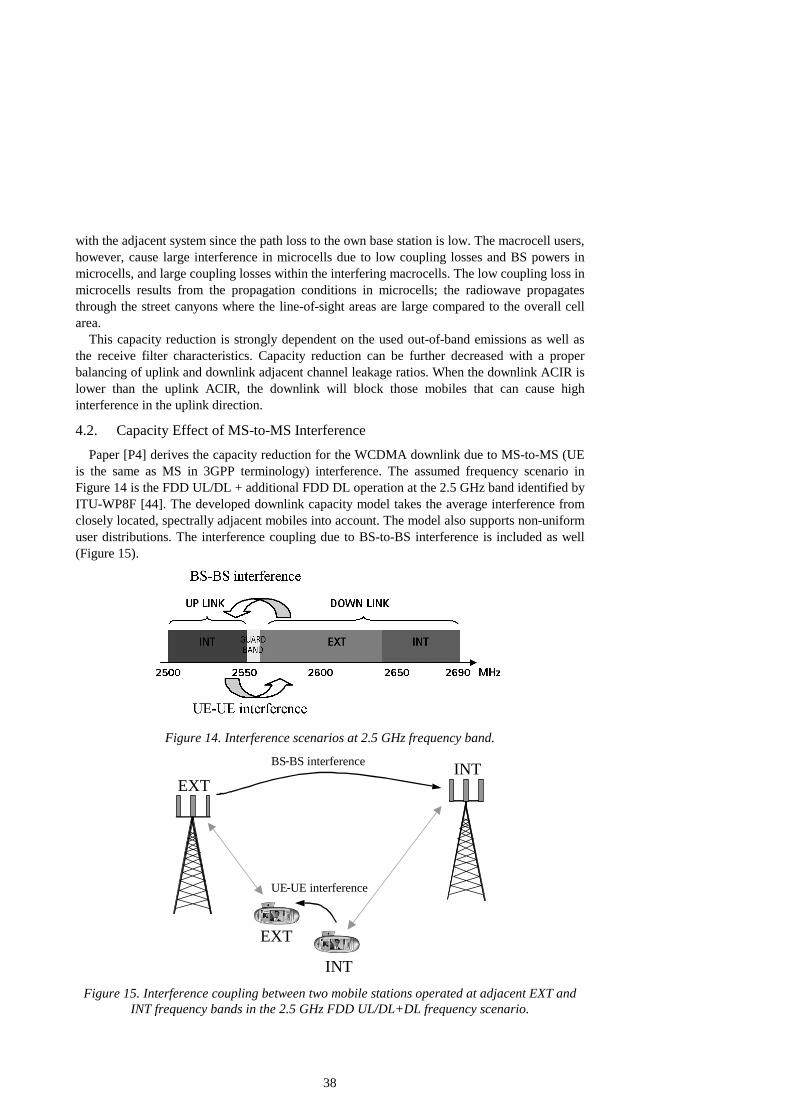
38
with the adjacent system since the path loss to the own base station is low. The macrocell users, however, cause large interference in microcells due to low coupling losses and BS powers in microcells, and large coupling losses within the interfering macrocells. The low coupling loss in microcells results from the propagation conditions in microcells; the radiowave propagates through the street canyons where the line-of-sight areas are large compared to the overall cell area.
This capacity reduction is strongly dependent on the used out-of-band emissions as well as the receive filter characteristics. Capacity reduction can be further decreased with a proper balancing of uplink and downlink adjacent channel leakage ratios. When the downlink ACIR is lower than the uplink ACIR, the downlink will block those mobiles that can cause high interference in the uplink direction.
4.2. Capacity Effect of MS-to-MS Interference Paper [P4] derives the capacity reduction for the WCDMA downlink due to MS-to-MS (UE
is the same as MS in 3GPP terminology) interference. The assumed frequency scenario in Figure 14 is the FDD UL/DL + additional FDD DL operation at the 2.5 GHz band identified by ITU-WP8F [44]. The developed downlink capacity model takes the average interference from closely located, spectrally adjacent mobiles into account. The model also supports non-uniform user distributions. The interference coupling due to BS-to-BS interference is included as well (Figure 15).
Figure 14. Interference scenarios at 2.5 GHz frequency band.
EXT INT
EXT
INT
BS - BS interference
UE - UE interference
Figure 15. Interference coupling between two mobile stations operated at adjacent EXT and
INT frequency bands in the 2.5 GHz FDD UL/DL+DL frequency scenario.

39
The developed downlink capacity model takes the average interference from closely located, spectrally adjacent mobiles into account. Typically, a spatially uniform user distribution is assumed when MS-to-MS interference is studied [43]. This is not, however, the actual situation. In fact the users in the radio cell are spatially non-uniformly located, e.g. indoor users are mainly located inside offices, shopping malls, restaurants etc. Business users are located within open-offices or conference rooms. Outdoor users are typically located in city squares, pedestrian streets or in parking areas. The developed model takes this non-uniform user distribution into account by assuming that the mobiles are located inside clusters. It is very important in radio system design to recognize these interference phenomena since, unlike the BS-to-MS interference between operators, the MS-to-MS interference is very difficult or perhaps even impossible to eliminate through network planning. The results indicate that the effect of the spatial user distribution, adjacent network loading, MS-to-MS propagation, cell size and the BS-BS isolation have to be taken into account when assessing the performance of radio systems where significant MS-to-MS interference is present.
4.3. Performance of 2 Mbit/s in Microcellular Environment The feasibility of a 2 Mbit/s DL transmission with WCDMA is studied in [P5]. The
performance of the high bit-rates is affected by intersymbol interference (ISI) when the propagation delays in the radio channel represent a large fraction of the chip duration. The multipath spread is determined by the propagation environment. The time dispersion is estimated by using the ray-tracing propagation model in [P6] which computes the field strength and delay of each propagation path. The statistics for the allocated RAKE fingers have been collected from the delay profile data predicted by the ray model. Then, link level simulations were carried out with various channel profiles and the performance of the 2 Mbps transmission in microcells was established based on these. The results show that 2 Mbps is feasible when the receiver is in the LOS or around the corner of a single building. When the receiver is further away the time dispersion of the radio channel increases, which in turn decreases the RAKE receiver performance due to the ISI. The performance of the high bit-rate with low spreading factors can be enhanced by deploying the chip equalizer in the reception instead of a RAKE receiver.

40
5. CONCLUSIONS
n this thesis analytical methods for the analysis of the performance of WCDMA radio networks were developed. This work also includes the development of a suitable
propagation model for radio network planning. The path loss maps produced by the propagation models have been utilized in the radio performance models as input data.
These performance studies ([P1]-[P4], [P8] and [P9]) were part of a research project at Nokia where intersystem interference, especially from narrowband systems to WCDMA was studied. Spectrally adjacent systems decrease the capacity and the coverage of the interfered system both in the uplink and in the downlink direction. The aim of these studies was to determine the performance degradation due to adjacent channel operation. This strongly depends on the emission masks from the transmitter and the receiver filtering, both in the mobile and in the base station, as well as on other design parameters such as the linearity of the mobile/base station receiver. These parameters are dependent on the implementation of the BS or the MS. The target of the network and the infrastructure design is to find a compromise between hardware complexity, required guard bands and the needed number of BS sites. One special application of these studies was the utilization of additional new frequency bands outside of the UMTS core band. These bands are, for example, the PCS band in the U.S. and the existing GSM band in Europe.
The developed radio wave propagation model was described in this thesis. The model can be used for microcellular radio network planning and system design purposes. The model estimates the received field strength for both outdoor and indoor receiver locations when the transmitter is located outside the buildings. Typically, ray-tracing propagation models are relatively slow compared to statistical models since the calculation of ray paths is computationally complex. The developed model utilizes a computationally efficient algorithm to define the main propagation paths. The accuracy of the model is, however, sufficient for network planning purposes. The developed propagation model can be utilized in radio system research and also in system design.
I
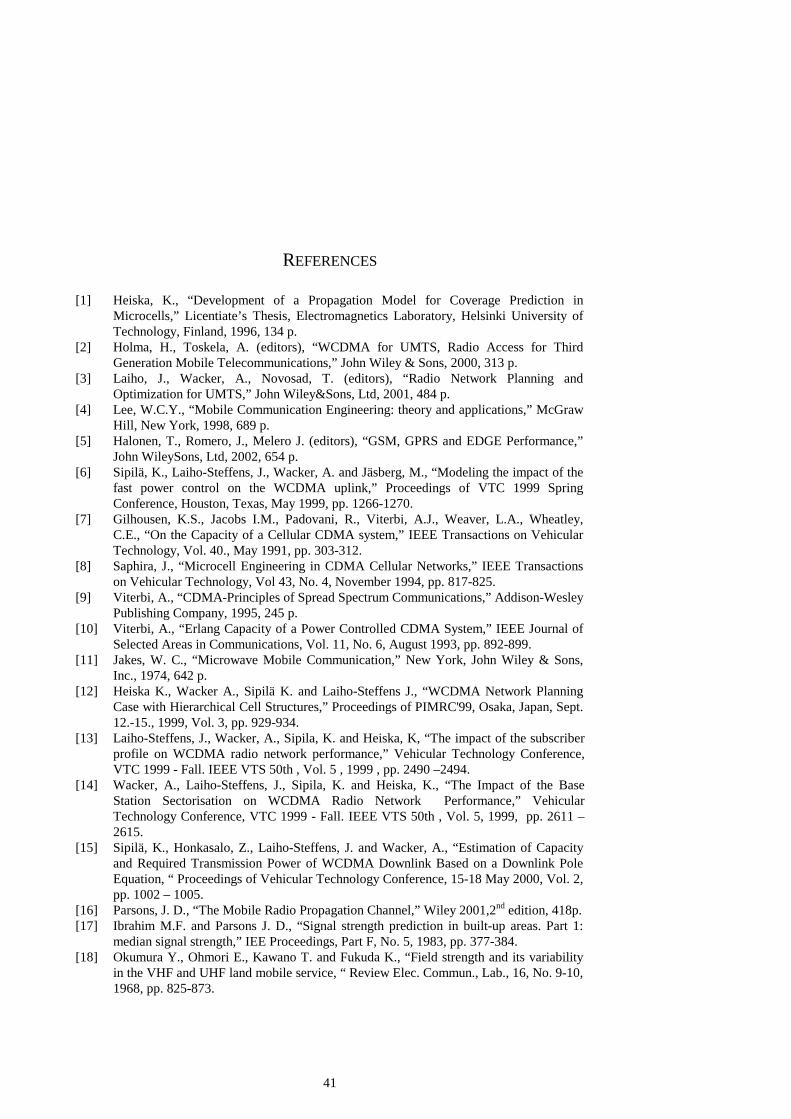
41
REFERENCES
[1] Heiska, K., “Development of a Propagation Model for Coverage Prediction in Microcells,” Licentiate’s Thesis, Electromagnetics Laboratory, Helsinki University of Technology, Finland, 1996, 134 p.
[2] Holma, H., Toskela, A. (editors), “WCDMA for UMTS, Radio Access for Third Generation Mobile Telecommunications,” John Wiley & Sons, 2000, 313 p.
[3] Laiho, J., Wacker, A., Novosad, T. (editors), “Radio Network Planning and Optimization for UMTS,” John Wiley&Sons, Ltd, 2001, 484 p.
[4] Lee, W.C.Y., “Mobile Communication Engineering: theory and applications,” McGraw Hill, New York, 1998, 689 p.
[5] Halonen, T., Romero, J., Melero J. (editors), “GSM, GPRS and EDGE Performance,” John WileySons, Ltd, 2002, 654 p.
[6] Sipilä, K., Laiho-Steffens, J., Wacker, A. and Jäsberg, M., “Modeling the impact of the fast power control on the WCDMA uplink,” Proceedings of VTC 1999 Spring Conference, Houston, Texas, May 1999, pp. 1266-1270.
[7] Gilhousen, K.S., Jacobs I.M., Padovani, R., Viterbi, A.J., Weaver, L.A., Wheatley, C.E., “On the Capacity of a Cellular CDMA system,” IEEE Transactions on Vehicular Technology, Vol. 40., May 1991, pp. 303-312.
[8] Saphira, J., “Microcell Engineering in CDMA Cellular Networks,” IEEE Transactions on Vehicular Technology, Vol 43, No. 4, November 1994, pp. 817-825.
[9] Viterbi, A., “CDMA-Principles of Spread Spectrum Communications,” Addison-Wesley Publishing Company, 1995, 245 p.
[10] Viterbi, A., “Erlang Capacity of a Power Controlled CDMA System,” IEEE Journal of Selected Areas in Communications, Vol. 11, No. 6, August 1993, pp. 892-899.
[11] Jakes, W. C., “Microwave Mobile Communication,” New York, John Wiley & Sons, Inc., 1974, 642 p.
[12] Heiska K., Wacker A., Sipilä K. and Laiho-Steffens J., “WCDMA Network Planning Case with Hierarchical Cell Structures,” Proceedings of PIMRC'99, Osaka, Japan, Sept. 12.-15., 1999, Vol. 3, pp. 929-934.
[13] Laiho-Steffens, J., Wacker, A., Sipila, K. and Heiska, K, “The impact of the subscriber profile on WCDMA radio network performance,” Vehicular Technology Conference, VTC 1999 - Fall. IEEE VTS 50th , Vol. 5 , 1999 , pp. 2490 –2494.
[14] Wacker, A., Laiho-Steffens, J., Sipila, K. and Heiska, K., “The Impact of the Base Station Sectorisation on WCDMA Radio Network Performance,” Vehicular Technology Conference, VTC 1999 - Fall. IEEE VTS 50th , Vol. 5, 1999, pp. 2611 –2615.
[15] Sipilä, K., Honkasalo, Z., Laiho-Steffens, J. and Wacker, A., “Estimation of Capacity and Required Transmission Power of WCDMA Downlink Based on a Downlink Pole Equation, “ Proceedings of Vehicular Technology Conference, 15-18 May 2000, Vol. 2, pp. 1002 – 1005.
[16] Parsons, J. D., “The Mobile Radio Propagation Channel,” Wiley 2001,2nd edition, 418p. [17] Ibrahim M.F. and Parsons J. D., “Signal strength prediction in built-up areas. Part 1:
median signal strength,” IEE Proceedings, Part F, No. 5, 1983, pp. 377-384. [18] Okumura Y., Ohmori E., Kawano T. and Fukuda K., “Field strength and its variability
in the VHF and UHF land mobile service, “ Review Elec. Commun., Lab., 16, No. 9-10, 1968, pp. 825-873.
42
[19] Tigerstedt, K. and Heiska, K., “Static WCDMA system simulator for indoor environments,” Vehicular Technology Conference, 2001. VTC 2001 Spring. IEEE VTS 53rd , Vol. 4, 2001, pp. 2800 –2803.
[20] Hata M., “Empirical formula for propagation loss in land mobile radio services,” IEEE Transactions on Vehicular Technology, Vol. VT-29, No. 3, August 1980, pp. 317-325.
[21] COST 231 A, “Urban transmission loss models for mobile radio in the 900- and 1800-MHz bands (Revision 2),” COST 231 TD(93) 119, Rev. 1, Florence, Jan. 24th, September, 1991.
[22] Walfish, J. and Bertoni, H. L., “A Theoretical Model of UHF Propagation in Urban Environment,” IEEE Trans. on Antennas and Propagation, Vol. 36, no.12, December 1988, pp. 1788-1796.
[23] Berg, J.E., “Path loss and fading in microcells,” COST 231 TD(90) 65, Darmstadt, September, 1990.
[24] Wirdemark, P., “Fitting a twoslope inverse power law to microcell LOS measurement,” COST 231 TD (90) 123, Darmstadt, December 1990.
[25] James, G.L., “The geometrical theory of diffraction for electromagnetic waves,” IEEE Electromagnetic Waves Series, Vol. 1, 3d ed., Peter Peregrinus Ltd.
[26] Keller, J.B., “The geometrical optics theory of diffraction,” Journal of Optical Society America, 52(2), 1962, pp. 116-130.
[27] G. Wölfe, R. Hoppe and F.M. Landstorfer, “A Fast and Enhanced Ray Optical Propagation Model for Indoor and Urban Scenarios,” in Proceedings of the 10th PIMRC 1999, Osaka, Japan, Sept, 1999, F5-3.
[28] Rautiainen, T., Wölfe, G., Hoppe, R., ” Verifying path loss and delay spread predictions of a 3D ray tracing propagation model in urban environment,” in Proceedings of Vehicular Technology Conference, VTC 2002-Fall, Vol. 3, pp. 2470-2474.
[29] Daniele, P., Frullone, M., Heiska, K., Riva, G. and Carciofi, C., “Investigation of Adaptive 3D Microcellular Prediction Tools Starting From Real Measurements,” Universal Personal Communications, 1996. Record., 1996 5th IEEE International, Conference on , Vol. 1 , 1996 , pp. 468 –472.
[30] Balanis, C.A., “Advanced Engineering Electromagnetics,” John Wiley & Sons, 1989, 981 p.
[31] van Dooren, G.A.J. (ed.), “Electromagnetic field strength prediction model for urban environments,” Final report for ESA/ESTEC contr. PO 123078, Eindhoven University of Technology, 1993, 134p.
[32] Ruck, G.T., Barrick, D.E., Stuart, W.D. and Krichbaum C.K., “Radar Cross Section Handbook,” Volume II, Plenum Press, New York - London, 1970, 949 p.
[33] Lindell I.V. and Heiska K., “Simple Image Theory for the Rough Interface of Two Isotropic Media,” Microwave and Optical Technology Letters, Vol. 14, No.6, April 1997, pp. 333-337.
[34] Lindell, I.V., “Radiowave Propagation,” (in Finnish), Helsinki, Otakustantamo 1985, 207 p.
[35] Kouyoumjian, R. G. and Pathak P. H., “A Uniform Geometrical Theory of Diffraction for an Edge in a Perfect Conducting Surface,” Proc. of the IEEE, Vol. 62, No. 11, November 1974, pp. 1448-1461.
[36] McNamara, D.A., Pistorius, C.W.I. and Malherbe, J.A.G., ”Introduction to The Uniform Geometrical Theory of Diffraction,” Artech House, 1990, 471 p.
[37] Holma, H. and Heiska, K., “Performance of high bit rates with WCDMA over multipath channels,” Vehicular Technology Conference, 1999IEEE 49th, Vol. 1, 1999, pp. 25 -29.
[38] Sipilä K. and Heiska K., “Can Ray-Tracing be Used as a Fading Generator in Simulating Micro Cellular Mobile Radio Systems,” in Proc. of the 8th International Conference on Wireless Communications, Calgary, 8-10 July, 1996, pp. 538-544.
43
[39] Heiska, K, and Kalliola K., “Wideband Propagation Modelling in Urband Microcells by using Ray-Tracing," European Co-operation in the field of Scientific and Technical Research, Cost 259, TD(97), Lissabon, 1997.
[40] Juntunen, J.O., Nikoskinen, K.I. and Heiska, K., “Binomial Array as a Multistate Phase Diversity Antenna,” IEEE Transactions on Vehicular Technology, Vol. 49, Issue: 3, May 2000, pp. 698 –705.
[41] Nikoskinen, K.I., Lempiainen, J.J.A., Heiska, K., “Beam diversity simulations in microcellular environment,” Antennas and Propagation Society International Symposium, Vol. 1, 1996, pp. 449 –452.
[42] Hämäläinen Seppo, “WCDMA Radio Network Performance,” PhD thesis, University of Jyväskylä, 2003, 235 p.
[43] 3GPP TR25.942, “RF System Scenarios,” release 1999, v3.0.0, March 2001. [44] ITU-R 8F/TEMP/290-E, Preliminary draft revision of recommendation ITU-RM.1036-
1:”Frequency arrangements for implementation of the terrestrial component of IMT-2000 in the bands 806-960 MHz, 1710-2025 MHz, 2110-2200 MHz and 2560-2690 MHz”.