On the e ects of competition between agent-based double...
26
On the effects of competition between agent-based double auction markets ✩ Kai Cai a , Jinzhong Niu b,* , Simon Parsons c,d a Department of Computer Science, Graduate Center, CUNY, 365 Fifth Avenue, New York, NY 10016, USA b CAISS, Department of Computer Science, City College, CUNY, 137th Street and Convent Avenue, New York, NY 10031, USA c Department of Computer and Information Science, Brooklyn College, CUNY, 2900 Bedford Avenue, Brooklyn, NY 11210, USA d Department of Computer Science, University of Liverpool, Ashton Building, Ashton Street, Liverpool, L69 3BX, UK Abstract Real market institutions, stock and commodity exchanges for example, do not occur in isolation. The same stocks and commodities may be listed on multiple exchanges, and traders who want to deal in those goods have a choice of markets in which to trade. While there has been extensive research into agent-based trading in individual markets, there is little work on this kind of multiple market scenario. Our work seeks to address this imbalance in the context of double auction markets. This paper examines how standard economic measurements, like allocative efficiency, are affected by the presence of multiple markets for the same goods, especially when the markets are competing for traders. We find that while dividing traders between several small markets typically leads to lower efficiency and worse convergence than grouping them into one large market, competition between markets for traders, can reduce these losses. Keywords: Competing markets, double auction, agent-based simulation 1. Introduction Auctions provide effective ways for allocating resources or exchanging goods and have been widely used in stock exchanges and electronic commerce. 1.1. Double auctions Among the many different types of auction is the double auction (DA)(Friedman, 1993), in which both buyers and sellers are allowed to exchange offers simultaneously. Since double auctions allow dynamic pric- ing on both the supply side and the demand side of the marketplace, their study is of great importance, both to theoretical economists, and those seeking to implement real-world market places. The two most common types of DA are the continuous double auction (CDA) and the clearing-house (CH). In a CDA, traders can make deals at any point during the auction, while in a CH, the market clears at a pre-specified time, allowing all traders to place offers before any matches are found. The CDA is one of the most common exchange ✩ A revised and expanded version of a paper that appeared in the Proceedings of the 10th Workshop on Agent-Mediated Electronic Commerce and then in (Ketter et al., 2008), which included selected papers from the workshop. * Corresponding author. Email addresses: [email protected] (Kai Cai), [email protected] (Jinzhong Niu), [email protected] (Simon Parsons) URL: http://web.cs.gc.cuny.edu/~jniu/ (Jinzhong Niu), http://sci.brooklyn.cuny.edu/~parsons/ (Simon Parsons) Preprint submitted to Elsevier April 8, 2014
-
Upload
nguyenhanh -
Category
Documents
-
view
215 -
download
0
Transcript of On the e ects of competition between agent-based double...

On the effects of competition between agent-based double auction marketsI
Kai Caia, Jinzhong Niub,∗, Simon Parsonsc,d
aDepartment of Computer Science, Graduate Center, CUNY, 365 Fifth Avenue, New York, NY 10016, USAbCAISS, Department of Computer Science, City College, CUNY, 137th Street and Convent Avenue, New York, NY 10031, USA
cDepartment of Computer and Information Science, Brooklyn College, CUNY, 2900 Bedford Avenue, Brooklyn, NY 11210, USAdDepartment of Computer Science, University of Liverpool, Ashton Building, Ashton Street, Liverpool, L69 3BX, UK
Abstract
Real market institutions, stock and commodity exchanges for example, do not occur in isolation. The samestocks and commodities may be listed on multiple exchanges, and traders who want to deal in those goodshave a choice of markets in which to trade. While there has been extensive research into agent-basedtrading in individual markets, there is little work on this kind of multiple market scenario. Our work seeksto address this imbalance in the context of double auction markets. This paper examines how standardeconomic measurements, like allocative efficiency, are affected by the presence of multiple markets for thesame goods, especially when the markets are competing for traders. We find that while dividing tradersbetween several small markets typically leads to lower efficiency and worse convergence than groupingthem into one large market, competition between markets for traders, can reduce these losses.
Keywords: Competing markets, double auction, agent-based simulation
1. Introduction
Auctions provide effective ways for allocating resources or exchanging goods and have been widelyused in stock exchanges and electronic commerce.
1.1. Double auctions
Among the many different types of auction is the double auction (DA) (Friedman, 1993), in which bothbuyers and sellers are allowed to exchange offers simultaneously. Since double auctions allow dynamic pric-ing on both the supply side and the demand side of the marketplace, their study is of great importance, bothto theoretical economists, and those seeking to implement real-world market places. The two most commontypes of DA are the continuous double auction (CDA) and the clearing-house (CH). In a CDA, traders canmake deals at any point during the auction, while in a CH, the market clears at a pre-specified time, allowingall traders to place offers before any matches are found. The CDA is one of the most common exchange
IA revised and expanded version of a paper that appeared in the Proceedings of the 10th Workshop on Agent-Mediated ElectronicCommerce and then in (Ketter et al., 2008), which included selected papers from the workshop.∗Corresponding author.Email addresses: [email protected] (Kai Cai), [email protected] (Jinzhong Niu), [email protected](Simon Parsons)URL: http://web.cs.gc.cuny.edu/~jniu/ (Jinzhong Niu), http://sci.brooklyn.cuny.edu/~parsons/ (SimonParsons)
Preprint submitted to Elsevier April 8, 2014

institutions and is in fact the primary institution for trading of equities, commodities and derivatives in ex-changes such as the New York Stock Exchange (NYSE) and Chicago Mercantile Exchange (CME). The CH
placed the role of the CDA at exchanges like the NYSE decades ago when trading was at a much smaller scaleand could be dealt with on the physical trading floor. Now it is used mainly at these exchanges, for example,to set stock prices at the beginning of daily trading.
The importance of double auctions in the real world has made it a popular research subject in microe-conomics. However the complex dynamics in such auctions makes it difficult to apply traditional analyticalmethods (Friedman, 1993), leading to the birth of a field called experimental economics in the 1960s, pio-neered by Smith (1962a). In this field, researchers typically run simulations to examine market dynamics.
1.2. Agent-based computational economics
Early work in experimental economics involved manual execution of auctions and recruitment of humansubjects to sit in as traders, in alignment with, for example, in stock exchanges decades ago where tradersshout at each other in the trading pit to make deals. Later on electronic markets started to emerge both in thereal world and in academic research, and software agents were deployed in these markets. Some of the agent-based work, e.g., (Cliff, 1997; Gode and Sunder, 1993), had the same focus as in (Smith, 1962a), examiningthe properties of double auctions with controlled configurations while other work, including (Gjerstad andDickhaut, 1998; Preist and van Tol, 1998a; Rust et al., 1993; Schvartzman and Wellman, 2009; Tesauroand Bredin, 2002; Vytelingum et al., 2004), aimed to improve the profitability or robustness of tradingstrategies in double auctions. The complex interaction between auction mechanisms and traders makes thetask of designing auction mechanisms a complex one, and several authors have suggested computationalapproaches to this task (Conitzer and Sandholm, 2004, 2007), several of which make use of techniquesfrom machine learning (Phelps et al., 2002, 2006; Walia et al., 2003). These pieces of work formed a solidfoundation for the experimental analysis in our work.
Here we note that agent-based computational economics (Tesfatsion, 2002), that is the use of agent-based computational models of economic systems, is becoming well-established. As Gintis (2007) pointsout:
Agent-based modeling is not an alternative to analytical modeling but rather an empirical in-vestigation of the characteristics of a complex system in a controlled laboratory setting.
Thus, agent-based models extend more traditional approaches (Leombruni, 2002). The advantage of thisextension, as Adomavicius et al. (2009) and Farmer (2001) observe, is that agent-based models can be usedto investigate problems that are out of reach to either current analytical techniques or to experiments withhuman traders.
1.3. Competing markets
All of the work we have mentioned has concentrated on single, isolated, markets, and this is true of mostof the work on double auctions that we are aware of. However this is typically not the case in the real world;on the contrary multiple connected markets usually compete against each other trading the same goods. Forinstance, company stock is frequently listed on several stock exchanges. US companies may be listed onboth the NYSE, NASDAQ and, in the case of larger firms, non-US markets like the London Stock Exchange(LSE). Indian companies, for example, can be listed on both the National Stock Exchange (NSE) and theBombay Stock Exchange (BSE) (Shah and Thomas, 2000). Until their merger in 2008, many commoditiescould be traded on both the CME and the New York Mercantile Exchange. Such multiple markets for thesame goods have a complex dynamics. The simplest example of this is, of course, the work of arbitrageurs
2

who exploit price differences between markets to buy low in one and sell high in another, thus evening theprices between markets.1 More complex, and less predictable dynamics occur in situations like that whenthe newly created Singapore International Monetary Exchange (SIMEX) claimed much of the trade in indexfutures on Nikkei 225 from Japanese markets in the late 1980s or when the NSE opened and proceeded toclaim much of the trade volume from the established BSE (Shah and Thomas, 2000), Changes like this takeplace over a long period of time, and stem from considerations such as the liquidity provided by the markets,and the (lack of) regulation that the market is subject to. Inter-market dynamics can also have much shortertimescales, as was the case in the flow between the CME and the NYSE during the global stock market crashof 1987 (Miller et al., 1988). Ramos (2003) presented an overview of competition between stock exchanges,explored the driven forces behind the competitions as well as their effects and how competitions are limiteddue to regulations.
This kind of interaction between markets has not been widely studied as yet, but, as Bakos (1998) sug-gests, seems to be increasingly relevant. In particular, there has been no systematic study of the use ofautomated traders in multiple connected, competing markets, though a number of different scenarios havebeen investigated. (Cassar and Duffy, 2001) uses agent-based methods to examine the effects of linkedmarkets on financial crises, while (Wilhite, 2001) looks at the effect of different trade routes on price con-vergence. (Moyaux and McBurney, 2006a,b) study the bull-whip effect (Lee et al., 1997)2 in supply chains.The most closely related research we know of is (Judd and Kearns, 2008), (Wilhite, 2006), (Ladley andBullock, 2006), (Caillaud and Jullien, 2003), and (Ellison et al., 2004). Judd and Kearns (2008) describeexperiments with human traders that clearly show that restrictions on who is allowed to trade with who —restrictions that are different from those imposed in our work, but clearly have some similarities — havea significant effect on market clearing performance while Wilhite (2006), though mainly concentrating onresults from network versions of the Prisoner’s Dilemma, describes agent-based experiments in the samekind of scenario as studied in (Judd and Kearns, 2008) with similar results. Ladley and Bullock (2006)studies how the similar restrictions affect the convergence of price to the theoretical equilibrium, runningsoftware agents in a CDA market network. Caillaud and Jullien (2003) and Ellison et al. (2004) on the otherhand made analytical analyses of the interaction between two competitors — markets in the former workand information service providers in the latter — and the results of the competitions — whether one marketdominates the other or both co-exist at some kind of equilibrium. We discuss in detail how this relates toours in Section 6 once we have described our own work.
We started to study competing markets by the organization of the TAC Market Design Competition, orthe CAT Tournament, an annual event that has been held from 2007 through 2011. In these competitions,participants each design and operate an electronic, double-auction market and these markets trade the sametype of goods and compete for traders and profit. Some initial results on such competing markets werepresented in (Niu et al., 2007, 2008b; Miller and Niu, 2012). The work we report here further extends theuse of agent-based methods to study groups of connected markets.
More specifically, the contribution made by this paper is to begin to explore the results of competitionbetween double auction markets populated by automated traders. Modeling trader behavior using simplereinforcement learning, and looking at standard metrics of market performance, we examine the ways inwhich a system of several small competing markets differs from that of one large market which contains the
1Though we do not study them here, futures exchanges make it possible for dealers in a particular commodity to offset their risksby trading options — commitments to buy or sell at a future date at a certain price — in that commodity, and these provide furtheropportunities for arbitrage. For examples of experimental work on the kind of speculation that occurs in futures markets, see (Milleret al., 1977; Williams, 1979; Williams and Smith, 1984).
2Where small fluctuations in supply in one market can have an effect that magnifies through the network.
3

same set of traders. In our model, competition between markets is captured by allowing traders to movebetween markets, and by allowing markets to differ in the charges that they impose on traders — broadlyspeaking, over time traders will learn to choose markets in which they make bigger profits and to avoidmarkets that charge them more — and we examine how this competition affects the performance of thesystem of small markets. The specific questions that we investigate in this paper are:
Q1. Is the allocative efficiency of a large double auction market reduced by splitting it into a numberof smaller markets, and does such a system of smaller markets trade further from the theoreticalequilibrium?
Q2. How does competition, as modeled by allowing traders to move between markets and permitting dif-ferent charges to be applied by markets, affect allocative efficiency and the distance from equilibriumat which markets trade?
Q3. How much of the effects of competition are due to the differences in the number of traders that marketsattract?
The answers to these questions are the specific contributions of the work we describe. In particular we showthat: a set of markets is less efficient than a single market containing the same set of traders and trades aremade further from equilibrium; competition between markets increases the overall efficiency of the set ofmarkets and in some cases can help them to trade closer to equilibrium; and these effects of competition arenot solely due to the differences in the number of traders that markets attract.
2. The market model
In our experimental analysis, we extend the market model that we previously designed for the CAT
Tournament and use JCAT (Niu et al., 2008a),3 the open-source software platform we built for the CAT
Tournament, to simulate competing markets populated by automated traders. This market model basicallyfollows that introduced in (Smith, 1962b), adopted by subsequent researchers in experimental economics(Gode and Sunder, 1993) and then by researchers who use software agents to investigate approaches totrading in markets (Cliff, 1997). Since we see our work extending this tradition, we chose to use the samebasic market model.
In our work, as in the three papers cited above, all traders, whether human or machine, are nominatedto be either buyers or sellers, i.e., one-way traders. Traders have chances to trade over a span of multipletrading days. On each day, each seller is given some number of indivisible goods that they are allowed toexchange for money, and is given a value for each item — the trader’s limit price or private value. Buyershave a similar private value for a number of goods, but rather than goods, they are given an allocation ofmoney which they may exchange for goods. A typical restriction, which we adopt, is that no seller maysell an item for less than its private value and no buyer is permitted to pay more than the private value foran item. These conditions are what Smith (1962b) calls “conditions of normal supply and demand”, theconditions in which the market is at equilibrium. Each day sellers bring to market the same goods, and thesegoods cost the same to produce. Each day, buyers look to buy the same goods at the same price. Days arenot identical however because traders may be aware of what happened on the previous day and thus maylearn over the course of several days the optimal way to trade. Each day is further broken up into a series ofrounds. A round is an opportunity for traders to make offers (shouts) to buy or sell.
3http://jcat.sourceforge.net/.
4
In prior work including the three pieces we mentioned above, all traders go to a single market day afterday throughout the experiments. In our extended market model, a number of markets run simultaneouslyand traders are allowed to move between these markets — choosing a market at the beginning of each day,staying there to trade during the day, and possibly moving to another market on the next day — so as totrade in a better venue to maximize their profits. Thus traders in our market model have two tasks. One isto decide how to make offers. The mechanism they use to do this is their trading strategy. The other taskis to choose a market to make offers in. The mechanism for doing this is their market selection strategy.Among the known trading strategies for double auctions from the literature, we considered three of them inour experiments:
• Zero Intelligence with Constraint (ZI-C) strategy by Gode and Sunder (1993). Traders employingthis strategy submit bids or offers that are generated randomly subject to a simple constraint. Thisconstraint states that bids are drawn from a uniform distribution between the buyer’s private valueand a specified lower bound (typically 0) while offers are restricted to the range between a seller’sprivate value and a specified higher bound (a value higher than any trader thinks the good in questionis worth).
• Zero Intelligence Plus (ZIP) strategy by Cliff (1997). ZIP traders use a simple heuristic to adjust theiroffers. Broadly speaking, traders increase their profit margin if recent market activity suggest thatdoing so will still allow them to trade, and reduce their profit margin if recent market activity suggeststhey are making offers too far from where the market is trading. The traders employ a simple form ofmachine learning to adjust their shouts, smoothing out fluctuations in the market.
• Reinforcement learning-based strategy (RE) by Roth and Erev (1995). This strategy considers theproblem of what offer to make as being a reinforcement learning problem. It experiments, makingoffers and recording how many times they are successful, and then makes choices based on the ex-pected value of each possible offer, computed using the probability of past success. We set the freeparameters of the RE strategy as described in (Nicolaisen et al., 2001).
The reason for picking the first of these strategies is that given by, among others, Walia et al. (2003) — sinceZI-C is not making bids with any intelligence, any effects we see have to be a result of market structure, ratherthan a consequence of the trading strategy, and hence will be robust across markets inhabited by differentkinds of trader. The reason for picking ZIP and RE is that given by Phelps et al. (2004). The first of thesestrategies is typical of the behavior of automated traders, while the second is a good model of human biddingbehavior. Between them, then, the three trading strategies are broadly representative of the range of tradersone might find in a real market — human traders (RE), intelligent program traders (ZIP), and traders with nointelligence (ZI-C) — and, as we discuss in more detail in Section 6, we believe that these will provide uswith broadly applicable results.
The market selection strategy represents a new capability of traders in the multi-market environmentand our implementation is based on a simple model for reinforcement learning. Traders treat the choice ofmarket as an n-armed bandit problem that they solve using an ε-greedy exploration policy (Sutton and Barto,1998, Chapter 2). Using this approach the behavior of the agents is controlled by two parameters ε and α.A trader chooses what it estimates to be the best market, in terms of daily trading profit, with probability1 − ε, and randomly chooses one of the remaining markets otherwise. ε may remain constant or be variableover time, depending upon the value of the parameter α (Sutton and Barto, 1998, Section 2.2). If α is 1,ε remains constant, while if α takes any value in (0, 1), ε will reduce over time. In all the experiments wedescribe in later sections, we set α to 1, and ε to 0.1. The results from our previous work on the interactions
5

between multiple markets (Niu et al., 2007; Miller and Niu, 2012) suggest that market selection behavior israther insensitive to the parameters we choose here and so we feel justified in only considering one set ofparameter values.
The ε-greedy market selection strategy equips traders with mobility that is essential to take advantage ofthe multi-market environment. To demonstrate the effects of such mobility, we contrast this with a marketselection strategy which always chooses to remain in the same market, and these two strategies give rise totwo types of trader mobility:
• Mobile: traders choose a market at the start of each day (this may be the same market in which thetraders participated the previous day) using the above ε-greedy exploration policy.
• Stationary: traders randomly select one of the markets available on the first day and remain there tillthe end of each experiment.
On the side of market mechanism, a large variety of double-auction mechanisms could be deployed tocompete, given the nature of the CAT Tournament that JCAT was designed for. The mechanisms may differfrom each other on when they clear their markets, at which price to clear the markets or to make each singletransaction, how matchable shouts are paired up, what shouts could be placed in the markets. A classificationof auction mechanisms, either from the literature or from the participants of the CAT Tournament, werepresented in (Niu et al., 2012). In our experiments, we consider only the two classic double auctions, theCDA and the CH, since the relative competitiveness of auction mechanisms is not the focus of this work. Inaddition, JCAT allows markets to charge traders, a feature that is not uncommon in studying competitionbetween markets or service providers, e.g., in (Caillaud and Jullien, 2003). Indeed, JCAT allows charges in avariety of ways, we used four types of charge in the work reported here:
• Shout fees: charges made by the market for each shout made by a trader.
• Information fees: charges made by the market for information about shouts made by other traders inthe market (required by the ZIP trading strategy).
• Transaction fees: charges made by the market for each transaction executed by a trader.
• Profit fees: charges made by the market on the bid/ask spread of any transactions they execute. Thename arose since the bid/ask spread is the transaction surplus, and with the k = 0.5 rule we use forallocating the surplus (Satterthwaite and Williams, 1993), the surplus is thus directly related to theprofit realized by both agents.4
In all our experiments, we set shout, information and transaction fees to constant, low, figures — $0.1, $2and $0.1 respectively. These are values typical of those adopted by entrants in the first CAT Tournament,and, as Niu et al. (2008b) argued, are sufficient to provide a small negative reinforcement that encouragestraders to leave markets in which they are not managing to make trades. Noting that the rules in the CDA
and the CH mechanisms do not change over time during trading and the three types of charge are fixedas well, we introduce the variety of auction mechanisms via the fourth type of charge, the profit fee. Weare particularly interested in the competitions between free markets, between markets charging fixed fees,and between markets adjusting fees dynamically over time. Thus we consider three different schemes for amarket to set the profit fee:
4Discussion of the k = 0.5 rule naturally gives rise to the question of how different rules for allocating surplus between traders willaffect the outcome of the experiments. Our previous work suggests that there is very little effect.
6

Table 1: The configurable facets of the market model, two on behavior of trader and two on market mecha-nism.
Facet Choice Note
Trading strategyZI-C Naive zero-intelligent strategy with constraint making random offers.ZIP Heuristics-based strategy dynamically adjusting profit margin.RE Reinforcement learning-based strategy using profit as feedback.
Trader mobilitymobile Traders move between markets maximizing profit.
stationary Traders stay with their initial market all the time.
Market mechanismCDA Continuous double auction that clears the market continuously.CH Clearing house that clears the market periodically at the equilibrium.
Charging schemefree Markets do not charge at all.fixed Markets impose fixed charges as a percentage of the profit of traders.
LL Markets adjust their charges over time in a Lure-or-Learn-Fast way.
• Free: No profit fees are charged at all at any time.
• Fixed: A constant proportion, say 10%, of the surplus on a transaction, is taken as a fee.
• Lure-or-learn fast (LL): A LL market either adjusts its charge to be just lower than that of the marketthat is the most profitable (learn), or if it is the most profitable market, it raises its charges slightly(lure). The adjustment of charge adopts the Widrow-Hoff rule used in the ZIP strategy (Cliff andBruten, 1997).
We summarize the four configurable facets of the market model in Table 1. Each of the experiments thatwe will discuss in Sections 4 and 5 is a controlled simulation configured with a combination of the choiceson the four facets.
3. Measurements
Before we discuss the details of the experiments, we define the measurements that we use to evaluatethe effectiveness of a market. The effectiveness of a market can be measured in a number of different ways.The most common ones include allocative efficiency and coefficient of convergence. Allocative efficiency,Ea, is used to measure how good a market is at generating a surplus (Plott and Smith, 1978). The actualsurplus, Pa, of an auction is:
Pa =∑
i
|vi − pi| (1)
for all agents who trade, where pi is the price of a trade made by agent i and vi is the private value of agenti. The equilibrium surplus, Pe, is:
Pe =∑
i
|vi − p0| (2)
for all buyers whose private value is no less than the equilibrium price, p0, and all sellers whose privatevalue is no greater than p0. The equilibrium price is the price at which the number of goods sold equals the
7
number of goods bought and can be computed from the private values of the traders assuming that no tradermakes a loss. (When, as is often the case, the balance of supply and demand occurs across a price range, weset the equilibrium price to be the middle of the range.) Ea, is then Pa/Pe expressed as a percentage.
Ea =Pa
Pe× 100 (3)
This tells us how close a market is to theoretical equilibrium in terms of surplus made — the more efficientthe market, the closer Ea is to 100. However, it says nothing about how close a market is to trading atthe equilibrium price. For the latter we use the coefficient of convergence, denoted as α (Smith, 1962a). αmeasures the deviation of transaction prices from the equilibrium price:
α =
√1n∑
i (pi − p0)2
p0× 100 (4)
where n is the number of traders in the market. The closer a market is to trading at equilibrium, the closer αis to 0.
Remember that our work aims to compare the performance of a system including multiple small, com-peting markets with traders distributed between them to that of a system of a big, single market — the usualcase studied in most of prior work — with the same set of traders all patronizing that single market. Thedefinitions above allow us to measure the performance in the latter case, but new definitions are neededto measure in the former case in a comparable way. Clearly the multi-market system would achieve themaximal surplus when all the traders move to one of the markets and can trade with each other without mar-ket barriers, forming exactly the single-market system. Thus the equilibrium surplus for the multi-marketsystem can simply be calculated using (2) pretending that all traders distributed between the multiple smallmarkets are all in a single, imaginary market, or the global market. This global equilibrium surplus isachieved when the global market is cleared at the global equilibrium price, denoted as pg
0, at which theglobal demand equals the global supply. Now with the actual surplus for the multi-market system being thesum of the actual surpluses of all these markets, the allocative efficiency for the multi-market system, or theglobal allocative efficiency, Eg
a, can be calculated as:
Ega =
∑j∑
i |vji − p j
i |∑j∑
i |vji − pg
0|(5)
where v ji is the private value of agent i in market j and p j
i is the price paid by agent i in market j. Similarlywe calculate the coefficient of convergence for the multi-market system, or the global coefficient of conver-gence, denoted as αg, by measuring how close transactions made in those small markets are close the globalequilibrium price:
αg =
√1ng
∑j∑
i (p ji − pg
0)2
pg0
× 100 (6)
where ng is the total number of traders in all markets.The global measurements are appropriate for our purposes because we are interested in examining how
far multiple markets diverge from the performance of an individual market. In contrast, simply calculatingthe average of Eas or αs of the small markets would not reveal useful information since the comparison willnot be based on the same (global) equilibrium. However, it should be noted that the global measurements
8
defined above in (5) and (6) are rather harsh since the small markets can, for example, be individuallyefficient but globally somewhat inefficient because of the distribution of traders. For example, consider a setof buyers b1, b2 and b3 with private values $10, $40 and $60 respectively, and a set of sellers s1, s2 and s3,with private values $20, $30 and $70, where each trader is entitled to trade one unit of goods. If all tradein a single market, the efficient matching is b3 with s1 and b2 with s2, generating a surplus of $50. If thethree traders are distributed between two markets, one containing b1, b2, s1 and s2 and the other containingb3 and s3, then even with efficient matching in both markets, the surplus is only $30.
4. Experiment Set I: System of multiple markets vs. system of a single market
To answer the questions we raised in Section 1, we used JCAT to run two sets of experiments based onthe market model we introduced in Section 2, the first set to answer Q1 and Q2 and the second set to answerQ3.
4.1. Experimental setupIn the first set of experiments, we aim to compare the performance of a system including multiple small
markets with that of a single large market under a wide range of scenarios. Both the multi-market systemand the single-market system would be populated by the same set of traders and configured in a similar wayfor them to be comparable. Here we say a market being ‘small’ simply to mean that only a fraction of traderstypically trade in that market and a market being ‘large’ to mean that all traders trade there.
The scenarios we considered in this set of experiments include all the four facets listed in Table 1. Allthe choices available on the facets make 36 combinations, each being a unique scenario. For instance, onesuch scenario is that all markets run the CDA, charge fixed profit fees, and are patronized by a populationof homogeneous ZIP traders that are stationary. Under each scenario, we ran an experiment, for which weobtained results for both a multi-market system, traders split across five markets, and a single-market system,all the traders concentrating in one market. The idea behind this configuration and the various scenarios isthat they allow us to identify the differences between the multi-market system and the single-market systemacross different market mechanism and trader types, identifying which differences only occur for a giventype of trader, and which are robust enough to occur for all types of traders. (And recall, from Section 2,that we chose the trading strategies to broadly model all the kinds of trader that we might find in a realmarket.) We measured the behavior of both mobile and stationary traders in order to establish the effect ofcompetition between markets for traders, as modeled by the different charging schemes used by markets.When traders cannot move, they cannot respond to differences in charging, and there is no competition.When traders are mobile, the market selection strategy biases them towards lower charging markets, and thecharging schemes that they use allow markets to compete for traders.
We denote the five small markets in the multi-market system respectively as M0, M1, M2, M3 and M4.When the markets impose fixed charges, M0 through M4 charge a profit fee at the levels of 10%, 20%, 30%,40%, and 50% respectively. When the markets use the LL charging scheme, the initial charges used by eachmarket follow the same pattern. As the charges aim to differentiate the small markets in the multi-marketsystem, there is no charge involved in the single-market system.
Each of the 36 experiments lasted 400 trading days, with each day being split into 50 0.5-second-longrounds. We repeated each experiment 50 times. Each trader is permitted to buy or sell at most five unitsof goods per day, and its private value for the goods is drawn from a uniform distribution between $50and $150. Each trader is assumed to have the same private value for all the units of goods that it tradesthroughout a single iteration of a given experiment, with new values being picked for each iteration. Eachmulti-market system or single-market system is populated by 100 traders, evenly split between buyers and
9

Table 2: The configuration of parameters in each of our experiments.
Parameter Value Parameter Value
No. of Days 400 No. of rounds per day 50Duration of round 0.5 seconds No. of competing markets 5No. of buyers 50 No. of sellers 50Trader entitlement 5 Trader valuation U($50, $150)ε in ε-greedy exploration 0.1 α in ε-greedy exploration 1Charges of M0 through M4 10%, 20%, 30%, 40%, and 50% for fixed or initial LL charges
sellers and in the case of a multi-market system, the initial distribution of traders to markets is random witheach trader having an equal probability of being assigned to each market. The parameters we discuss hereare summarized in Table 2.
4.2. Results and analysis
Our analysis of the results of the first set of experiments starts by giving an overview of the changes inmulti-market systems over time, before turning to compare multi-market systems with single-market onesand consider the factors that relate most closely to our research questions.
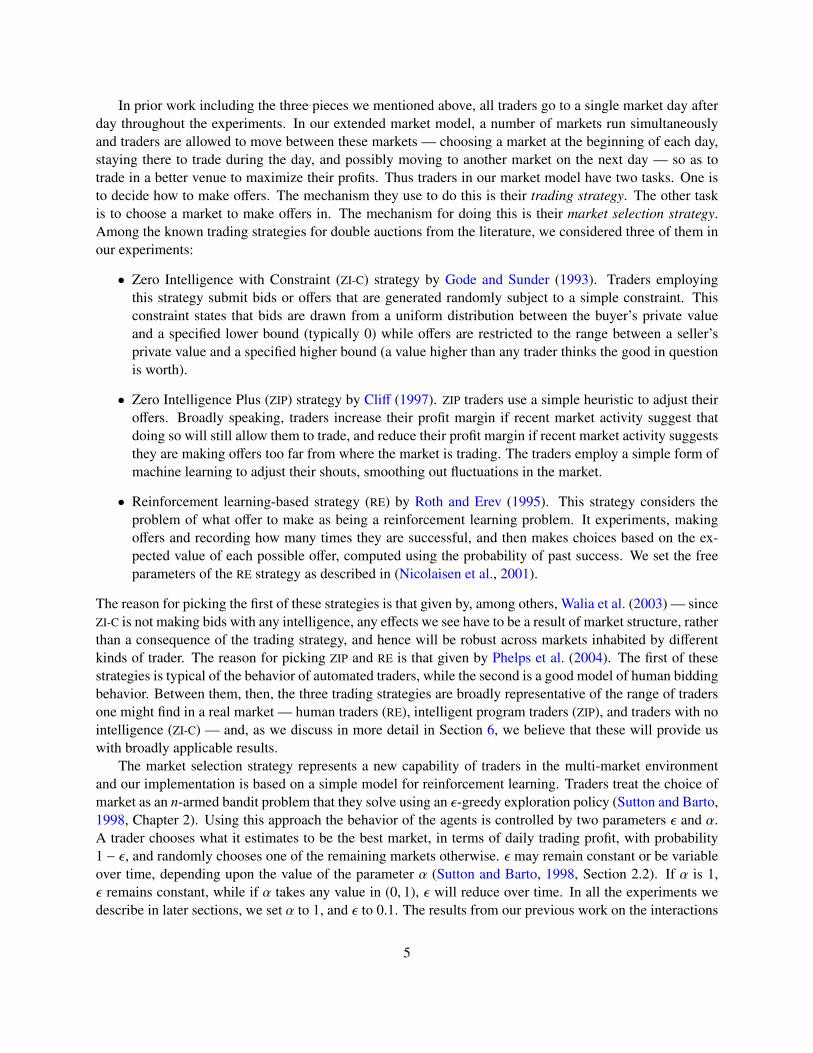
4.2.1. Overview of multi-market systemsFigure 1 gives one view of the experiments with multiple competing markets populated by mobile ZIP
traders. There are six different scenarios with mobile ZIP traders.5 We include plots for two of them —CDA markets with no charges, on the left, and CDA markets with the LL charging scheme, on the right. Therest give similar patterns, so we omit them due to limited space. The plots in the figure show the numberof traders leaving each of the five markets every day and they are superimposed over each other in eachsub-figure since the performances of the markets in this regard are largely indistinguishable. The reason toplot these values is that they summarize the amount of “churn” (to use the marketing term) in the markets.When the situation is settled, the number of traders moving will be low, when the situation is unsettled,the number of traders moving will be higher. All the six experiments with mobile ZIP traders show thatmovement decreases over time. It decreases most in the LL markets, and least in the markets that do notcharge and it decreases much more quickly in the markets that do charge than those that don’t. It neverdrops much below 2, which is consistent with having ε in the market selection mechanism fixed to 0.1 sothat traders continue to explore throughout each experiment.6
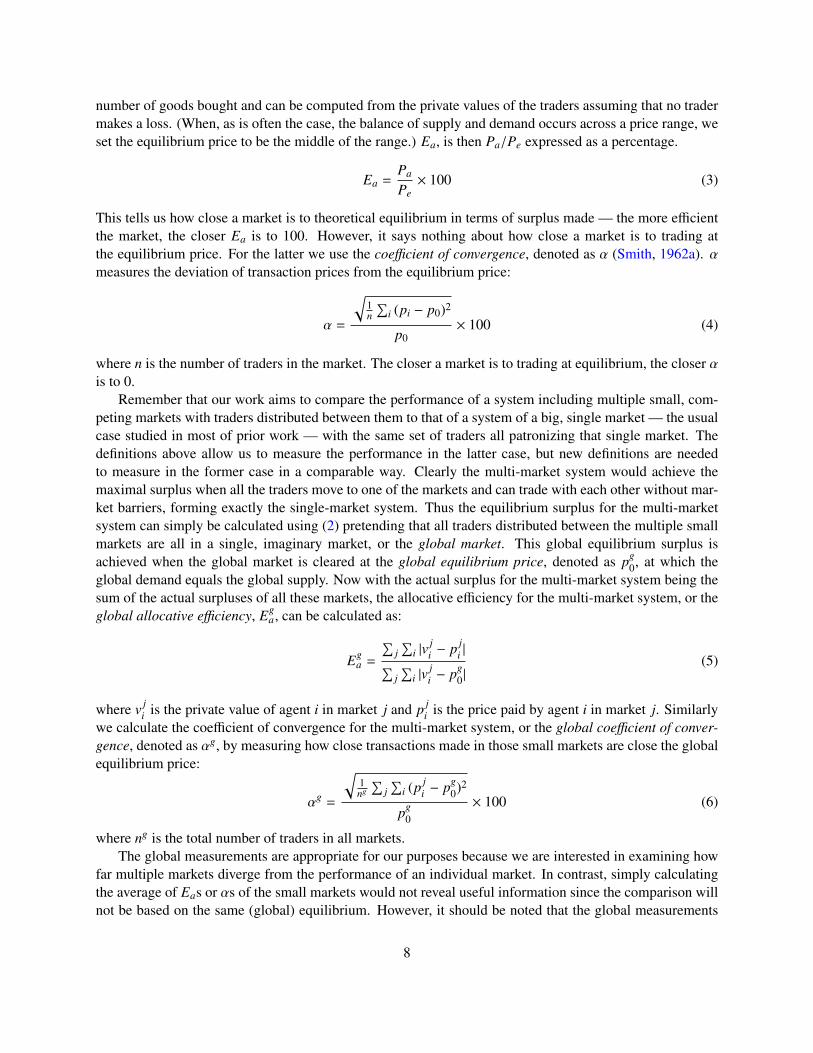
This movement of traders necessarily has an effect on the trading that takes place in each of the markets.Whereas we would expect a single market to rapidly approach equilibrium after just a few days at most —whether traders are software agents (Gjerstad and Dickhaut, 1998; Preist and van Tol, 1998b) or humans(Smith, 1962a) — in the multi-market case, this does not happen. Figure 2, which plots the daily changein equilibrium price in each market in Figure 1, is testimony to the way that the markets do not have a
5Remember that the markets may be CDAs or CHs and they may charge nothing, charge at fixed levels, or charge in the LL scheme,making six different combinations. See Table 1 for the facets we considered in configuring the market model.
6With 100 traders that have learned the best market to trade in, we’d still expect 10, that is 100 × 0.1, to change market each tradingday on average, which is, of course, approximately two for each market.
10

0 50 100 150 200 250 300 350 4000
0.5
1
1.5
2
2.5
3
3.5
4
4.5
5
(a) CDA markets with no charges0 50 100 150 200 250 300 350 400
0
0.5
1
1.5
2
2.5
3
3.5
4
4.5
5
(b) CDA markets with LL charges
Figure 1: How individual markets in the multi-market systems change over time — the number of traderschanging market. The x-axis gives the trading day, and the y-axis gives the number of traders that leaving agiven market on that day. Each point on the y-axis is the average of the ten surrounding days. All marketsfeatures mobile ZIP traders. Only the results for two of the six scenarios with mobile ZIP traders are shownhere due to limited space and the omitted ones exhibit similar patterns.
settled equilibrium. Again, we include the results of two of the six scenarios with mobile ZIP traders asrepresentatives. As shown in Figure 2, every market has a non-zero daily change, even at the end of the400-day period, and this is exactly why we run the simulations for so long. However, we do see a certainlevel of stability emerge in the markets that charge — by 300 days or so, while there are still changes fromday to day, the trend is for the average change in equilibrium price to settle towards a limit. This limit variesfrom market to market. For example in the experiment with CDA markets that use LL charging, the rightsub-figure in Figure 2, the limit ranges from around $10 in M0 to around $35 in M4.
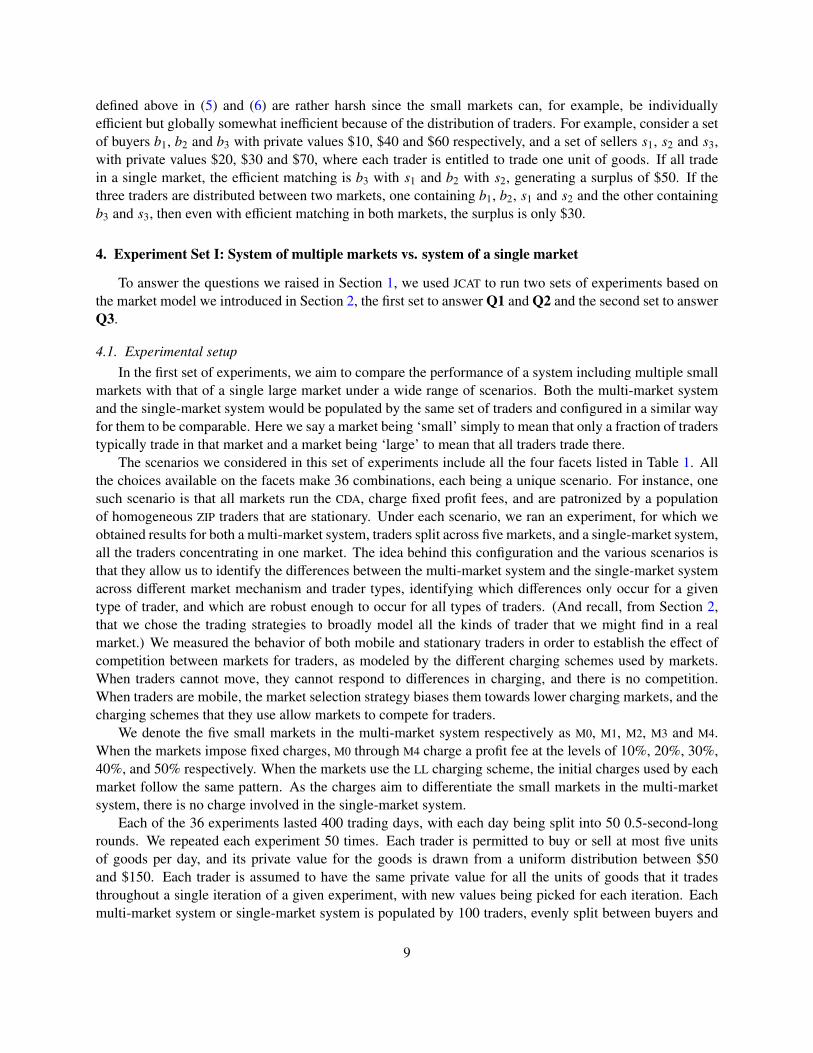
In case these changes in equilibrium price smack of anarchy in individual markets, consider Figures 3.Figures 3 plots the global allocative efficiency and the global coefficient of convergence for the same exper-iments as in Figure 1 and Figure 2. Again due to lack of space, we only show the results for the scenariowith all markets being CDAs and imposing no charges. As described above, global efficiency is computedby summing actual trader profits and then dividing by the theoretical profit that would be made if all thetraders were in the same market. It thus gives us a picture of our set of markets taken as a whole, and showsthat, despite the churn in individual markets, the overall picture has settled down after around 200 days. Theglobal coefficient of convergence similarly settles down, though it takes closer to 300 days to stop changingnoticeably. The global coefficient of convergence measures the average distance of each transaction fromwhere theory says it should take place, once again, if all the traders were in the same market. The fact thatit settles down to a reasonably constant value suggests that most transactions are taking place at a similarvalue from day to day.
Finally, we should note that the global allocative efficiency is a little low, and the global coefficient ofconvergence is a bit high, compared with those often reported for the trading strategies we use (in contrastthe values we obtain for the single market and which can be seen in Tables 3 and 4 are much the same asone would expect from the literature). We attribute this, at least in part, to churn. When a trader movesfrom one market to another, any learning it underwent in the old market about how to make offers is no use
11
0 50 100 150 200 250 300 350 4000
5
10
15
20
25
30
35
40
45
50
(a) CDA markets with no charges0 50 100 150 200 250 300 350 400
0
5
10
15
20
25
30
35
40
45
50
(b) CDA markets with LL charges
Figure 2: How individual markets in the multi-market systems change over time — the change in equilibriumprice. The x-axis gives the trading day, and the y-axis gives the change in equilibrium price between thatday and the previous day. Each point on the y-axis is the average of the ten surrounding days. All marketsfeatures mobile ZIP traders. Again, only the results for two of the six scenarios with mobile ZIP traders areshown here as representatives due to limited space.
0 50 100 150 200 250 300 350 40070
75
80
85
90
95
100
(a) global allocative efficiency0 50 100 150 200 250 300 350 400
0
2
4
6
8
10
12
14
16
18
20
(b) global coefficienct of convergence
Figure 3: How individual markets as a group change over time — allocative efficiency and coefficient ofconvergence. The x-axis gives the trading day, and the y-axis gives the measurement of concern on that day.All markets features mobile ZIP traders. Each figure shows the average value and one standard deviationabove and below the mean. Only the results for the scenario with all markets being CDAs and imposing nocharges due to limited space. The other scenarios exhibit similar pattern: efficiency gradually increases andcoefficient of convergence gradually decreases until both settle down. The starting level, the stable level,and the changing rate may vary scenario from scenario though.
any more, and may even be detrimental. Similarly, the influx of new traders into a market can invalidate thelearning previously undertaken by traders that have not moved. This means that offers are made away from
12

equilibrium, pushing the coefficient of convergence up, and in turn this means that extra-marginal traderscan trade, pushing efficiency down.
Note that though we have only shown the results for mobile ZIP traders in Figures 1 through 3, the otherexperiments have very similar results. A full set of results is available from the authors upon request. Allthese results parallel those we reported in (Niu et al., 2007), and together these results suggest that the effectswe see hold for a wide range of charging regimes and market selection strategies.
As we have discussed above, the results from our first set of experiments bear on the first two questions,Q1 and Q2. These results show that splitting a large double auction market into a number of smaller marketshas a negative effect on allocative efficiency and the approach of the markets to the theoretical equilibrium.Across a range of trading strategies, and for both CDA and CH market types, splitting a large market intosmaller markets decreases allocative efficiency and increases the coefficient of convergence. Thus our resultssuggest a positive answer to Q1 and give us a baseline from which to answer Q2.
4.2.2. Comparing multi-market systems with single-market systemsHaving sketched the overall behavior of multiple competing markets in our experiments, we turn to
compare the performances of these multi-market systems with the performances of the corresponding single-market systems. For each of the 36 experiments outlined above, we collected data and calculated allocativeefficiency and coefficient of convergence for each individual market in the multi-market system, M0 throughM4, the same measurements for the single-market system, and the global measurements defined as in Sec-tion 3 for the overall multi-market system. These results allow us to see how the performance of a set ofmarkets, as measured by the global measurements, differs from the same measurements for a single market,and the effect of competition on those measurements for the set of markets. Note that the single market valuediffers from the global measurement in that the actual trader profits and equilibrium prices are obtained in thesingle market rather than in the individual markets (while the theoretical profit and global equilibrium priceis the same in both cases). As usual, we report the measurements obtained from some of the experimentdue to lack of space. Tables 3 and 4 list the results for experiments with ZIP traders, allocative efficiency inthe former and coefficient of convergence in the latter. The values in the two tables are averaged over thelast 100 days of each experiment when, as described above, the experiments have approached some kind ofsteady state, as well as across the 50 runs of each experiment.
The first point to make is that, just as one would expect from usual theoretical analysis, say Rustichiniet al. (1994), the efficiency of the single market of 100 traders is generally greater than the efficiency ofany of the individual markets simply as a result of the larger number of traders in the single market and theeffect that efficiency tends to increase along with the number of traders. This, in turn, means that in mostcases,7 the global efficiency across the set of markets M0 to M4 is less than that of the single market.8 Thetheoretical profit is the same in both cases, so for the global efficiency to be higher, the individual marketswould have to do a better job of matching traders than the single market. Clearly the churn will make anyoptimal matching of offers hard to sustain even if it occurs in the first place.
Similarly, the coefficient of convergence of the single market is typically lower than that of the globalmarket. Again this is not surprising. The variation measured by the coefficient of convergence is againstthe equilibrium price given all trader private values, and this will only be the equilibrium price of eachindividual market if traders are evenly distributed by private value. Spreading traders across markets, we
7Though there are some exceptions — LL markets with mobile ZIC traders have very good efficiency.8The sum of the theoretical profits of the individual markets is at most equal to the the theoretical profit of the single market. Withlower efficiency in the individual markets than in the single market, the global efficiency using the theoretical profit of the singlemarket as denominator can only be even lower.
13

Table 3: Allocative efficiency for markets with ZIP traders in single-market and multiple-market scenarios.
multiple marketssingle market
M0 M1 M2 M3 M4 global
CDA
Mobile
Fixed 97.06 96.24 96.11 94.60 93.24 ◦94.53 ?97.935.59 7.54 7.76 11.84 14.38 2.59 1.27
LL 96.14 95.66 95.18 94.92 95.38 ◦94.48 ?98.557.60 9.13 10.71 10.30 9.82 2.96 1.04
Free 96.04 96.39 96.17 95.88 95.63 ◦94.22 ?99.498.19 6.80 7.34 8.26 9.18 2.63 0.47
Stationary
Fixed 97.47 97.86 97.46 98.05 96.98 91.14 ?97.933.03 3.23 3.34 4.96 4.16 4.16 1.27
LL 97.66 97.85 97.80 97.97 97.87 90.37 ?98.552.96 2.72 2.76 3.25 2.65 4.15 1.04
Free 97.27 97.59 97.60 97.55 97.54 89.62 ?99.494.11 3.75 3.49 4.57 4.16 5.10 0.47
CH
Mobile
Fixed 98.85 98.53 97.52 96.38 95.09 ◦96.62 ?99.744.74 8.25 11.25 13.75 13.75 2.10 0.52
LL 98.32 97.73 98.30 97.13 97.73 ◦96.78 ?99.684.68 8.17 5.13 9.10 7.14 2.20 0.49
Free 97.96 97.79 98.41 98.24 98.17 ◦96.91 ?99.756.77 7.62 4.60 5.02 5.98 2.06 0.49
Stationary
Fixed 99.04 99.01 99.36 99.22 99.01 90.54 ?99.743.45 2.06 3.40 3.96 4.98 4.98 0.52
LL 99.35 99.16 99.21 99.32 99.03 92.50 ?99.681.79 2.82 2.67 2.04 4.11 4.19 0.49
Free 99.29 98.56 99.06 99.06 99.19 91.34 ?99.752.55 5.66 3.35 2.97 2.91 4.76 0.49
* Italic numbers are standard deviations. Numbers with a ? next to them indicate the better (higher) ofthe global and single market efficiencies on a given row — all of these comparisons are significant atthe 95% level. Numbers with a ◦ next to them indicate the better (higher) of the global efficienciesfor mobile and stationary traders in a given market configuration, and when these numbers are alsobold this is significant at the 95% level. Thus the ◦94.48 in the third line of the global market columnindicates that a set of CDA markets with LL and mobile traders is more efficient than its counterpartwith stationary traders (which has an efficiency of 90.37%), and that this result is significant at the95% level.
** In a single market it makes no sense for traders to move since there is no market to move to or from.As a result, figures for mobile and stationary traders are the same.
14

Table 4: Coefficient of convergence for markets with ZIP traders in single-market and multiple-market sce-narios.
multiple marketssingle market
M0 M1 M2 M3 M4 global
CDA
Mobile
Fixed 8.58 8.67 9.10 8.95 8.93 ◦9.67 ?4.544.26 4.63 4.89 5.18 5.68 2.26 2.01
LL 8.04 8.02 8.11 7.92 7.92 ◦9.32 ?4.004.14 4.36 4.52 4.60 4.43 2.17 2.02
Free 8.41 8.40 8.28 8.21 8.17 ◦10.16 ?3.963.99 3.83 3.83 3.88 3.89 1.97 2.24
Stationary
Fixed 7.09 6.69 6.86 6.84 7.87 14.47 ?4.544.21 3.79 3.95 3.80 6.49 3.39 2.01
LL 6.14 6.07 6.99 6.24 6.18 13.58 ?4.003.58 3.45 6.00 4.20 3.57 2.92 2.02
Free 7.60 7.06 7.97 7.89 7.20 16.53 ?3.964.22 4.09 5.24 4.28 4.03 4.59 2.24
CH
Mobile
Fixed 5.09 5.28 5.31 5.52 5.56 ◦6.22 ?2.873.12 3.37 3.69 4.05 4.38 1.62 1.65
LL 5.02 5.05 5.19 5.33 5.39 ◦6.22 ?2.783.69 3.71 3.78 3.91 4.09 1.85 1.55
Free 5.50 5.47 5.54 5.49 5.58 ◦6.46 ?2.813.64 3.61 3.64 3.61 3.64 1.71 1.57
Stationary
Fixed 3.43 3.94 3.42 3.85 3.91 15.45 ?2.872.32 3.28 2.40 2.95 3.36 4.16 1.65
LL 2.74 3.09 3.11 2.80 2.68 9.66 ?2.781.87 2.16 2.29 1.96 2.02 3.01 1.55
Free 3.77 4.23 4.06 4.05 3.71 13.44 ?2.812.56 3.47 3.20 2.77 2.69 3.76 1.57
* Refer to the notes in Table 3 on the usage of various fonts and markers like ? and ◦.
would expect that even if the equilibrium price was the same on average, its variance would increase as thenumber of markets increased. This effect shows up in the fact that individual markets with ZIP traders (whichquickly learn to trade close to equilibrium) often have a considerably lower coefficient of convergence thanthe global value.
The second important point to note is that, looking just at the global efficiency values, we see thatthe markets with mobile traders, i.e., the markets where there is effective competition between marketsfor traders, are more efficient than markets with stationary traders. This observation holds across all threetrading strategies. In all cases the difference in efficiency between the markets with mobile traders andthe corresponding markets with stationary traders is statistically significant (by which we mean, here and
15

elsewhere in the paper, that p ≤ 0.05). It therefore seems to be the case that competition between marketsleads to higher efficiency. Traders that move to maximize their own expected profit, which is the effect ofthe market selection strategy we use, end up improving the efficiency of the set of markets as a whole.
In addition, it seems that in some cases the effect of the competition between individual markets is evenmore marked when markets are allowed to charge the mobile traders. Thus for both CDA and CH marketswith mobile ZIC traders, the markets charging using the LL scheme have easily the highest efficiency, andthe improvement over the efficiency over the corresponding markets which make no charges is statisticallysignificant. Similarly for CDA markets with mobile ZIP traders, markets that use fixed charges or LL chargesare significantly (p ≤ 0.05) more efficient than markets which make no charges. The same is true of CDA
markets with mobile RE traders. (Again space dictates that measurements for markets with ZI-C or RE tradersare omitted here. They are available from the authors upon request.)
The results for the coefficient of convergence show some of the same features. In markets with ZIP andRE traders, when traders are free to move, the coefficient of convergence of the global market is alwayssignificantly lower than when the traders are held stationary. The same is true of markets with ZIC tradersexcept when the markets use the LL charging scheme. As is the case with efficiency, it seems that allowinga set of markets to compete for traders, and encouraging traders to move to the market in which they canmaximize their profit, means that overall the set of markets trade closer to equilibrium.
Finally, it appears that for some combinations of market mechanisms and trading strategies, allowingmarkets to charge also improves the coefficient of convergence. In both CDA and CH markets with mobileZIC traders, using a fixed charging scheme leads to a significantly lower coefficient of convergence than notcharging. When the traders use the ZIP or the RE strategy, then both fixed and LL charging markets — bothCDA and CH— have significantly lower coefficients of convergence than the same markets without charges.
In conclusion, our results suggest that competition between markets has the potential to partially reversethe negative effects of this splitting into smaller markets. Again across different market types and tradingstrategies, in the majority of cases we see that the global performance of markets with mobile traders —modeling the case in which there is competition between markets — is better than markets in which tradersare not permitted to move — modeling the case in which there is no competition. In very few cases thisimprovement due to competition is sufficient to overcome the negative effect of splitting up the large market,but in all cases it does significantly reduce the negative effects. In addition, it is also true that in many casesthe global performance of a set of competing markets is improved if the set of markets are allowed to makecharges on traders. Thus, answering Q2, our results suggest that competition between markets, though itundoubtedly has a negative effect on some individual markets, overall has a beneficial effect on the set ofmarkets as a whole.
5. Experiment Set II: Correlation between allocative efficiency and number of traders
The first set of experiments tell us about the efficiency and convergence to equilibrium of a set of marketsas opposed to a single market, and the effect of competition on the differences between those markets,answering Q1 and Q2 that we raise in Section 1. Further, we need to investigate whether the effect ofcompetition on efficiency is a direct effect or an indirect effect. What we mean by this is as follows. Itis clear that when markets charge at different rates, the number of traders in the markets will change —for example Niu et al. (2007) shows that, in exactly the experimental setup we have here, traders tend tomove from higher charging markets to lower charging markets (as one would expect). Thus any changes inefficiency that we observe in the first set of experiments, described above, might just be due to the changingnumbers of traders rather than anything else, which is exactly what Q3 tries to find out. Therefore, we rana second set of experiments to answer Q3, examining the extent to which market behavior depends upon
16
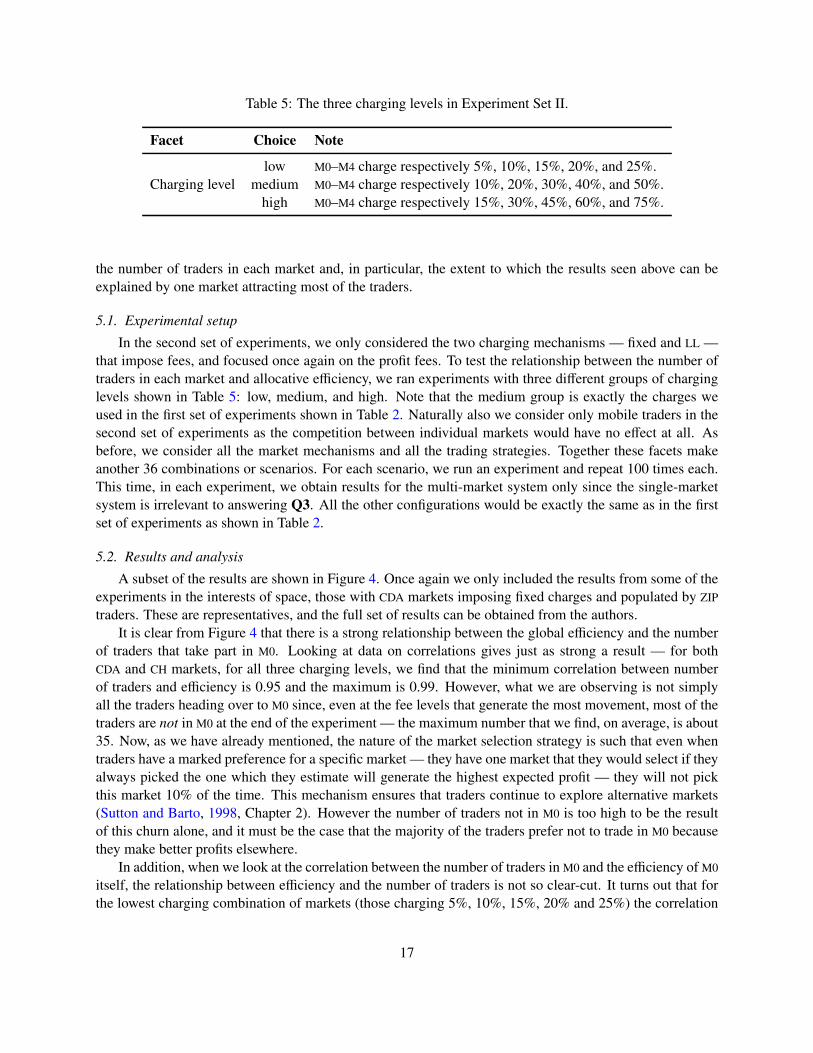
Table 5: The three charging levels in Experiment Set II.
Facet Choice Note
Charging levellow M0–M4 charge respectively 5%, 10%, 15%, 20%, and 25%.
medium M0–M4 charge respectively 10%, 20%, 30%, 40%, and 50%.high M0–M4 charge respectively 15%, 30%, 45%, 60%, and 75%.
the number of traders in each market and, in particular, the extent to which the results seen above can beexplained by one market attracting most of the traders.
5.1. Experimental setup
In the second set of experiments, we only considered the two charging mechanisms — fixed and LL —that impose fees, and focused once again on the profit fees. To test the relationship between the number oftraders in each market and allocative efficiency, we ran experiments with three different groups of charginglevels shown in Table 5: low, medium, and high. Note that the medium group is exactly the charges weused in the first set of experiments shown in Table 2. Naturally also we consider only mobile traders in thesecond set of experiments as the competition between individual markets would have no effect at all. Asbefore, we consider all the market mechanisms and all the trading strategies. Together these facets makeanother 36 combinations or scenarios. For each scenario, we run an experiment and repeat 100 times each.This time, in each experiment, we obtain results for the multi-market system only since the single-marketsystem is irrelevant to answering Q3. All the other configurations would be exactly the same as in the firstset of experiments as shown in Table 2.
5.2. Results and analysis
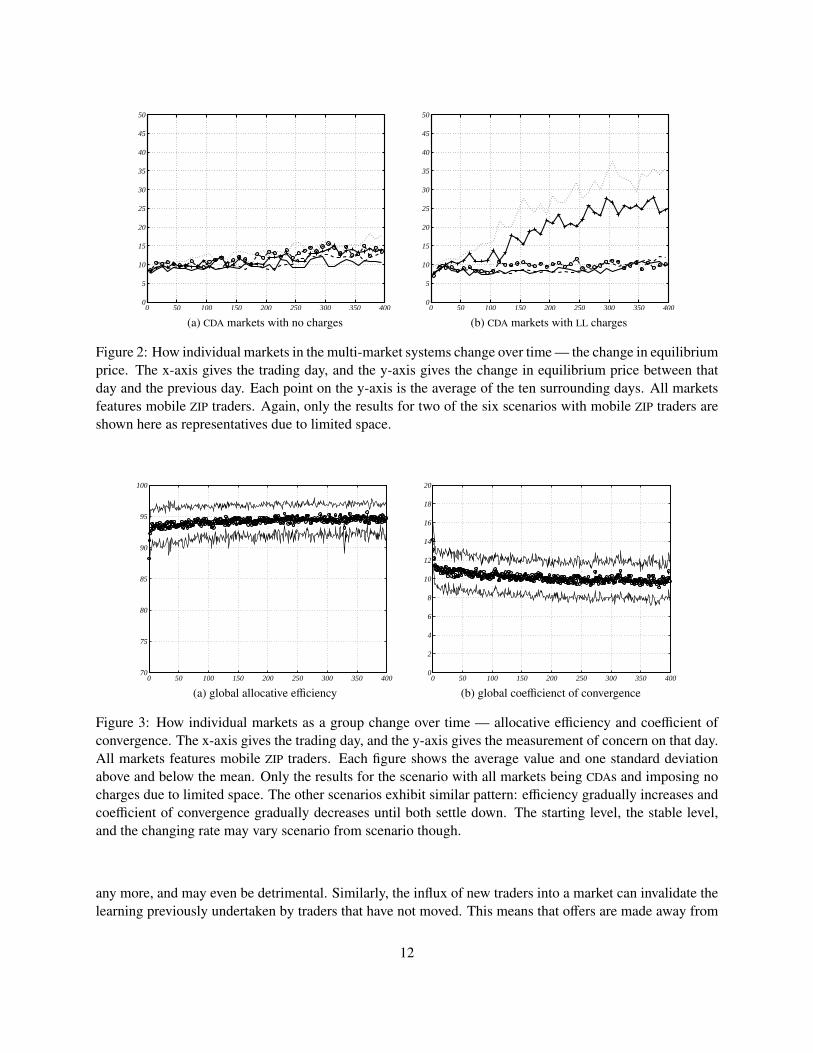
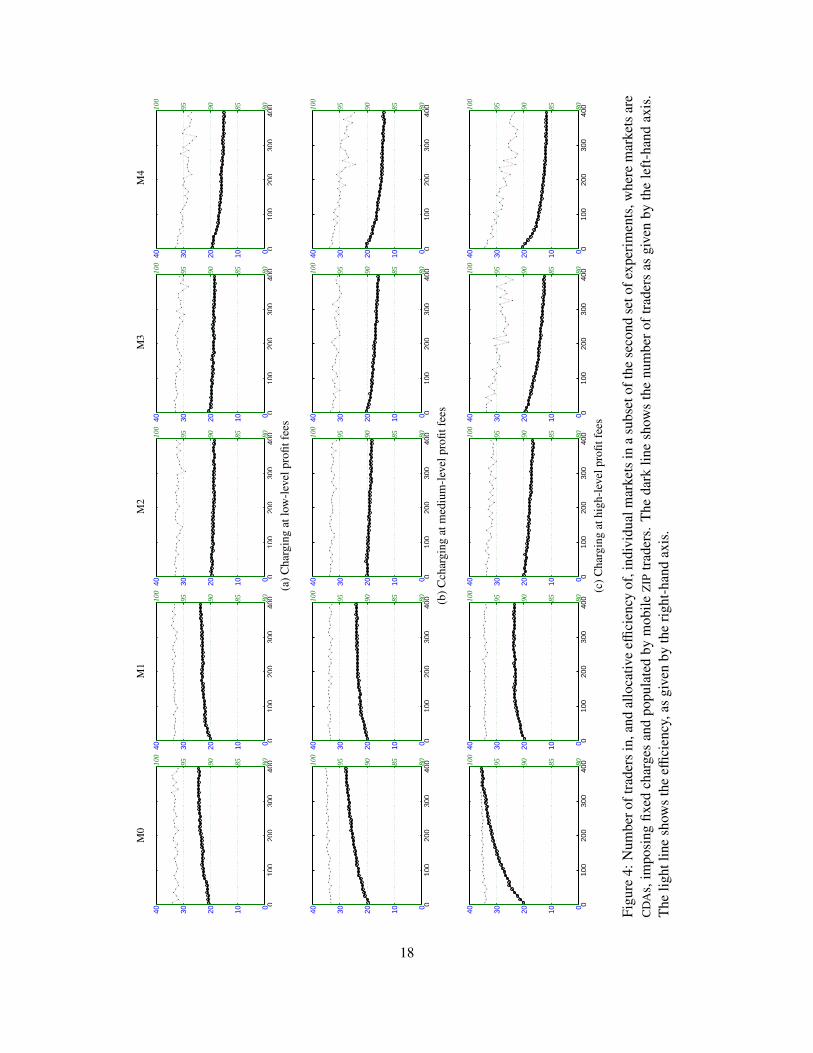
A subset of the results are shown in Figure 4. Once again we only included the results from some of theexperiments in the interests of space, those with CDA markets imposing fixed charges and populated by ZIP
traders. These are representatives, and the full set of results can be obtained from the authors.It is clear from Figure 4 that there is a strong relationship between the global efficiency and the number
of traders that take part in M0. Looking at data on correlations gives just as strong a result — for bothCDA and CH markets, for all three charging levels, we find that the minimum correlation between numberof traders and efficiency is 0.95 and the maximum is 0.99. However, what we are observing is not simplyall the traders heading over to M0 since, even at the fee levels that generate the most movement, most of thetraders are not in M0 at the end of the experiment — the maximum number that we find, on average, is about35. Now, as we have already mentioned, the nature of the market selection strategy is such that even whentraders have a marked preference for a specific market — they have one market that they would select if theyalways picked the one which they estimate will generate the highest expected profit — they will not pickthis market 10% of the time. This mechanism ensures that traders continue to explore alternative markets(Sutton and Barto, 1998, Chapter 2). However the number of traders not in M0 is too high to be the resultof this churn alone, and it must be the case that the majority of the traders prefer not to trade in M0 becausethey make better profits elsewhere.
In addition, when we look at the correlation between the number of traders in M0 and the efficiency of M0
itself, the relationship between efficiency and the number of traders is not so clear-cut. It turns out that forthe lowest charging combination of markets (those charging 5%, 10%, 15%, 20% and 25%) the correlation
17
M0
M1
M2
M3
M4
010
020
030
040
0010203040
80859095100
010
020
030
040
0010203040
80859095100
010
020
030
040
0010203040
80859095100
010
020
030
040
0010203040
80859095100
010
020
030
040
0010203040
80859095100
(a)C
harg
ing
atlo
w-l
evel
profi
tfee
s
010
020
030
040
0010203040
80859095100
010
020
030
040
0010203040
80859095100
010
020
030
040
0010203040
80859095100
010
020
030
040
0010203040
80859095100
010
020
030
040
0010203040
80859095100
(b)C
char
ging
atm
ediu
m-l
evel
profi
tfee
s
010
020
030
040
0010203040
80859095100
010
020
030
040
0010203040
80859095100
010
020
030
040
0010203040
80859095100
010
020
030
040
0010203040
80859095100
010
020
030
040
0010203040
80859095100
(c)C
harg
ing
athi
gh-l
evel
profi
tfee
s
Figu
re4:
Num
bero
ftra
ders
in,a
ndal
loca
tive
effici
ency
of,i
ndiv
idua
lmar
kets
ina
subs
etof
the
seco
ndse
tofe
xper
imen
ts,w
here
mar
kets
are
CD
As,
impo
sing
fixed
char
ges
and
popu
late
dby
mob
ileZ
IPtr
ader
s.T
heda
rklin
esh
ows
the
num
ber
oftr
ader
sas
give
nby
the
left
-han
dax
is.
The
light
line
show
sth
eeffi
cien
cy,a
sgi
ven
byth
eri
ght-
hand
axis
.
18
M0 M1 M2 M3 M4
0 5 10 15 20 2550
100
150
0 5 10 15 20 2550
100
150
0 5 10 15 20 2550
100
150
0 5 10 15 20 2550
100
150
0 5 10 15 20 2550
100
150
(a) With stationary traders
0 5 10 15 20 2550
100
150
0 5 10 15 20 2550
100
150
0 5 10 15 20 2550
100
150
0 5 10 15 20 2550
100
150
0 5 10 15 20 2550
100
150
(b) With mobile traders
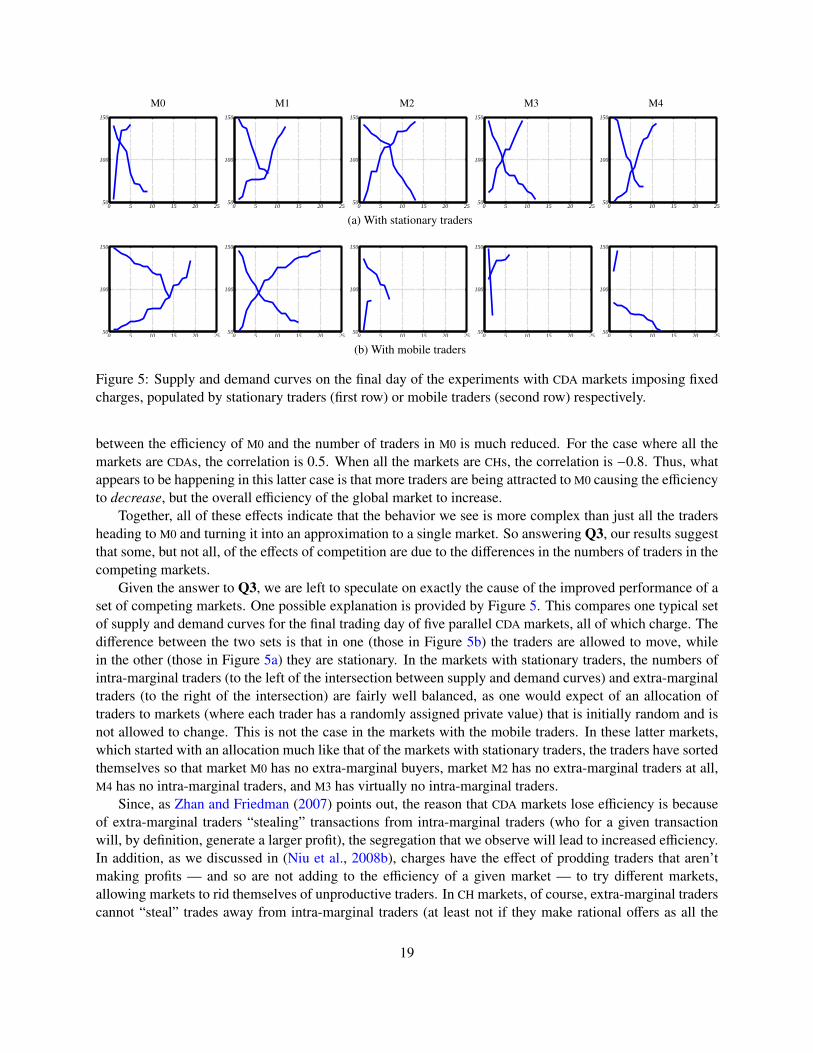
Figure 5: Supply and demand curves on the final day of the experiments with CDA markets imposing fixedcharges, populated by stationary traders (first row) or mobile traders (second row) respectively.
between the efficiency of M0 and the number of traders in M0 is much reduced. For the case where all themarkets are CDAs, the correlation is 0.5. When all the markets are CHs, the correlation is −0.8. Thus, whatappears to be happening in this latter case is that more traders are being attracted to M0 causing the efficiencyto decrease, but the overall efficiency of the global market to increase.
Together, all of these effects indicate that the behavior we see is more complex than just all the tradersheading to M0 and turning it into an approximation to a single market. So answering Q3, our results suggestthat some, but not all, of the effects of competition are due to the differences in the numbers of traders in thecompeting markets.
Given the answer to Q3, we are left to speculate on exactly the cause of the improved performance of aset of competing markets. One possible explanation is provided by Figure 5. This compares one typical setof supply and demand curves for the final trading day of five parallel CDA markets, all of which charge. Thedifference between the two sets is that in one (those in Figure 5b) the traders are allowed to move, whilein the other (those in Figure 5a) they are stationary. In the markets with stationary traders, the numbers ofintra-marginal traders (to the left of the intersection between supply and demand curves) and extra-marginaltraders (to the right of the intersection) are fairly well balanced, as one would expect of an allocation oftraders to markets (where each trader has a randomly assigned private value) that is initially random and isnot allowed to change. This is not the case in the markets with the mobile traders. In these latter markets,which started with an allocation much like that of the markets with stationary traders, the traders have sortedthemselves so that market M0 has no extra-marginal buyers, market M2 has no extra-marginal traders at all,M4 has no intra-marginal traders, and M3 has virtually no intra-marginal traders.
Since, as Zhan and Friedman (2007) points out, the reason that CDA markets lose efficiency is becauseof extra-marginal traders “stealing” transactions from intra-marginal traders (who for a given transactionwill, by definition, generate a larger profit), the segregation that we observe will lead to increased efficiency.In addition, as we discussed in (Niu et al., 2008b), charges have the effect of prodding traders that aren’tmaking profits — and so are not adding to the efficiency of a given market — to try different markets,allowing markets to rid themselves of unproductive traders. In CH markets, of course, extra-marginal traderscannot “steal” trades away from intra-marginal traders (at least not if they make rational offers as all the
19
traders do in our experiments). However, the movement of traders can still increase profits by allowinga trader that is extra-marginal in one market to become intra-marginal in another. Again, this behavior isencouraged by the combination of the market selection strategy and the charges imposed by the markets.
6. Discussion and conclusions
Having described the experiments we conducted and the results we obtained, we now relate our workto some of the prior work that we briefly mentioned in Section 1.3. Caillaud and Jullien (2003) and Ellisonet al. (2004) both studied some scenario in which a group of agents choose between multiple competingservice providers so as to get matched with desirable peers somehow. This theme is clearly identical to thatof our work. However the exact problems that these previous papers try to solve are much less complex thanthe scenarios we considered. Both previous papers considered exactly two competing service providers.Caillaud and Jullien (2003) focused on information service providers that compete for consumers whereeach consumer could be matched with one particular other and the consumers aim to use the services to lookfor their sole possible mates. In double auctions, however, each trader may typically be matched with anyone of multiple traders from the opposite side. Ellison et al. (2004) on the other hand studied the competitionbetween auction markets like we do here, however they use a mechanism of multi-item, second-price Englishauction to match supply from multiple sellers to demand from multiple buyers. This kind of auction is nota double auction, but a kind of sequential, single-sided auction. Ellison et al. (2004) further assumed thatall sellers have zero reserved cost for the goods they aim to sell, an assumption that does not apply in manyscenarios, including the one we study. Of course the assumptions or restrictions in both previous papersmay be necessary to make it tractable to use analytical methods to calculate the equilibria and examine theproperties at the equilibria — they did exactly this — but then these simplified models make it impossibleto use their conclusions as guidances to predict what would happen in the scenarios we study here which donot fit with those assumptions.
It is worth noting that the competition model in (Caillaud and Jullien, 2003) allows consumers to choosemultiple service providers simultaneously, i.e., multi-homing, a feature that can be observed in many do-mains. In our market model, multi-homing is not explicitly supported as on any trading day a trader cannot trade in more than one market. This configuration does not present much of a limitation as multipletraders may be considered to serve the same human or institution investor, for instance, which thus has away to patronize more than one market on any given day. This perspective may similarly be applied to therestriction of all traders being one-way in our market model, i.e., traders either buying or selling but neverdoing both simultaneously. We can capture two-way traders in our model as pairs of buyers and sellers. Ofcourse when multiple traders are related this way, their private values should be somehow correlated if notidentical. One piece of future work would be to investigate how having buyers and sellers with correlatedprivate values, and how including two-way traders, would affect the competition between multiple markets.
Perhaps the most related prior work is (Ladley and Bullock, 2006), in which the authors investigated howinformation flow via connections between traders in a segmented market affect the speed of convergence tothe theoretical equilibrium price. In their market model, traders, distributed based on some network topol-ogy and assigned varying connectivity with their peers, can receive information from and trade with theirneighbors only. Similar to our work, they considered CDA markets populated by some version of ZIP tradersand explored the overall performance of the market network. A few differences exist between our workand theirs. First, their model of distributed market network differs from ours. In their model, traders mayvirtually participate in multiple markets — but the connections between traders, though randomly generatedat the beginning of trading, are fixed throughout the simulation. In our model, traders may move betweenmarkets forming new connections throughout the simulation, but, as discussed above, are restricted to trade
20
in a sinle market at a time. Second, their focus is on information flow based on the network topology andhow the network market converges from this perspective, while our work here investigates how the segmen-tation of multiple markets affects the overall performance, including allocative efficiency as well as globalprice discovery. Finally, their experiments considered only a single type of auction mechanism, the CDA,and a single type of trading strategy, a version of ZIP that is modified to take into consideration informationfrom neighbors. Our experiments however involve a much larger number of different configurations, varyingauction mechanisms and varying trading strategies.
Despite the comparisons and discussions above, our market model is clearly not a realistic model. Thereis no existing market in which the same set of traders will continue to trade with the same limit prices formore than a year of trading without some price shock altering prices or traders entering and leaving themarket. The model is not intended to be realistic in this sense. The model is just intended to tell us about thesteady state, and we know from previous work that introducing price shocks (Gjerstad and Dickhaut, 1998)and permitting traders to enter or leave the market (Niu et al., 2007) just slows convergence to the steadystate.
Our justification for working with such a simplified model is that we see our work as fitting within the“class-of-models” approach, due to (Morgan, 2002; Sutton, 2000). According to (Sutton, 2000), the aimof modeling economic systems is rarely to model a real market, but is to model an abstraction from a realmarket that captures the behavior of a whole class of markets — exactly those which are the instantiations ofthe abstract model. In this work we are trying to see what the steady state behavior is in all sets of competingmarkets, both those with price shocks and those without, both those in which traders enter and leave, andthose that do not. To do that we look first at the most abstract market. We can take the results of our shock-free and fixed-trader experiments and use them to predict the results of removing these restrictions, and in thefuture we can investigate whether these predictions are true. It is for the same “class-of-models” reason thatwe picked the trading strategies that we used in our experiments. As we explained in Section 2, the threestrategies broadly capture the behavior of human traders (RE), effective program traders (ZIP) and traderswith no intelligence (ZI-C), who could be ineffective program traders, or human traders with no knowledgeof the market. Given our choice of trading strategies we can be confident that we have mapped, albeit at anabstract level, the effect of competition in a broad range of competing markets. Furthermore, given the lackof variation in the results, we can conclude that the choice of trading strategy does not have a big effect onthe results we see.
This latter point feeds into discussion of the robustness of the results that we obtain here. To whatextent are they artifacts of the experimental scenario we have been examining, and to what extent can theybe transferred to more general situations? We believe that our results will be robust, and there are severalreasons for thinking so. First, we obtain broadly the same results for a range of trading strategies — and arange that are representative of what one might find in real markets — suggesting that there is nothing aboutany given strategy that is producing the results that we see here. Indeed, the fact that we see the effects wereport with ZI-C traders is a strong argument on its own for the robustness of the results — as Gode andSunder (1993) argued when they introduced the strategy, results observed when all the traders are randomlymaking bids and offers seem likely to be unrelated to the details of trader activity. Second, our previouswork on this multiple-market setup suggests that the behavior of the markets is neither significantly affectedby the market selection strategy that is used (provided that the strategy is rational in the sense of favoringmarkets in which agents are more likely to make a profit), nor is it significantly altered if traders are allowedto leave and enter the set of markets (the only effect of allowing such additional movement is to slow thespeed of convergence of the set of markets (Niu et al., 2007)). Thus we would expect to see the same kindof results as given here in a broader range of scenarios.
21
The main conclusion of this paper is that while dividing traders from a single market into a group ofsmaller markets leads to a loss of efficiency and an increase in the coefficient of convergence, these changesmay be reduced when markets compete for traders. The situation we investigated was when markets competein the sense that the traders are allowed to move between markets in search of greater profits, and whenthose traders make choices about which market to trade in on the basis of expected profits. In addition,the performance of the set of markets is encouraged by the imposition of fees on the traders, meaning thatgroups of markets that charge show smaller losses of efficiency and greater convergence than markets thatdo not charge.
Taking the results presented here and those from our previous investigation into this kind of multiple-market scenario (Niu et al., 2007, 2008b) we believe that this finding holds because the movement of tradersbetween markets serves to segment those markets. Since the movement is profit-driven, traders migratetowards markets that allow them to make good trades, and overall this increases the total profits of the set ofmarkets, increasing the global efficiency. This effect is sharpened by the application of fees since these tendto reduce profits and so further discourage agents from remaining in markets that are unprofitable for them.A similar effect reduces the coefficient of convergence when traders move. Since traders move away fromunprofitable markets, it tends to be the extra-marginal traders that move, and these tend to be the traders thatmake offers further from the theoretical equilibrium. Removing the possibility that these traders make offersthat are accepted in turn reduces the overall distance of accepted offers from the theoretical equilibrium andreduces the coefficient of convergence.
In terms of what should be concluded from this work more broadly, we think that the main lessonis for anyone in the position of operating or regulating markets. First, markets that fragment from a singleunified market into smaller sub-markets will lead to less efficiency, so there is some value in, where possible,maintaining a single market. However, the second lesson is that if a market cannot be held together, then theloss of efficiency that entails can be reduced by allowing participants in the sub-markets to choose whichsub-market they participate in, and work we have reported elsewhere Cai et al. (2010) suggests that theeasier it is for traders to move between markets, the small this loss of efficiency.
Our current work is extending the investigation reported here. First, we are examining the robustness ofour results against traders who use different algorithms to do market selection. While, as discussed above,we feel that the results will hold given any reasonable approach to market selection, it seems worthwhile tocheck whether the results are affected by alternative strategies, especially since the n-armed bandit algorithmwe use is known to potentially have problems when payoffs change, as they do here. Second, we areinvestigating the effect of different levels of charging on the changes in efficiency that we observe — ourresults so far suggest that when markets charge, the overall performance of a set of markets improves, butare there limits to this improvement, and are there situations under which charging can be deterimental tooverall performance? Finally, we are looking at the influence of network effects, such as restrictions on themobility of traders, on the effects that we observe here. In the scenario we consider here, traders can movefreely between markets. Intuition suggests that restricting movement will have some effect on the behaviorof the markets, and this is backed up by preliminary reuslts Cai et al. (2010) — current work aims to discoverwhat the extent of these effects is and how they can be overcome.
Acknowledgments
This work was partially funded by the National Science Foundation under grant NSF IIS-0329037 Toolsand Techniques for Automated Mechanism Design, and by the UK EPSRC under grant GR/T10657/01 Mar-ket Based Control of Complex Computational Systems. We are grateful for use of the computational facility
22
at the CUNY Graduate Center, to the reviewers whose comments helped us to make many improvements tothe paper, and to the editors for their encouragement.
References
Adomavicius, G., Gupta, A., Zhdanov, D., 2009. Designing intelligent software agents for auctions withlimited information feedback. Information Systems Research 20 (4).
Bakos, Y., 1998. The emerging role of electronic marketplaces on the internet. Communications of the ACM41 (8), 35–42.
Cai, K., Niu, J., Parsons, S., 2010. Network effects in double auction markets with automated traders. In:Proceedings of the 12th Workshop on Agent-mediated Electronic Commerce. Toronto, Canada.
Caillaud, B., Jullien, B., 2003. Chicken and egg: Competition among intermediation service providers. RandJournal of Economics, 309–329.
Cassar, A., Duffy, N., 2001. Contagion of financial crises under local and global markets. In: Luna, F.,Perrone, A. (Eds.), Agent-based Methods in Economics and Finance: Simulations in Swarm. Kluwer,New York, NY.
Cliff, D., 1997. Minimal-intelligence agents for bargaining behaviours in market-based environments. Tech.Rep. HPL-97-91, Hewlett-Packard Research Laboratories.
Cliff, D., Bruten, J., 1997. Less than human: Simple adaptive trading agents for CDA markets. TechnicalReport HP-97-155, Hewlett-Packard Research Laboratories.
Conitzer, V., Sandholm, T., July 2004. An algorithm for automatically designing deterministic mechanismswithout payments. In: Proceedings of the 3rd International Joint Conference on Autonomous Agents andMultiagent Systems. New York, pp. 128–135.
Conitzer, V., Sandholm, T., Januray 2007. Incremental mechanism design. In: Proceedings of the 20thInternational Joint Conference on Artificial Intelligence. Hyderabad, India.
Ellison, G., Fudenberg, D., Mobius, M., 2004. Competing auctions. Journal of the European EconomicAssociation 2 (1), 30–66.
Farmer, J. D., November 2001. Toward agent-based models for investment. In: Proceedings of the Associ-ation for Investment Management and Research Conference: Developments in Quantitative InvestmentModels. pp. 61–70.
Friedman, D., 1993. The double auction institution: A survey. In: Friedman, D., Rust, J. (Eds.), The DoubleAuction Market: Institutions, Theories and Evidence. Perseus Publishing, Cambridge, MA, pp. 3–25.
Gintis, H., 2007. The dynamics of general equilibrium. The Economics Journal 117, 1280–1309.
Gjerstad, S., Dickhaut, J., 1998. Price formation in double auctions. Games and Economic Behavior 22,1–29.
Gode, D. K., Sunder, S., 1993. Allocative efficiency of markets with zero-intelligence traders: Market as apartial substitute for individual rationality. Journal of Political Economy 101 (1), 119–137.
23

Judd, J. S., Kearns, M., July 2008. Behavioral experiments in networked trade. In: Proceedings of the ACMConference on Electronic Commerce. Chicago, IL, pp. 150–159.
Ketter, W., La Poutre, H., Sadeh, N., Shehory, O., Walsh, W. (Eds.), 2008. Agent-Mediated ElectronicCommerce and Trading Agent Design and Analysis. Vol. 44 of Lecture Notes in Business InformationProcessing. Springer, Berlin.
Ladley, D., Bullock, S., 2006. Who to listen to: Exploiting information quality in a ZIP-agent market. In:La Poutre, H., Sadeh, N. M., Janson, S. (Eds.), Agent-Mediated Electronic Commerce. Designing TradingAgents and Mechanisms. Vol. 3937 of Lecture Notes in Computer Science. Springer, Berlin.
Lee, H. L., Padmanabhan, V., Whang, S., 1997. Information distortion in a supply chain: The bullwhipeffect. Management Science 43 (4), 546–558.
Leombruni, R., 2002. The methodological status of agent-based simulations. Working Paper 19, LABORa-torio Revelli, SIEC – University of Ancona.
Miller, M. H., Hawke, J. D., Malkiel, B., Scholes, M., Spring 1988. Findings of the Committee of InquiryExamining the Events Surrounding October 19, 1987. Tech. rep., Chicago Mercantile Exchange.
Miller, R. M., Plott, C. R., Smith, V. L., November 1977. Intertemporal competitive equilibrium: An empir-ical study of speculation. The Quarterly Journal of Economics 91 (4), 599–624.
Miller, T., Niu, J., January-February 2012. An assessment of strategies for choosing between competitivemarketplaces. Journal of Electronic Commerce Research and Applications 11 (1), 14–23.
Morgan, M., 2002. Symposium on Marshall’s Tendencies: 1 how models help economists to know. Eco-nomics and Philosopy 18, 5–16.
Moyaux, T., McBurney, P., 2006a. Modeling a supply chain as a network of markets. In: Proceedings of theIEEE International Conference on Service Systems and Service Managament. Troyes, France.
Moyaux, T., McBurney, P., 2006b. Reduction of the bullwhip effect in supply chains through speculation.In: Proceedings of the Symposium on Artificial Economics. Aalborg, Denmark.
Nicolaisen, J., Petrov, V., Tesfatsion, L., 2001. Market power and efficiency in a computational electric-ity market with discriminatory double-auction pricing. IEEE Transactions on Evolutionary Computation5 (5), 504–523.
Niu, J., Cai, K., Gerding, E., McBurney, P., Moyaux, T., Phelps, S., Shield, D., Parsons, S., May 2008a.JCAT: A platform for the TAC Market Design Competition. In: Padgham, Parkes, Muller, Parsons (Eds.),Proceedings of the 7th International Conference on Autonomous Agents and Multiagent Systems. Estoril,Portugal, demo Paper.
Niu, J., Cai, K., Parsons, S., Fasli, M., Yao, X., January-February 2012. A grey-box approach to automatedmechanism design. Journal of Electronic Commerce Research and Applications 11 (1), 24–35.
Niu, J., Cai, K., Parsons, S., Sklar, E., 2007. Some preliminary results on competition between markets forautomated traders. In: Proceedings of the Workshop on Trading Agent Design and Analysis. Vancouver,BC.
24

Niu, J., McBurney, P., Gerding, E., Parsons, S., 2008b. Characterizing effective auction mechanisms: In-sights from the 2007 TAC market design competition. In: Proceedings of the 7th International Conferenceon Autonomous Agents and Multi-Agent Systems. Estoril, Portugal.
Phelps, S., Marcinkiewicz, M., Parsons, S., McBurney, P., 2006. A novel method for automated strategyacquisition in n-player non-zero-sum games. In: Proceedings of the 5th International Conference onAutonomous Agents and Multi-Agent Systems. Hakodate, Japan.
Phelps, S., McBurney, P., Parsons, S., Sklar, E., 2002. Co-evolutionary mechanism design: A preliminaryreport. In: Padget, J., Shehory, O., Parkes, D., Sadeh, N., Walsh, W. E. (Eds.), Agent Mediated ElectronicCommerce IV: Designing Mechanisms and Systems. No. 2531 in Lecture Notes in Artificial Intelligence.Springer Verlag, pp. 123–142.
Phelps, S., Parsons, S., McBurney, P., 2004. An evolutionary game-theoretic comparison of two doubleauction markets. In: Faratin, P., Rodrıguez-Aguilar, J. A. (Eds.), Agent Mediated Electronic CommerceVI: Theories for and Engineering of Distributed Mechanisms and Systems. No. 3435 in Lecture Notes inArtificial Intelligence. Springer Verlag, pp. 101–114.
Plott, C. R., Smith, V. L., February 1978. An experimental comparison of two exchange institutions. TheReview of Economic Studies 45 (1), 133–153.
Preist, C., van Tol, M., 1998a. Adaptive agents in a persistent shout double auction. In: Proceedings of the1st International Conference on the Internet, Computing and Economics. ACM Press, pp. 11–18.
Preist, C., van Tol, M., 1998b. Adaptive agents in a persistent shout double auction. In: Proceedings of the1st International Conference on Information and computation economies. ACM Press, pp. 11–18.
Ramos, S. B., Feb. 2003. Competition between stock exchanges: A survey. FAME Research Paper SeriesRP77, International Center for Financial Asset Management and Engineering.
Roth, A. E., Erev, I., 1995. Learning in extensive-form games: Experimental data and simple dynamicmodels in the intermediate term. Games and Economic Behavior 8, 164–212.
Rust, J., Miller, J. H., Palmer, R., 1993. Behaviour of trading automata in a computerized double auctionmarket. In: Friedman, D., Rust, J. (Eds.), The Double Auction Market: Institutions, Theories and Evi-dence. Perseus Publishing, Cambridge, MA, pp. 155–199.
Rustichini, A., Satterthwaite, M. A., Williams, S. R., September 1994. Convergence to efficiency in a simplemarket with incomplete information. Econometrica 62 (5), 1041–1063.
Satterthwaite, M. A., Williams, S. R., 1993. The Bayesian theory of the k-double auction. In: Friedman,D., Rust, J. (Eds.), The Double Auction Market: Institutions, Theories and Evidence. Perseus Publishing,Cambridge, MA, pp. 99–123.
Schvartzman, L. J., Wellman, M. P., 2009. Stronger CDA strategies through empirical game-theoretic analysisand reinforcement learning. In: Proceedings of the 8th International Conference on Autonomous Agentsand Multi-Agent Systems. Budapest, Hungary, pp. 249–256.
Shah, A., Thomas, S., 18th June 2000. David and Goliath: Displacing a primary market. Global FinancialMarkets 1 (1), 14–21.
25
Smith, V. L., April 1962a. An experimental study of competitive market behaviour. Journal of PoliticalEconomy 70 (2), 111–137.
Smith, V. L., April 1962b. An experimental study of competitive market behaviour. The Journal of PoliticalEconomy 70 (2), 111–137.
Sutton, J., 2000. Marshall’s Tendencies: What Can Economists Know? MIT Press, Cambridge, MA.
Sutton, R. S., Barto, A. G., 1998. Reinforcement learning: An introduction. MIT Press, Cambridge, MA.
Tesauro, G., Bredin, J. L., 2002. Strategic sequential bidding in auctions using dynamic programming.In: Proceedings of the 1st International Conference on Autonomous Agents and Multi-Agent Systems.Budapest, Hungary, pp. 591–598.
Tesfatsion, L., 2002. Agent-based computational economics: Growing economies from the bottom up. Ar-tificial Life 8 (1), 55–82.
Vytelingum, P., Dash, R. K., David, E., Jennings, N. R., 2004. A risk-based bidding strategy for continuousdouble auctions. In: Proceedings of the 16th European Conference on Artificial Intelligence. Valencia,Spain, pp. 79–83.
Walia, V., Byde, A., Cliff, D., 2003. Evolving market design in zero-intelligence trader markets. Tech. Rep.HPL-2002-290, Hewlett-Packard Research Laboratories, Bristol, England.
Wilhite, A., 2001. Bilateral trade and ‘small-world’ networks. Computational Economics 18, 49–64.
Wilhite, A., 2006. Economic activity on fixed networks. In: Tesfatsion, L., Judd, K. L. (Eds.), Handbook ofComputational Economics. Vol. 2. Elsevier B. V., pp. 1013–1045.
Williams, A. W., 1979. Intertemporal competitive equilibrium: On further experimental results. In: Smith,V. L. (Ed.), Research in Experimental Economics. JAI Press, Inc.
Williams, A. W., Smith, V. L., January 1984. Cyclical double-auction markets with and without speculators.The Journal of Business 57 (1), 1–33.
Zhan, W., Friedman, D., September 2007. Markups in double auction markets. Journal of Economic Dy-namics and Control 31 (9), 2984–3005.
26