On the Assembly History of Dark Matter Haloes - arXiv · On the Assembly History of Dark Matter...
15
arXiv:astro-ph/0510372v2 4 May 2007 Mon. Not. R. Astron. Soc. 000, 1–15 (2000) Printed 23 January 2018 (MN L A T E X style file v2.2) On the Assembly History of Dark Matter Haloes Yun Li 1 , H.J. Mo 1 , Frank C. van den Bosch 2 , W.P. Lin 3 ⋆ 1 Department of Astronomy, University of Massachusetts, MA 01003, USA 2 Max-Planck-Institute for Astronomy, K¨ onigstuhl 17, D-69117 Heidelberg, Germany 3 Shanghai Astronomical Observatory, 80 Nandan Rd., Shanghai 200030, China ABSTRACT We study the mass assembly history (MAH) of dark matter haloes. We compare MAHs obtained using (i) merger trees constructed with the extended Press Schechter (EPS) formalism, (ii) numerical simulations, and (iii) the Lagrangian perturbation code PINOCCHIO. We show that the PINOCCHIO MAHs are in excellent agreement with those obtained using numerical simulations, while the EPS formalism predicts MAHs that occur too late. PINOCCHIO, which is much less CPU intensive than N- body simulation, can be run on a simple personal computer, and does not require any labor intensive post-simulation analysis, therefore provides a unique and powerful tool to investigate the growth history of dark matter haloes. Using a suite of 55 PINOCCHIO simulations, with 2563 particles each, we study the MAHs of 12,924 cold dark matter haloes in a ΛCDM concordance cosmology. This is by far the largest set of haloes used for any such analysis. For each MAH we derive four different formation redshifts, which characterize different epochs during the assembly history of a dark matter halo. We show that haloes less massive than the characteristic non-linear mass scale establish their potential wells much before they acquire most of their mass. The time when a halo reaches its maximum virial velocity roughly divides its mass assembly into two phases, a fast accretion phase which is dominated by major mergers, and a slow accretion phase dominated by minor mergers. Each halo experiences about 3 ± 2 major mergers since its main progenitor had a mass equal to one percent of the final halo mass. This major merger statistic is found to be virtually independent of halo mass. However, the average redshift at which these major mergers occur is strongly mass dependent, with more massive haloes experiencing their major mergers later. Key words: cosmology: theory — galaxies: formation — galaxies: haloes — dark matter. 1 INTRODUCTION The cold dark matter (CDM) paradigm has become the standard framework for the formation of large-scale struc- ture and galaxies. Small fluctuations in the initial density field grow by means of gravitational instability until they collapse to form virialized dark matter haloes. This growth process is hierarchical in the sense that small clumps virial- ize first, and aggregate successively into larger and larger ob- jects. Galaxies form from the gas that is shock heated by the gravitational collapse and then subsequently cools (White & Rees 1978; but see also Birnboim & Dekel 2003 and Keres et al. 2004). Therefore, a proper understanding of galaxy formation relies on an accurate description of the structure and assembly of these dark matter haloes. This problem is tackled by a combination of both N-body simulations and analytical models. Although N-body simulations have the ⋆ E-mail: [email protected] advantage that they follow the formation of dark matter haloes into the non-linear regime, they are expensive, both in terms of labor (analyzing the simulations) and CPU time. Therefore, accurate analytical models are always useful. The most developed of these is the Press-Schechter (PS) formal- ism, which allows one to compute the (unconditional) halo mass function (Press & Schechter 1974). Bond et al. (1991), Bower (1991) and Lacey & Cole (1993) extended the PS formalism, using the excursion set approach, to compute conditional mass functions. These allow the construction of merger histories, the computation of halo formation times, and detailed studies of spatial clustering and large scale bias (e.g., Kauffmann & White 1993; Mo & White 1996, 2002; Mo, Jing & White 1996, 1997; Catelan et al. 1998; Sheth 1998; Nusser & Sheth 1999; Somerville & Kolatt 1999; Cohn, Bagla & White 2001). Numerous studies in the past have tested the predic- tions of extended Press-Schechter (EPS) theory against nu- merical simulations. Although the unconditional mass func-
Transcript of On the Assembly History of Dark Matter Haloes - arXiv · On the Assembly History of Dark Matter...

arX
iv:a
stro
-ph/
0510
372v
2 4
May
200
7
Mon. Not. R. Astron. Soc. 000, 1–15 (2000) Printed 23 January 2018 (MN LATEX style file v2.2)
On the Assembly History of Dark Matter Haloes
Yun Li1, H.J. Mo1, Frank C. van den Bosch2, W.P. Lin3 ⋆
1Department of Astronomy, University of Massachusetts, MA 01003, USA2Max-Planck-Institute for Astronomy, Konigstuhl 17, D-69117 Heidelberg, Germany3Shanghai Astronomical Observatory, 80 Nandan Rd., Shanghai 200030, China
ABSTRACT
We study the mass assembly history (MAH) of dark matter haloes. We compareMAHs obtained using (i) merger trees constructed with the extended Press Schechter(EPS) formalism, (ii) numerical simulations, and (iii) the Lagrangian perturbationcode PINOCCHIO. We show that the PINOCCHIO MAHs are in excellent agreementwith those obtained using numerical simulations, while the EPS formalism predictsMAHs that occur too late. PINOCCHIO, which is much less CPU intensive than N-body simulation, can be run on a simple personal computer, and does not requireany labor intensive post-simulation analysis, therefore provides a unique and powerfultool to investigate the growth history of dark matter haloes. Using a suite of 55PINOCCHIO simulations, with 2563 particles each, we study the MAHs of 12,924 colddark matter haloes in a ΛCDM concordance cosmology. This is by far the largest setof haloes used for any such analysis. For each MAH we derive four different formationredshifts, which characterize different epochs during the assembly history of a darkmatter halo. We show that haloes less massive than the characteristic non-linear massscale establish their potential wells much before they acquire most of their mass. Thetime when a halo reaches its maximum virial velocity roughly divides its mass assemblyinto two phases, a fast accretion phase which is dominated by major mergers, and aslow accretion phase dominated by minor mergers. Each halo experiences about 3± 2major mergers since its main progenitor had a mass equal to one percent of the finalhalo mass. This major merger statistic is found to be virtually independent of halomass. However, the average redshift at which these major mergers occur is stronglymass dependent, with more massive haloes experiencing their major mergers later.
Key words: cosmology: theory — galaxies: formation — galaxies: haloes — darkmatter.
1 INTRODUCTION
The cold dark matter (CDM) paradigm has become thestandard framework for the formation of large-scale struc-ture and galaxies. Small fluctuations in the initial densityfield grow by means of gravitational instability until theycollapse to form virialized dark matter haloes. This growthprocess is hierarchical in the sense that small clumps virial-ize first, and aggregate successively into larger and larger ob-jects. Galaxies form from the gas that is shock heated by thegravitational collapse and then subsequently cools (White &Rees 1978; but see also Birnboim & Dekel 2003 and Kereset al. 2004). Therefore, a proper understanding of galaxyformation relies on an accurate description of the structureand assembly of these dark matter haloes. This problem istackled by a combination of both N-body simulations andanalytical models. Although N-body simulations have the
⋆ E-mail: [email protected]
advantage that they follow the formation of dark matterhaloes into the non-linear regime, they are expensive, bothin terms of labor (analyzing the simulations) and CPU time.Therefore, accurate analytical models are always useful. Themost developed of these is the Press-Schechter (PS) formal-ism, which allows one to compute the (unconditional) halomass function (Press & Schechter 1974). Bond et al. (1991),Bower (1991) and Lacey & Cole (1993) extended the PSformalism, using the excursion set approach, to computeconditional mass functions. These allow the construction ofmerger histories, the computation of halo formation times,and detailed studies of spatial clustering and large scale bias(e.g., Kauffmann & White 1993; Mo & White 1996, 2002;Mo, Jing & White 1996, 1997; Catelan et al. 1998; Sheth1998; Nusser & Sheth 1999; Somerville & Kolatt 1999; Cohn,Bagla & White 2001).
Numerous studies in the past have tested the predic-tions of extended Press-Schechter (EPS) theory against nu-merical simulations. Although the unconditional mass func-
c© 2000 RAS

2 Li, Mo, van den Bosch & Lin
tion was found to be in reasonable agreement, it systemat-ically over (under) predicts the number of low (high) masshaloes (e.g., Jain & Bertschinger 1994; Tormen 1998; Grosset al. 1998; Governato et al. 1999; Jenkins et al. 2001).Similar discrepancies have been found regarding the con-ditional mass function (Sheth & Lemson 1999; Somerville etal. 2000), which results in systematic offsets of the halo for-mation times predicted by EPS (e.g., van den Bosch 2002a).Finally, Bond et al. (1991) have shown that the PS approachachieves a very poor agreement on an object-by-object basiswhen compared with simulations (for a review, see Monaco1998).
It is generally understood that these discrepancies stemfrom the assumption of spherical collapse. Numerous studieshave investigated schemes to improve the EPS formalism byusing ellipsoidal, rather than spherical collapse conditions,thereby taking proper account of the aspherical nature ofcollapse in a CDM density field (e.g., Sheth, Mo & Tormen2001, hereafter SMT01; Sheth & Tormen 2002; Chiueh &Lee 2001; Lin, Chuieh & Lee 2002). Although this results inunconditional mass functions that are in much better agree-ment with numerical simulations (e.g., SMT01; Jenkins etal. 2001), they have been unable thus far to yield conditionalmass functions of sufficient accuracy that reliable mergertrees can be constructed.
Despite its systematic errors and uncertainties, thePS formalism has remained the standard analytical ap-proach in galaxy formation modeling. In particular, the ex-tended Press-Schechter theory is used extensively to com-pute merger histories and mass assembly histories (here-after MAHs) which serve as the back-bone for models ofgalaxy formation (e.g., Kauffmann, White & Guiderdoni1993; Somerville & Primack 1999; Cole et al. 2000; vanden Bosch 2001; Firmani & Avila-Reese 2000). This mayhave profound implications for the accuracy of these mod-els. For instance, the mass assembly histories of dark matterhaloes are expected to impact on the star formation histo-ries of the galaxies that form inside these haloes. In addition,the merger and mass assembly history of individual haloesmay also be tightly related to their internal structure. Asshown by Wechsler et al. (2002; hereafter W02) and Zhaoet al. (2003a;b), the MAH is directly related to the concen-tration of the resulting dark matter halo (see also Navarro,Frenk & White 1997; Bullock et al. 2001; Eke, Navarro &Steinmetz 2001). Errors in the mass assembly histories ofdark matter haloes may therefore result in erroneous pre-dictions regarding the star formation history and the rota-tion curve shapes and/or the zero-point of the Tully-Fisherrelation (e.g., Alam, Bullock & Weinberg 2002; Zentner &Bullock 2002; Mo & Mao (2000); van den Bosch, Mo & Yang2003). Clearly, a detailed understanding of galaxy formationrequires a description of the growth history of dark matterhaloes that is more accurate than EPS. Although N-bodysimulations are probably the most reliable means of obtain-ing accurate assembly histories of dark matter haloes, theyare computationally too expensive for some purposes.
As an alternative to the EPS formalism and N-bodysimulations, perturbative techniques have been developedthat describe the growth of dark matter haloes in a givennumerical realization of a linear density field. These include,amongst others, the truncated Zel’dovich (1970) approxima-tion (Borgani, Coles & Moscardini 1994), the peak-patch al-
gorithm (Bond & Myers 1996a,b) and the merging cell model(Rodriguez & Thomas 1996; Lanzoni, Mamon & Guiderdoni2000). Recently, Monaco, Theuns & Taffoni (2002b) devel-oped a numerical code that uses local ellipsoidal collapse ap-proximations (Bond & Myers 1996a; Monaco 1995) withinLagrangian Perturbation Theory (LPT, Buchert & Ehlers1993; Catelan 1995). This code, called PINOCCHIO (PIN-pointing Orbit-Crossing Collapsed HIerarchical Objects),has been shown to yield accurate mass functions, both con-ditional and unconditional (Monaco et al. 2002a,b; Taffoni,Monaco & Theuns 2002), and is therefore ideally suited tostudy halo assembly histories, without having to rely oncomputationally expensive N-body simulations.
This paper is organized as follows. In Section 2 we givea detailed overview of (extended) Press-Schechter theory,including a discussion of its short-comings and its modifica-tions under ellipsoidal collapse conditions, and describe theLagrangian perturbation code PINOCCHIO. In Section 3 wecompare the MAHs obtained from PINOCCHIO, the EPSformalism, and N-body simulations. We show that PINOC-CHIO yields MAHs that are in excellent agreement withnumerical simulations, and do not suffer from the shortcom-ings of the EPS formalism. In the second part of this paperwe then analyze a large, statistical sample of MAHs ob-tained with PINOCCHIO for haloes spanning a wide rangein masses. In Section 4 we use these MAHs to study, in a sta-tistical sense, various characteristic epochs and events in themass assembly history of a typical CDM halo. We analyzethe statistics of major merger events in Section 5. Finally,Section 6 summarizes our results.
2 THEORETICAL BACKGROUND
2.1 Extended Press-Schechter theory
In the standard model for structure formation the initialdensity contrast δ(x) = ρ(x)/ρ − 1 is considered to be aGaussian random field, which is therefore completely spec-ified by the power spectrum P (k). As long as δ ≪ 1the growth of the perturbations is linear and δ(x, t2) =δ(x, t1)D(t2)/D(t1), where D(t) is the linear growth factorlinearly extrapolated to the present time. Once δ(x) exceedsa critical threshold δ0crit the perturbation starts to collapseto form a virialized object (halo). In the case of sphericalcollapse δ0crit ≃ 1.68. In what follows we define δ0 as the ini-tial density contrast field linearly extrapolated to the presenttime. In terms of δ0, regions that have collapsed to form viri-alized objects at redshift z are then associated with thoseregions for which δ0 > δc(z) ≡ δ0crit/D(z).
In order to assign masses to these collapsed regions, thePS formalism considers the density contrast δ0 smoothedwith a spatial window function (filter) W (r;Rf ). Here Rf
is a characteristic size of the filter, which is used to com-pute a halo mass M = γf ρRf3/3, with ρ the mean massdensity of the Universe and γf a geometrical factor that de-pends on the particular choice of filter. The ansatz of the PSformalism is that the fraction of mass that at redshift z iscontained in haloes with masses greater than M is equal totwo times the probability that the density contrast smoothedwith W (r;Rf ) exceeds δc(z). This results in the well known
c© 2000 RAS, MNRAS 000, 1–15

On the Assembly History of Dark Matter Haloes 3
PS mass function for the comoving number density of haloes:
dn
d lnM(M, z) dM =
√2
πρδc(z)
σ2(M)
∣∣∣ dσdM
∣∣∣ exp[− δc2(z)
2σ2(M)
]dM (1)
(Press & Schechter 1974). Here σ2(M) is the mass varianceof the smoothed density field given by
σ2(M) =1
2π2
∫∞
0
P (k) W2(k;Rf ) k2 dk. (2)
with W (k;Rf ) the Fourier transform of W (r;Rf ).The extended Press-Schechter (EPS) model developed
by Bond et al. (1991), is based on the excursion set formal-ism. For each point one constructs ‘trajectories’ δ(M) of thelinear density contrast at that position as function of thesmoothing mass M . In what follows we adopt the notationof Lacey & Cole (1993) and use the variables S = σ2(M)and ω = δc(z) to label mass and redshift, respectively. In thelimit Rf → ∞ one has that S = δ(S) = 0, which can be con-sidered the starting point of the trajectories. Increasing Scorresponds to decreasing the filter massM , and δ(S) startsto wander away from zero, executing a random walk (if thefilter is a sharp k-space filter). The fraction of matter in col-lapsed objects in the mass intervalM ,M+dM at redshift zis now associated with the fraction of trajectories that havetheir first upcrossing through the barrier ω = δc(z) in theinterval S, S + dS, which is given by
P (S, ω) dS =1√2π
ω
S3/2exp[−ω22S
]dS (3)
(Bond et al. 1991; Bower 1991; Lacey & Cole 1993). Af-ter conversion to number counting, this probability functionyields the PS mass function of equation (1). Note that thisapproach does not suffer from the arbitrary factor two inthe original Press & Schechter approach.
Since for random walks the upcrossing probabilities areindependent of the path taken (i.e., the upcrossing is aMarkov process), the probability for a change ∆S in a timestep ∆ω is simply given by equation (3) with S and ω re-placed with ∆S and ∆ω, respectively. This allows one toimmediate write down the conditional probability that a par-ticle in a halo of mass M2 at z2 was embedded in a halo ofmass M1 at z1 (with z1 > z2) as
P (S1, ω1|S2, ω2) dS1 =
1√2π
(ω1 − ω2)
(S1 − S2)3/2exp
[− (ω1 − ω2)2
2(S1 − S2)
]dS1 (4)
Converting from mass weighting to number weighting, oneobtains the average number of progenitors at z1 in the massinterval M1, M1 +dM1 which by redshift z2 have merged toform a halo of mass M2:
dN
dM1
(M1, z1|M2, z2) dM1 =
M2
M1
P (S1, ω1|S2, ω2)
∣∣∣ dSdM
∣∣∣ dM1. (5)
This conditional mass function can be combined withMonte-Carlo techniques to construct merger histories (alsocalled merger trees) of dark matter haloes.
2.2 Ellipsoidal collapse
In an attempt to improve the inconsistencies between EPSand numerical simulations (see Section 1), various authorshave modified the EPS formalism by considering ellipsoidalrather than spherical collapse. For ellipsoidal density per-turbations, the conditions for collapse not only depend onthe self-gravity of the perturbation, but also on the tidalcoupling with the external mass distribution; external shearcan actually rip overdensities apart and thus prevent themfrom collapsing. Since smaller mass perturbations typicallyexperience a stronger shear field, they tend to be more ellip-soidal. Therefore, it is to be expected that the assumptionsof spherical collapse in the standard EPS formalism are moreaccurate for more massive haloes, whereas modifications as-sociated with ellipsoidal collapse will be more dramatic forsmaller mass haloes. The way in which ellipsoidal collapsemodifies the halo formation times with respect to the EPSpredictions depends on the definition of collapse. Ellipsoidalperturbations collapse independently along the three differ-ent directions defined by the eigen vectors of the deformationtensor (defined as the second derivative of the linear gravi-tational potential). It is customary to associate the first axiscollapse with the formation of a 2-dimensional pancake-likestructure, the second axis collapse with the formation ofa 1-dimensional filament, and the third axis collapse withthe formation of a dark matter halo. Most authors indeedhave associated halo formation with the collapse of the thirdaxis (e.g., Bond & Myers 1996a; Audit, Teyssier & Alimi1997; Lee & Shandarin 1998; SMT01), though some haveconsidered the first axis collapse instead (e.g., Bertschinger& Jain 1994; Monaco 1995). For first-axis collapse one pre-dicts that haloes form earlier than in the spherical case,whereas the opposite applies when considering third-axiscollapse. Clearly, the implications of considering ellipsoidalrather than spherical collapse depend sensitively on the col-lapse definition.
In order to incorporate ellipsoidal collapse in a PS-likeformalism, one needs to obtain an estimate of the criticaloverdensity for collapse δec. Various studies have attemptedsuch schemes. For instance, SMT01 used the ellipsoidal col-lapse model to obtain
δec(M, z) = δc(z)
(1 + 0.47
[σ2(M)
δ2c(z)
]0.615). (6)
Here δc(z) is the standard value for the spherical collapsemodel. Solving for the upcrossing statistics with this partic-ular barrier shape results in halo mass functions that are inexcellent agreement with those found in simulations (Sheth& Tormen 1999; Jenkins et al. 2001). Unfortunately, no ana-lytical expression for the conditional mass function is knownfor a barrier of the form of equation (6), and one has toresort to either approximate fitting functions (Sheth & Tor-men 2002), or one has to use time-consuming Monte-Carlosimulations to determine the upcrossing statistics (Chiueh& Lee 2001; Lin et al. 2002). Although the resulting con-ditional mass functions dN
dM1(M1, z1|M2, z2) dM1 have been
found to be in good agreement with numerical simulationsif a relatively large look-back time is considered (i.e., if∆z = z2 − z1 & 0.5), there is still a large disagreementfor small ∆z. This is probably due to the neglect of correla-tions between scales in the excursion set approach (Peacock
c© 2000 RAS, MNRAS 000, 1–15

4 Li, Mo, van den Bosch & Lin
& Heavens 1990; Sheth & Tormen 2002). This is unfortunateas it does not allow these methods to be used for the con-struction of merger histories or MAHs. Lin et al. (2002) triedto circumvent this problem by introducing a small mass gapbetween parent halo and progenitor halo, i.e., each time stepthey require that S1 − S2 > f δc2(z2). Upon testing theirconditional mass function with this mass gap against nu-merical simulations they find good agreement for f = 0.06,and claim that with this modification the excursion set ap-proach can be used to construct merger histories under ellip-soidal collapse conditions. However, they only tested theirconditional mass functions for ∆z > 0.2, whereas accuratemerger histories require significantly smaller time steps. Forinstance, van den Bosch (2002a) has argued for timesteps notlarger than ∆ω = ω1 − ω2 ≃ 0.1, which, for an Einstein-deSitter (EdS) cosmology, corresponds to ∆z ≃ 0.06 (see alsodiscussion in Somerville & Kolatt 1999). Furthermore, withthe mass gap suggested by Lin et al. (2002), each time stepthere is a minimum amount of mass accreted by the halo,which follows from S1 − S2 = f δc2(z2). This introduces adistinct maximum to the halo half-mass formation time, thevalue of which depends sensitively on the actual time-stepstaken. To test this, we constructed MAHs of CDM haloes us-ing the method of van den Bosch (2002a) but adopting theconditional probability function of Lin et al. (2002). Thisresulted in MAHs that are in very poor agreement with nu-merical simulations. In particular, the results were found todepend strongly on the value of ∆ω adopted.
In summary, although introducing ellipsoidal collapseconditions in the excursion set formalism has allowed theconstruction of accurate unconditional mass functions, therestill is no reliable method based on the EPS formalism thatallows the construction of accurate merger histories and/orMAHs.
2.3 PINOCCHIO
Although the problem of obtaining accurate merging his-tories under ellipsoidal collapse conditions can be circum-vented by using N-body simulations, the time-expense ofthese simulations is a major hurdle. An attractive alterna-tive is provided by the LPT code PINOCCHIO developedrecently by Monaco et al. (2002b). Below we give a shortoverview of PINOCCHIO, and we refer the interested readerto Monaco et al. (2002a,b) and Taffoni et al. (2002) for amore elaborate description.
PINOCCHIO uses Lagrangian perturbation theory todescribe the dynamics of gravitational collapse. In LPT thecomoving (Eulerian) coordinate x and the initial Lagrangiancoordinate q of each particle are connected via
x(q, t) = q+ S(q, t), (7)
with S the displacement field. The first-order term of S(q, t)is the well-known Zel’dovich approximation (Zel’dovich1970):
S(q, t) = −D(t)∂ψ
∂q(8)
with ψ(q) the rescaled linear gravitational potential, whichis related to the density contrast δ0(q) extrapolated to thepresent time by the Poisson equation
∇2ψ(q) = δ0(q), (9)
Since the Lagrangian density field is basically ρL(q) = ρ,the (Eulerian) density contrast is given by
1 + δ(x, t) =1
det(J)(10)
with J = ∂x/∂q the Jacobian of the transformation givenin (7). Note that the density formally goes to infinity whenthe Jacobian determinant vanishes, which corresponds tothe point in time when the mapping q → x becomes multi-valued, i.e. when orbits first cross leading to the formationof a caustic. Since the (gravitationally induced) flow is irro-tational the matrix J is symmetric and can thus be diago-nalized:
1 + δ(x, t) =1∏3
i=1[1−D(t)λi(q)]
(11)
with −λi the eigenvalues of the deformation tensor∂2ψ/∂qi∂qj .
PINOCCHIO starts by constructing a random realiza-tion of a Gaussian density field ρ(q) (linearly extrapolatedto z = 0) and the corresponding peculiar potential φ(q) ona cubic grid. The density fluctuation field is specified com-pletely by the power spectrum P (k), which is normalized byspecifying the value of σ8, defined as the rms linear overden-sity at z = 0 in spheres of radius 8h−1Mpc. The density andpeculiar potential fields are subsequently convolved with aseries of Gaussians with different values for their FWHMR. For the 2563 simulations used in this paper, 26 differentlinearly sampled values of R are used. For a given value ofR the density of a mass element (i.e., ‘particle’) will becomeinfinite as soon as at least one of the ellipsoid’s axes reacheszero size (i.e., when D(t) = 1/λi). At this point orbit cross-ing (OC) occurs and the mass element enters a high-densitymulti-stream region. This is the moment of first-axis col-lapse. Since the Jacobian determinant becomes multivaluedat this stage, one can not make any further predictions ofthe mass element’s fate beyond this point in time. Conse-quently, it is not possible in PINOCCHIO to associate halocollapse with that of the third axis.
For each Lagrangian point q (hereafter ‘particle’) andfor each smoothing radius R this OC (i.e., collapse) timeis computed, and the highest collapse redshift zc, the corre-sponding smoothing scale Rc, and the Zel’dovich estimate ofthe peculiar velocity vc are recorded. PINOCCHIO differsfrom the standard PS-like method when it comes to assign-ing masses to collapsed objects. Rather than associating ahalo mass with the collapsed mass element based directlyon the smoothing scale Rc at collapse, PINOCCHIO uses afragmentation algorithm to link neighboring mass elementsinto a common dark matter halo. In fact, the collapsed masselement may be assigned to a filament or sheet rather thana halo.
After sorting particles according to decreasing collapseredshift zc the following rules for accretion and merging areadopted: Whenever a particle collapses and none of its La-grangian neighbors (the six nearest particles) have yet col-lapsed, the particle is considered a seed for a new halo. Oth-erwise, the particle is accreted by the nearest Lagrangianneighbor that already has collapsed if the Eulerian distanced, computed using the Zel’dovich velocities v at the timeof collapse, obeys d 6 faRM , where RM = M1/3 is the ra-
c© 2000 RAS, MNRAS 000, 1–15

On the Assembly History of Dark Matter Haloes 5
Figure 1. Panels in the upper row show the (unconditional) halo mass functions at 4 different redshifts, as indicated. Different symbols(each with Poissonian error bars) correspond to 5 different PINOCCHIO simulations randomly selected from P0, each with a differentmass resolution. Dashed and solid lines correspond to the PS and SMT01 mass functions, respectively, and are shown for comparison.Panels in the lower row show the percentual difference between the PS and SMT01 mass functions (dashed lines) and that between thePINOCCHIO and the SMT01 mass functions (symbols with errorbars). Clearly, the PS mass function overestimates (underestimates)the number of small (high) mass haloes, while PINOCCHIO yields mass functions that are in excellent agreement with SMT01 (andthus with N-body simulations). Note that the SMT01 halo mass function best fits the mass function of simulated halos that is identifiedwith an FOF linking length of 0.2 times the mean particle separation. The mean density of a halo so seletced is similar to that within avirialized halo based on the spherical collapse model. PINOCCHIO haloes and PS haloes are all defined so that the mean density withina halo is similar to that based on the spherical collapse model.
dius of a halo of M particles. If more than one Lagrangianneighbor has already collapsed, it is simultaneously checkedwhether these haloes merge. This occurs whenever, againat the time of collapse, the mutual Eulerian distance be-tween these haloes is d 6 fMRM , where RM refers to thelarger halo. Note that with this description, up to six haloesmay merge at a given time. The collapsing particles that ac-cording to these criteria do not accrete onto a halo at theircollapse time are assigned to a filament. In order to mimicthe accretion of filaments onto haloes, filament particles canbe accreted by a dark matter halo at a later stage whenthey neighbor (in Lagrangian space) an accreting particle.Finally, in high density regions it can happen that pairs ofhaloes that are able to merge are not touched by newly col-lapsing particles for a long time. Therefore, at certain timeintervals pairs of touching haloes are merged if they obeythe above merging condition.
The accretion and merging algorithm described abovehas five free parameters. In addition to the parameters faand fM three additional free parameters have been intro-duced by Monaco et al. (2002b). We refer the reader tothis paper for details. This relatively large amount of free-dom may seem a weakness of PINOCCHIO. However, it isimportant to realize that even N-body codes require somefree parameters, such as the linking-length in the Friends-Of-Friends (FOF) algorithm used to identify dark matter
haloes. Furthermore, we do not consider these parametersas free in what follows. Rather, we adopt the values advo-cated by Monaco et al. (2002a,b), which they obtained bytuning PINOCCHIO to reproduce the conditional and un-conditional mass function of N-body simulations.
3 SIMULATIONS
In this paper we use PINOCCHIO simulations to study themass assembly histories (MAHs) of dark matter haloes. Wefollow previous studies (Lacey & Cole 1993; Eisenstein &Loeb 1996; Nusser & Sheth 1999; van den Bosch 2002a)and define the MAH, M(z), of a halo as the main trunk ofits merger tree: at each redshift, the mass M(z) is associ-ated with the mass of the most massive progenitor at thisredshift, and we follow this progenitor, and this progenitoronly, further back in time. In this way, this ‘main progeni-tor halo’ never accretes other haloes that are more massivethan itself. Note that although at each branching point wefollow the most massive branch, this does not necessarilyimply that the main progenitor is also the most massive ofall progenitors at any given redshift.
Below we describe the PINOCCHIO simulations, theN-body simulations, and the EPS method used to constructMAHs.
c© 2000 RAS, MNRAS 000, 1–15

6 Li, Mo, van den Bosch & Lin
Figure 2. The mass assembly histories of dark matter haloeswith present-day masses in the four mass bins as indicated inthe panels. The upper two panels are based on the 100h−1Mpc-box simulations, P1 and S1, while the lower two panels use datafrom the 300h−1Mpc-box simulations, P2 and S2. The thin linesare 40 MAHs randomly selected from the PINOCCHIO simula-tions. The thick solid line in each panel shows the average ofall the MAHs obtained in the PINOCCHIO simulaions in thecorresponding mass bin. The thick dotted line shows the averageMAH extracted from the simulations. The thick dashed line showsthe average MAH obtained from 3000 EPS realizations (properlysampled from halo mass function).
Table 1. Ensemble of PINOCCHIO simulations (P0)
Box size (h−1 Mpc) Nrun Mp (h−1 M⊙) NMAH
20 12 4.0× 10⁷ 2,69040 8 3.2× 10⁸ 1,86360 8 1.1× 10⁹ 79680 6 2.5× 10⁹ 1,438100 6 5.0× 10⁹ 2,799140 4 1.4× 10¹⁰ 410160 2 2.0× 10¹⁰ 299200 9 4.0× 10¹⁰ 2,629
A listing of the PINOCCHIO simulations used in this paper. Allsimulations use 2563 particles and adopt the standard ΛCDMconcordance cosmology. In order to get good statistics, we choosea combination of box sizes so that we can select thousands of well-resolved (with more than 2000 particles) haloes in each mass binwe adopt in the paper. This ensemble of PINOCCHIO simulations
is referred to as ‘P0’ in the text. The first column of Table 1 liststhe box size of the simulation in h−1 Mpc. The second columnlists the number of independent realizations run. The particlemass Mp (in h−1 M⊙) is listed in the third column, while thefourth column lists the total number of haloes (summed over allNrun realizations) with more than 2000 particles and for which aMAH has been obtained.
Figure 3. The dashed curve in each panel shows the differencebetween the average MAHs predicted by the EPS model and bythe N-body simulation, while the solid curve shows the differencebetween PINOCCHIO prediction and N-body simulation. The theupper two panels use data from P1 and S1, while the lower twopanels use data from P2 and S2. Data are not shown for z >
∼ 3because the MAHs are not well represented at such high redshiftsin the simulations.
Figure 4. The standard deviation of the MAHs, SM(z), normal-ized by the average MAH, M(z), in four mass bins. Solid linesare results from PINOCCHIO, while dotted lines are results fromN-body simulations. As in Fig. 2 and Fig. 3, the upper two pan-els use data from P1 and S1, while the lower two panels use datafrom P2 and S2.
c© 2000 RAS, MNRAS 000, 1–15

On the Assembly History of Dark Matter Haloes 7
3.1 PINOCCHIO simulations
Because the progenitors of a present-day halo becomesmaller at higher redshift, we can only follow the MAHsto a sufficiently high redshift if the halo at z = 0 contains alarge enough number of particles. When constructing MAHswith PINOCCHIO, we only use haloes that contain morethan 2000 particles at the present time, and we trace eachMAH to the redshift at which its main progenitor containsless than 10 particles. In order to cover a large range ofhalo masses, we have carried out 55 PINOCCHIO simula-tions with 2563 particles each and spanning a wide rangeof box sizes and particle masses (see Table 1, we call thissuite of PINOCCHIO simulations P0 hereafter). The choiceof box sizes ensures that there are several thousand well-resolved haloes in each of the mass bins considered. Each ofthese simulations takes only about 6 hours of CPU time on acommon PC (including the actual analysis), clearly demon-strating its advantage over regular N-body simulations. Thissuite of PINOCCHIO simulations has adopted the ΛCDMconcordance cosmology with Ωm = 0.3, ΩΛ = 0.7, h = 0.7and σ8 = 0.9.
With simulation box sizes ranging from 20 h−1Mpc to200h−1Mpc, and particle masses ranging from 4×10⁷h−1M⊙
to 4×10¹⁰h−1M⊙, we are able to study the MAHs of present-day haloes with masses > 8 × 10¹⁰h−1 M⊙. The construc-tion of the MAHs is straightforward: PINOCCHIO outputsa halo mass every time a merger occurs, i.e., when a halowith more than 10 particles merges into the main branch. Ifwe require an estimate of the halo mass at any intermediateredshift, z, we use linear interpolation in log(1+ z) betweenthe two adjacent output redshifts.
3.2 N-body simulations
For comparison we also used MAHs extracted from two setsof N-body simulations (referred to as S1 and S2). These N-body simulations follow the evolution of 5123 particles in aperiodic box of 100h−1Mpc (S1) and 300h−1Mpc (S2) on aside, assuming slightly different cosmologies (see Table 2 fordetails). The snapshot outputs of each simulation are evenlyplaced at 60 redshifts between z = 0 and z = 15 in ln(1+ z)space.
In each simulation and at each output, haloes are identi-fied using the standard FOF algorithm with a linking lengthof b = 0.2. Haloes obtained with this linking length have amean overdensity of ∼ 180. A halo at redshift z1 is identi-fied as a progenitor of a halo at z2 < z1 if more than half ofits mass is included in the halo at z2. The resulting lists ofprogenitor haloes are used to construct the MAHs. In ouranalysis, we only use haloes more massive than 1011h−1 M⊙
at the present time in S1 and halos more massive than1013h−1 M⊙ in S2. Thus, in each simulation only halos withmore than ∼ 600 particles at z = 0 are used, which allowsus to trace the MAHs to sufficiently high redshift with suf-ficiently high resolution. For comparison, we also generatetwo sets of PINOCCHIO simulations, P1 and P2, using ex-actly the same numbers of particles and cosmologies as inS1 and S2, respectively (see Table 2).
3.3 Monte-Carlo simulations
We also generate MAHs using Monte-Carlo simulationsbased on the standard EPS formalism. We adopt the N-branch tree method with accretion suggested by Somerville& Kolatt (1999, hereafter SK99). This method yields morereliable MAHs than for example the binary-tree method ofLacey & Cole (1993). In particular, it ensures exact massconservation, and yields conditional mass functions that arein good agreement with direct predictions from EPS theory(i.e., the method is self-consistent).
To construct a merger tree for a parent halo of mass Mthe SK99 method works as follows. First a value for ∆S isdrawn from the mass-weighted probability function
P (∆S,∆ω) d∆S =1√2π
∆ω
∆S3/2exp
[− (∆ω2)
2∆S
]d∆S (12)
(cf. equation [4]). Here ∆ω is a measure for the time stepused in the merger tree, and is a free parameter (see below).The progenitor mass,Mp, corresponding to ∆S follows fromσ2(Mp) = σ2(M) + ∆S. With each new progenitor it ischecked whether the sum of the progenitor masses drawnthus far exceeds the mass of the parent, M . If this is thecase the progenitor is rejected and a new progenitor massis drawn. Any progenitor with Mp < Mmin is added to themass componentMacc that is considered to be accreted ontothe parent in a smooth fashion (i.e., the formation history ofthese small mass progenitors is not followed further back intime). Here Mmin is a free parameter that has to be chosensufficiently small. This procedure is repeated until the totalmass left, Mleft = M − Macc −
∑Mp, is less than Mmin.
This remaining mass is assigned to Macc and one moveson to the next time step. For the construction of MAHs,however, it is not necessary to construct an entire set ofprogenitors. Rather, at each time step, one can stop oncethe most massive progenitor drawn thus far is more massivethan Mleft. This has the additional advantage that one doesnot have to define a minimum progenitor mass Mmin (seevan den Bosch 2002a for details).
In principle, since the upcrossing of trajectories througha boundary is a Markov process, the statistics of progenitormasses should be independent of the time steps taken. How-ever, the SK99 algorithm is based on the single halo proba-bility (equation [12]), which does not contain any informa-tion about the set of progenitors that make up the massof M . In fact, mass conservation is enforced ‘by hand’, byrejecting progenitor masses that overflow the mass budget.As shown in van den Bosch (2002a), this results in a timestep dependency, but only for relatively large time steps. Forsufficiently small values of ∆ω the algorithm outlined aboveyields accurate and robust results (see also SK99). Through-out this paper we adopt a timestep of ∆z = 0.05. Our testswith different values of ∆z from 0.01 to 0.05 have shownthat this time step is small enough to achieve stable results,that is, when we decrease the time step to ∆z = 0.01, thechange in the average MAH is less than 1%.
3.4 Comparison
We now compare the MAHs obtained with all three methodsdiscussed above. The upper panels of Fig. 1 plot the (un-conditional) halo mass functions at four different redshifts,
c© 2000 RAS, MNRAS 000, 1–15

8 Li, Mo, van den Bosch & Lin
Table 2. Reference PINOCCHIO and N-body simulations
Simulation Name Np Box size (h−1 Mpc) Mp(h−1 M⊙) Ωm ΩΛ h σ8
S1 (N-body) 5123 100 5.5× 10⁸ 0.268 0.732 0.71 0.85P1 (PINOCCHIO) 5123 100 5.5× 10⁸ 0.268 0.732 0.71 0.85
S2 (N-body) 5123 300 1.3× 10¹¹ 0.236 0.764 0.73 0.74P2 (PINOCCHIO) 5123 300 1.3× 10¹¹ 0.236 0.764 0.73 0.74
as indicated, obtained from 5 arbitrary PINOCCHIO runswith different box sizes in P0. Dashed lines correspond to theanalytical halo mass functions obtained using the standardPS formalism (equation [1]), while the solid lines indicatethe mass functions of SMT01 based on ellipsoidal collapse.The latter have been shown to accurately match the massfunctions obtained from N-body simulations (e.g., Sheth &Tormen, 1999; SMT01). The symbols in the lower panels ofFig. 1 plot the differences between the PINOCCHIO and theSMT01 mass functions, while the dashed lines indicate thedifferences between the PS and the SMT01 mass functions.Clearly, the PINOCCHIO mass functions are in excellentagreement with those of SMT01, and thus also with thoseobtained from N-body simulations. In addition, Taffoni etal. (2002) have shown that PINOCCHIO also accuratelymatches the conditional mass functions obtained from nu-merical simulations. We now investigate whether the actualMAHs obtained from PINOCCHIO are also in good agree-ment with the numerical simulations.
Fig. 2 plots the average MAHs obtained from thePINOCCHIO, N-body and EPS simulations, for halos withthe present masses in the following four mass ranges:log(M0/h
−1 M⊙) =11-12, 12-13, 13-14 and 14-15. For com-parison, in each panel we also show 40 randomly selectedMAHs from the PINOCCHIO simulations (P1 and P2). Toensure mass resolution, results for the low-mass bins (thetwo upper panels) are based on simulations with the smallbox size, i.e. S1 and P1. Results for the high-mass bins (thetwo lower panels) are based only on simulations with thelarge-box size (S2 and P2) in order to obtain a large numberof massive halos. The thick solid curve in each panel corre-sponds to the average MAH obtained by averaging over allthe halos, in the mass range indicated, found in one of thePINOCCHIO simulations (P1 and P2). The thick dashedlines correspond to the average MAHs obtained from 3000EPS Monte-Carlo simulations (properly weighted by thehalo mass function). The thick dotted lines show the av-erage MAHs obtained from the two N-body simulations (S1and S2). In Fig. 3, a detailed comparison between these re-sults are presented. As can be seen in Fig. 3, the averageMAHs obtained with PINOCCHIO are in good agreementwith those obtained from the N-body simulations (with dif-ferences smaller than 10%). Note that there are uncertaintiesin the identification of dark haloes in N-body simulations us-ing the FOF algorithm. Sometimes two physically separatedhaloes can be linked together and identified as one halo ifthey are bridged by dark matter particles, which can changethe halo mass by 5% on average. The agreement betweenPINOCCHIO and simulation shown in Fig. 3 is probably asgood as one can hope for. The EPS model, however, yields
MAHs that are systematically offset with respect to thoseobtained from the N-body simulations: the EPS formalismpredicts that haloes assemble too late (see also van denBosch 2002a; Lin, Jing & Lin 2003; W02). Fig. 4 shows theratio between the standard deviation of the MAHs, SM(z),and the average MAH M(z), as a function of redshift z. Asone can see, the agreement between the PINOCCHIO andN-body simulations is also reasonably good.
In summary, the Lagrangian Perturbation code PINOC-CHIO yields halo mass functions (both conditional and un-conditional), and mass assembly histories that are all ingood agreement with N-body simulations. In particular, itworks much better than the standard PS formalism, and yetis much faster to run than numerical simulations. PINOC-CHIO therefore provides a unique and fast platform for ac-curate investigations of the assembly histories of a large,statistical sample of CDM haloes.
4 HALO FORMATION TIMES
Having demonstrated that the PINOCCHIO MAHs are ingood agreement with those obtained from N-body simula-tions, we now use the suite of 55 PINOCCHIO simulations,P0, listed in Table 1 to investigate the assembly historiesof a large sample of haloes spanning a wide range in halomasses.
The assembly history of a halo can be parameterized bya formation time (or equivalently formation redshift), whichcharacterizes when the halo assembles. However, since theassembly of a halo is a continuous process, different ‘forma-tion times’ can be defined, each focusing on a different aspectof the MAH. Here we define and compare the following fourformation redshifts:
(i) zhalf : This is the redshift at which the halo has as-sembled half of its final mass. This formation time has beenwidely used in the literature.
(ii) zlmm: This is redshift at which the halo experiencesits last major merger. Unless stated otherwise we define amajor merger as one in which the mass ratio between thetwo progenitors is larger than 1/3. This definition is similarto zjump defined in Cohn & White (2005). Major mergersmay have played an important role in transforming galaxiesand in regulating star formation in galaxies. Their frequencyis therefore important to quantify.
(iii) zvvir: This is the redshift at which the virial velocityof a halo, Vvir, defined as the circular velocity at the virialradius, reaches its current value, V0, for the first time. SinceVvir is a measure for the depth of the potential well, zvvir
c© 2000 RAS, MNRAS 000, 1–15
On the Assembly History of Dark Matter Haloes 9
characterizes the formation time of the halo’s gravitationalpotential.
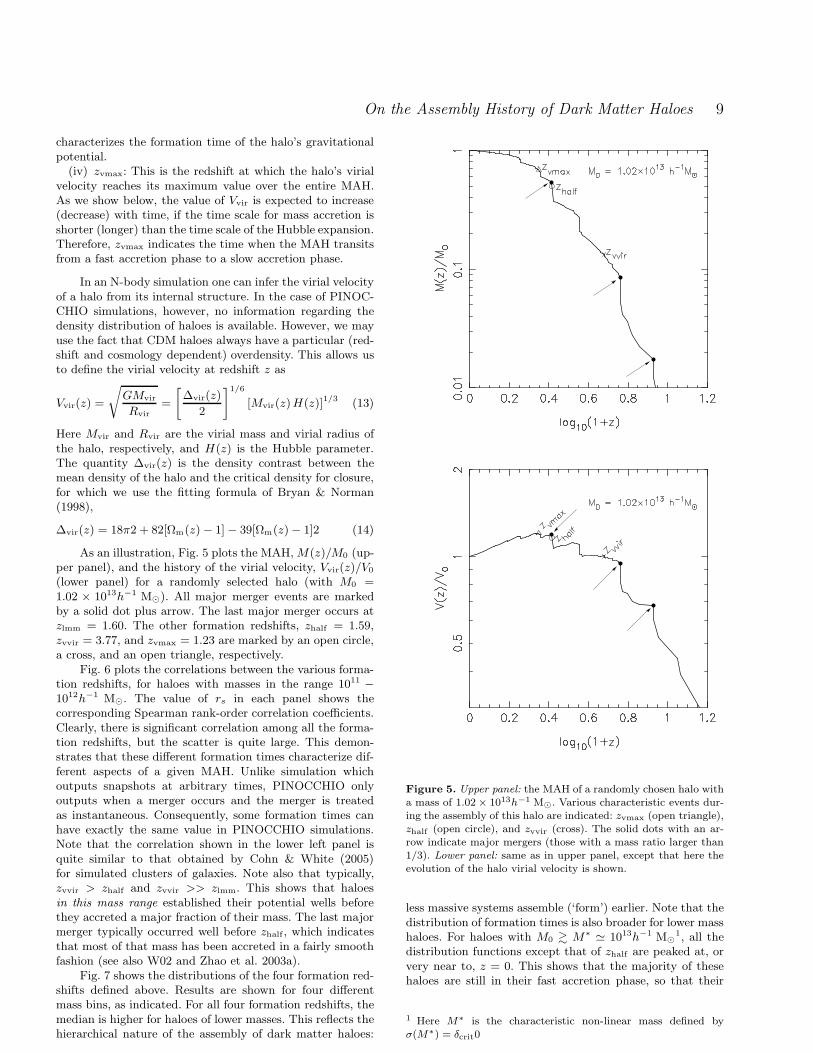
(iv) zvmax: This is the redshift at which the halo’s virialvelocity reaches its maximum value over the entire MAH.As we show below, the value of Vvir is expected to increase(decrease) with time, if the time scale for mass accretion isshorter (longer) than the time scale of the Hubble expansion.Therefore, zvmax indicates the time when the MAH transitsfrom a fast accretion phase to a slow accretion phase.
In an N-body simulation one can infer the virial velocityof a halo from its internal structure. In the case of PINOC-CHIO simulations, however, no information regarding thedensity distribution of haloes is available. However, we mayuse the fact that CDM haloes always have a particular (red-shift and cosmology dependent) overdensity. This allows usto define the virial velocity at redshift z as
Vvir(z) =
√GMvir
Rvir
=
[∆vir(z)
2
]1/6[Mvir(z)H(z)]1/3 (13)
Here Mvir and Rvir are the virial mass and virial radius ofthe halo, respectively, and H(z) is the Hubble parameter.The quantity ∆vir(z) is the density contrast between themean density of the halo and the critical density for closure,for which we use the fitting formula of Bryan & Norman(1998),
∆vir(z) = 18π2 + 82[Ωm(z)− 1]− 39[Ωm(z)− 1]2 (14)
As an illustration, Fig. 5 plots the MAH,M(z)/M0 (up-per panel), and the history of the virial velocity, Vvir(z)/V0
(lower panel) for a randomly selected halo (with M0 =1.02 × 10¹³h−1 M⊙). All major merger events are markedby a solid dot plus arrow. The last major merger occurs atzlmm = 1.60. The other formation redshifts, zhalf = 1.59,zvvir = 3.77, and zvmax = 1.23 are marked by an open circle,a cross, and an open triangle, respectively.
Fig. 6 plots the correlations between the various forma-tion redshifts, for haloes with masses in the range 1011 −1012h−1 M⊙. The value of rs in each panel shows thecorresponding Spearman rank-order correlation coefficients.Clearly, there is significant correlation among all the forma-tion redshifts, but the scatter is quite large. This demon-strates that these different formation times characterize dif-ferent aspects of a given MAH. Unlike simulation whichoutputs snapshots at arbitrary times, PINOCCHIO onlyoutputs when a merger occurs and the merger is treatedas instantaneous. Consequently, some formation times canhave exactly the same value in PINOCCHIO simulations.Note that the correlation shown in the lower left panel isquite similar to that obtained by Cohn & White (2005)for simulated clusters of galaxies. Note also that typically,zvvir > zhalf and zvvir >> zlmm. This shows that haloesin this mass range established their potential wells beforethey accreted a major fraction of their mass. The last majormerger typically occurred well before zhalf , which indicatesthat most of that mass has been accreted in a fairly smoothfashion (see also W02 and Zhao et al. 2003a).
Fig. 7 shows the distributions of the four formation red-shifts defined above. Results are shown for four differentmass bins, as indicated. For all four formation redshifts, themedian is higher for haloes of lower masses. This reflects thehierarchical nature of the assembly of dark matter haloes:
Figure 5. Upper panel: the MAH of a randomly chosen halo witha mass of 1.02× 10¹³h−1 M⊙. Various characteristic events dur-ing the assembly of this halo are indicated: zvmax (open triangle),zhalf (open circle), and zvvir (cross). The solid dots with an ar-row indicate major mergers (those with a mass ratio larger than1/3). Lower panel: same as in upper panel, except that here theevolution of the halo virial velocity is shown.
less massive systems assemble (‘form’) earlier. Note that thedistribution of formation times is also broader for lower masshaloes. For haloes with M0 & M∗ ≃ 1013h−1 M⊙
1, all thedistribution functions except that of zhalf are peaked at, orvery near to, z = 0. This shows that the majority of thesehaloes are still in their fast accretion phase, so that their
1 Here M∗ is the characteristic non-linear mass defined byσ(M∗) = δcrit0
c© 2000 RAS, MNRAS 000, 1–15

10 Li, Mo, van den Bosch & Lin
Figure 6. The correlations between various halo formationredshifts for haloes with present day masses in the range1011h−1 M⊙ 6M 6 1012h−1 M⊙. The value of rs in each panelshows the corresponding Spearman rank-order correlation coeffi-cient. Due to the finite time resolution in the PINOCCHIO sim-ulations, in some cases the values of two formation times can bethe same.
potential wells are still deepening with time. On the otherhand, haloes with M0 ≪ M∗ typically have zvvir > zhalfand zvvir > zlmm (cf. Fig. 6), indicating that their potentialwells have already been established, despite the fact thatthey continue to accrete appreciable amounts of mass.
Fig. 8 shows the distributions of the ratioM(zform)/M0,with zform one of our four formation redshifts. By defi-nition, the distribution of M(zhalf)/M0 is a δ-function atM(zform)/M0 = 0.5, and is therefore not shown. For haloeswith M0 < 1013h−1 M⊙, the virial velocity has alreadyreached the present day value when the halo has only as-sembled 10%-20% of its final mass. Thus, these systems as-semble most of their mass without significant changes to thedepth of their potential well. Only for massive haloes withM0 & 1014h−1M⊙ is the median ofM(zvvir)/M0 larger than0.5, implying that they have assembled the majority of theirpresent day mass through major (violent) mergers.
If we define major mergers as those with a progen-itor mass ratio that is at least 1/3, the distribution ofM(zlmm)/M0 is remarkably flat. This implies that somehaloes accrete a large amount of mass after their last major
Figure 7. The probability distributions of zhalf (dotted lines),zvvir (dashed lines), zvmax (dot-dashed lines) and zlmm (thicksolid lines). Results are shown for four different mass bins, asindicated in each panel. Note that the scale of the four panels isdifferent! See text for a detailed discussion.
Figure 8. The distributions of the halo mass fraction at variousformation times. Different line-styles correspond to different defi-nitions of the formation time, as indicated in the upper left-handpanel. As in Fig. 7, different panels correspond to different halomass bins, as indicated.
c© 2000 RAS, MNRAS 000, 1–15

On the Assembly History of Dark Matter Haloes 11
Figure 9. The median, 〈Njump〉, and dispersion, σNjump, of the
distribution of the number of mass jumps, Njump, in the MAHs,versus n (see text for definitions). Left panels show comparisonbetween P1 and S1, while right panels show comparison betweenP2 and S2. Note that the agreement between the PINOCCHIOsimulations and N-body simulations is remarkable and the massdependence is rather weak.
merger, while for others the last major merger signals thelast significant mass accretion event. Remarkably, the dis-tribution of M(zlmm)/M0 is virtually independent of M0.For low mass haloes, the flatness of the distribution ofM(zlmm)/M0 simply reflects the broad distribution of zlmm.However, for massive haloes with M & M∗, the distribu-tion of zlmm is fairly narrow. Therefore, for these haloesthe flatness of the M(zlmm)/M0 distribution implies that,since their last major merger, they have accreted a signifi-cant amount of mass due to minor mergers. Since the lastmajor merger occurred fairly recently, this is another indi-cation that massive haloes are still in their fast accretionphase.
5 THE PROPERTIES OF MAJOR MERGERS
During the assembly of dark matter haloes, major merg-ers play an important role. Not only does a major mergeradd a significant amount of mass, it also deepens the halo’spotential well. Furthermore, in current models of galaxy for-mation, a major merger of two galaxy-sized haloes is also ex-pected to result in a merger of their central galaxies, proba-bly triggering a starburst and leading to the formation of anelliptical galaxy. Therefore, it is important to quantify thefrequency of major mergers during the formation of CDMhaloes.
As mentioned above, in a PINOCCHIO simulationmergers of dark matter haloes are treated as instanta-neous events, and the masses of the merger progenitorsare recorded whenever a merger happens. This makes itvery convenient to identify mergers in PINOCCHIO. On
the other hand, in an N-body simulation halos are iden-tified only in a number of snapshots, and so the accuracyof identifying mergers is limited by the time intervals of thesnapshots. For example, if we define major mergers by look-ing for halos for which the mass ratio between its secondlargest and largest progenitors exceeds 1/3 in the last snap-shot, we may miss major mergers in which the two pro-genitors were assembled during the two snapshots. On theother hand, if we identify major mergers in a simulation bylooking for halos whose masses increase by a factor between1/4 and 1 in the next snapshot, we will overestimate thenumber of major merger events, because some of the halosmay have increased their masses by accretion of small halosrather than through major mergers. In the simulations usedhere (S1 and S2), the time intervals between successive snap-shots are about 0.3-0.6 Gyr, comparable to the time scalesof major mergers, and the two definitions of major mergersdescribed above lead to a factor of 2 difference in the numberof major mergers. Because of this, it is difficult to make adirect comparison between PINOCCHIO and N-body simu-lations in their predictions for the number of major mergers.In order to check the reliability of PINOCCHIO in predict-ing the number of major mergers, we use quantities thatare related to the number of major mergers but yet can beobtained from both our N-body and PINOCCHIO simula-tions. We first construct PINOCCHIO haloes at each of thesnapshots of our N-body simulations. We then follow theMAH of each of the present halo using the snapshots andidentify the number of events in which the mass of a haloincreases by a factor exceeding 1/n between two successivesnapshots, where n is an integer used to specify the heightsof the jumps. In practice, we trace the MAH backward intime until the mass of the halo is 1% of the final halo mass.Since exactly the same analysis can also be carried out forthe N-body simulations, we can compare, for a given n andfor halos of given mass at the present time, the statisticsof the number of jumps, Njump, predicted by PINOCCHIOsimulations with that given by the N-body simulations. Wefound that the distribution of Njump for a given n can bewell fit by a Gaussion distribution, and in Fig. 9 we plot themedian 〈Njump〉 and standard deviation σNjump
versus n, inseveral mass bins. The agreement between PINOCCHIO andN-body simulations is remarkably good. Although Njump isnot exactly the number of major mergers, the good agree-ment between PINOCCHIO and N-body simulations makesus believe that it is reliable to use PINOCCHIO to makepredictions for the statistics of major mergers.
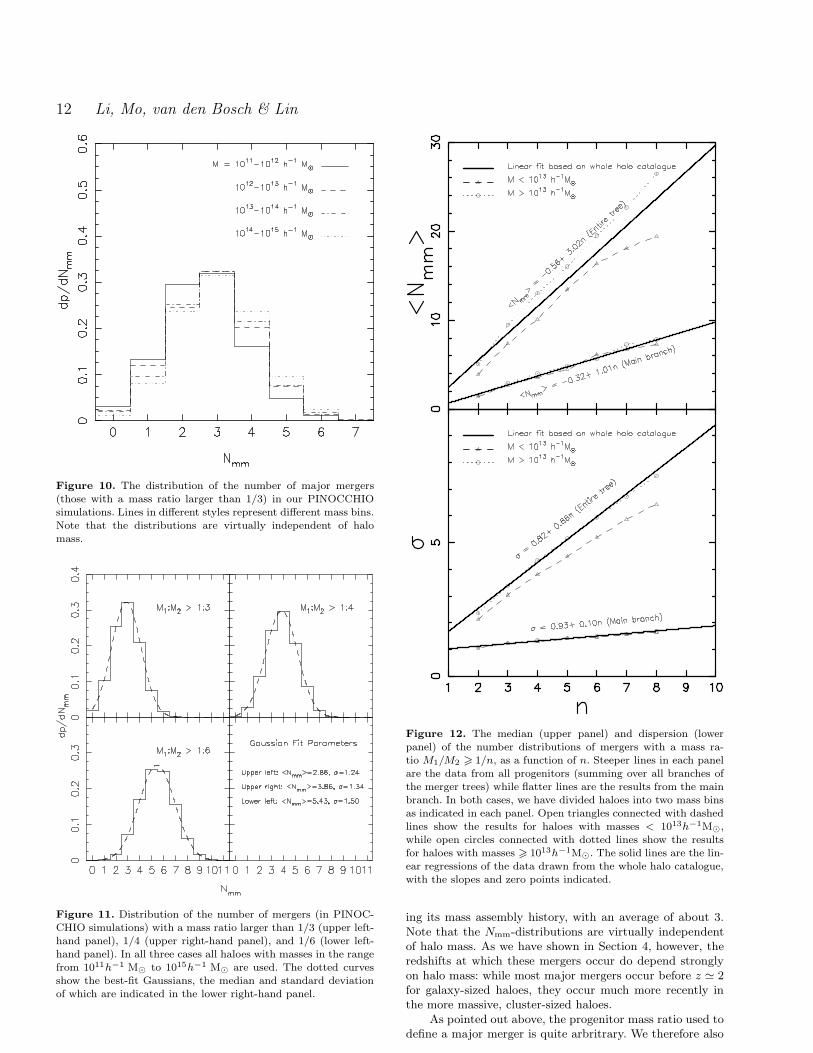
In order to investigate the statistics of major mergersin detail, we count the number of major mergers for eachof the halos in the ensemble of simulations P0. Here againwe only trace a halo back to a time when the mass of itsmain progenitor is 1% of the halo’s final mass. This choiceof lower mass limit is quite arbitrary. However, some limitis necessary, because otherwise there will be a large num-ber of major mergers involving progenitors with excessivelysmall masses at very early times. Furthermore this masslimit is also the one we use in defining Njump. The largenumber of halos in the ensemble ensures that each mass bincontains about 2000 haloes. Fig. 10 plots the distributionsof the number of major mergers (with a progenitor massratio > 1/3) for haloes of different masses at the presenttime. A halo experiences about 1 to 5 major mergers dur-
c© 2000 RAS, MNRAS 000, 1–15
12 Li, Mo, van den Bosch & Lin
Figure 10. The distribution of the number of major mergers(those with a mass ratio larger than 1/3) in our PINOCCHIOsimulations. Lines in different styles represent different mass bins.Note that the distributions are virtually independent of halomass.
Figure 11. Distribution of the number of mergers (in PINOC-CHIO simulations) with a mass ratio larger than 1/3 (upper left-hand panel), 1/4 (upper right-hand panel), and 1/6 (lower left-hand panel). In all three cases all haloes with masses in the rangefrom 1011h−1 M⊙ to 1015h−1 M⊙ are used. The dotted curvesshow the best-fit Gaussians, the median and standard deviationof which are indicated in the lower right-hand panel.
Figure 12. The median (upper panel) and dispersion (lowerpanel) of the number distributions of mergers with a mass ra-tio M1/M2 > 1/n, as a function of n. Steeper lines in each panelare the data from all progenitors (summing over all branches ofthe merger trees) while flatter lines are the results from the mainbranch. In both cases, we have divided haloes into two mass binsas indicated in each panel. Open triangles connected with dashedlines show the results for haloes with masses < 1013h−1M⊙,while open circles connected with dotted lines show the resultsfor haloes with masses > 1013h−1M⊙. The solid lines are the lin-ear regressions of the data drawn from the whole halo catalogue,with the slopes and zero points indicated.
ing its mass assembly history, with an average of about 3.Note that the Nmm-distributions are virtually independentof halo mass. As we have shown in Section 4, however, theredshifts at which these mergers occur do depend stronglyon halo mass: while most major mergers occur before z ≃ 2for galaxy-sized haloes, they occur much more recently inthe more massive, cluster-sized haloes.
As pointed out above, the progenitor mass ratio used todefine a major merger is quite arbritrary. We therefore also
c© 2000 RAS, MNRAS 000, 1–15

On the Assembly History of Dark Matter Haloes 13
investigate the frequency of mergers with a mass ratio largerthan 1/n with n = 2, 4, 5, 6, 7, 8 (in addition to the n = 3 dis-cussed thus far). We find that even with these values of n thedistributions of Nmm are still virtually independent of halomass. This allows us to consider a single Nmm-distributionfor haloes of all masses. Fig. 11 plots these distributions forthree different values of n as indicated. Each of these distri-butions is reasonably well described by a Gaussian function(dashed curves). Note that the use of a Gaussian functionis not entirely appropriate, because Nmm cannot be neg-ative. However, since the median value of Nmm is, in allcases, significantly larger than the width of the distribution,a Gaussian fit is still appropriate. To show how the Nmm-distribution depends on n, we plot, as in Fig. 12, the medianand the dispersion of this distribution as functions of n. Asone can see, both the median and the dispersion increaseroughly linearly with n, but the slope for the median (∼ 1)is much larger than that for the dispersion (∼ 0.1). Notethat the results for haloes with masses < 1013h−1 M⊙ and> 1013h−1M⊙ are similar, suggesting the distribution of thenumber of major mergers is quite independent of halo mass.
Thus far we have only focused on the (major) mergerevents that merge into the main branch of the merger tree.For comparison, we also consider the merger rates of all
progenitors, independent of whether they are part of themain branch or not. As before we only consider progenitorswith masses in excess of one percent of the final halo mass.The skewer lines in Fig. 12 show the median and dispersionof the number of such mergers as functions of n. Here again,both the median and dispersion have roughly linear relationswith n. The median number of such major mergers is roughlythree times as high as that of major mergers associated withthe main branch, and the dispersion increases with n muchfaster.
As mentioned above, major mergers are expected to beaccompanied by rapid changes of the halo’s potential well,due to a resulting phase of violent relaxation. To show suchrelation in more detail, Fig. 13 shows the distributions of thenumber of major mergers (defined with n = 3) before andafter the formation redshift zvmax. For haloes in all massranges, only a very small fraction (less than 5%) experi-ences a major merger at z < zvmax. This demonstrates onceagain that the growth of the virial velocity is mainly causedby major mergers. This result may have important implica-tions for understanding the structure of dark matter halos.As shown in Lu et al. (2006), if the buildup of the potentialwell associated with a dark matter halo is through majormergers, then the velocities of dark matter particles may beeffectively randomized, a condition that may lead to a den-sity profile close to the universal density profile observed inN-body simulations. Also, if galaxy disks are formed duringa period when no major mergers occur, our result suggeststhat the potential wells of the halos of spiral galaxies shouldchange little during disk formation.
6 CONCLUSIONS
In the current paradigm, galaxies are thought to form inextended cold dark matter haloes. A detailed understand-ing of galaxy formation, therefore, requires a detailed un-derstanding of how these dark matter haloes assemble. Halo
Figure 13. The probability distributions of the number of majormergers (those with a mass ratio larger than 1/3) before (solidlines) and after (dashed lines) zvmax. Note that the vast majorityof major mergers occur at z > zvmax, demonstrating that thegrowth of the halo’s virial velocity is mainly driven by majormergers.
formation histories are typically studied using either numer-ical simulations, which are time consuming, or using the ex-tended Press Schechter formalism, which has been shownto be of insufficient accuracy. In this paper, we have in-vestigated the growth history of dark matter haloes usingthe Lagrangian perturbation code PINOCCHIO, developedby Monaco et al. (2002a). We have demonstrated that themass assembly histories (MAHs) obtained by PINOCCHIOare in good agreement with those obtained using N-bodysimulations. Since PINOCCHIO is very fast to run, doesnot require any special hardware such as supercomputers orBeowulf clusters, and does not require any labor intensiveanalysis, it provides a unique and powerful tool to study thestatistics and assembly histories of large samples of darkmatter haloes for different cosmologies.
Confirming earlier results based on N-body simulations(e.g. W02; Zhao et al. 2003a,b), we find that typical MAHscan be separated into two phases: an early, fast accretionphase dominated by major mergers, and a late, slow accre-tion phase during which the mass is mainly accreted fromminor mergers. However, the MAHs of individual haloes arecomplicated, and therefore difficult to parameterize uniquelyby a single parameter. We therefore defined four differentformation times: the time when a halo acquires half of itsfinal mass, the time when the halo’s potential well is estab-lished, the time when a halo transits from the fast accretionphase to the slow accretion phase, and the time when a haloexperiences its last major merger. Using a large number ofMAHs of haloes spanning a wide range in masses, we stud-ied the correlations between these four formation redshifts,as well as their halo mass dependence. Although all four for-
c© 2000 RAS, MNRAS 000, 1–15

14 Li, Mo, van den Bosch & Lin
mation times are correlated, each correlation reveals a largeramount of scatter.
For all four formation redshifts, it is found that moremassive haloes assemble later, expressing the hierarchicalnature of structure formation. Haloes with masses belowthe characteristic non-linear mass scale, M∗, establish theirpotential wells well before they have acquired half of theirpresent day mass. The potential wells associated with moremassive haloes, however, continue to deepen even at thepresent time. The time when a halo reaches its maximumvirial velocity roughly coincides with the time where theMAH transits from the fast to the slow accretion phase.
If we define major mergers as those with a progenitormass ratio larger than 1/3, then on average each halo ex-periences about 3 major mergers after its main progenitorhas acquired one percent of its present day mass. In addi-tion, we found that the number of major mergers the mainbranch of the merging tree has experienced is linearly corre-lated with the mass ratio between the merging progenitors.For the whole merging tree, the number of major mergers isabout 3 times that of the major mergers in the main branch.The distribution of the number of major mergers a halo hasexperienced is virtually independent of its mass, and the ra-tio between the halo mass immediately after the last majormerger and the final halo mass has a very broad distribution,implying that the role played by major mergers in buildingup the final halo can differ significantly from system to sys-tem.
ACKNOWLEDGMENTS
We are grateful to Pierluigi Monaco, Tom Theuns and Giu-liano Taffoni for making their wonderful code PINOCCHIOpublicly available with an easy to understand manual, and toXi Kang for letting us share his EPS merging tree code. Wealso thank the Shanghai Supercomputer Center, the grantsfrom NFSC (No. 10533030) and Shanghai Key Projects inBasic Research (No. 05XD14019) for the N-body simula-tions used in this paper. HJM would like to acknowledgethe support of NSF AST-0607535, NASA AISR-126270 andNSF IIS-0611948. FvdB acknowledges useful and lively dis-cussions with Risa Wechsler during an early phase of thisproject.
REFERENCES
Alam S.M.K., Bullock J.S., Weinberg D.H., 2002, ApJ, 572,34Audit E., Teyssier R., Alimi J.-M., 1997, A&A, 325, 439Avila-Reese V., Firmani C., 2000, RevMexAA, 36, 23Bertschinger E., Jain B., 1994, ApJ, 431, 486Birnboim Y., Dekel A., 2003, MNRAS, 345, 349Bond J.R., Cole S., Efstathiou G., Kaiser N., 1991,ApJ,379, 440Bond J.R., Myers S., 1996a, ApJS, 103, 1Bond J.R., Myers S., 1996b, ApJS, 103, 41Borgani S., Coles P., Moscardini L., 1994, MNRAS, 271,223Bower R., 1991, MNRAS, 248, 332
Bryan G., Norman M., 1998, ApJ, 555, 240Buchert T., Ehlers J., 1993, MNRAS, 264, 375Bullock J.S., Kolatt T.S., Sigad Y., Somerville R.S.,Kravtsov A.V., Klypin A.A., Primack J.R., Dekel A., 2001,MNRAS, 321, 559Catelan P., 1995, MNRAS, 276, 115Catelan P., Lucchin F., Matarrese S., Porciani C., 1998,MNRAS, 297, 692Chiueh T., Lee J., 2001, ApJ, 555, 83Cohn J.D., Bagla J.S., White M., 2002, MNRAS, 325, 1053Cohn J.D., White M., 2005, preprint (astro-ph/0506213)Cole S., Lacey C.G., Baugh C.M., Frenk C.S., 2000, MN-RAS, 319, 168Eisenstein D.J., Loeb A., 1996, ApJ, 459, 432Eke V.R., Navarro J.F., Steinmetz M., 2001, ApJ, 554, 114Firmani C., Avila-Reese V., 2000, MNRAS, 315, 457Governato F., Babul A., Quinn T., Tozzi P., Baugh C.M.,Katz N., Lake G., 1999, MNRAS, 307, 949Gross M.A.K., Somerville R.S., Primack J.R., Holtzman J.,Klypin A.A., 1998, MNRAS, 301, 81Jain B., Bertschinger E., 1994, ApJ, 431, 495Jenkins A., Frenk C.S., White S.D.M., Colberg J.M., ColeS., Evrard A.E., Couchman H.M.P., Yoshida N., 2001, MN-RAS, 321, 372Kauffmann G., White S.D.M., 1993, MNRAS, 261, 921Kauffmann G., White S.D.M., Guiderdoni B., 1993, MN-RAS, 264, 201Keres D., Katz N., Weinberg D.H., Dave R., 2005, MNRAS,363, 2Lacey C., Cole S., 1993, MNRAS, 262, 627Lanzoni B., Mamon G.A., Guiderdoni B., 2000, MNRAS,312, 781Lee J., Shandarin S., 1998, ApJ, 500, 14Lin L., Chiueh T., Lee J., 2002, ApJ, 574, 527Lin W.P., Jing Y.P., Lin L., 2003, MNRAS, 344, 1327Lu Y., Mo H.J., Katz N., Weinberg M.D., 2006, MNRAS,368, 1931Mo H.J., Jing, Y.P., White, S.D.M., 1996, MNRAS, 282,1096Mo H.J., Mao S.D., 2000, MNRAS, 318, 163Mo H.J., White S.D.M., 1996, MNRAS, 282, 347Mo H.J., White S.D.M., 2002, MNRAS, 336, 112Mo H.J., Jing Y.P., White S.D.M., 1997, MNRAS, 284, 189Monaco P., 1995, ApJ, 447, 23Monaco P., 1998, Fundamentals of Cosmic Physics, Vol. 19,157Monaco P., Theuns T., Taffoni G., Governato F., QuinnT., Stadel J., 2002a, ApJ, 564, 8Monaco P., Theuns T., Taffoni G., 2002b, MNRAS, 331,587Navarro J.F., Frenk C.S., White S.D.M., 1997, ApJ, 490,493Nusser A., Sheth R.K., 1999, MNRAS, 303, 685Peacock J.A., Heavens A.F., 1990, MNRAS, 243, 133Press W., Schechter P., 1974, ApJ, 187, 425Rodrigues D.D.C., Thomas P.A., 1996, MNRAS, 282, 631Sheth R.K., 1998, MNRAS, 300, 1057Sheth R.K., Lemson G., 1999, MNRAS, 305, 946Sheth R.K., Mo H.J., Tormen G., 2001, MNRAS, 323, 1(SMT01)Sheth R.K., Tormen G., 1999, MNRAS, 308, 119Sheth R.K., Tormen G., 2002, MNRAS, 329, 61
c© 2000 RAS, MNRAS 000, 1–15

On the Assembly History of Dark Matter Haloes 15
Somerville R.S., Kolatt T.S., 1999, MNRAS, 305, 1Somerville R.S., Primack J.R., 1999, MNRAS, 310, 1087Somerville R.S., Lemson G., Kolatt T.S., Dekel A., 2000,MNRAS, 316, 479Taffoni G., Monaco P., Theuns T., 2002, MNRAS, 333, 623Tormen G., 1998, MNRAS, 297, 648van den Bosch F.C., 2001, MNRAS, 327, 1334van den Bosch F.C, 2002a, MNRAS, 331, 98van den Bosch F.C, 2002b, MNRAS, 332, 456van den Bosch F.C., Mo H.J., Yang X., 2003, MNRAS, 345,923Wechsler R.H., Bullock J.S., Primack J.R., Kravtsov A.V.,Dekel A., 2002, ApJ, 568, 52 (W02)White S.D.M., Rees M.J., 1978, MNRAS, 183, 341Zel’Dovich Y.B., 1970, A&A, 5, 84Zentner A.R., Bullock J.S., 2002, Phys. Rev. D., 66, 043003Zhao D.H., Mo H.J., Jing Y.P., Borner G., 2003a, MNRAS,339, 12Zhao D.H., Jing Y.P., Mo H.J., Borner G., 2003b, ApJ,597, 9
c© 2000 RAS, MNRAS 000, 1–15