On phasor estimation for voltage sags detection in a … phasor estimation for voltage sags...
7
On phasor estimation for voltage sags detection in a smart grid context Yassine Amirat, Zakarya Oubrahim, Mohamed Benbouzid To cite this version: Yassine Amirat, Zakarya Oubrahim, Mohamed Benbouzid. On phasor estimation for voltage sags detection in a smart grid context. IEEE. IEEE ISIE 2015, Jun 2015, Buzios, Brazil. IEEE, pp.1351-1356, 2015, Proceedings of the 2015 IEEE ISIE. <10.1109/ISIE.2015.7281669>. <hal-01213113> HAL Id: hal-01213113 https://hal.archives-ouvertes.fr/hal-01213113 Submitted on 7 Oct 2015 HAL is a multi-disciplinary open access archive for the deposit and dissemination of sci- entific research documents, whether they are pub- lished or not. The documents may come from teaching and research institutions in France or abroad, or from public or private research centers. L’archive ouverte pluridisciplinaire HAL, est destin´ ee au d´ epˆ ot et ` a la diffusion de documents scientifiques de niveau recherche, publi´ es ou non, ´ emanant des ´ etablissements d’enseignement et de recherche fran¸cais ou ´ etrangers, des laboratoires publics ou priv´ es.
Transcript of On phasor estimation for voltage sags detection in a … phasor estimation for voltage sags...
On phasor estimation for voltage sags detection in a
smart grid context
Yassine Amirat, Zakarya Oubrahim, Mohamed Benbouzid
To cite this version:
Yassine Amirat, Zakarya Oubrahim, Mohamed Benbouzid. On phasor estimation for voltagesags detection in a smart grid context. IEEE. IEEE ISIE 2015, Jun 2015, Buzios, Brazil.IEEE, pp.1351-1356, 2015, Proceedings of the 2015 IEEE ISIE. <10.1109/ISIE.2015.7281669>.<hal-01213113>
HAL Id: hal-01213113
https://hal.archives-ouvertes.fr/hal-01213113
Submitted on 7 Oct 2015
HAL is a multi-disciplinary open accessarchive for the deposit and dissemination of sci-entific research documents, whether they are pub-lished or not. The documents may come fromteaching and research institutions in France orabroad, or from public or private research centers.
L’archive ouverte pluridisciplinaire HAL, estdestinee au depot et a la diffusion de documentsscientifiques de niveau recherche, publies ou non,emanant des etablissements d’enseignement et derecherche francais ou etrangers, des laboratoirespublics ou prives.
On Phasor Estimation for Voltage Sags Detection in a Smart Grid Context
Yassine Amirat1, Zakarya Oubrahim1,2 and Mohamed Benbouzid2 1ISEN Brest, EA 4325 LBMS, Brest, France
2University of Brest, EA 4325 LBMS, Brest, France [email protected]
Abstract—The advent of smart grids have urged a radical
reappraisal of distribution networks and power quality
requirements, and effective use of the network are indexed as the
most important keys for smart grid expansion and deployment
regardless. One of the most efficient ways of effective use of these
grids would be to continuously monitor their conditions. This
allows for early detection of power quality degeneration
facilitating therefore a proactive response, prevent a fault ride-
through the renewable power sources, minimizing downtime, and
maximizing productivity. In this smart grid context, this paper
proposes the evaluation of signal processing tools, namely the
Hilbert transform and the linear Kalman filter to estimate voltage
phasor for voltage sags detection.
Keywords—Smart grid, voltage sag detection, Kalman Filter,
power quality (PQ), Hilbert Transform (HT), symmetrical
components
I. INTRODUCTION
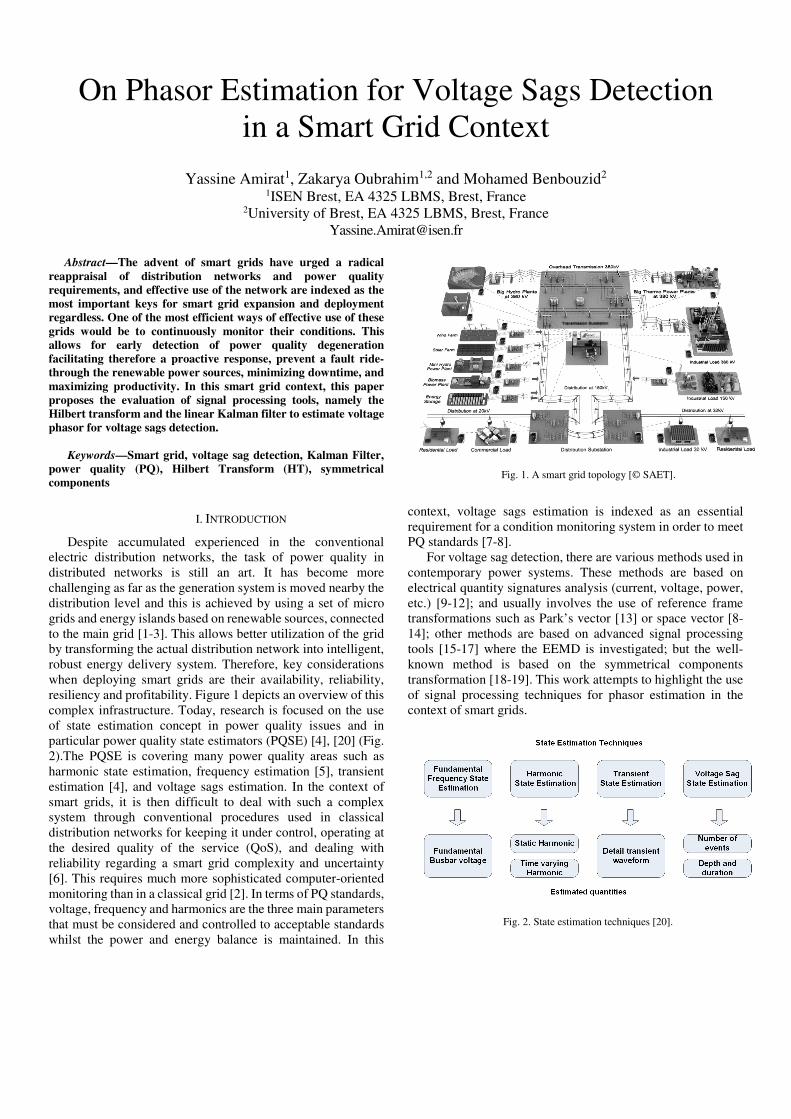
Despite accumulated experienced in the conventional electric distribution networks, the task of power quality in distributed networks is still an art. It has become more challenging as far as the generation system is moved nearby the distribution level and this is achieved by using a set of micro grids and energy islands based on renewable sources, connected to the main grid [1-3]. This allows better utilization of the grid by transforming the actual distribution network into intelligent, robust energy delivery system. Therefore, key considerations when deploying smart grids are their availability, reliability, resiliency and profitability. Figure 1 depicts an overview of this complex infrastructure. Today, research is focused on the use of state estimation concept in power quality issues and in particular power quality state estimators (PQSE) [4], [20] (Fig. 2).The PQSE is covering many power quality areas such as harmonic state estimation, frequency estimation [5], transient estimation [4], and voltage sags estimation. In the context of smart grids, it is then difficult to deal with such a complex system through conventional procedures used in classical distribution networks for keeping it under control, operating at the desired quality of the service (QoS), and dealing with reliability regarding a smart grid complexity and uncertainty [6]. This requires much more sophisticated computer-oriented monitoring than in a classical grid [2]. In terms of PQ standards, voltage, frequency and harmonics are the three main parameters that must be considered and controlled to acceptable standards whilst the power and energy balance is maintained. In this
context, voltage sags estimation is indexed as an essential requirement for a condition monitoring system in order to meet PQ standards [7-8].
For voltage sag detection, there are various methods used in contemporary power systems. These methods are based on electrical quantity signatures analysis (current, voltage, power, etc.) [9-12]; and usually involves the use of reference frame transformations such as Park’s vector [13] or space vector [8-14]; other methods are based on advanced signal processing tools [15-17] where the EEMD is investigated; but the well-known method is based on the symmetrical components transformation [18-19]. This work attempts to highlight the use of signal processing techniques for phasor estimation in the context of smart grids.
Fig. 1. A smart grid topology [© SAET].
Fig. 2. State estimation techniques [20].
II. VOLTAGE SAGS DETECTION AND
CHARACTERIZATION
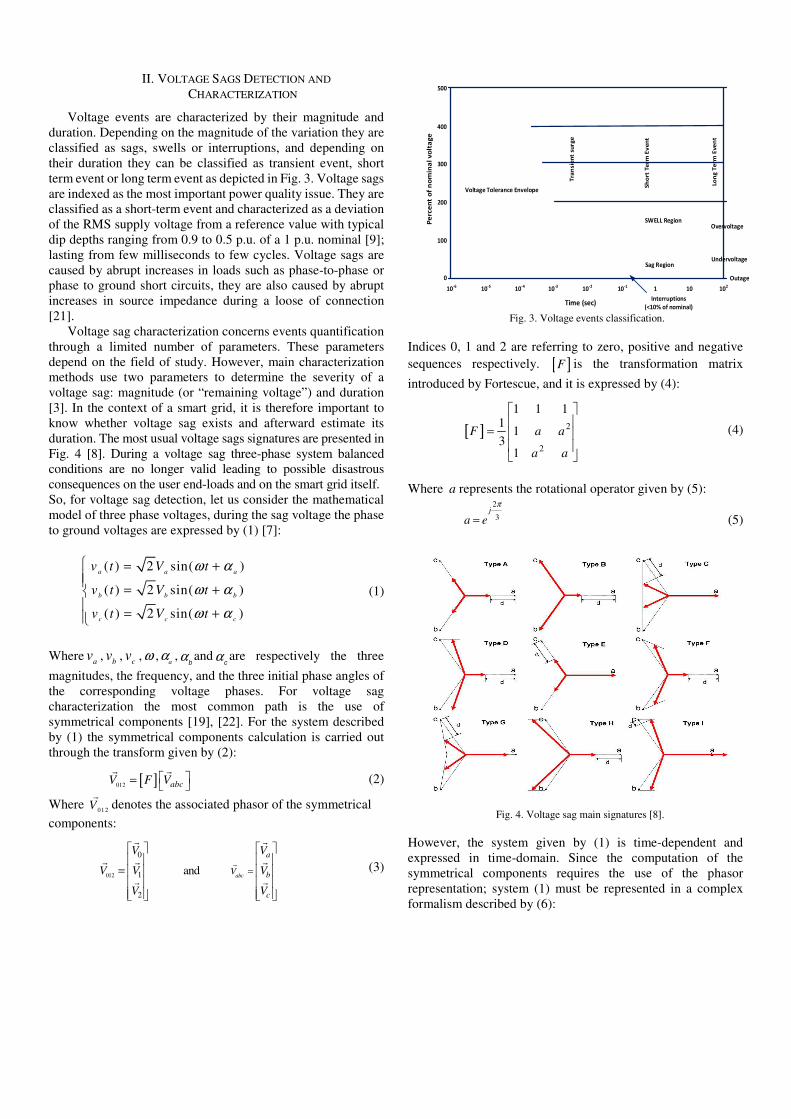
Voltage events are characterized by their magnitude and duration. Depending on the magnitude of the variation they are classified as sags, swells or interruptions, and depending on their duration they can be classified as transient event, short term event or long term event as depicted in Fig. 3. Voltage sags are indexed as the most important power quality issue. They are classified as a short-term event and characterized as a deviation of the RMS supply voltage from a reference value with typical dip depths ranging from 0.9 to 0.5 p.u. of a 1 p.u. nominal [9]; lasting from few milliseconds to few cycles. Voltage sags are caused by abrupt increases in loads such as phase-to-phase or phase to ground short circuits, they are also caused by abrupt increases in source impedance during a loose of connection [21].
Voltage sag characterization concerns events quantification through a limited number of parameters. These parameters depend on the field of study. However, main characterization methods use two parameters to determine the severity of a voltage sag: magnitude (or “remaining voltage”) and duration [3]. In the context of a smart grid, it is therefore important to know whether voltage sag exists and afterward estimate its duration. The most usual voltage sags signatures are presented in Fig. 4 [8]. During a voltage sag three-phase system balanced conditions are no longer valid leading to possible disastrous consequences on the user end-loads and on the smart grid itself. So, for voltage sag detection, let us consider the mathematical model of three phase voltages, during the sag voltage the phase to ground voltages are expressed by (1) [7]:
( ) 2 sin( )
( ) 2 sin( )
( ) 2 sin( )
a a a
b b b
c c c
v t V t
v t V t
v t V t
ω α
ω α
ω α
= +
= +
= +
(1)
Wherea
v ,b
v ,c
v ,ω ,a
α , αband α
care respectively the three
magnitudes, the frequency, and the three initial phase angles of the corresponding voltage phases. For voltage sag characterization the most common path is the use of symmetrical components [19], [22]. For the system described by (1) the symmetrical components calculation is carried out through the transform given by (2):
[ ]012 abcV F V =
� � (2)
Where 012V�
denotes the associated phasor of the symmetrical
components:
012
0
1
2
and abc
a
b
c
V
V V
V V V
V V
=
=
�
� �
� � �
� � (3)
Indices 0, 1 and 2 are referring to zero, positive and negative sequences respectively. [ ]F is the transformation matrix
introduced by Fortescue, and it is expressed by (4):
[ ] 2
2
1 1 11
13
1
F a a
a a
=
(4)
Where a represents the rotational operator given by (5):
2
3j
a e
π
= (5)
However, the system given by (1) is time-dependent and expressed in time-domain. Since the computation of the symmetrical components requires the use of the phasor representation; system (1) must be represented in a complex formalism described by (6):
Pe
rce
nt o
f n
om
ina
l v
olt
ag
e
Time (sec)
10-6
10-5
10-4
10-3
10-2
10-1
1 10 102
0
100
200
300
400
500
Tra
nsie
nt
surg
e
Sh
ort
Te
rm E
ve
nt
Overvoltage
UndervoltageSag Region
SWELL Region
Outage
Lo
ng T
erm
Eve
nt
Interruptions
(<10% of nominal)
Voltage Tolerance Envelope
Fig. 3. Voltage events classification.
Fig. 4. Voltage sag main signatures [8].
( )
( )
( )
( ) 2
( ) 2
( ) 2
aa
bb
cc
j ta
j tb
j tc
v t V e
v t V e
v t V e
ω α
ω α
ω α
+
+
+
=
=
=
(6)
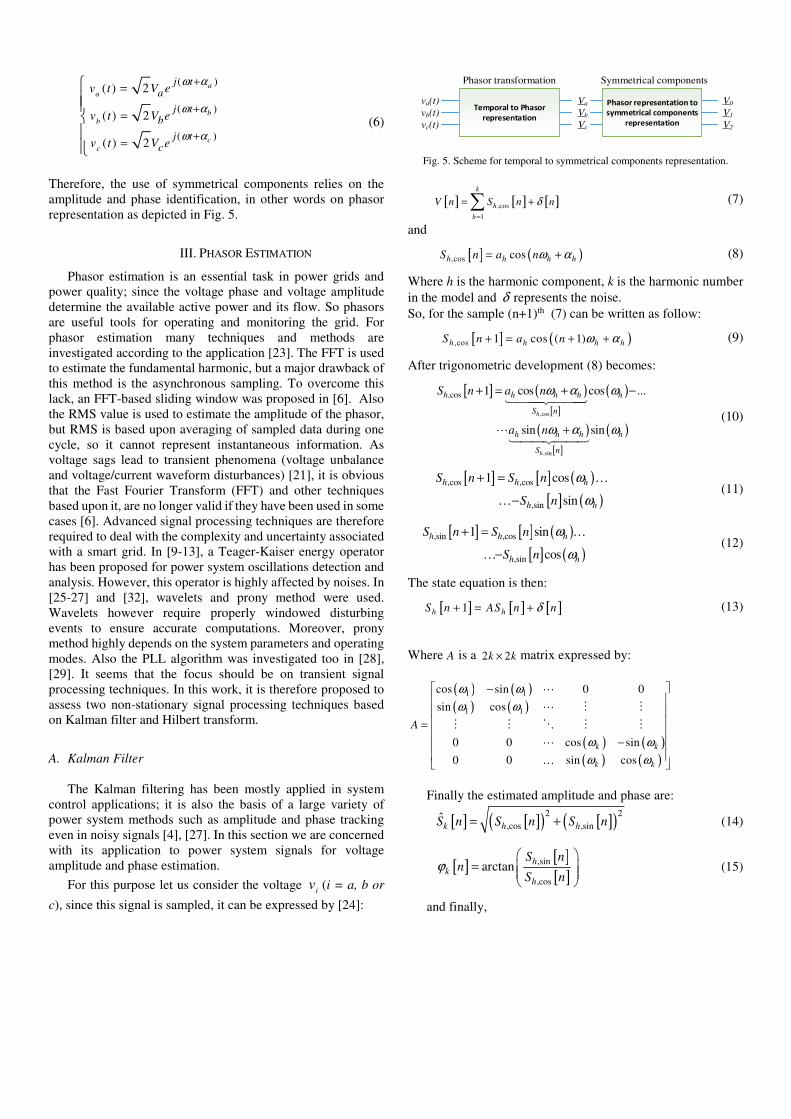
Therefore, the use of symmetrical components relies on the amplitude and phase identification, in other words on phasor representation as depicted in Fig. 5.
III. PHASOR ESTIMATION
Phasor estimation is an essential task in power grids and power quality; since the voltage phase and voltage amplitude determine the available active power and its flow. So phasors are useful tools for operating and monitoring the grid. For phasor estimation many techniques and methods are investigated according to the application [23]. The FFT is used to estimate the fundamental harmonic, but a major drawback of this method is the asynchronous sampling. To overcome this lack, an FFT-based sliding window was proposed in [6]. Also the RMS value is used to estimate the amplitude of the phasor, but RMS is based upon averaging of sampled data during one cycle, so it cannot represent instantaneous information. As voltage sags lead to transient phenomena (voltage unbalance and voltage/current waveform disturbances) [21], it is obvious that the Fast Fourier Transform (FFT) and other techniques based upon it, are no longer valid if they have been used in some cases [6]. Advanced signal processing techniques are therefore required to deal with the complexity and uncertainty associated with a smart grid. In [9-13], a Teager-Kaiser energy operator has been proposed for power system oscillations detection and analysis. However, this operator is highly affected by noises. In [25-27] and [32], wavelets and prony method were used. Wavelets however require properly windowed disturbing events to ensure accurate computations. Moreover, prony method highly depends on the system parameters and operating modes. Also the PLL algorithm was investigated too in [28], [29]. It seems that the focus should be on transient signal processing techniques. In this work, it is therefore proposed to assess two non-stationary signal processing techniques based on Kalman filter and Hilbert transform.
A. Kalman Filter
The Kalman filtering has been mostly applied in system control applications; it is also the basis of a large variety of power system methods such as amplitude and phase tracking even in noisy signals [4], [27]. In this section we are concerned with its application to power system signals for voltage amplitude and phase estimation.
For this purpose let us consider the voltage i
v (i = a, b or
c), since this signal is sampled, it can be expressed by [24]:
Temporal to Phasor
representation
Phasor representation to
symmetrical components
representation
Phasor transformation Symmetrical components
va(t)
vb(t)
vc(t)
Va
Vb
Vc
V0
V1
V2
Fig. 5. Scheme for temporal to symmetrical components representation.
[ ] [ ] [ ],cos
1
k
h
h
V n S n nδ
=
= +∑ (7)
and
[ ] ( ),cos cosh h h hS n a nω α= + (8)
Where h is the harmonic component, k is the harmonic number in the model and δ represents the noise. So, for the sample (n+1)th (7) can be written as follow:
[ ] ( ),cos 1 cos ( 1)h h h hS n a n ω α+ = + + (9)
After trigonometric development (8) becomes:
[ ] ( )[ ]
( )
( )[ ]
( ),cos
,sin
,cos 1 cos cos ...
sinsin
h
h
h h h h h
S n
h h h h
S n
S n a n
a n
ω α ω
ω α ω
+ = + −
+
���������
⋯�������
(10)
[ ] [ ] ( )
[ ] ( ),cos ,cos
,sin
1 cos
sin
h h h
h h
S n S n
S n
ω
ω
+ =
−
…
… (11)
[ ] [ ] ( )
[ ] ( ),sin ,cos
,sin
1 sin
cos
h h h
h h
S n S n
S n
ω
ω
+ =
−
…
… (12)
The state equation is then:
[ ] [ ] [ ]1h hS n AS n nδ+ = + (13)
Where A is a 2 2k k× matrix expressed by:
( ) ( )( ) ( )
( ) ( )( ) ( )
1 1
1 1
cos sin 0 0
sin cos
0 0 cos sin
0 0 sin cosk k
k k
A
ω ω
ω ω
ω ω
ω ω
− =
−
⋯
⋯ ⋮ ⋮
⋮ ⋮ ⋱ ⋮ ⋮
⋯
…
Finally the estimated amplitude and phase are:
[ ] [ ]( ) [ ]( )2 2
,cos ,sinˆk h hS n S n S n= + (14)
[ ][ ][ ]
,sin
,cos
arctan hk
h
S nn
S nϕ
=
(15)
and finally,
[ ][ ][ ]
,sin
,cos
arctan h
k h
h
S nn n
S nα ω
= − ⋅
(16)
Since the principal interest in phasor measurement is to calculate the fundamental component [23], this yields to
express the phasor of [ ]V n denoted [ ]V n as fellow:
[ ] [ ] [ ]ˆ j nV n S n e
ϕ= ⋅ (17)
B. Hilbert Transform
Hilbert transform has been extensively applied to estimate the instantaneous amplitude and the instantaneous phase. It is usually more robust against noise. In this section, we are concerned with its application to power system for phasor voltage amplitude and phase estimation.
Let us consider the temporal description of three phase voltages given by (1).
( ) ( )( )( ) 2 sini i
v t V t tϕ= (18)
The Hilbert transform of the instantaneous voltages i
v is given
by (19) [30]:
( ) ( )( )1 1 i
i iHTV
V t V t dt t t
ττ
π π τ
+∞
−∞
= ∗ = ∫ − (19)
That yields to represent the real function ( )i
v t by its
analytical signal ( )S t expressed by ( ( )S t can be any voltage or
current function):
( ) ( ) ( )i i iS S j HTt t S t= + ⋅ (20)
( ) ( ) ( )ˆ j t
i i eS t S tϕ
= (21)
Since voltages are sampled, the application of HT requires the use of Discret Hilbert transform (DHT) given by:
[ ] [ ]{ }{ } [ ]1DHT S n TF TF S n u n
− = (22)
where {}.TF and {}1 .TF− correspond to the FFT and Inverse
FFT, respectively, and ( )u n is defined by (21) :
[ ]
1, 0,2
2, 1, 2, ....., 12
0, 1, ..., 12
Nn
Nu n n
Nn N
=
= = −
= + −
(23)
Where N is the data sample number.
Using (21), the instantaneous amplitude and instantaneous phase in discrete formulation are given by:
[ ] [ ]( ) [ ]( )22
S n S n DHT S n= + (24)
[ ][ ]
[ ]arctan
DHT S nn
S nϕ
=
(25)
Finally the frequency deviation can be estimated using the relation:
( ) ( )( ) 0( ) 12
sf nF
n n fϕ ϕπ
∆ = − − − (26)
Where sF corresponds to the sampling frequency and 0f the
rated frequency (50 Hz for the European grid, 60 Hz for American grid).
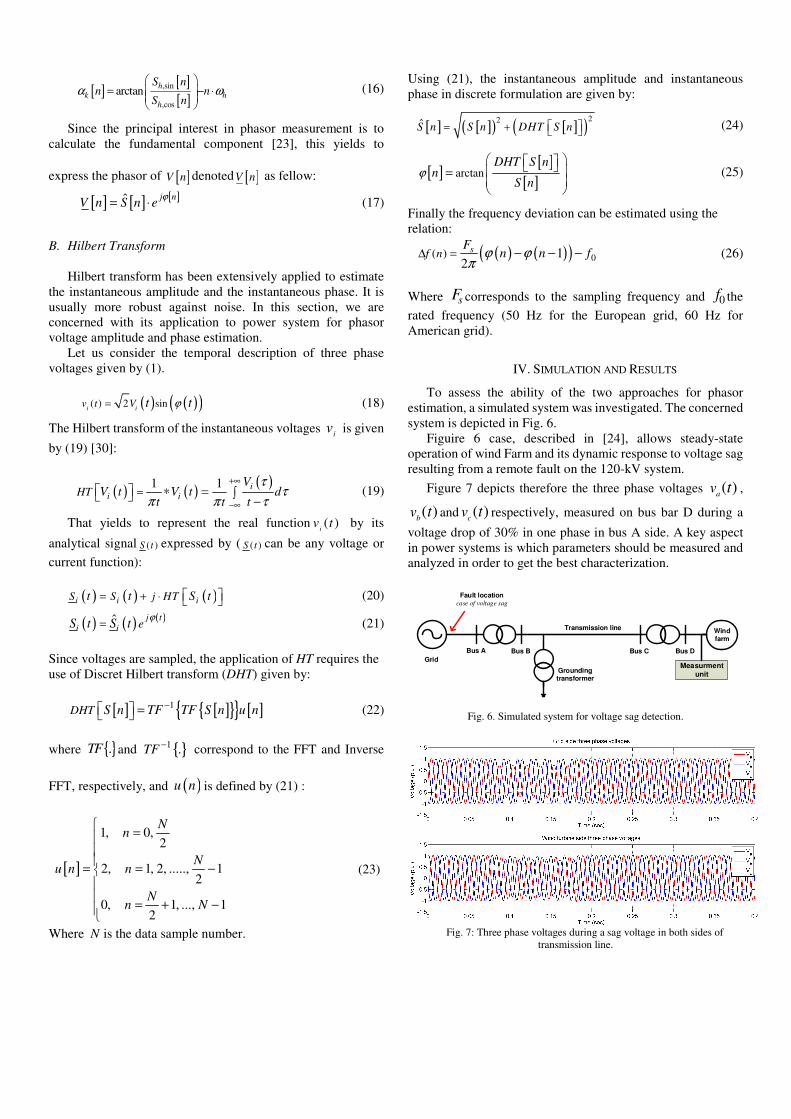
IV. SIMULATION AND RESULTS
To assess the ability of the two approaches for phasor estimation, a simulated system was investigated. The concerned system is depicted in Fig. 6.
Figuire 6 case, described in [24], allows steady-state operation of wind Farm and its dynamic response to voltage sag resulting from a remote fault on the 120-kV system.
Figure 7 depicts therefore the three phase voltages ( )a
v t ,
( )b
v t and ( )c
v t respectively, measured on bus bar D during a
voltage drop of 30% in one phase in bus A side. A key aspect in power systems is which parameters should be measured and analyzed in order to get the best characterization.
Wind farm
Grid
Grounding transformer
Transmission line
Fault location case of voltage sag
Bus A Bus B Bus D Bus C
Measurment
unit
Fig. 6. Simulated system for voltage sag detection.
Fig. 7: Three phase voltages during a sag voltage in both sides of
transmission line.
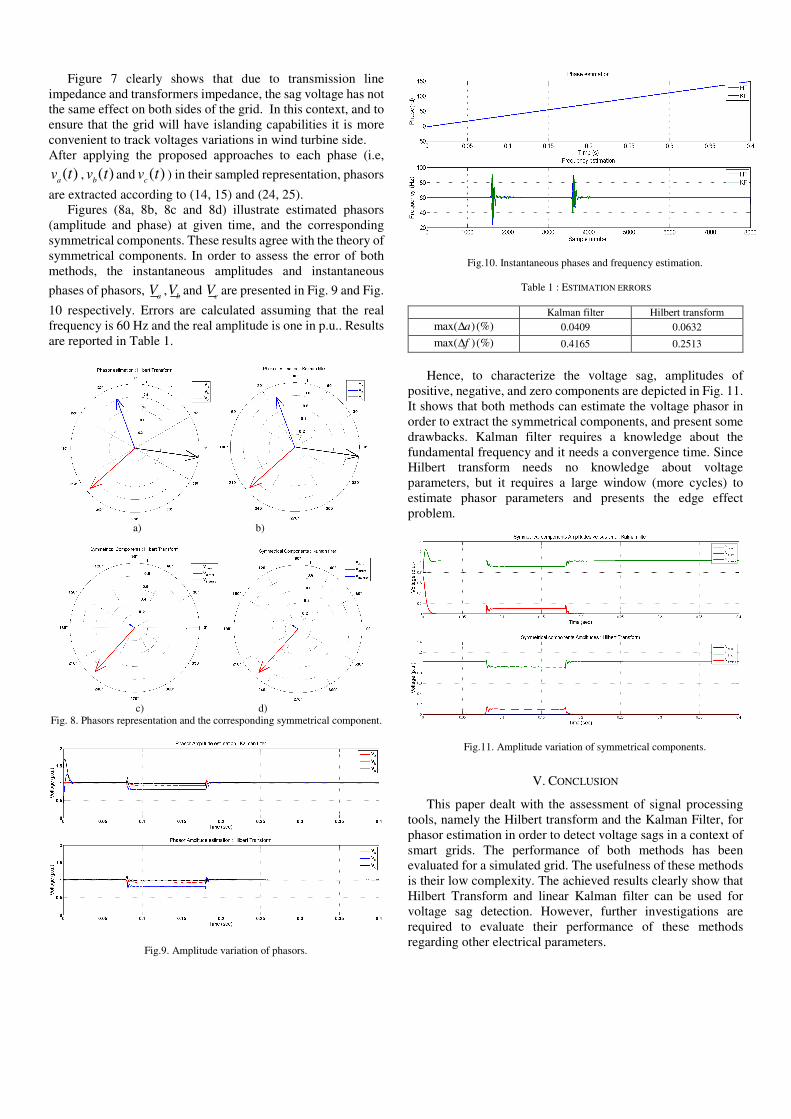
Figure 7 clearly shows that due to transmission line impedance and transformers impedance, the sag voltage has not the same effect on both sides of the grid. In this context, and to ensure that the grid will have islanding capabilities it is more convenient to track voltages variations in wind turbine side. After applying the proposed approaches to each phase (i.e,
( )a
v t , ( )b
v t and ( )c
v t ) in their sampled representation, phasors
are extracted according to (14, 15) and (24, 25). Figures (8a, 8b, 8c and 8d) illustrate estimated phasors
(amplitude and phase) at given time, and the corresponding symmetrical components. These results agree with the theory of symmetrical components. In order to assess the error of both methods, the instantaneous amplitudes and instantaneous
phases of phasors, a
V ,b
V and c
V are presented in Fig. 9 and Fig.
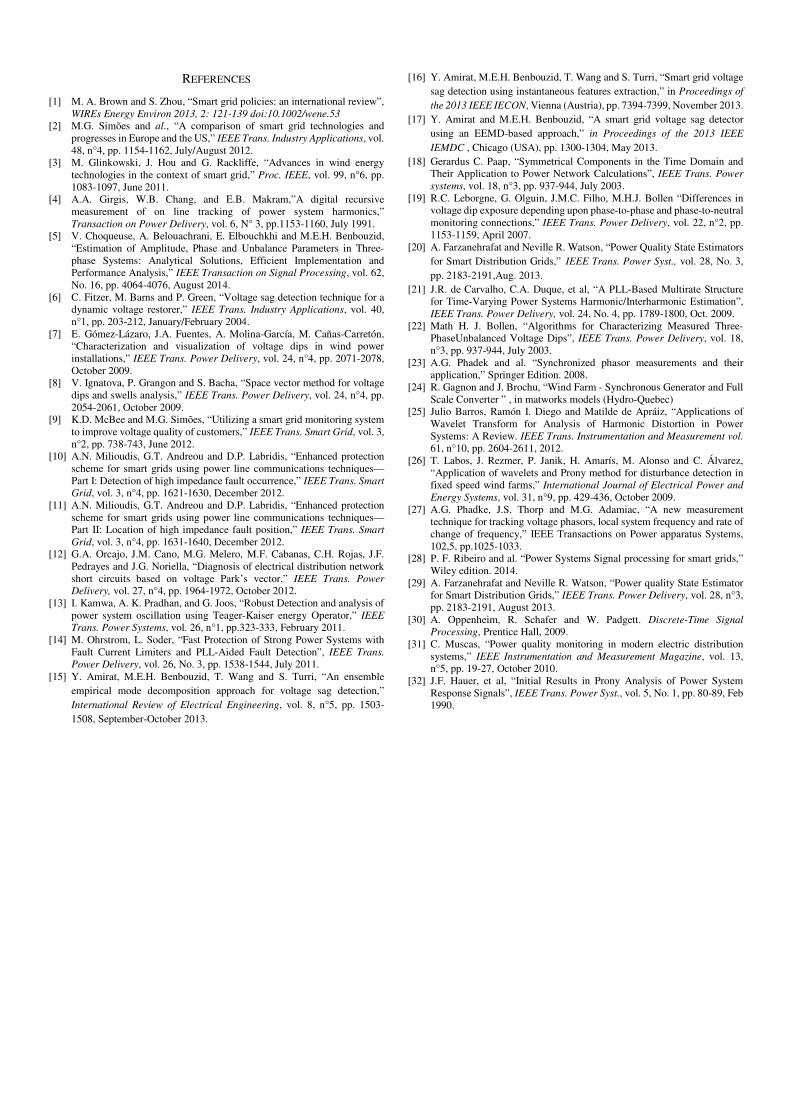
10 respectively. Errors are calculated assuming that the real frequency is 60 Hz and the real amplitude is one in p.u.. Results are reported in Table 1.
a) b)
c) d)
Fig. 8. Phasors representation and the corresponding symmetrical component.
Fig.9. Amplitude variation of phasors.
Fig.10. Instantaneous phases and frequency estimation.
Table 1 : ESTIMATION ERRORS
Kalman filter Hilbert transform max( )(%)a∆ 0.0409 0.0632
max( )(%)f∆ 0.4165 0.2513
Hence, to characterize the voltage sag, amplitudes of
positive, negative, and zero components are depicted in Fig. 11. It shows that both methods can estimate the voltage phasor in order to extract the symmetrical components, and present some drawbacks. Kalman filter requires a knowledge about the fundamental frequency and it needs a convergence time. Since Hilbert transform needs no knowledge about voltage parameters, but it requires a large window (more cycles) to estimate phasor parameters and presents the edge effect problem.
Fig.11. Amplitude variation of symmetrical components.
V. CONCLUSION
This paper dealt with the assessment of signal processing tools, namely the Hilbert transform and the Kalman Filter, for phasor estimation in order to detect voltage sags in a context of smart grids. The performance of both methods has been evaluated for a simulated grid. The usefulness of these methods is their low complexity. The achieved results clearly show that Hilbert Transform and linear Kalman filter can be used for voltage sag detection. However, further investigations are required to evaluate their performance of these methods regarding other electrical parameters.
REFERENCES
[1] M. A. Brown and S. Zhou, “Smart grid policies: an international review”, WIREs Energy Environ 2013, 2: 121-139 doi:10.1002/wene.53
[2] M.G. Simões and al., “A comparison of smart grid technologies and progresses in Europe and the US,” IEEE Trans. Industry Applications, vol. 48, n°4, pp. 1154-1162, July/August 2012.
[3] M. Glinkowski, J. Hou and G. Rackliffe, “Advances in wind energy technologies in the context of smart grid,” Proc. IEEE, vol. 99, n°6, pp. 1083-1097, June 2011.
[4] A.A. Girgis, W.B. Chang, and E.B. Makram,”A digital recursive measurement of on line tracking of power system harmonics,” Transaction on Power Delivery, vol. 6, N° 3, pp.1153-1160, July 1991.
[5] V. Choqueuse, A. Belouachrani, E. Elbouchkhi and M.E.H. Benbouzid, “Estimation of Amplitude, Phase and Unbalance Parameters in Three-phase Systems: Analytical Solutions, Efficient Implementation and Performance Analysis,” IEEE Transaction on Signal Processing, vol. 62, No. 16, pp. 4064-4076, August 2014.
[6] C. Fitzer, M. Barns and P. Green, “Voltage sag detection technique for a dynamic voltage restorer,” IEEE Trans. Industry Applications, vol. 40, n°1, pp. 203-212, January/February 2004.
[7] E. Gómez-Lázaro, J.A. Fuentes, A. Molina-García, M. Cañas-Carretón, “Characterization and visualization of voltage dips in wind power installations,” IEEE Trans. Power Delivery, vol. 24, n°4, pp. 2071-2078, October 2009.
[8] V. Ignatova, P. Grangon and S. Bacha, “Space vector method for voltage dips and swells analysis,” IEEE Trans. Power Delivery, vol. 24, n°4, pp. 2054-2061, October 2009.
[9] K.D. McBee and M.G. Simões, “Utilizing a smart grid monitoring system to improve voltage quality of customers,” IEEE Trans. Smart Grid, vol. 3, n°2, pp. 738-743, June 2012.
[10] A.N. Milioudis, G.T. Andreou and D.P. Labridis, “Enhanced protection scheme for smart grids using power line communications techniques—Part I: Detection of high impedance fault occurrence,” IEEE Trans. Smart
Grid, vol. 3, n°4, pp. 1621-1630, December 2012. [11] A.N. Milioudis, G.T. Andreou and D.P. Labridis, “Enhanced protection
scheme for smart grids using power line communications techniques—Part II: Location of high impedance fault position,” IEEE Trans. Smart
Grid, vol. 3, n°4, pp. 1631-1640, December 2012. [12] G.A. Orcajo, J.M. Cano, M.G. Melero, M.F. Cabanas, C.H. Rojas, J.F.
Pedrayes and J.G. Noriella, “Diagnosis of electrical distribution network short circuits based on voltage Park’s vector,” IEEE Trans. Power
Delivery, vol. 27, n°4, pp. 1964-1972, October 2012. [13] I. Kamwa, A. K. Pradhan, and G. Joos, “Robust Detection and analysis of
power system oscillation using Teager-Kaiser energy Operator,” IEEE
Trans. Power Systems, vol. 26, n°1, pp.323-333, February 2011. [14] M. Ohrstrom, L. Soder, “Fast Protection of Strong Power Systems with
Fault Current Limiters and PLL-Aided Fault Detection”, IEEE Trans.
Power Delivery, vol. 26, No. 3, pp. 1538-1544, July 2011. [15] Y. Amirat, M.E.H. Benbouzid, T. Wang and S. Turri, “An ensemble
empirical mode decomposition approach for voltage sag detection,” International Review of Electrical Engineering, vol. 8, n°5, pp. 1503-1508, September-October 2013.
[16] Y. Amirat, M.E.H. Benbouzid, T. Wang and S. Turri, “Smart grid voltage sag detection using instantaneous features extraction,” in Proceedings of
the 2013 IEEE IECON, Vienna (Austria), pp. 7394-7399, November 2013. [17] Y. Amirat and M.E.H. Benbouzid, “A smart grid voltage sag detector
using an EEMD-based approach,” in Proceedings of the 2013 IEEE
IEMDC , Chicago (USA), pp. 1300-1304, May 2013. [18] Gerardus C. Paap, “Symmetrical Components in the Time Domain and
Their Application to Power Network Calculations”, IEEE Trans. Power
systems, vol. 18, n°3, pp. 937-944, July 2003. [19] R.C. Leborgne, G. Olguin, J.M.C. Filho, M.H.J. Bollen “Differences in
voltage dip exposure depending upon phase-to-phase and phase-to-neutral monitoring connections,” IEEE Trans. Power Delivery, vol. 22, n°2, pp. 1153-1159, April 2007.
[20] A. Farzanehrafat and Neville R. Watson, “Power Quality State Estimators for Smart Distribution Grids,” IEEE Trans. Power Syst., vol. 28, No. 3, pp. 2183-2191,Aug. 2013.
[21] J.R. de Carvalho, C.A. Duque, et al, “A PLL-Based Multirate Structure for Time-Varying Power Systems Harmonic/Interharmonic Estimation”, IEEE Trans. Power Delivery, vol. 24, No. 4, pp. 1789-1800, Oct. 2009.
[22] Math H. J. Bollen, “Algorithms for Characterizing Measured Three-PhaseUnbalanced Voltage Dips”, IEEE Trans. Power Delivery, vol. 18, n°3, pp. 937-944, July 2003.
[23] A.G. Phadek and al. “Synchronized phasor measurements and their application,” Springer Edition. 2008.
[24] R. Gagnon and J. Brochu, “Wind Farm - Synchronous Generator and Full Scale Converter ” , in matworks models (Hydro-Quebec)
[25] Julio Barros, Ramón I. Diego and Matilde de Apráiz, “Applications of Wavelet Transform for Analysis of Harmonic Distortion in Power Systems: A Review. IEEE Trans. Instrumentation and Measurement vol.
61, n°10, pp. 2604-2611, 2012. [26] T. Labos, J. Rezmer, P. Janik, H. Amarís, M. Alonso and C. Álvarez,
“Application of wavelets and Prony method for disturbance detection in fixed speed wind farms,” International Journal of Electrical Power and
Energy Systems, vol. 31, n°9, pp. 429-436, October 2009. [27] A.G. Phadke, J.S. Thorp and M.G. Adamiac, “A new measurement
technique for tracking voltage phasors, local system frequency and rate of change of frequency,” IEEE Transactions on Power apparatus Systems, 102,5, pp.1025-1033.
[28] P. F. Ribeiro and al. “Power Systems Signal processing for smart grids,” Wiley edition. 2014.
[29] A. Farzanehrafat and Neville R. Watson, “Power quality State Estimator for Smart Distribution Grids,” IEEE Trans. Power Delivery, vol. 28, n°3, pp. 2183-2191, August 2013.
[30] A. Oppenheim, R. Schafer and W. Padgett. Discrete-Time Signal
Processing, Prentice Hall, 2009. [31] C. Muscas, “Power quality monitoring in modern electric distribution
systems,” IEEE Instrumentation and Measurement Magazine, vol. 13, n°5, pp. 19-27, October 2010.
[32] J.F. Hauer, et al, “Initial Results in Prony Analysis of Power System Response Signals”, IEEE Trans. Power Syst., vol. 5, No. 1, pp. 80-89, Feb 1990.