On Maternity Leave - Statistics · PDF fileSome are borne by women who take maternity leave...
30
On Maternity Leave (IS 892 A3) Summer 1989 (Vol. 1, No. 1) On Maternity Leave Joanne Moloney The last thirty years have witnessed dramatic changes in fertility and in labour force participation among women in Canada. Since the late 1950s the fertility rate has been halved and the participation rate for women has doubled. These trends have heightened interest in the availability and use of maternity leave and benefits. In the context of the labour market, maternity absences have both costs and benefits. The costs are mainly incurred in the short term. Some are borne by women who take maternity leave - a loss of income and job experience, and possibly forgone opportunities for job advancement. Some of the costs are shouldered by employers through their support of financial compensation schemes. The lost output of an employee on maternity leave (or the alternative of securing a temporary replacement) is also a cost. Finally, there are costs to society, for example, the public share of the total cost of maternity compensation plans. The benefits of maternity absences in a labour market context are longer term and relate to the supply of labour twenty or thirty years from now. To a large extent, this supply depends on the child-bearing decisions of today's working women. Prospective parents do not look only at the short-term costs surrounding the birth of a child. They weigh intangibles, such as the satisfaction derived from a loving parent-child relationship. They also weigh the long-term costs of child-rearing. This study of maternity leave entitlements and absences thus looks at only one facet of a very complex process. It examines the incidence of maternity absences in the 1980s in relation to fertility rates, revealing distinct patterns by age, education and province. The analysis also addresses the link between compensation and duration of maternity absences. Incidence of maternity absences file:///N|/LHSBR/LHSAD/PERSPECT/Pe8923.htm (1 of 18) [6/4/01 10:59:21 AM]
Transcript of On Maternity Leave - Statistics · PDF fileSome are borne by women who take maternity leave...
On Maternity Leave (IS 892 A3)
Summer 1989 (Vol. 1, No. 1)
On Maternity LeaveJoanne Moloney
The last thirty years have witnessed dramatic changes in fertility and in labour force participation
among women in Canada. Since the late 1950s the fertility rate has been halved and the participation rate for women has doubled. These trends have heightened interest in the availability and use of maternity leave and benefits.
In the context of the labour market, maternity absences have both costs and benefits. The costs are mainly incurred in the short term. Some are borne by women who take maternity leave - a loss of income and job experience, and possibly forgone opportunities for job advancement. Some of the costs are shouldered by employers through their support of financial compensation schemes. The lost output of an employee on maternity leave (or the alternative of securing a temporary replacement) is also a cost. Finally, there are costs to society, for example, the public share of the total cost of maternity compensation plans.
The benefits of maternity absences in a labour market context are longer term and relate to the supply of labour twenty or thirty years from now. To a large extent, this supply depends on the child-bearing decisions of today's working women.
Prospective parents do not look only at the short-term costs surrounding the birth of a child. They weigh intangibles, such as the satisfaction derived from a loving parent-child relationship. They also weigh the long-term costs of child-rearing. This study of maternity leave entitlements and absences thus looks at only one facet of a very complex process. It examines the incidence of maternity absences in the 1980s in relation to fertility rates, revealing distinct patterns by age, education and province. The analysis also addresses the link between compensation and duration of maternity absences.
Incidence of maternity absences
file:///N|/LHSBR/LHSAD/PERSPECT/Pe8923.htm (1 of 18) [6/4/01 10:59:21 AM]
On Maternity Leave (IS 892 A3)
Although maternity leave has been prominent among the employment issues of the 1980s, most of the attention has focused on comparisons of the quality of maternity leave provisions and benefits "packages", rather than on the incidence of pregnancy among working women. A scarcity of relevant data may partly explain this.
The annual Absence from Work Survey (AWS) collects information on absences of two weeks or longer due to accident, illness or pregnancy, among persons who were paid workers at some time during the reference year. (1)
This article uses the AWS definition for the incidence rate of absence from work due to pregnancy, that is, the proportion of the female paid worker "pool" who began a pregnancy-related absence during the year. The pool consists of women of child-bearing age who were paid workers at some time during the year.
Trends in the 1980s
Given the persistent upward trend in the labour force participation of women, it is not surprising that the number of paid workers absent due to pregnancy has also grown. Between 1980 and 1987, pregnancy-related absences increased by almost 50%, from 134,000 to 199,000. Except for a slight stall in 1982, which was presumably related to falling employment levels during the recession, the increase was spread evenly between 1980 and 1985. Since then, the number of absences has been stable.
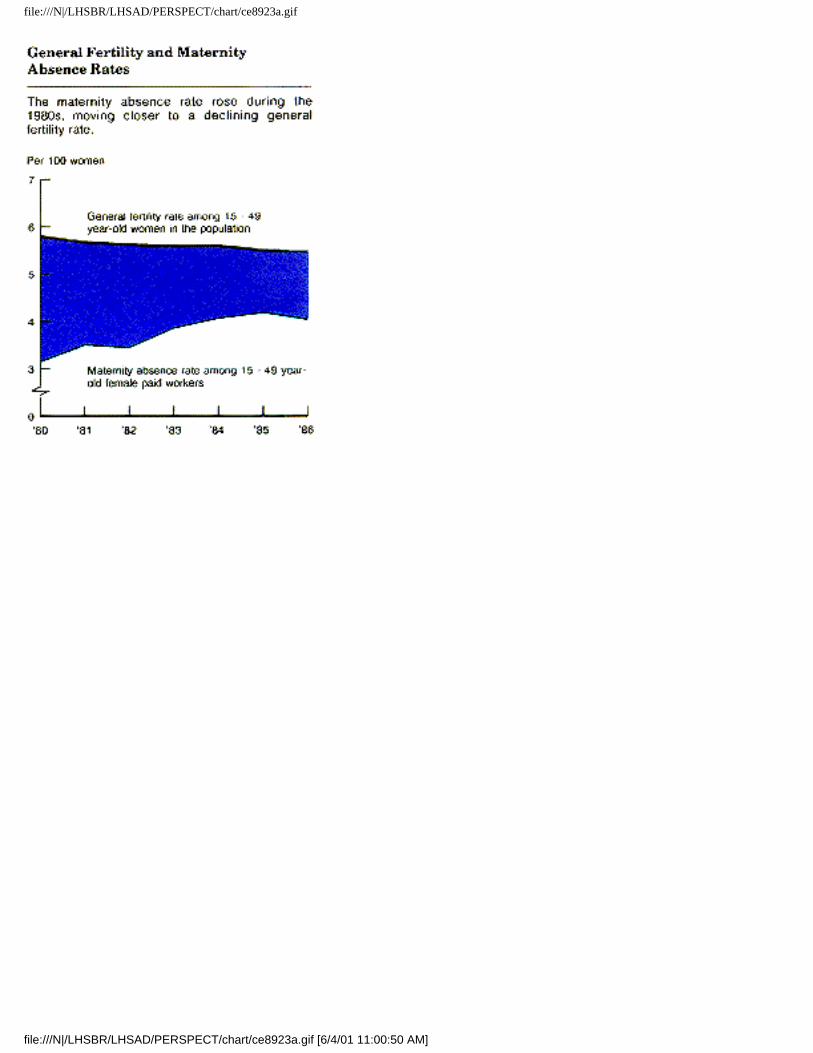
Maternity absences among female paid workers aged 15 to 49 can also be expressed as incidence rates that can then be examined in the context of fertility rates for all women. (2) The incidence of maternity absences has exhibited a slight upward trend in the 1980s, increasing from 3.1% in 1980 to 4.2% in 1985, then sliding back to 4.0% for the subsequent two years. Canada's general fertility rate expressed here as live births per 100 women 15 to 49 years of age in the population) declined during the 1980s, as it did during the 1960s and 1970s. From a peak level of 11.80 in 1957, the general fertility rate plummeted to 5.47 in 1986. But, the decline slowed with each decade; between 1980 and 1986 the rate slipped from 5.79 to 5.47.
Since the rate of maternity absence is lower than the general fertility rate, one can infer that fertility is lower among working women than among women who are not employed. The slight trends in the data show that the incidence rate of pregnancy related absence moved closer to the general fertility rate during the 1980s. This is not surprising, given the concomitant increase (from 67% to 73%) in the paid worker/population ratio for women 15 to 49 years of age.
file:///N|/LHSBR/LHSAD/PERSPECT/Pe8923.htm (2 of 18) [6/4/01 10:59:21 AM]
On Maternity Leave (IS 892 A3)
Chart A General Fertility and Maternity Absence Rates
Chart B Fertility and Maternity Absence Rates Prime Child-bearing Age Groups
The age factor and the education effect
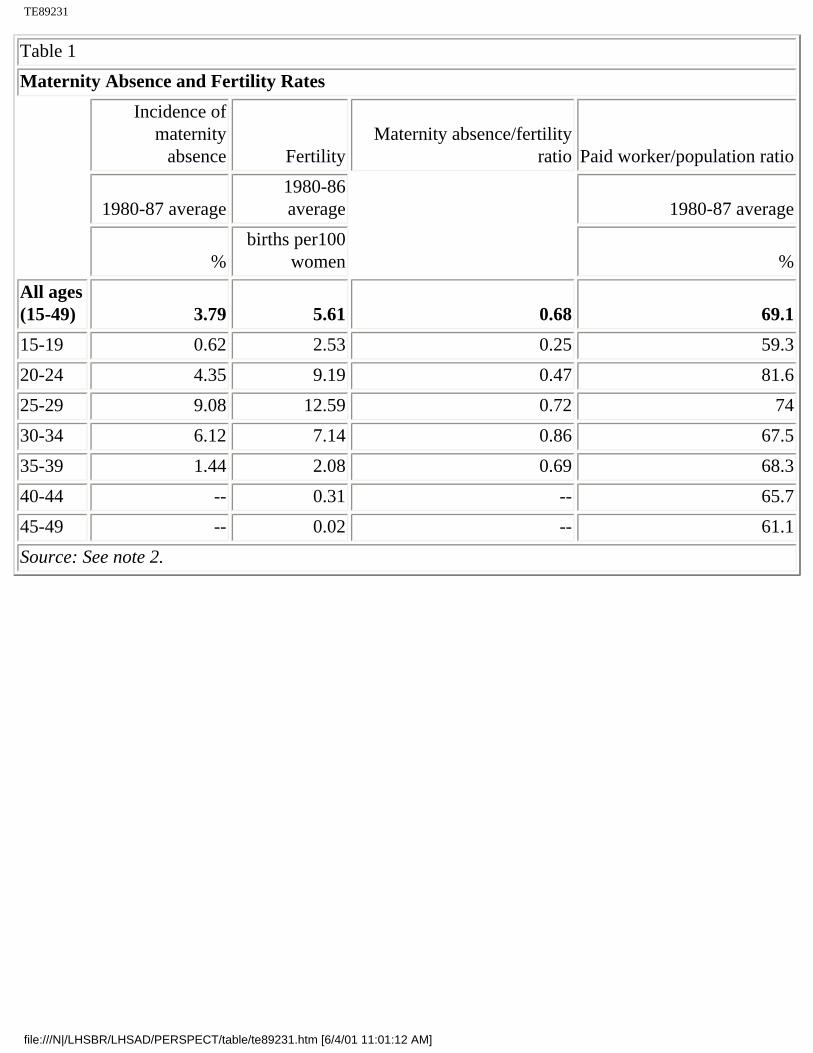
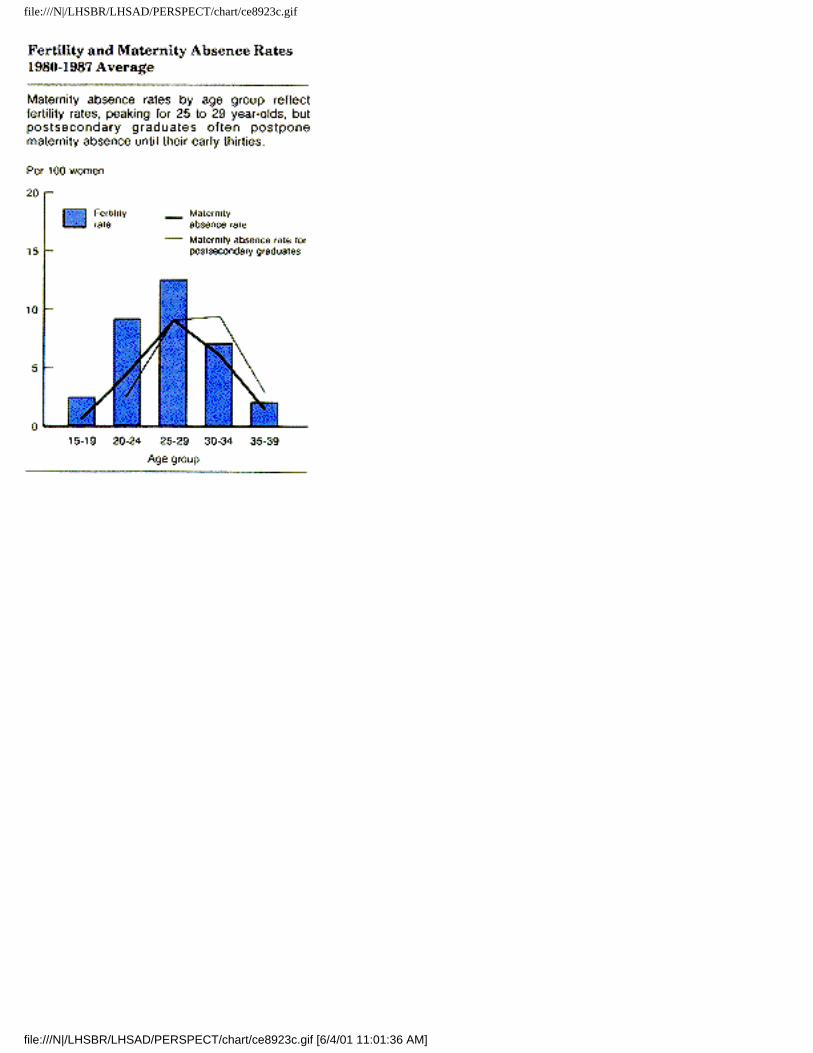
Since the 1970s, women aged 25 to 29 have been the prime child-bearing group. Above and below this age, the fertility rate falls off quickly (Table 1). Fertility rates clearly dominate the relationship between the incidence of maternity absence and age. For each age group, the incidence of maternity absence is lower than the corresponding fertility rate - but not proportionally so. This is especially apparent for 20 to 24 year-olds versus 30 to 34 year-olds: the younger group has a much higher fertility rate but a much lower rate of maternity absence. Relative to age-specific fertility rates, maternity absences are almost twice as common among women 30 to 34 years of age compared with those who are ten years younger.
Table 1 Maternity Absence and Fertility Rates
Source: See note 2.
This phenomenon is not explained by the paid worker/population ratios for the two age groups. Women 20 to 24 years of age are more likely to be part of the work force than women in their early thirties; other things being equal, one would expect the younger age group to have the higher maternity absence/fertility ratio.
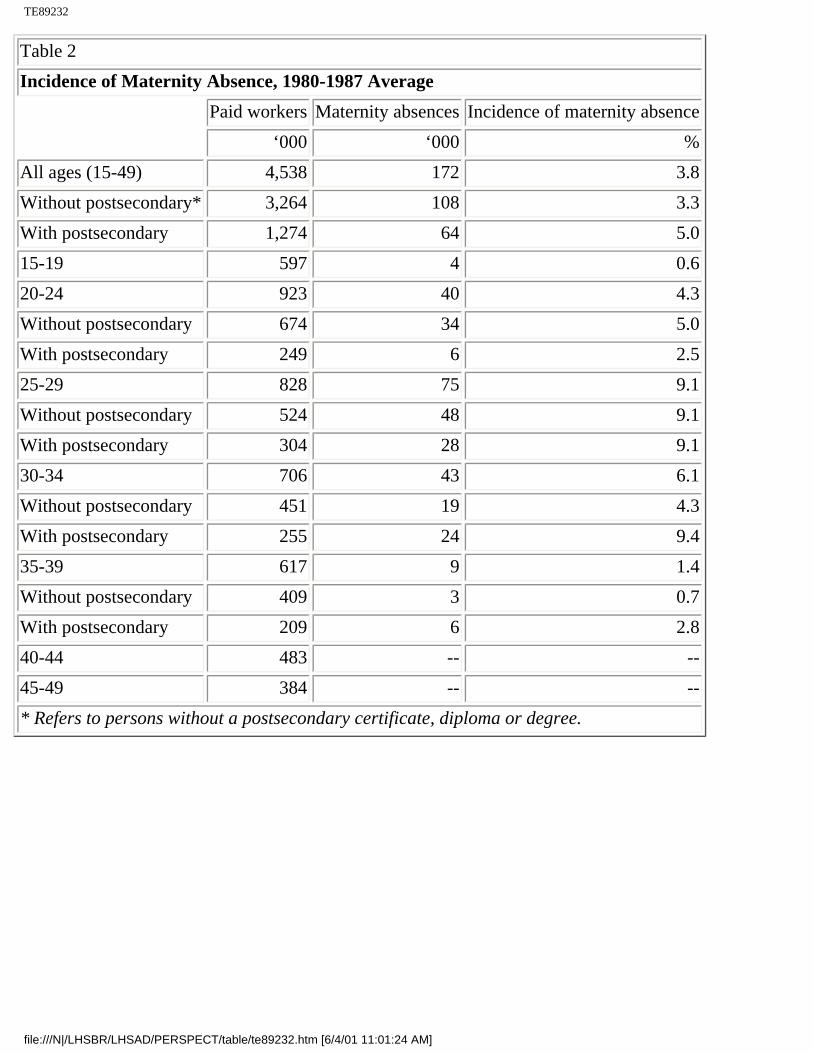
Why then is the maternity absence/fertility ratio of 30 to 34 year-olds so much higher? It may be the effect of postsecondary education. The pursuit of a postsecondary certificate or diploma or a university degree, followed by experience in the work force often requires a postponement of child-bearing - this "education effect" pushes the maternity absence rates for 20 to 24 year-olds and 30-34 year-olds in opposite directions. Working women in their early twenties who have a postsecondary degree, certificate or diploma are less likely to have a pregnancy-related absence than other working women of the same age - in many cases, these postsecondary graduates may have just began their careers (Table 2). In contrast, 30 to 34 year-old working women who are postsecondary graduates may have ten or even more
file:///N|/LHSBR/LHSAD/PERSPECT/Pe8923.htm (3 of 18) [6/4/01 10:59:21 AM]
On Maternity Leave (IS 892 A3)
years of work experience to their credit and they are approaching the higher-risk ages in the reproductive cycle. Their response is a rate of maternity absence which averaged 9.4% from 1980 to 1987 - more than twice the comparable rate (4.3%) among 30 to 34 year-old working women who are not postsecondary graduates. The effect of postponing child-bearing to accommodate postsecondary education is even more pronounced among university graduates in this age group. For these women, the incidence of maternity absence between 1980 and 1987 averaged 11.4%.
Table 2 Incidence of Maternity Absence, 1980-1987 Average
Leave and benefit entitlements
The maternity leave provisions and benefits applicable to a working woman in Canada depend on the province in which she works, her employer, and perhaps whether she belongs to a union. Government employees are covered by federal or provincial public service acts. Provincial employment standards govern all other workers except those who work for inter-provincial and federally regulated organizations covered by the Canada Labour Code. Within any statutory jurisdiction, employers and collective agreements negotiated by unions may offer improved "packages" for maternity leave and benefits, which exceed the terms specified in the applicable legislation. (Many of the public service acts in fact do not provide maternity leave; it is the collective agreements of unions representing public servants that provide maternity leave.) (Canadian Advisory Council on the Status of Women, 1988.)
Chart C Fertility and Maternity Absence Rates 1980-1987 Average
Working women in every statutory jurisdiction except the Northwest Territories are entitled to a period of unpaid maternity leave, but the length of that period varies. (3) Provincial statutes and the Canada Labour Code allow 17 or 18 weeks; for public servants, previsions vary from four months in Prince Edward Island to 12 months in Saskatchewan. In most jurisdictions, an employee must complete some minimum period of employment with her employer. This qualifying period varies from 20 weeks (out of the 12 months preceding the leave) for Quebec workers to one year plus 11 weeks for women in Ontario. Most of these provisions for unpaid maternity leave have been in effect throughout the 1980s.
file:///N|/LHSBR/LHSAD/PERSPECT/Pe8923.htm (4 of 18) [6/4/01 10:59:21 AM]
On Maternity Leave (IS 892 A3)
Regarding sources of financial compensation, UI maternity benefits are the most widely available. These consist of 15 weeks of benefits at 60% of the employee's regular wage, up to a maximum which is increased each year. (4) In 1987, for example, the maximum weekly benefit was $318. As a rule, a woman must have worked 20 weeks within the last year to qualify for this benefit. Besides the annual increase in the maximum weekly benefit, certain changes to the maternity benefit program were introduced in January, 1984, including the elimination of the "Magic 10" rule, which required women to work at least ten weeks around the time of conception (Townson, 1985).
Despite these improvements in the UI maternity benefit program, a 1985 study for the Task Force on Child Care ranked Canada poorly, compared with 22 industrialized countries in eastern and western Europe. Fifteen of these countries pay maternity benefits of 90% to 100% of the employee's usual earnings, up to a weekly maximum, for periods ranging from six weeks to nine months. The same study, however, showed that maternity leave provisions in Canada compare favorably with those in the United States (Townson, 1985).
Is it possible that for working women the decision to become a parent could be influenced by access to enhanced maternity leave provisions and benefits offered in some collective agreements? The incidence of maternity absences is slightly higher in industries with relatively high rates of union membership among working women. To examine the relationship between maternity absences and union membership, incidence rates for maternity absence were calculated for four groups of industries: primary industries and construction; manufacturing, transportation and storage; public and regulated services; and all other service industries. (5) The industries within each group had roughly similar rates of union membership for paid jobs held by women in 1986. These broad industry groups have the same order when ranked by union membership of by maternity absence (Table 3). The public and regulated service industries, in which coverage by a collective agreement is most common (60.2%), also have the highest incidence of maternity absence (4.8%). The primary and construction industries, which have the lowest rate of union membership (5.2%), also have the lowest maternity absence rates (2.1%). (6) However, the relationship between union membership and maternity absence is tenuous. For example, the rate of union membership in the manufacturing, transportation and storage industries is only half that of the public and regulated service industries; but the respective rates of maternity absence are very close - 4.0% and 4.8%.
Table 3 Characteristics of Female Paid Workers by Industry Group
Union membership does not guarantee better maternity leave provisions and benefits than those provided by legislation. For example, in the early 1980s, 49% of major collective agreements in Canada contained sections pertaining to maternity leave; of those that did include maternity leave provisions,
file:///N|/LHSBR/LHSAD/PERSPECT/Pe8923.htm (5 of 18) [6/4/01 10:59:21 AM]

On Maternity Leave (IS 892 A3)
71% exceeded legislated limits. (7) Through the 1980s, financial compensation during maternity leave has become a more prominent issue - but as recently as 1988, paid maternity leave was provided in only 26% of major agreements (Labour Canada, 1988).
Provincial variation
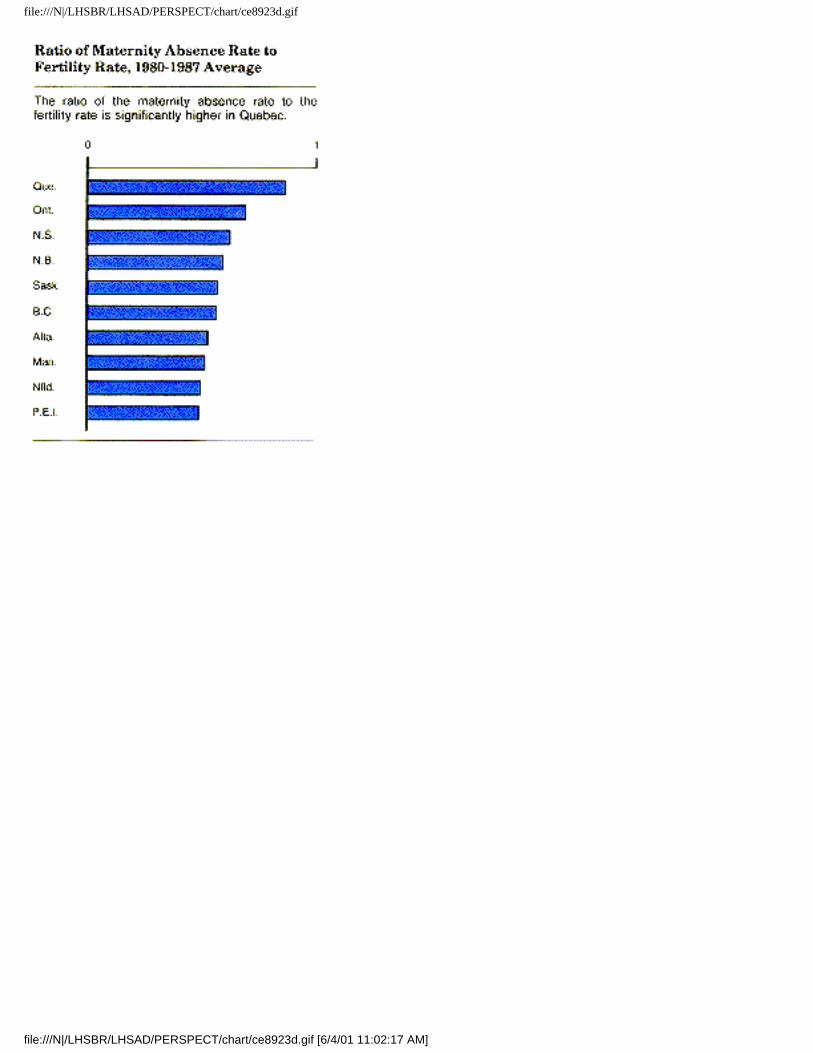
The most remarkable feature of maternity absence rates among the provinces surfaces only when one examines maternity absence relative to fertility rates. By province, the incidence of pregnancy-related absence (averaged over 1980 to 1987) varies between 3.0% and 4.3% (Table 4). Although this range is small, it is surprising that the rate of 4.3% belongs to Quebec - the province with the lowest fertility rate. The ratio of the maternity absence rate to the fertility rate for Quebec, at 0.87, is significantly greater than the ratios for the other provinces, which range between 0.50 for Prince Edward Island and Newfoundland and 0.70 for Ontario.
Table 4 Maternity Absence and Fertility by Province
Source: See note 2.
The high ratio for Quebec is the outcome of a fertility rate in continuous decline through the 1980s, combined with a generally increasing rate of maternity absence. In fact, since 1985, the estimated rate of pregnancy-related absence from work has exceeded the general fertility rate, suggesting that working women may have a higher fertility rate than those who are not employed.
What could account for this higher maternity absence/fertility ratio in Quebec? Neither the paid worker/population ratio nor the age distribution of women offer a convincing explanation. Indeed, the paid worker/population ratio in Quebec is lower than the ratio for Canada. This fact, in isolation, would suggest that the maternity absence/fertility ratio for Quebec should be lower than that of Canada unless in Quebec the fertility rate is higher among working women than among women outside the work force. A comparison of the age distribution of the paid worker pool versus the population for 15 to 49 year-old women shows that, relative to Canada as a whole, Quebec may have a slightly higher concentration of working women in the prime child-bearing age groups (20 to 34 years of age), but the difference is small.
The high maternity absence/fertility ratio in Quebec may in fact be related to superior maternity leave provisions and financial compensation. In addition to 18 weeks of "ordinary" maternity leave, Quebec legislation contains clauses for other types of leave related to pregnancy. (8) Of equal note is a reassignment/leave program, which became operational in 1981 under the Act respecting occupational health and safety. The program provides for the reassignment of a pregnant worker who furnishes a medical certificate stating that her working conditions may be physically dangerous to her health or that
file:///N|/LHSBR/LHSAD/PERSPECT/Pe8923.htm (6 of 18) [6/4/01 10:59:21 AM]
On Maternity Leave (IS 892 A3)
of her unborn child. In cases where reassignment is not possible, the worker may then apply to the "Commission de la santé et de la sécurité du travail" for leave with 90% of her salary paid until the date of delivery. Most of the collective agreements for the Quebec public sector reaffirm this law (Church, 1986; "Commission de la santé et de la sécurité du travail", 1985).
Chart D Ratio of Maternity Absence Rate to Fertility Rate, 1980-1987 Average
Quebec has also been a leader with respect to paid maternity leave in collective agreements. The first major Supplemental Unemployment Benefits (SUB) plan for maternity in Canada was negotiated in 1979 by the Quebec common front, a group of public sector unions representing about 20% of the female labour force in Quebec. (9) This plan introduced vastly improved financial compensation for maternity leave at a time when paid maternity leave was extremely rate. In 1980, only about 5.8% of major collective agreements in Canada provided fully or partially paid maternity leave. Since then, a number of public service agreements with maternity SUB plans have been negotiated, beginning with the contract won by the Canadian Union of Postal Workers in 1981. And as recently as 1987, the only provinces in which paid maternity leave was the norm were Quebec, Ontario and Manitoba. (10)
If enhanced maternity leave and benefits are a major reason for Quebec's high maternity absence/fertility ratio compared with other provinces, could this also explain the fact that since 1985, rates of maternity absence for this province have exceeded the general fertility rate? This would suggest that paid maternity leave and the option of returning to a paying job may remove some financial barriers to (or otherwise encourage) motherhood for working women in Quebec.
Compensation and duration of maternity absences
The following discussion relates to absences which had ended by the time of the survey; these comprise the major proportion (71%) of maternity absences from 1980 to 1987. (11)
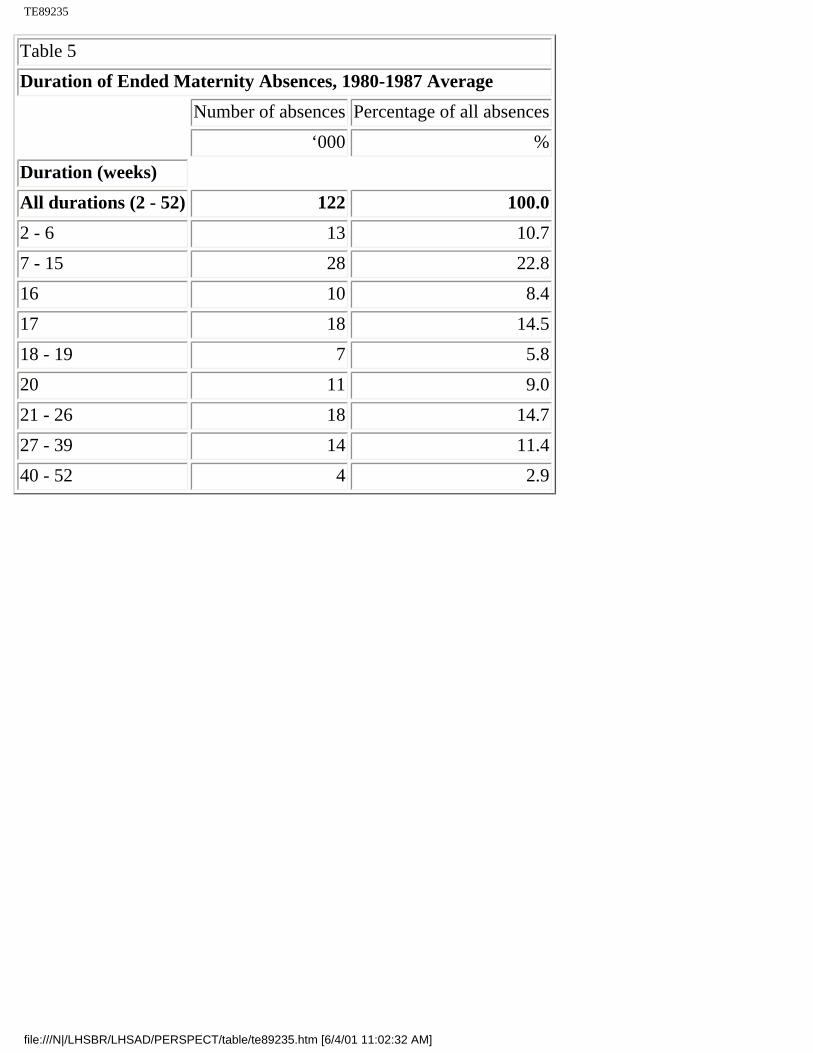
According to the AWS, the duration of maternity absences varies widely. A pregnancy-related absence may be shorter or longer than the duration specified in maternity leave provisions. (12) For the period 1980 to 1987, however, absences of 17 weeks were the most commonly occurring length and accounted for 14.5% of all absences (Table 5). This reflects statutory provisions for maternity leave, as well as regulations of the UI program, which offer benefits for a maximum of 15 weeks following an initial two-week waiting period.
file:///N|/LHSBR/LHSAD/PERSPECT/Pe8923.htm (7 of 18) [6/4/01 10:59:21 AM]
On Maternity Leave (IS 892 A3)
Table 5 Duration of Ended Maternity Absences, 1980-1987 Average
A surprisingly high proportion of ended absences were of short duration - 11% were from two to six weeks. This seems short for recuperation from childbirth, but in fact some of these absences may be sick leave taken for illness or medical complications earlier in the pregnancy.
The mean duration of ended maternity absences recorded by the AWS was 18.2 weeks, but the Maternity Leave Survey (MLS) offers an alternative (and more detailed) estimate.
Specifically, among women who had delivered live babies by the time of the survey, 58% had returned to work as paid employees (and of these, 91% had returned to the same employer). The mean duration of work interruption for these women was 21.5 weeks: an average of 4.5 weeks before and 17 weeks after childbirth. (13)
The effect of financial compensation on the duration of ended maternity absences is very visible. From 1980 to 1987, compensation was received for 87% of these absences; the high proportion compensated is reflected in the most commonly occurring duration of 17 weeks. In contrast, the duration distribution of non-compensated absences has no peaks. The average duration is 14.6 weeks, and 57% of the absences are only 2 to 14 weeks long. This compares with 18.7 weeks and 24% for compensated absences.
Trends during the 1980s
Annual data for 1980 to 1987 do not exhibit sweeping changes in the length of maternity absences (although differences could be difficult to detect because single-year estimates are subject to a higher degree of sampling variability). There does appear to be a slight upward trend of about 0.3 weeks per year in the mean duration of ended absences, but the increase in duration is confined to compensated absences.
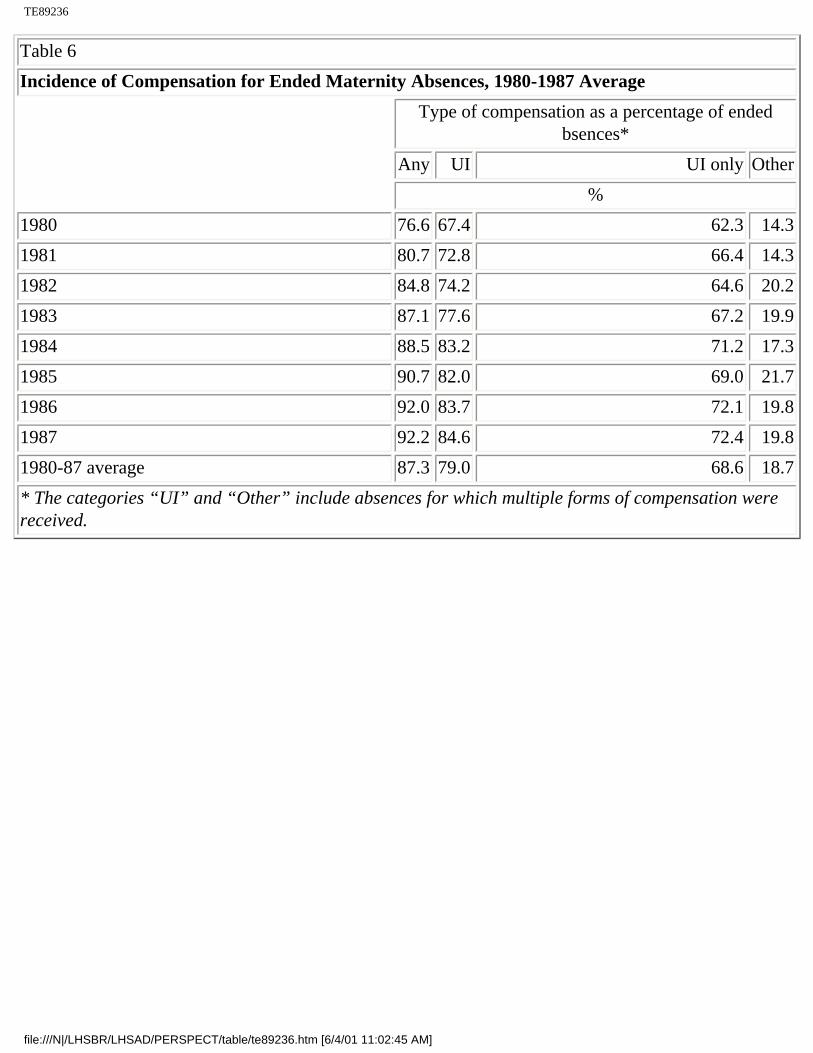
The proportion of compensated maternity absences jumped from 77% in 1980 to 92% in 1987 (Table 6). About two-thirds of this increase is accounted for by absences for which only UI was received (from 62% in 1980 to 72% in 1987). The increasing incidence of UI benefits appears to coincide with the more flexible rules implemented in January, 1984.
file:///N|/LHSBR/LHSAD/PERSPECT/Pe8923.htm (8 of 18) [6/4/01 10:59:21 AM]
On Maternity Leave (IS 892 A3)
Table 6 Incidence of Compensation for Ended Maternity Absences, 1980-1987 Average
Other types of compensation include primarily pay from the employer and group insurance. The incidence of these other types of financial compensation among ended absences also increased (from 14% in 1980 to 20% in 1987) although the trend is comparatively weak. The observed increase in non-UI types of compensation is less dramatic than the jump in the proportion of major collective agreements which provide for paid maternity leave - from 6% in 1980 to 26% in 1988 (Labour Canada, 1988).
Compensation among worker subgroups
Financial compensation rates for maternity absence differ markedly for full-time and part-time workers. This is not surprising because of the link between hours of work and the legal right to UI benefits. (14) MLS data from the 1984 reference year show that, among women who worked only full-time schedules during the 12 months before they stopped working, 93% were compensated.
The incidence of compensation among women who worked part-time, year round was 83%; in contrast, less than 60% of part-timers who had worked less than the full year received compensation. (15)
Other worker characteristics such as industry, province, education, age and marital status, although important with respect to labour market activity, have a more subtle link to entitlement to compensation for maternity absence. Generally speaking, it is difficult to identify significant differences in the incidence rates for compensation among these worker groups - the rates are dominated by the wide availability of UI maternity benefits and the majority are over 80%. Rather, it is the availability of non-UI types of compensation that distinguishes certain subgroups. Among industry groups,
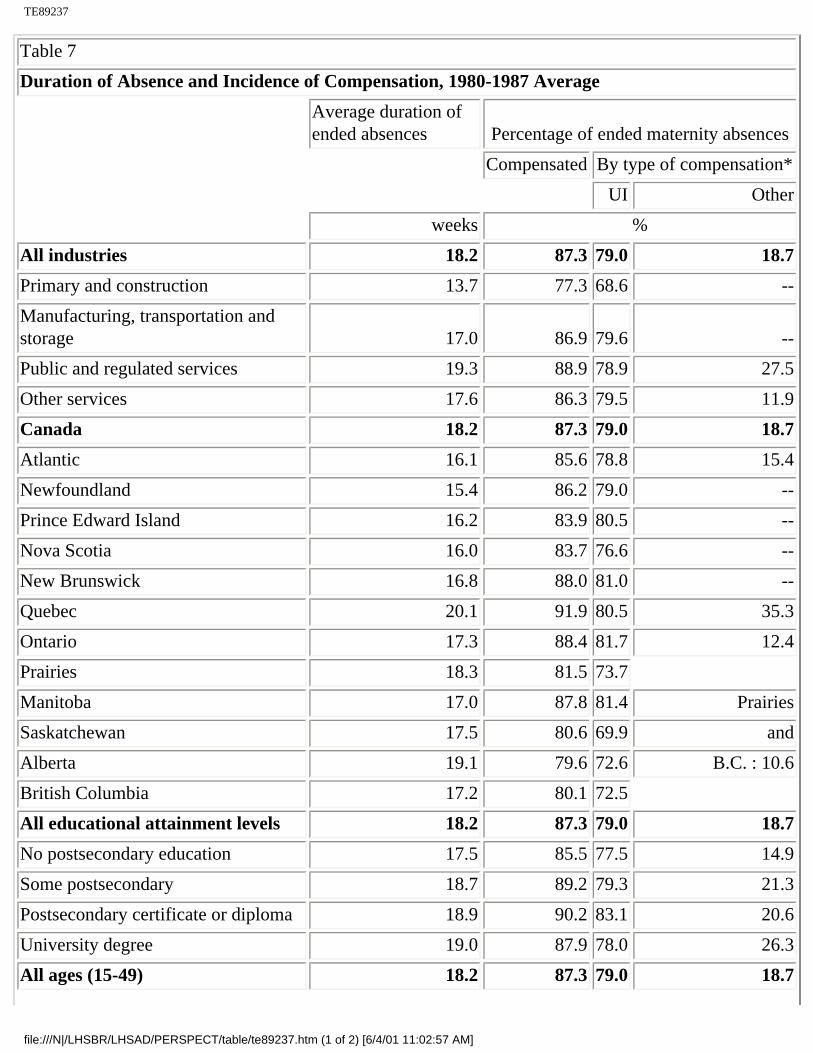
public and regulated services have the highest incidence of compensation (89%), followed closely by the manufacturing, transportation and storage group, and the other services group. The primary and construction industries lag behind at 77%. This pattern is similar to that observed for absence duration (Table 7).
Table 7 Duration of Absence and Incidence of Compensation, 1980-1987 Average
file:///N|/LHSBR/LHSAD/PERSPECT/Pe8923.htm (9 of 18) [6/4/01 10:59:21 AM]
On Maternity Leave (IS 892 A3)
The disparity between this last industry group and the other three is apparent when once compares the proportion of maternity absences for which UI benefits were received. This gap is probably the combined effect of several factors. First, the high rate of self-employment and small average firm size in the primary and construction industries suggests that paid employment in a family business may be more common in this group of industries - the family farm is a good example. But, until July 1987, workers employed by their spouses were not eligible for UI maternity benefits. (16)
Non-compensated and shorter absences may also be related to the seasonal nature of the work in these industries, which could limit eligibility for maternity benefits, especially if regular UI benefits are received shortly before the maternity absence. Finally, a generally lower profile of maternity absences is consistent with less bargaining power for maternity leave provisions and benefits in industries in which women are fewer in number.
Other types of financial compensation for maternity leave, such as pay from the employer and group insurance, are more common in the public and regulated services. Within this group of industries, a non-UI form of compensation was received in 28% of absences, compared with 12% for all other industries.
Compensation is most common in Quebec (92%) of all absences); this is mainly due to the prevalence of non-UI types of compensation in this province -35% (compared with 19% for Canada). The 20 weeks of paid maternity leave within the large public service, plus other maternity leave provisions and benefits unique to Quebec are likely contributing factors to relatively long maternity absences (averaging 20.1 weeks).
The incidence of compensation for the other provinces ranges from 80% to 88%. Rates are highest in Manitoba, Ontario and New Brunswick, and are lowest in the three most western provinces. Not surprisingly, this pattern is also reflected in UI incidence and may be the effect of higher shares of provincial employment in the primary and construction industries for the western provinces. For example, Saskatchewan, with its large agriculture industry, has the lowest incidence of UI among maternity absences (70%), nine percentage points below the rate for Canada.
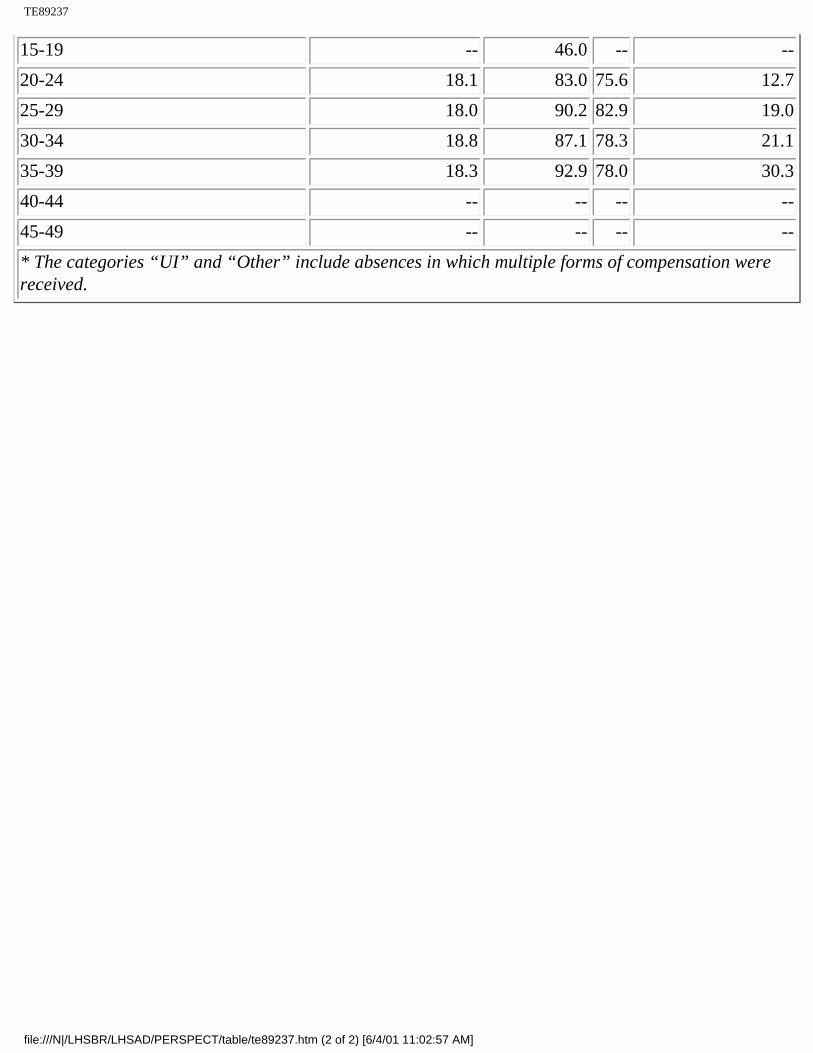
The likelihood of compensation for maternity absence also differs according to characteristics such as age, level of education, and marital status. Sampling variability limits detailed analysis of small groups (especially for cross-classifications of these variables) but some general patterns are visible. Compensation for a maternity absence is less common among women who are under 25 years of age (especially among teenagers), women who have no postsecondary education, and women who are not married.
Paid maternity leave, which is relatively rare compared to UI benefits, is perhaps the more interesting aspect of compensation. It appears to increase with age and with the level of education. The true reasons for these findings may not be the ones which first come to mind. On the one hand, it may seem logical that working women with valuable labour market skills may be offered paid maternity leave as an incentive to return to their jobs. On the other hand, the realities of collective bargaining suggest that non-
file:///N|/LHSBR/LHSAD/PERSPECT/Pe8923.htm (10 of 18) [6/4/01 10:59:21 AM]

On Maternity Leave (IS 892 A3)
wage benefits negotiated between an employer and various unions tend towards uniformity. The observed pattern in non-UI paid maternity leave by age and education may in fact be related to industry patterns. For example, the proportion of female paid workers employed in public and regulated services increases with age (from 15 to 39 years) and these industries also account for larger proportions of workers with a postsecondary certificate, diploma or degree than of workers without a postsecondary education.
Conclusion
Despite a continuing decline in the general fertility rate of Canadian women, the incidence of maternity absence rose between 1980 and 1987.
The impact of maternity absence on the supply of female labour is greatest for postsecondary graduates in their early thirties. It also appears that maternity absence is more common among workers for whom maternity leave and compensation provisions are more generous. For example, we see a higher rate of absence and a higher incidence of non-UI compensation among absences in the public and regulated service industries and in the province of Quebec. The analysis in this study cannot establish a casual link between these two factors although, in the case of Quebec, the low general fertility rate suggests that the superior leave and compensation provisions play a role in the high incidence of maternity absence.
Although the proportion of absences with financial compensation is large and has grown through the 1980s, non-UI forms of compensation, such as payments from the employer, are still relatively rate. It is clear that for most working women the cost of a maternity absence can be significant. Moreover, the current system of programs bears a price tag in terms of both direct expenditures and lost production. Of course, both private and social benefits accrue with the birth of a child. The former are obvious. The latter include growth in the labour supply in future decades.
But if child-bearing is an expensive proposition to combine with participation in the workforce, it is only the tip of the iceberg - the costs of child-rearing are far greater. One of the most immediate costs incurred is that of childcare. The shortage of high quality affordable childcare confronts a large proportion of young working parents each year. The National Child Care Survey, conducted by Statistics Canada in October, 1988 will provide extensive information on this important issue.
Survey data sources for maternity absence
The Absence from Work Survey
file:///N|/LHSBR/LHSAD/PERSPECT/Pe8923.htm (11 of 18) [6/4/01 10:59:21 AM]
On Maternity Leave (IS 892 A3)
The Absence from Work Survey (AWS), sponsored by Employment and Immigration Canada, is conducted every February as a supplement to the monthly Labour Force Survey (LFS). Its target population consists of persons aged 15 and over who worked as paid employees at some time during the previous year and who were absent from work for two or more consecutive weeks in that year as the result of an illness, accident or pregnancy. Only absences which began during the reference year are included in the survey.
In the case of multiple absences for a given worker, the AWS records details on the most recent absence and a small amount of information on the previous one. The questions asked include the reason for the absence, its duration and the types of compensation received.
The Maternity Leave Survey
To obtain more specific information on how the work patterns of pregnant women are affected, the Maternity Leave Survey (MLS), also sponsored by Employment and Immigration Canada, was conducted in February 1985 with the AWS. The sample consisted of respondents from the AWS who had been absent for pregnancy during the reference year (1984).
The questions asked in the MLS include the following: the respondent's type of work (full-time/part-time) in the 52 weeks preceding the absence; how many weeks before the birth (and why) the woman stopped working; how many weeks after the birth the mother returned to work (if she had returned - otherwise, why she had not); and how many weeks before and after the birth Unemployment Insurance (UI) benefits were received.
Sampling variability
The estimates from these surveys are subject to some degree of sampling error. The AWS is normally conducted using half of the households in the LFS sample of 48,000. The sampling ratio (that is, the proportion of the target population actually sampled) is much higher in some provinces than in others. As a result, the sampling variability associated with an estimate of a given size will not be the same for all provinces. For a given province the coefficient of variation (CV) generally decreases as the size of the estimate increases. (For further information see Lévesque (1988) or contact the author.
Unemployment insurance data
Statistics Canada obtains administrative data from Employment and Immigration Canada's (EIC)
file:///N|/LHSBR/LHSAD/PERSPECT/Pe8923.htm (12 of 18) [6/4/01 10:59:21 AM]
On Maternity Leave (IS 892 A3)
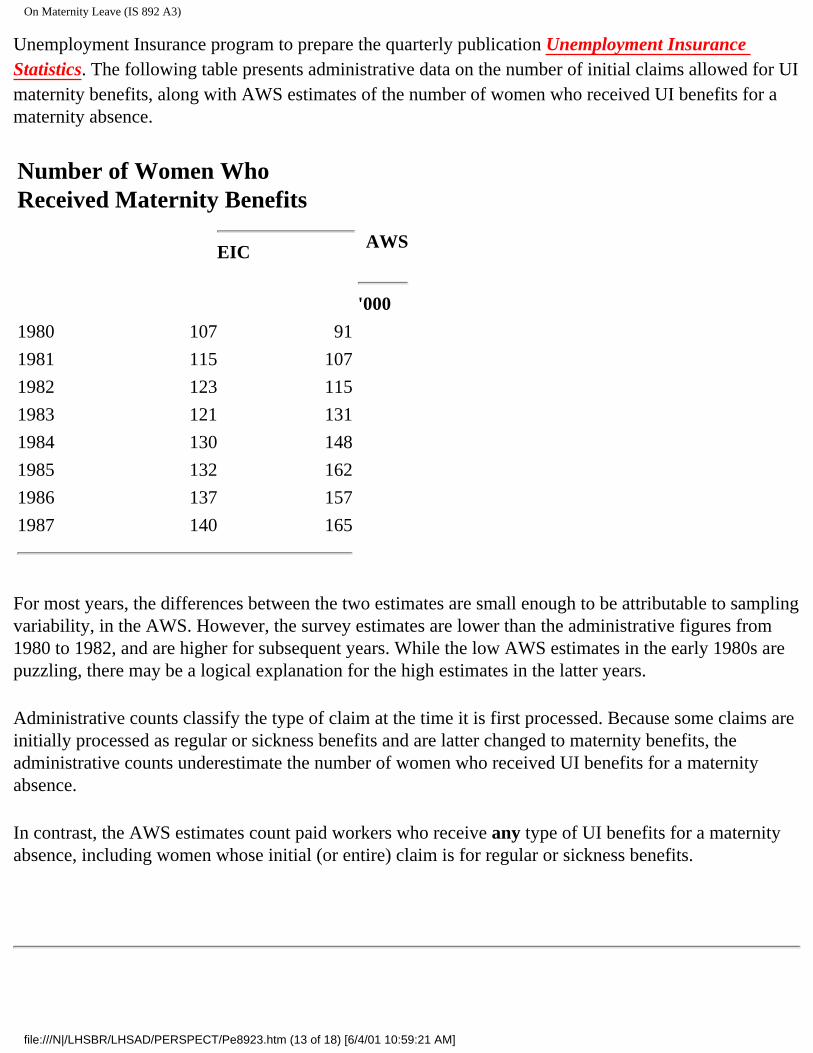
Unemployment Insurance program to prepare the quarterly publication Unemployment Insurance Statistics. The following table presents administrative data on the number of initial claims allowed for UI maternity benefits, along with AWS estimates of the number of women who received UI benefits for a maternity absence.
Number of Women Who Received Maternity Benefits
EIC AWS
'000
1980 107 91
1981 115 107
1982 123 115
1983 121 131
1984 130 148
1985 132 162
1986 137 157
1987 140 165
For most years, the differences between the two estimates are small enough to be attributable to sampling variability, in the AWS. However, the survey estimates are lower than the administrative figures from 1980 to 1982, and are higher for subsequent years. While the low AWS estimates in the early 1980s are puzzling, there may be a logical explanation for the high estimates in the latter years.
Administrative counts classify the type of claim at the time it is first processed. Because some claims are initially processed as regular or sickness benefits and are latter changed to maternity benefits, the administrative counts underestimate the number of women who received UI benefits for a maternity absence.
In contrast, the AWS estimates count paid workers who receive any type of UI benefits for a maternity absence, including women whose initial (or entire) claim is for regular or sickness benefits.
file:///N|/LHSBR/LHSAD/PERSPECT/Pe8923.htm (13 of 18) [6/4/01 10:59:21 AM]
On Maternity Leave (IS 892 A3)
Notes
Note 1From the estimates provided in the article by Lévesque (1988) it is clear that pregnancy-related absences constitute the smallest proportion of the total number of paid worker absences (about 20% in 1966). However, for female paid workers of prime child-bearing age, pregnancy absences are more common than the combined number of absences resulting from accident and illness.
Note 2Although the incidence rates of pregnancy-related absences may be a useful and reasonable proxy for the fertility rate of working women, it is important to be aware of the conceptual and coverage differences between these two measures.
The general fertility rate published by Statistics Canada measures the annual number of live births per 1,000 women 15 to 49 years of age. Official rates for each of the provinces and territories, except Newfoundland, can be found in Statistics Canada's Births and Deaths: Vital Statistics, Volume 1. The official rate for Canada excludes Newfoundland and includes the two territories. For this study, a general fertility rate for Newfoundland was calculated from unrounded population estimates (provided by Demography Division) and published birth data. At the time of writing, births and fertility rates for 1987 were not available.
The AWS, a supplement to the LFS, is confined to the non-reserve, non-institutionalized civilian population in the ten provinces. The incidence rate of maternity absence estimated from the AWS pertains to women 15 to 49 years of age who worked as paid employees sometime during the reference year. The survey data may include absences for pregnancy that do not correspond to a live birth in the reference year, for example, absences due to medical complications early in a pregnancy, miscarriage and stillbirths. On the other hand, the incidence rates for maternity absence do not take account of multiple births.
Note 3In some statutes, employees in certain occupations, for example, domestic workers and professions, are exempted from the maternity leave provisions.
Note 4The maximum insurable earnings level is raised each year in accordance with the average percentage increase in wages and salaries over the most recent eight-year period available from Revenue Canada/Taxation.
Note 5The "public and regulated services" group of industries includes communication and utilities, and education, health, social and government services. The "other services" group includes all other service-
file:///N|/LHSBR/LHSAD/PERSPECT/Pe8923.htm (14 of 18) [6/4/01 10:59:21 AM]
On Maternity Leave (IS 892 A3)
producing industries except transportation and storage, which are grouped with manufacturing.
Note 6The industry codes for each respondent on the AWS file pertain to the current or most recent job at the time of the interview in February. This may not be the same job the respondent held preceding the absence(s) recorded for the previous calendar year. To take account of such cases, rates of maternity absence were also calculated for the reduced set of respondents with job tenure of 14 months or longer at the time of the interview. The incidence rates by industry group for this reduced sample are all somewhat larger than the rates for the full sample (reflecting the legal right to maternity leave after completing a qualifying period of job tenure), but the ranking of the rates is preserved. The full sample rates are used in Table 3 since they are subject to less sampling variability.
Pregnancy-related absences counted by the AWS include cases in which women resigned or were laid off from their jobs as well as those who began a period of maternity leave from their jobs. So the AWS incidence rates for pregnancy-related absence may overestimate the prevalence of formal maternity leave.
Note 7These two percentages (71% and 49%) are based on major collective agreements (excluding construction) for two separate years, 1982 and 1983 respectively. For 1982, agreements covering 200 and more employees were included in the data base; for 1993, data were available for agreements covering 500 and more employees (Labour Canada, 1984).
Note 8These include special maternity leave when there is a risk of miscarriage or a threat to the health of the mother, and leave for legal or spontaneous abortion and stillbirths (CCH Canadian Ltd., 1987).
Note 9The agreement provides 20 weeks of maternity leave at 93% of regular pay for those who quality for UI maternity benefits. For the 15 weeks during which the UI benefits are payable the employer supplements them to make up 93% of regular pay. For the remaining five weeks, the employer pays the entire 93% of regular wages. Workers who do not qualify for UI maternity benefits receive ten weeks of benefits at 93% of their salary, paid by the employer, and a further ten weeks of unpaid leave (Labour Canada, 1984; Christopher Church, 1986).
Note 10The only other agreement with paid maternity leave was that of the Workers' Compensation Board Employees' Union in British Columbia. (Unpublished data on collective agreements covering 500 and more employees, in effect 31 December 1987, Bureau of Labour Information, Labour Canada.)
Note 11The AWS collects data for up to two long absences which started during the reference year; the most
file:///N|/LHSBR/LHSAD/PERSPECT/Pe8923.htm (15 of 18) [6/4/01 10:59:21 AM]
On Maternity Leave (IS 892 A3)
recent and (if there was more than one) the previous absence. A "previous" absence coded as "pregnancy" often occurs with a "most recent" absence also coded as "pregnancy", which implies that the first absence is probably related to sickness or medical complications earlier in the pregnancy, and the second absence is the one taken for childbirth. (Duration data from the 1980s support this hypothesis - the median durations are seven weeks for previous absences and 17 weeks for most recent ended absences.) The analysis of compensation and duration in this study relates to most recent ended absences.
Some caution is advised in interpreting the AWS duration measures. Among ended absences those of short duration are probably over-represented. (Assuming that the underlying distribution of duration is the same regardless of the starting date, the frequency distribution for ended absences is missing absences of more than about 13.5 months long, as well as a decreasing proportion of shorter absences.) The average duration of ended absences thus underestimates the average duration of all absences. For an unended absence, on the other hand, the duration recorded at the time of the survey serves only as a lower bound on the total length of the absence.
Note 12Some collective agreements allow a pregnant employee to take sick leave when she is advised by her doctor to stop working before the expected date of delivery; also, a formal period of maternity leave may be followed by parental leave. These different types of leave, taken in succession, would constitute one long absence surrounding a pregnancy, and this is how they would show up in AWS data.
There are also situations in which the AWS duration of absence may measure something other than leave from an employer. Specifically, women who leave a job for pregnancy reasons are counted as absent by the AWS (and the duration of absence refers to absence from the workforce). The same is true of women who resign from a job after some period of maternity leave; in these cases, the duration reported in the AWS could be either the duration of leave from the employer or the length of absence from the workforce.
Note 13The AWS estimate for the mean duration of ended (most recent) absences in 1984 is only 18.7 weeks, almost three weeks less than the MLS mean duration of work interruption for women who had returned to work. Two factors which may contribute to this difference are: short pregnancy absences not associated with childbirth; and absences in which job separation occurs, as described note 12.
Note 14Employment of 15 or fewer hours per week at a wage less than 20% of maximum insurable earnings is not insurable under the Unemployment Insurance Act.
Note 15The "full-time only" workers from the MLS are self-identified (without reference to hours of work per week). The "part-time only" workers are those who stated that they worked only part-time and fewer than 30 hours a week.
file:///N|/LHSBR/LHSAD/PERSPECT/Pe8923.htm (16 of 18) [6/4/01 10:59:21 AM]
On Maternity Leave (IS 892 A3)
Note 16Until July 1987, workers were not eligible for UI maternity benefits if they were employed by their spouse (Unemployment Insurance Act, Section 3.2.c) or by a corporation in which the employee or their spouse individually or in combination controlled more than 40% of the voting shares (Section 4.3.d).
References
● Canadian Advisory Council on the Status of Women. Becoming a Parent: A Guide to Maternity/Parental Leave and Benefits in Canada. August 1988.
● CCH Canadian Limited. Canada Labour Law Reports, 1987. ● Church, C. Maternity and Parental Benefits in Canadian Collective Agreements. Discussion
paper prepared for the Women's Bureau, Labour Canada, August 1986. ● Commission de la santé et de la sécurité du travail. Annual Report, 1985. ● Labour Canada. Maternity and Child Care Leave in Canada. (Catalogue No. L24-1208/84E),
1985. ● Labour Canada. Non-Wage Trends in Collective Bargaining in Canada. Bureau of Labour
Information, October 1988. ● Lévesque, J.-M. "Work Absences and Compensation, 1979-1986," The Labour Force. Statistics
Canada (Catalogue No. 71-001), April 1988. ● Statistics Canada. Unemployment Insurance Statistics. (Catalogue No. 73-001, quarterly). ● Statistics Canada. Births and Deaths: Vital Statistics. Volume 1 (Catalogue No. 84-204, annual). ● Townson, M. "Paid Parental Leave Policies: An International Comparison, With Options for
Canada," in Series 4 Child Care: The Employer's Role. Background paper for the Report of the Task Force on Child Care, Status of Women Canada (Catalogue No. SW 43-1/4-1985E), December 1985.
Chart references
The four charts deal with the general fertility rate and the maternity absence rate. The general fertility rate shows the annual number of live births per 1,000 women aged 15 to 49. The maternity absence rate is the proportion of female paid workers in the same age group who were absent from work in a given year because of pregnancy. See note 2 for further details.
file:///N|/LHSBR/LHSAD/PERSPECT/Pe8923.htm (17 of 18) [6/4/01 10:59:21 AM]

On Maternity Leave (IS 892 A3)
Author
Joanne Moloney is with the Labour and Household Surveys Analysis Division of Statistics Canada.
Source
Perspectives on Labour and Income, Summer 1989, Vol. 1, No. 1 (Statistics Canada, Catalogue 75-001E). This is the third of five articles in the issue.
file:///N|/LHSBR/LHSAD/PERSPECT/Pe8923.htm (18 of 18) [6/4/01 10:59:21 AM]
file:///N|/LHSBR/LHSAD/PERSPECT/chart/ce8923a.gif
file:///N|/LHSBR/LHSAD/PERSPECT/chart/ce8923a.gif [6/4/01 11:00:50 AM]

file:///N|/LHSBR/LHSAD/PERSPECT/chart/ce8923b.gif
file:///N|/LHSBR/LHSAD/PERSPECT/chart/ce8923b.gif [6/4/01 11:00:59 AM]
TE89231
Table 1
Maternity Absence and Fertility Rates
Incidence of maternity
absence FertilityMaternity absence/fertility
ratio Paid worker/population ratio
1980-87 average1980-86 average 1980-87 average
%births per100
women %
All ages (15-49) 3.79 5.61 0.68 69.1
15-19 0.62 2.53 0.25 59.3
20-24 4.35 9.19 0.47 81.6
25-29 9.08 12.59 0.72 74
30-34 6.12 7.14 0.86 67.5
35-39 1.44 2.08 0.69 68.3
40-44 -- 0.31 -- 65.7
45-49 -- 0.02 -- 61.1
Source: See note 2.
file:///N|/LHSBR/LHSAD/PERSPECT/table/te89231.htm [6/4/01 11:01:12 AM]
TE89232
Table 2
Incidence of Maternity Absence, 1980-1987 Average
Paid workers Maternity absences Incidence of maternity absence
‘000 ‘000 %
All ages (15-49) 4,538 172 3.8
Without postsecondary* 3,264 108 3.3
With postsecondary 1,274 64 5.0
15-19 597 4 0.6
20-24 923 40 4.3
Without postsecondary 674 34 5.0
With postsecondary 249 6 2.5
25-29 828 75 9.1
Without postsecondary 524 48 9.1
With postsecondary 304 28 9.1
30-34 706 43 6.1
Without postsecondary 451 19 4.3
With postsecondary 255 24 9.4
35-39 617 9 1.4
Without postsecondary 409 3 0.7
With postsecondary 209 6 2.8
40-44 483 -- --
45-49 384 -- --
* Refers to persons without a postsecondary certificate, diploma or degree.
file:///N|/LHSBR/LHSAD/PERSPECT/table/te89232.htm [6/4/01 11:01:24 AM]
file:///N|/LHSBR/LHSAD/PERSPECT/chart/ce8923c.gif
file:///N|/LHSBR/LHSAD/PERSPECT/chart/ce8923c.gif [6/4/01 11:01:36 AM]
TE89233
Table 3
Characteristics of Female Paid Workers by Industry Group
Incidence of maternity absence(15-49 year-
olds) 1980-87 average
Rate of union membership in paid jobs held by women
1986*
Proportion of paid workers (15-49 in
prime child-bearing age group (20-34)
1980-87 average
%
Primary and construction 2.1 5.2 49.4
Manufacturing, transportation and storage 4.0 29.2 56.2
Public and regulated services 4.8 60.2 54.9
Other services 3.2 9.6 53.3
* This rate counts as union members all workers who are covered by a collective agreement.
Source: Unpublished data from the Labour Market Activity Survey.
file:///N|/LHSBR/LHSAD/PERSPECT/table/te89233.htm [6/4/01 11:01:48 AM]

TE89234
Table 4
Maternity Absence and Fertility by Province
Incidence of maternity absence Fertility Maternity absence/fertility ratio
1980-87 average 1980-86 average
%births per 100
women
Canada 3.79 5.61 .676
Newfoundland 3.04 6.06 .502
Prince Edward Island 3.07 6.21 .495
Nova Scotia 3.43 5.47 .627
New Brunswick 3.34 5.60 .596
Quebec 4.34 5.01 .866
Ontario 3.76 5.41 .696
Manitoba 3.22 6.22 .517
Saskatchewan 4.17 7.31 .571
Alberta 3.66 6.88 .532
British Columbia 3.26 5.73 .569
Source: See note 2.
file:///N|/LHSBR/LHSAD/PERSPECT/table/te89234.htm [6/4/01 11:02:05 AM]
file:///N|/LHSBR/LHSAD/PERSPECT/chart/ce8923d.gif
file:///N|/LHSBR/LHSAD/PERSPECT/chart/ce8923d.gif [6/4/01 11:02:17 AM]
TE89235
Table 5
Duration of Ended Maternity Absences, 1980-1987 Average
Number of absences Percentage of all absences
‘000 %
Duration (weeks)
All durations (2 - 52) 122 100.0
2 - 6 13 10.7
7 - 15 28 22.8
16 10 8.4
17 18 14.5
18 - 19 7 5.8
20 11 9.0
21 - 26 18 14.7
27 - 39 14 11.4
40 - 52 4 2.9
file:///N|/LHSBR/LHSAD/PERSPECT/table/te89235.htm [6/4/01 11:02:32 AM]
TE89236
Table 6
Incidence of Compensation for Ended Maternity Absences, 1980-1987 Average
Type of compensation as a percentage of ended bsences*
Any UI UI only Other
%
1980 76.6 67.4 62.3 14.3
1981 80.7 72.8 66.4 14.3
1982 84.8 74.2 64.6 20.2
1983 87.1 77.6 67.2 19.9
1984 88.5 83.2 71.2 17.3
1985 90.7 82.0 69.0 21.7
1986 92.0 83.7 72.1 19.8
1987 92.2 84.6 72.4 19.8
1980-87 average 87.3 79.0 68.6 18.7
* The categories “UI” and “Other” include absences for which multiple forms of compensation were received.
file:///N|/LHSBR/LHSAD/PERSPECT/table/te89236.htm [6/4/01 11:02:45 AM]
TE89237
Table 7
Duration of Absence and Incidence of Compensation, 1980-1987 Average
Average duration of ended absences Percentage of ended maternity absences
Compensated By type of compensation*
UI Other
weeks %
All industries 18.2 87.3 79.0 18.7
Primary and construction 13.7 77.3 68.6 --
Manufacturing, transportation and storage 17.0 86.9 79.6 --
Public and regulated services 19.3 88.9 78.9 27.5
Other services 17.6 86.3 79.5 11.9
Canada 18.2 87.3 79.0 18.7
Atlantic 16.1 85.6 78.8 15.4
Newfoundland 15.4 86.2 79.0 --
Prince Edward Island 16.2 83.9 80.5 --
Nova Scotia 16.0 83.7 76.6 --
New Brunswick 16.8 88.0 81.0 --
Quebec 20.1 91.9 80.5 35.3
Ontario 17.3 88.4 81.7 12.4
Prairies 18.3 81.5 73.7
Manitoba 17.0 87.8 81.4 Prairies
Saskatchewan 17.5 80.6 69.9 and
Alberta 19.1 79.6 72.6 B.C. : 10.6
British Columbia 17.2 80.1 72.5
All educational attainment levels 18.2 87.3 79.0 18.7
No postsecondary education 17.5 85.5 77.5 14.9
Some postsecondary 18.7 89.2 79.3 21.3
Postsecondary certificate or diploma 18.9 90.2 83.1 20.6
University degree 19.0 87.9 78.0 26.3
All ages (15-49) 18.2 87.3 79.0 18.7
file:///N|/LHSBR/LHSAD/PERSPECT/table/te89237.htm (1 of 2) [6/4/01 11:02:57 AM]
TE89237
15-19 -- 46.0 -- --
20-24 18.1 83.0 75.6 12.7
25-29 18.0 90.2 82.9 19.0
30-34 18.8 87.1 78.3 21.1
35-39 18.3 92.9 78.0 30.3
40-44 -- -- -- --
45-49 -- -- -- --
* The categories “UI” and “Other” include absences in which multiple forms of compensation were received.
file:///N|/LHSBR/LHSAD/PERSPECT/table/te89237.htm (2 of 2) [6/4/01 11:02:57 AM]


![Maternity Leave Rights [FAQ] Answered](https://static.fdocuments.net/doc/165x107/58775eca1a28ab4e4f8b636f/maternity-leave-rights-faq-answered.jpg)