
On Float The Full 60 Page PDF - Value Investing Journey
60
1 On Float The Full 60 Page PDF By Jason Rivera Chairman, CEO, and Founder of Rivera Holdings Investment Holding Company A Rivera Holdings Publication Copyright 2016
Transcript of On Float The Full 60 Page PDF - Value Investing Journey

1
On Float The Full 60 Page PDF
By Jason Rivera
Chairman, CEO, and Founder of
Rivera Holdings Investment
Holding Company
A Rivera Holdings Publication
Copyright 2016

2
Contents
Charlie Munger On Deferred Tax Liabilities
And Intrinsic Value On Float Part 1 ............ 3
What Is Float? On Float Part 2 .................... 7
Buffett's Alpha Notes - The Power of Float -
On Float Part 3 ......................................... 16
How To Find Float On The Balance Sheet -
On Float Part 4 ........................................ 23
How Does Float Affect Valuation? On Float
Part 5 ........................................................ 35
Is Float Ever Bad? On Float Part 6 ........... 54
Conclusion and Further Recommended
Reading - On Float Part 7 ......................... 58

3
Charlie Munger On Deferred Tax Liabilities And Intrinsic Value
On Float Part 1
The goal of this blog is to help us all improve as investors and thinkers so we're a little
wiser every day. The hope being that our knowledge will continue to compound over
time so we'll have huge advantages over other investors in the future.
The aim of today's post is to continue this process by talking about a topic few investors
know about. And even fewer understand.
Below is an unedited thread from the value investment forum Corner of Berkshire
and Fairfax discussing Charlie Monger’s thoughts on deferred tax liabilities and
intrinsic value.
Bolded emphasis is mine below.
So, I've been reading Monger’s Wesco letters (they are quite repetitive).
However, while reading, I found the following section pretty interesting:
Consolidated Balance Sheet and Related Discussion
As indicated in the accompanying financial statements, Wesco's net worth
increased, as accountants compute it under their conventions, to $2.22

4
billion ($312 per Wesco share) at yearend 1998 from $1.76 billion ($248
per Wesco share) at yearend 1997.
The $459.5 million increase in reported net worth in 1998 was the result of
three factors: (1) $395.8 million resulting from continued net appreciation
of investments after provision for future taxes on capital gains; plus (2)
$71.8 million from 1998 net income; less (3) $8.1 million in dividends
paid.
The foregoing $312-per-share book value approximates liquidation value
assuming that all Wesco's non-security assets would liquidate, after taxes,
at book value. Probably, this assumption is too conservative. But our
computation of liquidation value is unlikely to be too low by more than
two or three dollars per Wesco share, because (1) the liquidation value of
Wesco's consolidated real estate holdings (where interesting potential now
lies almost entirely in Wesco's equity in its office property in Pasadena)
containing only 125,000 net rentable square feet, and (2) unrealized
appreciation in other assets (primarily Precision Steel) cannot be large
enough, in relation to Wesco's overall size, to change very much the overall
computation of after-tax liquidation value.
Of course, so long as Wesco does not liquidate, and does not sell
any appreciated assets, it has, in effect, an interest-free "loan"
from the government equal to its deferred income taxes on the
unrealized gains, subtracted in determining its net worth.
This interest free "loan" from the government is at this moment
working for Wesco shareholders and amounted to about $127
per share at yearend 1998.
However, some day, perhaps soon, major parts of the interest-free "loan"
must be paid as assets are sold. Therefore, Wesco's shareholders have no
perpetual advantage creating value for them of $127 per Wesco share.
Instead, the present value of Wesco's shareholders' advantage must
logically be much lower than $127 per Wesco share. In the writer's
judgment, the value of Wesco's advantage from its temporary,

5
interest-free "loan" was probably about $30 per Wesco share at
yearend 1998.
After the value of the advantage inhering in the interest-free
"loan" is estimated, a reasonable approximation can be made of
Wesco's intrinsic value per share. This approximation is made
by simply adding (1) the value of the advantage from the
interest-free "loan" per Wesco share and (2) liquidating value
per Wesco share. Others may think differently, but the foregoing
approach seems reasonable to the writer as a way of estimating intrinsic
value per Wesco share.
BREAK HERE. BELOW THIS IS THE WRITERS - NOT
MUNGER'S COMMENTS.
It immediately struck me that such an evaluation could easily be applied to
Berkshire, although Berkshire at this point is much more complex than
Wesco was then. Turns out, someone had already done the analysis for
2011 and 2012:
http://seekingalpha.com/article/282116-berkshire-hathaway-
worth-its-salt
http://seekingalpha.com/article/740931-berkshire-hathaway-
worth-its-salt-2012-update
(As a side note, I had trouble following Dan Braham's line of thinking on
this evaluation in the comments of the first article)
This evaluation contrasts from the "investments per share" and "earnings
from owned companies" approach, which I believe was advocated by
Buffett more recently.
BREAK... BELOW HERE ARE MY COMMENTS.
The Importance of Float

6
‘Float is money that doesn’t belong to us, but that we temporarily hold.”
Warren Buffett
Why does Munger think the above is a good approximation of Wesco's intrinsic
valuation then? Because while the company "owns" these liabilities on their balance
sheet the company can use them to grow the business.
This is an example of float and the power it can have on a company.
Munger only used an estimated 1/5th of the value of Wesco's float in his valuation.
Why? Because when these "assets" are sold it comes off Wesco's balance sheet.
I agree with Munger that this is a necessary and conservative way to look at valuing float
within a company.
And most people overlook float when evaluating companies because they either don't
know what it is. Don't know the power it can have within a business. Or don't know
how to evaluate it.
This won't be an issue here.
Press On Research subscribers already know this as I talk a lot about float in many
issues I've written. But I want to begin talking about it more here for a simple reason.
Float is one of the most powerful - and least understood - concepts when evaluating
businesses.
We can gain a gigantic advantage over other investors by knowing what float is. How to
evaluate it. And and how to value it.
Also, contrary to common belief float can be found in any business. Not just insurance
companies.
But we'll get to this in a later post... In the next post I'm going to explain what float is in
more detail.

7
What Is Float? On Float Part 2
Today's post is a continuation of the earlier post Charlie Munger On Deferred Tax
liabilities and Intrinsic Value - On Float Part 1. And we're going to answer the
question today, what is float?
But before we get to that next is an excerpt from the July 2015 Press On
Research issue where I talk about float extensively.
The Biggest Investment Secret In The World
How Warren Buffett Got So Rich And How You Can Too
Warren Buffett’s admired around the world for his philanthropy as he’s
going to donate 99% of his $70 billion plus net worth to charity when he
dies.
He can donate so much money because of how great an investor he is. But
almost no one knows how Warren Buffett made his fortune.
Yes, most investors know about his investments in Coke (KO), Johnson &
Johnson (JNJ), and Wells Fargo (WFC). But this isn’t how he built his
fortune.

8
Investor’s who’ve studied Buffet know he built his partnership, and then
Berkshire Hathaway, buying small companies.
But this still isn’t the true secret to Warren Buffett’s success.
Today I’m going to tell you how he grew $100,000 into more than $70
billion. And tell you how we can start doing the same.
But before we explain the exact companies Buffett built his fortune on. We
need to talk about why Press On Research concentrates on small caps.
A University of Kansas student asked Buffett about this in 2005:
“Question: According to a business week report published in 1999, you
were quoted as saying: “It's a huge structural advantage not to have a lot of
money. I think I could make you 50% a year on $1 million. No, I know I
could. I guarantee that.”…would you say the same thing today?”
Here’s Buffett’s answer emphasis is mine:
“Yes, I would still say the same thing today. In fact, we are still earning
those types of returns on some of our smaller investments. The best
decade was the 1950s; I was earning 50% plus returns with small
amounts of capital. I could do the same thing today with smaller
amounts. It would perhaps even be easier to make that much money in
today's environment because information is easier to access."
Yes, I’ve said this before many times. But it’s an important concept to
understand.
Small ultra safe investments that produce a ton of cash. Have little to no
debt. Pay dividends and buy back shares. And are cheap are my favorite
investments.
These kinds of businesses are what Value Investing Journey and
Press On Research is all about.

9
Today’s recommendation has no debt. Owns more cash and cash
equivalents than its entire market cap. And just its net cash and cash
equivalents make up 77% of its market cap.
This doesn’t count any of its property, plant, and equipment, future
premiums earned, or cost-free float. And this company is undervalued by
29% to 70%.
But this still isn’t all… It’s also much more profitable than competition.
Today’s pick isn’t just a great company with all the above traits. It’s also in
Buffett’s favorite industry to invest.
Investing In Insurance
Most people won’t research insurance companies. I wouldn’t early in my
investing journey. And many professional analysts stay away too.
This is because insurance companies are hard to understand at first. Have
new and confusing terminology to learn. And normal profit metrics don’t
matter much for them.
But if you learn how to evaluate them not only will you learn they’re easy
to evaluate once you know what you’re doing. But you can use the same
repeatable process on every insurance company. And Buffett has
continued to buy into insurance – his favorite industry – constantly over
the decades. And it’s why he’s so successful.
In reality insurance companies are easy to understand.
Insurance companies take money – premiums, the insurance version of
revenue – as payment for insuring things like businesses, equipment,
health, life, etc.
The insurance company doesn’t have to pay you a dime of the money it
earns over the years until there’s some kind of damage or theft of
whatever’s insured.

10
When this happens they pay the agreed upon insurance rate out to the
policyholder.
While the company continues to earn money – premiums again - it invests
some of it so it can pay back your policy in the future. And also make a
profit in excess of the amount earned, invested, and paid out.
If the company writes its policies and invests well over time it will earn
underwriting profits. And grow the assets it can use to write more policies
and invest more money.
If it doesn’t, the company will go out of business when a major disaster
strikes.
Think of insurance companies like investment management companies.
But instead of only earning management fees. Insurance companies earn
premiums on top of investment earnings.
These effects can double profits over time… If management is great at
what they do.
The insurance business while easy to understand is one of the hardest
businesses to be great at.
Other than being a low-cost operator like GEICO. Owned by Berkshire
Hathaway. There are no competitive advantages in this industry. And it
also experiences wild swings of huge profitability than massive losses.
But if the company writes policies and invests money well over a long
period they can grow to great sizes at almost no extra costs. The only new
costs may be to hire more staff.
Insurance companies also hold the greatest secret in the investment
world… Float. This is how Buffett built his fortune. And how we’ll start to
build ours.
But before we get to this we need to know why float is so important.

11
Brief Berkshire Hathaway History
Buffett began buying Berkshire Hathaway stock in 1962 when it was still a
textile manufacturer. And when he still ran his investment partnership.
He bought Berkshire stock because it was cheap compared to the assets it
had. Even though the company was losing money.
He continued to pour millions of dollars into Berkshire to keep up with
foreign and non union competition. But none of this worked.
In time Buffett realized he was never going to make a profit again in the
textile industry. So whatever excess funds Berkshire did produce he
started buying other companies.
The first insurance company Berkshire Hathaway bought was National
Indemnity Company in 1967.
Since then Berkshire’s float has grown from $39 million in 1970 to $77
billion in 2013.
Float compounds like interest does if you use and invest it well. But not
only does float compound, if you use it right it also compounds the value of
the company that owns the float.

12
Since 1967 when Berkshire bought National Indemnity, Berkshire’s stock
price has risen from $20.50 a share to today’s price of $210,500. Or a
total gain of 10,268%.
This is the power of insurance companies when operated well. And today’s
recommendation is an insurance company that operates the right way too.
But before we get to that I need to explain how float makes this possible.
The Biggest Investment Secret Revealed
‘Float is money that doesn’t belong to us, but that we temporarily hold.”
Warren Buffett
Float is things like prepaid expenses. Billings in excess of expected
earnings. Deferred taxes. Accounts payable. Unearned premiums. And
other liabilities that don’t require interest payments.
But they are the farthest thing from liabilities.
MY UPDATED NOTE HERE... I'LL TALK ABOUT THIS MORE IN
DEPTH IN A LATER POST AND DETAIL WHAT I MEANT TO
SAY AND DIDN'T EXPLAIN WELL ENOUGH HERE.
Instead of paying this money out now like normal liabilities. Companies
can use these “liabilities” to fund current operations.
Float is positive leverage instead of negative leverage like debt and interest
payments.
Think of float as the opposite of paying interest on a loan. Instead of
paying the bank for the cash you’ve borrowed. The bank pays you interest
to use the money you loaned. And you can use this money to invest.
Using cost-free float to fund operations can improve margins by up to a
few percentage points.

13
MY NOTE HERE: I'LL EXPLAIN THIS BETTER IN A FUTURE
POST TOO.
The best way to explain why float is so important is with the following
quote:
“Leaving the question of price aside, the best business to own is one that
over an extended period can employ large amounts of free – other
peoples money – in highly productive assets so that return on owners
capital becomes exceptional.” Professor Sanjay Bakshi adding to
something Warren Buffett said about great businesses.
I said in last month’s issue: “When a company’s float/operating assets
ratio is above 100% it means the company is operating with “free” or
cost-free money.”
But this isn’t true with insurance companies.
For an insurance company to operate on a cost-free basis it has to produce
underwriting profits for a sustained period.
I look for underwriting profits of at least five years straight to consider its
float cost-free.
And the company I’m going to tell you about today has earned an
underwriting profit every one of the last 10 years.
When you come across companies that are able to do this on a consistent
basis you should expect exceptional returns in the future.
This is because when a company operates its entire business on a cost-free
basis it means several things. 1) It’s a great business. 2.) It’s an efficient
business. And 3.) float magnifies profit margins.
So what is this great company?

14
I go on here to detail the company I recommended - and bought for the portfolios I
manage - in July to subscribers.
So What Is Float?
To summarize the above float is anything listed in the liabilities section of its balance
sheet you don't pay interest on.
Interest based liabilities - NOT FLOAT - include capital leases, and short and long-
term debt.
Most of the time these are the only interest based liabilities on a company's balance
sheet. Make sure by checking the off-balance sheet transactions and total obligations
notes - if any - in the companies footnotes.
Examples of non interest based liabilities - FLOAT - include prepaid expenses, accounts
payable, taxes payable, accrued liabilities, deferred tax liabilities, unearned premiums,
etc.
These vary more but remember if the company doesn't have to pay interest on the
liability it's float... Money the company has to pay later but in the mean time can use to
invest in and grow the business.
Think of float as normal debt without the negative effects.
In the short to medium-term - long-term for most insurance companies - float while
listed as a liability on the balance sheet should be considered an asset to the company.
Why? Because while the company owns the float it can use these "liabilities" to invest
and grow the business.
How though?
Because while the company lists the liability on its balance sheet - and still owns the
liability - it can use the float as positive leverage to grow the company or invest in other
businesses.

15
Sometimes at a better than cost free basis as mentioned above... But we'll talk about this
in a future post on float.
Next up I'll go through a company's balance sheet to separate float from non float. And
show you how to value and evaluate it.

16
Buffett's Alpha Notes - The Power of Float - On Float Part 3
Today's post is a continuation of the earlier posts: Charlie Munger On Deferred
Tax liabilities and Intrinsic Value - On Float Part 1. And What is Float? On
Float Part 2.
Today I'm going to illustrate how powerful float is over time.
Buffett's Alpha Notes - The Power Of Float
My notes aren't in the quoted areas unless in parenthesis. Bolded emphasis is mine
throughout.

17
“Further, we estimate that Buffett’s leverage is about 1.6-to-1 on
average. Buffett’s returns appear to be neither luck nor magic, but, rather,
reward for the use of leverage combined with a focus on cheap, safe,
quality stocks.”
“We show that Buffett’s performance can be largely explained
by exposures to value, low-risk, and quality factors.”
“Looking at all U.S. stocks from 1926 to 2011 that have been
traded for more than 30 years, we find that Berkshire Hathaway
has the highest Sharpe ratio among all. Similarly, Buffett has a
higher Sharpe ratio than all U.S. mutual funds that have been
around for more than 30 years.”
Sharpe ratio is a measure for calculating risk adjusted returns. I don’t use this metric
but It’s talked about a lot in the Buffett’s Alpha PDF so you need to understand what it is
to understand the context of the article even if you never use it.
Alpha is another metric I don't use... It's a measure of risk adjusted performance. It's
the return in excess an investor/business generates when compared to an index.
For example if your stock picks have returned 20% every year over the last ten years
while a comparable index has returned 10% every year for those ten years you've
generated an alpha of ten percentage points every year.
“So how large is this Sharpe ratio that has made Buffett one of the richest
people in the world? We find that the Sharpe ratio of Berkshire Hathaway
is 0.76 over the period 1976-2011. While nearly double the Sharpe
ratio of the overall stock market, this is lower than many
investors imagine.
Adjusting for the market exposure, Buffett’s information ratio is even
lower, 0.66. This Sharpe ratio reflects high average returns, but also
significant risk and periods of losses and significant drawdowns.

18
If his Sharpe ratio is very good but not super-human, then how
did Buffett become among the richest in the world?”
“The answer is that Buffett has boosted his returns by using leverage
(FLOAT) and that he has stuck to a good strategy for a very long
time period, surviving rough periods where others might have been
forced into a fire sale or a career shift. We estimate that Buffett applies a
leverage of about 1.6-to-1, boosting both his risk and excess return in that
proportion.”
Thus, his many accomplishments include having the conviction,
wherewithal, and skill to operate with leverage and significant
risk over a number of decades.”
If you read the article linked below ignore the academic talk of beta, efficient markets,
and other academic terms that have little to no relevance in value investing.
“Buffett’s genius thus appears to be at least partly in recognizing
early on, implicitly or explicitly, that these factors work,
applying leverage without ever having to fire sale, and sticking
to his principles. Perhaps this is what he means by his modest
comment:”
Ben Graham taught me 45 years ago that in investing it is not
necessary to do extraordinary things to get extraordinary
results – Warren Buffett, Berkshire Hathaway Inc., Annual
Report, 1994.
“However, it cannot be emphasized enough that explaining Buffett’s
performance with the benefit of hindsight does not diminish his
outstanding accomplishment. He decided to invest based on these
principles half a century ago. He found a way to apply leverage.
(FLOAT) Finally, he managed to stick to his principles and continue
operating at high risk even after experiencing some ups and downs that
have caused many other investors to rethink and retreat from their
original strategies.”

19
I disagree with the high risk mentioned in this entire article.
The academic version of risk is a lot different from what we as value investors think of
risk. Most of the “excessive risk” mentioned throughout the article is attributed to
volatility. This isn’t risk in what we do.
“Why then does Buffett rely heavily on private companies as well,
including insurance and reinsurance businesses? One reason might be
that this structure provides a steady source of financing,
allowing him to leverage his stock selection ability. Indeed, we
find that 36% of Buffett’s liabilities consist of insurance float
with an average cost below the T-Bill rate.” (FLOAT)
In summary, we find that Buffett has developed a unique access
to leverage that he has invested in safe, high-quality, cheap
stocks and that these key characteristics can largely explain his
impressive performance.
Buffett’s large returns come both from his high Sharpe ratio and his ability
to leverage his performance to achieve large returns at higher risk. Buffett
uses leverage (FLOAT) to magnify returns, but how much leverage does
he use? Further, what are Buffett’s sources of leverage, their terms, and
costs? To answer these questions, we study Berkshire Hathaway’s balance
sheet, which can be summarized as follows:
We would like to compute the leverage using market values (which we
indicate with the superscript MV in our notation), but for some variables
we only observe book values (indicated with superscript BV) so we proceed
as follows.
The above means the estimated 1.6 to 1 leverage the paper states Berkshire gets from
its float is a low estimate. This is because they had to use book values as estimates for
the wholly owned Berkshire subsidiaries.
These book values don’t represent any growth in value of the subsidiaries only the
original purchase price in most cases. And knowing what kind of companies Buffett

20
buys these companies have gained a ton of value over time meaning more leverage
according to the papers logic.
The magnitude of Buffett’s leverage can partly explain how he outperforms
the market, but only partly. If one applies 1.6-to-1 leverage to the market,
that would magnify the market’s average excess return to be about 10%,
still falling far short of Berkshire’s 19% average excess return.
Berkshire’s more anomalous cost of leverage, however, is due to
its insurance float. Collecting insurance premia up front and
later paying a diversified set of claims is like taking a “loan.”
Table 3 shows that the estimated average annual cost of
Berkshire’s insurance float is only 2.2%, more than 3 percentage
points below the average T-bill rate.
Hence, Buffett’s low-cost insurance and reinsurance business
have given him a significant advantage in terms of unique
access to cheap, term leverage. We estimate that 36% of
Berkshire’s liabilities consist of insurance float on average.
Based on the balance sheet data, Berkshire also appears to
finance part of its capital expenditure using tax deductions for
accelerated depreciation of property, plant and equipment as
provided for under the IRS rules. E.g., Berkshire reports $28
Billion of such deferred tax liabilities in 2011 (page 49 of the
Annual Report). FLOAT
Berkshire Hathaway’s overall stock return is far above returns of both the
private and public portfolios. This is because Berkshire is not just a
weighted average of the public and private components. It is also
leveraged, which magnifies returns.
While Buffett is known as the ultimate value investor, we find that his
focus on safe quality stocks may in fact be at least as important to his

21
performance. Our statistical finding is consistent with Buffett’s own
words:
I could give you other personal examples of “bargain-purchase”
folly but I'm sure you get the picture: It's far better to buy a
wonderful company at a fair price than a fair company at a
wonderful price. – Warren Buffett, Berkshire Hathaway Inc.,
Annual Report, 1989.
Given that we can attribute Buffett’s performance to leverage and his focus
on safe, high-quality, value stocks, it is natural to consider how well we can
do by implementing these investment themes in a systematic way.
In essence, we find that the secret to Buffett’s success is his
preference for cheap, safe, high-quality stocks combined with
his consistent use of leverage to magnify returns while surviving
the inevitable large absolute and relative drawdowns this
entails.
Indeed, we find that stocks with the characteristics favored by
Buffett have done well in general, that Buffett applies about 1.6-
to-1 leverage financed partly using insurance float with a low
financing rate, and that leveraging safe stocks can largely
explain Buffett’s performance.
This is the power of float illustrated over a long time period.
The above means his excess returns are attributed only to smart use of float
and buying cheap great businesses over a long period.
This is why we must understand what it is and how to use it to our advantage to become
better investors.
If you want to read the full 45 page PDF that includes the math, examples, and
references download the paper Buffett’s Alpha here.

22
Most of Buffett's and Berkshire's float comes from insurance companies. But float can
be found at any company. And next up I'll show you how by analyzing a company's
balance sheet to find float.

23
How To Find Float On The Balance Sheet - On Float Part 4
Today's post is a continuation of the earlier posts:
Charlie Munger On Deferred Tax liabilities and Intrinsic Value - On
Float Part 1.
What is Float? On Float Part 2.
Buffett’s Alpha Notes – The Power of Float – On Float Part 3.
Today I'm going to illustrate how to find float on the balance sheet. And show you what
float means in terms of the company’s margins.
I'm going to do this by showing you float from two different companies I've evaluated
and written up for Press On Research subscribers. One is an insurance company.
The other isn't.
On Float Part 4
How To Find And Evaluate Float
I've removed the names from both the companies below. If you'd like to know which
companies they are and see the full write ups on them you need to subscribe to Press
On Research.

24
Insurance Company Float
When most people think of float they think of insurance companies so this is where we'll
start.
Below is the unedited float analysis I did on an insurance company I wrote up for Press
On Research subscribers.
***
All numbers below are in USD $ millions unless noted.
Assets
Financial Assets: Fixed maturity securities of 94.3 + equity securities of 4.9 +
trading securities of 0.1 + loans of 1.9 + cash and cash equivalents of 6.8 + accrued
investment income of 0.8 + premiums and other receivables of 11.3 + deferred
income tax assets of 3.8 = 123.9
Operating Assets: Deferred policy acquisition costs of 8.5 + PP&E net of 2 + other
assets of 13.9 = 24.4
Total Assets = 148.3
Liabilities
Equity of 44.9
Short-term debt of 0.9 and long-term debt of 17.4 = 18.3
Float: Future policy benefits of 35.2 + policyholder funds of 1.6 + unearned
premiums of 29.9 + taxes payable of 0.1 + other liabilities of 18.3 = 85.1
Total liabilities are 103.4
Float/operating assets 85.1/24.4 = 3.49.
Float supports operating assets 3.49 times.

25
And Float is "free money" because (NAME REMOVED) earns consistent underwriting
profits as it’s earned underwriting profits in six of the last nine years.
Pretax profits have changed to underwriting profit below because normal pretax profits
mean nothing for insurance companies.
(NAME REMOVED) had an underwriting profit – profit from operations before taxes
here – for the full 2015 year of 6.4.
Underwriting profit/total assets = ROA
6.4/148.3 = 4.3%
Compared to a Morningstar ROA of 3.2%
Underwriting Profit/(total assets - float) = levered ROA
6.4/63.2 = 10.1%
If I were to rely only on Morningstar to get estimates for margins (NAME
REMOVED) looks below average at only 3.2%.
Yes I know this isn’t an apples to apples comparison. But normal profit metrics mean
nothing for insurance companies.
When considering underwriting profit. Its ROA is a still below average 4.3%.
But (NAME REMOVED) float magnifies its ROA higher.
When considering float, its levered ROA goes up to 10.1%. Or 43% higher than what I
calculate it’s normal ROA as.
Having a levered ROA of 10.1% isn’t great compared to normal companies I invest in…
But for an insurance company this is a great margin.

26
One of my investment icons the great insurance investor Shelby Davis looked for
insurance companies having an ROA above 10% so this meets his threshold.
Another important metric for insurance companies is ROE. Most great insurance
companies fall in the 10 – 15% ROE range.
I calculate (NAME REMOVED) ROE – underwriting profits/shareholders equity – as
14.3% not levered by any float. Compared to Morningstar’s ROE estimate of 10.7. This
puts (NAME REMOVED) into the great insurance company category. And there’s still
more.
***
I continue on from here detailing this great small insurance company but now
let's explain what everything above means.
Why Does Float Magnify Margins?
As talked about in the post Buffett's Alpha Notes - On Float Part 3 float is positive
leverage instead of negative leverage like debt. The positive leverage - float - boosted
ROA 43% higher than its normal I calculated.
This magnification of margins happens at any company with float. The more float - and
profitability - the company operates on and produces the higher margins are magnified.
But why?
Let's go back to the April 2016 Press On Research issue this to find out what this
means over time for a company operating well.
***
Float is things like prepaid expenses. Billings in excess of
expected earnings. Deferred taxes. Accounts payable.

27
Unearned premiums. And other liabilities that don’t require
interest payments.
But they are the farthest thing from “normal” liabilities.
With normal liabilities you have to pay an agreed upon
amount within a certain period or your customers and
suppliers will stop paying you.
Float are things you won’t have to pay back for a while the
company uses in the mean time to grow the business.
Instead of paying this money out now like normal liabilities.
Companies can use these “liabilities” to fund current
operations.
Float is positive leverage instead of negative leverage like
debt and interest payments.
Think of float as the opposite of paying interest on a loan.
Instead of paying the bank for the cash you’ve borrowed.
The bank pays you interest to use the money you borrowed.
And you can use this money to invest.
A nice example is long-term debt versus unpaid premiums.
Both liabilities are listed on the balance sheet. But each is far
different from a real world perspective.
With long-term debt you get money in exchange for agreeing
to pay back a loan at an agreed upon rate for an agreed upon
period. If you don’t you can go into bankruptcy and/or go
out of business.
With unpaid premiums you get paid a monthly amount from
a customer – say for house insurance – and only have to pay
back any amount when a disaster occurs.

28
If your clients don’t make big claims for a long time – or ever
over the life of an individual policy – the company keeps
using this “liability” to continue investing and growing the
business.
Now let’s keep going with this example…
If you own a home with a mortgage you have home insurance
in the United States. The ranges of this vary but let’s say you
own a home and pay $300 a month towards home insurance
costs.
This $300 a month - $3,600 a year or $36,000 after 10 years
– goes to the insurance company every month. Year after
year even if you never claim any insurance.
The insurance company holds this money on the balance
sheet as a liability because the assumption – probability – is
you’ll make an insurance claim at some point.
In the mean time the insurance company invests this money
to grow assets. This way it makes sure it has enough money
to pay claims when it has to.
Now imagine this multiplied by thousands, tens of
thousands, hundreds of thousands, or even millions of
customers.
If the insurance company produces underwriting profits on
top of the float it gets and invests this money well over a long
period this money compounds exponentially.
This is how Buffett and Munger grew Berkshire to the giant it
is today.
***

29
Remember also from Buffett's Alpha On Float Part 3 of this series... The paper
found almost all Buffett's excess performance was due to float and the positive leverage
powers it has on a company.
This is why float and the positive leverage it produces for the companies using and
growing it well over time is so important. It magnifies all margins at a company not just
the ones mentioned above. And if a company operates well the internal value of the
company compounds exponentially.
If you're a Warren Buffett/Charlie Munger type value investor this is the exact situation
you're looking for.
Now let's get to the non insurance company to finish explaining everything.
Non Insurance Company Float
When most people think about float - if they think about it at all - it's when thinking
about insurance companies. But non insurance companies have float as well.
Remember from the previous post What Is Float? On Float Part 2:
To summarize the above float is anything listed in the
liabilities section of its balance sheet you don't pay interest
on.
Interest based liabilities - NOT FLOAT - include capital
leases, and short and long-term debt.
Most of the time these are the only interest based liabilities
on a company's balance sheet. Make sure by checking the
off-balance sheet transactions and total obligations notes - if
any - in the companies footnotes.
Examples of non interest based liabilities - FLOAT - include
prepaid expenses, accounts payable, taxes payable, accrued
liabilities, deferred tax liabilities, unearned premiums, etc.

30
This means any company that has these kinds of liabilities have float. And since most
companies have at least small amounts of these liabilities most companies have float.
How much float a company operates on is what affects their margins. Higher amounts
of float compared to operating assets means a higher leveraging of margins.
Now let's get to the float analysis of the non insurance company... Again, the following is
unedited except for the removal of the company's name.
***
All numbers below are in millions of dollars unless noted.
Financial Assets: Cash and cash equivalents of 2.7 + deferred tax assets of 1.9 = 4.6
Operating Assets: Accounts receivable of 39.1 + Inventories of 12.6 + prepaid
expenses of 1.1 + other CA of 0.3 + net PP&E of 73.7 + goodwill of 2.4 + other IA of
0.6 = 129.8
Total Assets = 134.4
Liabilities
Equity of 86.2
Debt of 14.4
Float = Accounts payable of 13.3 + Taxes Payable of 0.5 + accrued liabilities of 8.9
+ other CL of 1.3 + deferred tax liabilities of 1.4 + pensions and other benefits of 8
= 33.1
Total liabilities 47.5
Float/operating assets = 33.1/129.8 = 25.5%.
This means (NAME REMOVED) float supports 25.5% of its operating assets.
Pretax profits/total assets=ROA
18.7/134.4= 13.9%
Compared to a Morningstar ROA of 10.1%
Pretax profits/ (total assets-float) = levered ROA

31
18.7/101.3 = 18.5%
When I evaluated (NAME REMOVED) in 2012 I knew
what float was. But not how to calculate and quantify what
float meant for a company. So when I began looking
at (NAME REMOVED)again in recent weeks I was
shocked to see a big chunk of float helping operate and grow
the company.
Why?
Because I expected a manufacturer to operate more on short
and long-term debt than float. But (NAME
REMOVED) float is 2.30 times higher than its short and
long-term debt.
What this means for you is that (NAME
REMOVED) operates and grows in a healthy way.
This is why its book value per share talked about above rose
so much in recent years. But this isn’t all operating on float
can do for a company… It also magnifies margins as well.
As you can see from the levered ROA calculation above. This
is its true ROA when considering float. Float magnifies its
ROA by 8.4 percentage points when compared to the
“normal” ROA shown on Morningstar.
This will make a gigantic difference in the long-term. How
big? Let me show you below using an example…
Let’s say we have one million dollars that compounds at a
10.1% rate every year for 10 years. With no additions the
original million dollars will turn into $2.617 million at the
end of 10 years. Great of course. But let’s see what an extra
8.4 percentage points every year will do to this same money
over time.

32
Using the same numbers above. Same time frame. But 18.5%
compound rate the original one million dollars will turn into
$5.460 million at the end of 10 years. The 8.4 percentage
point difference over 10 years time means we make an extra
$2.843 million. Or more than double what we would earn
with only a 10.1% compound rate.
This helps explain why (NAME REMOVED) book value
has grown 2.61 times in only six plus years. And this is why
I’m not worried about (NAME REMOVED) other “below
exceptional” margins talked about above.
Float magnifies all these as well. Not as much as ROA. But by
at least a few percentage points each bringing them up to the
exceptional level of other Press On Research picks.
***
Now let's get back to explaining what everything means. Starting with the things I
didn't mention above.
The first thing to notice is the huge reversal in the amount of financial assets and
operating assets the two companies have. The insurance company had huge amounts of
financial assets and few operating assets. And the non insurance company had the
inverse.
An insurance company’s balance sheet should always look like this.
Non insurance companies vary more but in general they will have more operating assets
than financial assets.
Float supporting operating assets is the amount of float that supports the harder assets
of a company. The ones regular companies - non insurance and financials - earn profits
from in most cases.

33
Everything likely makes sense in its place of either financial assets or operating assets
except goodwill and intangible assets. Why are these included in operating assets and
not financial assets?
Intangible assets (IA) is the easier to understand of the two.
Generally IA are things like patents, customer lists, trademarks, and brand names.
These have direct effect on the company operations and is why they're included in
operating assets.
For goodwill its more murky... Goodwill is a form of intangible assets that occur when a
company acquires another and pays above book value for the company. In effect this
means the company pays extra in an acquisition for the company’s operations so this is
why goodwill is included in operating assets.
There are other reasons as well but for simplicity I stuck with the above reasoning.
The amount of float that supports operating assets line is important for all companies.
This is because as mentioned above the more float a company has compared to its
operating assets the higher margins are magnified.
For companies having a lot of float and financial assets like insurance companies this
number can go well over 100%. For most normal companies this number will be below
100%. But as always the higher this number is the better because it magnifies margins
the higher it is.
Separating debt and float in the float analysis is a lot easier to do. Any interest bearing
liability - short and long-term debt, capital leases - goes into the debt category. All other
liabilities go into the float category.
Now let’s sum this all up and bring it back to the beginning to explain how this all affects
a company's value.
Summary

34
If I've explained everything well enough in the series so far we should understand -
What float is.
Why it’s important.
How companies can use float as positive leverage.
How Buffett got so rich using float.
How to find float on a balance sheet.
How to evaluate float.
How float affects a company and its margins.
And maybe the most important thing - why float affects a company and its
margins.
In the next chapter of this series we'll go back to the beginning and explain how float
affects a company's value alluded to in On Float Part 1.
35
How Does Float Affect Valuation? On Float Part 5
Today's post is a continuation of the earlier posts:
Charlie Munger On Deferred Tax liabilities and Intrinsic Value - On
Float Part 1.
What is Float? On Float Part 2.
Buffett’s Alpha Notes – The Power of Float – On Float Part 3.
How To Find Float On The Balance Sheet – On Float Part 4
Today we're going to talk about how float affects valuation. The issue brought up way
back in part 1 of this series linked above. But before we get to this let's go back to On
Float Part 4 to continue this talk about valuation with those companies.
Insurance Company Float and Valuation
Below is the unedited float analysis I did on an insurance company I wrote about in
the April 2016 Press On Research issue.
All numbers below are in USD $ millions unless noted.
Assets
Financial Assets: Fixed maturity securities of 94.3 + equity securities of 4.9
+ trading securities of 0.1 + loans of 1.9 + cash and cash equivalents of 6.8 +

36
accrued investment income of 0.8 + premiums and other receivables of 11.3
+ deferred income tax assets of 3.8 = 123.9
Operating Assets: Deferred policy acquisition costs of 8.5 + PP&E net of 2 +
other assets of 13.9 = 24.4
Total Assets = 148.3
Liabilities
Equity of 44.9
Short-term debt of 0.9 and long-term debt of 17.4 = 18.3
Float: Future policy benefits of 35.2 + policyholder funds of 1.6 + unearned
premiums of 29.9 + taxes payable of 0.1 + other liabilities of 18.3 = 85.1
Total liabilities are 103.4
Float/operating assets 85.1/24.4 = 3.49.
Float supports operating assets 3.49 times.
And Float is "free money" because (NAME
REMOVED) earns consistent underwriting profits as it’s
earned underwriting profits in six of the last nine years.
Pretax profits have changed to underwriting profit below
because normal pretax profits mean nothing for insurance
companies.
(NAME REMOVED) had an underwriting profit – profit
from operations before taxes here – for the full 2015 year of
6.4.
Underwriting profit/total assets = ROA
6.4/148.3 = 4.3%
Compared to a Morningstar ROA of 3.2%
Underwriting Profit/(total assets - float) = levered ROA
37
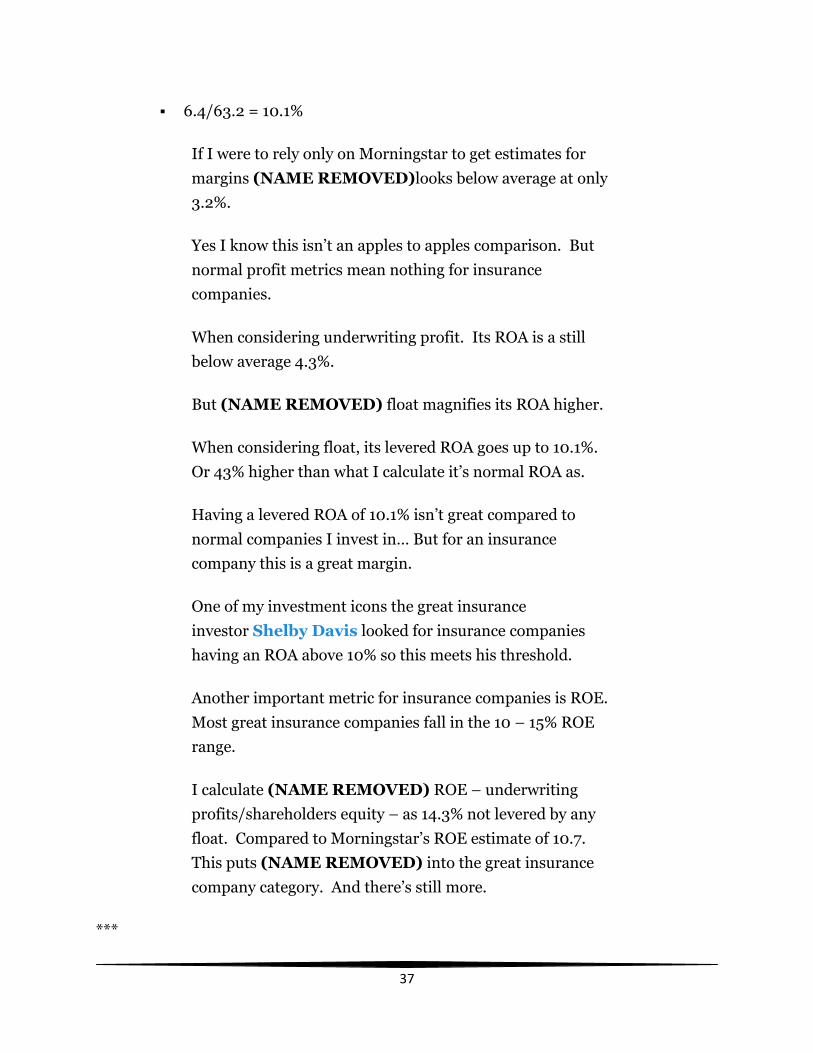
6.4/63.2 = 10.1%
If I were to rely only on Morningstar to get estimates for
margins (NAME REMOVED)looks below average at only
3.2%.
Yes I know this isn’t an apples to apples comparison. But
normal profit metrics mean nothing for insurance
companies.
When considering underwriting profit. Its ROA is a still
below average 4.3%.
But (NAME REMOVED) float magnifies its ROA higher.
When considering float, its levered ROA goes up to 10.1%.
Or 43% higher than what I calculate it’s normal ROA as.
Having a levered ROA of 10.1% isn’t great compared to
normal companies I invest in… But for an insurance
company this is a great margin.
One of my investment icons the great insurance
investor Shelby Davis looked for insurance companies
having an ROA above 10% so this meets his threshold.
Another important metric for insurance companies is ROE.
Most great insurance companies fall in the 10 – 15% ROE
range.
I calculate (NAME REMOVED) ROE – underwriting
profits/shareholders equity – as 14.3% not levered by any
float. Compared to Morningstar’s ROE estimate of 10.7.
This puts (NAME REMOVED) into the great insurance
company category. And there’s still more.
***

38
I continue on from here detailing this great small insurance company but now let's get
back to talking about how float affects valuation.
The unedited valuations below are from the April 2016 Press On Research issue
except for the removal of the company name and ticker. My notes talking about float
now are bolded and capitalized.
How Does Float Affect Valuation?
As Warren Buffett once said, “Price is what you pay, value is
what you get.”
The price of a company is what the market says it is. But how
do I establish value?
When I recommend a stock, I try to find its “intrinsic value.”
Intrinsic value measures a company’s true value considering
tangible and intangible assets and the company’s operations.
Think of intrinsic value this way: What would this company
be worth if we were to buy it outright? It’s like appraising the
value of a house or car.
If I find the intrinsic value of a company to be higher than its
market price, that’s a good sign of an undervalued stock.
I valued (NAME REMOVED) four ways.
The first is by assuming 1% interest rates for the long-term.
And that (NAME REMOVED) float won’t grow over time.
The second is an asset reproduction valuation.
The third is adding the reproduction value of (NAME
REMOVED) to 1/5th of its float and then dividing by its
number of shares.

39
And the fourth is adding (NAME REMOVED) float and
equity together then dividing this by its number of shares.
Valuations done using (NAME REMOVED) 2016 10K. All
numbers are in millions of US$, except per share
information, unless otherwise noted.
(NAME REMOVED) current market cap is (REMOVED;
BELOW $100 MILLION) and its current share price is
$15.20 per share.
Float X 1% Interest Rate + Equity Valuation
This valuation is expecting 1% interest rates for the long-
term and no growth in float over time.
(float X 10%) + Equity = estimated value/number of shares.
(84.9 X 10%) + 44.9 = 53.4/2.5 = $21.36 per share.
This valuation is the minimum (NAME
REMOVED) should sell for because interest rates won’t
stay as low as they are forever. And it still shows (NAME
REMOVED) is selling at a 28.8% discount.
(NAME REMOVED) has consistent underwriting profits
and conservative managers so float should grow over time as
well.
JUST THIS COMPANIES FLOAT EQUALS $33.96 A
SHARE. OR 223% HIGHER THAN ITS THEN TOTAL
SHARE PRICE. REMEMBER THOUGH THIS
NEEDS TO BE DISCOUNTED IN MOST CASES
BECAUSE OF THE LONG TERM NATURE OF MOST
FLOAT AND BECAUSE THEY'RE LIABILITIES.
WE'LL TALK ABOUT THIS FURTHER BELOW.
Next up is the asset reproduction valuation.

40
Asset Reproduction Valuation
Assets Book Value
Reproduction Value
Notes
Fixed Maturity Securities
94.3 84.9
Equity Securities 4.9 3.9
Trading Securities
0.1 0
Loans 1.9 1
Cash and Cash Equivalents
6.8 6.8
Accrued Investment Income
0.8 0
Premiums and Other Receivables
11.3 6.9
Deferred Policy Acquisition Costs
8.5 5.1
Deferred Income Tax Assets
3.8 2

41
PP&E Net 2 1
Other Assets 13.9 8.3
Total Assets 148.3 119.9
Minus
Future Policy Benefits
35.2 21.1
Policyholder Funds
1.6 0
Unearned Premiums
29.9 17.9
ST Debt 0.9 0
LT Debt 17.4 10.4
I could have discounted this even further since it’s not necessary for insurance companies to carry debt. This would have made reproduction value even higher below.
Taxes Payable 0.1 0

42
Other Liabilities 18.3 11
Total Liabilities 103.4 60.4
Equals 44.9 59.5
The note above also explains why reproduction value is higher than net asset value. This is rare when I find this.
Divided By Shares
2.5 2.5
Equals $17.96 $23.80
Current share price =
$15.20 $15.20
Discount to current share price =
15.40% 36%
This valuation does not take into account any of (NAME
REMOVED) float. This is an asset – at least in the short-
term – because of (NAME REMOVED) long sustained
history of underwriting profits.
And as mentioned throughout this issue these act as a cost-
free form of positive leverage which boosts (NAME
REMOVED) value.

43
Even in this still ultra conservative valuation (NAME
REMOVED) is selling at a 36% discount to its current share
price.
Asset Reproduction + 1/5 of Float Valuation
Add float (1/5 of float after reading this discussion in part 1
of the On Float series here) asset reproduction value gets
us to:
59.5 + (84.9 X 20% = 16.98) = 76.48/2.5 = $30.59 per share. Or more than
a double from its current $15.00 share price.
This also considers no growth in float. Any rise in interest
rates. Or a turn to a better insurance market. All which will
help (NAME REMOVED) shares explode but this
valuation still shows it’s selling at a 50.3% discount.
REMEMBER THE DISCOUNTING TALKED ABOUT
ABOVE? HERE IT IS.
USING ONLY 1/5TH OF THIS COMPANIES FLOAT -
OR $6.79 PER SHARE - FLOAT ADDS
SUBSTANTIAL VALUE TO THE COMPANY.
IN THE CASE OF THIS VALUATION 22.2% TO THE
COMPANIES VALUE. 1/5TH OF FLOAT MAKES UP
45% OF THE COMPANIES THEN CURRENT SHARE
PRICE.
AS TALKED ABOUT THROUGHOUT THE APRIL
2016 PRESS ON RESEARCH ISSUE THIS COMPANY
IS CONSISTENTLY PROFITABLE AS WELL. AND
THIS VALUATION DOESN'T COUNT ITS VALUABLE
OPERATIONS AT ALL.

44
I DON'T WHEN EVALUATING INSURANCE
COMPANIES BUT IF I WERE TO ADD A MULTIPLE
OF ITS TTM UNDERWRITING PROFIT TO THIS
VALUATION TO INCLUDE THE VALUE OF ITS
OPERATIONS INTO THIS VALUATION IT WOULD
BE...
6.4 x 8 + 76.48 = 127.68/2.5 = $51.07
THIS IS A CONSERVATIVE ESTIMATE OF THE
COMPANIES REAL INTRINSIC VALUE. THE
VALUE A CONTROL INVESTOR MAY EXPECT THE
COMPANY TO BE WORTH WHEN ACQUIRING THE
WHOLE COMPANY.
PROFITABLE OPERATIONS COMBINED WITH
LOW COST OR COST FREE FLOAT HAS IMMENSE
VALUE AS SEEN FROM THIS VALUATION.
AND REMEMBER THIS ALSO ASSUMES NO
GROWTH IN FLOAT GOING FORWARD.
AGAIN, THIS IS THE POWER OF FLOAT
ILLUSTRATED. THIS WILL ALL HELP
COMPOUND THE VALUE WITHIN THE COMPANY
AS WELL OVER THE LONG-TERM BARRING
SUDDEN POOR MANAGEMENT.
Float + Equity Valuation
Float + Equity = estimated value/number of shares.
59.5 + 44.9 = 129.8/2.5 = $51.92 per share.
This high end valuation doesn’t discount float at all. But also
doesn’t expect any growth over time. And still
shows (NAME REMOVED) is selling at a 71% discount to
its current share price.

45
So not only is (NAME REMOVED) an ultra conservative
and safe to own insurance company. But it’s also
undervalued by as much as 71%. And we should expect to
earn at least 28.8% owning them.
But there’s still more that makes (NAME REMOVED) a
safe investment…
***
From here I continue detailing the company in the issue but let's finish talking about the
insurance company above.
All insurance companies have a lot of float that makes up the value of the company.
This is because most of any insurance company's balance sheet and operations are
based on float.
Now let's go to the non insurance company talked about in On Float Part 4 to see the
contrast here. And also that float can add substantial value to non insurance companies
as well.
Non Insurance Company Float and Valuation
All numbers below are in millions of dollars unless noted.
Financial Assets: Cash and cash equivalents of 2.7 + deferred tax assets of
1.9 = 4.6
Operating Assets: Accounts receivable of 39.1 + Inventories of 12.6 +
prepaid expenses of 1.1 + other CA of 0.3 + net PP&E of 73.7 + goodwill of
2.4 + other IA of 0.6 = 129.8
Total Assets = 134.4
Liabilities
Equity of 86.2
Debt of 14.4

46
Float = Accounts payable of 13.3 + Taxes Payable of 0.5 + accrued liabilities
of 8.9 + other CL of 1.3 + deferred tax liabilities of 1.4 + pensions and other
benefits of 8 = 33.1
Total liabilities 47.5
Float/operating assets = 33.1/129.8 = 25.5%. This
means (NAME REMOVED) float supports 25.5% of its
operating assets.
Pretax profits/total assets=ROA
7/134.4= 13.9%
Compared to a Morningstar ROA of 10.1%
Pretax profits/ (total assets-float) = levered ROA
7/101.3 = 18.5%
Now that we remember this let's continue to show how float affects this companies
valuation.
The information below is an unedited excerpt from the January 2016 Press On
Research issue except for the removal of the company name and ticker.
***
As Warren Buffett once said, “Price is what you pay, value is
what you get.”
The price of a company is what the market says it is. But how
do I establish value?
When I recommend a stock, I try to find its “intrinsic value.”
Intrinsic value measures a company’s true value considering
tangible and intangible assets. And the company’s
operations.
47
Think of intrinsic value this way: What would this company
be worth if we were to buy it outright? It’s like appraising the
value of a house or car.
If I find the intrinsic value of a company is higher than its
market price, that’s a good sign of an undervalued stock.
I valued (NAME REMOVED) five ways.
The book value per share valuation talked about above. An
asset reproduction valuation. A float plus equity valuation. A
8 and 11 times EBIT + cash – debt valuation. And a
combined asset reproduction and 8 and 11 times EBIT + cash
– debt valuation.
Book Value Per Share Valuation
The first way I valued (NAME REMOVED) from earlier
shows (NAME REMOVED) should be worth $11.18 a
share. An 11.5% premium to what its selling at now at $9.90
a share at the time of this writing.
This is the absolute minimum (NAME REMOVED) should
be selling for because it doesn’t count any of its valuable and
profitable operations at all. Or any growth.
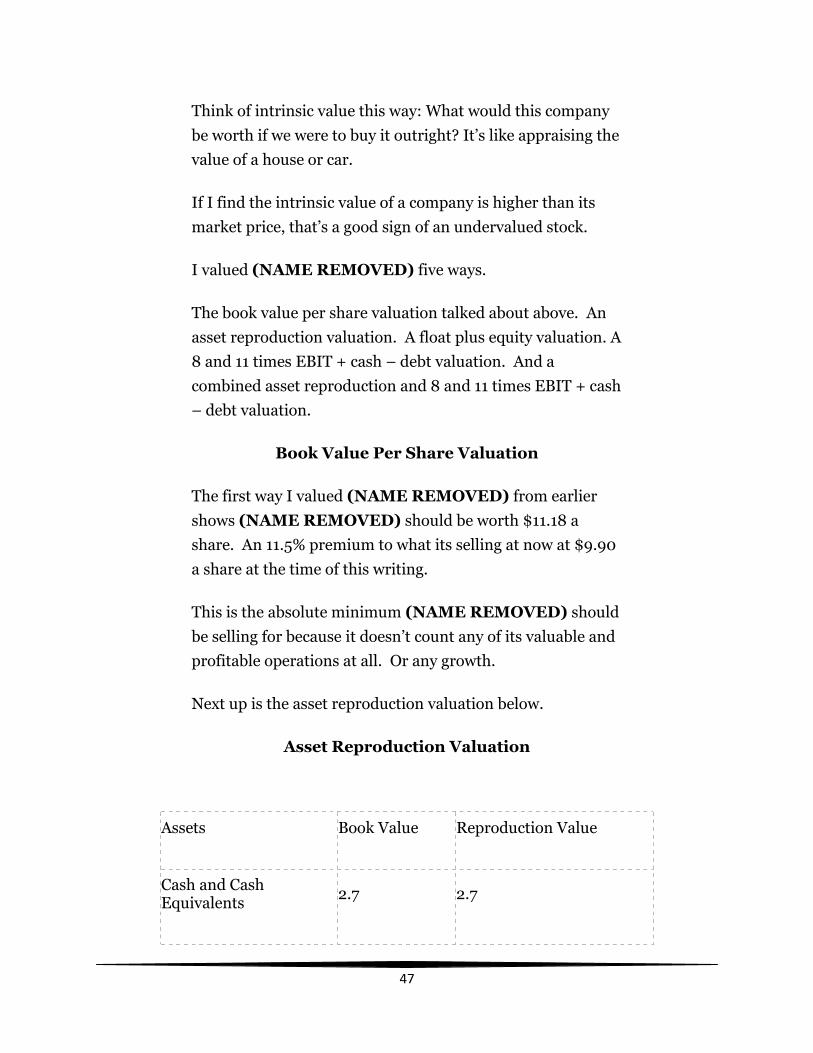
Next up is the asset reproduction valuation below.
Asset Reproduction Valuation
Assets Book Value Reproduction Value
Cash and Cash Equivalents
2.7 2.7

48
Accounts Receivable 39.1 33.2
Inventories 12.6 7.6
Deferred Income Taxes 1.9 1
Prepaid Expenses 1 0
Other CA 0.3 0
Net PP&E 73.7 44.2
Goodwill 2.4 1
Intangible Assets 0.6 0
Total Assets 134.3 89.7
Minus
Short Term Debt 4.1 4.1
Accounts Payable 13.3 6.7
Taxes Payable 0.5 0
Accrued Liabilities 8.9 4.5

49
Other CL 1.3 0
LT Debt 10.5 6
Pensions And Other Benefits
8 6
Total Liabilities 46.6 27.3
Equals 87.7 62.4
Divided By Shares 7.6 7.6
Equals $11.54 $8.21
While (NAME REMOVED) is selling above its
reproduction valuation – and it should since it’s a great
company – it’s selling below its net asset valuation. The
middle bar above.
This is also an ultra conservative valuation that
shows (NAME REMOVED) is undervalued by 14.2% now.
Float Plus Equity Valuation
The third way I valued (NAME REMOVED) was by adding
float to equity and then dividing by its numbers of shares.
33.1 + 86.2 = 119.3/7.6 = $15.70 per share.
This again is an ultra conservative valuation because it
doesn’t include cash. Or (NAME REMOVED) valuable
and profitable operations.

50
But this still shows (NAME REMOVED) is undervalued by
37% now.
EBIT Valuation
The fourth way I valued (NAME REMOVED) is by using
its TTM EBIT. Multiplying this by eight and 11. Adding
cash. Subtracting debt. Then dividing this by the number of
diluted shares outstanding.
8X 19 + cash of 2.7 – 14.6 = 140.1/7.6 = $18.43. This means (NAME
REMOVED) is undervalued by 46.3% now. Almost a double from current
share price.
11X 19 + 2.7 – 14.6 = 197.1/7.6 = $25.93. Or undervalued by 61.8% now. Or
more than a double from current prices.
Yet again this doesn’t show the whole story because this
valuation doesn’t include its valuable assets.
EBIT Plus Reproduction Valuation
Adding in the net value – after debt – of its estimated
reproduction assets gets us values of:
140.1 + 62.4 = 202.5/7.6 = $26.64 per share. Or 2.69 times higher than its
current share price.
197.1 + 62.4 = 259.5/7.6 = $34.14 per share. Or 3.45 times higher than its
current share price. Or a 3.45 bagger from current prices.
THIS COMPANIES THEN CURRENT SHARE PRICE
WAS $10. ITS FLOAT EQUALS $4.36 PER SHARE.
THIS MEANS JUST ITS FLOAT MADE UP 43.6% OF
ITS THEN CURRENT SHARE PRICE.
IN OTHER WORDS FOR ONLY $5.64 YOU GET THIS
COMPANIES CONSISTENTLY PROFITABLE GREAT

51
MARGINS, ASSETS, OPERATIONS AND
EVERYTHING ELSE AFTER CONSIDERING FLOAT.
WHEN EVALUATING NON INSURANCE
COMPANIES I DON'T INCLUDE FLOAT IN THE
VALUATIONS MOST OF THE TIME BECAUSE AS
ALWAYS I LIKE TO BE AS CONSERVATIVE AS
POSSIBLE.
BUT IF I WERE TO ADD 1/5TH OF THIS
COMPANIES FLOAT ($6.62 MILLION OR $0.87 PER
SHARE) TO THE EBIT PLUS REPRODUCTION
VALUATION THIS WOULD GET US VALUES OF
$27.51 AND $35.01 RESPECTIVELY ABOVE.
1/5TH OF FLOAT ADDS ~3% TO THIS COMPANIES
VALUE. NOT MUCH IN THE SHORT TERM BUT
REMEMBER IF FLOAT IS USED WELL OVER A
LONG TIME IT COMPOUNDS AND COMPOUNDS
THE VALUE WITHIN THE COMPANY. AND MOST
PEOPLE DON'T CONSIDER FLOAT AT ALL WHEN
EVALUATING NON INSURANCE COMPANIES.
AT THE TIME THE COMPANY WAS AN ~$75
MILLION COMPANY. IF THE COMPANY
CONTINUES TO COMPOUND FLOAT AT 3% OVER
10 YEARS THE COMPANIES INTRINSIC VALUE
WILL COMPOUND BY ~$26 MILLION TO $101
MILLION.
AND THIS ASSUMES NO GROWTH IN FLOAT. NO
GROWTH FROM ITS VALUABLE OPERATIONS.
AND NO ADDITIONS OF NEW CAPITAL FOR 10
YEARS. ALL SHOULD CONTINUE TO GROW AT
THIS GREAT COMPANY.

52
THIS COMBINED AFFECT OF COMPOUNDING
FLOAT, INTERNAL VALUE, AND OPERATIONAL
PROFITABILITY COULD EXPLODE THIS
COMPANIES SHARES OVER TIME.
BUT I DON'T COUNT ANY OF THIS POSSIBILITY IN
ANY VALUATIONS DUE TO CONSERVATISM.
THIS IS WHY FLOAT IS IMPORTANT EVEN FOR
NON INSURANCE COMPANIES. IT CAN ADD
SUBSTANTIAL VALUE TO A COMPANY EVEN IF
ITS ONLY ICING ON THE CAKE AS I OFTEN VIEW
IT.
The above means that we’re buying (NAME
REMOVED) at a massive discount to its true value.
***
Again, from here I continue detailing this great company. For now let's sum this all
up before moving on to the next part of this now extended series. Is Float Ever Bad?
On Float Part 6.
Summary
If I've explained everything well enough in the series so far we should understand -
What float is.
Why it’s important.
How companies can use float as positive leverage.
How Buffett got so rich using float.
How to find float on a balance sheet.
How to evaluate float.
How float affects a company and its margins.
Maybe the most important thing why float affects a company and its margins.
And how float affects a company's value.

53
In the next and sixth chapter - yes I've now added two more parts to this now extended
series - I'll answer the question is float ever bad.

54
Is Float Ever Bad? On Float Part 6
Today's post is a continuation of the earlier posts:
Charlie Munger On Deferred Tax liabilities and Intrinsic Value - On
Float Part 1.
What is Float? On Float Part 2.
Buffett’s Alpha Notes – The Power of Float – On Float Part 3.
How To Find Float On The Balance Sheet – On Float Part 4
How Does Float Affect Valuation? On Float Part 5
Today we're going to answer the question "Is Float Ever Bad?
Is Float Ever Bad?

55
I'm a guy who likes to live by the above quote. If I can make things simpler I always do.
Not only does this make things easier to understand but it also can save a ton of time.
When analyzing investments and dealing with complex topics like investment float this
isn't always possible.
Understanding the good things about investment float is definitely one of those things
you can make only so simple. The concept is simple to understand but the there are a
ton of different nuances to understand which leads to complexity. You can likely tell
since it's taken me 51 pages thus far in the five earlier posts to explain the good things
about investment float.
Luckily the answer to the titled question is a simple one. And also involves simple and
easy to understand concepts as well.
Yes, certain investment float is bad. And no, not all float is equal.
The heuristic or mental model I use when evaluating float is that if the company isn't
profitable - or near profitability - its float is useless. And can even be a negative burden
for a company.
Why?
Remember that float are liabilities that can be turned into positive leverage for a
company if used well by management and the company is profitable. But always
remember leverage can go both ways as well.
If a company isn't profitable and hasn't produced profits in several years float turns into
negative leverage. This is because in the long run float are liabilities the company will
have to pay at some point.
This is because the longer a company goes without earning profits the longer it will take
a company to pay its liabilities because it's not earning enough money. This also makes

56
it harder to fund operations and grow in a healthy way without taking on a ton of debt or
even more liabilities.
Let's go through a quick example to show this.
Let's say we have two insurance companies. Company A has an average combined ratio
of 90% over the last five years and Company B has an average combined ratio of 110%
over the last five years.
Not only does this mean Company A's profits are 20 percentage points better on average
than Company B. But it also likely means that Company B has continued racking up
liabilities it can't afford to pay when due or when a catastrophe strikes.
This is because Company B hasn't earned a profit on average over the last five years.
And of course all else remaining equal a company earning 20 percentage points
better profit's on average is the higher quality company.
The same general rule goes for non insurance companies as well. If they aren't, haven't
been, and show no signs of becoming profitable float should be viewed as negative
leverage for a company.
I use the following rules when evaluating all companies float...
To view float as a giant positive for any company I like to see consistent
profitability in the last five years. And/or seven of the last 10 years.
If a company has off and on profitability I view float as neutral.
And if the company is consistently unprofitable I view float as a huge negative for
the company.
This idea is a lot simpler to understand than the concept of what float is and makes it
potentially great for companies and investors.

57
One last thing to remember when evaluating float is that whether the company has
positive or negative acting float doesn't matter if the company doesn't allocate capital
well. And the management doesn't know what float is or how to use it.
To evaluate these potentials see the previous five posts on this topic.
Summary
If I've explained everything well enough in the series so far we should understand -
What float is.
Why it's important.
How companies can use float as positive leverage.
How Buffett got so rich using float.
How to find float on a balance sheet.
How to evaluate float.
How float affects a company and its margins.
Maybe the most important thing why float affects a company and its margins.
How float affects a company's value.
And answered the question is float ever bad?
In the next and final seventh chapter of this series I'll share the best resources I've
learned from about float with you.
Knowing what we know now we should have a gigantic advantage over other investors
who either don't know about float. Or aren't willing to put in the time to learn what it is
and what it can do for a company and investment.

58
Conclusion and Further Recommended Reading - On Float Part 7
This post is the last one in the On Float series started way back on February 2nd 2016.
Yes that date is correct. I posted the first article in this series Charlie Munger On
Deferred Tax Liabilities and Intrinsic Value - On Float Part 1 seven months
ago.
If I've done my job well in the seven parts and 60 pages of content including this post we
all should know the following things now.
What float is.
Why it's important.
How companies can use float as positive leverage.
How Buffett got so rich using float.
How to find float on a balance sheet.
How to evaluate float.
How float affects a company and its margins.
Maybe the most important thing why float affects a company and its margins.
How float affects a company's value.
And answered the question is float ever bad?

59
But as with any great thing in life and investing there's always more to learn and
improve on. Knowing this I've included the things I've learned the bulk about
investment float from below.
Also make sure to read the comments sections of any of the following as well as there is
usually great commentary there on the specifics of float.
All the following are in no particular order. Have been added to the Recommended
Reading and Viewing page. And are designated as MUST READS!!! on
the Recommended Reading and Viewing page.
Berkshire Hathaway Shareholder Letters
The Brooklyn Investor: So What Is Berkshire Really Worth (Part 1)
The Brooklyn Investor: So What Is Berkshire Really Worth (Part 2)
The Brooklyn Investor: So What Is Berkshire Really Worth (Part 3)
The Brooklyn Investor: So What Is Berkshire Really Worth (Part 4)
Shookrun.com: Buffett On Insurance.
Losch Management: Insurance Float.
Bronstein Report: Estimating Berkshire Hathaway's Intrinsic Value.
Warren Buffett Explains The Genius Of Float.
Warren Buffett Plays The Float With Blue Chip Stamps And Private
Jets....And Wins.
Berkshire Hathaway Worth Its SALT Part 1
Berkshire Hathaway Worth Its SALT 2012 Update - Part 2.
Buffett On Insurance And Investing: Its About The Float.
Presentation on Moats and Float.
Flirting With Float Part 1
Flirting With Float Part 2
Flirting With Float Part 3
My posts about float.
Charlie Munger On Deferred Tax Liabilities and Intrinsic Value - On
Float Part 1
What Is Float? On Float Part 2

60
Buffett's Alpha Notes - The Power of Float - On Float Part 3
How To Find Float On The Balance Sheet - On Float Part 4
How Does Float Affect Valuation? On Float Part 5
Is Float Ever Bad? On Float Part 6
Conclusion and Further Recommended Reading - On Float Part 7
Reading the above things and taking notes where necessary will help you further
understand the nuances of float.
But if you really want to continue learning about float make sure to read company
filings, take notes, analyze the company fully, analyze its float, and value the company.
Doing this over and over - like with almost everything in value investing - not
only ingrains these concepts in your thought processes. But the more you do it the more
nuances you will spot. And the more intimate knowledge you'll have of investment float
and its immense power.
If I've done my job well over the last 60 pages we should now have a huge advantage
over other investors who either don't know what investment float is. Don't know how to
value and evaluate it. Or won't take the time to learn how to do these things.
From my own anecdotal observations this will put us ahead of 95+% of other investors
who don't or won't consider investment float when evaluating companies.
But as always there's always more to learn and improve on so on to the next one...


