Omslag 2006_56.indd
59
Haukur Ingason Model Scale Tunnel Fire Tests Sprinkler Brandforskprojekt 406-021 SP Fire Technology SP REPORT 2006:56 SP Swedish National Testing and Research Institute
Transcript of Omslag 2006_56.indd

Haukur Ingason
Model Scale Tunnel Fire TestsSprinkler
Brandforskprojekt 406-021
SP Fire TechnologySP REPORT 2006:56
SP S
wed
ish
Nat
ion
al T
esti
ng
an
d R
esea
rch
Inst
itu
te

Haukur Ingason
Model Scale Tunnel Fire TestsSprinkler
Brandforskprojekt 406-021

Haukur Ingason Model Scale Tunnel Fire Tests Sprinkler Brandforskprojekt 406-021
SP Rapport 2006:56 Brandteknik Borås 2006

2
Abstract Model Scale Tunnel Fire Tests Sprinkler A literature survey of the use of water spray systems in tunnels is presented together with arguments and discussion on the use of such systems. A summary of available research related testing is given as well. It shows that there is a lack of systematic studies dealing with important parameters such as longitudinal flow, Heat Release Rate (HRR), fire spread and thermal and toxic environment. A model scale study (1:23) was carried out in order to improve the basic understanding of water spray systems in longitudinal tunnel flow. The water spray system consisted commercial available axial-flow hollow cone nozzles. Tests with both a deluge system made of 12 nozzles placed directly above the fire source and a water curtain system consisting of 4 nozzles placed either downstream or upstream the fire source were carried out. A wood crib pile was used to simulate the fire source, which was designed to correspond in large scale to a HGV (Heavy Goods Vehicle) fire load. A second wood crib was used as a target pile and was placed downstream the ignited wood crib. The parameters varied were the water flow rate and water pressure, the longitudinal ventilation rate and the arrangement of the nozzle system. Possible fire spread between wood cribs with a free distance corresponding to 15 m in large scale was investigated. Key words: model scale, tunnel fire, sprinkler nozzle, longitudinal ventilation SP Sveriges Provnings- och SP Swedish National Testing and Forskningsinstitut Research Institute SP Rapport 2006:56 SP Report 2006:56 ISBN 91-85533-49-1 ISSN 0284-5172 Borås 2006 Postal address: Box 852. SE-501 15 BORÅS, Sweden Telephone: +46 33 16 50 00 Telex: 36252 Testing S Telefax: +46 33 13 55 02 E-mail: [email protected]

3
Table of Content Abstract 2
Table of Content 3
Preface 4
1 Introduction 7
2 Literature survey 8 2.1 Debate on use of water spray systems in tunnels 8 2.2 Installed systems 9 2.3 Japanese experience 9 2.4 Large scale experiments 10 2.5 Aim of the present study 13
3 Theoretical considerations 14 3.1 Scaling theory 14 3.2 Determination of HRR 15 3.3 Water flow rate 16 3.4 Work by Kung and Hill 17 3.5 Critical water application rate 19
4 Experimental Setup 20 4.1 Fire load 21 4.2 Instrumentation 22 4.3 Water spray system 24
5 Test procedure 26
6 Test results 29 6.1 Heat release rate 29 6.2 Gas temperatures 31 6.3 Gas concentration 32 6.4 Radiation and fire spread 32
7 Discussion of results 34 7.1 Comparison with Kung and Hill data 34 7.2 Plot of data using deluge A system 35 7.3 Deluge system B 40
8 Conclusions 41
9 References 42
Appendix Test Results 44

4
Preface This project was financed by the Swedish Fire Research Board (BRANDFORSK). The technicians Michael Magnusson, Joel Blom, Lars Gustafsson and Ari Palo-Oja at SP Fire Technology are acknowledges for their valuable assistance during performance of the tests. They were also responsible for the construction of the test rig. Magnus Arvidson is acknowledged for his valuable discussion during the preparation of the tests and during the analysis of the test results. The advisory group to the project is thanked for their contribution. The advisory group consisted of Johan Hedenfalk (SL), Lars Aidanpää (LKAB), Magnus Lindström (Brandkonsulten), Per Walmerdahl (FOI), Staffan Bengtsson (Brandskyddslaget), Anders Walling (Brandforsk), Jan Blomqvist (Cerberus), Anders Berqvist (Stockhol Fire Brigade), Ovind Engdahl (Norsk Brannvern), Bernt Freiholtz (Vägverket), Odd Lyng, Gunnar Spång (SL), Christer Lindeman (SL), Jenette Stenman (Banverket) Bo Wahlström (Brandskyddslaget), Katarina Kieksi (Banverket) and Omar Harrami (SRV).

5
Sammanfattning En litteraturstudie visar att det har funnits ett generellt motstånd mot användning av vattenbaserade släcksystem i tunnlar trots att de används med stor framgång i vägtunnlar i Japan. De argument som används mot användning av sprinkler i vägtunnlar bygger till stor del på försök som genomfördes 1965 med ett stort bensinbål i en relativt liten tunnel. Att man har börjat diskutera användningen av vattendimma system i tunnlar i dag har i huvudsak med att göra att det har inträffat stora brandolyckor i vägtunnlar och att vattenmängden och vattendropparna är betydligt mindre jämfört med konventionella sprinklersystem. Det finns också många företag som ser möjligheter att etablera sig på marknaden. Runehamar försöken som genomfördes 2003 är också en bidragande orsak till det ökade intresset för vattenbaserade släcksystem i vägtunnlar. Litteraturstudien visar att det finns ett antal fullskaliga experiment med sprinkler genomförda men det finns inga systematiska försök där man har undersökt inverkan av olika grundläggande parametrar så som lufthastighet, brandstorlek och kritiska påföringshastigheter som krävs för att förhindra brandspridningen. Därför genomfördes försök i modellskala där dessa parametrar undersöktes. Modellförsök Försöken genomfördes i en tunnel som var i skala 1 mot 23. Fem försök med sprinklerdysor där man undersökte den minsta mängd vatten som behövdes för att förhindra brandspridning mellan två ”långtradare” (två träribbstaplar med ett avstånd som motsvarar 15 m i fullskala). Ett deluge system arrangerades med totalt 12 dysor och lufthastigheten motsvarade 3 m/s. Totala vattenflödet som användes var 0.35 l/min (887 l/min i fullskala), 0.5 l/min (1268 l/min i fullskala) och 0.67 l/min (1700 l/min i fullskala). Motsvarande vattentäthet i fullskala är 3.5 mm/min, 5 mm/min och 6.7 mm/min. I försöket med lägsta vattenflödet kunde man observera att stapeln nedströms var lite påverkad (bränd) men branden tog sig aldrig i den. I övriga två fallen med högre vattenflöde så var det ingen tvekan att branden inte spreds vidare. Däremot påverkades temperaturnivåerna tydligt längre nedströms branden (motsvarande 77 m i fullskala) beroende på vattenflödet. I inget av fallen släcktes branden men den kontrollerades olika. Modelltunneln hade måtten 0.4 x 0.2 m hög och 10 m lång (9.2 m x 4.6 m hög och 230 m lång). Den byggdes i Promatect H skivor med brandhärdad glas på ena sidan. En mekanisk fläkt mot ena tunnelmynningen användes för att styra längsventilationen.

6

7
1 Introduction The large fires that have occurred in many road tunnels in Europe [1, 2] have lead to renewed discussion about the need for a water spray system in order to prevent further catastrophic fires in road tunnels. Also, the Runehamar tests [3, 4], which resulted in both rapid and high Heat Release Rates (HRR) using ordinary hazardous goods, show that there are good reasons to review many commonly accepted views and attitudes. As a consequence, new innovative water based technologies are being seriously discussed as a part of the tunnel safety concepts in many new large infrastructure projects. The use of water based suppression system is, however, still controversial and source for strong opinions. The knowledge about the efficiency of water spray systems in tunnels is still spare. There is a need for more fundamental research on the efficiency of these types of systems in tunnels. The effects of longitudinal flow on the cooling efficiency and capability to prevent fire spread between vehicles are an interesting subject to study. The fire spread between large vehicles such as Heavy Goods Vehicles (HGV) in the large fires that have occurred have put focus on the use of water spray systems to prevent fire spread. In the present study a focus is put on producing a well defined experimental data which can be used for future modelling work. Similar type of work has been carried out for sprinklers in ordinary buildings. Among those are the fundamental work of H-C Kung [5, 6] and F. Tamanini [7] on sprinkler suppression of wood cribs and Rasbash et al. [8] and recently Heskestad on pool fires [9]. An excellent overview of water spray suppression has been conducted by Grant et. al. [10] and by Heskestad [11]. The present study starts with a literature survey of different aspects on using water spray systems in tunnels, followed by a motivation for the experimental work carried out here. A detailed description of test setup and test results is given. An analysis of the data is focused on obtaining relative effects of the systems on the situation downstream the fire source.

8
2 Literature survey In the following, a summary of the present knowledge about water spray system is given, both concerning different arguments for not using water spray systems and also arguments for using such systems, as well as the an overview of were such systems are being used and the experience of such systems. A summary of available research related testing of water spray systems is then given. Finally, a recap is given connecting the presented knowledge to the aims of the experimental study given in this report. 2.1 Debate on use of water spray systems in tunnels The debate on using water spray systems in tunnels has been ongoing among experts since the unfavourable results of the experiment with sprinklers during the Ofenegg tunnel [12, 13] test series in Switzerland 1965. The main results from the three sprinkler tests, which consisted of gasoline fires with 6.6 m2 fuel area, 47.5 m2 and 95 m2, respectively and a sprinkler system with water flow rate of 19 l/min m2 (19 mm/min, no foam additives) were [13]:
- The sprinklers were able to extinguish the fire within a short time, - the visibility was strongly reduced due to turbulence created by the sprinklers and
cooling down of the smoke layer, the smoke layer was effectively cooled down and de-stratified, so that it covered the whole tunnel,
- the sprinkler water evaporated and hot steam showed scalding effects at all organic test materials, even at considerable distance from the fire site,
- the steam production pushed the hot smoke quickly in the neighbouring tunnel sections creating higher temperatures there than without sprinklers,
- in the last test with 95 m2 gasoline fuel fire, after fire was extinguished, the gasoline evaporation continued and the vapours spread along the test tunnel. After about 20 minutes into the test, an ignition of gasoline vapours initiated by remaining hot objects in the fire zone, occurred and a deflagration occurred with air velocities up to 30 m/s inside the tunnel and caused damage to the ventilation installation.
These listed results, with exception of the first one, give the basis for the argumentation of not recommend installation of water spray systems in tunnels. These arguments still show up in the PIARC and NFPA guidelines [14, 15] and during the years further arguments, not directly based on the Ofenegg tests, have been added to these guidelines. Such argumentation is that flammable liquids can be carried on the water, spreading the fire and increasing its size, the efficiency is low for fires inside vehicles, an unintentional activation of a sprinkler system could initiate traffic accidents and maintenance can be costly. Further, testing of a fire sprinkler system on a periodic basis to determine its state of readiness is impractical and costly and the sprinklers are difficult to handle manually. Other arguments not mentioned in the guidelines are for example that in the Nordic countries the risk for freezing is often mentioned as a drawback of a water spray system. An argument for not installing water spray systems that is often mentioned in the debate is the relatively high investment costs for water spray systems. All these added arguments are more a results of a discussion among experts rather than conclusive results based on well defined experiments as those obtained from the Ofenegg tests.

9
2.2 Installed systems The number of water spray systems in road tunnels, with exception of Japan (see section 2.3), is very low. No European country currently uses water spray systems on a regular basis, although there are specific tunnel projects in Europe which plans to install water mist systems in new road tunnels. There are three tunnels in the Nordic countries (two in Norway and one in Sweden) where sprinklers have been used for special purposes and there are three road tunnels in USA which have been equipped with foam sprinkler systems: the Central Artery North Area (CANA) Route 1 tunnels in Boston, MA and the I-90 First Hill Mercer Island and Mt. Baker Ridge tunnels in Seattle, WA. The decision to provide sprinklers in these tunnels was motivated solely by the fact that these tunnels will be operated to allow the unescorted passage of vehicles carrying hazardous materials as cargo. In the Sydney Harbour Tunnel in Australia a traditional deluge water sprinkler system has been installed and in the city of Melbourne two systems have been installed [16]. One system has also been installed in the Joogryeng tunnel in South Korea [17]. Consequently, due to the adverse results from the Ofenegg tests, and the recommendations given by e.g. PIARC and NFPA, there are currently not more than about ten water spray systems installed outside Japan. 2.3 Japanese experience Japan chose to follow another path than PIARC and NFPA. The first water spray system in Japanese road tunnel was installed in 1963 [18]. According to PIARCs report there are 82 road tunnels [14] installed with water spray (sprinkler) system. This number is considerably higher than the number given in a written summary by Yoshikazu OTA [16], where he says that more than 30 tunnels are installed in Japan with water sprinkler system since 1970th. Nonetheless, in a unique report written by Rob Stroeks for the Road Administration in the Netherlands (RWS) [18], where the author gives a very good insight into the Japanese water spray system design and experience, it is stated that the success rate of the Japanese water spray systems in real accidents is very high. No cases have been reported of false operation, malfunction or partial function of water spray systems during actual tunnel fires. Every year water spray system prevents fires from developing. One tunnel operator (Japan Highway Public Corporation) report that about 10 to 16 fires occurs every year where fire brigade has to intervene and where at least 2 or 3 times the water spray system is activated. Other operator (Metropolitan Expressway Public Corporation) report that at least in 5 or 6 cases the system has really cooled the fire heard and fire spread to other vehicles was prevented [18]. The purpose of Stroeks report was among other things to find out about any adverse effects experienced by the Japanese authorities and manufacturers. According to the report, there are no problems with superheated water, nor secondary explosions due to fuel vapours on the road surface. It is stated in the report that the influence by the water spray system to smoke stratification is limited to the deluge length (e.g. to 50 to 100 m) [18]. In order to avoid problems during evacuation, the system is not activated until the operator is certain that people have evacuated. In Japan, the water spray systems that are to be installed in a specific tunnel are based on categorization of the tunnel in question. The category of a tunnel is determined on a case by case basis, based on the investigation and evaluation of a number of factors. The principle factors are the length and traffic volume of the tunnel. Water spray systems are required in tunnels longer than 10 km and in shorter tunnels longer than 3 km with heavy traffic ( ≥ 4000 vehicle/day and bi-directional tunnels). The spray section is either 25 m or 50 m (two sections may operate, i.e. up to 100 m), the standard water volume is 6

10
l/min/m2 (mm/min) and the water pressure is 3 – 3.5 bar. The water spray system should be able to: − Cool down the fire and its surroundings − Suppress (control) the fire − Prevent fire spread − Support the fire fighting activities Generally, no foam additives are used (due to cost and cleaning requirements afterward use). In Japan only one tunnel has the inclusion of a foam additive. The water supply should be able to support an operation for at least 40 minutes. Regular inspections and testing of the systems are carried out every year. No notable defects have been experienced with water spray installations [18]. With the notable exception of Japan, there are no complete guidelines or standards for water spray extinguishing system in road tunnels presently available. Experience from Japan, in terms of writing guidelines, designing systems and using fixed water spray system in road tunnels, is unique in the world. 2.4 Large scale experiments In order to test the performance of the Japanese water spray systems, numerous fire tests in tunnels with liquid fuels (alcohol, methanol, gasoline) in the range of 1 – 8 m2 pools, private cars, buses and trucks (up to 6 ton cargo), have been conducted throughout the years [18]. During the year’s in-between 1960 – 1985, both model scale tests (2) and large scale tests (13) in tunnels using water spray systems were carried out [18]. One of the model scale tests was performed 1961 in scale 1 to 5 and included 13 tests with various water pressures spray volumes, spray angles and different spray distributions. The cooling effects and effects on the fire size were investigated [18]. Very limited information about the test results is available, as the research report is written in Japanese. The most extensive Japanese large scale test series was the one carried out by the Public Works Research Institute (P.W.R.I.). They performed two series of large-scale tests [19]. The first test series were carried out in P.W.R.I’s own full-scale test tunnel facility (700 m) and the second test series was carried out on the Chugoku Highway in the Kakeitou Tunnel (3277 m). The water sprinkler facilities were set so that comparisons could be made between the presence and absence of sprinkling under the same fire sources and the same longitudinal flow. Duration of sprinkling was set at about 20 minutes. The area of sprinkler was that area directly above the fire source. In some tests the sprinkler system was used downstream from the fire source in order to check the cooling effect of sprinkling on hot air currents. The amount of water discharge was set at about 6 mm/min (liters/min/m2) on road surface. In order to review the possibility of fire spread to following vehicles congested during the fire, an experimental case where carried out by cars which were arranged longitudinally and transversely. In year 2001, tests were carried out in the No. 3 Shimizu tunnel in Japan (115 m2 cross-section) using water spray systems on gasoline fuels of 1, 4 and 9 m2 , a bus and 3 passenger cars (beside each other) [20-22]. The highest fuel area (9 m2 ) corresponds to about 23 MW fire. One of the results of these experiments was to confirm the usefulness of water spray systems in case of a 23 MW fire (9 m2 gasoline) and to prevent fire spread between cars [18]. Other important large scale tunnel tests using water spray systems are the Memorial tunnel tests [23] in the USA and the 2nd Benelux tests in the Netherlands [24, 25]. The

11
most recent research related large scale tests were carried out in the UPTUN project [26]. There are also some tests that has been carried out which are directly related to specific tunnel projects. Some, but not all, have been published in the open literature [27, 28]. In the Memorial test series, four tests were conducted with a suspended ceiling installed inside the tunnel such that the section area was rectangular. Sprinklers were installed at the ceiling. Arvidson [29] estimated the discharge density to be 3.8 mm/min. The HRR of the fire was 50 MW in all four tests. Two additional tests were conducted without the suspended ceiling. During these tests the sprinklers were installed 2.1 m above the floor level. Arvidson [29] estimated the discharge density to 2.4 mm/min. Two different HRRs were used, 50 MW and 100 MW, respectively. It was concluded that the effectiveness of the deluge foam-water sprinkler system was not negatively affected by a longitudinal ventilation velocity of 4.2 m/s. The fires were extinguished in less than 30 seconds in all four tests. The time to extinguishment was longer, approximately 2 minutes, when the nozzles were installed along the wall of the tunnel. In the 2nd Benelux four tests using water based deluge spray system were carried out. The fire load consisted of a van and on open/covered truck load with wood pallets/tyres. The water density was 12.5 mm/min and the system activated at different time depending on the purpose of the test. In one test the purpose was to see if any steam was produced and in two tests the visibility reduction was considered. In the last test the efficiency of the system to cool down a warmed up tanker. It was concluded that an open deluge sprinkler system reduces the temperature of the smoke/air and of vehicles adjacent to the fire considerably. The risk of fire spread will therefore be significantly reduced. Smoke temperatures downstream do not attain the lethal tenability limit and steam production was insignificant. Visibility, however, will be reduced such that escape routes will become hard to detect. Without a sprinkler system, fire spread from a small truck might occur between an adjacent vehicle standing within a radius of 10 m from the fire. In the UPTUN project, both tests with diesel pool fires ranging from 2 – 24 MWs were used as well as wood pallets ranging from 17 – 25 MW [26]. Both low pressure systems and high pressure water mist systems were used where water discharge rate was 1 to 3.5 mm/min for the low pressure system and 0.6 to 2.3 mm/min for the high pressure system. A total of 75 extinction tests were performed in the test series, which was carried out in a 100 m long tunnel with a cross-section of about 50 m2. The main conclusions were that the efficiency of both low and high pressure systems was satisfactory. The reduction in HRR compared to freeburn tests was in the range of 0 to 80 %. The efficiency was strongly dependent on the fire size, nozzle type, location and the water discharge rates. The best results were obtained for the large fires ( ≥ 20 MW). The HRR was then reduced up to 80 % of its maximum freeburn HRR. A rapid reduction of the temperatures downstream from the fire was measured after activation and the tenability conditions downstream the fires were found to be satisfactory. The visibility downstream the fire was not improved during the first minutes after activation, but visibility was generally increased as the HRR was reduced. Visibility upstream the fire was improved after activation of the system. Tuomisaari [27] presented two large scale tests using water mist system in a tunnel. The first large scale test program was undertaken in 1999, at Darchem Flare facility in the UK, where the aim was to develop the design criteria for an on-board HI-FOG water mist system against fire in a HGV in the Eurotunnel. The conceptual design for the suppression system, and the setting of performance objective for it, were based on the geometry of the Eurotunnel HGV carrier wagons and tunnel conditions. In the tests the test fire loads included dried wooden pallets and European plastic commodity stacked on

12
a lorry trailer, and sides covered with combustible tarpaulin. The performance objectives were the following:
- prevent fire spread to adjacent vehicles - protect the tunnel and its infrastructure against destructive thermal damage and - mitigate conditions to extend time available for egress.
The fire was effectively suppressed shortly after activation. The system fulfilled all the performance objectives [27]. The second test program was carried out in June 2002 in the 100 m long and 50 m2 IF test tunnel in Norway. The primary objective of the test series was to verify the full concept and observe the systems thermal management capability in a road tunnel fire. For this purpose the test fire was so designed that it could not be suppressed but it was continuously burning and generating heat at a constant rate. The whole concept of zones and curtains was proven effective. A concealed spray fire with the spray hitting hot metal plates at a close distance provides such a steady fire. After activation the system cooled the temperatures above the fire from about 350 oC down to 150 oC and from about 100 oC down to below 50 oC at a distance of 20 m [27]. Guigas and Weatherill [28] presented interesting large scale fire tests with a water mist system in a longitudinal tunnel flow. The fire load consisted of multiple private cars simulating a collision situation. Fire spread tests with and without mitigation of the water mist system was carried. The system was designed to control the fire (0.5 – 1.5 l/min/m2 and 20 – 40 bar pressure) rather than extinguishing it as well as to prevent fire spread between the cars. Following conclusions related to the water mist system were presented:
- The water mist system stopped the fire propagation by cooling the combustion
gases, reducing the heat fluxes and the HRR - The visibility downstream the fire was improved with the water mist system but
decreased upstream. - No significant effects on the toxic gas concentrations downstream the fire were
measured The study shows that water mist system can prevent a major fire development when designed properly.

13
2.5 Aim of the present study It is apparent that the aim and background of each test presented earlier was determined by the specific conditions, background and opinions of those involved in the planning of the tests. The variation in the water discharge density, nozzle types, fuel type and size, ventilation conditions and scales make it nearly impossible to draw any general conclusions about the efficiency of water spray systems and its ability to control or suppress different fires sources. In most of the tests, very little data on test results are given. The test programmes are usually very specific and not designed to make any general modelling work on the efficiency of the systems. The survey show that there is a need for a well defined test programme focusing on a well defined and well instrumented experiments measuring the efficiency of a water spray system. Such data can be used for fundamental modelling work of cooling and suppression theories for tunnel fires. Any such information is not available. Further, large scale tests are expensive and it is difficult to carry out any type of advanced parametric studies to reasonable costs. Therefore, a model study in a reasonable scale is a reasonable option. In the present study model scale tests are presented showing in a systematic way the influence of a water spray system on the reduction in HRR, temperatures, gas concentrations and heat fluxes. This type of work has never been conducted for tunnel fires.

14
3 Theoretical considerations 3.1 Scaling theory The model tunnel was built in scale 1:23, which means that the length scale, L , of the tunnel is scaled geometrically according to this ratio. The aim with the study was to obtain a better understanding of certain phenomena that could be expected in tunnel fires using water spray system. In order to convert the results to a large scale, a scaling technique can be used. There are numerous techniques available but the Froude scaling is the most common. In Table 1 a list of scaling correlations suitable for the study here is shown. Table 1 A list of scaling correlations for the model tunnel [9, 30-34].
Type of unit Scaling model Eq. number Gas flow and energy
Heat Release Rate (HRR) ⋅
Q (kW)
2/5
⎟⎟⎠
⎞⎜⎜⎝
⎛=
⋅⋅
M
FMF L
LQQ (1)
Velocity u (m/s) 2/1
⎟⎟⎠
⎞⎜⎜⎝
⎛=
M
FMF L
Luu (2)
Volume flow (m3/s) 2/5
⎟⎟⎠
⎞⎜⎜⎝
⎛=
⋅⋅
M
FMF
LLVV
(3)
Time t (s) 2/1
⎟⎟⎠
⎞⎜⎜⎝
⎛=
M
FMF L
Ltt (4)
Mass (kg) 3
⎟⎟⎠
⎞⎜⎜⎝
⎛=
M
FMF L
Lmm (5)
Temperature (K) MF TT = (6)
Water flow
Water flow rate ⋅q (m3/s)
2/5
,, ⎟⎟⎠
⎞⎜⎜⎝
⎛=
⋅⋅
M
FMwFw L
Lqq
(7)
Water density "⋅q (l/m2 min)
2/1"
,
"
, ⎟⎟⎠
⎞⎜⎜⎝
⎛=
⋅⋅
M
FMwFw L
Lqq
(8)
Water pressure differentials P∆ (bar)
M
FMF L
LPP ∆=∆ (9)
Effective nozzle diameter (mm)
M
FMF L
LDD =
(10)
Droplet diameter (mm) 2/1
⎟⎟⎠
⎞⎜⎜⎝
⎛=
M
FMF L
Ldd (11)
L is the length scale and index M is related to the model scale and index F to full scale (LM=1 and LF=23 in our case).

15
In the study we neglect the scaling effects of the thermal inertia of the involved material, the turbulence intensity and radiation of the gases but we scale the HRR, the time, the energy content, mass of the fuel, water flow rates, water flow density, droplet diameter etc. As pointed out by Heskestad [34] it is not possible to scale drop source of a water spray properly, except in an approximate manner using geometrically similar spray nozzle. To scale the dynamic interaction of water drops with the convective flow, the initial water drop trajectories must be conserved from scale to scale, initial drop velocities, drop diameter and water flux densities must scale with 2/1L . According to Heskestad [9], the thermal radiation effects include attenuation of thermal radiation from the fire to the surroundings and evaporation of water drops due to absorption of fire radiation do not scale properly. With in the scope of this study it was not possible to consider all these aspects. More information about scaling theories can obtained from for example references [9, 30-34]. In the present study, there was no large scaled sprinkler or water mist nozzles a priori thought to be a model for the small scale nozzles used. The water flow rate (water discharge density) was used as the leading choice for the chose of a commercial nozzle. This means that the pressure and trajectory of the model nozzle used does not necessarily comply with a commercial available large scale nozzle or sprinkler. 3.2 Determination of HRR The HRR was determined using two different measuring techniques; by measuring the fuel weight loss and by measuring the mass flow rate and gas concentrations in an exhaust duct connected to the tunnel. The main advantage of the weight measuring technique is the fast response but it was not possible to use the results after the water
spray system is activated. Here it was mainly used to obtain the fuel loss rate, afm ,
⋅at
activation. The HRR at activation, aQ⋅
, can be calculated by using the following equation:
cafa HmQ ,
⋅⋅= χ (12)
where cH is the ‘effective heat of combustion’ or the ‘chemical heat of combustion’ (kJ/kg) [35] measured under a hood calorimeter or with other similar measures. In
general, the fuel mass loss rate, fm⋅
, is determined by weight loss. As the ventilation conditions inside the tunnel are different than in the open, a combustion efficiency coefficient, χ needs to be added to the equation. When the water spray system has been activated the only way of estimating the HRR is
by measuring the oxygen concentrations [36, 37]. The HRR, ⋅
Q (kW), is obtained by the use of the following equation (without correction due to CO production) using oxygen consumption calorimetry.
⎟⎟⎠
⎞⎜⎜⎝
⎛
−−−−−
=⋅⋅
22
2222
1)1()1(
14330 ,0,0
COO
COOCOO
XXXXXX
mQ (13)

16
where 2,0 OX is the volume fraction of oxygen in the incoming air (ambient) or 0.2095
and 2,0 COX is the volume fraction of carbon dioxide measured in the incoming air or
≈2,0 COX 0.00033.
2OX and 2COX are the volume fractions of oxygen and carbon
dioxide at the measuring station downstream of the fire measured by a gas analyser (dry). If
2COX has not been measured equation (13) can be used by assuming 2COX =0. This
will simplify equation (13) and usually the error will not be greater that 10 % for most
fuel controlled fires. In the derivation of equation (13) it is assumed that uAm aρ=⋅
and that 13100 kJ/kg is released per kg of oxygen consumed. It is also assumed that the relative humidity (RH) of incoming air is 50%, the ambient temperature is 15oC, CO2 in incoming air is 330 ppm (0.033 %) and the molecular weight of air, Ma, is 0.02895 kg/mol and 0.032 kg/mol for oxygen (MO2). Further, aρ is the ambient air density, u is the average longitudinal velocity upstream the fire in m/s and A is the cross-sectional area of the tunnel in m2 at the same location as u is measured.
The total air mass flow rate, ⋅
m , inside the tunnel (and in the exhaust duct) can be determined according to the following equation:
uA
TT
m 00 ρζ=& (14)
The theoretically determined mass flow correction factor (ratio of mean to maximum velocity), ζ , is dependent of the variation of temperature and velocity over the cross-section of the tunnel, A (or the exhaust duct, see chapter 4). In the calculations of the air mass flow rate a theoretical value of ζ =0.817 was used for the tunnel and ζ =0.87 for the exhaust duct (with one exception; test 1 where ζ was put equal to 0.72 due to high discrepancy of the HRR using equations (12) and (13) at the time of water spray activation). The gas velocity was determined with aid of the measured pressure difference, ∆p, for each bi-directional probe [38] and the corresponding gas temperature. The diameter of the probes, D, used was 16 mm and the probe length, L, was 32 mm. The velocity was obtained from equation (15):
aaTpT
ku
ρ∆= 21
(15)
where k was a calibration coefficient equal to 1.08. The ambient values used in equation (15) were Ta = 293 K and aρ =1.2 kg/m3. 3.3 Water flow rate The water flow rate (l/min) for each nozzle can be determined by using the following equation:
PKq w ∆=⋅
(16)
17
where K is the K-factor and P∆ is the water pressure differentials in bar. The total water flow rate can be determined by multiplying equation (16) with the total number of
nozzles ( sprN ) used in each test. The water flow rate, wq⋅
, can be scaled according to
equation (7). The water flow density (water discharge density), "wq⋅
, can be scaled according to equation (8). The water flow density (l/min/m2) or (mm/min) can be obtained by the following equation:
c
ww A
⋅⋅
=" (17)
where cA is the total coverage area (m2) of the water spray nozzle. This can be calculated by the following equation: sprbac NssA ××= (18) where as and bs are the equal spacing distances between the nozzles in direction a and b, respectively and sprN , is the total number of sprinklers. 3.4 Work by Kung and Hill For the present experimental study the work of Kung and Hill [6] on extinction of wood crib and pallet fires is of great interest. They conducted a series of experiments on extinguishment of wood crib fires by water applied directly on the top of the crib and wood pallets. The water was applied on the top by means of a rake consisting of perforated stainless steel tubes (perforated hole diameter of 0.41 mm and tube outer diameter of 6.4 mm). They presented interesting nonimensional variables which basically accounted for variations in preburn percentage, crib height, showing nondimensional fuel consumption and total water evaporated as functions of nondimensional water flow rate. More specifically, it was shown that a single empirical correlation, for three types of cribs with the same stick size, but different crib height (6, 11 and 16 layer cribs, respectively), was established between the ratio of crib mass consumed during the extinction period versus the fire-consumable material remaining at the beginning of water application, R ,
and between the ratio of true* water application rate, cwm ,
⋅ versus the fuel burning rate at
the activation of water application, cwm ,
⋅/
⋅
afm , . The mass consumed during extinction
period was the initial fuel mass, 0M , minus the fuel mass consumed before water application (preburn time), PM , minus the dry fuel mass saved at the end of the water application period, M , or MMMM Pextp −−= 0 . The fire-consumable mass left at the
* The true water application rate, cwm ,
⋅, is defined by Kung and Hill as the application rate of water
which strikes the crib. This rate is equal to the total water application rate, wm⋅
, multiplied by
(1-c), i.e. )1(, cmm wcw −=⋅⋅
where c is the fraction of water applied that fell directly through the shafts of the crib. The value of c has not been given in the paper by Kung and Hill.

18
moment when the water application started is the 0M minus PM minus the mass of ash, ashM , which would result from a corresponding freeburn test without water application. The weight fraction of ash, rP , was defined as 0/ MM ash and was found to be 0.061 for the eastern white pine wood cribs used. Thus, fire-consumable mass left at the moment when the water application started, which also can be interpreted as the amount of fuel consumed during the extinction period in a freeburn test, can be written as
Prfreeburncons MPMM −−= )1(0, . The ratio R was found to vary as the -1.55 power of
the ratio cwm ,
⋅/
⋅
afm , or
55.1
,,
)1(−
⋅
⋅
⎥⎥
⎦
⎤
⎢⎢
⎣
⎡ −⋅==af
w
freeburncons
extp
m
cmM
MR ξ (19)
where ξ is a proportionality coefficient varying depending on type of fuel (wood crib or pallets) and type of ignition procedure. For the wood crib tests ξ was 0.312 for a centre ignition of the crib and 0.260 for the 11 layer crib and the entire bottom ignited simultaneously. For the wood pallet tests this coefficient was 0.150. For a certain fuel package this correlation show that the amount of fuel consumed during the water application period (extinction period) will be highly dependent on the preburn time. Kung and Hill [6] presented also a single linear relationship between the ratio of total water evaporated ( eM ) versus the total mass consumed during extinguishment
)( 0 MMM P −− , and the ratio of the “true” water application rate ( )1(, cmm wcw −=⋅⋅
)
versus the maximum freeburning rate of the wood crib ( max,fm⋅
) based on the wood crib tests:
max,max,
, )1(
f
w
f
cw
extp
e
m
cm
m
mMM
⋅
⋅
⋅
⋅−== ψψ (20)
where ψ was experimentally determined; 2.5 for centrally ignited wood cribs and 1.8 for
entire bottom ignited crib. The total water application rate, wm⋅
, multiplied by (1-c), i.e.
)1(, cmm wcw −=⋅⋅
, is the fraction of water applied that strikes directly on the wood cribs. The value of c was not given in the paper by Kung and Hill. Equation (20) can be rewritten by multiplying both sides of equation (20) with cw HH / where wH is the heat of evaporation of water ((4200(100-20) + 2200)=2536 kJ/kg) and cH is the heat of combustion for wood (15030 kJ/kg):
freeburn
w
extp
w
Q
cQEE
max,
)1(⋅
⋅−
=ψ (21)

19
where wew HME = , cextpextp HME = , www HmQ⋅⋅
= and cffreeburn HmQ max,max,
⋅⋅= . In
the tests performed here, no information about eM was obtained. This makes equation (21) unfeasible to use in present form. Equations (19) and (20) calculate a nondimensional fuel consumption and total water evaporated during a complete test as functions of nondimensional water flow rate. These correlations may be constrained to information that is not always available after large scale tunnel fire tests. Momentary measurements of HRR, temperatures, gas concentrations are usually available during such test but not the amount of fuel or water vapour consumed during the test. In order to analysis the data considering such conditions a following hypothesis is
presented. It is reasonable to anticipate that the max
⋅Q obtained during water application
correlates to the water flow rate or www QHmQ⋅⋅⋅
∝∝max . A steady state energy equation for the fuel surface anticipates such correlation. If this correlation is true, we could use the right hand side of equation (21), and propose the following relationship for plotting the data:
freeburn
w
freeburn Q
cQ
Q
Q
max,max,
max )1(⋅
⋅
⋅
⋅−
∝ (22)
where we define freeburnQQ max,max /⋅⋅
as the nondimensional HRR ratio and
freeburnw QcQ max,/)1(⋅⋅
− as the nondimensional water flow variable. Further, if this relationship holds, we would also expect that the ratios of
freeburnTT max,max / ∆∆ , freeburnii XX max,max, / and freeburnqq max,max /⋅⋅
will hold since we know
that maxmax,maxmax
⋅⋅∝∝∆∝ qXTQ i holds for longitudinal flow in tunnels [39]. Here
maxT∆ is the maximum excess gas temperature ( )( maxmax aTTT −=∆ ), max,iX is
maximum gas concentration and max
⋅q is maximum heat flux measured in the longitudinal
flow. When plotting the data, maximum values of corresponding instruments, after the activation of the water spray system will be applied. The parameter c will be determined from the experimental data. 3.5 Critical water application rate Heskestad [11] determined from the data of Kung and Hill, that the critical water
application rate, "
,crwm⋅
, i.e. the amount of water needed to extinguish the crib, was 1.9 g/m2
s and 2.4 g/m2 s for 5 % preburn and 20 % preburn, respectively. This is the amount
of water flow rate per unit exposed fuel surface area ( sA ) effectively extinguishing the test object. Values higher than the critical value tend to fasten the time to extinction. In the overview given by Heskestad, the critical water application rates based on other investigations as well for wood based fuels varies between 1.3 g/m2
s up to 3 g/m2 s. This
information will be compared to the experimental data obtained here.

20
4 Experimental Setup A total of 12 tests with nozzles mounted at the ceiling were carried out in a 1:23 scale model tunnel. The model tunnel had been used for free burn tests with wood cribs and longitudinal ventilation [39].
Figure 1 A photo of the 1:23 model scale tunnel before it was used for fire tests
with longitudinal ventilation [39]. A fan was attached to the tunnel entrance and windows were put on one side.
Longitudinal ventilation was established with aid of an electrical axial fan attached to the entrance of the model tunnel, see Figure 1. The fan it self was 0.95 m long with an inner diameter of 0.35 m and 0.8 HP motor yielding a maximum capacity of 2000 m3/h (at 1400 rpm and 7.5 mmH2O). The rotation speed, and thereby the capacity, could be controlled by an electrical device coupled to the motor. In between the fan and the tunnel entrance a 0.8 m long rectangular plywood box with the dimensions 0.4 wide and 0.3 m high, was mounted in order to create a uniform flow at the entrance of the tunnel. The swirls created by the axial fan, was hampered by filling the plywood box with straw fibres. The nominal longitudinal wind velocities of 0.42 m/s and 0.62 m/s were used. According to equation (2), the corresponding large scale velocities are 2 m/s and 3 m/s ( 2/1L∝ ). The tunnel itself was 10 m long, 0.4 m wide and 0.2 m high, see Figure 2. The corresponding large scale measures ( L∝ ) are 230 m long, 9.2 m wide and 4.6 m high, respectively. As this tunnel had been used in earlier test series with ceiling height of 0.3 m [39], a false ceiling with the same material as in the other parts of the model scale tunnel was used to create the 0.2 m height. The false ceiling was a part of the exhaust ventilation system that was constructed to exhaust the fire gases. The exhaust system consisted of a steel duct system with diameter of 0.25 m (0.049 m2), see Figure 2 and Figure 3. The steel duct system was connected to the central ventilation system at SP Fire Technology in Borås, Sweden. The nominal flow rate in the steel duct was 0.12 m3/s, which corresponds to 304 m3/s in large scale ( 2/5L∝ ). The model was constructed using non-combustible, 15 mm thick, boards (Promatect H). The density of the boards was 870 kg/m2 the heat capacity was 1.13 kJ/kg K and heat

21
conduction was 0.19 kW/m K. The floor, ceiling and one of the vertical walls were built in Promatect H boards while the front side of the tunnel was covered with a fire resistance window glaze. The 5 mm thick window glaze (0.6 m wide and 0.35 m high) was mounted in steel frames which measured 0.67 m by 0.42 m.
200m
m
1200
mm
300
mm
260 mm
780
mm
Nr 4
8200mm
steel duct forexhaust flow
Ø 250 mm2865mm
x=0 m
4055mm
ignitedwood crib
target
650mm
Figure 2 A schematic drawing of the model tunnel using longitudinal flow. The
fire gases were exhausted through an opening in the ceiling (0.26 m x 0.22 m) which was 8.2 m from the inlet opening (x=0).
300
mm
400 mm
100
mm
780
mm
260 mm
260mm
Figure 3 A photo and a schematic drawing of the exhaust ventilation used in
the tests to measure the HRR. 4.1 Fire load The fire load consisted of wood cribs (pine) as shown in Figure 4. The length of the long sticks was 0.54 m and the short one 0.12 m. The sticks were squared with a width and height of 0.015 m. The free distance between each horizontal stick was 0.02 m and the total exposed fuel surface area of wood crib was estimated to be 0.56 m2. The total weight of the wood crib ranged from 1.0 kg to 1.16 kg. The variation is because each wood crib was manufactured by hand. The height from the tunnel floor and up to the bottom of the wood crib was about 0.05 m. The total height of the wood crib itself was usually 0.105 m and the free distance from the top of the wood crib and up to the ceiling was about 0.045 m.

22
540 mm 120 mm
105
mm
sticks 15 x 15 mm
50 m
m
Figure 4 Detailed drawing of the wood crib used as a fire source. 4.2 Instrumentation Various measurements were conducted during each test. A wood crib was placed on a weighing platform (W), consisting of a scale attached by four steel rods to a free floating dried Promatect H board measuring 0.65 m long, 0.35 m wide and 0.12 m thick. The centre of the wood crib was located 2.865 m from the inlet opening (x=0). In the case when a target wood crib was used, only the first wood crib was weighted. The free distance to the target, if used, was 0.65 m, corresponding to 15 m in large scale. The weighing platform was connected to a data logging system recording the weight loss every second. The centre of the weighing platform was 2.87 m from the tunnel entrance and the accuracy of the weighing platform was +/- 0.1 g. The weighing results were only applied when water spray was not active. The temperature was measured with welded 0.25 mm type K thermocouples (T). The location of the thermocouples is shown in Figure 5 and Figure 6. Most of the thermocouples were placed along the ceiling at a distance of 0.035 m from the ceiling. A pile of thermocouples was placed 6.22 m (pile A in Figure 5). The pile thermocouples were placed in the centre of the tunnel and at height 0.024 m, 0.062 m, 0.10 m, 0.138 m and 0.176 m, respectively, above the floor. These thermocouples are identified as T6-T10 for pile A in Figure 6 and the thermocouples at the ceiling are identified as T1, T3 – T6, T11 and T12. A bi-directional [38] probe was placed upstream the fire at the centre of the cross-section and 1.15 m from the inlet (BD). The pressure difference was measured with a pressure transducer with a measuring range of +/- 20 Pa.

23
200
mm
weighting platform
Thermcouplepilebi-directional probe
Gasanalysisflux meter
1235 mm 1250mm
990mm
380mm855mm 1250mm 1250mm 1250mm 1250mm
Thermocouple K 0.25 mm
Obs: all instrument at the cenre of the tunnel
176
mm
24m
m
62m
m
100m
m
138m
m
176m
mThermocouple pile A
700mm
X
2865 3355 mm 2500 mm 1280mm
pile A
flux 1 flux 2
Figure 5 The instrument layout and measures during the tests. At two locations and flush to the floor board, water cooled heat flux meters of type Schmidt-Boelter (S) were placed to record the total heat flux. The locations were 3.72 m (Flux 1 or S18 in Figure 6) and 6.22 m (Flux 2 or S19 in Figure 6) from the tunnel entrance (x=0). The gas concentration (O2.) (G) was measured 6.22 m from the entrance (at pile A, at height 0.176 m (0.88 x tunnel height) by one measuring probe consisting of open copper tubes (Ø 6 mm) and in the exhaust duct. Gas concentrations (O2. CO2 and CO) (G) were also measured in the exhaust duct in order to measure the HRR. The oxygen was measured with an M&C Type PMA 10 (0 – 21 %) and the CO2 (0 - 10%) and CO (0 – 3 %) was measured with Siemens Ultramat 22. In Figure 6 the number of and identification of the probes used is presented.
W
thermocouple pilevelocity
gasanlysisheat flux gage
thermocouple
T1 T2 T3 T4 T5
T17
S18 S19
B21
T=thermocoupleB=bi-directional probe
S=Schmidt-Boelter gageG=gasanalysisW=Weightloss
pile A
pile AT6
T7 T8T9 T10
T11T6
2865
3720
5000
6220
1235
T12
7220
8470
Figure 6 The channel number and identification of all the instruments is shown
in this figure. The scale (weighting platform) (W), the thermocouples, the pressure transducers, the gas analysers and flux meters were connected to IMP 5000 KE Solotron loggers. The data was recorded on a laptop computer at a rate of about one scan per second.

24
4.3 Water spray system The water spray system consisted of two parallel 1600 mm long steel pipes, with an outer diameter of 12 mm, placed horizontally above the main ceiling of the tunnel. At every 200 mm, a 120 mm long steel pipe with an outer diameter of 12 mm was mounted vertically through the main ceiling (at height 0.3 m) and the false ceiling (at 0.2 m) where it was connected to the two parallel steel pipes. In order to make the system flexible, the system was originally built with possibility to connect 14 water spray nozzles, as shown in Figure 7 and Figure 8. In the first test series 12 nozzles (deluge A) were used. The tests carried out with a deluge A system are to be regarded as an active fire control system. In the second test series 4 nozzles were used (deluge B, Figure 9) either downstream the ignited wood crib or upstream the ignited wood crib. No direct hit on the ignited wood crib although there were some observations that the water that did partly hit the wood cribs. This system can be regarded as a water curtain system used to cool down the fire gases. The deluge water spray system consisted of nozzles of the type; Lechler Hollow Cone Spray 212.085.11.CC.00.0 (Material 11). This nozzle creates a very fine uniform hollow spray cone. The nozzle passage diameter was 0.25 mm (5.75 mm in large scale, L∝ ). The spray diameter of the cone at 7 bar (161 bar in large scale, L∝ ) water pressure is 140 mm at a distance of 100 mm from the nozzle opening and 220 mm at a distance of 200 mm from the nozzle opening. This means that the total coverage area of each nozzle
at the tunnel floor (or road surface) is 038,04
22.0 2
=×π m2. The total coverage area at
floor level for 12 nozzles will be 46.012038.0 =× m2. The total coverage area cA for 12 nozzles according to equation (17) is 48.0122.02.0 =×× m2, which is nearly the same. Table 2 Technical information for the nozzle used in the experiments Type Nozzle
passage diameter
Cone angle
Water pressure
P∆
Flow rate of one nozzle
wq⋅
k-factor (equation )
Lechler mm o bar l/min l/min bar-1/2 5 0.04 0.0179 7 0.047 0.0178
212.085 0.25 80
10 0.057 0.0180 More information about this nozzle can be obtained from www.lechler.com. In other tests, the location and the number of the nozzles were changed in accordance to Table 3. A pressurized water tank (150 l) was used to supply the water to the water spray system. The flow rate of the system was adjusted in accordance to the condition that the nominal water density would be about 3.5 mm/min, 5 mm/min and 7 mm/min, respectively, in large scale ( 2/1L∝ ).
The total water flow rates, wq⋅
, and water pressures, P∆ , were not recorded by the laptop computer. It was manual readings from gages connected to the water spray system as shown in Figure 7.

25
20m
m
1200
mm
300
mm
260 mm
780
mm
1000mm
1600 mm
wood crib
Connected to a pressurizedtank with water
Lechler nozzle 212.085
flanged steel plate target650 mm
8200 mm
φ12 mm steel pipe
pump Q P
Connection topressuriezed air
extra pipe to beconnected
2865 mm
Figure 7 A principal sketch and location of the deluge A water spray system
using 12 nozzles. In the test setup shown here the deluge system was mounted centrally above the ignited wood crib.
50 m
m
150 mm
200m
m
200 mm
100m
m
flanged steel plateattached to the false
ceiling with steel rods.
30 m
m
Lechler 212.085 nozzleφ12 mm steel pipe
1 2 3 4 5 6 7
Figure 8 A bird view schematic sketch of the deluge A water spray system (to
the left) and a cross-sectional view of the tunnel and the flanged steel plate mounted above the ignited wood crib (to the right). Nozzles are connected at locations 1-6. In the deluge B system nozzles were either connected at locations 1 and 2 (upstream) or at 6 and 7 (downstream).
A flanged steel plate (just few millimetres thick) was mounted in the ceiling directly above the ignited wood cribs, see Figure 8. This was done in order to avoid a direct hit of the water spray cone onto the wood crib. This would simulate fire conditions where the fire source is partly hidden by some kind of obstacles or a solid ceiling of an HGV truck. One test was done without this flanged steel plate in order to explore how much it would affect the results.
1200
mm wood crib
Connected to a pressurizedtank with water
Lechler nozzle 212.085
flanged steel plate target650 mm
pump Q P
Connection topressuriezed air
Figure 9 A principal sketch and location of the deluge B water spray system
using 4 nozzles at two different locations, upstream the ignited wood crib and downstream the ignited wood crib. Only 4 nozzles were used at each time, locations 1 and 2 or locations 6 and 7 (see figure 8).

26
5 Test procedure The wood cribs used in each test were dried over a night in a furnace with 60 ºC (<5% moisture). The ignited wood crib was placed on the weighting platform at a height 50 mm above floor. A cube of fibreboard measuring 0.03 m, 0.03 m and 0.024 m which was soaked in heptane (9 mL) and on the weighing platform board at the upstream edge of the wood crib as indicated in Figure 10. At 2 minutes from starting the logging system, the ignition cube was ignited. The total number of tests was 13 where 2 tests were freeburn tests and 11 with either a deluge system A or B. The deluge system was always activated 1 minute after ignition, or 4.8 minutes in large scale ( 2/1L∝ ). The HRR when the system activated was in the range of 20 – 30 kW, or 50– 75 MW in large scale ( 2/5L∝ ).
Figure 10 A photo from the test setup using a deluge A system with 12 nozzles connected at locations 1-6.
In Table 3, detailed information on each test carried out is given. The tests were carried out with the same tunnel width, 0.4 m, and ceiling height, 0.2 m. In most of the tests a nominal velocity of 0.62 m/s (3 m/s in large scale, 2/1L∝ ) was used whereas in two tests a nominal velocity of 0.42 m/s (2 m/s in large scale) was used. In most of the tests a wood crib of about 1 kg was ignited ( ≈ 12 tonne in large scale, 3L∝ ). At a free distance of 0.65 m (15 m in large scale) on the downstream side a target consisting of wood crib of the same structure as the ignited one was placed in majority of the tests in order to observe if there would have been any risk for further fire spread from the ignited wood crib. In Table 3, rearrangement of the actual test sequence have been done in order facilitate the reading of the table. Test nr 8 was a freeburn test with no target on the downstream side. This test will serve as a reference test (freeburn) when comparing the effects of the water spray system on the measured data. The heat release data for this test was only obtained with the weighing measurements. The measurements with the exhaust duct system failed due to technical error in the gas concentration measurements. Unfortunately, no repeated test was carried out. Test nr 6 was carried out to investigate if the fire would really spread if not water spray systems were applied. In tests 1 to 5, 12 nozzles (deluge A system) were mounted centrally above the ignited wood crib. The
Ignition source placed here
flanged steel plate
Lechler nozzle
Target Longitudinal wind

27
water flow density, longitudinal ventilation rate and presence of the steel plate were varied in these five tests. The nominal flow rates were 0.35 l/min, 0.5 l/min and 0.67 l/min, respectively. Corresponding flow rates in large scale are 888 l/min, 1268 l/min and 1700 l/min ( 2/5L∝ ). The calculated nominal water discharge densities according to equation (17) are 0.73 mm/min, 1.04 mm/min and 1.4 mm/min, where cA is equal to 0.48 m2 according to equation (17). This corresponds to the predetermined water densities in large scale of 3.5 mm/min, 5 mm/min and 6.7 mm/min ( 2/1L∝ ), respectively. In test five the flanged steel plate mounted above the ignited wood crib was removed. The reason was to investigate how much influence on the results this steel protection might have on the results. In tests 7 and 9 - 12, the water spray system consisted of 4 nozzles (deluge B system) where the nozzles were located in positions 6 and 7 (see Figure 8). The total water flow rates were 0.17 l/min (or 431 l/min in large scale) and 0.22 l/min (558 l/min), respectively. This corresponds to a water density of 1.04 mm/mm (5 mm/min) and 1.4 mm/min (6.7 mm/min). The idea with these tests was to investigate how much water cooling we could expect when the system does not hit directly on the fire source (water curtain) and to see if the fire would spread between the wood cribs with only 4 nozzles in-between the wood cribs. Of the tests in this series, a target was used in test 7 and 11. In tests 9, 10 and 12, 13 no targets were used. The reason why not all tests were carried out with targets was mainly to obtain measured data which was not influenced by ignited target. After tests 1 to 5, the remainings of the ignited wood crib was measured after it had been dried. In Table 3, 0M is the initial fuel mass, PM is the fuel mass consumed before water application (preburn time), M is the dry fuel mass saved at the end of the water application period and ))1(/()( 00 prp MPMMMMR −−−−= . The preburn
percentage ( 100/ 0 ×MM p ) for the tests carried out here is about 7 – 8 %. Table 3 Summary of tests carried out with longitudinal ventilation
Test nr
aT
nomu measu * 0M
pM M
R **
Flanged steel
plate at ceiling
Target
Deluge system
(number of nozzles)
Positions of nozzles (see Figure
8)
oC m/s m/s g g g - - - - - 8 19.2 0.62 0.67 1062 134 ~0 1.00 yes no - - 6 21.6 0.62 0.54 1146 148 ~0 - yes yes - - 1 20.3 0.62 0.61 1020 84 244 0.79 yes yes A (12) 1-6 2 22.1 0.62 0.57 1008 72 297 0.73 yes yes A (12) 1-6 3 19.6 0.62 0.63 1140 90 167 0.91 yes yes A (12) 1-6 4 21.0 0.42 0.21 1096 32 190 0.88 yes yes A (12) 1-6 5 21.6 0.62 0.58 1144 82 196 0.87 no yes A (12) 1-6 7 20.8 0.62 0.56 1160 134 ~0 - yes yes B (4) 6,7 9 19.5 0.62 0.63 1022 NA NA NA yes no B (4) 6,7
10 18.1 0.62 0.71 1046 NA NA NA yes no B (4) 6,7 11 18.8 0.62 0.68 1118 NA NA NA yes yes B (4) 6,7 12 19.2 0.42 0.48 1000 NA NA NA yes no B (4) 6,7 13 19.4 0.62 0.69 1092 NA NA NA yes no B (4) 1,2
* average value (8 minutes) of the centreline velocity measured during the test ** eqn (19), assume that rP =0.061

28
In Table 4 the nominal flows ( nomwq ,
⋅) and water pressure ( nomP∆ ) are given. The values
of nomP∆ are based on calculations (equation (16)) using k-factors given in Table 2 and
the nominal water flow rate, nomwq ,
⋅. The values of wq
⋅ and P∆ are manual readings
from flow and pressure gages. In the case when the sign ~ is shown it means that an visual reading check was done and not an accurate reading with registration of the exact value. Table 4 Summary of information concerning the water spray system.
Test nr
nomu
Number of nozzles at
ceiling
nomwq ,
⋅
wq⋅
nomP∆
P∆
"
,nomwq⋅
m/s l/min l/min bar bar mm/min
8 0.62 0 - - - - - 6 0.62 0 - - - - - 1 0.62 12 0.50 0.51 5.4 5.34 1.04 2 0.62 12 0.67 ~0.66 9.6 ~10 1.40 3 0.62 12 0.35 0.35 2.7 3.3 0.73 4 0.42 12 0.50 0.50 5.4 ~6.0 1.04 5 0.62 12 0.50 0.48 5.4 6.12 1.04 7 0.62 4 0.17 0.17 5.4 6.02 1.04 9 0.62 4 0.17 ~0.17 5.4 ~6 1.04
10 0.62 4 0.22 ~0.22 9.6 ~10 1.40 11 0.62 4 0.22 ~0.22 9.6 ~10 1.40 12 0.42 4 0.17 0.176 5.4 6.05 1.04 13 0.62 4 0.17 ~0.17 5.4 ~6 1.04
~ means that an visual reading check was done

29
6 Test results In the following a presentation of the test results is given. All the detailed test results for each test are given in Appendix. 6.1 Heat release rate In Figure 11, the freeburn HRR for one wood crib and for two wood cribs, respectively, are shown. The HRR of the freeburn test with one wood crib (test 8), was not determined with the exhaust system (oxygen calorimetry). As mentioned earlier this was due to a technical error in the gas measurements which occurred only in this test. When two wood cribs (test 6) were used the fire spread from the ignited wood crib to the target. The time when the fire spread to the second wood crib (the target) was 1.68 min from ignition. The effective heat of combustion used for determination of HRR using the weighted data was 15.03 MJ/kg [39]. This value was obtained from a freeburn measurements under a fire laboratory hood calorimetry of the wood crib used (16.7 MJ/kg) and by assuming a combustion efficiency of 0.9 inside the tunnel. The weight results are consistent and reliable when the water spray system is not activated. The HRR based on the oxygen calorimetry was used in the tests when the water spray system was activated. There were, however, problems with pressure waves in the ventilation system in some of the tests (oscillation in the test data presented in Appendix). In those cases an average HRR values (30 sec average) were used in the analysis. Further, integration of the HRR curves did not give consistent data on the total heat of combustion if compared to the fuel mass left after
each test. Due to this reason the HRR at activation, aQ⋅
, was determined from the weighing data, see Table 5. The water spray system was always activated one minute from ignition. In Figure 12, the HRR as a function of time is plotted for the freeburn test (test 8) and the tests with the deluge system A (12 nozzles) centrally located above the ignited wood crib (tests 1, 2 and 3). The nominal water flow rates where 0.35 l/min, 0.5 l/min and 0.67 l/min, respectively. The nominal longitudinal ventilation rate was 0.62 m/s and the flanged steel plate was present at the ceiling.

30
0
20
40
60
80
100
120
140
160
180
0 1 2 3 4 5 6 7 8 9 10
Time (min)
Hea
r re
leas
e ra
te (k
W)
1 wood crib 2 wood cribs
Figure 11 The freeburn HRR for both one wood crib and two wood cribs, i.e. when the fire has spread to the second wood crib (the target).
0
20
40
60
80
100
120
0 1 2 3 4 5 6 7 8 9 10 11 12 13
Time (min)
Hea
r re
leas
e ra
te (k
W)
freeburn qw=0.35 l/min qw=0.5 l/min qw=0.67 l/min
Figure 12 Comparison of the measured HRR for the freeburn test with one wood crib and three different flow rates of the deluge system A (12 nozzles). The nominal longitudinal ventilation rate was 0.62 m/s and there was a flanged steel plate in the ceiling.

31
6.2 Gas temperatures In Table 5, the maximum values of the excess gas temperature readings are presented for all the tests performed. The location of the temperature readings are related to the definition of the thermocouple, e.g. 3max,TT∆ etc. means thermouples T3, T4, T5, T6 and T11, respectively. The location can been found in Figure 6. The average temperature given at pile A, avgATmax,∆ , is based on the arithmetic average of the excess temperature readings of thermocouples T6, T7, T8, T9 and T10, respectively. The HRR when the
water spray system was activated, aQ⋅
, is given as well. Table 5 Test results related to HRR and gas temperature.
Test nr nomwq ,
⋅
nomu aQ⋅
* max
⋅Q
3max,TT∆
4max,TT∆
5max,TT∆
6max,TT∆
11max,TT∆ avgATmax,∆
Unit-> l/min m/s kW kW ºC ºC ºC ºC ºC ºC x -> - 1.15 m 2.87 m - 2.87 m 3.72m 5.0 m 6.22 m 7.47 m 6.22 m
8 - 0.62 - 102.2* 630.5 675.2 460.9 287.5 225.2 228.1 6 - 0.62 - 154.2 565.5 704.9 787.1 515.3 363.3 466.1 1 0.50 0.62 25.6 53.2 472.4 401.4 261.1 201.0 151.1 136.4 2 0.67 0.62 24.0 41.8 455.2 148.4 119.7 100.9 86.5 82.5 3 0.35 0.62 24.0 66.4 531.1 648.5 344.3 258.7 192.8 181.2 4 0.50 0.42 16.5 27.4 491.9 189.9 109.7 86.8 109.7 81.3 5 0.50 0.62 28.6 50.9 1004.7 304.6 224.5 176.8 135.4 118.0 7 0.17 0.62 24.0 128.1 638.0 695.9 784.2 479.2 335.6 400.3 9 0.17 0.62 25.6 82.5 622.4 567.3 319.1 230.1 187.7 197.6
10 0.22 0.62 24.0 75.6 634.7 447.3 258.0 199.2 169.5 176.6 11 0.22 0.62 NA 82.7 636.8 492.6 274.4 206.2 167.4 170.0 12 0.17 0.42 21.0 65.3 649.5 475.6 243.3 176.3 140.5 128.1 13 0.17 0.62 30.1 81.2 609.0 704.3 452.0 293.6 224.7 208.1
* based on weight, Hc=15.03 MJ/kg
In chapter 3.4 it was proposed that the nondimensional variables freeburnQQ max,max /⋅⋅
and
freeburnTT max,max / ∆∆ could be used for analysing the data. Here maxT∆ is the maximum
excess gas temperature ( )( maxmax aTTT −=∆ ). In Table 6 the experimental values of these two variables are given.

32
Table 6 Test results related to reduction of the HRR and gas temperatures.
Test nr
nomwq ,
⋅
(l/min) freeburnQ
Q
max,
max⋅
⋅
freeburnT
T
TT
,3max
3max
∆∆
freeburnT
T
TT
,4max
4max
∆∆
freeburnT
T
TT
,5max
5max
∆∆
freeburT
T
TT
,6max
6max
∆∆
freeburnTavgA
TavgA
TT
,max
max
∆∆
x -> 2.87 m - 2.87 m 3.72m 5.0 m 6.22 m 6.22 m
8 - 1.00 1.00 1.00 1.00 1.00 1.00 1 0.50 0.52 0.75 0.59 0.57 0.70 0.60 2 0.67 0.41 0.72 0.22 0.26 0.35 0.36 3 0.35 0.65 0.84 0.96 0.75 0.90 0.79 4 0.50 0.27 0.78 0.28 0.24 0.30 0.36 5 0.50 0.50 NA 0.45 0.49 0.61 0.52 9 0.17 0.81 0.99 0.84 0.69 0.80 0.87
10 0.22 0.74 1.01 0.66 0.56 0.69 0.77 11 0.22 0.81 1.01 0.73 0.60 0.72 0.75 12 0.17 0.64 1.03 0.70 0.53 0.61 0.56 13 0.17 0.79 0.97 1.04 0.98 1.02 0.91
NA – Not Available 6.3 Gas concentration The only gas concentration, max,iX , that was measured on the downstream side of the fire
source was the oxygen ( 2O ) concentration. The O2, CO and CO2 were measured in the exhaust duct. The oxygen concentration was measured in all of the tests at the centreline of the tunnel and at a height 0.176 m above the floor level at x=3.72 m (pile A). In Table
7 the measured oxygen concentration, 2O , at maximum HRR ( max
⋅Q ) is given in
percentage. The maximum depleted oxygen, max,2O∆ , is the measured concentration subtracted with the ambient oxygen concentration of 20.95 %. The ratio of reduced
depleted oxygen to the depleted freeburn oxygen reduction, freeburnO
O
max,2
max,2
∆∆
, is given in
Table 7 in order to investigate the effects of the water spray system on the gas concentrations. 6.4 Radiation and fire spread The heat flux, fluxq
⋅ , was measured at two different locations, x=3.72 m (flux 1) and
x=6.22 m (flux 2), respectively. The maximum heat flux measured at both locations is given in Table 8. In order to see the reduction of the heat flux due to the water spray system, the measured values were normalized to the freeburn tests with one wood crib (test 8). Observation about if the fire spread to the target is given as well in Table 8. In tests 1-5, i.e. tests with deluge system A, the fire did not spread in any of the tests. In some of the tests, ocular documentation was done of the target when the fire did not spread. This was not systematically done, so there were tests when this was not documented (ND), as can be seen in Table 8.

33
Table 7 The measured oxygen concentration at height 0.176 m above floor
level and 3.72 m from the tunnel entrance (x=6.22 m).
Test nr
nomwq ,
⋅
nomu max
⋅Q
2O max,2O∆
freeburnOO
max,2
max,2
∆∆
l/min m/s kW % % -
x -> 2.87 m 1.15 m - 6.22 m 6.22 m 6.22 m
8 - 0.62 102.2 6.9 14.1 1.00 6 - 0.62 154.2 1.5 19.5 1 0.50 0.62 53.2 13.7 7.2 0.51 2 0.67 0.62 41.8 16.1 4.8 0.34 3 0.35 0.62 66.4 9.0 12.0 0.85 4 0.50 0.42 27.4 15.2 5.7 0.41 5 0.50 0.62 50.9 13.3 7.7 0.55 7 0.17 0.62 128.1 2.9 18.0 9 0.17 0.62 82.5 8.9 12.1 0.86
10 0.22 0.62 75.6 9.9 11.0 0.79 11 0.22 0.62 82.7 9.6 11.4 0.81 12 0.17 0.42 65.3 8.2 12.8 0.91 13 0.17 0.62 81.2 8.4 12.6 0.89
Table 8 Test results of the measured heat flux.
Test nr
nomwq ,
⋅
nomu max
⋅Q
max,fluxq⋅
(flux 1) max,fluxq
⋅
(flux 2) freeburnflux
flux
q
q
,
max,⋅
⋅
freeburnflux
flux
q
q
,
max,⋅
⋅
Fire spread to target
Ocular observation of target after the test
l/min m/s kW kW/m2 kW/m2 - -
x -> 2.87 m 1.15 m - 3.72 m 6.22 m 3.72 m 6.22 m - -
8 - 0.62 102.2 33.3 3.0 1.00 1.00 - - 6 - 0.62 154.2 46.1 13.7 - - yes Burned out
1 0.50 0.62
53.2 4.9 1.7 0.15 0.55 no Slighly charred on upstream top
2 0.67 0.62 41.8 5.6 1.2 0.17 0.41 no No charring
3 0.35 0.62
66.4 11.6 2.4 0.35 0.80 no Extensive
charring on top 4 0.50 0.42 27.4 4.6 0.8 0.14 0.26 no ND 5 0.50 0.62 50.9 7.0 2.0 0.21 0.67 no ND 7 0.17 0.62 128.1 14.4 8.9 - - yes Burned out 9 0.17 0.62 82.5 14.8 2.8 0.44 0.93 - -
10 0.22 0.62 75.6 12.7 3.0 0.38 0.99 - - 11 0.22 0.62 82.7 13.1 2.5 0.39 0.84 no ND 12 0.17 0.42 65.3 13.5 1.3 0.41 0.42 - - 13 0.17 0.62 81.2 30.5 3.2 0.91 1.05 - -
ND – Not Documented

34
7 Discussion of results In the following a comparison of the experimental data is carried out and discussed. The plots presented are mainly based on the data given in Tables 5 – 8 but also on data obtained from the paper by Kung and Hill [6]. The results have been divided into two parts, one with tests carried out with the deluge A system and one with a deluge B system. The deluge A system consisted of 12 nozzles and was located centrally over the ignited wood crib. This system can be regarded as an active fire control system. The deluge B system consists of 4 nozzles and can be regarded as a water curtain system cooling down the bypassing fire gases. 7.1 Comparison with Kung and Hill data For the deluge A system a comparison has been made with the results of Kung and Hill [6]. The results have been plotted in Figure 13 by using the variables in equation (19). As expected when the parameter c, i.e. the fraction of water applied that fell directly through the shafts of the crib, is equal to zero (c=0) the present experimental data does not fit very well. However, if c is chosen as 0.89, we obtain a reasonably good correspondence with the data from Kung and Hill. It is not a perfect match, as can be observed in Figure 13; the slope appears to be slightly less, which can be expected due to the difference in the experimental setup. In Kung and Hills test series the water was applied directly on the crib top by means of a rake consisting of perforated stainless steel tubes (perforated hole diameter of 0.41 mm with distances between them of 12.7 mm and 35 mm, respectively) whereas in the present tests it was applied with means of commercial axial-flow hollow cone nozzles with diameter of 0.25 mm and a c/c distance of 200 mm and a steel plate to protect direct hit on the wood cribs. Therefore it is promising that there exists a vague correlation between the experiments when c is 0.89. The c value was not given in the paper by Kung and Hill, which make this comparison slightly insecure. The conclusion is that there appears to be a vague correspondence in the Kung and Hill data and the results presented here.
0.0
0.2
0.4
0.6
0.8
1.0
0.0 1.0 2.0 3.0 4.0 5.0 6.0 7.0 8.0
(1-c)mw/mf,a
R=(
M0-
Mp-
M)/(
M0(
1-Pr
)-Mp)
Kung and Hill present tests c=0 present tests c=0.89
Figure 13 Comparison of the data presented by Kung and Hill and the results presented in this study (unom=0.62 m/s, test 1,2,3 and 5). The value of c has been arbitrarily chosen in order to fit to their data.

35
The amount of fuel consumed in the present tests is considerably higher than in Kung and Hills experiments. This is mainly due to the lower water flow rates chosen. In the present test series R varies from 0.73 to 0.91 but in Kung and Hills data R varies from 0.037 to 0.647 (when R is equal to one the same amount of fuel from the time of activation, has been consumed with or without a water spray system).
In the following plots of the nondimensional variables freeburnQQ max,max /⋅⋅
,
freeburnTT max,max / ∆∆ , freeburnOO max,2max,2 / ∆∆ and freeburnqq max,max /⋅⋅
versus the
nondimensional water flow variable freeburnw QcQ max,/)1(⋅⋅
− will be presented. The
parameter wQ⋅
is a measure of the water flow rate of the system since www HmQ⋅⋅
=
( 60/,nomww qm⋅⋅
= and 2534=wH kJ/kg). The parameter freeburnQ max,
⋅ was obtained from
test 8, which is based on weighted fuel loss ( cffreeburn HmQ max,max,
⋅⋅= ) using cH =15.03
MJ/kg. 7.2 Plot of data using deluge A system
The nondimensional HRR ratio, freeburnQQ max,max /⋅⋅
, as a function of the nondimensional
water flow variable freeburnw QcQ max,/)1(⋅⋅
− , is plotted in Figure 14. The data is taken for nominal longitudinal flow of 0.62 m/s (3 m/s in large scale) and a steel plate in the ceiling (tests 1,2 and 3) and assuming c=0.89.
0.0
0.2
0.4
0.6
0.8
1.0
0.00 0.01 0.02 0.03 0.04 0.05
(1-c)Qw/Qmax,freeburn
Qm
ax/Q
max
,free
burn
Figure 14 The nondimensional HRR ratio plotted as a function of the
nondimensional water flow variable with longitudinal ventilation rate of 0.62 m/s and a steel plate in the ceiling.

36
Apparently there exists a correlation between the nondimensional HRR ratio
freeburnQQ max,max /⋅⋅
and the nondimensional water flow variable freeburnw QcQ max,/)1(⋅⋅
− when using water flow rates of 0.35, 0.5 and 0.67 l/min. This correlation tends to be linear within the range of water flow rates and longitudinal ventilation rate ( nomu =0.62 m/s) tested. As expected, increasing water flow rate gives more effective reduction of the maximum HRR, at least within the range of tested water flow rates. The tests do not give any information of what might occur for lower water flow rates than 0.35 l/min or higher than 0.67 l/min. In test 4, the nominal longitudinal ventilation rate, nomu , was assumed to be 0.42 m/s (2
m/s) and a nominal water flow rate, nomwq ,
⋅, of 0.5 l/min. The actual average velocity
measured during the test was only 0.21 m/s, see Table 3. In test 5, the nominal ventilation rate was 0.62 m/s and nominal water flow rate 0.5 l/min, but the flanged steel plate was removed from the ceiling. Thus, it is of interest to compare tests 4 and 5 to test 1, which is comparable to these two tests, and see how these parameters affects the efficiency of the deluge system. The results are shown in Figure 15. Apparently, the presence of the flanged steel plate does not have any significant effect on the results. When the longitudinal ventilation rate is reduced from 0.62 m/s down to 0.21 m/s the reduction of the nondimensional HRR ratio become much higher. The water spray system becomes more effective compared when 0.62 m/s were used. The reason for this is probably related to the effects of the velocity on the HRR. Increased longitudinal ventilation tends to give higher HRR for similar conditions as given in these tests [39].
0.0
0.2
0.4
0.6
0.8
1.0
0.00 0.01 0.02 0.03 0.04 0.05
(1-c)Qw/Qmax,freeburn
Qm
ax/Q
max
,free
burn
u=0.62 m/s, plate u=0.62 m/s, no plate u= 0.42 m/s, plate
Figure 15 The nondimensional HRR ratio versus the nondimensional water flow
variable in different longitudinal ventilation rates and existence of a flanged steel plate at the ceiling.
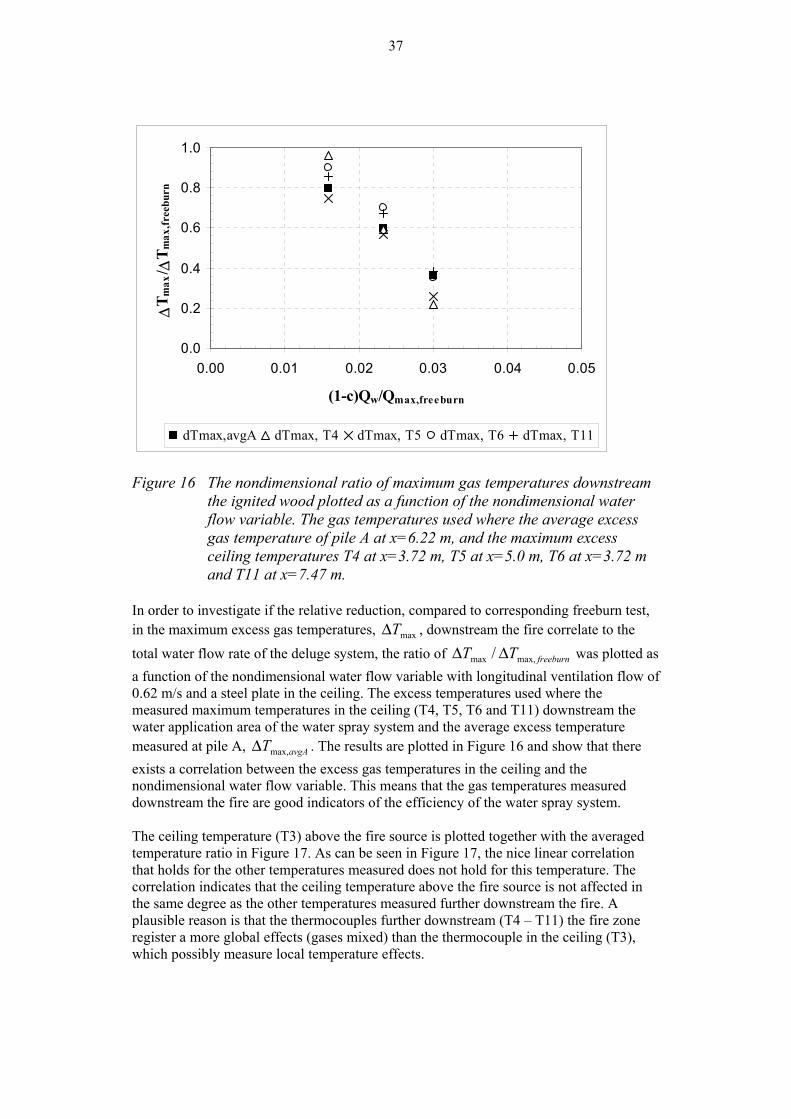
37
0.0
0.2
0.4
0.6
0.8
1.0
0.00 0.01 0.02 0.03 0.04 0.05
(1-c)Qw/Qmax,freeburn
∆T m
ax/ ∆
T max
,free
burn
dTmax,avgA dTmax, T4 dTmax, T5 dTmax, T6 dTmax, T11
Figure 16 The nondimensional ratio of maximum gas temperatures downstream
the ignited wood plotted as a function of the nondimensional water flow variable. The gas temperatures used where the average excess gas temperature of pile A at x=6.22 m, and the maximum excess ceiling temperatures T4 at x=3.72 m, T5 at x=5.0 m, T6 at x=3.72 m and T11 at x=7.47 m.
In order to investigate if the relative reduction, compared to corresponding freeburn test, in the maximum excess gas temperatures, maxT∆ , downstream the fire correlate to the total water flow rate of the deluge system, the ratio of freeburnTT max,max / ∆∆ was plotted as a function of the nondimensional water flow variable with longitudinal ventilation flow of 0.62 m/s and a steel plate in the ceiling. The excess temperatures used where the measured maximum temperatures in the ceiling (T4, T5, T6 and T11) downstream the water application area of the water spray system and the average excess temperature measured at pile A, avgATmax,∆ . The results are plotted in Figure 16 and show that there exists a correlation between the excess gas temperatures in the ceiling and the nondimensional water flow variable. This means that the gas temperatures measured downstream the fire are good indicators of the efficiency of the water spray system. The ceiling temperature (T3) above the fire source is plotted together with the averaged temperature ratio in Figure 17. As can be seen in Figure 17, the nice linear correlation that holds for the other temperatures measured does not hold for this temperature. The correlation indicates that the ceiling temperature above the fire source is not affected in the same degree as the other temperatures measured further downstream the fire. A plausible reason is that the thermocouples further downstream (T4 – T11) the fire zone register a more global effects (gases mixed) than the thermocouple in the ceiling (T3), which possibly measure local temperature effects.

38
0.0
0.2
0.4
0.6
0.8
1.0
0.00 0.01 0.02 0.03 0.04 0.05
(1-c)Qw/Qmax,freeburn
∆T m
ax/ ∆
T max
,free
burn
dTmax,avgA dTmax, T3
Figure 17 The ratio of maximum ceiling gas temperature directly above the ignited wood (T3) to temperatures of corresponding freeburn test as a function of the nondimensional water flow variable. For comparison the corresponding average excess temperature values for pile A are given.
0.0
0.2
0.4
0.6
0.8
1.0
0.00 0.01 0.02 0.03 0.04 0.05
(1-c)Qw/Qmax,freeburn
P/P m
ax, fr
eebu
rn
Q dTavg dO2 qflux
Figure 18 The ratio of maximum values of parameter P to the corresponding
maximum value of freeburn test as a function of the nondimensional water flow variable.

39
A plot of different parameters, P , was done in similar way as shown in Figure 16, i.e. as
a function of the nondimensional water flow variable freeburnw QcQ max,/)1(⋅⋅
− . The
parameters representing P in Figure 18 are; max
⋅Q , maxT∆ , max,2O∆ and max
⋅q . The heat
flux was taken at same location as avgT∆ , 2O∆ , i.e. at pile A (flux 2). There appears to be a very good correlation between the parameters P for the test situation described in this report. The correlation tends to be linear within the water flow rate range tested. This indicates that it is possible to use one of these instruments, especially if HRR measurements are lacking, to measure the efficiency of the water spray system. This could be of importance to know when doing large scale tests with water spray systems were the instrumentation is limited. If we assume that the trend of the line in Figure 18 is linear all the way down to zero, i.e. we extrapolate the trend of the curve,
we can see it will intersect the x-axis when 04.0/)1( max, ≈−⋅⋅
freeburnw QcQ . An
interesting observation is that if we put the numerical values known ( wH =2536 kJ/kg,
freeburnQmax,
⋅=102.2 kW and sA =0.56 m2) into this equation we obtain
scrwscwcrw AmcAmm /)1(/ ,,
"
,
⋅⋅⋅−== =0.0028 kg/m2 s =2.8 g/m2 s. This number can be
compared to what Heskestad [11] presented as critical water flow rate, "
,crwm⋅
. This value varied between 1.3 – 3 g/m2 s for numerous investigations with wood. If this is a corresponding value, the nominal critical flow rate which would be needed to extinguish
the wood crib used here is; 60,, ⋅=⋅⋅
crwcrw mq =0.0028 )1/(60 cAs −⋅⋅ =0.86 l/min.
0.0
0.2
0.4
0.6
0.8
1.0
0.00 0.01 0.02 0.03 0.04 0.05
(1-c)Qw/Qmax,freeburn
R=(
M0-
Mp-
M)/(
M0(
1-Pr
)-Mp)
Figure 19 The ratio R versus the nondimensional water flow variable for tests
with a nominal longitudinal flow of 0.62 m/s and a steel plate in the ceiling.

40
During the test series with longitudinal flow of 0.62 m/s, the wood crib mass after each test was weighted ( M ) in dried conditions. The measured values can be found in Table 3, where the ratio ))1(/()( 00 prp MPMMMMR −−−−= is plotted as a function of the nondimensional water flow variable. It is apparent that for the test conditions represented here that the nondimensional HRR, gas temperature, fuel consumption, oxygen depletion and heat flux downstream the fire, all correlate to the nondimensional
water flow variable freeburnw QcQ max,/)1(⋅⋅
− . This is valid for locations where the instruments are not directly hit by the water spray droplets. The parameter c needs to experimentally determined for each test setup. These results are of great importance for designing and evaluate large scale tests for water spray systems in tunnels. 7.3 Deluge system B In the following a similar analysis is carried out for the deluge B system which is a water curtain system for cooling of the hot fire gases. Tests 9 to 12, were all carried out with the deluge system downstream the ignited wood crib. The system consisted of 4 nozzles with the centre of the 4 nozzles about 0.3 m from the downstream edge of the ignited wood crib. The system was tested with two different nominal flow rates, 0.17 l/min and 0.22 l/min (431 l/min and 558 l/min). In test 13, four nozzles were mounted upstream the ignited wood crib. The main reason was to observe if there would be any cooling effects of the water curtain on the HRR in nominal longitudinal flow of 0.62 m/s. In test 7 the fire spread to the target (0.17 l/min), whereas in test 11 (0.22 l/min) it did not. This gives an indication of the water flow rate needed to prevent the fire spread using water curtains.
0.0
0.2
0.4
0.6
0.8
1.0
0.00 0.01 0.02 0.03 0.04 0.05
(1-c)Qw/Qmax,freeburn
∆T m
ax,a
vg/ ∆
T max
,avg
,free
burn
4 nozzles downstream 4 nozzels upstream 12 nozzles
Figure 20 Comparison of the deluge A system (12 nozzles) and the deluge B system (4 nozzles).
The nondimensional excess temperature ratio versus the nondimensional water flow variable of 4 nozzles mounted both upstream and downstream of the ignited wood crib, is shown in Figure 20. The trend is similar here, i.e. the cooling of the relative temperature tends to follow the same linear dependence as in the tests with 12 nozzles. The cooling effects appear although to be more efficient, which can be seen if the water flow rate is plotted together with data with the deluge A system.

41
8 Conclusions The report contains a literature survey of the use of water spray systems in tunnels and an experimental model scale study of efficiency of such system in a longitudinal tunnel flow. Arguments for using or not using water spray systems are presented, as well as an overview of were such systems have been installed and the experience of using such systems. A summary of available research related testing of water spray systems is given as well. Based on the literature study it can be concluded that the adverse results from the Ofenegg tests had a major impact on the potential use of water spray systems in tunnels in large parts of the world. None of the adverse effects similar to the one obtained in the Ofenegg tests, except for the visibility reduction, were observed in any of the other large scale tests presented. The reduction in visibility is a problem that is universal when sprinkler systems are used, even in buildings, but it has never been a debated issue. The controversy about the reduction in visibility can be solved for tunnels by delaying the activation of the systems or at least until the safety of those who need to evacuate is secured. There are few technical arguments found in this survey which would not advocate the use of water spray systems (with or without foam additives) in highly trafficated road tunnels. The question of investment and maintenance costs of such systems has not been considered here. Japan has carried out a systematic and resolute work in order to obtain an optimized water spray systems that are confident for their needs. Experience from Japan, both in terms of writing guidelines, designing systems and actually using fixed water spray system in road tunnels, is unique in the world. Results from the model scale study presented, show that no fire spread occurred to the target in the case with nominal water flow rate equal or higher than 0.35 l/min and a deluge system A (12 nozzles). The target was charred in the tests with 0.35 and 0.5 l/min but not with 0.67 l/min. The critical water flow rate for extinction using deluge system A was estimated to be 0.86 l/min or higher. When using water curtains (deluge B system) the fire spread to the target using 17 l/min but not when using 0.22 l/min. The tests show that the nondimensional ratio of HRR, excess gas temperature, fuel consumption, oxygen depletion and heat flux downstream the fire, all correlate well to the
nondimensional water flow variable freeburnw QcQ max,/)1(⋅⋅
− . This is valid for locations where the instruments are not directly hit by the water spray droplets. Further, there appears to be a vague correspondence in the Kung and Hill [6] data and the results presented here if the parameter c is put equal to 0.89.

42
9 References 1. Ingason, H., "Fire Development in Catastrophic Tunnel Fires (CTF)",
International Symposium on Catastrophic Tunnel Fires (CTF), 31-47, Borås, Sweden, 20-21 November, 2003.
2. Beard, A. N., and Carvel, R. O., Eds., "The handbook of tunnel fire safety," Thomas Telford Publishing, London, 2005.
3. Ingason, H., and Lönnermark, A., "Heat Release Rates from Heavy Goods Vehicle Trailers in Tunnels", Fire Safety Journal, 40, 646-668, 2005.
4. Lönnermark, A., and Ingason, H., "Gas Temperatures in Heavy Goods Vehicle Fires in Tunnels", Fire Safety Journal, 40, 506-527, 2005.
5. Kung, H.-C., "Cooling of Room Fires by Sprinkler Spray", Jounal of Heat Transfer, 99, No. 3, 353 - 359, August 1977.
6. Kung, H.-C., and Hill, J. P., "Extinction of Wood Crib and Pallet Fires", Combustion and Flame, 24, 305 - 317, 1975.
7. Tamanini, F., "The Application of Water Sprays to the Extinguishemnt of Crib Fires", Combustion Science and Technology, 14, p. 17, 1976.
8. Rasbash, D. J., Rogowski, Z. W., and Stark, G. W. V., "Mechanisms of Extinction of Liquid Fires and Water Sprays", Combustion and Flame, 4, 223-234, 1960.
9. Heskestad, G., "Extinction of gas and liquid pool fires with water spray", Fire Safety Journal, 38, 301-317, 2003.
10. Grant, G., Brenton, J., and Drysdale, D., "Fire Suppression by Water Sprays", Progress in Energy and Combustion Science, 26, 79-130, 2000.
11. Heskestad, G., "The role of water in suppression of fire: A Review", Journal of Fire and Flammability, 11, p. 254, 1980.
12. "Schlussbericht der Versuche im Ofenegg Tunnel von 17.5 - 31.5 1965", Kommission für Sicherheitsmassnahmen in Strassentunneln, 1965.
13. Haerter, A., "Fire Tests in the Ofenegg-Tunnel in 1965", International Conference on Fires in Tunnels, SP REPORT 1994:54, 195-214, Borås, Sweden, 10-11 October, 1994.
14. "Fire and Smoke Control in Road Tunnels", PIARC, 05.05B-1999, 1999. 15. NFPA 502, "Road Tunnels, Bridges, and Other Limited Access Highways", 2001
ed., National Fire Protection Association, 2001. 16. OTA, O., "Automatic fire extinction (sprinkler) system", OTA Engineering,
Tokyo, Japan, December 2001. 17. H.K. Kim, A. Lönnermark, and Ingason, H., "Comparison and Review of Safety
Design Guidelines for Road Tunnels", SP Swedish National Testing and Research Instititue, Under preparation, 2006.
18. Stroeks, R., "Sprinklers in Japanese Road Tunnels", Bouwdienst Rijkswaterstaat, Directoraat-Generaal Rijkswaterstaat, Ministry of Transport, The Netherlands, Project Report BFA-10012, 2001.
19. "State of the Road Tunnel Equipment in Japan - Ventilation, Lighting, Safety Equipment", Public Works Research Institute, Technical note, Vol. 61, Japan, 1993.
20. Kunikane, Y., Kawabata, N., Takekuni, K., and Shimoda, A., "Heat Release Rate Induced by Gasoline Pool Fire in a Large-Cross-Section Tunnel", 4th Int. Conf. Tunnel Fires, 387-396, Basel, Switzerland, 2-4 December, 2002.
21. Kunikane, Y., Kawabata, N., Okubo, K., and Shimoda, A., "Behaviour of Fire Plume in a Large Cross Sectional Tunnel", 11th Int. Symp. on AVVT, 78 - 93, Luzern, Switzerland, 2003.
22. Kunikane, Y., Kawabata, N., Ishikawa, T., Takekuni, K., and Shimoda, A., "Thermal Fumes and Smoke Induced by Bus Fire Accident in Large Cross

43
Sectional Tunnel", The fifth JSME-KSME Fluids Engineering Conference, Nagoya, Japan, 17-21 November, 2002.
23. "Memorial Tunnel Fire Ventilation Test Program - Test Report", Massachusetts Highway Department and Federal Highway Administration, 1995.
24. Lemaire, A., van de Leur, P. H. E., and Kenyon, Y. M., "Safety Proef: TNO Metingen Beneluxtunnel - Meetrapport", TNO, TNO-Rapport 2002-CVB-R05572, 2002.
25. T. Lemaire, and Kenyon, Y., "Large Scale Fire Tests in the Second Benelux Tunnel", Fire Technology, 42, 329-350, 2006.
26. K. Opstad, J.P. Stensaas, and Brandt, A. W., "Fire mitigation in tunnels, experimental results obtained in the Uptun project", 2nd Int. Symp. on Tunnel Safety and Security, March 15-17, Madrid, Spain, 2006.
27. Tuomisaari, M., "Tunnel Fire Protection, HI-FOG concept for road and railway tunnesl", International Symposium on Catastrophic Tunnel Fires (CTF), SP Report 2004:05, Borås, 2003.
28. Guigas, X., and Weatherill, A., "Dynamic fire spreading and water mist tests for the A86 East Tunnel", Fires in Tunnels - Fifth International Conference, 261-270, 25-27 October, London, 2004.
29. Arvidson, M., "Alternative Fire Sprinkler Systems for Roadway Tunnels", Proceedings of the International Symposium on Catastrophic Tunnel Fires, 193-201, Borås, Sweden, 20-21 November, 2003.
30. Heskestad, G., "Modeling of Enclosure Fires", Proceedings of the Fourteenth Symposium (International) on Combustion, 1021-1030, The Pennsylvania State University, USA, August, 1972.
31. Quintiere, J. G., "Scaling Applications in Fire Research", Fire Safety Journal, 15, 3-29, 1989.
32. Saito, N., Yamada, T., Sekizawa, A., Yanai, E., Watanabe, Y., and Miyazaki, S., "Experimental Study on Fire Behavior in a Wind Tunnel with a Reduced Scale Model", Second International Conference on Safety in Road and Rail Tunnels, 303-310, Granada, Spain, 3-6 April, 1995.
33. Heskestad, G., "Physical Modeling of Fire", Journal of Fire & Flammability, Vol. 6, p. 253 - 273, 1975.
34. Heskestad, G., "Scaling the interaction of water sprays and flames", Fire Safety Journal, 37, 535-548, 2002.
35. Tewarson, A., "Generation of Heat and Chemical Compounds in Fires". In The SFPE Handbook of Fire Protection Engineering (P. J. DiNenno, D. Drysdale, C. L. Beyler, W. D. Walton, R. L. P. Custer, J. R. Hall, and J. M. Watts, Eds.), National Fire Protection Association, 3-82 -- 3-161, Quincy, MA, USA, 2002.
36. Janssens, M., and Parker, W. J., "Oxygen Consumption Calorimetry". In Heat Release in Fires (V. Babrauskas and T. J. Grayson, Eds.), E & FN Spon, 31-59, London, UK, 1995.
37. Ingason, H., "Fire Dynamics in Tunnels". In The Handbook of Tunnel Fire Safety (R. O. Carvel and A. N. Beard, Eds.), Thomas Telford Publishing, 231-266, London, 2005.
38. McCaffrey, B. J., and Heskestad, G., "Brief Communications: A Robust Bidirectional Low-Velocity Probe for Flame and Fire Application", Combustion and Flame, 26, 125-127, 1976.
39. Ingason, H., "Model Scale Tunnel Fire Tests - Longitudinal ventilation", SP Swedish National Testing and Research Institute, SP REPORT 2005:49, Borås, Sweden, 2005.

44
Appendix Test Results Figure A1 Measured energy released of the initial wood crib, gas concentrations, heat
fluxes, air flow and gas temperatures in Test 1.
Temperature 0,035 m under the ceiling
0
200
400
600
800
1000
1200
0 5 10 15
time (min)
Gas
tem
pera
ture
(o C) T3
T4T5T6T11T12
Temperature x=6,22 m (pile A)
0
50
100
150
200
250
0 5 10 15
time (min)
Gas
tem
peat
ure
(o C)
T6T7T8T9T10
Heat Release Rate (kW)
0
50
100
150
200
250
0 5 10 15
time (min)
HRR
(kw
)
HRR weightHRR O2 exhaust
air mass flow rate
0
0.05
0.1
0.15
0.2
0.25
0.3
0 5 10 15
time (min)
mas
s flo
w r
ate
(kg/
s)
upstreamexhaust
Heat Radiation (kW/m2)
0
1
2
3
4
5
6
0 5 10 15
time (min)
Hea
t flu
x (k
w/m
2 )
Flux 1Flux 2Flux 3
Velocity
0.001.002.003.004.005.006.007.00
0 5 10 15
time (min)
velo
city
(m/s
)
upstreamexhaust
O2
0
5
10
15
20
25
0 5 10 15
time (min)
Oxy
gen
(%)
O2 - 0.88 H - pile AO2 - exhaust
CO2-CO
0
5
10
15
20
25
0 5 10 15
time (min)
Gas
con
cent
ratio
n (%
)
CO2 - 0.88 H - pile ACO - 0.88 H - pile A

45
Figure A2 Measured energy released of the initial wood crib, gas concentrations, heat
fluxes, air flow and gas temperatures in Test 2 (note: oscillations in the exhaust ventilation system)..
Temperature 0,035 m under the ceiling
0
200
400
600
800
1000
1200
0 5 10 15
time (min)
Gas
tem
pera
ture
(o C) T3
T4T5T6T11T12
Temperature x=6,22 m (pile A)
0
50
100
150
200
0 5 10 15
time (min)
Gas
tem
peat
ure
(o C)
T6T7T8T9T10
Heat Release Rate (kW)
0
50
100
150
200
250
0 5 10 15
time (min)
HR
R (k
w) HRR weight
HRR O2 CO2exhaust
air mass flow rate
0
0.05
0.1
0.15
0.2
0.25
0.3
0 5 10 15
time (min)
mas
s flo
w r
ate
(kg/
s)
upstreamexhaust
Heat Radiation (kW/m2)
0
1
2
3
4
5
6
0 5 10 15
time (min)
Heat
flux
(kw
/m2 )
Flux 1Flux 2Flux 3
Velocity
0.001.002.003.004.005.006.007.00
0 5 10 15
time (min)
velo
city
(m/s
)
upstreamexhaust
O2
0
5
10
15
20
25
0 5 10 15
time (min)
Oxy
gen
(%)
O2 - 0.88 H - pile AO2 - exhaust
CO2-CO
0
5
10
15
20
25
0 5 10 15
time (min)
Gas
con
cent
ratio
n (%
)CO2 - exhaustCO - exhaust

46
Figure A3 Measured energy released of the initial wood crib, gas concentrations, heat
fluxes, air flow and gas temperatures in Test 3.
Heat Release Rate (kW)
0
50
100
150
200
250
0 5 10 15
time (min)
HR
R (k
w) HRR weight
HRR O2 CO2exhaust
air mass flow rate
0
0.05
0.1
0.15
0.2
0.25
0.3
0 5 10 15
time (min)
mas
s flo
w r
ate
(kg/
s)
upstreamexhaust
Heat Radiation (kW/m2)
02468
101214
0 5 10 15
time (min)
Heat
flux
(kw
/m2 )
Flux 1Flux 2Flux 3
Velocity
0.001.002.003.004.005.006.007.00
0 5 10 15
time (min)
velo
city
(m/s
)
upstreamexhaust
O2
0
5
10
15
20
25
0 5 10 15
time (min)
Oxy
gen
(%)
O2 - 0.88 H - pile AO2 - exhaust
CO2-CO
0
5
10
15
20
25
0 5 10 15
time (min)
Gas
con
cent
ratio
n (%
)
CO2 - exhaustCO - exhaust
Temperature 0,035 m under the ceiling
0
200
400
600
800
1000
1200
0 5 10 15
time (min)
Gas
tem
pera
ture
(o C) T3
T4T5T6T11T12
Temperature x=6,22 m (pile A)
0
50
100
150
200
250
300
0 5 10 15
time (min)
Gas
tem
peat
ure
(o C)
T6T7T8T9T10

47
Figure A4 Measured energy released of the initial wood crib, gas concentrations, heat
fluxes, air flow and gas temperatures in Test 4.
Heat Release Rate (kW)
0
50
100
150
200
250
0 5 10 15
time (min)
HR
R (k
w) HRR weight
HRR O2 CO2exhaust
air mass flow rate
0
0.05
0.1
0.15
0.2
0.25
0.3
0 5 10 15
time (min)
mas
s flo
w r
ate
(kg/
s)
upstreamexhaust
Heat Radiation (kW/m2)
0
1
2
3
4
5
0 5 10 15
time (min)
Heat
flux
(kw
/m2 )
Flux 1Flux 2Flux 3
Velocity
0.00
0.10
0.20
0.30
0.40
0.50
0 5 10 15
time (min)
velo
city
(m/s
)
upstreamexhaust
O2
0
5
10
15
20
25
0 5 10 15
time (min)
Oxy
gen
(%)
O2 - 0.88 H - pile AO2 - exhaust
CO2-CO
0
5
10
15
20
25
0 5 10 15
time (min)
Gas
con
cent
ratio
n (%
)
CO2 -exhaustCO - exhaust
Temperature 0,035 m under the ceiling
0
200
400
600
800
1000
1200
0 5 10 15
time (min)
Gas
tem
pera
ture
(o C) T3
T4T5T6T11T12
Temperature x=6,22 m (pile A)
0
20
40
60
80
100
120
0 5 10 15
time (min)
Gas
tem
peat
ure
(o C)
T6T7T8T9T10

48
Figure A5 Measured energy released of the initial wood crib, gas concentrations, heat
fluxes, air flow and gas temperatures in Test 5.
Heat Release Rate (kW)
0
50
100
150
200
250
0 5 10 15
time (min)
HR
R (k
w) HRR weight
HRR O2 CO2exhaust
air mass flow rate
0
0.05
0.1
0.15
0.2
0.25
0.3
0 5 10 15
time (min)
mas
s flo
w r
ate
(kg/
s)
upstreamexhaust
Heat Radiation (kW/m2)
012345678
0 5 10 15
time (min)
Heat
flux
(kw
/m2 )
Flux 1Flux 2Flux 3
Velocity
0.001.002.003.004.005.006.007.00
0 5 10 15
time (min)
velo
city
(m/s
)
upstreamexhaust
O2
0
5
10
15
20
25
0 5 10 15
time (min)
Oxy
gen
(%)
O2 - 0.88 H - pile AO2 - exhaust
CO2-CO
0
5
10
15
20
25
0 5 10 15
time (min)
Gas
con
cent
ratio
n (%
)CO2 - exhaustCO - exhaust
Temperature 0,035 m under the ceiling
0
200
400
600
800
1000
1200
0 5 10 15
time (min)
Gas
tem
pera
ture
(o C) T3
T4T5T6T11T12
Temperature x=6,22 m (pile A)
0
50
100
150
200
250
0 5 10 15
time (min)
Gas
tem
peat
ure
(o C)
T6T7T8T9T10

49
Figure A6 Measured energy released of the initial wood crib, gas concentrations, heat
fluxes, air flow and gas temperatures in Test 6 (freeburn with two wood cribs).
Heat Release Rate (kW)
0
50
100
150
200
250
0 5 10 15
time (min)
HR
R (k
w) HRR weight
HRR O2 CO2exhaust
air mass flow rate
0
0.05
0.1
0.15
0.2
0.25
0.3
0 5 10 15
time (min)
mas
s flo
w r
ate
(kg/
s)
upstreamexhaust
Heat Radiation (kW/m2)
0
10
20
30
40
50
0 5 10 15
time (min)
Heat
flux
(kw
/m2 )
Flux 1Flux 2Flux 3
Velocity
0.001.002.003.004.005.006.007.00
0 5 10 15
time (min)
velo
city
(m/s
)
upstreamexhaust
O2
0
5
10
15
20
25
0 5 10 15
time (min)
Oxy
gen
(%)
O2 - 0.88 H - pile AO2 - exhaust
CO2-CO
0
5
10
15
20
25
0 5 10 15
time (min)G
as c
once
ntra
tion
(%)
CO2 - exhaustCO - exhaust
Temperature 0,035 m under the ceiling
0
200
400
600
800
1000
1200
0 5 10 15
time (min)
Gas
tem
pera
ture
(o C) T3
T4T5T6T11T12
Temperature x=6,22 m (pile A)
0
100
200
300
400
500
600
0 5 10 15
time (min)
Gas
tem
peat
ure
(o C)
T6T7T8T9T10

50
Figure A7 Measured energy released of the initial wood crib, gas concentrations, heat
fluxes, air flow and gas temperatures in Test 7 (note: oscillations in the exhaust ventilation system).
Temperature 0,035 m under the ceiling
0
200
400
600
800
1000
1200
0 5 10 15
time (min)
Gas
tem
pera
ture
(o C
)
T3T4T5T6T11T12
Temperature x=6,22 m (pile A)
0
100
200
300
400
500
600
0 5 10 15
time (min)
Gas
tem
peat
ure
(o C)
T6T7T8T9T10
Heat Release Rate (kW)
0
50
100
150
200
250
0 5 10 15
time (min)
HR
R (k
w) HRR weight
HRR O2 CO2exhaust
air mass flow rate
0
0.05
0.1
0.15
0.2
0.25
0.3
0 5 10 15
time (min)
mas
s flo
w r
ate
(kg/
s)
upstreamexhaust
Heat Radiation (kW/m2)
0
5
10
15
20
25
0 5 10 15
time (min)
Heat
flux
(kw
/m2 )
Flux 1Flux 2Flux 3
Velocity
0.001.002.003.004.005.006.007.00
0 5 10 15
time (min)
velo
city
(m/s
)
upstreamexhaust
O2
0
5
10
15
20
25
0 5 10 15
time (min)
Oxy
gen
(%)
O2 - 0.88 H - pile AO2 - exhaust
CO2-CO
0
5
10
15
20
25
0 5 10 15
time (min)G
as c
once
ntra
tion
(%)
CO2 - exhaustCO - exhaust

51
Figure A8 Measured energy released of the initial wood crib, gas concentrations, heat
fluxes, air flow and gas temperatures in Test 8 (feeburn with one wood crib).
Heat Release Rate (kW)
0
50
100
150
200
250
0 5 10 15
time (min)
HR
R (k
w)
HRR weightHRR O2 exhaust
air mass flow rate
0
0.05
0.1
0.15
0.2
0.25
0.3
0 5 10 15
time (min)
mas
s flo
w r
ate
(kg/
s)
upstreamexhaust
Heat Radiation (kW/m2)
05
10152025303540
0 5 10 15
time (min)
Heat
flux
(kw
/m2 )
Flux 1Flux 2Flux 3
Velocity
0.001.002.003.004.005.006.007.00
0 5 10 15
time (min)
velo
city
(m/s
)
upstreamexhaust
O2
0
5
10
15
20
25
0 5 10 15
time (min)
Oxy
gen
(%)
O2 - 0.88 H - pile A
Temperature 0,035 m under the ceiling
0
200
400
600
800
1000
1200
0 5 10 15
time (min)
Gas
tem
pera
ture
(o C) T3
T4T5T6T11T12
Temperature x=6,22 m (pile A)
050
100150200250300350
0 5 10 15
time (min)
Gas
tem
peat
ure
(o C)
T6T7T8T9T10

52
Figure A9 Measured energy released of the initial wood crib, gas concentrations, heat
fluxes, air flow and gas temperatures in Test 9.
Heat Release Rate (kW)
0
50
100
150
200
250
0 5 10 15
time (min)
HR
R (k
w) HRR weight
HRR O2 CO2exhaust
air mass flow rate
0
0.05
0.1
0.15
0.2
0.25
0.3
0 5 10 15
time (min)
mas
s flo
w r
ate
(kg/
s)
upstreamexhaust
Heat Radiation (kW/m2)
02468
10121416
0 5 10 15
time (min)
Heat
flux
(kw
/m2 )
Flux 1Flux 2Flux 3
Velocity
0.001.002.003.004.005.006.007.00
0 5 10 15
time (min)
velo
city
(m/s
)
upstreamexhaust
O2
0
5
10
15
20
25
0 5 10 15
time (min)
Oxy
gen
(%)
O2 - 0.88 H - pile AO2 - exhaust
CO2-CO
0
5
10
15
20
25
0 5 10 15
time (min)G
as c
once
ntra
tion
(%)
CO2 - exhaustCO - exhaust
Temperature 0,035 m under the ceiling
0
200
400
600
800
1000
1200
0 5 10 15
time (min)
Gas
tem
pera
ture
(o C
)
T3T4T5T6T11T12
Temperature x=6,22 m (pile A)
0
50
100
150
200
250
300
0 5 10 15
time (min)
Gas
tem
peat
ure
(o C)
T6T7T8T9T10

53
Figure A10 Measured energy released of the initial wood crib, gas concentrations, heat
fluxes, air flow and gas temperatures in Test 10.
Heat Release Rate (kW)
0
50
100
150
200
250
0 5 10 15
time (min)
HR
R (k
w) HRR weight
HRR O2 CO2exhaust
air mass flow rate
0
0.05
0.1
0.15
0.2
0.25
0.3
0 5 10 15
time (min)
mas
s flo
w r
ate
(kg/
s)
upstreamexhaust
Heat Radiation (kW/m2)
02468
101214
0 5 10 15
time (min)
Heat
flux
(kw
/m2 )
Flux 1Flux 2Flux 3
Velocity
0.001.002.003.004.005.006.007.00
0 5 10 15
time (min)
velo
city
(m/s
)
upstreamexhaust
O2
0
5
10
15
20
25
0 5 10 15
time (min)
Oxy
gen
(%)
O2 - 0.88 H - pile AO2 - exhaust
CO2-CO
0
5
10
15
20
25
0 5 10 15
time (min)
Gas
con
cent
ratio
n (%
)
CO2 - exhaustCO - exhaust
Temperature 0,035 m under the ceiling
0
200
400
600
800
1000
1200
0 5 10 15
time (min)
Gas
tem
pera
ture
(o C) T3
T4T5T6T11T12
Temperature x=6,22 m (pile A)
0
50
100
150
200
250
0 5 10 15
time (min)
Gas
tem
peat
ure
(o C)
T6T7T8T9T10

54
Figure A11 Measured energy released of the initial wood crib, gas concentrations, heat
fluxes, air flow and gas temperatures in Test 11.
Heat Release Rate (kW)
0
50
100
150
200
250
0 5 10 15
time (min)
HR
R (k
w) HRR weight
HRR O2 CO2exhaust
air mass flow rate
0
0.05
0.1
0.15
0.2
0.25
0.3
0 5 10 15
time (min)
mas
s flo
w r
ate
(kg/
s)
upstreamexhaust
Heat Radiation (kW/m2)
02468
101214
0 5 10 15
time (min)
Heat
flux
(kw
/m2 )
Flux 1Flux 2Flux 3
Velocity
0.001.002.003.004.005.006.007.00
0 5 10 15
time (min)
velo
city
(m/s
)
upstreamexhaust
O2
0
5
10
15
20
25
0 5 10 15
time (min)
Oxy
gen
(%)
O2 - 0.88 H - pile AO2 - exhaust
CO2-CO
0
5
10
15
20
25
0 5 10 15
time (min)G
as c
once
ntra
tion
(%)
CO2 - exhaustCO - exhaust
Temperature 0,035 m under the ceiling
0
200
400
600
800
1000
1200
0 5 10 15
time (min)
Gas
tem
pera
ture
(o C
)
T3T4T5T6T11T12
Temperature x=6,22 m (pile A)
0
50
100
150
200
250
0 5 10 15
time (min)
Gas
tem
peat
ure
(o C)
T6T7T8T9T10

55
Figure A12 Measured energy released of the initial wood crib, gas concentrations, heat
fluxes, air flow and gas temperatures in Test 12.
Heat Release Rate (kW)
0
50
100
150
200
250
0 5 10 15
time (min)
HR
R (k
w) HRR weight
HRR O2 CO2exhaust
air mass flow rate
0
0.05
0.1
0.15
0.2
0.25
0.3
0 5 10 15
time (min)
mas
s flo
w r
ate
(kg/
s)
upstreamexhaust
Heat Radiation (kW/m2)
02468
10121416
0 5 10 15
time (min)
Heat
flux
(kw
/m2 )
Flux 1Flux 2Flux 3
Velocity
0.001.002.003.004.005.006.007.00
0 5 10 15
time (min)
velo
city
(m/s
)
upstreamexhaust
O2
0
5
10
15
20
25
0 5 10 15
time (min)
Oxy
gen
(%)
O2 - 0.88 H - pile AO2 - exhaust
CO2-CO
0
5
10
15
20
25
0 5 10 15
time (min)G
as c
once
ntra
tion
(%)
CO2 - exhaustCO - exhaust
Temperature 0,035 m under the ceiling
0
200
400
600
800
1000
1200
0 5 10 15
time (min)
Gas
tem
pera
ture
(o C
)
T3T4T5T6T11T12
Temperature x=6,22 m (pile A)
0
50
100
150
200
250
0 5 10 15
time (min)
Gas
tem
peat
ure
(o C)
T6T7T8T9T10

56
Figure A13 Measured energy released of the initial wood crib, gas concentrations, heat
fluxes, air flow and gas temperatures in Test 13.
Heat Release Rate (kW)
0
50
100
150
200
250
0 5 10 15
time (min)
HR
R (k
w) HRR weight
HRR O2 CO2exhaust
air mass flow rate
0
0.05
0.1
0.15
0.2
0.25
0.3
0 5 10 15
time (min)
mas
s flo
w r
ate
(kg/
s)
upstreamexhaust
Heat Radiation (kW/m2)
05
101520253035
0 5 10 15
time (min)
Heat
flux
(kw
/m2 )
Flux 1Flux 2Flux 3
Velocity
0.001.002.003.004.005.006.007.00
0 5 10 15
time (min)
velo
city
(m/s
)
upstreamexhaust
O2
0
5
10
15
20
25
0 5 10 15
time (min)
Oxy
gen
(%)
O2 - 0.88 H - pile AO2 - exhaust
CO2-CO
0
5
10
15
20
25
0 5 10 15
time (min)G
as c
once
ntra
tion
(%)
CO2 - exhaustCO - exhaust
Temperature 0,035 m under the ceiling
0
200
400
600
800
1000
1200
0 5 10 15
time (min)
Gas
tem
pera
ture
(o C
)
T3T4T5T6T11T12
Temperature x=6,22 m (pile A)
050
100150200250300350
0 5 10 15
time (min)
Gas
tem
peat
ure
(o C)
T6T7T8T9T10

SP Fire TechnologySP REPORT 2006:56ISBN 91-85533-49-1ISSN 0284-5172
SP Swedish National Testing and Research Institute develops and transfers
technology for improving competitiveness and quality in industry, and for safety,
conservation of resources and good environment in society as a whole. With
Swedens widest and most sophisticated range of equipment and expertise for
technical investigation, measurement, testing and certfi cation, we perform
research and development in close liaison with universities, institutes of technology
and international partners.
SP is a EU-notifi ed body and accredited test laboratory. Our headquarters are in
Borås, in the west part of Sweden.
SP Swedish National Testing and Research InstituteBox 857SE-501 15 BORÅS, SWEDENTelephone: + 46 33 16 50 00, Telefax: +46 33 13 55 02E-mail: [email protected], Internet: www.sp.se