OMSAN LOJİSTİK. Management Applications of Performance Metrics 1.Track progress 2.Benchmarking...
33
OMSAN LOJİSTİK
-
Upload
edgar-daniel -
Category
Documents
-
view
227 -
download
0
Transcript of OMSAN LOJİSTİK. Management Applications of Performance Metrics 1.Track progress 2.Benchmarking...

OMSAN LOJİSTİK
Management Applications of Performance Metrics
1. Track progress2. Benchmarking3. Investment justification4. Gain perspective on business and solutions
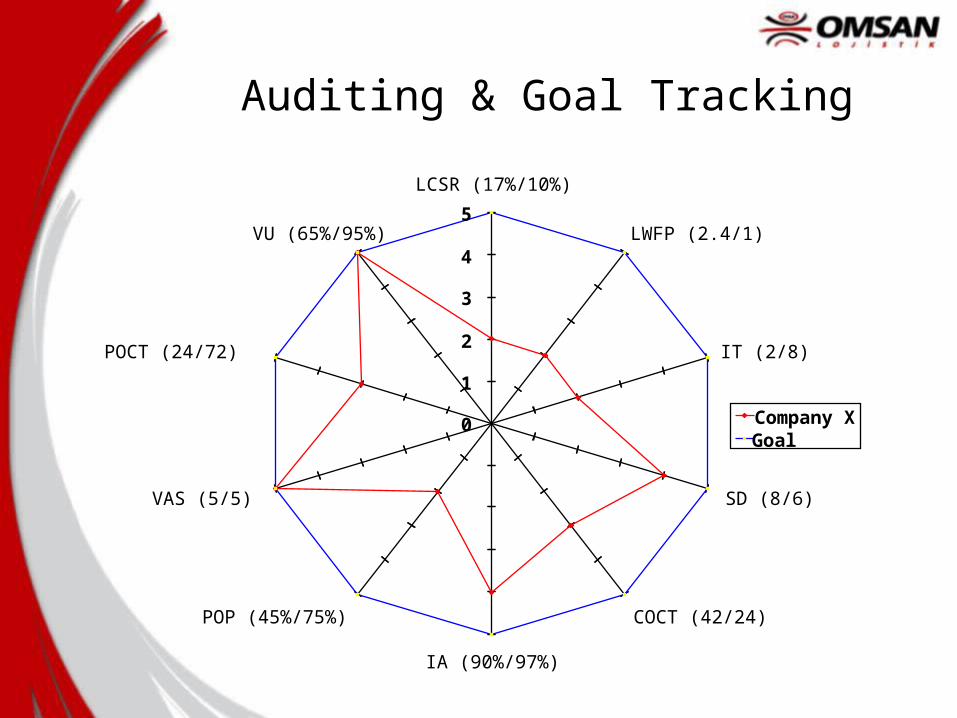
Auditing & Goal Tracking
POCT (24/72)
VU (65%/95%)
COCT (42/24)
LCSR (17%/10%)
LWFP (2.4/1)
IT (2/8)
SD (8/6)
IA (90%/97%)
POP (45%/75%)
VAS (5/5)
0
1
2
3
4
5
Company XGoal
Benchmarking Corporate Performance Measures
• Process vs. Performance Benchmarking• Internal vs. External Benchmarking• Public vs. Private vs. Competitive Benchmarking
Major Issues in Benchmarking• Selecting Partners• Selecting KPIs• Comparability Issues

Cost Components 1975
Transportation
Inventory Carrying Charges
Warehousing
Admin. / Order Processing
$.068
$.058
$.048
$.015
$.035
$.020
$.024
$.016
TOTALS $.189 $.095
Herbert W. Davis, 2003
2003
$.033
$.021
$.020
$.012
$.086
2003
Average Mfg
Example of Public Benchmarking: Logistics Cost Components

The AMAT benchmarking exercise story: from public to private, from
standard to normalized…• Increasing top management concern over inventory
planning and financial implications• Decision to evaluate current performance at similar
companies and operations• AMAT Inventory Turns = 1.8• AMAT Line Fill Rate = 92%• Logistics at AMAT qualified as a support organization for
service parts in the high-tech electronics segment.• Some results…

AMAT public benchmarking effort. We used sources such as Cass Logistics, Herb Davis,
and the IOMA Report.
1.8
5.85 4.6
5.3 5.1 4.6 4.33.7 4
30
5.54.3 4.8
1.5
6.5
11.5
16.5
21.5
26.5
31.5
Applie
d M
ate
rials
Com
pute
rs
Sem
iconducto
rs
Tele
com
munic
ations
Ele
ctr
onic
s
Ele
ctr
onic
s P
art
s
Com
pute
rs
Specia
l M
achin
ery
Aircra
ft P
art
s
Aircra
ft E
ngin
es &
Part
s
Japan A
uto
Part
s
Moto
r V
ehic
le P
art
s
EU
Ele
ctr
onic
s
Japan E
lectr
onic
s
Industry Category
Inven
tory
Tu
rns
92.0%
90.0%
97.0%96.0%
92.0%
94.0%
86.0%
88.0%
90.0%
92.0%
94.0%
96.0%
98.0%
App
lied
Mat
eria
ls
U.S
. Mot
orV
ehic
leP
arts
Japa
nE
lect
roni
cs
Japa
n A
uto
Par
ts US
Indu
stria
lP
rodu
cts
Her
b D
avis
Dat
abas
eA
vera
ge
Industry Category
Fill
Rat
e
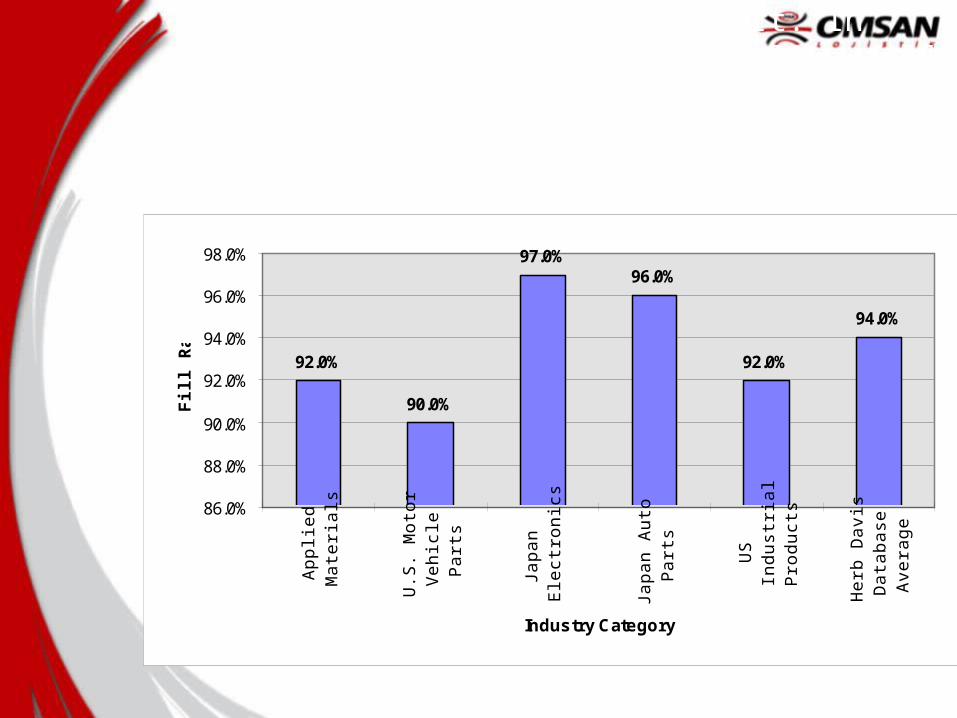
AMAT public benchmarking effort. In this case we were looking for line fill rate by industry, being careful with the way companies calculate this KPI
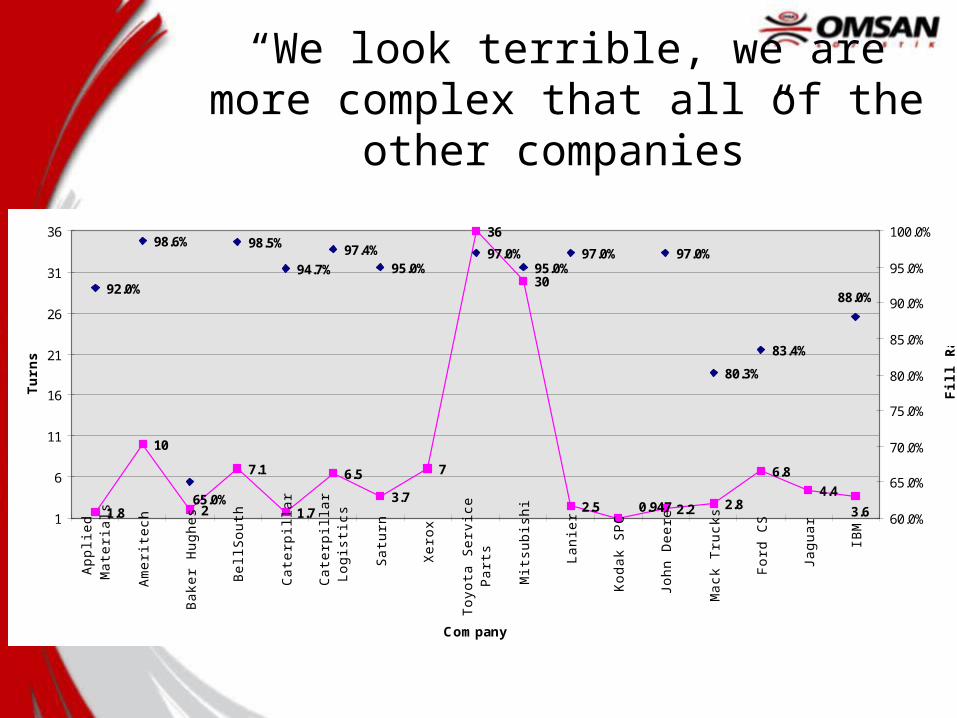
“We look terrible, we are more complex that all of the other companies”
1.8
10
2
7.1
1.7
6.5
3.7
7
36
30
2.5 2.2 2.8
6.8
4.40.947 3.6
92.0%
98.6% 98.5%
94.7%
97.4%95.0%
97.0%95.0%
97.0% 97.0%
80.3%
83.4%
88.0%
65.0%
1
6
11
16
21
26
31
36
App
lied
Mat
eria
ls
Am
erite
ch
Bak
er H
ughe
s
Bel
lSou
th
Cat
erpi
llar
Cat
erpi
llar
Logi
stic
s
Sat
urn
Xer
ox
Toyo
ta S
ervi
ceP
arts
Mits
ubis
hi
Lani
er
Kod
ak S
PC
John
Dee
re
Mac
k Tr
ucks
For
d C
S
Jagu
ar
IBM
Company
Turn
s
60.0%
65.0%
70.0%
75.0%
80.0%
85.0%
90.0%
95.0%
100.0%
Fill
Rat
e
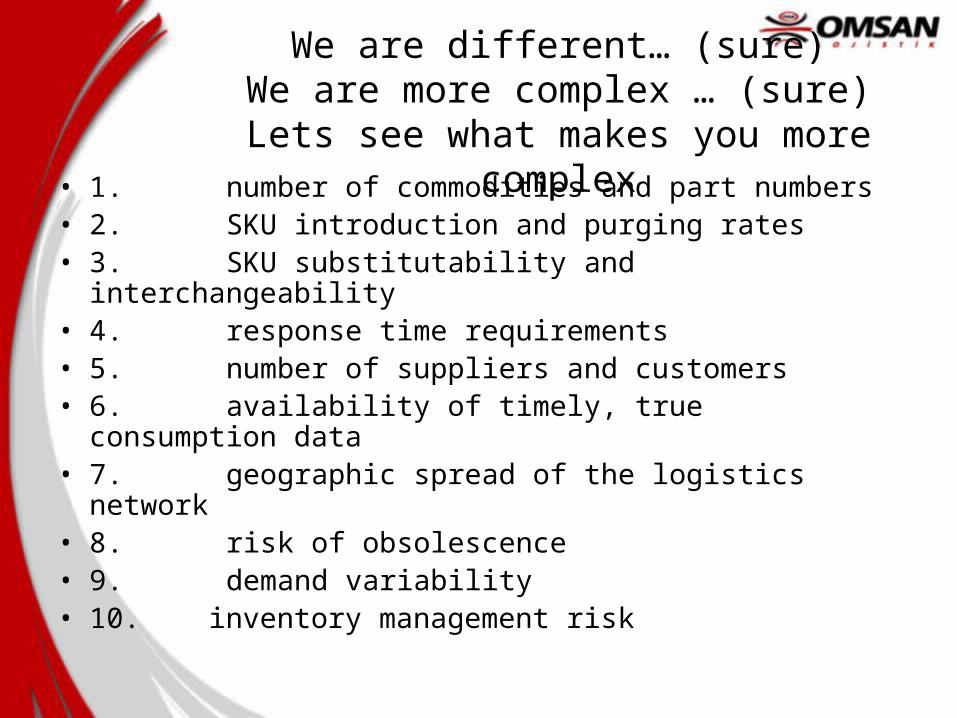
We are different… (sure)We are more complex … (sure)
Lets see what makes you more complex• 1. number of commodities and part numbers • 2. SKU introduction and purging rates • 3. SKU substitutability and interchangeability • 4. response time requirements • 5. number of suppliers and customers • 6. availability of timely, true consumption data • 7. geographic spread of the logistics network • 8. risk of obsolescence • 9. demand variability • 10. inventory management risk
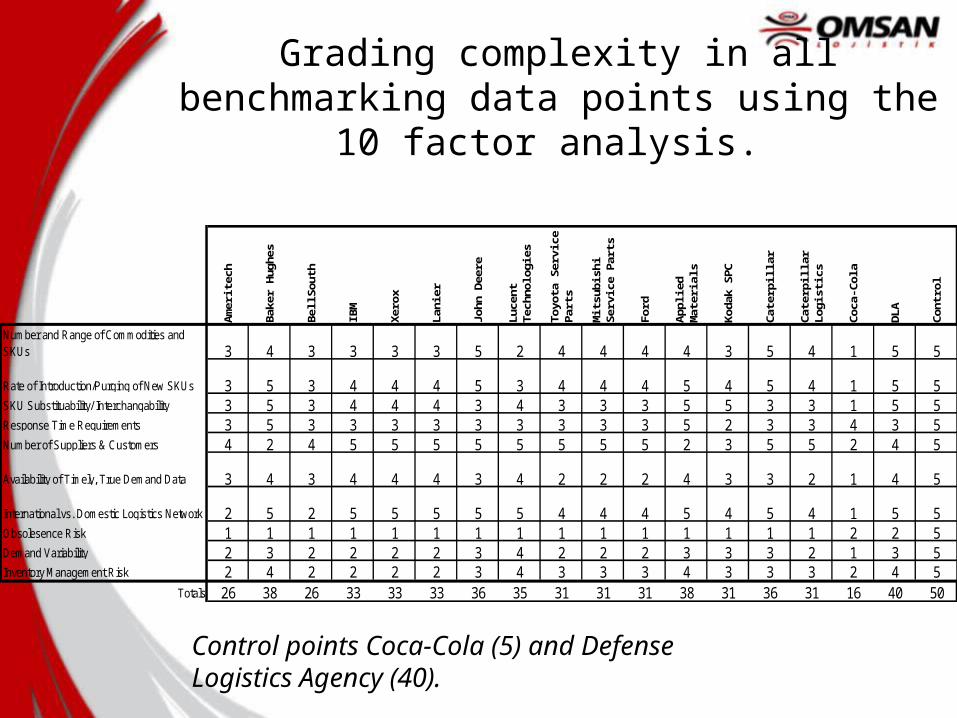
Grading complexity in all benchmarking data points using the 10 factor analysis.
Am
erite
ch
Bak
er H
ughe
s
Bel
lSou
th
IBM
Xero
x
Lani
er
John
Dee
re
Luce
nt
Tech
nolo
gies
Toyo
ta S
ervi
ce
Part
s
Mits
ubis
hi
Serv
ice
Part
s
Ford
App
lied
Mat
eria
ls
Kod
ak S
PC
Cat
erpi
llar
Cat
erpi
llar
Logi
stic
s
Coc
a-C
ola
DLA
Con
trol
Number and Range of Commodities and SKUs 3 4 3 3 3 3 5 2 4 4 4 4 3 5 4 1 5 5
Rate of Introduction/Purging of New SKUs 3 5 3 4 4 4 5 3 4 4 4 5 4 5 4 1 5 5SKU Substituability/ Interchangability 3 5 3 4 4 4 3 4 3 3 3 5 5 3 3 1 5 5Response Time Requirements 3 5 3 3 3 3 3 3 3 3 3 5 2 3 3 4 3 5Number of Suppliers & Customers 4 2 4 5 5 5 5 5 5 5 5 2 3 5 5 2 4 5
Availability of Timely, True Demand Data 3 4 3 4 4 4 3 4 2 2 2 4 3 3 2 1 4 5
International vs. Domestic Logistics Network 2 5 2 5 5 5 5 5 4 4 4 5 4 5 4 1 5 5Obsolesence Risk 1 1 1 1 1 1 1 1 1 1 1 1 1 1 1 2 2 5Demand Variability 2 3 2 2 2 2 3 4 2 2 2 3 3 3 2 1 3 5Inventory Management Risk 2 4 2 2 2 2 3 4 3 3 3 4 3 3 3 2 4 5
Totals 26 38 26 33 33 33 36 35 31 31 31 38 31 36 31 16 40 50
Control points Coca-Cola (5) and Defense Logistics Agency (40).
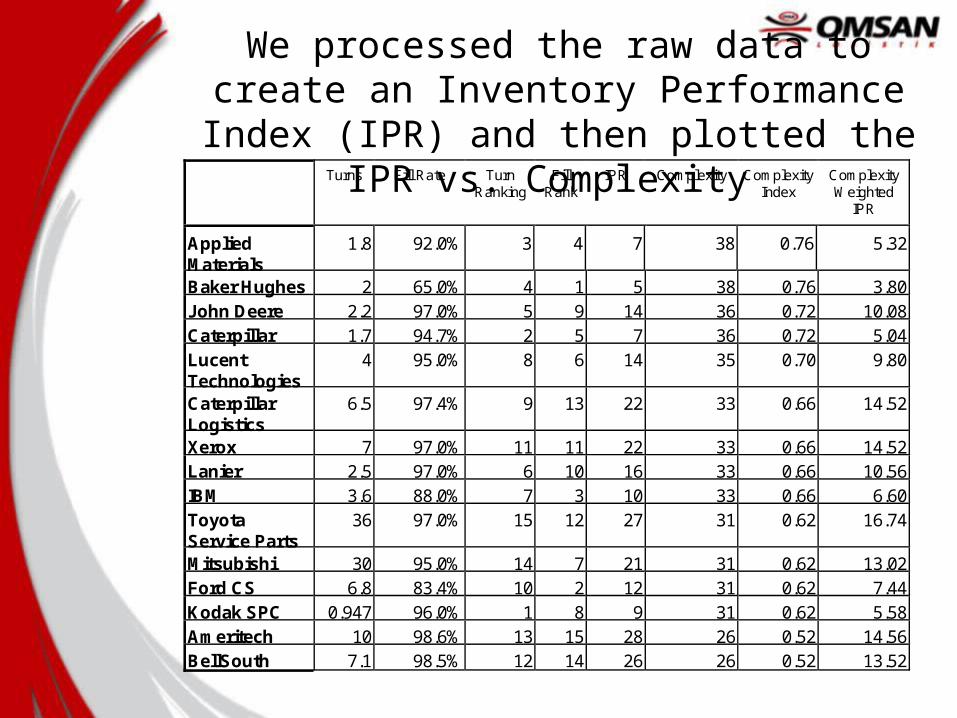
We processed the raw data to create an Inventory Performance Index (IPR) and then
plotted the IPR vs. Complexity Turns Fill Rate Turn
Ranking Fill
Rank IPR Complexity Complexity
Index Complexity Weighted
IPR
Applied Materials
1.8 92.0% 3 4 7 38 0.76 5.32
Baker Hughes 2 65.0% 4 1 5 38 0.76 3.80 John Deere 2.2 97.0% 5 9 14 36 0.72 10.08 Caterpillar 1.7 94.7% 2 5 7 36 0.72 5.04 Lucent Technologies
4 95.0% 8 6 14 35 0.70 9.80
Caterpillar Logistics
6.5 97.4% 9 13 22 33 0.66 14.52
Xerox 7 97.0% 11 11 22 33 0.66 14.52 Lanier 2.5 97.0% 6 10 16 33 0.66 10.56 IBM 3.6 88.0% 7 3 10 33 0.66 6.60 Toyota Service Parts
36 97.0% 15 12 27 31 0.62 16.74
Mitsubishi 30 95.0% 14 7 21 31 0.62 13.02 Ford CS 6.8 83.4% 10 2 12 31 0.62 7.44 Kodak SPC 0.947 96.0% 1 8 9 31 0.62 5.58 Ameritech 10 98.6% 13 15 28 26 0.52 14.56 BellSouth 7.1 98.5% 12 14 26 26 0.52 13.52
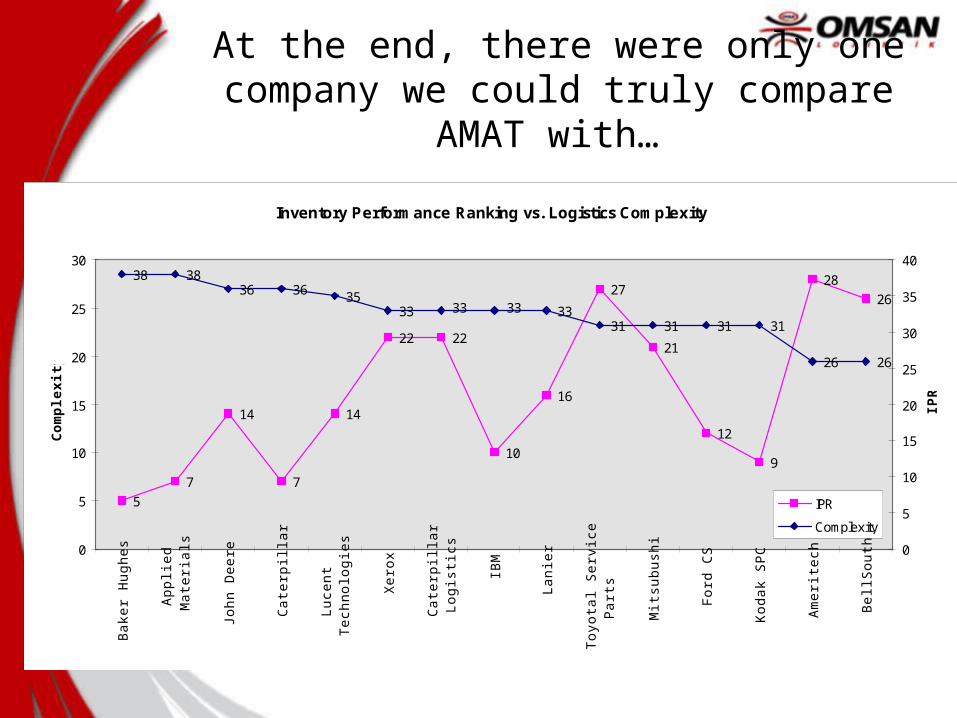
At the end, there were only one company we could truly compare AMAT with…
Inventory Performance Ranking vs. Logistics Complexity
5
7
14
7
14
22 22
10
16
27
21
12
9
28
26
38 3836 36 35
33 3331 31 31 31
26 26
3333
0
5
10
15
20
25
30
Bak
er H
ughe
s
App
lied
Mat
eria
ls
John
Dee
re
Cat
erpi
llar
Luce
ntTe
chno
logi
es
Xer
ox
Cat
erpi
llar
Logi
stic
s
IBM
Lani
er
Toyo
tal S
ervi
ceP
arts
Mits
ubus
hi
For
d C
S
Kod
ak S
PC
Am
erite
ch
Bel
lSou
th
Co
mp
lexi
ty
0
5
10
15
20
25
30
35
40
IPR
IPR
Complexity

Process benchmarking may look like a gap chart against world-class practices
3,5
3,5
3
3,5
3
4,5
4,5
0
1
2
3
4
5
DC Performance
Measures
Receiving & Putaway
Storage
Order PickingUnitizing & Shipping
WMS
Workforce &
Workplace
World-Class
Disney Merchandise DC
Keep it in perspective…
• “A (potential) problem with benchmarking (to be sensitive
to) is that it can restrict the team’s thinking to the
framework of what is already being done in the
company’s own industry. By aspiring only to be as good
as the best in the industry, the team sets a cap on its
own ambitions. Used this way, benchmarking is a tool
for catching up, not for jumping ahead.”
Hammer, M. & Champy, J. “Reengineering the Corporation: A Manifesto for Business Revolution”, 1993
Logistics Initiatives: Financial Justification Analysis
Disney’s Distribution Center
Spartan Stores’ Logistics Operation
AMOCO’s Transportation Performance Analysis

Disney’s DC performance objectives show potential savings by improving productivity,
quality, and velocity.
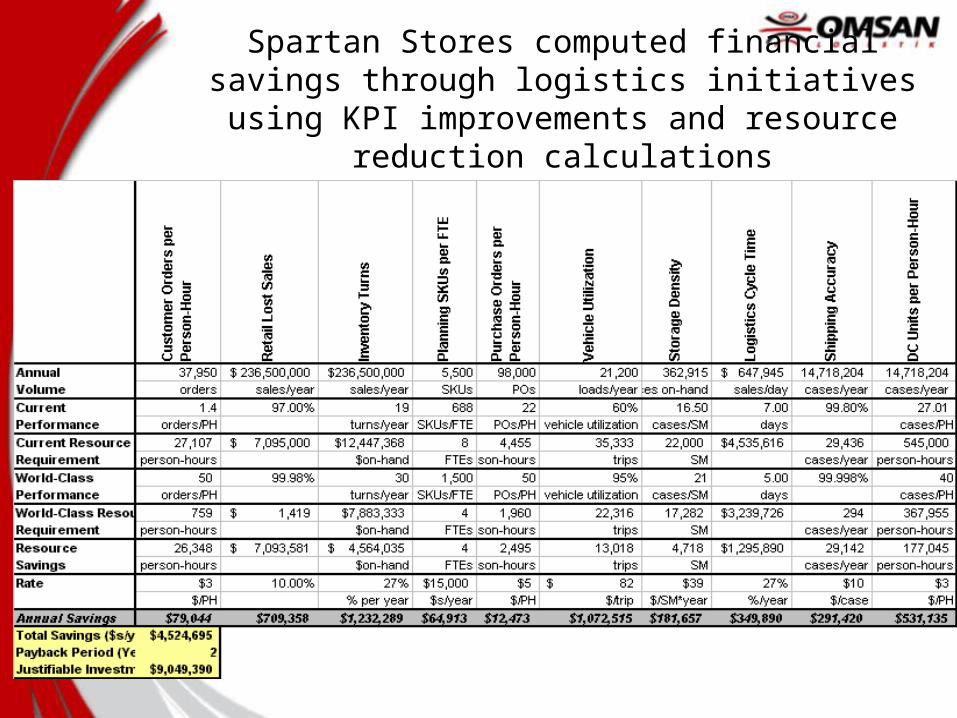
Spartan Stores computed financial savings through logistics initiatives using KPI improvements and
resource reduction calculations
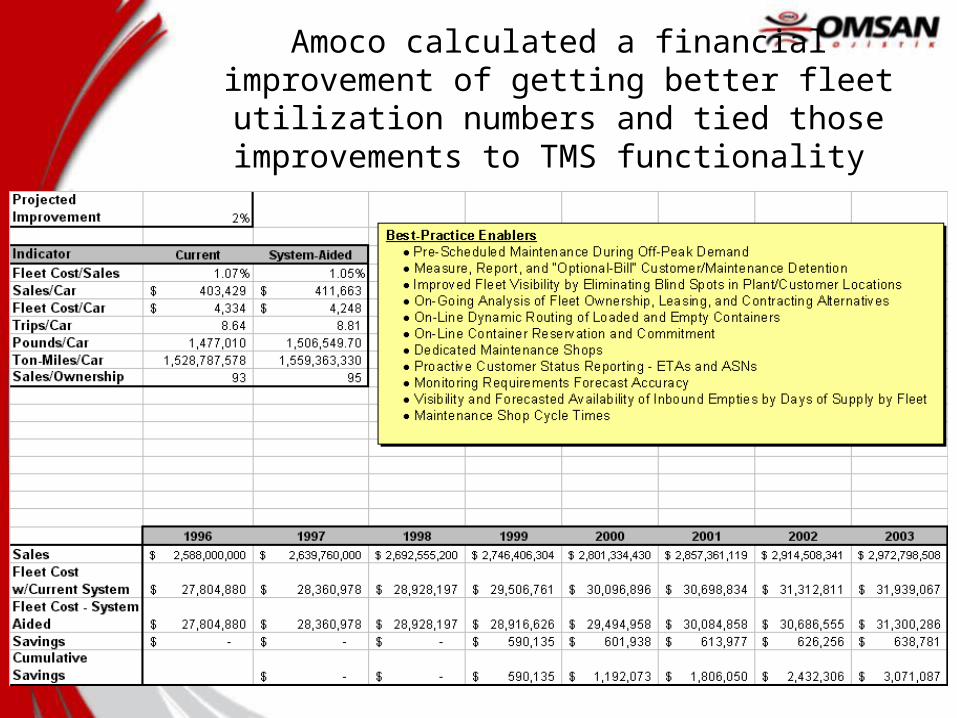
Amoco calculated a financial improvement of getting better fleet utilization numbers and tied those
improvements to TMS functionality

There are not perfect corporate performance systems, but there
are BAD ones!
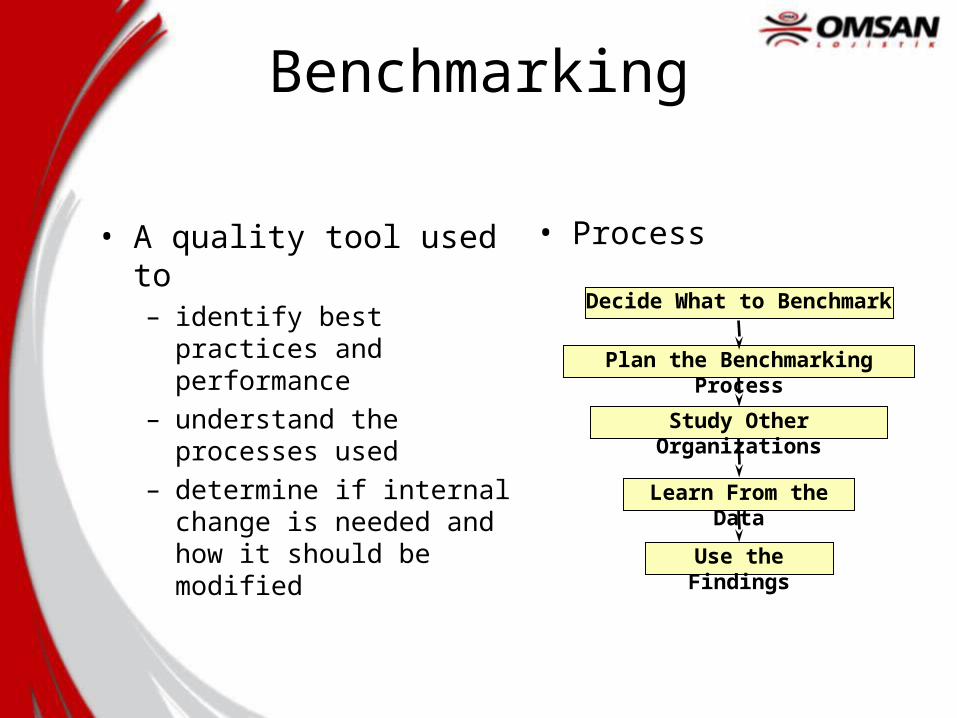
Benchmarking
• A quality tool used to – identify best practices and
performance– understand the processes
used– determine if internal change
is needed and how it should be modified
• Process
Decide What to Benchmark
Plan the Benchmarking Process
Study Other Organizations
Learn From the Data
Use the Findings

Benchmarking Identifies Winners and Losers
World Class
Country Class
Above average
Below average
Slipping Organizations
Troubled Organizations
Winners
Survivors
Losers
“High Performance Benchmarking: 20 Steps to Success” H. James Harrington
DesiredState
DesiredState
ProcessReengineering
CustomerValue
Research
ActivityBased Costing
Performance measurement
Flowcharting
Benchmarking
Value Chain
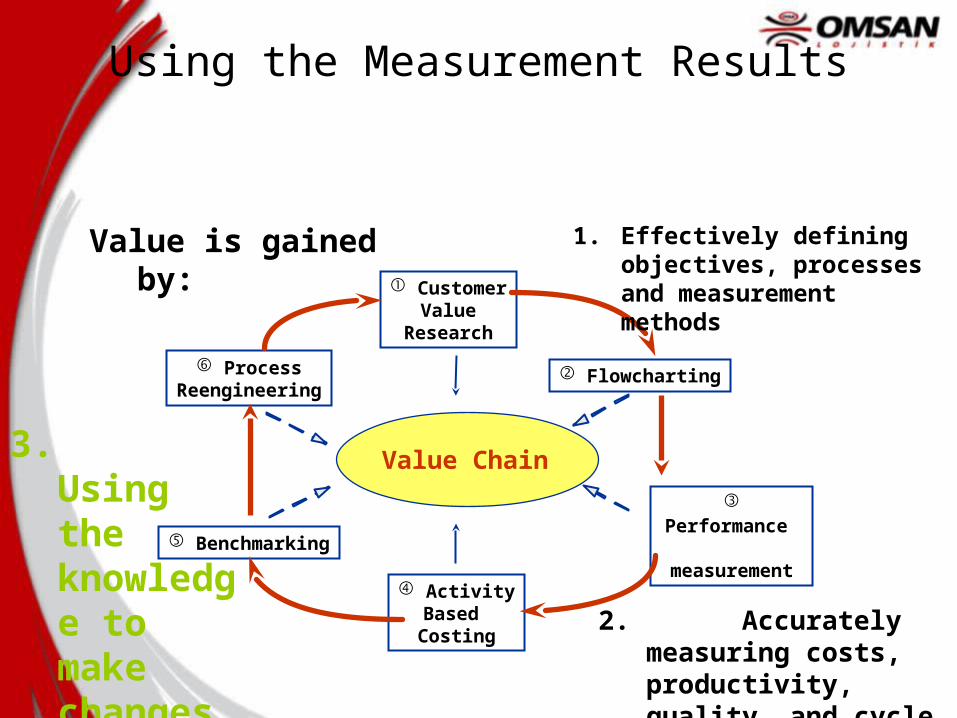
Using the Measurement Results
Value is gained by: 1. Effectively defining objectives, processes and measurement methods
2. Accurately measuring costs, productivity, quality, and cycle time
3. Using the knowledge to make changes

Productivity Audit and Control
Goals
PerformanceReports
Corrective Actions
Monitor
INPUTS ACTIVITIES OUTPUTS

Key Definitions
• Auditing– Provides the information necessary for control– Quantify
• Control– The process where planned performance is
brought into line, or kept in line, with desired objectives
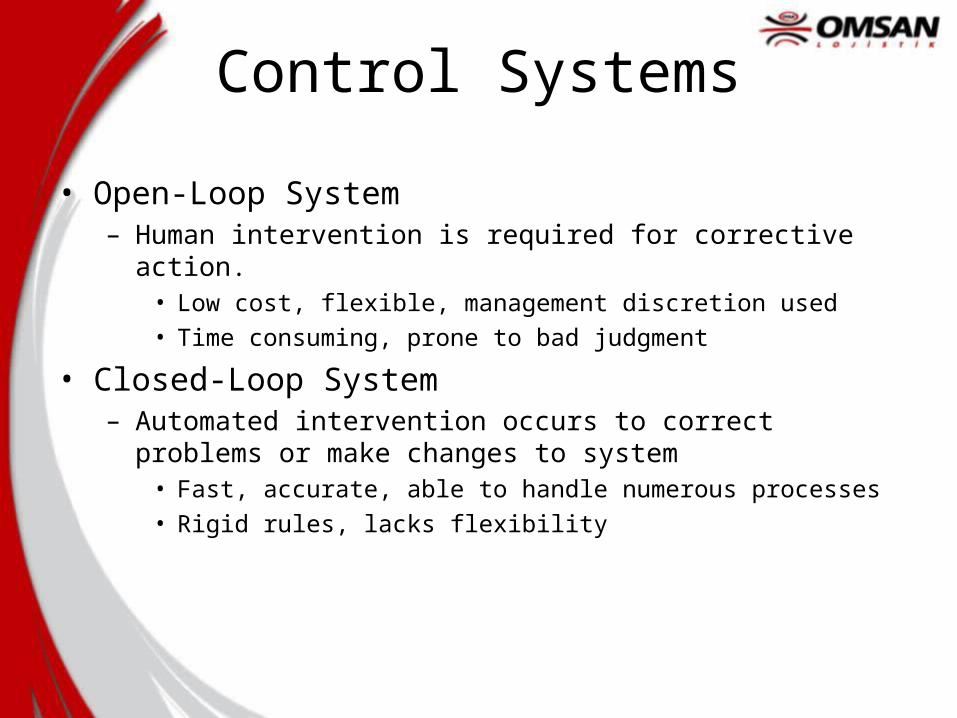
Control Systems
• Open-Loop System– Human intervention is required for corrective action.
• Low cost, flexible, management discretion used
• Time consuming, prone to bad judgment
• Closed-Loop System– Automated intervention occurs to correct problems or make
changes to system• Fast, accurate, able to handle numerous processes
• Rigid rules, lacks flexibility
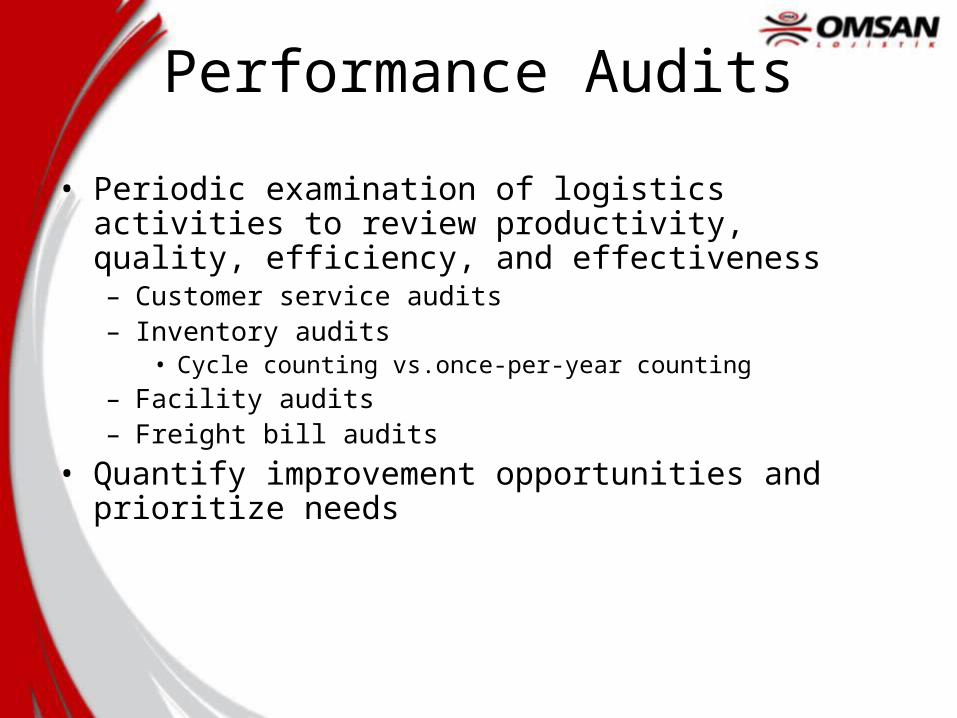
Performance Audits
• Periodic examination of logistics activities to review productivity, quality, efficiency, and effectiveness – Customer service audits– Inventory audits
• Cycle counting vs.once-per-year counting
– Facility audits– Freight bill audits
• Quantify improvement opportunities and prioritize needs
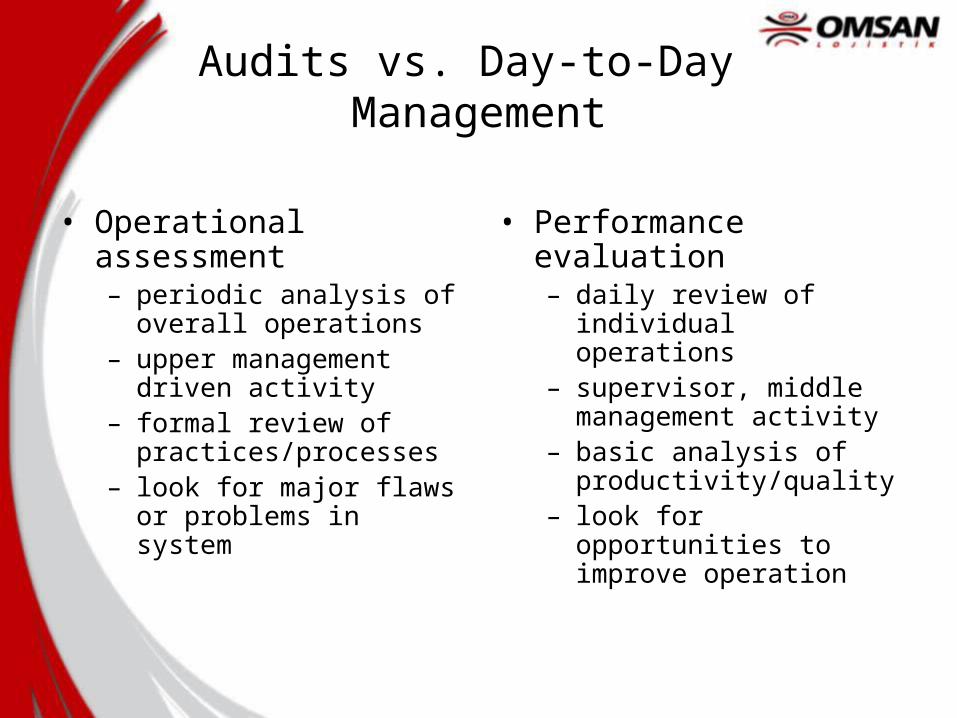
Audits vs. Day-to-Day Management
• Operational assessment– periodic analysis of overall
operations– upper management driven
activity– formal review of
practices/processes– look for major flaws or
problems in system
• Performance evaluation– daily review of individual
operations– supervisor, middle
management activity– basic analysis of
productivity/quality– look for opportunities to
improve operation
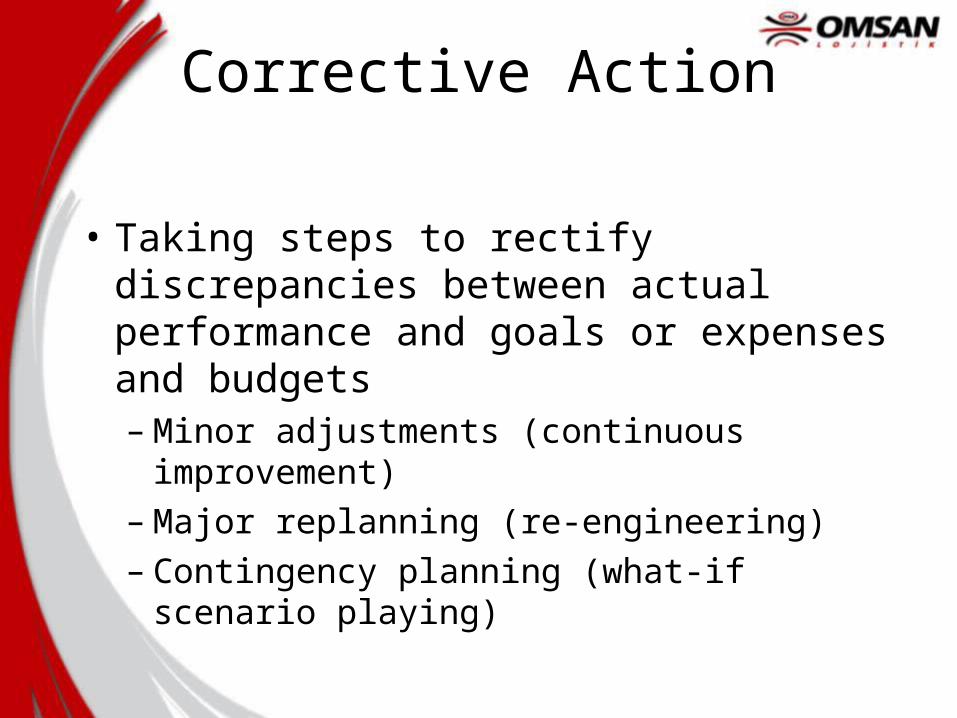
Corrective Action
• Taking steps to rectify discrepancies between actual performance and goals or expenses and budgets– Minor adjustments (continuous improvement)– Major replanning (re-engineering)– Contingency planning (what-if scenario
playing)
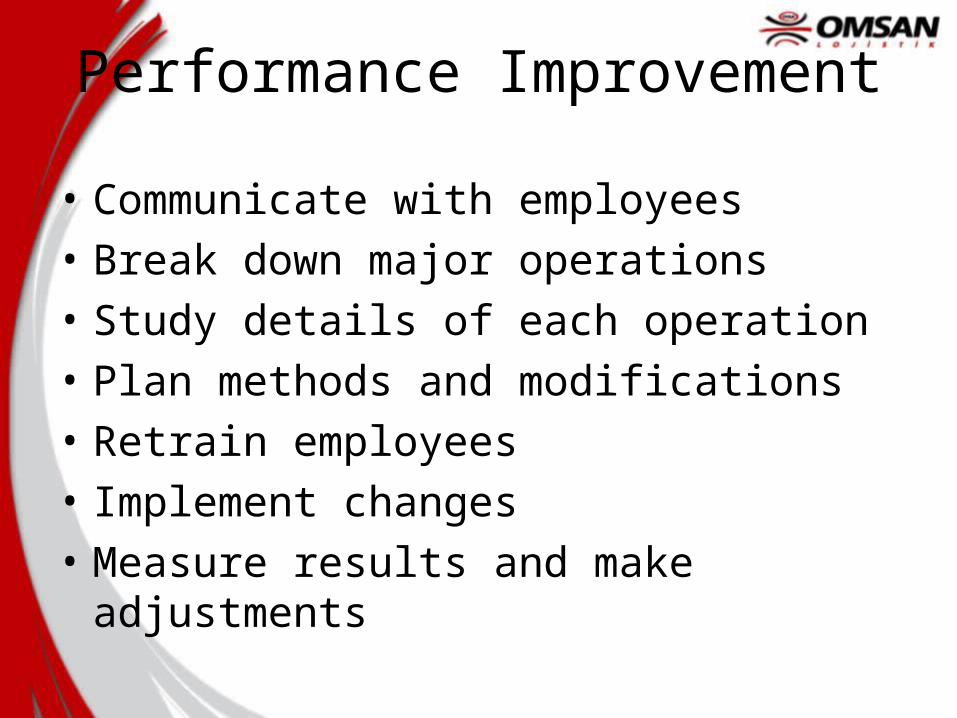
Performance Improvement
• Communicate with employees
• Break down major operations
• Study details of each operation
• Plan methods and modifications
• Retrain employees
• Implement changes
• Measure results and make adjustments
Performance Improvement
• Minor advances result from labor effort– Improve worker productivity
• limited benefits from corrective action programs
– Improve worker efficiency/utilization• keep people busy in productive functions
– Improve worker accuracy• do things right the first time
Performance Improvement
• Effective management brings major results– Eliminate work
• do only what is necessary
• don’t duplicate efforts
– Simplify work• find the easiest way
• ask the experts for suggestions
• train and retrain
• reduce paperwork
Performance Improvement
• Effective management brings major results– Reorganize and reengineer work systems– Improve your operational knowledge
• record & evaluate productivity every day
• learn all functions
• look for improvement opportunities
– Staff operation properly • accurate forecasting
• manage proactively, stretch people
• use overtime and work rules to your advantage