Omnidirectional Superfluorescence Transientspeople.ucalgary.ca/~lvov/thesis-complete.pdf ·...
92
Omnidirectional Superfluorescence Transients Alexander Isayevich Lvovsky Submitted in partial fulfilment of the requirements for the degree of Doctor of Philosophy in the Graduate School of Arts and Sciences COLUMBIA UNIVERSITY 1998
Transcript of Omnidirectional Superfluorescence Transientspeople.ucalgary.ca/~lvov/thesis-complete.pdf ·...
Omnidirectional Superfluorescence Transients
Alexander Isayevich Lvovsky
Submitted in partial fulfilment of the
requirements for the degree of
Doctor of Philosophy
in the Graduate School of Arts and Sciences
COLUMBIA UNIVERSITY
1998
ABSTRACT
A dense sample of atomic rubidium vapor excited by a short (4 ps)
transform-limited laser pulse two-photon resonant with the 5S-5D
transition in a large Fresnel number geometry emits a delayed
omnidirectional infrared superfluorescence pulse (coherent flash) on the
5D-6P transition. This superfluorescence emission involves a coherent
population transfer to the 6P level and results in prompt directional yoked
UV emission and coherent population transfer back to the ground 5S state.
This emission completes the process of parametric four-wave mixing,
selectively involving only those atoms on the 6P level whose 5D-6P
emission satisfies the phase-matching condition. The unique feature of this
four-wave mixing radiation is that it occurs after the termination of the
pump pulse, as evidenced by direct measurement of emission timing. The
multidirectional character of superfluorescent emission is confirmed by the
observation of non-collinear parametric four-wave mixing when exciting
the sample by two simultaneous overlapping pulses, for a wide range of
beam angles. Also observed and investigated is superfluorescent transient
diffraction that appears when the sample is excited by a sequence of three
laser pulses.
TABLE OF CONTENTS
List of figures iii
Acknowledgments v
Introduction 1
Chapter 1. Review of superfluorescence 7
1.1. What is superfluorescence? 7
1.2. Theoretical description of superfluorescence 8
1.3. Superfluorescence in three-level Systems 10
1.4. Yoked superfluorescence in cesium 12
1.5. Yoked superfluorescence in rubidium 15
Chapter 2. Experimental setup 18
2.1. Ti:Sapphire laser 1 regenerative amplifier system 18
2.2. Oven and sample cell 20
2.3. Optical detection and data acquisition 23
2.3.1. Detectors 23
2.3.2. Data acquisition 25
Chapter 3. Single-pulse yoked superfluorescence 27
3.1. Spatial character 27
3.1.1. Upper transition 27
3.1.2. Lower transition 27
3.2. Temporal properties 32
3.3. Power of yoked emission as a function of excitation
intensity 34
Chapter 4. Conical yoked superfluorescence 38
4.1. The idea 38
4.2. Experiment 42
4.3. Autocorrelation via conical yoked superfluorescence 46
Chapter 5. Superfluorescent transient diffraction 49
5.1. Review of photon echoes 49
5.2. Billiard ball echo model 52
5.3. Superfluorescent transient diffraction: physical
mechanism 55
5.4. Spatial properties 59
5.5. Temporal properties 68
5.6. Discussion 75
Conclusions 77
Bibliography 78
Appendix. Experiments in cesium vapor 82

LIST OF FIGURES
Fig. 1.1. Level diagrams of superfluorescence experiments 11
Fig. 1.2. Rubidium energy level diagram 15
Fig. 2.1. Sample cell and oven 22
Fig. 3.1. Phase-matching diagram for single-pulse yoked
superfluorescence 28
Fig. 3.2. Images of single-pulse yoked superfluorescence emissions
from two sample cells 20
Fig. 3.3. Theoretical and experimental spatial profiles of the lower
transition yoked emission from two sample cells 31
Fig. 3.4. Single-pulse conical yoked emission, observed at high
temperatures 32
Fig. 3.5. Delay of the 6P - 5S yoked superfluorescence pulse with
respect to the generating laser pulse as a function of the excitation
pulse energy 33
Fig. 3.6 Yoked superfluorescence intensities as functions of the
excitation pulse energy (theoretical) 37
Fig. 3.7 Yoked superfluorescence intensities as functions of the
excitation pulse energy (experimental) 37
Fig. 4.1 Phase-matching diagram for the two-pulse yoked
superfluorescence 39
Fig. 4.2. Theoretical apex angles of conical yoked emissions as a
function of angular separation between the excitation pulses 41
Fig. 4.3. Experimental apparatus 43
Fig. 4.4. A photograph of conical yoked superfluorescence 45
Fig. 4.5. Experimental data on apex angle of conical emission 45
Fig. 4.6. Autocorrelation profiles generated by a BBO crystal and the
rubidium sample 48
Fig. 5.1. Recoil diagram of a stimulated photon echo experiment 54
Fig. 5.2. Recoil diagram of the superfluorescent transient diffraction
experiment 56
Fig. 5.3. Two types of superfluorescent transient diffraction: vector
diagrams 60
Fig. 5.4. Perfect phase matching beam configurations in superfluorescent
transient diffraction 63
Fig. 5.5. Location of excitation beams and conical transient diffraction
emissions 64
Fig. 5.6. Two types of conical superfluorescent transient diffraction:
images 66
Fig. 5.7. Theoretical and experimental behavior of conical
superfluorescent transient diffraction apex angles 67
Fig. 5.8. Detection circuit for the superfluorescent transient diffraction
experiment 69
Fig. 5.9. An oscilloscope trace of yoked emissions 69
Fig. 5.10. Superfluorescent transient diffraction intensity as a function of
the second pulse delay (high excitation intensity) 72
Fig. 5.11. Superfluorescent transient diffraction intensity as a function of
the second pulse delay (low excitation intensity) 72
Fig. 5.12. Superfluorescent transient diffraction intensity as a function of
the second pulse delay: theoretical model 74
ACKNOWLEDGMENTS
I would like to express my deepest appreciation to my adviser,
Professor S. R. Hartmann, whose patient supervision allowed me to pursue
my research to the best of my ability. I am grateful to Professor F.Moshary
of the City College of New York for offering me his facility to perform
these experiments, helpful discussions and for teaching me a great deal
about realities of modern academia. I would also like to thank Dr. J. H.
Brownell, who helped to get me started in difficult times of his own
graduation, and Professor A. Blaer for providing a teaching grant that
allowed me to support myself for the entire time of my thesis research.
I am dedicating this dissertation to my parents.
1
INTRODUCTION
An ensemble of two-level atoms, prepared with sufficient population
inversion and high optical gain, develops a macroscopic transition moment,
resulting in a burst of superfluorescence (SF) which depletes the upper state.
Experimentally SF is usually obtained by optically exciting the upper level
of a three-level system. The population inversion achieved on the transition
between the upper and middle levels leads to superfluorescence and coherent
transfer of population to the middle level.
Superfluorescence develops from amplified spontaneous emission. A
spontaneous photon emitted into a high-gain mode gets amplified and, in the
process, generates a macroscopic antenna of oscillating dipoles. The intensity
of the field emitted by this antenna is proportional to the number of involved
individual oscillators squared, the effect known as Dicke's superradiance [1].
If sufficiently excited, the antenna generates a coherent burst of radiation in
a time much shorter than the fluorescence lifetime T1.
Classical superfluorescence experiments [2-4] were performed in
"pencil-shaped" samples (Fresnel number close to 1) which allowed
development of two minimally competing superfluorescent modes, forward
and backward. In the present work, the sample is quasispherical and the gain
is essentially independent of direction. Now mode competition is significant
and might be expected to either preclude the development of superfluorescence
altogether or to at least restrict it to a few well isolated modes which would
randomly fire from one laser shot to the next. Nevertheless we find that
superfluorescence develops and it is omnidirectional. This cannot arise from
2a spherical mode as the sample is large compared to the radiation wavelength.
It must be that in our sample, each spontaneously emitted randomly directed
photon is amplified and, in the process, generates a separate macroscopic
antenna. Thus, a three-dimensional distribution of randomly phased antennas
(a kind of pin cushion array), individually directed throughout 4π, is produced
and each antenna separately and simultaneously produces a short (compared
to T1) coherent burst.
In our experiment, we use a powerful Ti:Sapphire laser system to do a
two-photon excitation of the 5D level in atomic rubidium from the ground
5S level, and observe omnidirectional superfluorescence on the 5 6D P→
transition. Initial optical excitation results in coherent superposition between
the 5S and 5D level; the 5 6D P→ superfluorescence automatically creates
coherent superposition between 6P and 5S. What is the effect of this
superposition?
Brownell et al. performed a related experiment [5] in an elongated
sample containing atomic vapor of cesium. They resonantly excited the 6S-6D
transition using a short two-photon resonant laser pulse and observed
superfluorescence on the 6D-6P transition both in the forward (pump) and
backward directions. The coherent superposition established between the 6P
and 6S levels due to the forward 6 6D P→ superfluorescence created a
phase-matched macroscopic dipole moment which resulted in a superradiant
emission along 6 6P S→ . This effect was called Yoked Superfluorescence
(YSF) as this emission is due to and occurs simultaneously with forward
superfluorescence on the 6D-6P transition.
Our case is more complicated as the 5 6D P→ superfluorescence occurs
simultaneously in many directional modes. Nevertheless, yoked emission on
3the 6 5P S→ transition is observed. It is emitted in the forward (laser beam)
direction in the case of a single excitation pulse, or in a variety of directions
if the sample is excited by a sequence of pulse of different directions. If the
latter is the case, the direction(s) of yoked emission is determined, through
phase matching, by the wavevector(s) characterizing the initially established
coherent superposition between 5D and 5S.
In this sense, yoked superfluorescence can be considered as time delayed
four wave mixing where the four fields are not present simultaneously. In
general four-wave mixing (FWM) is a third order nonlinear (χ3) phenomenon
resulting from interaction of four fields such that ω ω ω ω1 2 3 4+ = + andr r r rk k k k1 2 3 4+ = + , where ωi and
rki are the frequency and wavevector of
the nth wave. In a typical parametric four-wave mixing application, the
system is pumped at ω ω1 2= and emits at ω3 and ω4. The responsible
interaction need not be resonant and generally all four fields are present
simultaneously. Garrett and co-workers [6-8], and others [9, 10] have observed
and extensively studied parametric FWM in alkali metal vapors. In these
works, FWM is resonantly enhanced via the nD-qP-mS channel while the
system is two-photon excited in a low Fresnel number geometry near or on
the mS-nD transition by a nanosecond laser pulse. These experiments were
carried out at high number densities so that the FWM emissions were conical
and it was found that when the interaction was resonant the associated ASE
on the nD-qP transition was inhibited. Similar inhibition effects were found
in the YSF experiment [5] where the forward 6 6D P→ SF emission was
suppressed in magnitude and appeared later than its backward counterpart.
We note, however, one substantial difference between conventional
parametric FWM and yoked superfluorescence. The former was obtained
4using optical excitation by nanosecond dye lasers, and all the observed effects
took place in the presence of the pump field. On the other hand, pumping in
the YSF experiments was done by picosecond lasers, and the development
of the yoked superfluorescence emissions occurred long after the pump pulse
is over. The temporal separation of the participating fields is a unique feature
of YSF as a four-wave mixing process.
An exception to be mentioned here is the phenomenon of photon
echo, where the three component fields are applied temporally separated,
and the FWM (photon echo) signal is also separate from the pump pulses.
This is made possible by the processes of inhomogeneous dephasing/rephasing.
In our case, all excitation fields are applied at once, and it is the
superfluorescence buildup time, not dephasing, that causes the delay in FWM.
The first part of this thesis is devoted to general theoretical introduction
and literature review of superfluorescence (Chapter 1), description of our
experimental setup (Chapter 2) and major spatial and temporal characteristics
of observed single-pulse YSF (Chapter 3).
Since our apparatus only allows observation of emissions from the
sample within a relatively small solid angle restricted by its windows, the
omnidirectional character of the 5D-6P superfluorescent emission could not
be directly established from single-pulse experiments. An indirect method,
described in Chapter 4, involves pumping the sample by two simultaneous
angled pulses, so that the two-photon excitation occurs by absorbing one
photon from each pulse. The phase-matching condition is thus modified so
that the directional 6P-5S emission lies on a cone whose apex angle depends
on the angular separation of the two pump pulses. As this angular separation
is varied, phase matching picks out a uniquely determined infrared
5superfluorescence direction with which to combine. The large disparity
between the two transition wavelengths allows full coverage of the 4π solid
angle infrared superfluorescence radiation pattern to be established while at
the same time keeping the angular separation of the two-photon excitation
pulses and the apex angle of the 6P-5S emission within the relatively narrow
aperture of the apparatus. The observation of conical emission at all values
of the pump pulse angle confirms the omnidirectional character of
superfluorescence and the introduced above notion of "coherent flash". In
that chapter, we also discuss the capability of this phenomenon as a phase-
sensitive autocorrelation technique.
As mentioned above, yoked superfluorescence occurs in the directions
determined, via phase matching, by the coherent superposition in which the
states 5S and 5D have been prepared. If the 5S state which existed before
the laser pulse contains some "prerecorded" coherence, it will manifest itself
in additional directions of the lower transition YSF emission. This coherence
can be prepared, in the form of transient induced grating (TIG), by a pair of
laser pulses applied to the system substantially earlier than the interrogating
(third) pulse. This leads to the photon-echo type of emission which we call
superfluorescent transient diffraction (SFTD). This emission is distinguished
from conventional TIG scattering [11] by some unique properties. First, this
signal is not bound by phase matching requirement that firmly establishes
the directions of excitation pulses in the case of conventional TIGs. Second,
the emission is produced by a two-photon resonant excitation. Third, the
diffracted pulse is emitted on the wavelength which is different from the
excitation wavelength. Fourth, the emission is conical. Spatial and temporal
properties of superfluorescent transient grating emissions are investigated in

6Chapter 5.
The thesis concentrates on the experiments done during the last year
of the three-year term the author spent doing his PhD research. A brief
overview of the projects completed during the previous two years is presented
in the Appendix which concludes this dissertation.

7
CHAPTER 1
REVIEW OF SUPERFLUORESCENCE
1.1. What is superfluorescence?
Superradiance [1] is a common reference term for the class of
phenomena that involve cooperative radiation of N two-level oscillators,
prepared in the state of coherent superposition between the two energy levels.
Cooperative radiation is characterized by its intensity being proportional to
N 2, as opposed to spontaneous emission whose intensity is proportional to
N. The state of coherent superposition can be either generated by an external
laser field or develop out of the spontaneous radiation background. The
latter case, known as superfluorescence, takes place when the system is
prepared with complete population inversion, and very high gain (αL >>1,
where L is the sample length). Triggered by incoherent spontaneous emission
and background thermal radiation, the system gradually evolves into a coherent
superposition state, at which time the superradiant pulse is emitted.
Predicted theoretically by Dicke [1], superfluorescence (SF) has been
first observed by M. S. Feld et al. [2] in 1973 on a rotational transition in
hydrogen fluoride. A number of experimental [4, 5, 12-16] and theoretical
[17-25] works have been performed since then; an excellent account of
progress in the area up to 1981 can be found in the review paper [18] by M.
S. Feld and J. C. MacGillivray.
1.2. Theoretical description of superfluorescence
Superfluorescence develops out of a single spontaneous photon emitted
8into the high gain mode; therefore, its strict theoretical model needs to be
quantum-mechanical [22, 26]. However, the number of photons participating
in the process quickly grows, and becomes macroscopic on the time scales
of the transition's superradiant lifetime, which is much shorter than the length
of the entire period of superfluorescent pulse development (see below). This
allows one to develop a semiclassical model, based on Maxwell-Bloch
equations and yielding results which are quite consistent with the quantum-
mechanical one [17]. The initial stage of superfluorescent development is
introduced empirically via the "tipping angle" θ0 of the initial Bloch vector
of the system. For a completely inverted system, the Bloch vector is in the
state of "unstable equilibrium" and points straight up; the initial spontaneous
photon creates small macroscopic polarization in the sample and "tips" the
Bloch vector, allowing the avalanche process of SF development to begin.
The tipping angle is normally set to θ0 2= / N and is one of the two main
parameters of Feld's semiclassical model. The other parameter is the system's
superradiant lifetime, which is, by definition, the expectation time for a
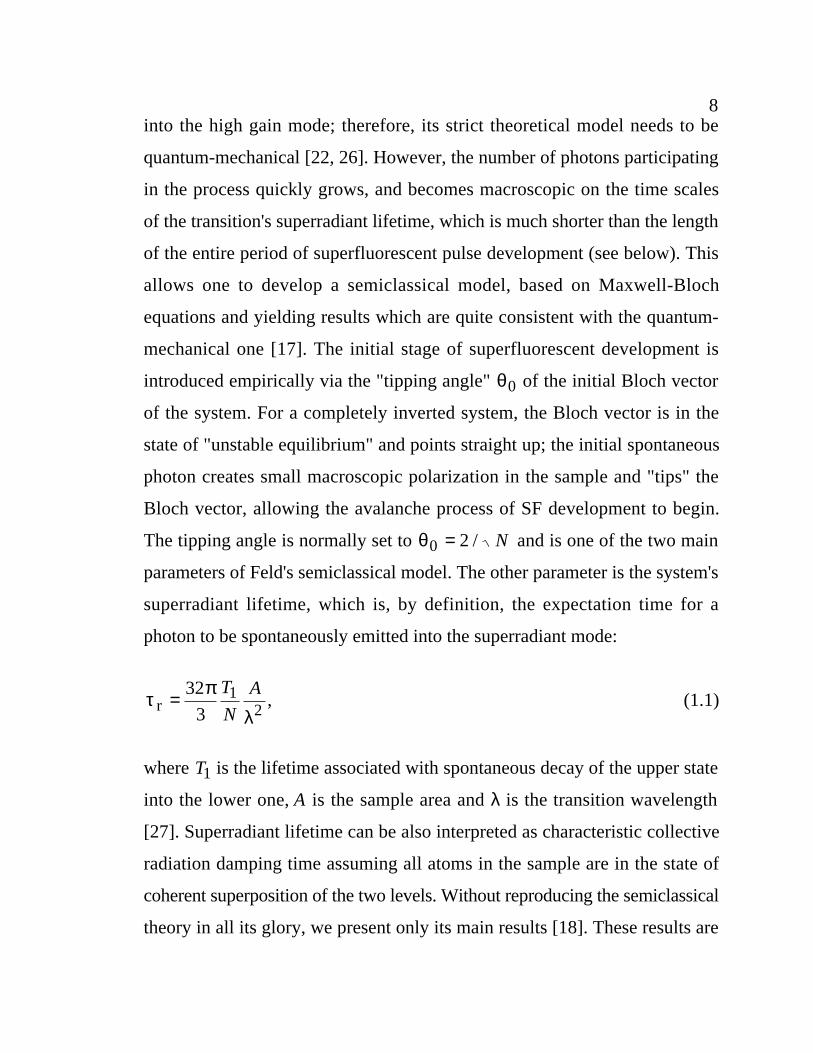
photon to be spontaneously emitted into the superradiant mode:
τ πλ
r = 32
31
2T
N
A, (1.1)
where T1 is the lifetime associated with spontaneous decay of the upper state
into the lower one, A is the sample area and λ is the transition wavelength
[27]. Superradiant lifetime can be also interpreted as characteristic collective
radiation damping time assuming all atoms in the sample are in the state of
coherent superposition of the two levels. Without reproducing the semiclassical
theory in all its glory, we present only its main results [18]. These results are
9best expressed in terms of the quantity φ π θ= ln( / )2 0 ; for typical N on the
scale of 10 1012 16− , φ is between 15 and 20.
According to the semiclassical theory, the peak output power of the
SF pulse is
I N Np ≈ ∝4
22hω
τ φr; (1.2)
its width is
τ τ φw N≈ ∝ −r
1 (1.3)
and its delay with respect to the moment of inversion is
τ τ φd N≈ ∝ −r
2 14/ . (1.4)
These results are obtained in the plane wave approximation, for the ideal
conditions neglecting the interaction of the waves of different directions,
diffraction and incoherent relaxation losses, and assuming complete and
instantaneous inversion taking place in a pure two-level system.
To address these assumptions in the experiment, one needs to satisfy
the following requirements [13]. Elimination of diffraction losses and
transverse mode competition is achieved by the setting the geometry of the
excited volume so that its Fresnel number A L/ λ is close to unity; this
allows development of just two superfluorescent modes of opposite direction,
which have little effect upon each other. The condition of instantaneous
inversion is achieved by making the excitation optical pulse shorter than τ r .
10To avoid losses due to incoherent relaxation, one has to satisfy t T T Tw < 1 2 2, , *,
where T1 and T2 are, respectively, the longitudinal and transverse
homogeneous relaxation times, and T2* is the inhomogeneous dephasing
time.
Assuming that the relaxation is dominated by inhomogeneous
dephasing, and using (1.3), we find that the superradiant lifetime of the
system should be 15-20 times shorter than the inhomogeneous dephasing
time. Employing the relation [27]
α τL T= 8 2* / r (1.5)
we find that for the superfluorescence to exist, one needs very high gain,
αL ≈ 150 . The practical experience shows that the actual magnitude of the
gain needed to achieve SF is a little lower, about 50 to 100.
1.3. Superfluorescence in three-level systems
A common superfluorescence experiment involves optical excitation
of the atom's ground state a , into a higher energy state c , and observing
superfluorescence to state b whose energy lies between those of a and
c . This way complete inversion between levels b and c is be accomplished.
The preference of the c b→ channel over competing c a→ and other
channels takes place either due to its higher gain [4, 13] or, in later experiments,
because of the two-photon excitation of the c state which makes a direct
dipole transition between c and a impossible [5, 15] (fig. 1.1). If the
latter is the case, a dipole transition could still be possible from b to a ,
which can affect the development of superfluorescence on the upper ( c b→ )
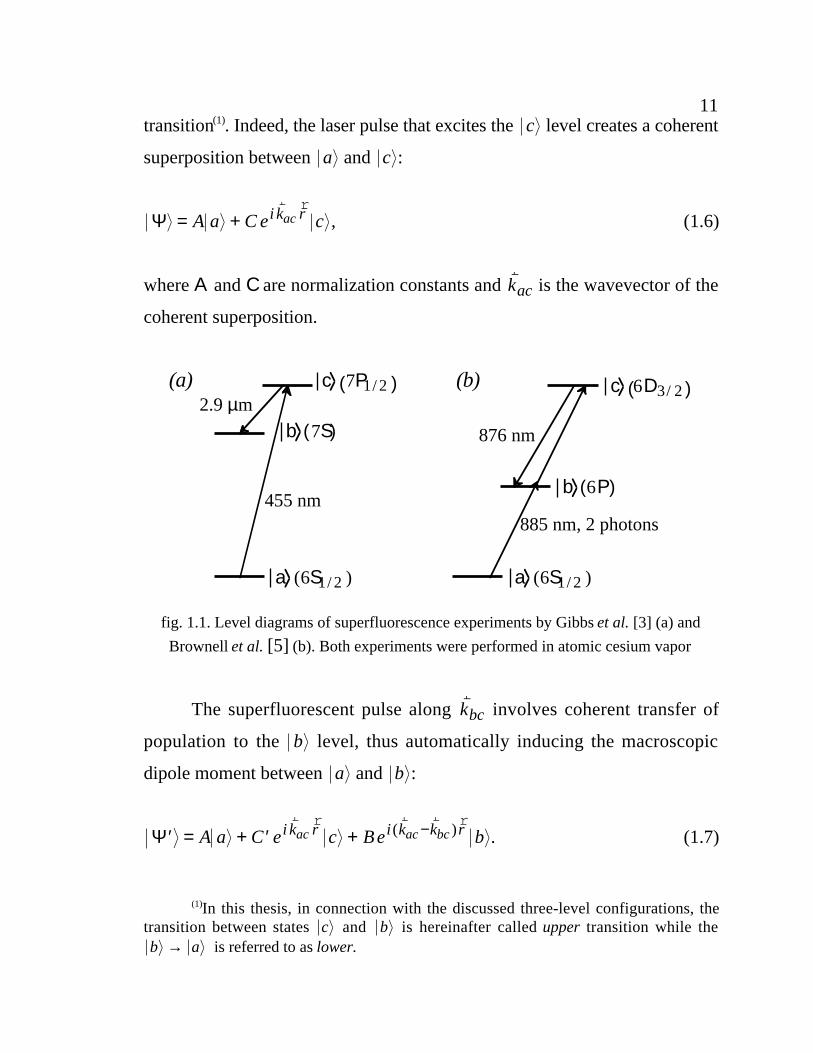
11transition(1). Indeed, the laser pulse that excites the c level creates a coherent
superposition between a and c :
Ψ = +A a C e ci k racr r
, (1.6)
where A and C are normalization constants and rkac is the wavevector of the
coherent superposition.
2.9 µm
455 nm
b 7S( )
c 7P1/ 2( )
876 nm
885 nm, 2 photons
b 6P( )
c 6D3/ 2( )
a (6S1/ 2 ) a (6S1/ 2 )
(a) (b)
fig. 1.1. Level diagrams of superfluorescence experiments by Gibbs et al. [3] (a) and
Brownell et al. [5] (b). Both experiments were performed in atomic cesium vapor
The superfluorescent pulse along rkbc involves coherent transfer of
population to the b level, thus automatically inducing the macroscopic
dipole moment between a and b :
′ = + ′ + −Ψ A a C e c B e bi k r i k k rac ac bcr r r r r
( ) . (1.7)
(1)In this thesis, in connection with the discussed three-level configurations, thetransition between states c and b is hereinafter called upper transition while theb a→ is referred to as lower.
12If superfluorescence happens to occur in the direction colinear to the laser
beam, i.e. r rk kbc ac|| , the coherent superposition between b and a is phase
matched since in this case
r r r rk k k k cac bc ac bc ab− = − = ω / , (1.8)
where ωab is the optical frequency between a and b , and c is the speed
of light. The macroscopic dipole moment, associated with this superposition,
will coherently emit electromagnetic field in the direction of laser beam.
The first experiments to study this effect of have been performed by
Okada et al. [28, 29] on the cascade 2S-2P-3S transition in lithium vapor,
by two-photon exciting the 3S level via a 30-ps laser pulse. Along with
superfluorescence on the upper transition, a forward emission on the lower
transition was observed which proved to be superradiant. The streak camera
investigations [28] of the temporal character of superfluorescent emission
has demonstrated that the latter begins do develop while the excitation pulse
is still present.
1.4. Yoked superfluorescence in cesium
More refined experiments, with SF emissions temporally separated
from the pump, were done by Brownell et al. in [5]. Two-photon laser
excitation of the 6 3 2D / level in atomic rubidium lead to 876-nm
superfluorescence along 6 63 2D P/ → , closely followed by the 894-nm
forward superradiant emission back to the ground level 6S. The term yoked
superfluorescence (YSF) was introduced in reference to these two forward
coherent emissions, indicative of the temporal and genetic connection between
13the two. A unity Fresnel number geometry was used which allowed
development of only two superfluorescent modes, collinear and opposite
with the direction of the excitation laser. Since the competition between
these two modes is reduced to minimum, the amplitude B of the term in (1.7)
that leads to the yoked field was relatively large and strong emission was
observed.
This superradiant pulse, although generated by the forward c b→
SF pulse, has a negative effect on the latter. It reduces the population of the
b state and the associated coherent superposition between b and c that
is essential for the superfluorescence development. The fact that enhancement
of population inversion hinders the growth of the optical signal on the c b→
transition is somewhat counterintuitive, but shows the fundamental difference
between ordinary lasing and superfluorescence [1]. Inversion is essential in
the beginning of the SF development, but when the coherent superposition is
formed between the two states, both levels must be populated.
Experiment [5] showed strong inhibition of the forward
superfluorescence. It was observed that on the upper (876 nm) transition, the
forward superfluorescent pulse was delayed by up to 0.5 ns with respect to
the backward and up to 10 times weaker in intensity. It was accompanied by
a simultaneous forward pulse on the lower transition, while the lower transition
radiation in the backward direction was either extremely week or not seen at
all. This latter circumstance is also easily understood: the coherence on the
lower transition due to backward SF is not phase matched; therefore, backward
b a→ emission will occur only if there is population inversion on this
transition. The excitation pulse thus needs to be strong enough to deplete the
population of the ground ( a ) state by at least 50%.
14The approximate theoretical expression for the upper transition SF
field inhibited by the yoked b a→ emission is given by [5]
E z tE
I tcbcb
ab cbab cb ab cb,( ) =
−−( )
−
0
0 2 1 1τ τ
τ τ τ τr r
r r r r , (1.9)
where t is time, z is the position along the laser beam and I0 is the 0th order
modified Bessel function (see complete derivation of (1.6) in [30]). The
superradiant lifetimes τ rab and τ r
cb depend on the number N of atoms in
each coherent superposition and therefore also depend on t . However, the
degree of inhibition can still be estimated, very roughly, by substituting the
total number of atoms in the excited area of the sample as N into (1.1). For
cesium at 1500C, 80µm beam diameter and L = 1 cm, we find N ≈ ×1 1 1010. .
Using, for the preferred 6D3/2-6P1/2-6S1/2 channel, λcb = 876, λab = 894 nm,
T cb1 79= ns and T ab
1 35= ns [31], we find τ rcb =1 60. ps while τ r
ab = 0 67.
ps. It is thus obvious that severe inhibition is to take place.
A question may arise why in this experiment the superfluorescence
along 6 63 2D P/ → channel takes precedence over the higher gain
6 73 2D P/ → transition. The reason is in the geometry of the excitation
beam. With the 80-µm diameter of the excited volume, the Raleigh range of
the λ = 15 µm 6 7D P→ emission is 400 µm while the sample length is 1
cm. This emission is thus subject to substantial diffraction losses and is
highly suppressed.
As mentioned in the Introduction, yoked superfluorescence can be
considered a parametric four-wave mixing phenomenon. Inhibition effects
similar to the above have been observed in a number of conventional FWM
experiments in alkali vapors [6-8, 10]; however, all these experiments were
15
performed with long laser
pulses, so that the wave
mixing occurred in the
presence of the pumping
laser field. On the other
hand, in the YSF
experiments the generated
FWM fields appear long
after the termination of the
excitation pulses.
1 . 5 . Y o k e d
superfluorescence in
rubidium
In the experiment
reported in this thesis, we
excite a rubidium vapor
sample by a picosecond
laser pulse, two-photon
resonant wi th the
5 51 2S D/ − transition.
(The 90-GHz fine splitting
of the D state could not be
resolved by a four-picosecond laser pulse). Both rubidium and cesium belong
to the group of alkali metals; rubidium is in the fifth period while cesium is
in the sixth. Consequently, the spectra of these two elements are very similar,
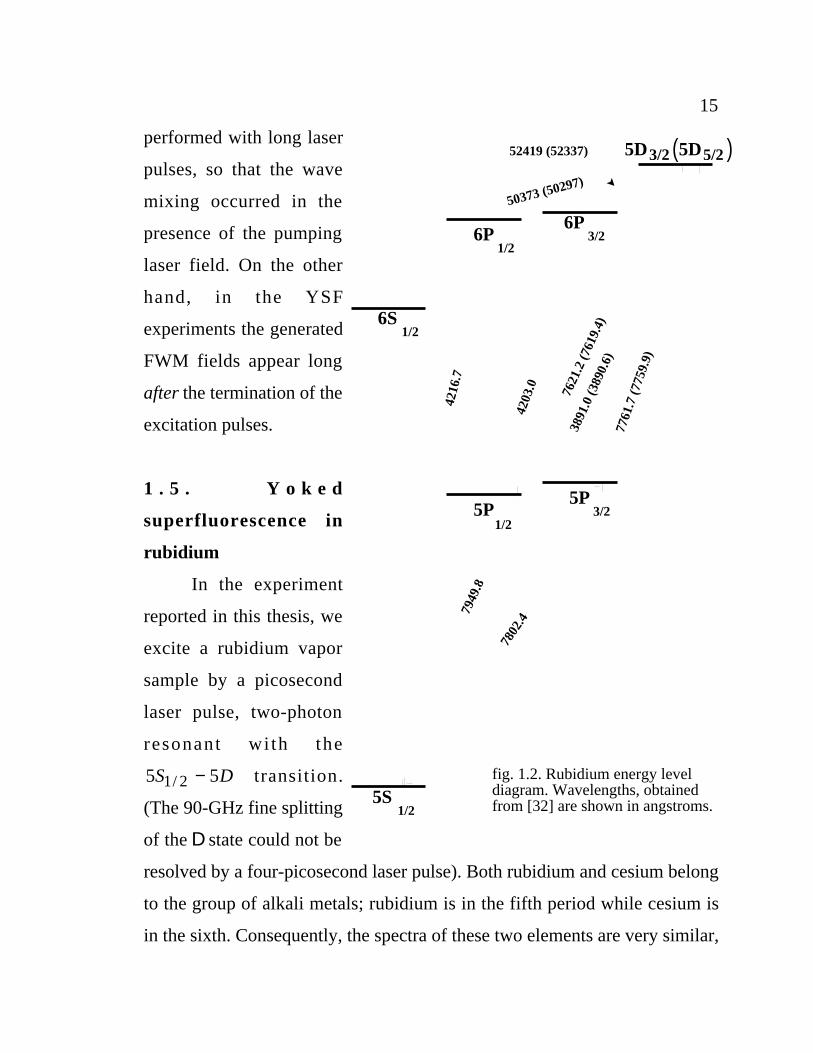
fig. 1.2. Rubidium energy level diagram. Wavelengths, obtained from [32] are shown in angstroms.
52419 (52337)
6S
6P6P
5S
5P5P
1/2
1/23/2
3/2
1/2
1/2
7949
.8
7802
.4
3891
.0 (3
890.
6)
50373 (50297)
7621
.2 (7
619.
4)
7761
.7 (7
759.
9)
4216
.7
4203
.0
5D 5D3/2 5/2( )
16with main quantum numbers of corresponding atomic levels different by one
(fig. 1.2) [32]. The choice of rubidium over cesium in the experiment was
determined by the wavelength range of the available laser system. Our setup
may therefore appear quite similar to that in [5].
The fundamental difference is that the diameter of the excited volume
in our work was up to one half of its 1-cm length. This eliminates diffraction
losses on the 5D-6P transition and allows fair competition between the 5-µm
5D-6P and 760-nm 5D-5P channels. Since the transition gain
ατ π
λπ
λL
T
v
N
T A= = ×
88
3
8
3
322
1
2*
r th(1.10)
(where vth is the average atomic thermal velocity) is proportional to the
cubic power of the wavelength while the fluorescent lifetimes of the two
transitions are of the same order, the 5 6D P→ channel is strongly preferred.
YSF is to occur along 5 6 5D P S→ → . According to the accepted notation,
a S= 5 , b P= 6 and c D= 5 .
Another consequence of wide excited volume is that in such a
"quasispherical" sample no particular direction of superfluorescence is grossly
preferred, so that it develops simultaneously in all directions, emitting a
uniform "flash" of coherent radiation. The equation (1.7) is modified as
follows:
′ = + ′ + ∑ −Ψ A S C e D B e Pi k r
kk
i k k r
DP
DPDP5 5 62 2
rr
rr
r r r( ) . (1.11)
Here rk is the wavevector of the laser (the factor of 2 is due to two-photon
17excitation) and
rkDP is an omnidirectional set of wavevectors along which
the upper transition superfluorescence occurs. The lower transition now has
to select, among this large set, the one which corresponds to a phase matched
coherent superposition between 6P and 5S , i.e. such that 2r rk k kDP PS− = .
This condition is satisfied when rkDP is forward (collinear to the pump
beam) and the resulting yoked field on the lower transition is also emitted
forward.
To estimate the degree of inhibition of the forward superfluorescence
by this field, we compare the two superradiant lifetimes in the same manner
as above. At 1500C, the number density of saturated rubidium vapor is
8 9 1013 3. × −cm ; among various combinations of fine sublevels the channel
with highest dipole moments is 5 65 2 3 2D P/ /→ (λ = 5.2 µm, T1 0 69= . µs)
and 6 63 2 1 2P S/ /→ (λ = 420 nm, T1 0 36= . µs). The superradiant lifetime is
0.96 ps for the upper transition and 76 ps for the lower. With such great
disparity, no inhibition effects can be expected.

18
CHAPTER 2
EXPERIMENTAL SETUP
2.1. Ti:Sapphire laser / regenerative amplifier system
Our laser system consisted of a Spectra-Physics Tsunami femtosecond
Ti:Sapphire laser and a Spectra-Physics Spitfire Ti:Sapphire regenerative
amplifier, set up to work in the picosecond mode. The mode locked Tsunami
laser was powered by a 9-watt beam from a Coherent Innova 400 argon ion
laser, and produced a 82-MHz train of 80-fs pulses. The average power of
the beam was 1.3 to 1.5 watts, in the wavelength tuning range between 720
and 850 nm. The laser was tuned to the 778-nm two-photon 5 5S D→ transition
in rubidium.
The laser beam then entered a Spitfire regenerative amplifier, powered
by a 8.4-watt, 1-kHz, 527-nm, 250-ns pulse train from a Spectra-Physics
Merlin Nd:YLF laser. The amplifier consisted of a pulse stretcher, regenerative
amplification system, and compressor. Below, we discuss the operation of
each of these stages.
Pulse stretching was necessary because of the limited capacity of the
amplifying Ti:Sapphire crystal rod. Beams of intensity exceeding 100 GW/cm2
tend to self-focus destructively in the crystal, preventing their effective
amplification. The solution to this problem is to reduce the peak power of
the pulse by stretching its duration, and recompressing it after amplification.
Stretching is done by spectral decomposition of the pulse by a diffraction
grating, and by having different components of the spectrum travel different
distances. Since the bandwidth of a pulse is inversely proportional to its

19duration, this technique allows to extend an initial 80-fs pulse by as much as
10000 times. The positively chirped and recollimated output pulse of the
stretcher is then directed into a regenerative amplifier. Operation of the
compressor is inverse to that of the stretcher.
While operating the system, care should be taken that the stretcher
functions properly before injecting the stretched beam into the amplifier.
Otherwise there is a risk of burning the crystal. Proper operation of the
stretcher can be determined by observing stripes of spectrally decomposed
pulse on the diffraction grating.
The principle of regenerative amplification is to confine, by polarization,
a single pulse (selected from a mode-locked train), amplify it to the appropriate
energy level, then cavity dump the output. Typically an input pulse of energy
only a few nanojoules can be amplified to over 1 mJ in a single Ti:Sapphire
crystal rod. The amplification takes place as an optical pulse passes through
the crystal, which is optically excited by a single, relatively long pulse from
Nd:YLF laser for the entire duration of confinement. The single-pass
amplification is small, about 3-4 times, but multipassing the rod results in a
much higher output gain.
The confinement and cavity dumping of the amplified pulse is
accomplished by switching two Pockels cells. Precision timing, necessary to
ensure capturing of only one pulse from the train, and synchronization with
the Nd:YLF firing is provided by a separate electronic unit.
Femtosecond pulses produced by the Tsunami laser were excessively
short for our experiment. The amplifier thus had to be set up to convert its
femtosecond input into pulses several picoseconds long. This was achieved
by using special gratings and spectral filtering the beam inside the stretcher.
20As a result, the amplifier output pulses, while suffering insignificant power
losses, became substantially longer in accordance with the uncertainty
principle.
The characteristics of the amplifier output pulses are presented below.
wavelength 778 nm
pulse width 4 ps
train frequency 1 kHz
pulse energy 0.4 to 0.5 mJ
beam diameter 2 to 3 mm
2.2. Oven and sample cell
The majority of the experiments were performed on a type-37 UV-quartz
cell from NSG Precision Cells, identical to that described in [33] and filled
with about 1 g of rubidium. The cell head was of cylindrical shape, with two
polished windows 2.5 cm in diameter and 1 cm path length. A 1/4 inch,
graded seal quartz-to-pyrex tube was extending out of the cylindrical wall of
the cell head was used to attach it to the body of the cell. The latter was a
vertical dome-sealed pyrex glass tube, about 6 inches long and 3/4 inches in
diameter, with rubidium located at its bottom. Such construction, with
substantial spatial separation between the head and rubidium storage, allowed
independent control over the density and temperature of rubidium vapor.
The cell's head should have been kept its hottest point in order to avoid
condensation of rubidium on the windows.
Transmission range of quartz is between 0.3 and 4 µm. To observe the
5 µm upper transition SF, another sample had to be manufactured which
21was transparent in this range. Since a single-piece cell that would satisfy this
requirement was not commercially available, we made a stainless-steel cell
with sapphire windows (sapphire is transparent for electromagnetic waves
up to at least 5.5 µm wavelength). Its main part was a custom made steel
cross by MDC corp., with one arm shortened to 1". The two ends of this arm
were covered with flange mounted sapphire windows 5/8" in diameter; the
third end was sealed with a blank metal flange and to the fourth end a MDC
stainless-steel-to-pyrex graded seal tube, 3/4" in diameter, was attached.
This tube was used to deposit rubidium into the cell, and was sealed at the
end when deposition was completed. All connections between metal parts
were made with Conflat type knife-edge flanges. This cell had a 2.5-cm
optical path length and 5 cm clearance size. Note that after this cell was
made, it was found that the thin windows of the original quartz cell were
also sufficiently transparent for 5-micron radiation. Nevertheless, the stainless
steel cell constituted a useful facility extensively employed in the experiments.
The equipment and procedure of depositing rubidium into the cells
were also identical to those used in [33] and involved two-stage vacuum
distillation.
Yoked superfluorescence was observed at sample temperatures of at
least 1200C. Since part of the experiment involved exciting the sample with
beams of wide, up to 600, angular separation, a special oven had to be
constructed to allow such excitation (fig. 2.1). This oven consisted of a flat
aluminum box 2"×8"×17", with its inner walls covered with 1/2" thick thermal
insulation fiber glass blankets. The oven stood on the optical table so that its
longest side was vertical. Two apertures, 1.5 inch in diameter, were drilled
in the upper section of the front and back faces and each was covered with
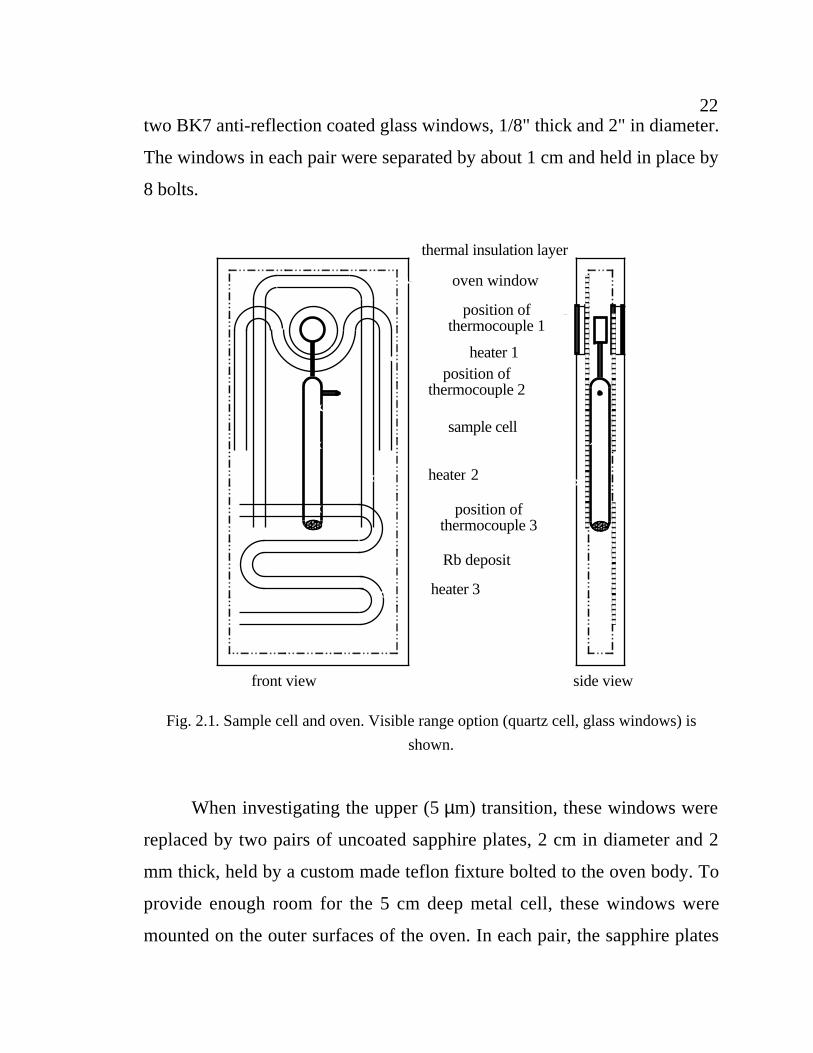
22two BK7 anti-reflection coated glass windows, 1/8" thick and 2" in diameter.
The windows in each pair were separated by about 1 cm and held in place by
8 bolts.
thermal insulation layer
sample cell
front view side view
Rb deposit
heater 3
heater 3
heater 1
2
oven window
position ofthermocouple 1
position ofthermocouple 3
position ofthermocouple 2
Fig. 2.1. Sample cell and oven. Visible range option (quartz cell, glass windows) is
shown.
When investigating the upper (5 µm) transition, these windows were
replaced by two pairs of uncoated sapphire plates, 2 cm in diameter and 2
mm thick, held by a custom made teflon fixture bolted to the oven body. To
provide enough room for the 5 cm deep metal cell, these windows were
mounted on the outer surfaces of the oven. In each pair, the sapphire plates
23were kept about 5 mm apart by a rubber O-ring; this ring also served to
thermally isolate the space between the windows from the outside air. Another
O-ring was placed on each side between the aluminum body of the oven and
the inner window, so that, in spite of their external location, the windows
provided sufficient thermal insulation.
Heating was provided by three 24" long furnace tapes attached to the
inside of the oven walls, covering the insulation blankets. Two of these
heating tapes were located on the back side of the oven, one near the cell
head and the other one at its bottom. The third tape ran throughout the front
side of the oven. Exact position of the heaters was established by trial-and-error
to allow proper stabilization of the cell temperature.
Three chromel-alumel thermocouples were attached to the cell body:
one at its neck near the head, second in the middle of the body and third near
its bottom. These thermocouples were connected to three Omega CN9000A
microprocessor-controlled temperature controllers that supplied electric power
to the heating tapes through solid state relays. This system permitted to
maintain the temperature at the three thermocouple locations independently,
within 1-20C.
2.3. Optical detection and data acquisition
2.3.1. Detectors
The rubidium sample, heated to 130-1500C and excited by optical
pulses from the described above laser system, generated yoked
superfluorescence signal. This signal manifested itself as a purple beam in
the direction of laser excitation, associated with yoked superradiant emission
on the lower (6 5P S→ ) transition. This beam was clearly visible to the
24naked eye.
In addition to naked eye, other detectors employed to observe the
lower transition YSF component included EG&G C90371E PIN and C90302E
avalanche silicon photodiodes. In this dissertation, the avalanche photodiode
will be referred to as "APD" and C90371E as "PIN". Both detectors had an
ultrafast (0.5 ns) response time and relatively high (60%) quantum efficiency;
the APD had a gain of about 100 but was characterized by slightly longer
response time than the PIN and substantial nonlinearity. Therefore, the APD
was used only when the signal was too weak to be detected by the PIN. Both
diodes were placed in a special housing as described in [33].
To protect the diodes from the laser beam, two interference filters
were used: a 2 inch diameter, blue shortpass and a 1" diameter, 10 nm
bandwidth, with 420-nm center wavelength. The second filter was attached
directly to the face of the photodiode housings to prevent registration of
scattered laser light.
To detect the 5-µm superfluorescence on the 5 6D S→ transition, we
used a Santa-Barbara Research Center liquid-nitrogen-cooled Ge:Au detector,
sensitive in the wavelength range between 2 and 9 micrometers. The diameter
of the detector's sensitive area was about 2 mm. The time resolution of this
detector was more than a microsecond which was not fast enough for SF
timing measurements; however, the detector could still be used to detect
superfluorescence and determine its spatial character.
An EG&G FND-100 detector was used, when necessary, to monitor
the pump energy; oscilloscope trigger was provided by a 35-ps-risetime
AR-S2 Antel Optronics silicon photodiode.
252.3.2. Data acquisition
For precise measurement of emission timing, the output from the PIN
or APD was directed into a 1-GHz Tektronix 7A29 amplifier, mounted in a
1-GHz Tektronix 7104 analog oscilloscope mainframe. Oscilloscope traces
were captured by a Tektronix DCS01 digitizing camera, mounted on the
oscilloscope screen, and transferred to an IBM PC-compatible computer for
later analysis. The array of the camera contained 512×512 pixels; this
corresponds to the 10 ps pixel resolution when the fastest oscilloscope time
scale of 0.5 ns per division is used. Such was the scale of error in our time
measurement experiments.
Measurement of YSF energies was performed via a Tektronix TDS
754A 500-MHz digital oscilloscope, connected to a computer by a GPIB
interface. This oscilloscope averaged a large number of single-shot
photodetector signals and digitized the mean value of the signal voltage at a
given moment in time related to the trigger.
Note that when the oscilloscope time scale was set to faster than 25
ns/division, the oscilloscope had to sample the signal from more than one
laser shot to acquire enough data for one waveform, which proportionally
slowed the process of averaging. For example, with the time scale of 1
ns/div the oscilloscope would have to sample 25 shots to obtain a single
waveform, so in order to get an average of 100 waveforms, 2500 laser shots
were needed. Therefore, to obtain reliable data at a fast rate, one needs to
work on the slowest possible oscilloscope time scale as long as the desired
signal is still observed on the screen.
Some applications of the experiment required acquisition of two-
dimensional images. These images were acquired with a Sony XC-77 512×400

26CCD videocamera and processed with Media Cybernetics Image-Pro Plus
software.
27
CHAPTER 3
SINGLE-PULSE YOKED SUPERFLUORESCENCE
3.1. Spatial character of yoked superfluorescence.
3.1.1. Upper transition
To verify omnidirectional character of the upper transition
superfluorescence, we looked at the emission from the sample with the Au:Ge
far infrared detector. The detector was placed about 50 cm away from the
cell so that the registered spatial pattern was a good approximation of the far
field limit. The observed picture was consistent with the expectations although
quite erratic. Superfluorescence developed in separate modes, each with
angular divergence of 1/20 to 1/10 rad; these modes were scattered throughout
the solid angle of the gain, determined by the sample length and laser beam
diameter. The angle of emission increased when the excitation beam was
wider, or when the L=2.5 cm cell was replaced by the L=1 cm one.
Same picture was observed when the detector was placed behind the
oven; there was no inhibition to the forward SF compared to other directions.
It was also found that superfluorescence in directions perpendicular to the
oven and cell windows was substantially enhanced by reflection feedback.
3.1.2. Lower transition
While SF on the upper transition is omnidirectional, the direction of
yoked superradiance on the lower transition is restricted by phase-matching
conditions. It can only occur in the forward direction, selectively involving
only those atoms on the 6P level whose superfluorescent emission on the
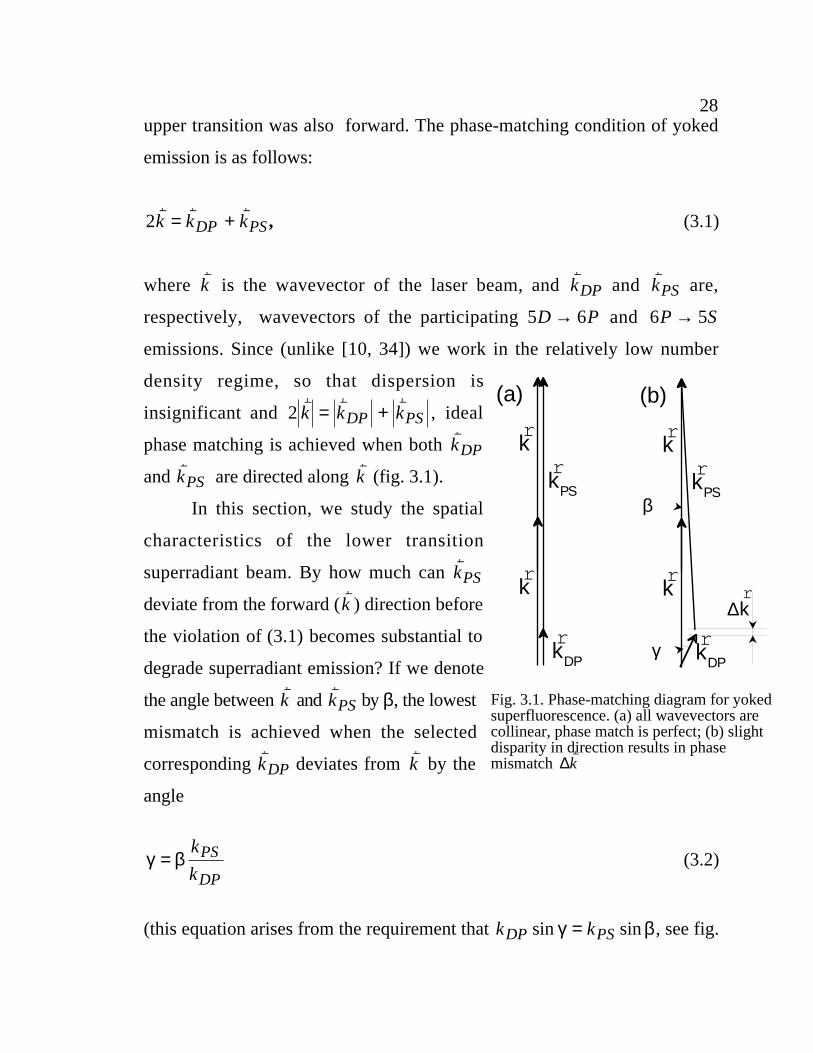
28upper transition was also forward. The phase-matching condition of yoked
emission is as follows:
2r r rk k kDP PS= + , (3.1)
where rk is the wavevector of the laser beam, and
rkDP and
rkPS are,
respectively, wavevectors of the participating 5 6D P→ and 6 5P S→
emissions. Since (unlike [10, 34]) we work in the relatively low number
density regime, so that dispersion is
insignificant and 2r r rk k kDP PS= + , ideal
phase matching is achieved when both rkDP
and rkPS are directed along
rk (fig. 3.1).
In this section, we study the spatial
characteristics of the lower transition
superradiant beam. By how much can rkPS
deviate from the forward (rk ) direction before
the violation of (3.1) becomes substantial to
degrade superradiant emission? If we denote
the angle between rk and
rkPS by β, the lowest
mismatch is achieved when the selected
corresponding rkDP deviates from
rk by the
angle
γ β=k
kPS
DP(3.2)
(this equation arises from the requirement that k kDP PSsin sinγ β= , see fig.
Fig. 3.1. Phase-matching diagram for yokedsuperfluorescence. (a) all wavevectors are collinear, phase match is perfect; (b) slight disparity in direction results in phase mismatch ∆
rk
β
γ
(b)(a)
r k
r k
r k DP
r k PS
r k
r k
r k DP
r k PS
∆r k
293.1). The resulting magnitude of wavevector mismatch is
∆k k k k k kDP PS DP PS( ) ( cos ) ( cos )β γ β= − − = − + −2 1 1
r r r
= + = +
k k
k
kkDP PS
PS
DPPS
γ β β2 2 2 2
2 2 2(3.3)
The cooperative electromagnetic field amplitude in the direction of
rkPS is proportional to
E e d x A e dzi k k k xL
i k zDP PS∝ =∫ ∫− −
excitedvolume
( )2 3
0
r r r r r ∆
= − = −( )A
i k
e
i kiA L e
k L
k L
i k Li k L
∆ ∆∆
∆
∆∆1 2
22/ sin /
/(3.4)
so that its intensity is
Ik L
k L( )
sin ( ) /
( ) /β
ββ
∝( )
∆∆
2
2
2
. (3.5)
The function I( )β presents the theoretical spatial profile of the lower
transition superradiance. Note that unlike other superradiant emissions, e.g.
photon echo [35] and free polarization decay, this spatial character is
determined by the conditions of phase matching, rather than diffraction
divergence.
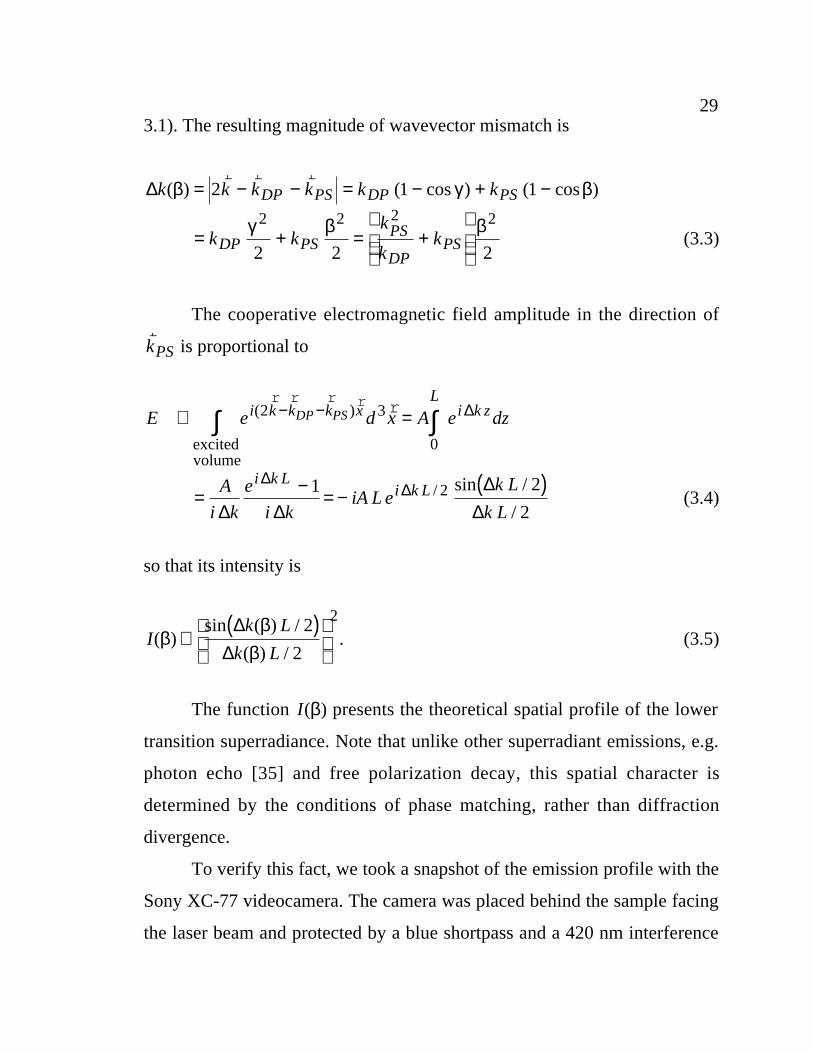
To verify this fact, we took a snapshot of the emission profile with the
Sony XC-77 videocamera. The camera was placed behind the sample facing
the laser beam and protected by a blue shortpass and a 420 nm interference
30filter, and the number of normal density attenuators. The F=75 mm objective
lens of the camera was tuned to infinity to obtain the far field picture in the
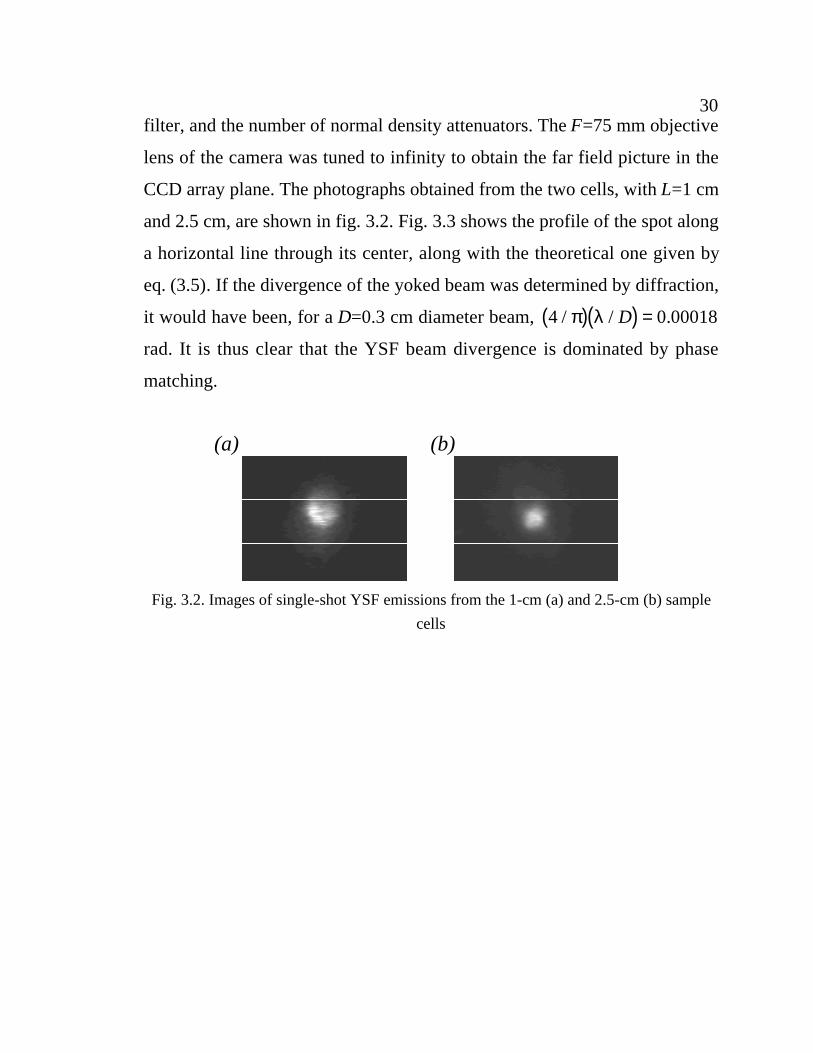
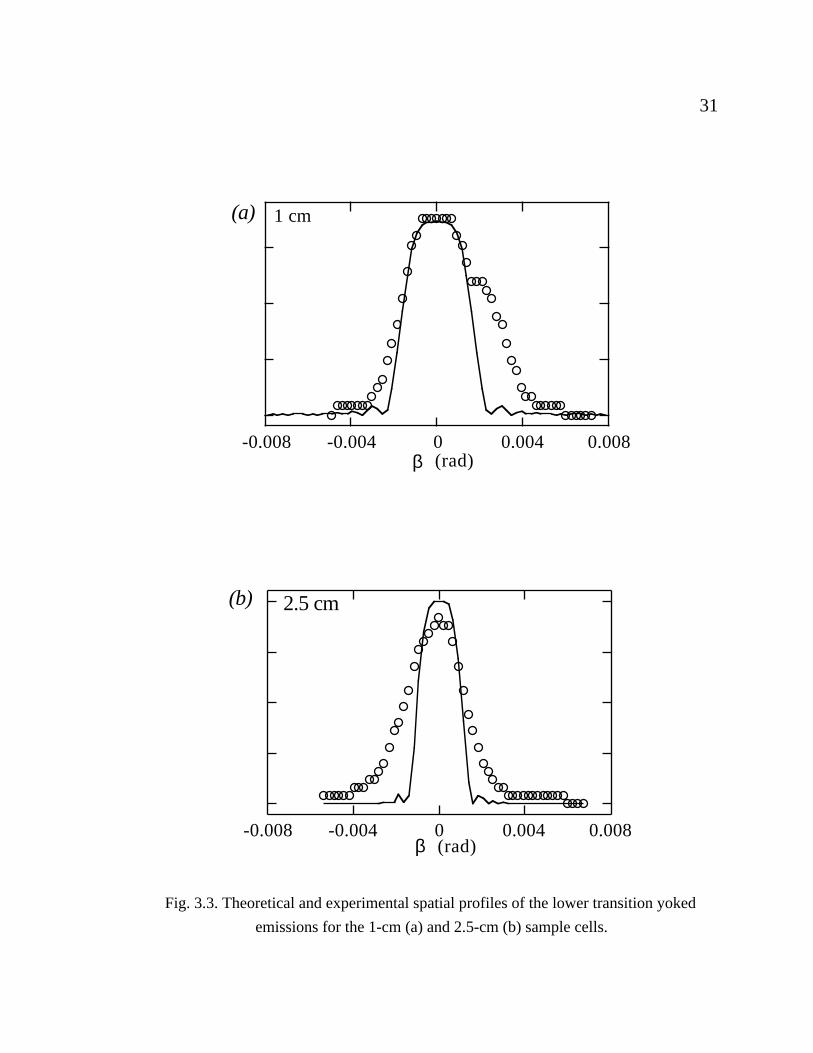
CCD array plane. The photographs obtained from the two cells, with L=1 cm
and 2.5 cm, are shown in fig. 3.2. Fig. 3.3 shows the profile of the spot along
a horizontal line through its center, along with the theoretical one given by
eq. (3.5). If the divergence of the yoked beam was determined by diffraction,
it would have been, for a D=0.3 cm diameter beam, 4 0 00018/ / .π λ( )( ) =D
rad. It is thus clear that the YSF beam divergence is dominated by phase
matching.
(a) (b)
Fig. 3.2. Images of single-shot YSF emissions from the 1-cm (a) and 2.5-cm (b) sample
cells
31
-0.008 -0.004 0 0.004 0.008β
(a) 1 cm
(rad)
-0.008 -0.004 0 0.004 0.008β
2.5 cm
(rad)
(b)
Fig. 3.3. Theoretical and experimental spatial profiles of the lower transition yoked
emissions for the 1-cm (a) and 2.5-cm (b) sample cells.

32
At higher number densities, dispersion comes
into play and the condition 2r r rk k kDP PS= + is
no longer valid. Yoked emissions become conical.
The profile in fig. 3.4 is obtained with the 2.5-cm
cell at the temperature 2200C, which corresponds to
the saturated vapor number density of
2 1015 3× −cm . This profile is similar, by its
appearance and physical origin, to the one observed
by Boyd et al. in [10] in sodium vapor, with nanosecond excitation pulses
and number densities around 1016 3cm− .
3.2. Temporal properties of the emission on the lower transition
As mentioned in the introduction, YSF can be considered as a four-wave
mixing process that occurs after the termination of the pump pulses. We
performed a set of measurements to check the presence of such a delay. The
420-nm lower-transition emission was registered with the APD photodiode,
protected by two interference filters (see Section 2.3) and connected to the
7104 oscilloscope. The oscilloscope traces were digitized with the Tektronix
videocamera. For each setting of laser intensity and cell temperature, 25
waveforms were taken and relative positions of their peaks, with respect to
the oscilloscope screen, were measured and averaged.
To determine the absolute value of the emission delay it was necessary
to find the relative (with respect to the oscilloscope screen) peak position of
an undelayed pulse. The difficulty associated with this measurement is that
the photodiode response time is significantly wavelength-dependent [36],
Fig. 3.4. Single-pulse conical YSF emission from the cell, observed due to dispersion at high temperatures.
33and there was no available source of a short 420-nm pulse. As a replacement,
a BBO crystal was used which generated the 4-ps, 389-nm second harmonic
of the 778-nm pump laser field.
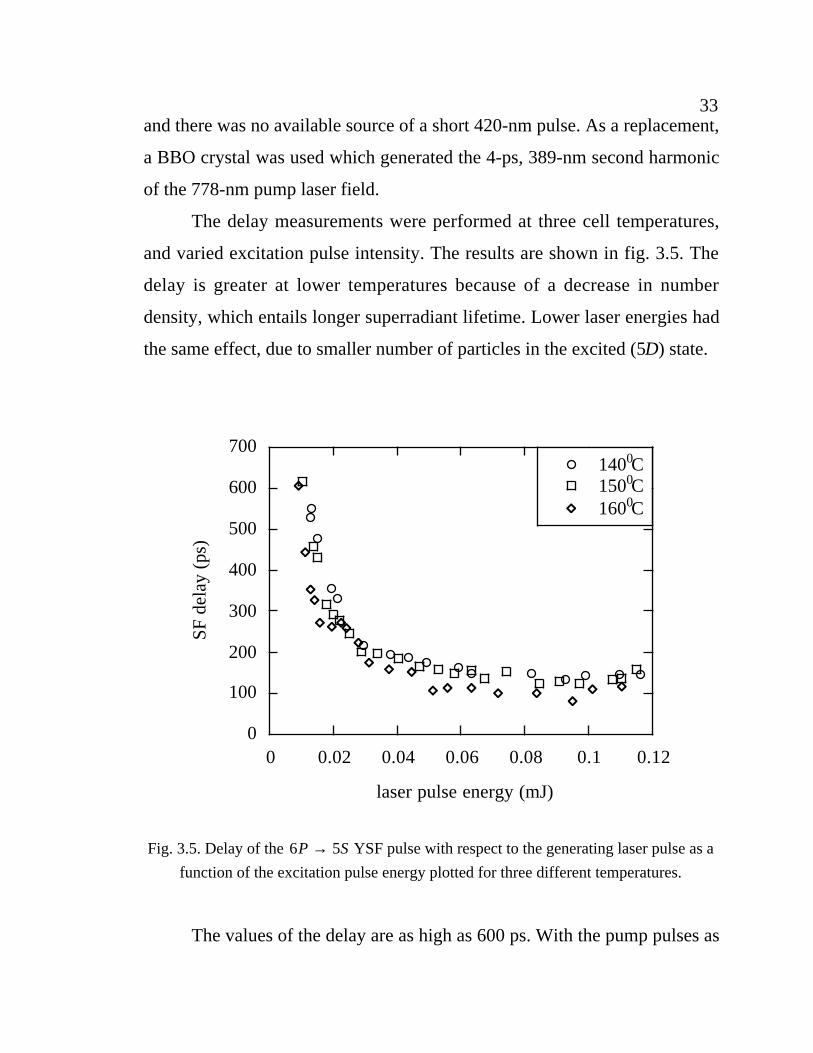
The delay measurements were performed at three cell temperatures,
and varied excitation pulse intensity. The results are shown in fig. 3.5. The
delay is greater at lower temperatures because of a decrease in number
density, which entails longer superradiant lifetime. Lower laser energies had
the same effect, due to smaller number of particles in the excited (5D) state.
0
100
200
300
400
500
600
700
0 0.02 0.04 0.06 0.08 0.1 0.12
140 C150 C160 C
SF d
elay
(ps
)
laser pulse energy (mJ)
0
0
0
Fig. 3.5. Delay of the 6 5P S→ YSF pulse with respect to the generating laser pulse as a
function of the excitation pulse energy plotted for three different temperatures.
The values of the delay are as high as 600 ps. With the pump pulses as
34short as 4 ps, it can be concluded that most of the superradiant pulse is
emitted in the absence of the pump laser field.
3.3. Power of yoked emission as a function of excitation intensity
To understand the properties of superfluorescent transient diffraction
(discussed in Chapter 5) it was essential to estimate the area(2) Θ of the
excitation pulse. This estimation can be done by comparing the dependencies
of the upper and lower transition yoked emission energies on the intensity of
the excitation pulse. There is a fundamental difference between the two. As
indicated above (see Eq. (1.2)), the energy of the D P→ superfluorescent
pulse is proportional to the population of the D level squared, i.e. sin ( / )4 2Θ .
The energy of the yoked superradiant emission on the lower ( P S→ )
transition is proportional to the product of populations of the two levels, i.e.
sin ( / ) cos ( / ) ( / ) sin2 2 22 2 1 4Θ Θ Θ= . These expressions need to be
(2)The notion of the pulse area (time integrated Rabi frequency), initially introducedfor a dipole excitation of a two-level system, can be transferred, with sufficiently highaccuracy, to two-photon processes provided there is a quasiresonant energy level betweenthe ground and excited ones (see, for example, [62]). In our case of the 5S-5D rubidiumtransition this level exists; it is 5P. The state of the two-photon excited system is then
given by Ψ Θ Θ= +cos( / ) sin( / )2 5 2 5S ie Diϕ , where ϕ is the optical phase. Thetwo-photon Rabi frequency is given by (in SI units)
Ω20
22 1
12=
−∑I
c
d dp m m
m pmε ω ωh.
In this equation, dij and ωij are, respectively, dipole moment matrix element and optical
transition frequency between levels i and j , ωp is the frequency of the two-photon
resonant laser pulse, and Ip is its intensity. Transition occurs between levels 1 and 2.Note that the pulse area for a two-photon excitation is proportional to the intensity of theexciting field rather than its amplitude.
corrected to account for nonuniform profile of the laser beam and subsequent
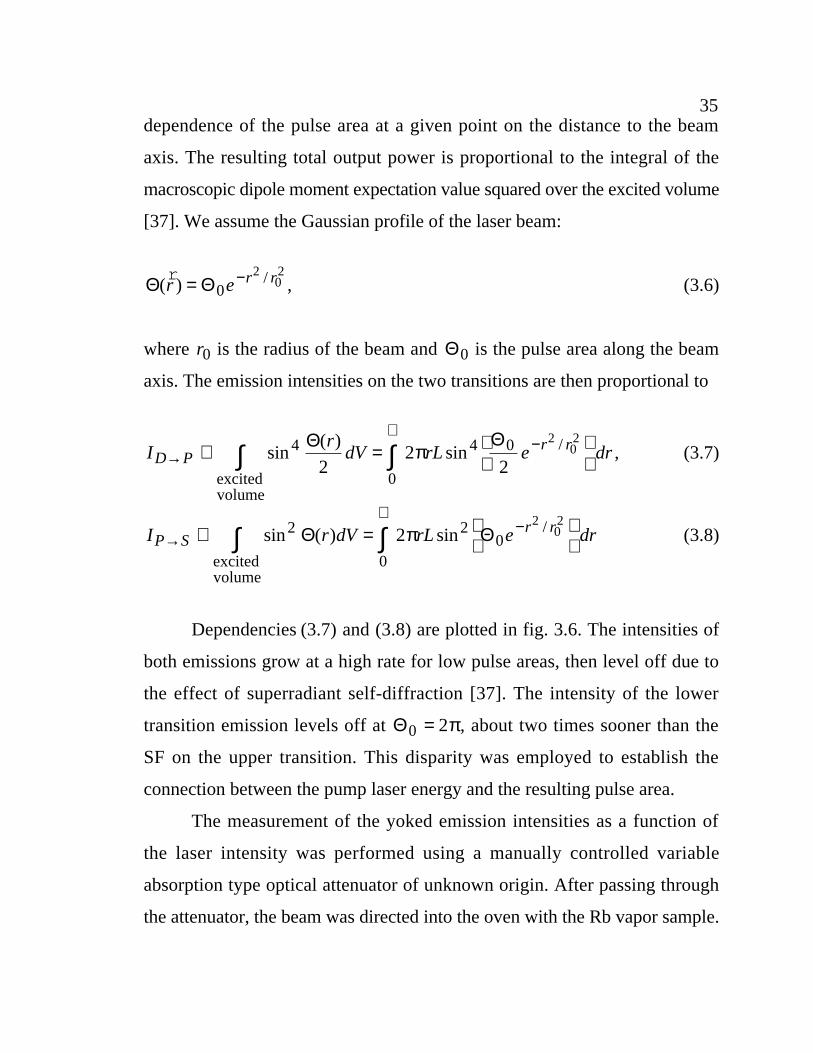
35dependence of the pulse area at a given point on the distance to the beam
axis. The resulting total output power is proportional to the integral of the
macroscopic dipole moment expectation value squared over the excited volume
[37]. We assume the Gaussian profile of the laser beam:
Θ Θ( ) /rr e r r= −
02
02
, (3.6)
where r0 is the radius of the beam and Θ0 is the pulse area along the beam
axis. The emission intensities on the two transitions are then proportional to
Ir
dV rL e drD Pr r
→
∝−∝ =
∫ ∫
excitedvolume
sin( )
sin /4
0
4 0
22
2
202Θ Θ
π , (3.7)
I r dV rL e drP Sr r
→
∝−∝ =
∫ ∫
excitedvolume
sin ( ) sin /2
0
202
202
Θ Θπ (3.8)
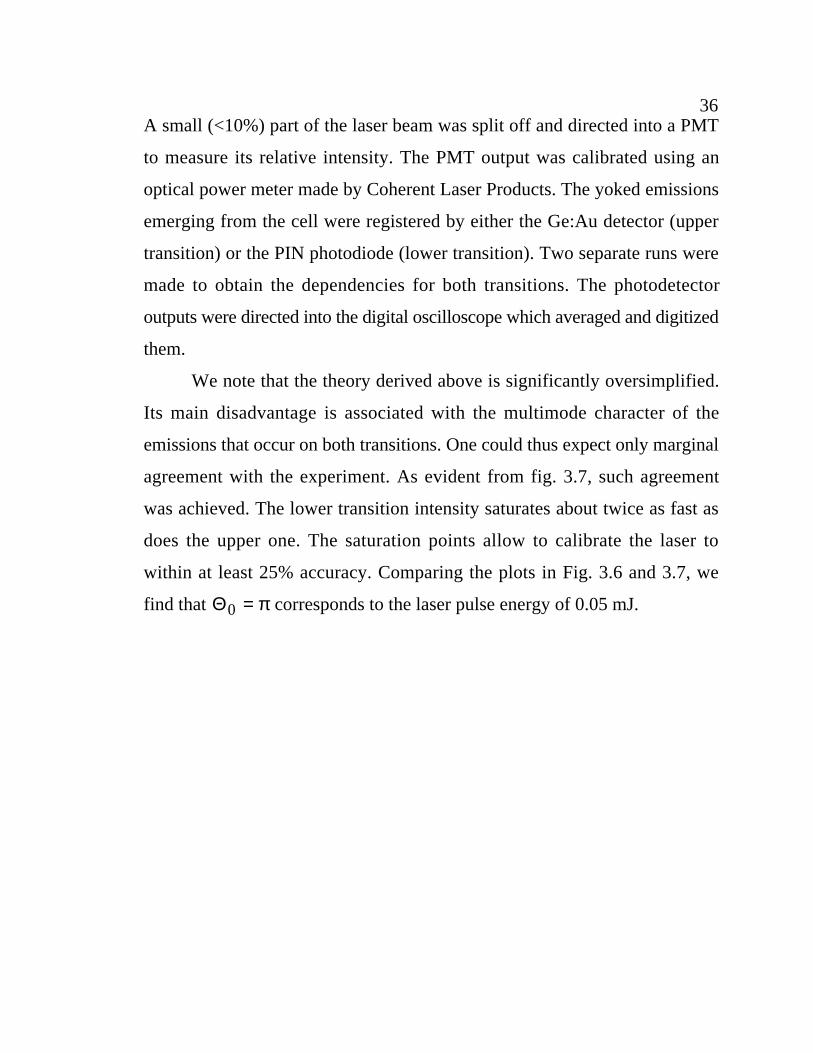
Dependencies (3.7) and (3.8) are plotted in fig. 3.6. The intensities of
both emissions grow at a high rate for low pulse areas, then level off due to
the effect of superradiant self-diffraction [37]. The intensity of the lower
transition emission levels off at Θ0 2= π, about two times sooner than the
SF on the upper transition. This disparity was employed to establish the
connection between the pump laser energy and the resulting pulse area.
The measurement of the yoked emission intensities as a function of
the laser intensity was performed using a manually controlled variable
absorption type optical attenuator of unknown origin. After passing through
the attenuator, the beam was directed into the oven with the Rb vapor sample.
36A small (<10%) part of the laser beam was split off and directed into a PMT
to measure its relative intensity. The PMT output was calibrated using an
optical power meter made by Coherent Laser Products. The yoked emissions
emerging from the cell were registered by either the Ge:Au detector (upper
transition) or the PIN photodiode (lower transition). Two separate runs were
made to obtain the dependencies for both transitions. The photodetector
outputs were directed into the digital oscilloscope which averaged and digitized
them.
We note that the theory derived above is significantly oversimplified.
Its main disadvantage is associated with the multimode character of the
emissions that occur on both transitions. One could thus expect only marginal
agreement with the experiment. As evident from fig. 3.7, such agreement
was achieved. The lower transition intensity saturates about twice as fast as
does the upper one. The saturation points allow to calibrate the laser to
within at least 25% accuracy. Comparing the plots in Fig. 3.6 and 3.7, we
find that Θ0 = π corresponds to the laser pulse energy of 0.05 mJ.
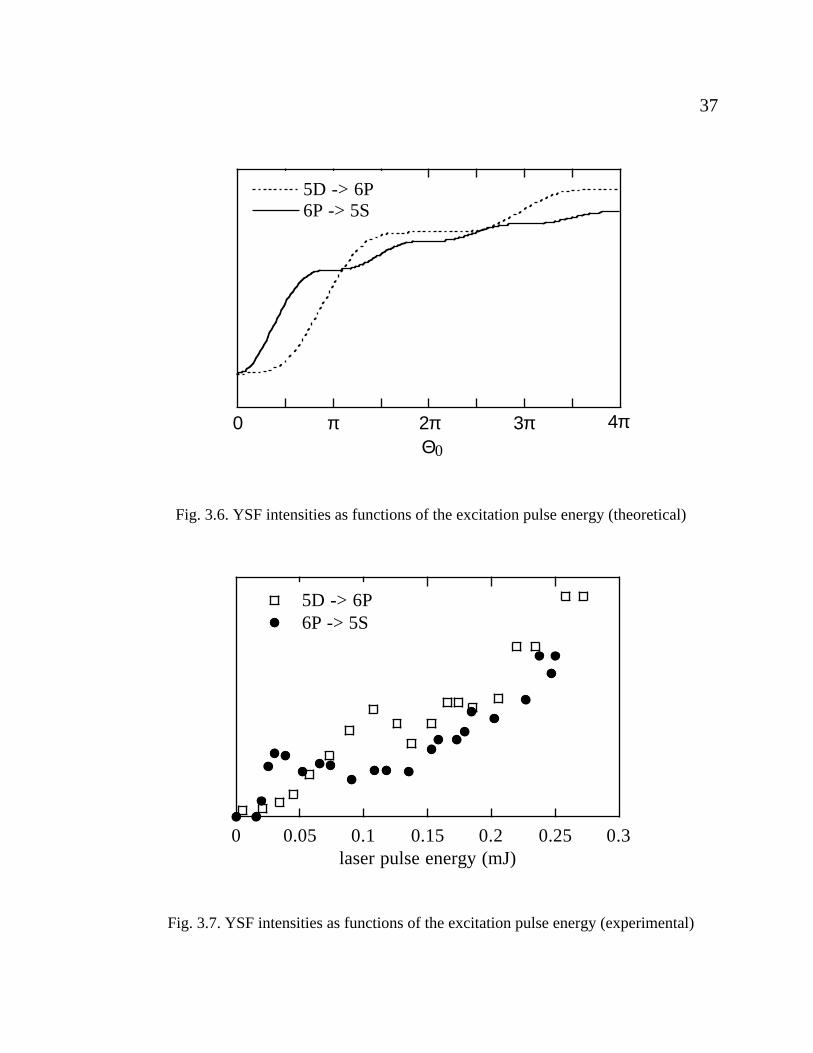
37
5D -> 6P6P -> 5S
Θ0 π 2π 3π 4π
0
Fig. 3.6. YSF intensities as functions of the excitation pulse energy (theoretical)
0 0.05 0.1 0.15 0.2 0.25 0.3
5D -> 6P6P -> 5S
laser pulse energy (mJ)
Fig. 3.7. YSF intensities as functions of the excitation pulse energy (experimental)
38
CHAPTER 4
CONICAL YOKED SUPERFLUORESCENCE
4.1. The idea
The experiments described in the previous chapter did not reliably
demonstrate the omnidirectional character of the upper transition
superfluorescence. The measurements performed with an infrared detector
(Section 3.1.1) have shown to be quite erratic and were spatially restricted
by the oven and cell windows. The character of the upper transition SF thus
had to be verified indirectly, via the method described below.
Consider a situation when the sample is simultaneously excited by
two overlapping non-collinear laser pulses with fields E x t E ei k x t1 10
1( , ) ( )rrr
= −ω
and E x t E ei k x t2 20
2( , ) ( )rr r
= −ω , where ω = ΩSD / 2 and r rk k cSD1 2 2= = Ω / ,
Ω's denoting the optical frequencies of designated transitions. The two-photon
excitation is a function of the second power of the field, i.e.
( ) ( ) ( ) ( )E E E e E e E E ei t k x i t k x i t k x k x1 2
2102 2
202 2
10 2021 2 1 22+ = + +− − − −ω ω ωr r r r
(4.1)
The first two terms of the above expression yield two YSF pulses along the
two laser directions in the manner described above. The last term of equation
(4.1), however, results in a coherent superposition characterized by wavevector
r rk k1 2+ .
39
αγ
r k 2
r k 2
r k 1
r k 1
r k DP
r k DP
r k PS
r k PS
r k 1 +
r k 2
r k 1 +
r k 2
(a) (b)
β
αγ
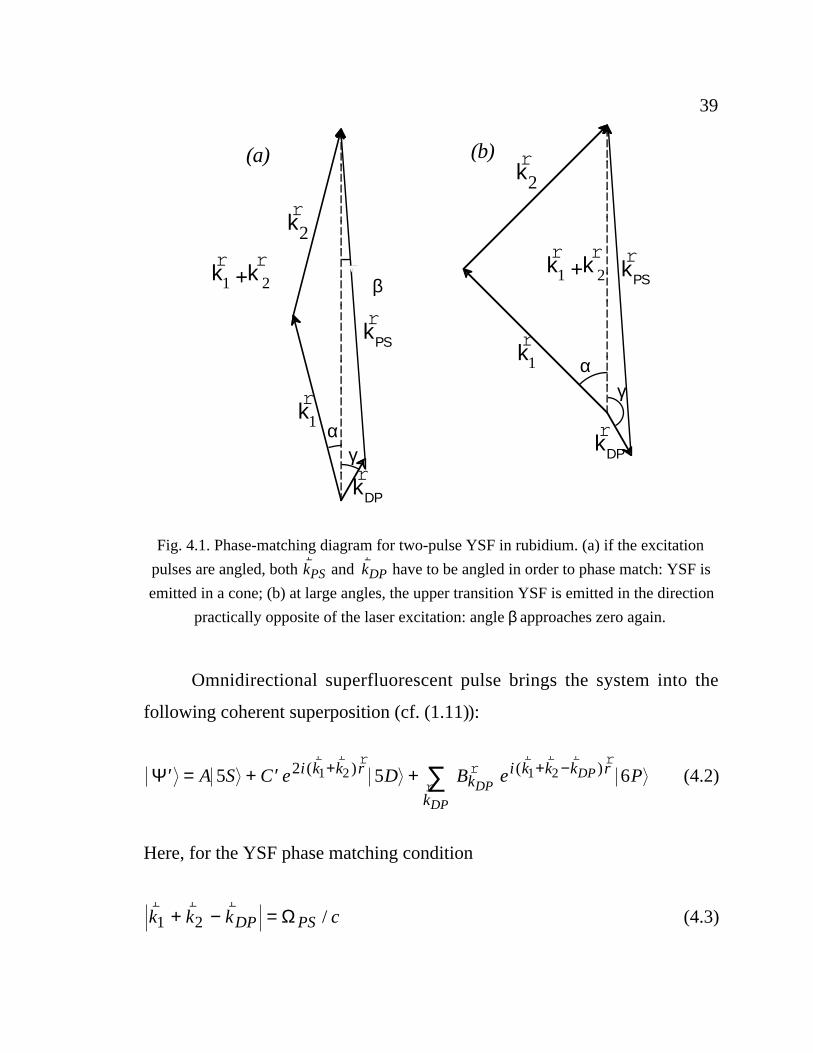
Fig. 4.1. Phase-matching diagram for two-pulse YSF in rubidium. (a) if the excitation
pulses are angled, both rkPS and
rkDP have to be angled in order to phase match: YSF is
emitted in a cone; (b) at large angles, the upper transition YSF is emitted in the direction
practically opposite of the laser excitation: angle β approaches zero again.
Omnidirectional superfluorescent pulse brings the system into the
following coherent superposition (cf. (1.11)):
′ = + ′ ++ + −∑Ψ A S C e D B e Pi k k r
kk
i k k k r
DP
DPDP5 5 62 1 2 1 2( ) ( )
r r r
rr
r r r r(4.2)
Here, for the YSF phase matching condition
r r rk k k cDP PS1 2+ − = Ω / (4.3)
40
to be met, rkDP has to be angled with respect to
r rk k1 2+ (fig. 4.1). The
resulting superradiant pulse on the lower transition also appears at an angle,
so as to satisfy the relation
r r r rk k k kDP PS1 2+ = + . (4.4)
This angle, determined from equation (4.4), is given by
k k k kkDP PS PS2 2 22 4= + −( cos ) cos cosα α β (4.5)
where 2 1 2α = ∠ ( , )r rk k , β = ∠ +( , )
r r rk k kPS 1 2 .
Note that due to axial symmetry of the above equations with respect tor rk k1 2+ , the YSF emission should in fact be conical, with the axis along the
bisector of rk1 and
rk2.
The above treatment was developed for 5 6D P→ superfluorescence
occurring along a given direction rkDP. Actually, the upper transition
superfluorescence "does not care" about phase-matching and has no directional
restrictions except those imposed by gain, i.e. sample geometry (See Section
1.5.). The lower transition just selects among the omnidirectional set of
rkDP's those that can satisfy eq. (4.4). Therefore, if we do see a cone of
superradiance at given α, that would be an indication that there was
superfluorescence on the upper transition along the rkDP's associated with
this α.
41
0
2
4
6
8
10
12
0 10 20 30 40 50 60 70
180
150
120
90
30
0
2β(d
egre
es)
γ(d
egre
es)
2α (degrees)
2β
γ
60
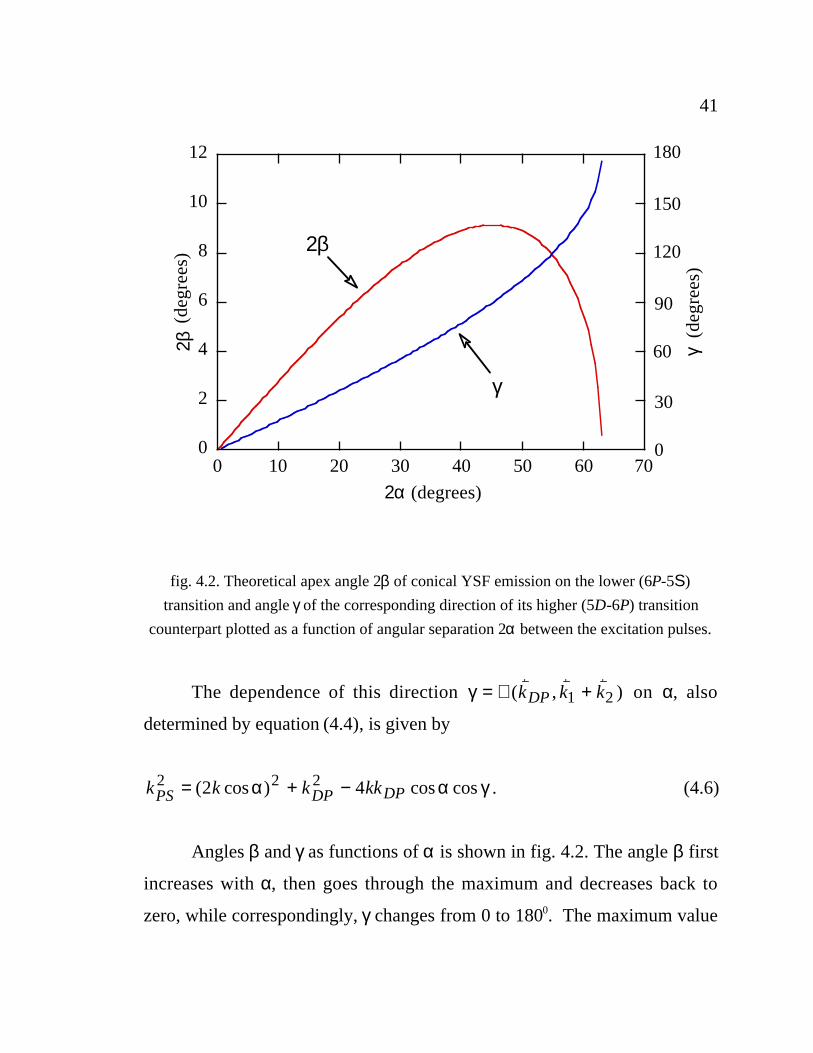
fig. 4.2. Theoretical apex angle 2β of conical YSF emission on the lower (6P-5S)
transition and angle γ of the corresponding direction of its higher (5D-6P) transition
counterpart plotted as a function of angular separation 2α between the excitation pulses.
The dependence of this direction γ = ∠ +( , )r r rk k kDP 1 2 on α, also
determined by equation (4.4), is given by
k k k kkPS DP DP2 2 22 4= + −( cos ) cos cosα α γ . (4.6)
Angles β and γ as functions of α is shown in fig. 4.2. The angle β first
increases with α, then goes through the maximum and decreases back to
zero, while correspondingly, γ changes from 0 to 1800. The maximum value

42of the cone apex angle 2β corresponds to the case where
rkDP is perpendicular
to rkPS , while β = 0 corresponds to the selected component of
superfluorescence being emitted either in the forward (γ=0) or backward
(γ=1800) directions.
Since the angle γ runs throughout the range from 0 to 1800 when α is
varied, the observation of the lower transition conical emission for all values
of α from 0 to 620 would prove the omnidirectional character of the upper
transition superfluorescence.
4.2. Experiment
Our Ti:Sapphire laser system generated a train of 4-ps, 0.5-mJ optical
pulses two-photon resonant with the 5S-5D Rb transition. The laser system
output was split into two 0.5 cm diameter beams of equal intensity and the
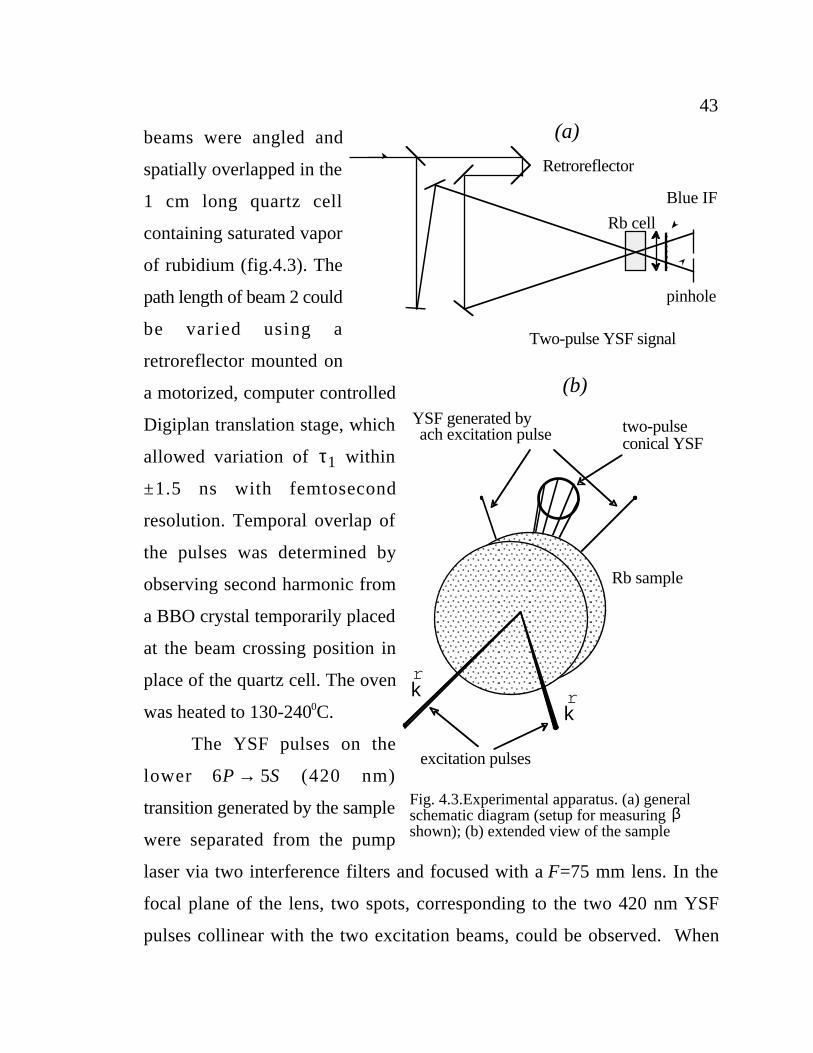
43
beams were angled and
spatially overlapped in the
1 cm long quartz cell
containing saturated vapor
of rubidium (fig.4.3). The
path length of beam 2 could
be varied using a
retroreflector mounted on
a motorized, computer controlled
Digiplan translation stage, which
allowed variation of τ1 within
±1.5 ns with femtosecond
resolution. Temporal overlap of
the pulses was determined by
observing second harmonic from
a BBO crystal temporarily placed
at the beam crossing position in
place of the quartz cell. The oven
was heated to 130-2400C.
The YSF pulses on the
lower 6 5P S→ (420 nm)
transition generated by the sample
were separated from the pump
laser via two interference filters and focused with a F=75 mm lens. In the
focal plane of the lens, two spots, corresponding to the two 420 nm YSF
pulses collinear with the two excitation beams, could be observed. When
Fig. 4.3.Experimental apparatus. (a) general schematic diagram (setup for measuring shown); (b) extended view of the sample
β
Rb sample
excitation pulses
r k
r k
YSF generated by ach excitation pulse two-pulse
conical YSF
(b)
(a)
Rb cell
pinhole
Blue IF
Two-pulse YSF signal
Retroreflector
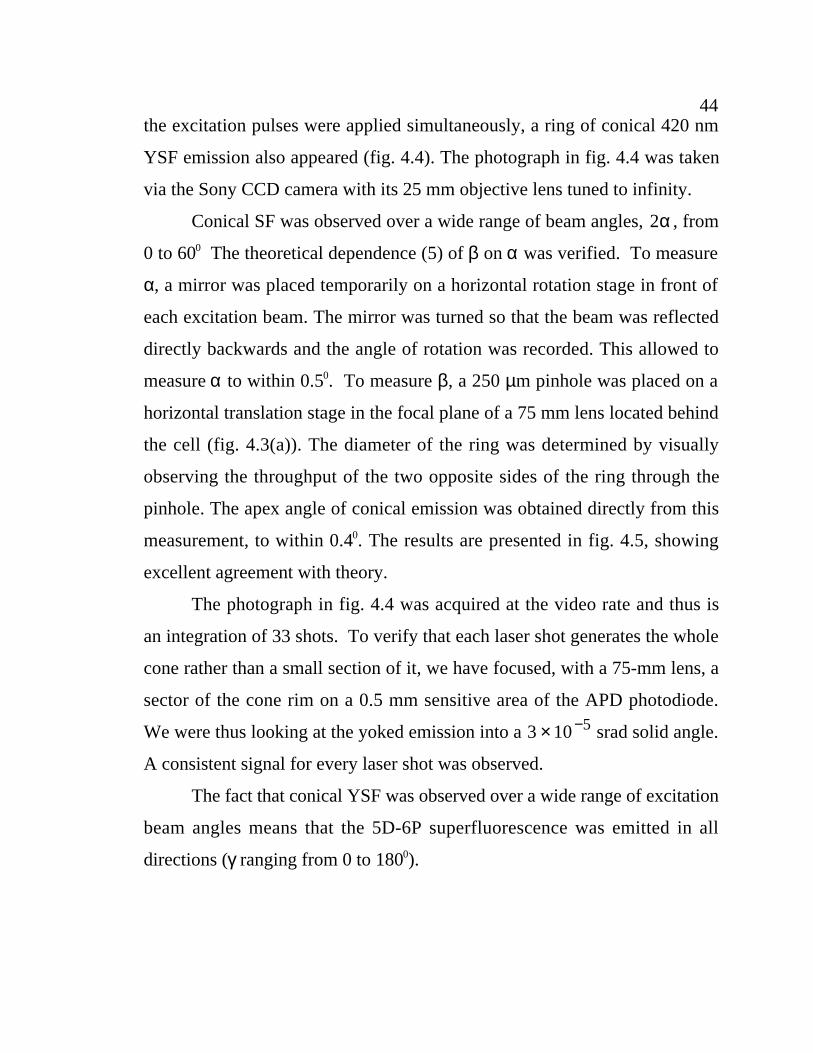
44the excitation pulses were applied simultaneously, a ring of conical 420 nm
YSF emission also appeared (fig. 4.4). The photograph in fig. 4.4 was taken
via the Sony CCD camera with its 25 mm objective lens tuned to infinity.
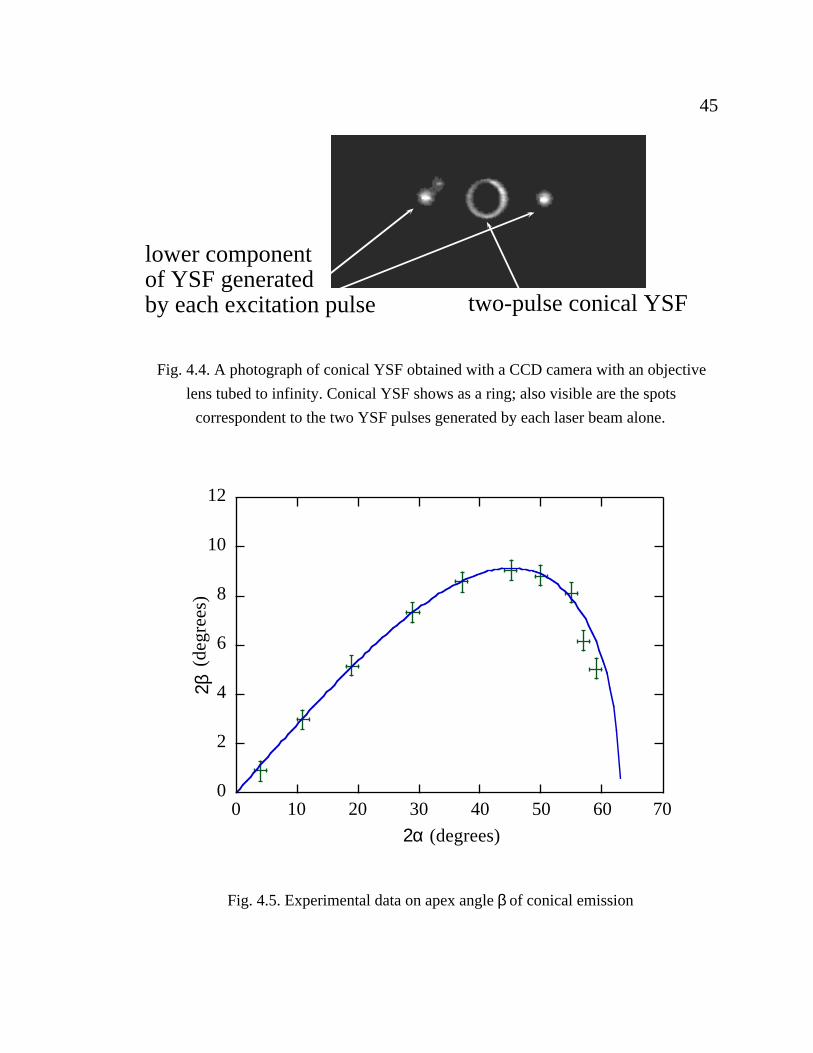
Conical SF was observed over a wide range of beam angles, 2α , from
0 to 600 The theoretical dependence (5) of β on α was verified. To measure
α, a mirror was placed temporarily on a horizontal rotation stage in front of
each excitation beam. The mirror was turned so that the beam was reflected
directly backwards and the angle of rotation was recorded. This allowed to
measure α to within 0.50. To measure β, a 250 µm pinhole was placed on a
horizontal translation stage in the focal plane of a 75 mm lens located behind
the cell (fig. 4.3(a)). The diameter of the ring was determined by visually
observing the throughput of the two opposite sides of the ring through the
pinhole. The apex angle of conical emission was obtained directly from this
measurement, to within 0.40. The results are presented in fig. 4.5, showing
excellent agreement with theory.
The photograph in fig. 4.4 was acquired at the video rate and thus is
an integration of 33 shots. To verify that each laser shot generates the whole
cone rather than a small section of it, we have focused, with a 75-mm lens, a
sector of the cone rim on a 0.5 mm sensitive area of the APD photodiode.
We were thus looking at the yoked emission into a 3 10 5× − srad solid angle.
A consistent signal for every laser shot was observed.
The fact that conical YSF was observed over a wide range of excitation
beam angles means that the 5D-6P superfluorescence was emitted in all
directions (γ ranging from 0 to 1800).
45
lower componentof YSF generatedby each excitation pulse two-pulse conical YSF
Fig. 4.4. A photograph of conical YSF obtained with a CCD camera with an objective
lens tubed to infinity. Conical YSF shows as a ring; also visible are the spots
correspondent to the two YSF pulses generated by each laser beam alone.
0
2
4
6
8
10
12
0 10 20 30 40 50 60 70
2β(d
egre
es)
2α (degrees)
Fig. 4.5. Experimental data on apex angle β of conical emission
46
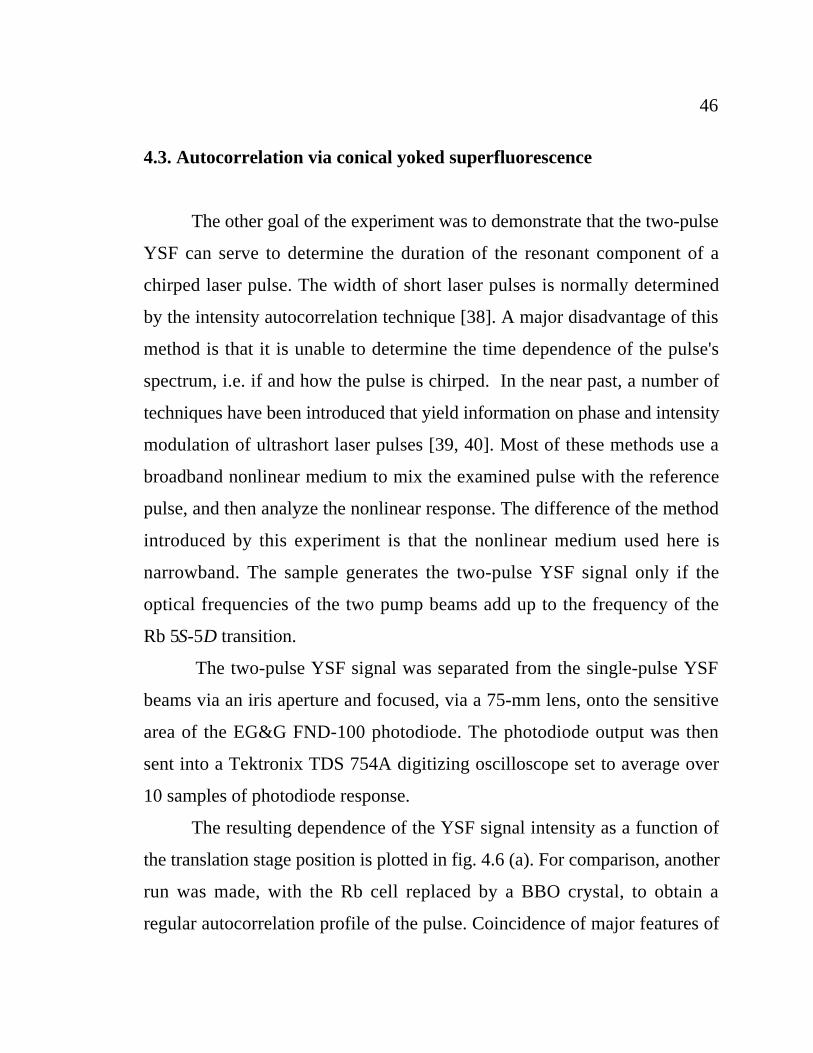
4.3. Autocorrelation via conical yoked superfluorescence
The other goal of the experiment was to demonstrate that the two-pulse
YSF can serve to determine the duration of the resonant component of a
chirped laser pulse. The width of short laser pulses is normally determined
by the intensity autocorrelation technique [38]. A major disadvantage of this
method is that it is unable to determine the time dependence of the pulse's
spectrum, i.e. if and how the pulse is chirped. In the near past, a number of
techniques have been introduced that yield information on phase and intensity
modulation of ultrashort laser pulses [39, 40]. Most of these methods use a
broadband nonlinear medium to mix the examined pulse with the reference
pulse, and then analyze the nonlinear response. The difference of the method
introduced by this experiment is that the nonlinear medium used here is
narrowband. The sample generates the two-pulse YSF signal only if the
optical frequencies of the two pump beams add up to the frequency of the
Rb 5S-5D transition.
The two-pulse YSF signal was separated from the single-pulse YSF
beams via an iris aperture and focused, via a 75-mm lens, onto the sensitive
area of the EG&G FND-100 photodiode. The photodiode output was then
sent into a Tektronix TDS 754A digitizing oscilloscope set to average over
10 samples of photodiode response.
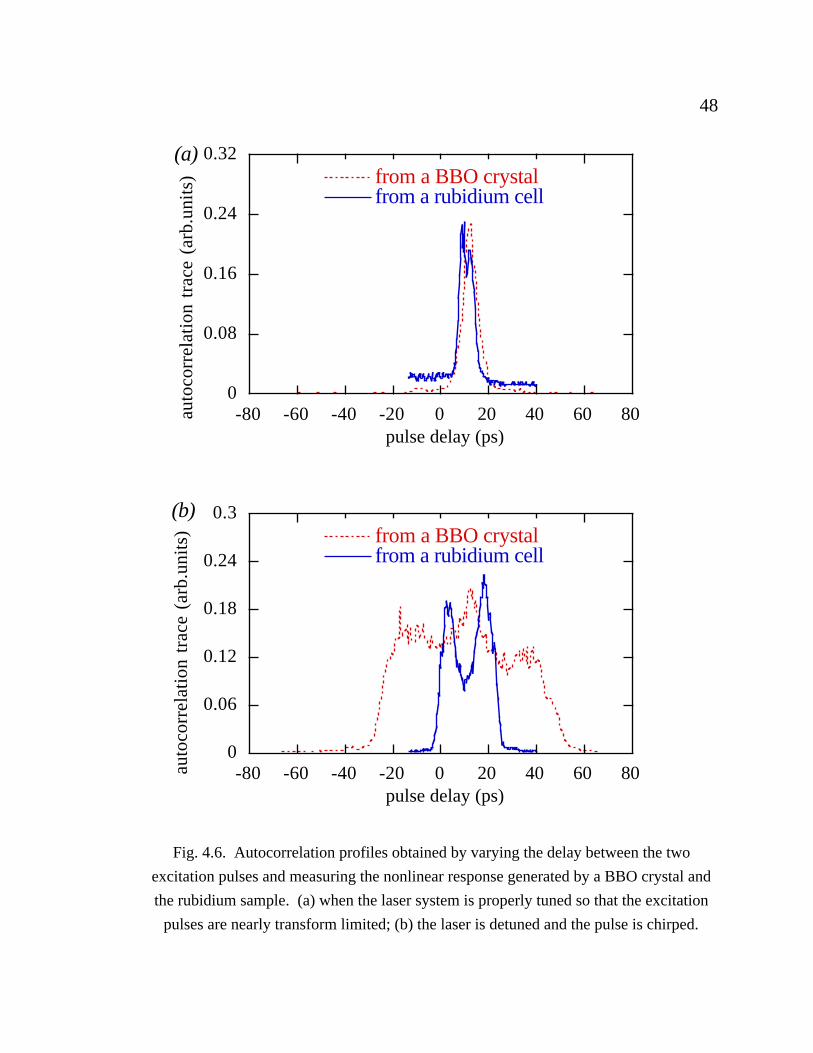
The resulting dependence of the YSF signal intensity as a function of
the translation stage position is plotted in fig. 4.6 (a). For comparison, another
run was made, with the Rb cell replaced by a BBO crystal, to obtain a
regular autocorrelation profile of the pulse. Coincidence of major features of
47the two autocorrelation profiles shows that the pump pulse was nearly transform
limited.
As mentioned in Section 2.1, our laser system stretched the laser
pulses in duration before entering the regenerative amplifier in order to
reduce their peak power, and recompressed them after amplification. Slight
misalignment of the compressor, however, results in some residual chirp in
the output pulse. Fig. 4.6 (b) shows the two autocorrelation profiles of the
pulse produced by the amplifier with such a misaligned compressor. Now,
while the autocorrelation performed with the crystal shows the total duration
of the pulse, the profile obtained with conical YSF clearly exhibits the structure
of the chirp. There are two separate peaks associated with the two-photon
resonance frequency, each of those being about 6 ps in duration.
48
0
0.06
0.12
0.18
0.24
0.3
-80 -60 -40 -20 0 20 40 60 80
from a BBO crystalfrom a rubidium cell
pulse delay (ps)
auto
corr
elat
ion
trac
e (a
rb.u
nits
)
(b)
Fig. 4.6. Autocorrelation profiles obtained by varying the delay between the two
excitation pulses and measuring the nonlinear response generated by a BBO crystal and
the rubidium sample. (a) when the laser system is properly tuned so that the excitation
pulses are nearly transform limited; (b) the laser is detuned and the pulse is chirped.
0
0.08
0.16
0.24
0.32
-80 -60 -40 -20 0 20 40 60 80
from a BBO crystalfrom a rubidium cell
pulse delay (ps)
auto
corr
elat
ion
trac
e (a
rb.u
nits
)
(a)
49
CHAPTER 5SUPERFLUORESCENT TRANSIENT DIFFRACTION
5.1. Review of photon echoes
While the YSF emissions discussed below do not formally belong to
the class of photon echoes, they are closely related and governed by the
same mechanisms. Since understanding of these mechanisms is essential to
conceive the properties of the superfluorescent transient diffraction, we begin
the chapter with a brief review of known types of photon echoes.
Photon echo (PE) is an optical coherent response of a resonant medium
to a sequence of two or more short powerful laser pulses. A simplest case is
two-pulse photon echo, where two laser pulses applied at moments t = 0 and
t = τ generate an echo signal centered at t = 2τ . Here the first pulse creates
macroscopic polarization in the sample which dissipates due to inhomogeneous
dephasing. This dephasing is reversed by the second pulse, resulting in
formation of macroscopic dipole moment and superradiant echo pulse. Photon
echo is emitted in the direction of r r rk k ke = −2 2 1, where
rk 's denote the
wavevectors of the two excitation pulses.
A necessary condition for the existence of PE is that the pulse separation
does not exceed homogeneous dephasing time, associated with irreversible
decay of coherent polarization:
T T2 2* < < ′τ , (5.1)
where T2* is the inverse inhomogeneous bandwidth (associated with Doppler
effect in gases) and ′T2 is the homogeneous lifetime, defined as
50
′( ) = ( ) + ( )− − −T T T21
11
212 . (5.2)
In the above equation, T1 and T2 are, respectively, longitudinal and transverse
relaxation times. Inequality (5.1) allows application of PE to determine the
homogeneous lifetime of the system, making it a powerful tool of Doppler-free
spectroscopy.
An RF analog of photon echo, known as spin echo, has been first
observed by Hahn et al. in 1950 [41]. Following the invention of laser,
photon echoes were experimentally observed [35, 42] in ruby. Shortly
afterwards, echo experiments were extended to gases [43, 44] which were
previously believed to be incapable of generating echoes [45].
In 1970, observation of stimulated photon echoes was reported [46,
47]. A stimulated echo appears at t = +τ τ1 2 along r r r rk k k ke = + −3 2 1 upon
excitation by three laser pulses, applied at t = 0, t = τ1 and t = τ2. The first
excitation pulse produces coherent superposition between the ground and
excited states which is then transferred by the second pulse into a coherent
superposition separately between the ground states and between the excited
states. In this manner, the ground and excited states "gratings" are formed.
The third pulse then interrogates (scatters on) these gratings, resulting in the
echo emission.
A remarkable property of stimulated echo is that the delay of the third
pulse can be much greater than the homogeneous lifetime. The relaxation
rate of a coherent superposition within a single (especially the ground) state
is much slower than that between the ground and excited states. This feature
has been utilized in long-lived photon echo experiments. First such experiment
51was done by Chen et al. [48]: echoes were observed for the third pulse
delayed by as much as 3 minutes.
If the single-state grating relaxation is of interest, it is necessary that
the second pulse immediately follow the first. In a number of experiments
[49-51], the delay τ1 has been reduced to zero. Two noncollinear pulses
simultaneously entering a sample induce coherence in the form of a transient
induced grating (TIG). The third pulse probing the sample is diffracted by
the grating and scattered by r rk k2 1− . The intensity of the diffracted field
measured as a function of the third pulse delay yields the relaxation rate of
the grating.
When the temporally overlapping excitation pulses are intense the
gratings produce scatter in many orders and echo experiments become very
rich [52, 53]. In [52] standing wave excitation pulses were generated by
deploying temporally overlapping laser pulses into the sample from opposing
directions. A multitude of echoes were produced at times t n ne = +τ ( / )1 21 2 ,
where n1 and n2 are arbitrary integers, when two such pulses separated by τ
were used. In [54] (see Appendix) a pair of slightly noncollinear simultaneous
excitation pulses at t = 0, followed by the third pulse at t = τ , generated a
fan array of coherent emissions at t = 0, t = τ and t = 2τ .
Since in a TIG experiment two first excitation pulses are applied
simultaneously (or shortly apart), the above requirement that T T2 2* < ′ is no
longer important. TIG diffraction can be observed for very short homogeneous
lifetimes [55], in which case the diffracted pulse is emitted simultaneously
with the interrogating laser pulse and inhomogeneous processes play no role.
Accordingly, such a process cannot be considered as a true photon echo. In
our experiment, the homogeneous and inhomogeneous dephasing times are

52magnitudes of the same order, and the question whether the observed YSF
emissions can be called echoes remains open.
Once a ground state grating is formed by two laser pulses, it can be
probed by the third pulse resonant with a different atomic transition, generating
PE on the same transition. This type of photon echo is known as tri-level
echo and was first observed in [56] albeit in a slightly different (two-pulse)
configuration.
5.2. Billiard-ball echo model
Exact quantitative analysis of photon echoes is done by solving optical
Bloch equations and is rather complicated. However, PEs in optically thin
gases, generated by excitation pulses short compared to inverse Doppler
width can be analyzed using the billiard-ball model [57-59] which provides a
simple means of presenting an otherwise complicated experiment. The idea
is to represent the set of atoms in the sample by a wave packet (billiard ball)
and to follow its development in time as it is subjected to short optical
excitation pulses. The size of the billiard ball is determined by the thermal
distribution of atomic momenta, and its density is given by
ρ π( )
/( ) /r r r r
r r R e r r R− =
−− −
0
3 2
20
2
BBBB2
, (5.3)
where rr0 is the position of the billiard ball center, R m k TBB B= h / is the
billiard ball radius, m is the atomic mass, kB is the Boltzmann constant and
T is the temperature. Each excitation pulse generates additional wave packets
which represent the new states the initial wave packet has been coupled to
by the pulse. All wave packets recoil according to the momentum of the
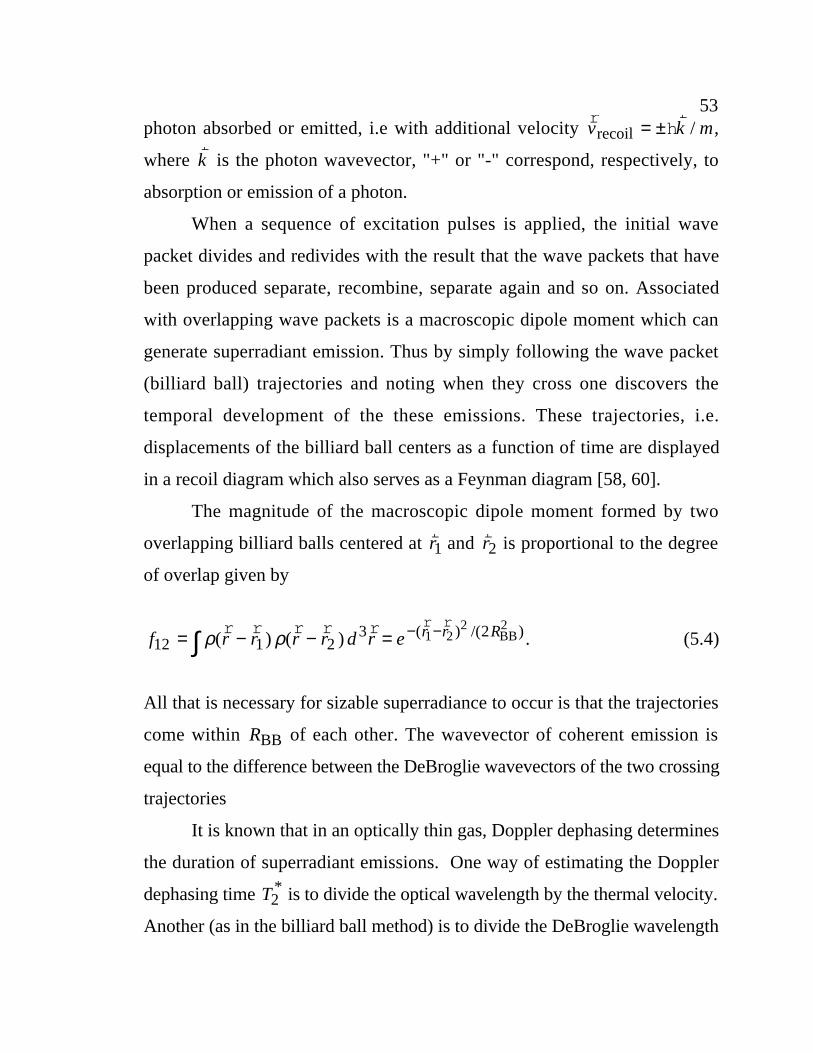
53photon absorbed or emitted, i.e with additional velocity
rhr
v k mrecoil = ± / ,
where rk is the photon wavevector, "+" or "-" correspond, respectively, to
absorption or emission of a photon.
When a sequence of excitation pulses is applied, the initial wave
packet divides and redivides with the result that the wave packets that have
been produced separate, recombine, separate again and so on. Associated
with overlapping wave packets is a macroscopic dipole moment which can
generate superradiant emission. Thus by simply following the wave packet
(billiard ball) trajectories and noting when they cross one discovers the
temporal development of the these emissions. These trajectories, i.e.
displacements of the billiard ball centers as a function of time are displayed
in a recoil diagram which also serves as a Feynman diagram [58, 60].
The magnitude of the macroscopic dipole moment formed by two
overlapping billiard balls centered at rr1 and
rr2 is proportional to the degree
of overlap given by
f r r r r d r e r r R12 1 2
3 21 22
= − − =∫ − −ρ ρ( ) ( ) ( ) /( )r r r r r r rBB2
. (5.4)
All that is necessary for sizable superradiance to occur is that the trajectories
come within RBB of each other. The wavevector of coherent emission is
equal to the difference between the DeBroglie wavevectors of the two crossing
trajectories
It is known that in an optically thin gas, Doppler dephasing determines
the duration of superradiant emissions. One way of estimating the Doppler
dephasing time T2* is to divide the optical wavelength by the thermal velocity.
Another (as in the billiard ball method) is to divide the DeBroglie wavelength

54of the atomic wavepacket ( RBB) by the atomic recoil velocity
rvrecoil. Both
methods give identical results.
An example is shown in fig 5.1 which displays a recoil diagram for a
conventional stimulated photon echo experiment in which excitation pulses
are applied at t = 0, t = τ1 and t = τ2. Here the first two pulses generate a
photon echo (associated with the crossing at t = 2 1τ ), a ground state grating
(two horizontal trajectories) and an excited state grating (two positively
sloped trajectories). If τ 2 1>> T , the excited state grating decays by the time
of arrival of the third pulse, and a stimulated echo is generated at the crossing
point at t = +τ τ1 2, along r r r rk k k ke = + −3 2 1.
τ1 τ 2 τ 2 + τ10 2τ1
r k 1 −
r k 2
0
r k 1
r k 2
r k 1 −
r k 2 +
r k 3
r k 3
τ 2 − τ1
Fig. 5.1. Recoil diagram of a stimulated photon echo experiment
The distance between the centers of the two billiard balls associated
with the trajectories crossing at t = +τ τ1 2 is r rr r v t1 2 1 2− = − −recoil ( )τ τ .
Substituting this into (5.4), we find that the echo field amplitude is proportional
to
55
f t tk t k T
mτ τ θ ττ τ
1 2 2
21 2
2
2+ = − −− −
( ) ( ) exp
( ) B (5.5)
= − −− −
θ τ π τ τ
( ) exp( )
( )*t
t
T2
1 22
224
Here θ τ( )t − 2 is the Heavyside step function that enforces causality. As
expected, the duration of the echo pulse is on the order of T2*.
If τ1 2≤ T *, there will be also an echo associated with the extrapolated
crossing at τ τ2 1− , in the direction of r r r rk k k ke = + −3 1 2. The amplitude of
this echo is given by
f t tt
Tτ τ θ τ π τ τ
2 1 21 2
2
224− = − −
+ −
( ) ( ) exp
( )
( )*. (5.6)
This echo will be weaker than the one given by (5.5) as the center of the
Gaussian bell is located to the left of the Heavyside step.
We also note that all conventional echoes are subject to the phase
matching condition, i.e. the equality
rk ke = (5.7)
must hold within the margins of ± −L 1, where L is the sample length.
5.3. Superfluorescent transient diffraction: physical mechanism
Superfluorescent transient diffraction (SFTD) emissions reported in
the present thesis appear in an experimental setting somewhat similar to a
classical stimulated PE experiment. The sample is irradiated by a sequence
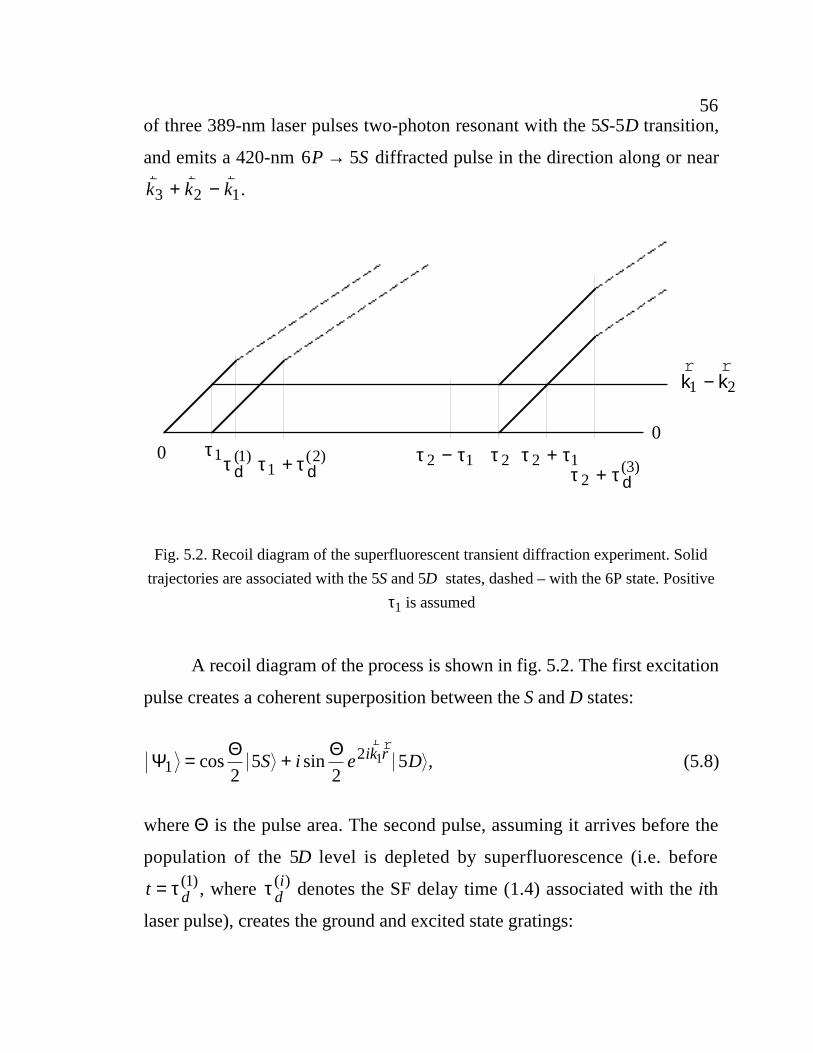
56of three 389-nm laser pulses two-photon resonant with the 5S-5D transition,
and emits a 420-nm 6 5P S→ diffracted pulse in the direction along or near
r r rk k k3 2 1+ − .
τ1 τ 2 τ 2 + τ10
r k 1 −
r k 2
0τ 2 − τ1τ d
(1)τ 2 + τ d
(3)τ1 + τ d(2)
Fig. 5.2. Recoil diagram of the superfluorescent transient diffraction experiment. Solid
trajectories are associated with the 5S and 5D states, dashed – with the 6P state. Positive
τ1 is assumed
A recoil diagram of the process is shown in fig. 5.2. The first excitation
pulse creates a coherent superposition between the S and D states:
Ψ Θ Θ1
2
25
251= +cos sinS i e Dik r
rr, (5.8)
where Θ is the pulse area. The second pulse, assuming it arrives before the
population of the 5D level is depleted by superfluorescence (i.e. before
t d= τ ( )1 , where τ di( ) denotes the SF delay time (1.4) associated with the ith
laser pulse), creates the ground and excited state gratings:
57
Ψ Θ Θ Θ
22 2 2 2 2
2 25
251 2 1 2= −
+ +
−cos sin sin( )e S i e e Di k k r ik r ik rr r r rr r r
(5.9)
(in this and following equations we have omitted the factors associated with
the time evolution of the states). Gratings are now formed within the 5S and
5D states, both characterized by wavevector 2 1 2r rk k−( ). Since the third
pulse comes at a substantial delay, by the time it arrives the population of the
5D level is negligible because of superfluorescence relaxation. On the other
hand, the coherence in the 5S state is long lived (see above). Therefore, it is
only the first term in (5.9) that needs to be taken into account. The third
excitation pulse modifies the system as follows:
Ψ Θ Θ Θ Θ
32 2 2 2
2 2 25
251 2 3= −
+
−cos sin cos sin( )e S i e Di k k r ik rr r r rr
(5.10)
so that now there are coherent superpositions between 5S and 5D, characterized
by the following wavevectors (for positive τ1): 2 3rk (trajectories crossing at
t = τ2), 2 3 1 2r r rk k k+ −( ) (extrapolated crossing at t = −τ τ2 1) and
2 3 2 1r r rk k k+ −( ) (crossing at t = +τ τ2 1).
A direct dipole transition between levels 5D and 5S is prohibited by
selection rules. However, the third pulse causes omnidirectional
superfluorescence that occurs at t d= +τ τ23( ) and coherently transfers
population from 5D to 6P, changing (5.10) to the form
58
′ = −
∑ −Ψ Θ Θ
32 2 2
2 21 2
r
r r r
k
i k k r
DP
ecos sin ( ) (5.11)
× + +
−cos sin sin ( )Θ Θ Θ2
52
52
62 23 3S iA e D B e Pik r i k k rDPrr r r r
,
where
rkDP represents an omnidirectional set of vectors along which
superfluorescence occurs, A and B are normalization constants. The 5 6D P→
emission is followed by the yoked 6 5P S→ emission along such wavevectorsrkPS for which there is a counterpart among the omnidirectional set of
rkDP's
that would satisfy
r r rk k kDP PS DS+ = (5.12)
where rkDS is the wavevector which characterizes coherent superposition
between 5D and 5S. The latter can be not only 2 3rk (as in the case of
single-pulse YSF) but also, subject to Doppler rephasing, 2 3 2 1r r rk k k+ −( )
and 2 3 1 2r r rk k k+ −( ). The 5D-5S coherent superposition associated with one
of these wavevectors leads to emission of an SFTD pulse.
Superfluorescent transient diffraction resembles tri-level echo in the
sense that the diffracted pulse is observed on a different transition (6P-5S)
than the 5D-5S where the original grating is formed. The difference is that
the coherent population transfer to 6P is done by omnidirectional
superfluorescence rather than a directional laser pulse.
If the first two excitation pulses are temporally overlapping, the transient
grating can also be created via a two-photon process involving absorption of
a photon from pulse 1 and stimulated emission into pulse 2. This process
leads to a coherent superposition in the 5S state characterized by wavevector
59
r rk k1 2− (as well as
r rk k2 1− ). Upon application of pulse 3, this superposition
results in a yoked 6 5P S→ emission whose direction is determined by
(5.12) with rkDS being either 2 3 2 1
r r rk k k+ − or 2 3 1 2
r r rk k k+ − . We call this
type of TIG "two-photon grating" to distinguish from the discussed above
"four-photon grating" which does not require a temporal overlap between
the two laser pulses.
5.4. Spatial properties
Equation (5.12) can be satisfied only if
r r rk k kDP PS DS+ ≥ . (5.13)
For both types of superfluorescent gratings, r r rk kDS = ±2 3 ∆ ,
r∆ being
r rk k2 1−
for the two-photon grating and 2 2 1r rk k−( ) for the four-photon one. Since
r r rk k kDP PS+ = 2 3 , only one of two vectors
2 23 3r r r rk k+ −( )∆ ∆, can satisfy
the triangle inequality (5.13) (fig. 5.3). We adopt the following convention:
independent of the order of their arrival, we define pulses 1 and 2 so that
2 3r rk + ∆ is the shorter among the two. This means that SFTD emission
always appears along 2 3 2 1r r rk k k+ −( ) or 2 3 2 1
r r rk k k+ − Pulse 2 can come
earlier than pulse 1 – in which case we say that delay τ1 is negative.
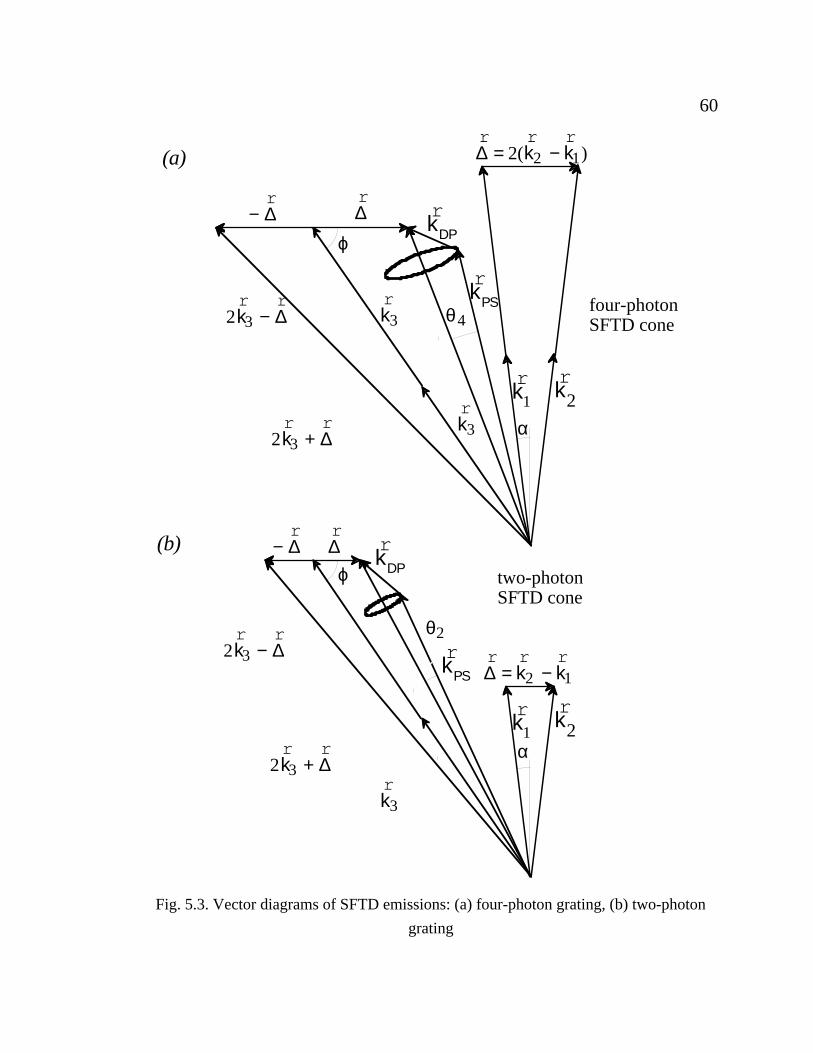
60
α
α
r k 2
r k 1
r k DP
r k PS
(a)
r k 3
r k 3
2r k 3 +
r ∆
2r k 3 −
r ∆
r ∆ −
r ∆
ϕ
(b)
r k DP
r k PS
r k 3
2r k 3 +
r ∆
2r k 3 −
r ∆
r ∆ −
r ∆
ϕ two-photon SFTD cone
four-photon SFTD cone
r k 2
r k 1
θ4
θ2
r ∆ =
r k 2 −
r k 1
r ∆ = 2(
r k 2 −
r k 1)
Fig. 5.3. Vector diagrams of SFTD emissions: (a) four-photon grating, (b) two-photon
grating
61
If inequality (5.13) is valid, phase matching requirement (5.12) is
satisfied if the SFTD signals are emitted in cones, similar to those discussed
in the previous chapter. The axes of the cones lie along 2 3r rk + ∆; their apex
angles 2θ depend on the magnitude of r∆ (i.e. the angle 2α between
rk1 and
rk2) and the angle ϕ between
rk3 and
r rk k2 1− .
We shall now obtain exact quantitative expressions for θ α ϕ( , ). Using
∆ = j k sin α , (5.14)
where j is equal to 2 for the two-photon TIG and 4 for the four-photon one,
k = 2π λ/ is the laser wavenumber, we find that
2 4 42 2 2 2r r
k k jk jk+ = +( ) −∆ sin sin cosα α ϕ (5.15)
(see fig. 5.3). Applying equation (5.12)
r r r rk k kDP PS+ = +2 3 ∆ (5.16)
we obtain
k k k k kDP PS PS
2 2 22 2 2= + + − +r r r r
∆ ∆ cosθ, (5.17)
so that
62
cossin sin cos
sin sin cosθ
α α ϕ
α α ϕj
PS DP
PS
k jk jk k k
k k jk jk=
+ ( ) − + −
+ ( ) −
4 4
2 4 4
2 2 2 2 2
2 2 2, (5.17)
where subscript j indicates the type of the grating. The smaller ϕ, the greater
θ j (see fig. 5.3).
For the four-photon grating, inequality (5.13) is satisfied when
ϕ π α≤ −/ 2 . For ϕ π α= −/ 2 , (5.13) becomes an equality and the cone
collapses into a beam (θ = 0) along 2 3 1 2r r rk k k+ −( ). The three pulses enter
the sample along three legs of a pyramid with a rectangular base (fig. 5.4(a)).
The diffracted pulse is then emitted along the fourth leg. This (or similar)
geometry is a requirement for conventional stimulated PE and TIG
experiments, as only with this configuration perfect phase matching is achieved
[47]. On the other hand, conical SFTD emissions are observed at a variety of
angles, as long as the triangle inequality (5.13) holds.
This is a unique feature of SFTD as a transient grating process, which
is solely due to the omnidirectional character of the 5 6D P→
superfluorescence. The coherent omnidirectional SF flash reveals all coherent
superpositions which were prepared in the sample, either by an immediately
preceding laser pulse or in the form of ground state grating. When the
interrogating pulse arrives, these coherent superpositions manifest themselves
as conical emissions along the phase-matched directions.
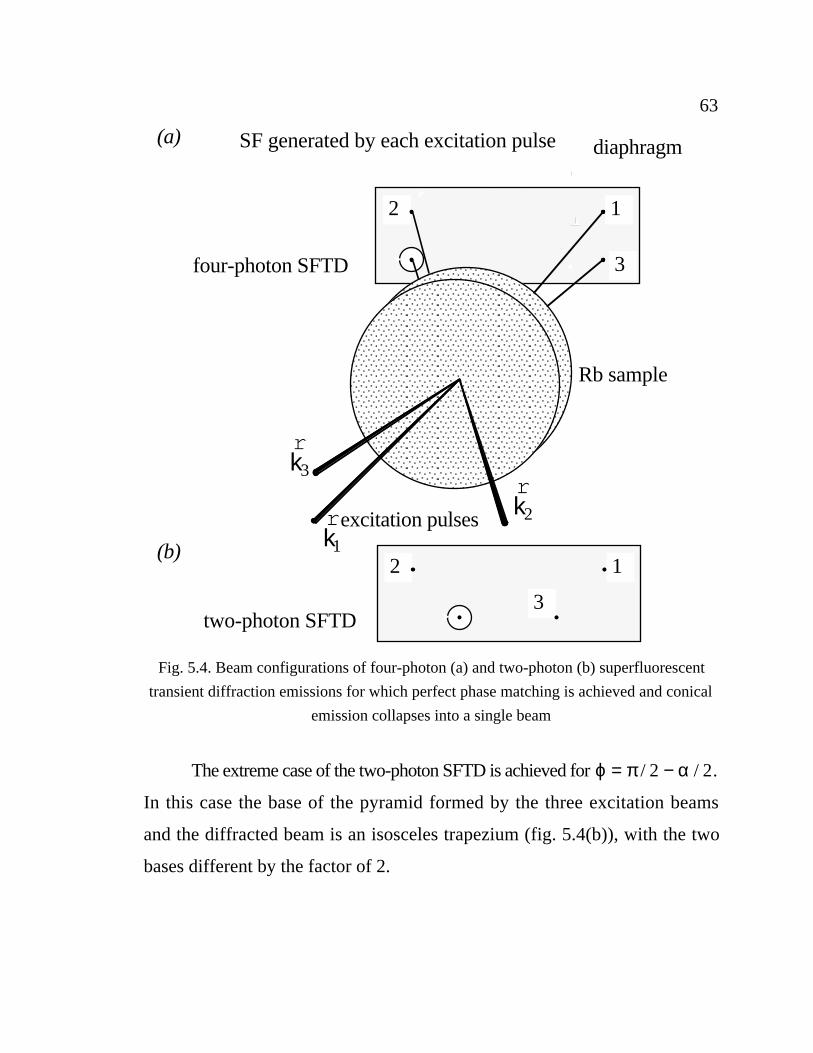
63
SF generated by each excitation pulse
four-photon SFTD
diaphragm(a)
two-photon SFTD
(b)1
3
2
excitation pulses
1
3
2
Rb sample
r k 1
r k 2
r k 3
Fig. 5.4. Beam configurations of four-photon (a) and two-photon (b) superfluorescent
transient diffraction emissions for which perfect phase matching is achieved and conical
emission collapses into a single beam
The extreme case of the two-photon SFTD is achieved for ϕ π α= −/ /2 2.
In this case the base of the pyramid formed by the three excitation beams
and the diffracted beam is an isosceles trapezium (fig. 5.4(b)), with the two
bases different by the factor of 2.
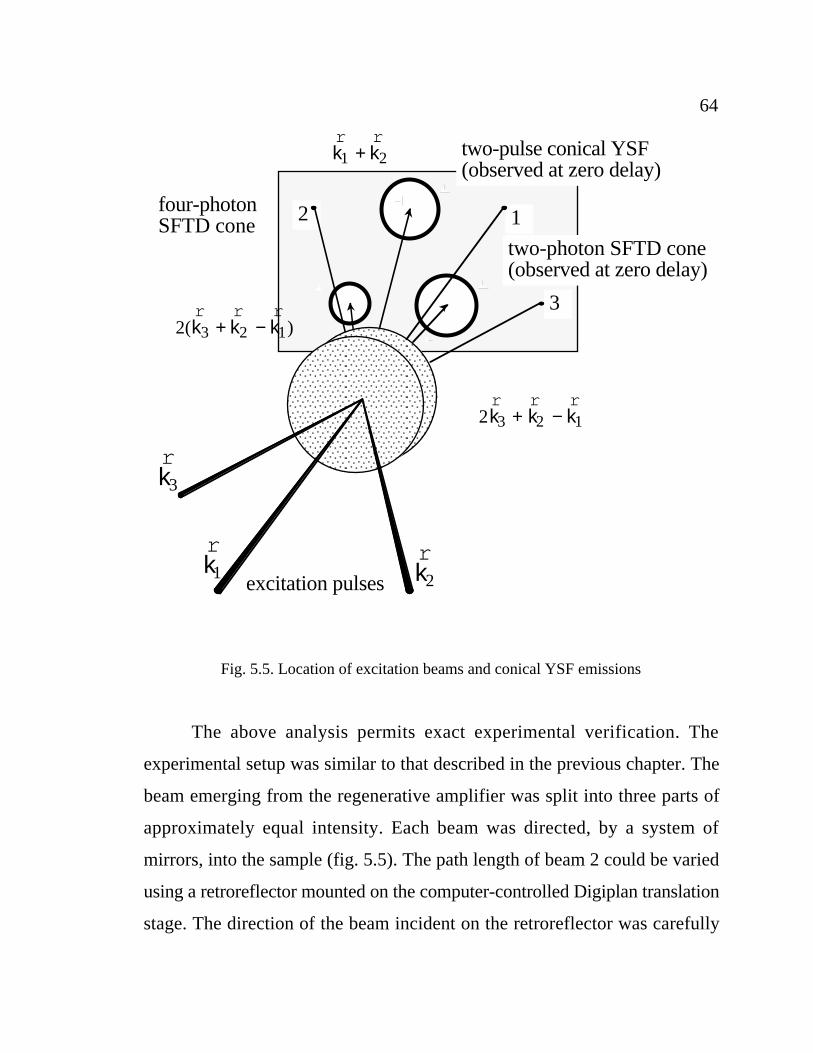
64
excitation pulses
1
3
2
r k 1
r k 2
four-photon SFTD cone
r k 3
two-pulse conical YSF(observed at zero delay)
two-photon SFTD cone(observed at zero delay)
r k 1 +
r k 2
2(r k 3 +
r k 2 −
r k 1)
2r k 3 +
r k 2 −
r k 1
Fig. 5.5. Location of excitation beams and conical YSF emissions
The above analysis permits exact experimental verification. The
experimental setup was similar to that described in the previous chapter. The
beam emerging from the regenerative amplifier was split into three parts of
approximately equal intensity. Each beam was directed, by a system of
mirrors, into the sample (fig. 5.5). The path length of beam 2 could be varied
using a retroreflector mounted on the computer-controlled Digiplan translation
stage. The direction of the beam incident on the retroreflector was carefully
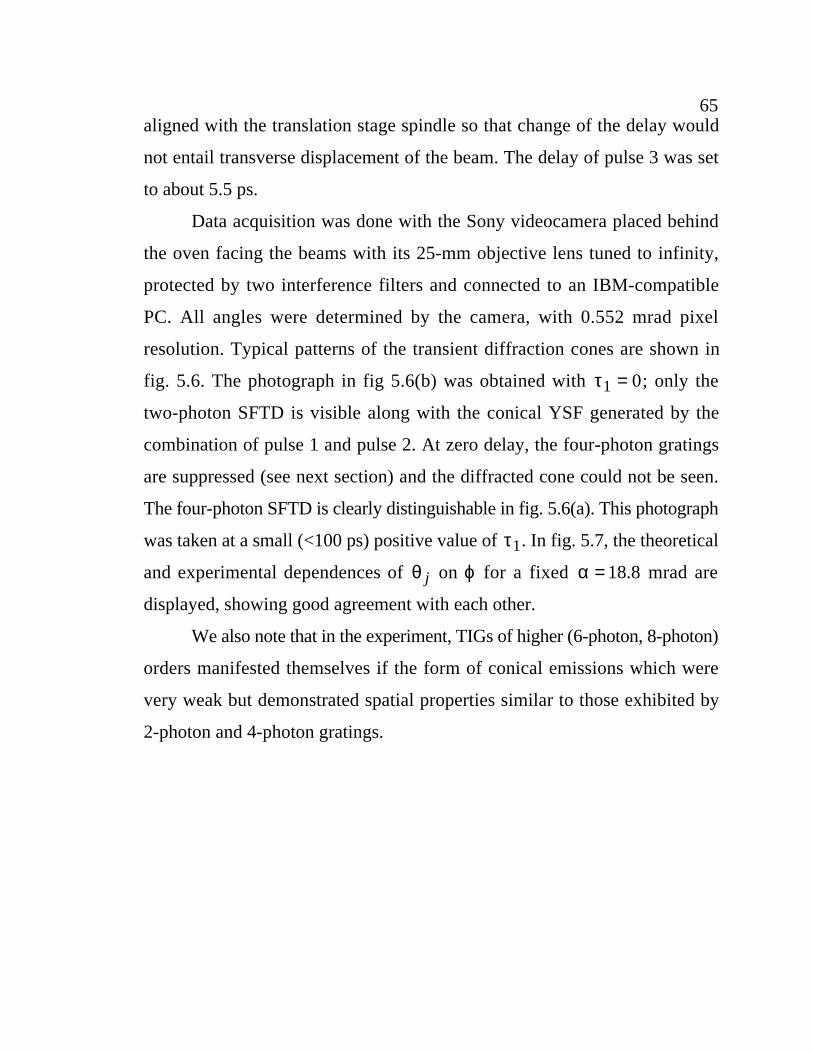
65aligned with the translation stage spindle so that change of the delay would
not entail transverse displacement of the beam. The delay of pulse 3 was set
to about 5.5 ps.
Data acquisition was done with the Sony videocamera placed behind
the oven facing the beams with its 25-mm objective lens tuned to infinity,
protected by two interference filters and connected to an IBM-compatible
PC. All angles were determined by the camera, with 0.552 mrad pixel
resolution. Typical patterns of the transient diffraction cones are shown in
fig. 5.6. The photograph in fig 5.6(b) was obtained with τ1 0= ; only the
two-photon SFTD is visible along with the conical YSF generated by the
combination of pulse 1 and pulse 2. At zero delay, the four-photon gratings
are suppressed (see next section) and the diffracted cone could not be seen.
The four-photon SFTD is clearly distinguishable in fig. 5.6(a). This photograph
was taken at a small (<100 ps) positive value of τ1. In fig. 5.7, the theoretical
and experimental dependences of θ j on ϕ for a fixed α = 18 8. mrad are
displayed, showing good agreement with each other.
We also note that in the experiment, TIGs of higher (6-photon, 8-photon)
orders manifested themselves if the form of conical emissions which were
very weak but demonstrated spatial properties similar to those exhibited by
2-photon and 4-photon gratings.
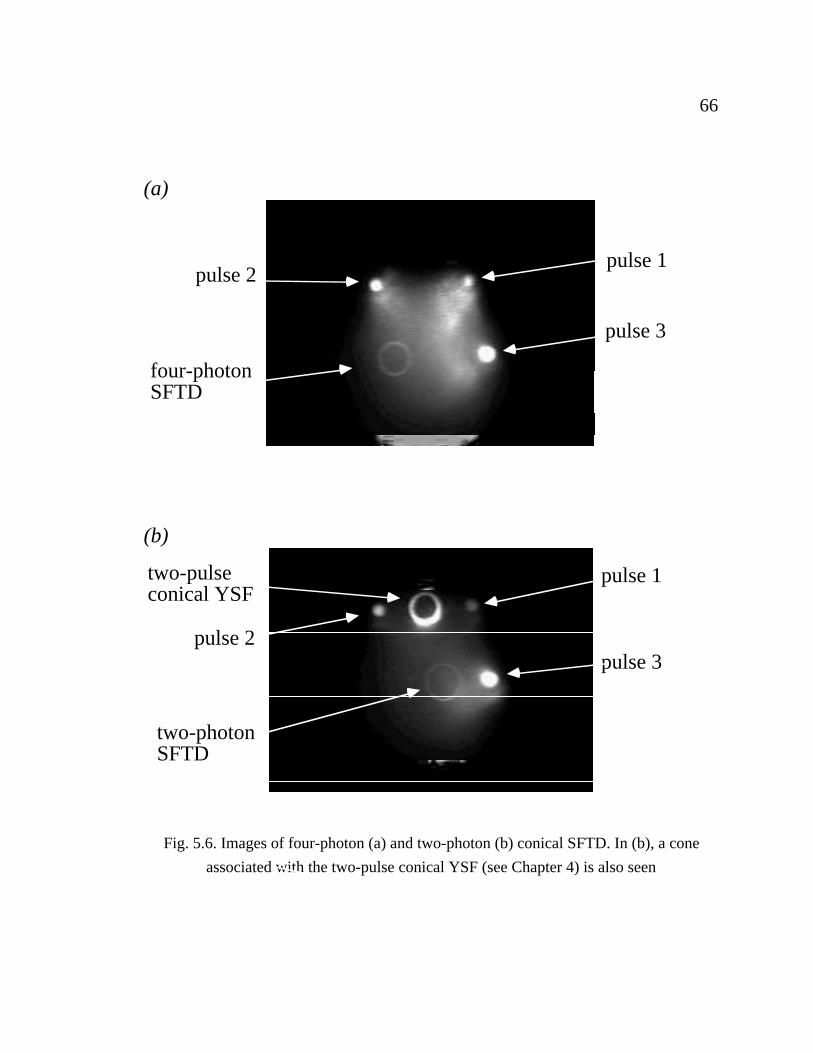
66
(a)
(b)
Fig. 5.6. Images of four-photon (a) and two-photon (b) conical SFTD. In (b), a cone
associated with the two-pulse conical YSF (see Chapter 4) is also seen
pulse 3
two-photon SFTD
pulse 2
pulse 1
pulse 3
pulse 1
pulse 2
four-photon SFTD
two-pulse conical YSF
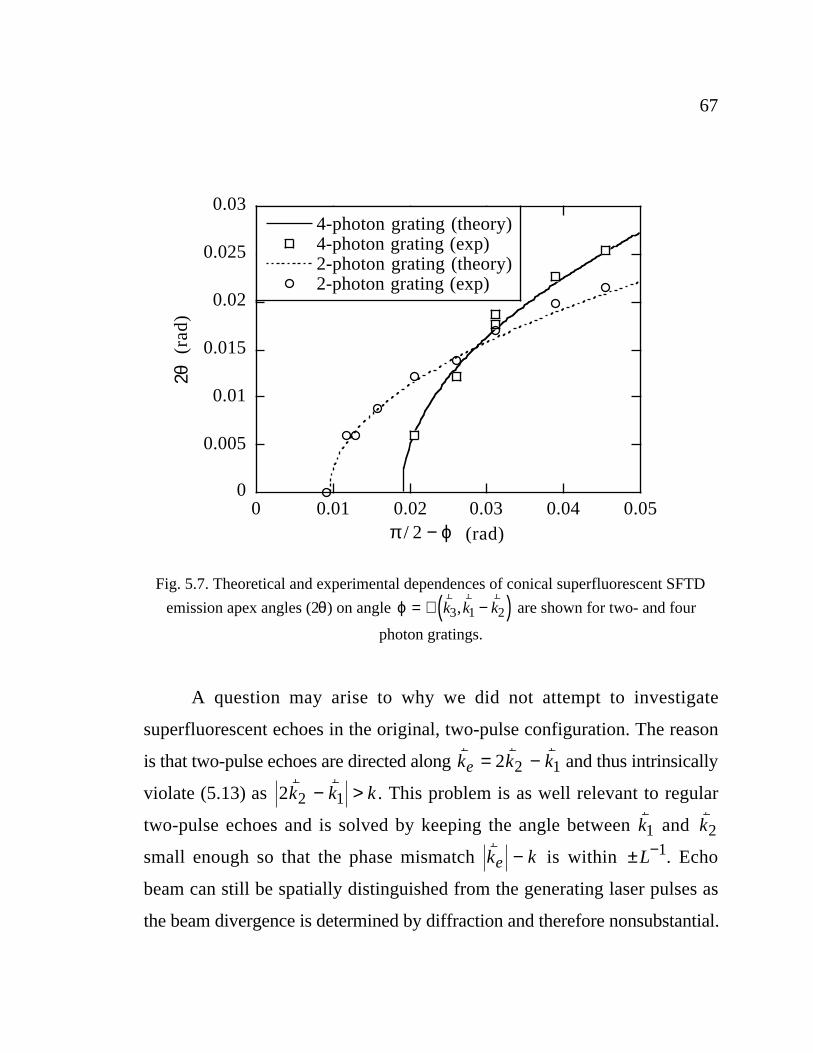
67
0
0.005
0.01
0.015
0.02
0.025
0.03
0 0.01 0.02 0.03 0.04 0.05
4-photon grating (theory)4-photon grating (exp)2-photon grating (theory)2-photon grating (exp)
2θ(r
ad)
(rad)π ϕ/ 2 −
Fig. 5.7. Theoretical and experimental dependences of conical superfluorescent SFTD
emission apex angles (2θ) on angle ϕ = ∠ −( )r r r
k k k3 1 2, are shown for two- and four
photon gratings.
A question may arise to why we did not attempt to investigate
superfluorescent echoes in the original, two-pulse configuration. The reason
is that two-pulse echoes are directed along r r rk k ke = −2 2 1 and thus intrinsically
violate (5.13) as 2 2 1r rk k k− > . This problem is as well relevant to regular
two-pulse echoes and is solved by keeping the angle between rk1 and
rk2
small enough so that the phase mismatch
rk ke − is within ± −L 1. Echo
beam can still be spatially distinguished from the generating laser pulses as
the beam divergence is determined by diffraction and therefore nonsubstantial.
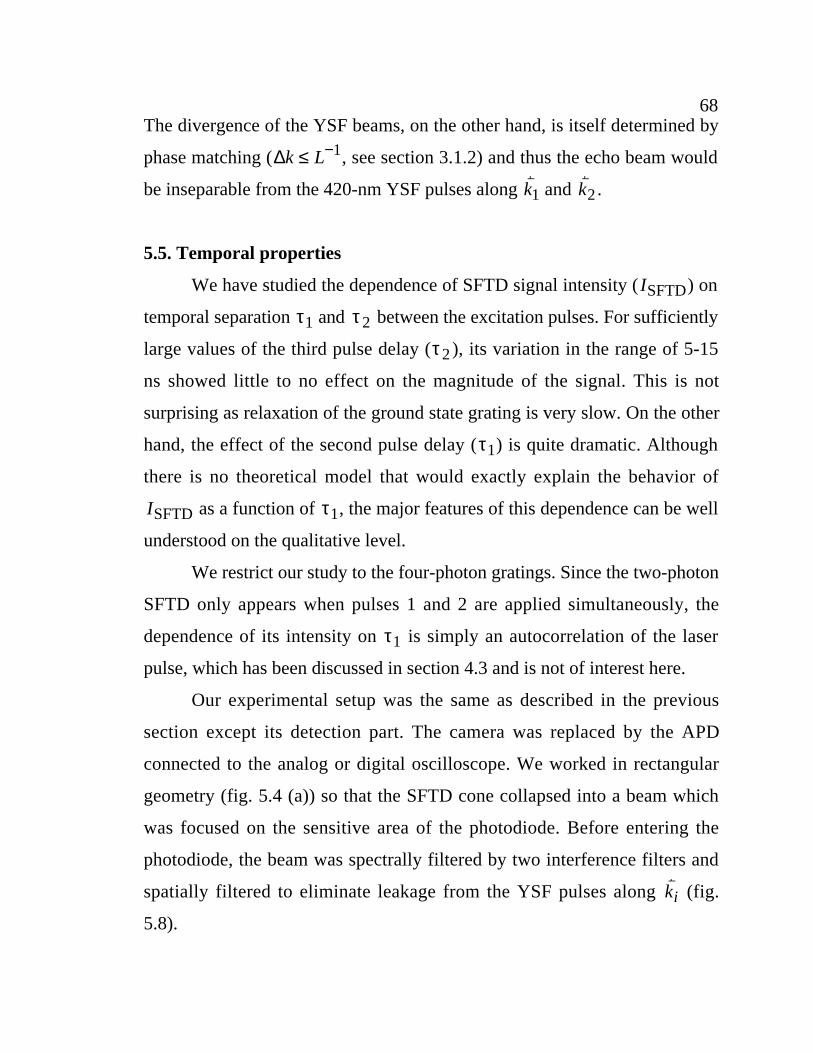
68The divergence of the YSF beams, on the other hand, is itself determined by
phase matching (∆k L≤ −1, see section 3.1.2) and thus the echo beam would
be inseparable from the 420-nm YSF pulses along rk1 and
rk2.
5.5. Temporal properties
We have studied the dependence of SFTD signal intensity ( ISFTD) on
temporal separation τ1 and τ 2 between the excitation pulses. For sufficiently
large values of the third pulse delay (τ 2 ), its variation in the range of 5-15
ns showed little to no effect on the magnitude of the signal. This is not
surprising as relaxation of the ground state grating is very slow. On the other
hand, the effect of the second pulse delay (τ1) is quite dramatic. Although
there is no theoretical model that would exactly explain the behavior of
ISFTD as a function of τ1, the major features of this dependence can be well
understood on the qualitative level.
We restrict our study to the four-photon gratings. Since the two-photon
SFTD only appears when pulses 1 and 2 are applied simultaneously, the
dependence of its intensity on τ1 is simply an autocorrelation of the laser
pulse, which has been discussed in section 4.3 and is not of interest here.
Our experimental setup was the same as described in the previous
section except its detection part. The camera was replaced by the APD
connected to the analog or digital oscilloscope. We worked in rectangular
geometry (fig. 5.4 (a)) so that the SFTD cone collapsed into a beam which
was focused on the sensitive area of the photodiode. Before entering the
photodiode, the beam was spectrally filtered by two interference filters and
spatially filtered to eliminate leakage from the YSF pulses along rki (fig.
5.8).
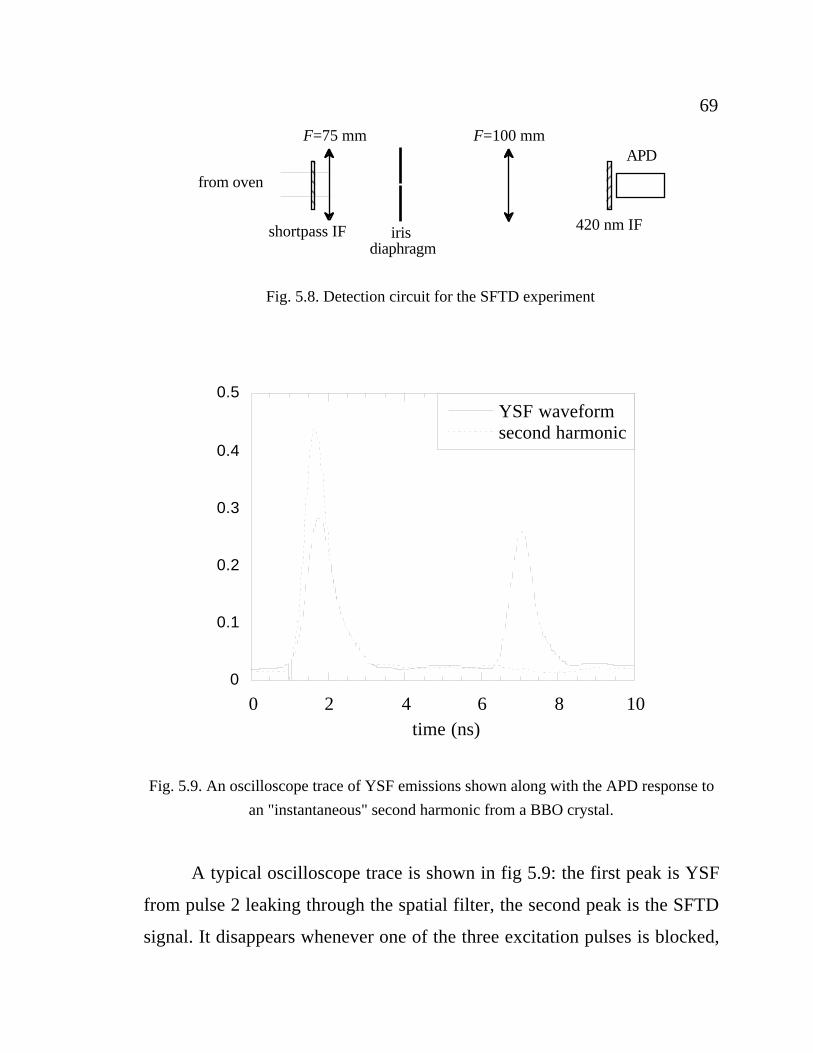
69
APD
420 nm IF
F=100 mmF=75 mm
shortpass IF iris diaphragm
from oven
Fig. 5.8. Detection circuit for the SFTD experiment
0 2 4 6 8 10
YSF waveformsecond harmonic
0
0.1
0.2
0.3
0.4
0.5
time (ns)
Fig. 5.9. An oscilloscope trace of YSF emissions shown along with the APD response to
an "instantaneous" second harmonic from a BBO crystal.
A typical oscilloscope trace is shown in fig 5.9: the first peak is YSF
from pulse 2 leaking through the spatial filter, the second peak is the SFTD
signal. It disappears whenever one of the three excitation pulses is blocked,
70indicating that the observed peak corresponds to SFTD rather than leakage
of YSF from pulse 3 through the spatial filter. For comparison, the figure
also shows the detector response to a 4-ps second-harmonic pulse generated
by the BBO crystal. The waveform of the YSF pulse mimics that of the
second harmonic. This is an indication that the width of the SFTD pulse is
less than 50-100 ps. This feature is discussed further in the next section
The intensity of the SFTD signal as a function of τ1 for three excitation
pulses of about 75-mJ energy is plotted, for two different temperatures, in
fig. 5.10. Strong signals are restricted to a relatively narrow range of τ1,
which decreases with temperature. This range is determined by the SF delay
time τ d( )1 of the 5D state. If the interval between the first two pulses exceeds
τ d( )1 , by the time the second (by order) pulse arrives, the population of the
5D level will be depleted by superfluorescence, and virtually no ground state
grating will be formed. Direct measurement of superfluorescent timing (via
the technique described in Section 3.2) determined τ d to be 95 ps for 1600C
and 150 ps for 1400C, which is consistent with the graph in fig 5.10. As
evidenced by this figure, however, some residual population remains on the
5D level even after the onset of superfluorescence: there are nonzero SFTD
signals at relatively large, positive values of τ1. ISFTD ( )τ1 in this region
exhibits modulation with the 90 GHz frequency (shown magnified in the
insert of fig. 5.10) which is the same as the fine splitting frequency of the 5D
level.
The dip at τ1 = 0 is associated with a number of multiphoton processes
that occur only when two excitation pulses are applied simultaneously. These
include absorption of one photon from each excitation pulse, absorption
along rk1 and stimulated emission along
rk2 or vice versa, etc. Their result is
71to diminish the amplitude of the four-photon ground state grating.
The plots in fig. 5. 10 are asymmetric with respect to the point τ1 0= .
This feature becomes more significant when the intensity of the excitation
pulses is diminished (fig. 5.11). This asymmetry is believed to be a consequence
of dynamics of inhomogeneous rephasing. To explain this dynamics, we
adapt the following assumptions:
1. Short SFTD pulse is emitted immediately after the 5 6D P→
superfluorescence generated by pulse 3, i.e. at the moment t d= +τ τ23( ) .
2. The amplitude of the SFTD pulse is proportional to the value of the
billiard ball overlap factor at that moment.
The SFTD signal is emitted along 2 3 2 1r r rk k k+ −( ) and is associated
with the crossing at t = +τ τ2 1. Using (5.7) and the above assumptions, we
find the diffracted field intensity to be proportional to
f edTd( , )( ) ( ) /( ) *
τ τ π τ τ31
2 231
22= − − , (5.19)
where, for rubidium at 1500C and 420-nm wavelength, T2 423* = ps. In other
words, diffracted emissions are stronger when τ1 is approaching τ d( )3 . At the
same time, as mentioned above, the absolute magnitude of τ1 cannot exceed
τ d( )1 .
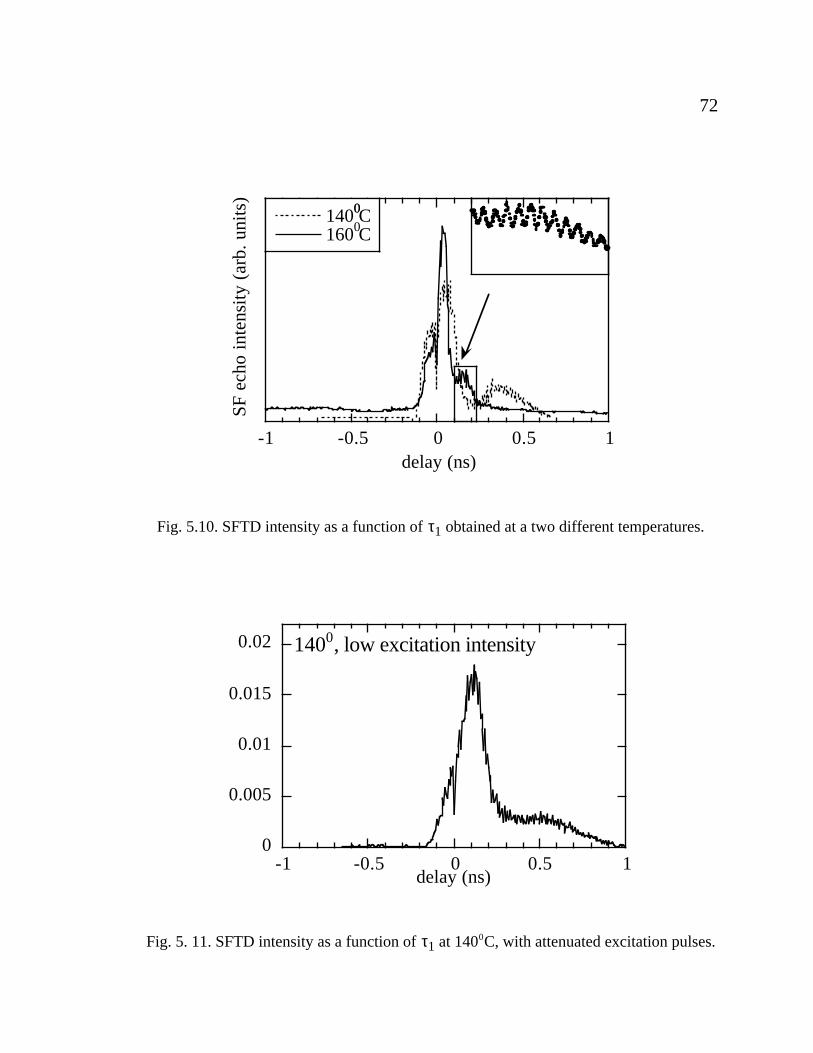
72
-1 -0.5 0 0.5 1
140 C160 C
SF
ech
o in
tens
ity
(arb
. uni
ts)
delay (ns)
00
0
Fig. 5.10. SFTD intensity as a function of τ1 obtained at a two different temperatures.
0
0.005
0.01
0.015
0.02
-1 -0.5 0 0.5 1delay (ns)
1400, low excitation intensity
Fig. 5. 11. SFTD intensity as a function of τ1 at 1400C, with attenuated excitation pulses.
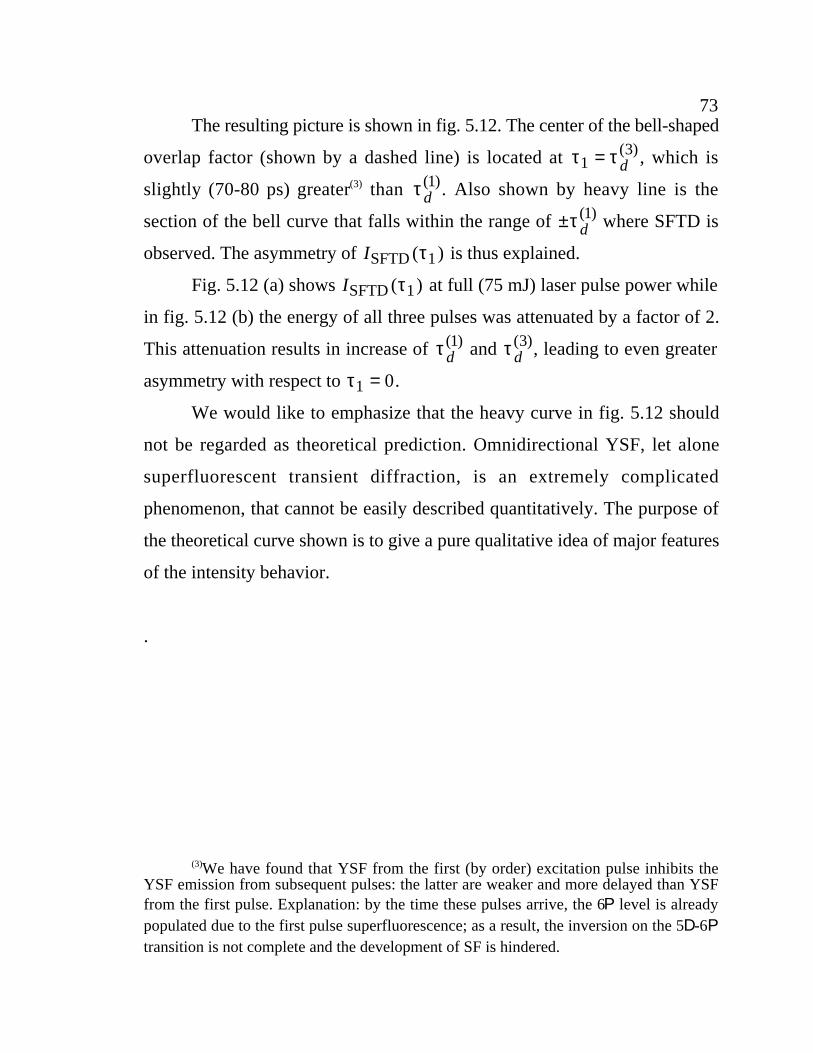
73The resulting picture is shown in fig. 5.12. The center of the bell-shaped
overlap factor (shown by a dashed line) is located at τ τ13= d
( ) , which is
slightly (70-80 ps) greater(3) than τ d( )1 . Also shown by heavy line is the
section of the bell curve that falls within the range of ±τ d( )1 where SFTD is
observed. The asymmetry of ISFTD ( )τ1 is thus explained.
Fig. 5.12 (a) shows ISFTD ( )τ1 at full (75 mJ) laser pulse power while
in fig. 5.12 (b) the energy of all three pulses was attenuated by a factor of 2.
This attenuation results in increase of τ d( )1 and τ d
( )3 , leading to even greater
asymmetry with respect to τ1 0= .
We would like to emphasize that the heavy curve in fig. 5.12 should
not be regarded as theoretical prediction. Omnidirectional YSF, let alone
superfluorescent transient diffraction, is an extremely complicated
phenomenon, that cannot be easily described quantitatively. The purpose of
the theoretical curve shown is to give a pure qualitative idea of major features
of the intensity behavior.
.
(3)We have found that YSF from the first (by order) excitation pulse inhibits theYSF emission from subsequent pulses: the latter are weaker and more delayed than YSFfrom the first pulse. Explanation: by the time these pulses arrive, the 6P level is alreadypopulated due to the first pulse superfluorescence; as a result, the inversion on the 5D-6Ptransition is not complete and the development of SF is hindered.
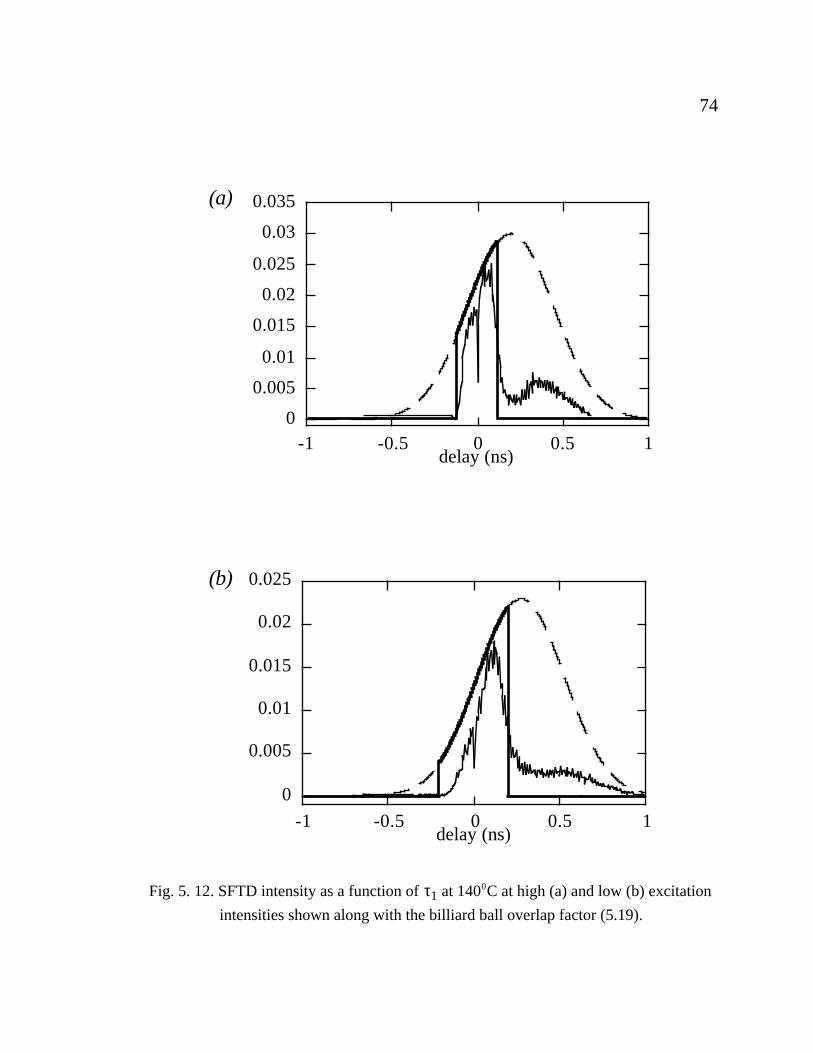
74
0
0.005
0.01
0.015
0.02
0.025
0.03
0.035
-1 -0.5 0 0.5 1delay (ns)
(a)
0
0.005
0.01
0.015
0.02
0.025
-1 -0.5 0 0.5 1delay (ns)
(b)
Fig. 5. 12. SFTD intensity as a function of τ1 at 1400C at high (a) and low (b) excitation
intensities shown along with the billiard ball overlap factor (5.19).
75
5.6. Discussion
While the above model explains the main features of SFTD emission
as a function of τ1, a number of questions remains unanswered. An example
is the shortness of the SFTD pulse (as well as the direct 6 5P S→ yoked
emission). On one hand, this is not surprising as we are dealing with an
optically thick sample. On the other hand, the amplitude of the coherent
superposition associated with the particular member in the set of
rkDP that
leads to transient diffraction is very small, so that the superradiant lifetime
associated with this coherent superposition should be greater than T2*.
Not less puzzling is the structure of quantum modulation exhibited by
the signal at large delay values. Why are these beats observed only when
superfluorescence occurs between the two excitation pulses, and are not
present (or relatively weak) when τ τ11≤ d
( )?
We explain the asymmetry of SFTD signal intensities with respect to
τ1 0= by inhomogeneous rephasing. According to this concept, this
asymmetry should diminish with temperature as does τ d( )1 . As evident from
fig. 5.10, however, the effect of increasing temperature is opposite. This
discrepancy can be ascribed to high nonlinearity of YSF processes which
becomes even greater with increasing number density.
Can the observed superfluorescent transient diffraction be considered
an echo phenomenon? On one hand, yes, because Doppler dephasing and
rephasing do play a role in its properties. On the other hand, this emission
lacks one significant feature of a stimulated echo: it appears almost
simultaneously with the YSF from pulse 3, i.e. at t d= +τ τ23( ) , whereas the
stimulated echo pulse is centered at t = +τ τ2 1. This question is therefore a

76matter of terminological convention; the author of this thesis believes that
the answer can be affirmative.

77
CONCLUSION
A sample of atomic rubidium, two-photon excited, in a large Fresnel
number geometry, into a coherent superposition between levels 5S and 5D,
produces a coherent flash of omnidirectional superfluorescence on the
5 6D P→ transition. This superfluorescence is followed by the directional
yoked emission from 6P back to 5S, which selectively involves only those
atoms on the 6P level whose superfluorescent emission could satisfy the
phase-matching condition. The direction(s) of the lower transition emission
is determined by the coherent superposition state between 5S and 5D in
which the system has been prepared.
Two examples were studied. In the first, the sample was excited by
two simultaneous non-collinear laser pulses. The coherent superposition that
is established due to absorption of one photon from each pulse results in
conical emission pattern whose apex angle is a function of the angle between
the excitation beams. In the second example, a transient grating is recorded
in the 5S state via two laser pulses separated by a short interval. A third
pulse interrogates the grating and produces the diffracted yoked
superfluorescence pulse which is also emitted in a cone defined by the phase
matching requirements.
For both cases, spatial and temporal features of the emissions were
studied. For spatial characteristics, excellent agreement with theoretical
predictions was found. Qualitative explanation was given to major temporal
properties.
78BIBLIOGRAPHY
1. R. H. Dicke, Phys. Rev. 93, 99 (1954).
2. N. Skribanowitz, I. P. Herman, J. C. MacGillivray, et al., Phys. Rev. Lett.
30, 309 (1973).
3. H. M. Gibbs, Q. H. F. Vrehen, and H. M. Hikspoors, in Laser Spectroscopy
III, edited by J. L. Hall and J. L. Carlsten (Springer-Verlag, Berlin, 1977), p.
213.
4. D. J. Heinzen, J. E. Thomas, and M. S. Feld, Phys. Rev. Lett. 54, 677
(1985).
5. J. H. Brownell, X. Lu, and S. R. Hartmann, Phys. Rev. Lett. 75, 3265
(1995).
6. W. R. Garrett, Laser Phys. 5, 466 (1994).
7. W. R. Garrett, Phys. Rev. Lett. 70, 4059-4062 (1993).
8. M. A. Moore, W. R. Garrett, and M. G. Payne, Opt. Commun. 68, 310
(1988).
9. S. M. Hamadani, J. A. D. Stockdale, R. N. Compton, et al., Phys. Rev. A
34, 1938 (1986).
10. M. S. Malcuit, D. J. Gauthier, and R. W. Boyd, Phys. Rev. Lett. 55,
1086-1089 (1985).
11. H. J. Eichler, Laser induced dynamic gratings (Springer-Verlag, Berlin,
1986).
12. M. Gross, C. Fabre, P. Pillet, et al., Phys. Rev. Lett. 36, 1035 (1976).
13. H. M. Gibbs, Q. H. F. Vrehen, and H. M. Hikspoors, Phys. Rev. Lett 39,
547 (1977).
14. A. Crubellier, S. Liberman, and P. Pillet, Phys. Rev. Lett. 41, 1237
79(1978).
15. C. Brechignac and P. Cahuzac, J. Phys. B 14, 221 (1981).
16. J. S. Bakos, D. P. Schrerer, and F. K. Kneubuhl, Phys. Rev. A 46, 410
(1992).
17. J. C. MacGillivray and M. S. Feld, Phys. Rev. A 14, 1169 (1976).
18. M. S. Feld and J. C. MacGillivray, in Coherent Nonlinear Optics -
Recent Advances, edited by M. S. Feld and V. S. Letokhov (Springer-Verlag,
Berlin, Heidelberg, New York, 1980), Vol. 21, p. 7-57.
19. F. P. Mattar, H. M. Gibbs, S. L. McCall et al., Phys. Rev. Lett. 46, 1123
(1981).
20. K. Ikeda, J. Okada, and M. Matsuoka, J. Phys. Soc. Jpn. 48, 1636
(1980).
21. K. Ikeda, J. Okada, and M. Matsuoka, J. Phys. Soc. Jpn. 48, 1646
(1980).
22. F. Haake, H. King, G. Schroder, et al., Phys. Rev. A 20, 2047-2063
(1979).
23. C. M. Bowden and C. C. Sung, Phys. Rev. Lett. 50, 156 (1983).
24. J. P. Mattar and C. M. Bowden, Phys. Rev. A 27, 345 (1983).
25. N. A. Enaki and Y. M. Shvera, Opt. Spectrosc (USSR) 65, 272 (1988).
26. D. Polder, M. F. H. Schuurmans, and Q. H. F. Vrehen, Phys. Rev. A 19,
1192 (1979).
27. R. Friedberg and S. R. Hartmann, Phys. Lett. 37A, 285 (1971).
28. J. Okada, K. Ikeda, and M. Matsuoka, Opt. Commun. 27, 321 (1978).
29. J. Okada, K. Ikeda, and M. Matsuoka, Opt. Commun. 26, 189 (1978).
30. X. M. Lu, Ph. D. Thesis (Columbia University, New York, 1995).
31. O. S. Heavens, J. Opt. Soc. of America 51, 1058 (1987).
8032. Bacher and Goudsmit, Atomic Energy Levels (McGraw-Hill, 1932).
33. J. H. Brownell, Ph. D. Thesis (Columbia University, New York, 1995).
34. W. R. Garrett, M. A. Moore, R. C. Hart et al., Phys. Rev. A 45, 6687
(1992).
35. I. D. Abella, N. A. Kurnit, and S. R. Hartmann, Phys. Rev. 141, 391
(1966).
36. J. H. Brownell, X. Lu, and S. R. Hartmann, Phys. Rev. Lett. 75, 3657
(1995).
37. A. I. Lvovsky and S. R. Hartmann, Phys. Rev. A (To be published) .
38. E. P. Ippen and C. V. Shank, Ultrashort Laser Pulses - Picosecond
Techniques and Applications (Springer-Verlag, Berlin, 1977).
39. D. J. Kane and R. Trebino, IEEE J. Quantum Electron. 29, 571 (1993).
40. J. T. Fourkas, L. Dhar, K. A. Nelson et al., J. Opt. Soc. Am. B 12, 155
(1995).
41. E. L. Hahn, Phys. Rev. 80, 580 (1950).
42. N. A. Kurnit, I. D. Abella, and S. R. Hartmann, Phys. Rev. Lett. 13, 567
(1964).
43. C. K. N. Patel and R. E. Slusher, Phys. Rev. Lett. 20, 1087 (1968).
44. M. O. Scully, M. J. Stephen, and D. C. Burnham, Phys. Rev. 171, 213
(1968).
45. L. Allen and J. H. Eberly, Optical Resonance and Two-Level Atoms
(Dover Publications, Inc., New York, 1987).
46. N. A. Kurnit and S. R. Hartmann, Interaction of radiation with solids
(Plenum Press, New York, 1970).
47. P. Hu, R. Leigh, and S. R. Hartmann, Phys. Lett. 40A, 164 (1972).
48. Y. C. Chen, K. Chiang, and S. R. Hartmann, Opt. Commun. 29, 181
81(1979).
49. D. W. Phillion, D. J. Kuizenga, and A. E. Siegman, Appl. Phys. Lett. 27,
85 (1975).
50. T. Yajima and Y. Taira, J. Phys. Soc. Jpn. 48, 1620 (1979).
51. A. M. Weiner, S. D. Silvestri, and E. P. Ippen, J. Opt. Soc. Am. B 2, 654
(1985).
52. T. W. Mossberg, R. Kachru, E. Whittaker et al., Phys. Rev. Lett. 43,
851-5 (1979).
53. R. Friedberg and S. R. Hartmann, Laser Physics 3, 526 (1993).
54. A. I. Lvovsky and S. R. Hartmann, J. Phys. B (to be published) (1998).
55. M. F. Emide, A. Baltuska, A. Kummrow et al., Phys. Rev. Lett. 80,
4645 (1998).
56. T. Mossberg, A. Flusberg, R. Kachru et al., Phys. Rev. Lett. 39, 1523
(1977).
57. R. Beach, S. R. Hartmann, and R. Friedberg, Phys. Rev. A 25, 2658-66
(1982).
58. R. Friedberg and S. R. Hartmann, Phys. Rev. A 48, 1446 (1993).
59. R. Friedberg and S. R. Hartmann, Bulletin of the Russian Academy of
Sciences 58, 1282-1306 (1994).
60. A. I. Lvovsky and S. R. Hartmann, Laser Physics 6, 535-543 (1996).
61. A. I. Lvovsky and S. R. Hartmann, Phys. Rev. A 56, 4254-4263 (1997).
62. M. Lu and Y. Liu, J. Phys. B 24, 5089 (1994)

82
APPENDIX
EXPERIMENTS IN CESIUM VAPOR
This appendix describes the experiments not covered in the body of
the thesis, performed by the author in the years of 1995–1997. Although
there is no direct connection to the main subject of the dissertation, these
experiments played a significant role in expanding our general understanding
of superradiance as a physical entity, not to mention their contribution to
author's education end experience.
The work has been done at Columbia University's Photon Echo
Laboratory laser facility. The core of this facility, described in details in
[33], embodied a Spectra-Physics dye laser system capable of producing
10-ps pulses of energies up to 1 µJ in the wavelength range between 850 and
950 nm. All experiments were performed on atomic vapor of cesium.
A.1. Time delayed second harmonic generation
In 1995, Brownell et al. [36] have observed time delayed second
harmonic (SH) generation. This experiment was performed by two-photon
exciting the 6 61 2 3 2S D/ /− transition in atomic cesium vapor, in the presence
of transverse magnetic field. It is known from symmetry considerations that
optical SH generation is impossible in gases unless an external field is applied
to break the symmetry. In this experiment it was shown that even in the
presence of such a field, immediately after the two-photon laser excitation,
the quadrupole radiation pattern has a null in the forward (phase matched)
direction and no second harmonic is emitted. It takes time before the quadrupole
83moment, precessing around the field direction, transforms itself in such a
way that second harmonic is enabled. The authors of [36] have obtained the
evidence of this time delay by measuring the displacement of the SH signal
oscilloscope trace with respect to that of an undelayed signal.
Although the results obtained in [36] have clearly proven the presence
of the delay, they exhibited a number of puzzling features. For example, the
magnitude of the delay appeared to be more than a factor of two greater than
calculated. In paper [61], published in 1997, we presented the refined
measurements and analysis of SH generation in cesium vapor. Besides having
resolved the aforementioned discrepancy (which was a result of eddy currents
induced in the metal sample cell when subject to the pulsed magnetic field),
we have extended our measurements to the 6 61 2 5 2S D/ /− transition, analyzed
the effect of superfluorescence on the development of SH, measured the
magnitude of the SH signal and introduced a more precise technique of
delay determination.
A.2. Coherent fan emissions
The second experiment [54] was devoted to transient diffraction
emissions that appeared in the following configuration. A transient grating
was induced at t = 0 in an optically thin Cs vapor sample using two
simultaneous, slightly noncollinear laser pulses resonant with the fundamental
6 61 2 1 2S P/ /− transition, followed by a third resonant excitation pulse at
t = τ . This excitation results in emission of fan-shaped arrays of coherent
pulses, centered at t = 0, t = τ and t = 2τ and governed by higher order
diffraction effects, as well as inhomogeneous dephasing and rephasing. We
have shown that each fan component is characterized by a complex modulation
84and polarization pattern that is different from other components and is
determined by the atomic Hamiltonian, thus demonstrating the potential of
this technique as a spectroscopic tool. This work has been preceded by [60]
(1996) where modulation of conventional two-pulse photon echo in cesium
has been studied in detail.
A.3. Superradiant self-diffraction
In his classic paper [1], R. H. Dicke has considered a case when a
large number of oscillating in phase dipoles are concentrated in a very small
(<< λ3) volume. In experimental practice this situation is quite uncommon,
and in later works on superradiance (see, for example, [20, 35]) Dicke's
analysis has been modified to account for larger excited volume. Modern
treatment usually regards the excited volume as cylindrical, with all the
elementary dipoles equally excited. But this assumption is not, generally
speaking, correct either.
The macroscopic dipole moment induced in a sample by a highly
energetic excitation pulse of nonuniform (e.g. Gaussian) profile forms a ring
pattern, where highly excited areas alternate with regions where the Rabi
area of the excitation field is a multiple of 2π and the excitation is weak. The
superradiant beam, generated by the macroscopic dipole moment of such
complicated structure, undergoes self-diffraction, resulting in high beam
divergence and complex pattern of the far field radiation. In the paper [37],
currently being prepared for publication, we have performed a detailed
theoretical analysis of superradiant self-diffraction patterns and found a number
of interesting properties they possess. We have also proven a theorem stating
that for sufficiently smooth excitation profiles in an optically thin sample,
85the total power of superradiant emission is proportional to the integral, over
the excited volume, of the macroscopic dipole moment squared. A curious
consequence is that for such nonuniformly excited samples, the total power
of cooperative emission is given by the same function of excitation pulse
area Θ as the total power of noncoherent fluorescent emission as a function
of Θ / 2 . The theoretical analysis is followed by an experimental section
where the existence of superradiant self-difraction is made manifest.