OMERS AR 2012 - OAC - ENG · In May 2012, the Minister of Municipal Affairs and Housing announced...
170
2012 Annual Report
Transcript of OMERS AR 2012 - OAC - ENG · In May 2012, the Minister of Municipal Affairs and Housing announced...

2012 Annual Report

OMERS
Our commitment to you.
Our performance is built on professional expertise and experience
in client services and investments, innovative corporate strategies,
sound global relationships, and strong governance.
Our strategy is not simply about targets; it’s about building a
sustainable business model whose foundation is value creation
and whose goal is delivering on the pension promise.
Our clients – members, employers and other stakeholders –
count on us to navigate a world of disruptive change to provide a
secure pension plan. They entrust us with their contributions so
that they can focus on serving citizens, saving lives, caring for the
elderly – shouldering the important work that gets done every day
across Ontario’s communities.
Our people, some of whom are featured in this report, are
passionate about delivering on the pension promise and making
a difference in the communities in which they live and work.
OMERS 2012 Annual Report

Fifty Years of OMERS
Half a century ago, we made a promise to provide the people
who support Ontario’s communities with a secure retirement.
Before OMERS, many municipal employers across the province
did not participate in a pension plan to support their employees’
retirement. By bringing municipalities and local boards together,
OMERS brought strength in numbers through a strong and stable
pooled investment fund with more secure benefi ts.
Since then, OMERS has grown into one of Canada’s largest
pension plans with more than $60 billion in net assets and
429,000 members. Today, OMERS is an active, diversifi ed
investor and engine of economic growth in Ontario and Canada.
2012 Annual Report OMERS

OMERSTable of Contents
OMERS
2 Message from the OMERS Administration
Corporation Chair
4 Message from the OMERS Sponsors
Corporation Co-Chairs
6 2012 Highlights
OMERS Administration Corporation
2 Message from the President and CEO
4 Governance: OMERS
Administration Corporation
10 Proxy Voting
12 Senior Management Team
13 Board of Directors
14 2012 Management’s Discussion and Analysis
68 Compensation Discussion and Analysis
78 Responsibilities of Management,
Actuary and Independent Auditors
79 Actuarial Opinion
80 Independent Auditors’ Report
81 Consolidated Financial Statements
84 Notes to Consolidated Financial Statements
124 Ten-Year Financial Review
126 Glossary
OMERS Sponsors Corporation
2 Message from the CEO
4 Year in Review
6 Governance: OMERS Sponsors Corporation
12 Sponsors Corporation Members
13 Independent Auditors’ Report
14 Financial Statements
16 Notes to Financial Statements
OMERS

1 2012 Annual Report OMERS
“ We have more than one million points of contact with Plan members and employers every year, including 2,100 face-to-face meetings reaching over 30,000 clients. We take our job very seriously to make sure they have all the information they need to make the right decisions for themselves and their families.”
Fotini Eliopoulos
Specialist, Education and Training
OMERS Administration Corporation

2 OMERS 2012 Annual Report
OMERS
OMERS Administration CorporationOMERS Administration Corporation Board has 14 Members and is the administrator of the OMERS Pension Plans.
The OAC Board is responsible for:
• appointing and overseeing the OAC management team
• establishing investment and funding policies, asset allocation and investment management of OMERS Pension Plans’ assets
• overseeing pension services, administration and Plan valuation
• appointing the OAC auditors and the actuary for the OMERS Pension Plans.
“ OMERS members want to know their pensions are secure over the long term. Our performance in 2012 is another indication that our investment strategy is working and will continue to support OMERS efforts to return the Plan to a fully funded position well within the projected timeframe.”
Rick Miller
Chair
OMERS Administration Corporation

3 2012 Annual Report OMERS
Our Commitment To You.
For the OMERS Administration Corporation (OAC) Board, the theme of our 2012 Annual Report says it all. As Board Chair, I know I speak for all of my Board
colleagues in saying we are passionately committed to the well-being of our OMERS Primary Pension Plan (the Primary Plan or the Plan) – to continuous
improvements in its administration, to its investment strategy and to keeping the pension promise to Plan members.
In early 2012, I identifi ed certain key priorities for our Board. These priorities included our continued role in returning the Plan to surplus, maintaining
continued excellence in service to our members, active engagement in the OMERS Governance Review 2012 (the Review) with our colleagues on the
Sponsors Corporation (SC), and ensuring a smooth transition as terms for OAC Board members are completed. The close of 2012 brought some changes
to the membership of the OAC Board, and I would like to express the Board’s thanks to Bill Aziz and Leslie Thompson, two of our colleagues whose work
contributed greatly to our ability to deliver on these priorities over the past year and whose tenure came to an end in December 2012. At the same time,
we welcome new Board members Michael Fenn and David Beatty.
As the OAC Board Chair, I have the opportunity, as do my colleagues, to discuss OMERS business with a wide range of members and stakeholders and to
gain insight into the issues that interest them. Since the 2008 global economic downturn, we have heard from Plan members that they want some assurance
that their pensions are secure, and both Boards have been focused on dealing with Plan funding and our respective roles in returning the Plan to a fully
funded position.
Over time, pension plans like OMERS cycle through periods of actuarial surplus and defi cit. In fact, in 1997 when I fi rst joined the Board, OMERS was in the
midst of a large actuarial surplus, and we moved through periods of defi cit and surplus for the following 10 years. More recently, in 2009, following the 2008
global economic downturn, our actuaries projected that OMERS actuarial defi cit would continue to grow and that measures were required immediately to
gradually eliminate the defi cit to protect members well into the future. As a result, the SC took steps to reduce the defi cit through a combination of
contribution increases and a benefi t reduction. At that time the defi cit was projected to grow to more than $10 billion at the end of 2012, when it would start
to level off, then begin to decline gradually to zero over approximately 10 to 15 years. By generating solid investment returns in the 7 per cent – 11 per cent
range on average over time, the OAC can help return the Plan to surplus earlier than originally projected. In fact, as a result of our 2012 return of 10 per
cent, combined with the returns for the three years following the global downturn in 2008, our average investment return over the past four years was about
8.9 per cent. The projected actuarial defi cit is now at less than $10 billion, lower than was projected in 2009. This speaks very well of our investment
strategy, and it is our objective to continue this trend to generate steady returns above the actuarial requirement in the years ahead which would eliminate
the defi cit sooner than originally projected.
Another priority for our Board over the past year was the OMERS Governance Review 2012. The need for the Review was established in 2006 when the
Province created a new, independent governance model for OMERS. The OAC and SC saw the Review as an opportunity to begin to evaluate internal
processes in preparation for the Review. Many of the areas discussed by the Reviewer in his fi nal Report released early in 2013 had already been identifi ed
by the two Boards as areas for improvement, and we are well positioned to address the Report’s recommendations over the coming year. We look forward
to providing information on progress in this regard in 2013.
An important responsibility for the OAC Board is oversight of our organization’s rolling fi ve-year Strategic Plan. A key requirement for OMERS to compete
with other large capital pools for assets across the globe is our vision to grow OMERS pool of investment capital through long-term relationships with
like-minded international investment partners, providing investment services and products to other pension plans, and offering optional retirement savings
opportunities to OMERS members. One such offering is our Additional Voluntary Contributions (AVCs) program, launched in 2011. In my conversations with
OMERS members since the launch, I have heard time and time again that members want the right to receive an income stream from the AVC component of
the Plan rather than being forced to withdraw or transfer their AVC funds after age 71. This is not currently possible under Ontario law. I have urged all Plan
members, whether over the age of 71 or younger, to contact their MPP and request their support to have this issue rectifi ed during the review of the
Regulations for Bill 120 – Securing Pension Benefi ts Now and for the Future Act, 2010.
In closing, it has truly been a privilege to serve as the OAC Board Chair in 2012, and I look forward to 2013 as we continue to make progress on the issues
and initiatives that are important to our members and stakeholders, and to doing our best to keep the pension promise to Plan members.
Thank you.
Rick Miller
Message from the OAC Board Chair

4 OMERS 2012 Annual Report
OMERS
OMERS Sponsors CorporationOMERS Sponsors Corporation is the Plan sponsor of the OMERS Pension Plans and consists of 14 Members:
seven Plan member representatives and seven employer representatives.
The SC is responsible for:
• determining Plan design for benefi ts to be provided by the OMERS Pension Plans
• setting contribution rates for members and participating employers
• establishing or changing a reserve to stabilize contribution rates
• setting compensation levels and appointment protocol of SC and OAC Board Members.
“ It’s vital we consider broad and diverse viewpoints including those from current, retired and future members as well as the organizations that employ them.”
Marianne Love
Co-Chair
OMERS Sponsors Corporation
“ Our central goal as SC Co-Chairs is to ensure that our decisions around design and funding support the health and long-term viability of the OMERS Pension Plans. We work together with the OAC to ensure OMERS is positioned for strength and stability in today’s turbulent times and well into the future.”
Brian O’Keefe
Co-Chair
OMERS Sponsors Corporation

5 2012 Annual Report OMERS
Message from the SC Co-Chairs
At OMERS Sponsors Corporation (SC) we have two main objectives. The fi rst is to ensure that the governance of OMERS supports the health and long-term
sustainability of the Pension Plans and meets the needs of stakeholders. The second is to ensure that the Plans are affordable, sustainable and appropriately
funded to fulfi ll the pension promise. We must consider broad and diverse viewpoints from current, retired and future members as well as the organizations
that employ them.
Governance
We fi rmly believe that good governance is fundamental to ensuring the long-term success of OMERS and the Pension Plans. We participated in the
governance review required under the Ontario Municipal Employees Retirement System Review Act, 2006 (the OMERS Review Act) and began our own
review of the composition and appointment process for the Boards. We solicited and received input from stakeholders, which reinforced the importance of
the oversight and governance of OMERS.
In May 2012, the Minister of Municipal Affairs and Housing announced that Mr. Tony Dean was appointed as the Reviewer under the OMERS Review Act.
Mr. Dean further reinforced the importance of good governance. His Report was released on January 25, 2013. In 2013 we will address the Report’s
recommendations and input from stakeholders and use these to enhance the governance and oversight of OMERS.
Our commitment to good governance is also refl ected in SC Board members’ participation in education programs, industry conferences and internal
training covering a variety of topics including governance, risk and growth. We thank the SC for its continuous commitment to self-improvement, an
endeavour that benefi ts the entire SC Board.
This year, the SC reappointed three OAC Board members whose terms were set to expire and appointed two new OAC Board members to replace outgoing
members. In addition the SC extended the seat of one OAC Board member by one year.
The SC saw four of its Board members reappointed, the term of one SC Board member extended for an additional year, and one new SC Board member,
Mary McConville, appointed to replace an outgoing member, Joe Aitchison. In a separate but related exercise, the SC, with Sponsor approval, extended the
terms of three SC Board members from December 31, 2013 to December 31, 2014 in order to better distribute term expiry dates over the three-year cycle.
On behalf of the SC, we would like to thank Joe Aitchison for his signifi cant contribution to the work of the SC Board since the SC’s inception, and we
welcome Mary McConville from the Ontario Association of Children’s Aid Societies (OACAS).
Funding
At the end of 2012, OMERS had an actuarial defi cit of $9.9 billion in the Primary Plan, and it is projected that the Plan will continue in a defi cit position for
some time to come. In fact, as projected in 2010, the reported funding defi cit has grown with the full impact of the losses incurred in 2008 refl ected in the
funding defi cit at the end of 2012.
In 2010, we established a strategy to address the funding defi cit which involved temporary benefi t changes and contribution rate increases. We implemented
the last phase of this strategy effective January 1, 2013, increasing contributions to ensure the Fund receives an additional 0.9 per cent in contributions
(per side) and changing benefi ts for members who terminate before being eligible for early retirement. We also established principles to guide the way
contribution rates are allocated in the future.
Although our funding position has changed, our multi-year plan is on course. Raising contribution rates or changing benefi ts are decisions not taken lightly
and it is too early to tell if further action will be required. Given the Primary Plan’s funded position and the persistent headwinds facing the Plans, we will
remain vigilant in assessing and responding to those pressures.
Working Together – SC and OAC
For the fi rst time we had a Strategic Planning Session, in September 2012, where the two Boards met and discussed various strategic issues facing OMERS.
It was an invaluable exercise to help the Boards work collaboratively on strategic initiatives, a common vision for the future and to ensure our governance
meets the needs of stakeholders. The Boards of the SC and OAC meet regularly, in their entirety as well as through the Joint Council, to discuss issues of
relevance to both organizations, stakeholders and Plan members. Within our respective mandates, the two organizations are able to work collaboratively to
ensure our focus remains on the Plans.
In Closing…
Our strategy continues to support the long-term viability of the Plans and good governance and, as always, the SC will continue to work in partnership with
the OAC to bring the Plans back to a fully funded position and to enhance governance under the bicameral governance model.
Marianne Love & Brian O’Keefe

6 OMERS 2012 Annual Report
OMERS
Global Reach“ One of the great things about Oxford and OMERS is that we are encouraged to apply our international experience to our roles as we expand our global presence. Our people, our quality assets and our customer service are the foundation of our strong reputation.”
Maud Chaudhary
Director, Real Estate Management
Oxford Properties Group
1 Year 5 Year 10 Year 03
04
05
06
07
08
09
10
11
12
32.7
36.2
61.5
55.754.0
48.4
44.0
52.2
48.2
41.610.03%
9.75%
3.56%4.08%
8.24%7.73%
Rate of Return and Benchmark (%)For the period ending December 31, 2012
• Annual Average Rate of Return • Benchmark
Net Investment Asset GrowthAs at December 31,
Market Value ($ billions)

7 2012 Annual Report OMERS
2012 Highlights
Borealis• Signed an agreement to purchase Midland
Cogeneration Venture
• Sold its interest in Enwave Energy Corporation
• Completed restarts of Bruce Power Units 1 and 2
Oxford• Completed 28 asset transactions and 18 refi nancings
• Development projects all on time, on budget and leasing as per forecast
• Continued leadership in sustainability, customer service and operations
OMERS Strategic Investments• Launched the Global Strategic Investment Alliance
(GSIA) with the Pension Fund Association and a Mitsubishi Corporation-led consortium, both of Japan, joining OMERS to pursue high-quality, large-scale infrastructure investments
Capital Acquisition & Management“ Borealis is an infrastructure investing pioneer, which has grown into an entity that sources, transacts and manages a diversifi ed portfolio of large-scale infrastructure assets. We have $18 billion in assets under management and provide stable and
strong cash fl ows to pay pensions.”
Annesley Wallace
Vice-President
Borealis Infrastructure
60%40%82%
18%
• Public Markets • Private Markets (real estate, infrastructure, private equity)
2003 2012
Asset MixAs at December 31,

8 OMERS 2012 Annual Report
OMERS
Client Focus“ Over the years, OMERS has grown into a global, diversifi ed investor and engine of economic growth and employment in Ontario and Canada. This all comes from our commitment to provide the men and women who have served or continue to serve Ontario’s communities
with a secure retirement.”
Michael Robinson
Manager, Client Services
OMERS Administration Corporation
Nearly 1 in 20 employed Ontarians is an OMERS member
About 51% of the Fund,
over $31 billion, is invested in Canada
Over 25,000 Canadians are employed at OMERS and the companies in which
it has signifi cant ownership share
Members have put their
trust in OMERS, with
accumulated contributions
and investment earnings of $170 million in
Additional Voluntary Contributions (AVCs)
since we launched
the program in 2011
51%

9 2012 Annual Report OMERS
“ Everything we do is about helping our members succeed – putting them at the centre. The ongoing modernization of our pension services system is critical because it will help us deliver better service as well as innovative offerings – like our Additional Voluntary Contributions or AVCs – which can help members
maximize their retirement income.”
Adam Nasser
Director, Pension Operations
OMERS Administration Corporation
190,000 calls handled by Client Services.
Client satisfaction continues to be high at 89% satisfi ed or very satisfi ed.
94% of calls are answered within 100 seconds and resolved at fi rst point of contact.

10 OMERS 2012 Annual Report
OMERS
Plan Design“ Our focus is on the future and the long-term stability of the OMERS Pension Plans. This is why we ensure our stakeholders have the information they need to appreciate the Plan design decisions made by the Board as well as the ability to communicate their views to the Board.”
Susan Porter
Board Secretary & Offi ce Manager
OMERS Sponsors Corporation
2012 Highlights
OMERS Sponsors Corporation (SC)
• Joint OAC and SC sessions demonstrated collaborative approach to strategic planning
• Participated in the governance review required by the OMERS Review Act
• Initiated our own review of composition and the appointment process of the Boards
• Implemented fi nal phase of strategy to address the funding defi cit and established principles to guide allocation of future contribution rates
• Participated in pension reform discussions to ensure OMERS is well represented

11 2012 Annual Report OMERS
Innovation“ OMERS gives me the opportunity to be at the forefront of identifying and supporting great entrepreneurs, growing companies and new technologies that we believe have the potential to become global leaders in their fi elds.”
Bram Sugarman
Senior Associate
OMERS Ventures
OMERS Ventures invested over $110 million in:

12 OMERS 2012 Annual Report
OMERS
Direct Drive“ We are strongly committed to directly owning and managing our investments. Doing so creates the best long-term value opportunity which goes into paying pensions for OMERS Plan members.”
Chantal Thibault
Managing Director and General Counsel, Legal
OMERS Private Equity
Named one of Lexpert’s Rising Stars:
Leading Lawyers Under 40
2012 Highlights
OMERS Private Equity
• Acquired Golfsmith International, a U.S.-based specialty golf retailer. Golfsmith has been combined with Golf Town, our Canadian market leading golf retailer, creating the largest golf specialty retail business in the world
• Direct investment in Lifeways, a leading provider of supported living services for adults with learning disabilities in the U.K.

13 2012 Annual Report OMERS
Great People“ At OMERS, I get challenging work in a fast-paced and rewarding environment where our core values and important mission makes my work meaningful. The fi nancial, investment and global expertise in our capital markets group is incredibly strong – we have a deep bench of talent that allows us to better negotiate today’s complex economic environment.”
Helen Rattee
Principal
OMERS Capital Markets

14 OMERS 2012 Annual Report
OMERS
“ Everyone at OMERS is committed to ensuring the Plan’s governance remains strong and healthy. At the end of the day, successful governance affects performance and is a refl ection of how much we care about delivering on our mission.”
Amen Tam
Director, Audit Services
Capital Markets, Pension Services, Corporate
OMERS Administration Corporation
“ Addressing the recommendations of the OMERS Review is a priority that has far-reaching implications for every member who relies on us to provide for their fi nancial future. Good governance is collaborative by nature and it should extend deeply into the organization to be effective. That’s how we approach it.”
Chris Vanden Haak
Director, Pension Policy and Communications
OMERS Sponsors Corporation

15 2012 Annual Report OMERS
Strong GovernanceWhen it was proclaimed in 2006, the Ontario Municipal Employees Retirement System Act, 2006 (the
OMERS Act) established a new, independent governance model for OMERS. A process for reviewing
the new model in 2012 was defi ned in the companion Ontario Municipal Employees Retirement System
Review Act, 2006 (the OMERS Review Act). As defi ned in this Act, the Review was to focus on the
actual governance and administration of OMERS since the OMERS Act was proclaimed. It was to
address and evaluate matters that include:
a) the effi ciency and effectiveness of decision-making by the SC;
b) the governance model’s effectiveness in ensuring OMERS overall fairness and fi nancial stability;
c) the governance model’s effectiveness and fairness for employers, members and former members
of the Plan; and
d) the governance model’s effectiveness and fairness in ensuring the accountability of OMERS.
On May 15, 2012 Mr. Tony Dean was appointed by the Minister of Municipal Affairs and Housing
to undertake the Review on the Province’s behalf. In an open letter published on that day Mr. Dean
indicated his intent “to make every effort to ensure that anyone who wants to participate and
contribute will have the opportunity to do so.” Mr. Dean received several submissions and consulted
with a wide range of groups and individuals over the summer and fall of 2012.
On January 25, 2013 the Ontario Government offi cially released Mr. Dean’s Report. The Co-Chairs of
the SC Board of Directors and the Chair of the OAC Board of Directors immediately responded to the
release of Mr. Dean’s report with a letter thanking him and his staff for their work and for their tireless
effort to balance the interests of all OMERS members, sponsors and other stakeholders. The letter
from the Co-Chairs and Chair stated that “We agree with Mr. Dean’s observation that OMERS has been
a success story, both in Canada and internationally, and we welcome his suggestions to enhance
OMERS governance to ensure its continued strength. The OAC and SC are fully committed to working
together to address the various recommendations contained in Mr. Dean’s Report.”
As noted in the Report, the OAC and SC have already collaboratively addressed some of the issues
raised by Mr. Dean. OMERS representatives have made clear the belief across the organization that
addressing these recommendations will lead to an even stronger OMERS, and all involved look
forward to continuing to work together to achieve that objective.
OMERS will ensure that its stakeholders are kept apprised of progress as the process to address the
Report moves forward. As milestones are reached information will be widely distributed through
several channels including OMERS Spring and Fall Information Meetings, newsletters, omers.com
and omerssc.com.


2012 Annual Report

OMERSAdministration CorporationTable of Contents
2 Message from the President and CEO
4 Governance: OMERS
Administration Corporation
10 Proxy Voting
12 Senior Management Team
13 Board of Directors
14 2012 Management’s Discussion and Analysis
68 Compensation Discussion and Analysis
78 Responsibilities of Management,
Actuary and Independent Auditors
79 Actuarial Opinion
80 Independent Auditors’ Report
81 Consolidated Financial Statements
84 Notes to Consolidated Financial Statements
124 Ten-Year Financial Review
126 Glossary

1 2012 Annual Report OMERS Administration Corporation

2 OMERS Administration Corporation 2012 Annual Report
OMERS Administration Corporation
“ The outlook for the Plan is strong. If we continue to make our 20-year average annual return of 8.64 per cent during the next decade, the Plan will return to surplus ahead of schedule. ”
Michael Nobrega
President and CEO
OMERS

3 2012 Annual Report OMERS Administration Corporation
Message from the President and CEO
The OMERS Primary Pension Plan (the Primary Plan or the Plan) ended 2012 in a strong fi nancial position with a solid asset base, prudent debt fi nancing
with a Triple A credit rating, the capacity to generate growing investment cash fl ows and more than ample liquidity to withstand market shocks under
stressed fi nancial conditions. Investment performance in 2012 further fortifi ed the Plan’s fi nancial foundations with a 10.03 per cent total fund return, which
exceeded the actuarial annual requirement of 6.5 per cent necessary to keep the Primary Plan fully funded over the long term. Investment performance
contributed $5.2 billion in net investment income, resulting in OMERS ending 2012 with $60.8 billion in net assets.
The net assets will underpin the retirement income of 429,000 plan members for decades to come, despite the fact that liabilities will progressively grow
as the baby boom generation retires over the next 15 years. The present value of the defi ned benefi t accrued pension obligation was $69.1 billion at the
end of 2012, leaving a funding defi cit of $9.9 billion as at December 31, 2012.
The outlook for the Plan is strong. If we continue to make our 20-year average annual return of 8.64 per cent during the next decade (and we are working
to do much better than that), the Plan will return to surplus ahead of schedule. Further, strong cash fl ows generated from contributions from employers and
members, coupled with cash fl ows from dividends, interest payments and income distributions, are expected to exceed benefi t payments for at least
20 years.
The bedrock of the Pension Plan is OMERS fortress balance sheet that rests on four core investment platforms. Three platforms – Oxford Properties Group,
Borealis Infrastructure and OMERS Private Equity – along with OMERS Strategic Investments, invest in private markets and collectively these Investment
Entities generated a return of 13.79 per cent in 2012, confi rming yet again the prescience of the OMERS Board in 2003 when it approved a long-term shift of
capital into private market assets to produce strong and more stable returns. Oxford, which manages $9.1 billion of the Plan’s net investment assets in
commercial real estate, and Borealis, managing $9.8 billion of the Plan’s net investment assets in infrastructure, are large cash generating machines with
embedded economic resilience even in adverse market conditions. The third private market platform, OMERS Private Equity, which manages $6.0 billion of
the Plan’s net investment assets, has built a large directly owned and actively managed portfolio of private companies and is in the process of replacing its
reliance on expensive external fund managers.
The fourth core investment platform invests in public markets and produced a 7.50 per cent return in 2012. With $35.0 billion of the Plan’s net investment
assets, OMERS Capital Markets continued to evolve its investing strategies to mitigate the impact of volatile stock markets buffeted by the persistent
European sovereign debt crisis, diffi culties in the U.S. economic recovery, slower growth in China and depressed commodity prices in Canada.
The inherent strengths of the balance sheet make OMERS an attractive counterparty and investment ally for other institutions. In 2012, we managed
$7 billion of third-party assets and we expect this to increase in the future. Two major international institutions have signed on as partners in the Global
Strategic Investment Alliance (GSIA) to invest in large-scale infrastructure assets alongside OMERS and in 2012 Borealis acquired a major infrastructure
asset which is expected to become the fi rst GSIA investment in 2013. Also, Canadian pension funds can now invest in OMERS platforms through
investment contracts and we secured our fi rst client, who will invest in the Borealis infrastructure portfolio starting in 2013. As well, the Additional Voluntary
Contributions program continues to attract plan members and has stimulated member interest in buying past service to top up pension benefi ts. These
capital raise programs are gaining traction and will enable the Plan to participate in large investments that we would not otherwise purchase on our own for
risk and capital availability reasons.
Another priority for OMERS is membership growth. Our Pension Services Group is exploring options for growth through new relationships with municipal
employers that may not have access to the economies of scale available through OMERS.
In 2003, OMERS adopted its current strategic plan including an investment strategy designed to provide balance between public and private market
assets and to generate long-term, stable cash fl ows while maintaining liquidity under stressed fi nancial conditions. The strategy has evolved to incorporate
a “direct drive” ownership model providing OMERS with greater control of its investments at a lower cost. Enterprise-wide programs have also been
developed to promote employee engagement and participation in the execution of the strategy.
The strategy is achieving results on all fronts and, in 2012, OMERS marked the fi fth consecutive year as one of AON Hewitt’s Best Employers in Canada and
the third year as Pension Fund of the Year: Canada (World Finance Magazine). We are confi dent that the current strategic plan is the right one for OMERS
and that the initiatives embedded in the strategy will continue to contribute to the long-term fi nancial sustainability of the Plan.
Michael Nobrega

4 OMERS Administration Corporation 2012 Annual Report
OMERS Administration Corporation
Governance:OMERS Administration CorporationUnder the Ontario Municipal Employees Retirement System Act, 2006, which was proclaimed into law in June 2006, OMERS Administration Corporation is responsible for pension administration, valuation of the accrued pension obligation and investment of the pension funds.
Corporate and Board Governance
Effective and transparent pension plan governance is the foundation
that allows OMERS to fulfi ll its pension promise to its members.
Throughout its 50-year history, OMERS has continuously sought
to achieve high standards in governance, as evidenced by its
Governance Vision and Mission.
Governance Vision
The OMERS Administration Corporation Board of Directors will be
publicly recognized as an industry leader in corporate and pension
governance.
Governance Mission
The purpose of governance is to ensure effective board and
management decision-making through the use of processes and
controls to ensure the Plan is administered in the best interests of
Members and Benefi ciaries.
Key Board Responsibilities
The OAC Board has many important responsibilities, as outlined in
the OAC Board Mandate which can be found on our website. The key
responsibility of the OAC Board is to set the overall course of OAC,
including its investment direction and objectives, and to ensure that
the pension services for which it is responsible are executed
effectively and effi ciently. It also actively oversees fi nancial reporting
and actuarial matters such as the annual valuation of the liabilities of
the OMERS Pension Plans. The OAC Board approves the strategic
planning process followed by OAC as well as the Strategic Plan
prepared by the management team. The OAC Board also delegates
to Management responsibility for day-to-day business activities
including a number of other important functions such as compliance,
internal controls and talent management. With respect to these
delegations, the role of the OAC Board is to monitor Management and
to ensure that its activities remain consistent with the longer term
vision, objectives and directional framework set by the OAC Board.

5 2012 Annual Report OMERS Administration Corporation
Other key specifi c responsibilities of the OAC Board include identifying
and appointing the Chief Executive Offi cer (CEO) of OAC as well as
assessing the performance of the CEO. Compensation of Management
is also set by the OAC Board.
OAC Board Governance
Many policies and practices are in place to support OAC’s commitment
to leading governance practices and Board performance including:
• Governance Manual that is available on our website;
• comprehensive OAC Board development program that includes external
director certifi cation and an internal orientation in OAC Board operations
and governance;
• external auditor independence policy;
• detailed Code of Conduct covering areas such as confl ict of interest,
fi duciary duties and privacy and confi dentiality;
• personal and insider trading policy which requires OAC Board
members, senior management and applicable employees to
pre-clear their personal trading;
• requirement that members of the Audit Committee meet the standard of
fi nancial literacy; and
• transparency and accountability processes including regular meetings
with Plan members and other stakeholders, as well as timely and
accurate print and electronic communication of developments.
Summaries of OAC Board and committee decisions are published
on the OMERS website.
We expect that in 2013 the OAC Board will be spending considerable
time dealing with implementation of the recommendations contained in the
2012 Reviewer’s Report.
Further details on OAC’s governance practices can be found in the OAC
Governance Manual that is available on www.omers.com.
OAC Board Membership
In 2009 OMERS Sponsors Corporation (SC) enacted SC By-law No.13
which names specifi c sponsor organizations that have the right to
nominate individuals to be considered by the SC for appointment to the
OAC Board. According to SC By-law No. 13, the OAC Board is comprised
of 14 members who are proposed by the following organizations:
• Association of Municipalities of Ontario (2 members);
• Canadian Union of Public Employees (Ontario) (2 members);
• City of Toronto (1 member);
• Electricity Distributors Association (1 member);
• Ontario Association of Children’s Aid Societies (1 member);
• Ontario Association of Police Services Boards (1 member);
• Ontario Professional Fire Fighters Association (1 member);
• Ontario Public Service Employees Union (1 member);
• Ontario Secondary School Teachers’ Federation (1 member);
• Police Association of Ontario (1 member);
• Retiree groups (1 member); and
• School boards (1 member) (rotation between public and Catholic
associations).
OAC Board Appointments
The OAC Board appoints the CEO, who is not a member of the OAC
Board, as well as the OAC’s independent auditor and external actuary
responsible for Plan valuation and related matters. The OAC Board has
its own independent external counsel to provide legal advice to the
OAC Board when confl ict matters arise.
Governance

6 OMERS Administration Corporation 2012 Annual Report
OMERS Administration Corporation
OAC Board Practice
The OAC Board has regular in camera meetings without Management
present. The Board also conducts regular evaluations of its performance
at the end of meetings as well as annually. It regularly reviews the critical
competencies the Board needs to oversee the affairs of OAC and serve
the interests of Plan members.
OAC Board Remuneration and Expenses
The remuneration paid to OAC Board members is determined by SC
By-law No. 6. For 2012, the SC’s by-law provides for the Chair to receive
total compensation of $70,000 per annum while the Chairs of committees
receive an annual retainer of $17,800 per annum and other members
receive an annual retainer of $12,800. In addition, all OAC Board members,
with the exception of the OAC Board Chair, receive a meeting fee of $750
to a maximum of 24 meetings per year.
Hearings of the Appeals Sub-Committee, which meets when required to
deal with appeals fi led by Plan members, are not subject to, or counted in,
calculating the 24 meeting per year limit.
The table on page 8 includes remuneration paid to OAC Board members
for OAC Board and committee meetings as well as other eligible expenses
in 2012, with comparable numbers for 2011.
OAC Board Committees
In 2012, the OAC Board had four standing committees which assisted
the OAC Board in discharging its responsibilities.
As part of its regular review of processes to enhance OAC Board
operations, the Board determined that, commencing in July 2012, the
activities of the Investment Committee, which was a committee of the
whole OAC Board, would be merged with the OAC Board, and investment
matters are now considered as part of the regular meetings of the
OAC Board.
The OAC Board also uses sub-committees from time to time to deal
with special situations.
Governance Committee
The Governance Committee annually reviews the mandates of the OAC
Board and its committees. It has oversight of the OAC Board Orientation
and Education programs. It is also responsible for implementing periodic
internal assessments of the OAC Board’s performance. It recommends
changes to OAC governance where required to address effectiveness
issues; assesses the competency requirements of the OAC Board; and
recommends the skills and experience needed for the OAC Board. The
Committee is also responsible for reviewing relevant policies relating to
governance, including an OAC external communications policy.
Audit Committee
The Audit Committee assists the OAC Board in fulfi lling its oversight
responsibilities for the:
• integrity of the fi nancial reporting process and fi nancial statements;
• system of internal controls and the review of the disclosure of fi nancial
information;
• system of risk management and fraud risk management;
• internal audit process;
• external audit of the fi nancial statements;
• organizational processes for monitoring compliance with laws and
regulations and the Code of Conduct; and
• Ethics Hotline (whistle-blower process) and special investigations.

7 2012 Annual Report OMERS Administration Corporation
Human Resources Committee (HRC)
The purpose of the Human Resources Committee (formerly the Leadership
Resources and Compensation Committee) is to assist the OAC Board in
meeting its fi duciary oversight and related obligations by:
• attracting, retaining and motivating excellent leaders at the senior
executive level who are committed to the OAC Mission Statement
and Core Values;
• overseeing a robust succession planning process for the position
of CEO; and
• overseeing senior executive performance, compensation and
compensation policies.
Member Services Committee (MSC)
The Member Services Committee assists the OAC Board in meeting its
fi duciary oversight and related obligations in relation to Plan funding and
pension administration policies and strategies, and in discharging its
related monitoring, compliance and risk mitigation responsibilities. The
Committee ensures oversight of management activities in key areas of
pension services and administration which includes approving pension
innovation and strategic matters, overseeing the work of the external
actuary and recommending the annual actuarial valuation, including
assumptions and methods, to the OAC Board and reviewing OAC
communication strategies, material administration projects and changes to
pension legislation/regulations. The Committee also acts as the fi nal
internal appeals body for determinations by the President governing
benefi t entitlements under the OMERS Pension Plans.
Appeals Sub-Committee
The Appeals Sub-Committee serves as an appeals tribunal for Plan
members who are appealing decisions of the President and CEO
(or his delegates) regarding their pension benefi t entitlements. The
Appeals Sub-Committee hears evidence and renders decisions in
these appeals. It retains independent external counsel to assist it in
its deliberations. Starting in 2013, the Appeals Sub-Committee will be
replaced by an Appeals Panel of the Member Services Committee.
OAC Joint Council Sub-Committee (JCSC)
This sub-committee, comprised of four members of the OAC Board, has
been mandated by the OAC Board to participate as the OAC Board’s
representation on the AC/SC Joint Council. The AC/SC Joint Council was
formed following the execution of the Framework Agreement with the SC in
2009 as a venue in which to address matters of importance to either party
with respect to oversight and governance of the OMERS Pension Plans,
including the Framework Agreement.
OAC Board Attendance
OAC Board and Committee meeting attendance in 2012 is as detailed
on page 9.
Governance

8 OMERS Administration Corporation 2012 Annual Report
OMERS Administration Corporation
OAC Board Remuneration and Expenses
For the year ended December 31, 2012 2011Remuneration Expenses (i) Remuneration Expenses (i)
Rick Miller (2012 Chair) $ 70,000 $ 73,118 $ 35,800 $ 42,125
Bill Aziz 35,800 19,663 30,800 13,352
Monty Baker 30,800 23,926 - -
Fred Biro 32,300 19,916 6,200 1,146
David Carrington 37,300 2,894 33,800 3,788
Richard Faber 35,800 32,147 35,800 24,496
Laurie Nancekivell 30,800 26,172 31,550 7,594
David O'Brien 35,800 12,503 35,800 17,389
James Phillips 35,800 22,469 30,800 8,293
John Sabo (2011 Chair) 30,800 22,216 70,000 39,076
Eugene Swimmer 30,800 26,248 36,550 17,787
Leslie Thompson 35,800 24,472 31,550 3,923
Sheila Vandenberk 37,300 22,982 30,800 20,914
John Weatherup 30,800 8,891 30,800 5,389
Former Board Members - 1,000 63,400 35,750
Other Expenses (ii) - 146,425 - 149,871
Total $ 509,900 $ 485,042 $ 503,650 $ 390,893
(i) Includes reimbursement for normal out-of-pocket business expenses including education, meeting and communication expenses incurred on behalf of OAC. Board expenses incurred by Directors are reported to the Audit Committee annually.
(ii) Other expenses include Board group meeting expenses not allocated by individual.

9 2012 Annual Report OMERS Administration Corporation
Governance
2012 Board/Committee Meetings
Director (i)OAC Board
MeetingsAudit
CommitteeInvestmentCommittee
GovernanceCommittee
Human Resources Committee
Member Services
Committee
Joint Council
MeetingsCommittees
(Total)Overall
Attendance
Attended % Attended Attended Attended Attended Attended Attended Attended % Attended %
Bill Aziz 23/23 100% (Chair) 5/6 4/4 7/7 16/17 94% 39/40 98%
Monty Baker 19/23 83% 4/4 6/6 6/6 16/16 100% 35/39 90%
Fred Biro 23/23 100% 6/6 7/7 6/6 19/19 100% 42/42 100%
David Carrington 23/23 100% 3/4 6/6 9/10 90% 32/33 97%
Richard Faber (ii) 23/23 100% 6/6 4/4 (Chair) 7/7 17/17 100% 40/40 100%
Rick Miller (ii) (iii) 23/23 100% 3/4 5/6 7/7 4/4 6/6 7/7 32/34 94% 55/57 96%
Laurie Nancekivell 22/23 96% 5/6 6/7 6/6 17/19 89% 39/42 93%
David O'Brien 18/23 78% 4/6 (Chair) 3/4 5/7 12/17 71% 30/40 75%
James Phillips 23/23 100% (Chair) 4/4 6/6 4/4 14/14 100% 37/37 100%
John Sabo 22/23 96% 4/4 6/6 10/10 100% 32/33 97%
Eugene Swimmer 23/23 100% 4/4 6/6 6/6 16/16 100% 39/39 100%
Leslie Thompson 22/23 96% 6/6 (Chair) 7/7 13/13 100% 35/36 97%
Sheila Vandenberk 21/23 91% 6/6 6/7 (Chair) 6/6 18/19 95% 39/42 93%
John Weatherup 21/23 91% 5/6 5/7 3/4 13/17 76% 34/40 85%
Overall Attendance 95% 92% 93% 90% 92% 100% 93% 93% 94%
(i) OAC Directors also attended other discretionary meetings such as the Spring and Fall Information Meetings, Joint Education Sessions with the SC, New Board and Committee Member Orientation Sessions, site visits to several of our Portfolio Companies, in-house education sessions and updates from the Board Chair on meetings held with the 2012 Reviewer and SC Co-Chairs.
(ii) Attended a series of six meetings regarding the OMERS Governance Review 2012 and the Reviewer’s recommendations to the Minister of Municipal Affairs and Housing.
(iii) Ex offi cio member for Audit, Governance, HRC and MSC.

10 OMERS Administration Corporation 2012 Annual Report
OMERS Administration Corporation
The proxy vote is an important asset of a pension fund. We exercise
our ownership rights by voting proxies diligently in a manner intended
to maximize the long-term value of our investments.
We believe that well managed companies with strong governance
practices will generally contribute positively to long-term investment
returns. Conversely, poorly managed companies with poor
governance practices are more likely to increase the risk of not
achieving positive long-term investment returns.
Our proxy voting guidelines contain general statements about
how OMERS is likely to vote on a particular issue. These are not
completely rigid positions, and we may consider extenuating
circumstances that might call for a different vote than a specifi c
guideline suggests. This may include taking into account different
regulatory or corporate governance regimes and customary
practices in different jurisdictions.
Our proxy voting guidelines, and our voting record for the Canadian
and U.S. markets, can be found on our website.
Proxy Voting Guidelines
OMERS understands the different roles and responsibilities
of shareholders, directors and management in the corporate
governance system. Accordingly, when OMERS exercises its
voting rights, it does not seek to manage the companies in which
it owns shares. OMERS considers its vote an important tool by
which it can express its views and infl uence management and the
board of directors over the way in which the corporation is being
managed and overseen.
Proxy VotingWe own shares in numerous publicly traded companies around the world. Share ownership carries with it important rights and responsibilities, including the right to vote shares at company meetings.

11 2012 Annual Report OMERS Administration Corporation
Proxy Voting
Our proxy voting guidelines are based on a number of key principles,
including:
Board of Directors
Good corporate governance practices should be followed to encourage
effective and independent boards.
Executive and Director Compensation
Executive compensation should be reasonable, performance-based
and structured in a manner that aligns management with the long-term
interests of shareholders.
Takeover Protection
Shareholder rights plans should permit the board and management
to respond to takeover offers in a manner that enhances long-term
shareholder value.
Shareholder Rights
Share structures should support the basic principle linking voting
to equity ownership on the basis of “one share, one vote”.
Environmental, Social and Governance
High ethical and environmental standards and respect for their employees,
human rights and the communities in which they do business contribute
to long-term fi nancial performance.
Proxy Votes
During 2012, we voted on a total of 18,575 items covering 1,669
shareholder meetings globally. In Canada, we voted on 2,701 items
in 258 shareholder meetings. Outside of Canada, we voted on
7,559 items in the U.S. and 8,315 items outside of North America
at 1,411 shareholder meetings.
Proxy Items Voted
•8,315 Non North America
•7,559 United States
•2,701 Canada

12 OMERS Administration Corporation 2012 Annual Report
OMERS Administration Corporation
Investment Management Team
Michael NobregaPresident and Chief Executive Offi cer
Patrick CrowleyExecutive Vice Presidentand Chief Financial Offi cer
Jennifer BrownExecutive Vice President and Chief Pension Offi cer
Michael LatimerExecutive Vice President and Chief Investment Offi cer
Warren BellExecutive Vice President and Chief Human Resources Offi cer
Rodney HillExecutive Vice Presidentand Chief Auditor
G. Blair Cowper-SmithExecutive Vice President, Corporate Affairs and Chief Legal Offi cer
Jacques DemersPresident and CEOOMERS Strategic Investments
Michael RollandPresident and CEOBorealis Infrastructure
Blake HutchesonPresident and CEOOxford Properties Group
James DoneganPresident and CEOOMERS Capital Markets
Paul G. RenaudPresident and CEOOMERS Private Equity
Senior Management TeamCorporate Management Team

13 2012 Annual Report OMERS Administration Corporation
Richard Faber
Rick MillerChair
Frederick BiroMonty BakerBill Aziz
David Carrington Laurie Nancekivell
James Phillips
David O’Brien
John Sabo
Board of Directors
Eugene Swimmer
Sheila Vandenberk
Leslie Thompson
John Weatherup

14 OMERS Administration Corporation 2012 Annual Report
OMERS Administration Corporation
2012 Management’s Discussion and AnalysisTable of Contents
16 Vision and Strategy
18 Enterprise-Wide Strategic Plan
20 OAC Summary
20 Review of 2012 Results
20 2012 Economic Overview
21 Investment Performance Overview
23 Benchmark Returns
24 Net Assets of the Plans
25 Assets Under Management
25 Investment Management and Pension
Administration Expenses
25 Debt
26 Plan Asset Mix
27 Asset Class Allocation
27 Internal Controls Review
28 OMERS Pension Plans
28 OMERS Primary Pension Plan
29 Retirement Compensation Arrangement
29 OMERS Supplemental Pension Plan for Police,
Firefi ghters and Paramedics
30 Plan Funding Status
35 OMERS Pension Services
40 The Funds
42 OMERS Capital Markets
48 OMERS Private Equity
52 Borealis Infrastructure
56 Oxford Properties Group
60 OMERS Strategic Investments
62 Risk Management
67 Critical Accounting Policies
OMERS Administration Corporation (OAC) is the administrator of the OMERS
pension plans (the OMERS Pension Plans or the Plans) as defi ned in the Ontario
Municipal Employees Retirement System Act, 2006 (the OMERS Act). The
OMERS Pension Plans include OMERS Primary Pension Plan (the Primary Plan
or the Plan), the Retirement Compensation Arrangement (the RCA) associated
with the Plan and the OMERS Supplemental Pension Plan for Police, Firefi ghters
and Paramedics (the Supplemental Plan). Additional Voluntary Contributions
(AVCs) are offered to Plan members as part of the Primary Plan. OAC is
responsible for administrating the OMERS Pension Plans and investing the
funds of the Plan, the RCA and the Supplemental Plan (collectively, the Fund or
the Funds). The Funds are managed by the following entities: OMERS Capital
Markets (public markets investments, mortgages and private debt), OMERS
Private Equity (private equity), Borealis Infrastructure (infrastructure), Oxford
Properties Group (real estate) and OMERS Strategic Investments (strategic
investments from any asset class) (collectively the Investment Entities). This
management discussion and analysis is the responsibility of the management of
OAC (Management) and contains Management’s analysis of the Plans’ fi nancial
condition, operational results and the environment in which they operate as of
February 21, 2013. This section should be read in conjunction with the OAC
Consolidated Financial Statements. The Audit Committee and Board of Directors
of OAC (the Board) have reviewed and approved the contents of this Management
Discussion and Analysis.
In addition to historical information, this section contains forward-looking
statements with respect to Management’s strategy, objectives, outlook and
expectations. Forward-looking statements can be identifi ed by use of words
such as “believe”, “expect”, “may”, “could”, “intend”, “continue” or “estimate” or
variations of such words and phrases or statements that certain actions, events
or results “may” “could”, “would”, “might” or “will” be taken or achieved. By their
very nature, such statements are subject to risks and uncertainties, which may
cause actual results to differ from the expectations expressed in the forward-
looking statements. Forward-looking statements made in this section represent
Management’s views at the date of this report and OAC does not undertake to
update or revise any forward-looking statements as a result of new information,
future events, or otherwise.

15 2012 Annual Report OMERS Administration Corporation
Management’s Discussion and Analysis

16 OMERS Administration Corporation 2012 Annual Report
OMERS Administration Corporation
Vision and StrategyWe have one clear and overriding goal – to keep the pension promise to our current and future retirees.
We work as a team in pursuit of outstanding performance that will enable us to meet this objective including:
• generating suffi cient returns over the long term through
the investment of the Funds; and
• providing excellent pension administration services to
our members and employers, the most important of which
is to pay monthly pensions to retirees.

17 2012 Annual Report OMERS Administration Corporation
LeadBe the leader in the pension industry.
We want to be nothing less than the leader in the pension
industry. We will earn this status if we rank in the top quartile
of investment performance over the long term and if we set
the industry standard for service to Plan members and
employers.
Perform Provide fi rst-in-class investment management.
We recognize the importance of earning superior
risk-adjusted returns in the long term. This means superior
returns while being conscious of the actions we are taking
to keep pensions secure.
ServeDeliver superior pension services to our members and employers.
Services to Plan members are one of our top priorities
and one of our key strengths.
GrowAttract investment partners and employers through our leadership.
Growth is an objective not for its own sake but because it
will expand the range and size of investment opportunities
we can pursue leading to improved returns and allowing us
to improve our services for the benefi t of all members.
Our vision focuses on four key areas which are integrated into our strategies and decisions:
Management’s Discussion and Analysis

18 OMERS Administration Corporation 2012 Annual Report
OMERS Administration Corporation
Enterprise-Wide Strategic PlanThe OAC 2012-2016 Enterprise-Wide Strategic Plan is the joint product of the Board and Management of OAC. It has evolved as a shared vision from a consultative strategic planning process.
The Strategic Plan refl ects research and industry-leading
initiatives developed by Management. It is infl uenced by
open and transparent conversations between Board
members and Management that occur at least six times
per year when detailed update reports are formally
presented to the Board. The focus on strategy is a matter
of routine during ongoing liaison between the Board
Chair and the OAC CEO.
It is our practice for the Board and Management to
engage in a high level of collaboration, consistent with
leading governance practices. In February 2012, Board
members identifi ed the broad issues that would guide the
2012 strategic planning discussions, including OMERS
funding position, global macroeconomic trends and
their implications for OMERS investment strategy and
the impact and opportunities of potential pension reform
in Canada.
In April 2012, the Board devoted a signifi cant amount
of time to discussing a draft of the Strategic Plan and
approved the fi nal version in June 2012.
The Strategic Plan is a living document. While the main pillars of our
Strategic Plan have been consistent for the last fi ve years, new and
revised initiatives and issues arise each year while other initiatives
are removed from the plan based on research and due diligence. In
addition, events beyond our control at home and abroad infl uence
the content and tone of our strategy. Throughout the year, the Board
receives informational updates and is called upon for approval of
specifi c initiatives, allowing Management to implement them.
The six pillars of OAC’s Strategic Plan include:
1. Asset Mix Policy
Our asset allocation policy is based on our belief that over the long
term an asset mix with greater exposure to private market
investments positions the Plan to generate strong, predictable returns
and consistent cash fl ows with reduced risk to meet its funding
requirements. This Board-approved asset mix policy sets targets and
ranges of public and private markets investments. Our investment
strategy over the long term is to move to and maintain our asset mix
exposure to public market investments, such as public equities and
interest bearing investments, at approximately 53 per cent of the
Plan’s net investment assets with the remaining 47 per cent
representing exposure to private market investments, such as private
equity, infrastructure and real estate.
At the end of 2012, the Plan’s public markets investments
represented 59.9 per cent of net investment assets and private
markets investments represented 40.1 per cent of net investment
assets. The investment in private markets is down from 42.4 per cent
at December 31, 2011 due to rising share prices in the public markets,
the sale of certain private market investments and strong cash yields
from private market investments. With signifi cant private market
investment opportunities developing, our goal is to achieve the
long-term target of 47 per cent for private market investments by 2016.
2. Direct Drive Active Asset Management
We are making signifi cant progress in actively managing an
increasing proportion of OMERS investments internally to enhance
returns and reduce investment costs. The principal drivers are
increased direct drive active management of foreign publicly traded
equities and private equity investments. Our long-term goal is to have
95 per cent of total fund assets directly managed. Achievement of this
goal is expected to result in net savings of over $173 million over the
period of 2008-2013. Of this, savings amounting to $129 million have
already been realized to the end of 2012. As at December 31, 2012,
total fund assets managed internally were 88.3 per cent as compared
with 83.8 per cent at the end of 2011. This increase is attributable to
ongoing implementation efforts of both OMERS Capital Markets and
OMERS Private Equity.

19 2012 Annual Report OMERS Administration Corporation
Enterprise-Wide Strategic Plan
Management’s Discussion and Analysis
3. Access to Domestic Capital
OMERS Investment Management (OIM) was established in 2009 with the principal objective of raising domestic capital from other pension plans and other
eligible clients. Accessing domestic capital to build a larger capital base will enable OMERS to continue to pursue attractive investments for the benefi ts of
OMERS Plan members. OIM has built signifi cant awareness of OMERS investment capabilities in Canada, particularly in its private market strategies.
During 2012, OIM signifi cantly expanded its marketing efforts and as a result at December 31, 2012 was in advanced discussions with parties interested in
gaining exposure in their funds to the performance of the annual investment return of the OMERS Primary Plan or the return of a specifi c Investment Entity.
Early in 2013, the fi rst OIM transaction was completed with another Canadian pension fund to provide the rate of return on OMERS infrastructure assets
managed by Borealis Infrastructure.
In November 2012, the Ontario Ministry of Finance issued a report entitled “Facilitating Pooled Asset Management for Ontario’s Public-Sector Institutions”
(the Morneau Report). The Morneau Report identifi es an opportunity for smaller public sector funds to benefi t from the implementation of a pooled asset
management framework through (i) reduced duplication and costs, (ii) broader access to additional asset classes, (iii) enhanced risk management
practices and (iv) more diversifi ed portfolios. The proposed framework would permit institutions to retain fi duciary responsibility and control over asset
allocation decisions, create and offer a “family of unitized pooled funds”, operate at arm’s length from the Ontario government and facilitate exceptional
fund governance and risk management. OIM provides an excellent platform to seize this opportunity and our directed marketing efforts are expected to
help build a larger capital base for OMERS.
The Additional Voluntary Contributions initiative which was successfully launched on January 1, 2011 continues to gain momentum. At its second
anniversary, AVCs had accumulated $170 million. AVCs are further discussed on page 37 of this Annual Report.
We are continuing our efforts to pursue traditional and associated employers to either join OMERS or, if they have existing plans, to consolidate their plans
with OMERS. Bill 236 (the Pension Benefi ts Amendment Act, 2010) facilitates such asset transfers. Regulations to support Bill 236, expected to be released
in early 2013, should help us move this initiative forward.
4. Access to Foreign Capital
OMERS Strategic Investments (OSI) is leading our initiative to access foreign capital. OSI has formed the Global Strategic Investment Alliance (GSIA) to
enable OMERS to leverage its capital alongside new sources of co-investment capital from like-minded, long-term institutional investors in North America,
Europe, Asia-Pacifi c and the Middle East. The GSIA enhances OMERS ability to secure preferred large-scale private market investments, mainly in North
America and Western Europe, while leveraging OMERS investment management expertise. In April 2012, the GSIA was launched with participation from the
Pension Fund Association and a consortium led by Mitsubishi Corporation, both of Japan, and OMERS. During 2013, OAC expects to complete the fi rst
GSIA investment and to expand the size of the GSIA with additional members.
During 2012, a new entity, Rosewater Global Limited (Rosewater), was established to act as the Alliance Administrator for the GSIA. Rosewater is
responsible for ensuring the effective and effi cient administration of the GSIA for all members.
5. Strategic Investment Opportunities
The OMERS Worldwide brand has been established through OSI as a unifying global brand to assist the Investment Entities in sourcing global investments.
We are continuing the process of creating a global investment footprint by (i) establishing a network of offi ces in major fi nancial centres, (ii) building
awareness of the intellectual capital of the entire enterprise under the OMERS Worldwide brand via a proactive media strategy and (iii) creating awareness
about our GSIA initiative by participating in leading business conferences and building relationships with business and government leaders.
OMERS Ventures was launched in 2011 with a mandate of making venture capital investments, throughout a company’s fi nancial lifecycle from seed
investments to investments in later stages. In 2012, OMERS Ventures invested a total of over $110 million in a number of leading technology fi rms in
Canada, with the goal of enhancing these fi rms’ ability to become global companies and hence generating signifi cant returns for OMERS.
6. Barriers to Growth
OAC continues to work with provincial and federal governments as well as others in the Canadian pension industry with respect to removing restrictive rules
that act as barriers to OMERS growth. Over the last few years OAC has been successful in having a number of the restrictive rules amended.
Other barriers to growth remain, specifi cally the regulatory block to the employees of OMERS Investment Entities joining the Plan. While Bill 135 amended
the OMERS Act to allow OMERS Investment Entities participation in the Plan, this provision will only be proclaimed following changes to the Federal Income
Tax Regulation 8514, the timing of which is uncertain. We believe this initiative enhances the alignment of our investment teams with the overall objectives of
the Plan.
Following the Canadian Minister of Finance announcement in 2011 that the Federal Government intends to move forward with Pooled Registered Pension
Plans (PRPPs), the Government of Ontario announced in its March 2012 Budget that it will work with other provinces and the Federal Government on
developing a PRPP model. OAC continues to monitor the development of PRPPs at the provincial level to ensure that OMERS is not disadvantaged or
deprived of the opportunity to be an eligible provider of PRPPs.

20 OMERS Administration Corporation 2012 Annual Report
OMERS Administration Corporation
OAC SummaryReview of 2012 Results
Investment Objective
Our investment objective is to meet the pension
promise and add surplus wealth. To fulfi ll the pension
promise to our current and future retirees, we must
produce net investment returns that generate 6.5 per
cent (4.25 per cent real return plus 2.25 per cent infl ation
rate) or more on the asset classes in which we invest
within an acceptable risk tolerance.
Management Approach
Defi ne an asset mix strategy and investment strategy
to meet the Plan’s investment objectives.
2012 Performance
Total Plan gross return of 10.03 per cent
(net return: 9.50 per cent) compared to a gross return of
9.75 per cent for the benchmark and within our strategic
target return of 7 to 11 per cent.
RCA Investment Fund return of 11.84 per cent
compared to 12.21 per cent for the benchmark.
2012 Economic Overview
Equity markets were defi ned by a number of events in 2012 that
signifi cantly affected investors’ appetite for risk. 2012 promised to be
a year full of unknown political and economic outcomes. Investors
were faced with an uncertain result in the U.S. election, a sovereign
European debt crisis that was beginning to spread beyond Greece
and a slowing U.S. and global economy.
Overall in 2012, the economic data out of the U.S. was not overly
encouraging with an unemployment rate that remained stubbornly
high throughout the year and GDP growth that signaled a slowdown
in the economy. On the political front, market participants were faced
with uncertainty leading up to the presidential election after which
they turned their attention to the “fi scal cliff”– consequences from the
reversal of tax reductions and implementation of spending cuts that
would activate on January 1, 2013 without U.S. Government action.
China’s annual growth rate fell for seven straight quarters through the
third quarter of 2012 which prompted China’s central bank to cut
interest rates several times during 2012.
The global investment climate was fragile at best. The year began
with investors bracing for another year of potential market volatility
similar to 2011, but unprecedented action taken by central banks
worldwide in 2012 resulted in a year that rewarded those investors
who remained invested in equities. Major global equity markets
posted impressive gains in 2012 primarily as a result of continued
central bank easing, with the S&P 500 index, the DAX index
(Germany), the CAC index (France), and the TOPIX index (Japan)
all providing double digit returns while the S&P/TSX index closed
2012 up four per cent. The smaller increase in the TSX was driven
primarily by the fi nancial sector, offset in part by negative returns in
the resource sectors.
With interest rates continuing at or near historical lows, fi xed income
indices posted much lower returns than the past few years. OMERS
continued its overweight fi xed income strategy to preserve capital in
light of continuing global uncertainty and to maintain adequate
liquidity to meet the funding requirements for private market
investments.

21 2012 Annual Report OMERS Administration Corporation
OAC Summary
Investment Performance Overview
Through our Investment Entities, we invest in several asset classes – public markets, private equity, infrastructure and real estate – both in Canada
and around the world.
Investment Entity Primary Asset Class
OMERS Capital Markets Public markets, including interest bearing securities, commercial mortgages, real return bonds and public equities
OMERS Private Equity Private equity through both direct and indirect (funds) investments
Borealis Infrastructure Infrastructure through direct investments
Oxford Properties Group Real estate direct investments
OMERS Strategic Investments Direct strategic assets of any asset class that are considered outside the mandates of the other
Investment Entities but are still considered to be in the best interest of the Fund
Our Investment Entities are described more fully beginning on page 41 of this Annual Report.
Investment returns for the Plan and RCA for 2012 and 2011 based on investment income before external manager fund and performance fees and
investment management expenses were as follows:
Returns and Benchmarks 2012 2011
For the year ended December 31, Rate of Return Benchmark Rate of Return Benchmark
OMERS Capital Markets 7.50% 8.74% -0.22% 1.26%
OMERS Private Equity 19.17% 22.09% 7.23% -5.58%
Borealis Infrastructure 12.68% 8.60% 8.79% 8.00%
Oxford Properties Group 16.91% 7.15% 8.40% 6.83%
OMERS Strategic Investments -10.13% 8.70% 7.24% 6.90%
Total Private Markets 13.79% 11.38% 8.20% 4.50%
Total Primary Plan Fund (i) 10.03% 9.75% 3.17% 2.52%
RCA Investment Fund (ii) 11.84% 12.21% -2.42% -2.43%
(i) Investment Entity returns refl ect the results of the Plan’s currency hedging related activities with external counterparties. Prior to 2012, currency hedging for private market Investment Entities was based on internal transactions. For all years, total Plan returns include the results of the Plan’s currency hedging activities.
(ii) Excludes the RCA refundable tax balance with the Canada Revenue Agency. Including the refundable tax balance, the RCA rate of return was 5.47 per cent (2011: -1.25 per cent).
Management’s Discussion and Analysis

22 OMERS Administration Corporation 2012 Annual Report
OMERS Administration Corporation
The Primary Plan achieved a 10.03 per cent total investment return in 2012, exceeding the benchmark of 9.75 per cent by 28 basis points while the RCA
Investment Fund earned 11.84 per cent compared with the benchmark of 12.21 per cent. While the OMERS Capital Markets gross return of 7.50 per cent
was 124 basis points lower than the benchmark, total private markets returns of 13.79 per cent exceeded the benchmark by 241 basis points, demonstrating
the effectiveness of the asset mix and direct drive management components of the Strategic Plan. In 2003, we adopted an asset mix policy of allocating
a greater portion of our asset mix to private markets investments. Since that time, the Plan has earned over $30 billion in total investment income and an
average annual investment return of 7.76 per cent. Our returns over this nine-year period exceeded the benchmark returns, adding $3.3 billion in value to
the Fund. The rate of return, benchmark and the value added by our investment professionals over the last one, fi ve, nine and ten-year periods are shown
in the table below:
Rate of Return and Benchmark Returns (%)For the period ended December 31, 2012
-5%
0%
5%
10%
15%
1 Year 5 Year 9 Year* 10 Year
10.03% 9.75%
0.28%
3.56% 4.08%
-0.52%
7.76%6.90%
0.86%
8.24% 7.73%
0.51%
* Period since adoption of asset mix policy in 2003. Over the nine-year period, private market investments have increased from 18.4 per cent of the Fund in 2004 to 40.1 per cent at the end of 2012.
• Annual Average Rate of Return
• Benchmark
• Value Added

23 2012 Annual Report OMERS Administration Corporation
OAC Summary
Management’s Discussion and Analysis
Benchmark Returns
We measure the performance of each of OMERS Capital Markets asset classes and OMERS Private Equity against market benchmarks set by the Board
that refl ect the results of markets in which we invest; for Borealis Infrastructure, Oxford Properties and OMERS Strategic Investments, performance is
measured against an absolute return benchmark set at the beginning of each year by the Board. We develop a benchmark for total investment activities by
aggregating and weighting the individual benchmarks for each entity. Our benchmarks are reviewed and approved by the OAC Board. Our goal is to earn
returns that equal or exceed these benchmarks. When we exceed the benchmark, our investment managers are adding value to the portfolio above the
targeted return for the asset class or the return generated by the markets through passive investments. The benchmarks used are as follows:
Entity Benchmark
OMERS Capital Markets
Fixed income Blended DEX 30 day Treasury Bill Index / DEX Universe Bond Index
Real return bonds DEX Real Return Bond Index
Canadian public equities Blended S&P/TSX Composite Index / S&P TSX 60 Index
International equities Blended MSCI All World excluding Canada and U.S. / MSCI All Cap U.S. Index
OMERS Private Equity Aggregate of Global Russell indices adjusted for geographic and sector exposures plus an illiquidity
and leverage premium; mezzanine debt based on an absolute return benchmark.
Borealis Infrastructure, Oxford Properties Group
and OMERS Strategic Investments
Absolute return set at the beginning of each year based on operating plans approved by the Board.
Total Fund (i) Weighted Average blend of Investment Entity benchmarks
RCA Investment Fund Weighted Average blend for the RCA Investment Fund is 5 per cent DEX 30-Day T-Bill + 23.75 per cent
S&P/TSX 60 Composite + 23.75 per cent MSCI EAFE (Mid/Large Cap) + 47.50 per cent MSCI USA All Cap
(i) The Total Fund return is measured against a Canadian dollar denominated composite benchmark produced by aggregating returns from each of the policy entity benchmarks, using the Fund’s asset mix policy weight.
Annual Rate of Return and Benchmark (%)For the year ended December 31,
-20%
-15%
-10%
-5%
0%
5%
10%
15%
20%
2002 2003 2004 2005 2006 2007 2008 2009 2010 2011 2012
-7.4%
15.5%
9.9%
13.2% 13.7%
5.6%
-13.2%
12.1%
11.47%
2.52%
9.75%
-7.1%
12.7%
12.1%
16.0% 16.4%
8.7%
-15.3%
10.6%
12.01%
3.17%
10.03%
• Rate of Return
• Benchmark

24 OMERS Administration Corporation 2012 Annual Report
OMERS Administration Corporation
Net Assets of the Plans
OAC net assets at December 31, 2012 were $60,767 million which includes net investment assets of $61,467 million, net pension-related assets of
$205 million less the amount due to administered funds of $905 million.
Net Assets(millions)
As at December 31, 2012 2011
Net investment assets $ 61,467 $ 55,702
Net pension related assets (i) 205 209
Due to administered funds (905) (828)
$ 60,767 $ 55,083
(i) Net pension related assets include contributions receivable, other assets and other liabilities.
Net assets increased by $5,684 million, or 10.3 per cent, compared with an increase of $1,734 million, or 3.3 per cent in 2011. The increase in
2012 was driven primarily by investment returns from all investment categories and the excess of contributions over benefi ts payments and pension
administration expenses.
Changes Net Assets(millions)
For the year ended December 31, 2012 2011
Net assets, beginning of year $ 55,083 $ 53,349
Changes due to investment activities 5,200 1,363
Changes due to pension activities 484 371
Net Assets, End of Year $ 60,767 $ 55,083

25 2012 Annual Report OMERS Administration Corporation
OAC Summary
Management’s Discussion and Analysis
Assets under Management
Attracting and managing third-party capital enables us to mitigate risk by diversifying OMERS invested capital over a greater number of large-scale assets,
with potentially a greater percentage of governance and economic control over the investments. Assets under management (AUM) were $88.1 billion at
December 31, 2012, compared to $78.2 billion at December 31, 2011 and have grown by over 37 per cent since December 31, 2008, at the height of the
fi nancial crisis when AUM were $64 billion.
(billions)
For the year ended December 31, 2012 2011
Net Assets $ 60.8 $ 55.1
Add back:
Consolidated debt 8.5 7.2
Debt in controlled investments 8.0 7.6
Third-Party Capital (i) 7.4 6.4
Other liabilities 3.4 1.9
Total Assets Under Management $ 88.1 $ 78.2
(i) Represents third parties’ gross share of equity where OMERS has governance and economic control and holds more than 50 per cent of such assets through its invested capital and funds administered on behalf of other pension plans.
Investment Management and Pension Administration Expenses
Administrative expenses are incurred for direct pension administration, direct investment management and corporate services. Direct pension administration
expenses are incurred to provide direct services to OMERS members and employers. Direct investment management expenses represent those of the
Investment Entities managing OMERS investments. Corporate services expenses primarily include corporate information systems, accounting, legal and
other governance expenses incurred to support either the pension administration or the investment management functions. These are allocated between
pensions and investments based on an estimate of the use of resources.
Investment management expenses increased slightly from $264 million in 2011 to $265 million in 2012. Investment management expenses, including
external manager performance fees recorded in investment income, represent an investment management expense ratio of 53 basis points for the year
ended December 31, 2012 compared to 58 basis points for 2011. Investment management expenses are impacted by increased salaries and benefi ts offset
by the favorable resolution of a property tax issue in Oxford Properties and lower external fund manager base and performance fees. Pension administration
and corporate support expenses were $56 million for the year, compared with $59 million for the previous year, a decrease of 5 per cent. The decrease in
pension administration and corporate support expenses resulted from OAC’s continued efforts to achieve effi ciencies across all corporate areas.
Debt
OAC has maintained an “AAA” credit rating from two leading credit rating agencies. This has enabled us, where appropriate, to obtain debt fi nancing at
preferred rates to support our investment strategy. Recourse debt includes $999 million of debentures and $2,401 million of commercial paper. The
debentures and commercial paper are guaranteed by OAC, supported by OAC’s “AAA” credit rating. Other OAC debt is secured by specifi c investments.
OAC’s total debt has increased to $8,461 million in 2012 compared to $7,239 million in 2011. Increased borrowing was incurred to fi nance the acquisition of
certain real estate assets by Oxford Properties Group.

26 OMERS Administration Corporation 2012 Annual Report
OMERS Administration Corporation
Plan Asset Mix
As discussed in the investment strategy section, one of our investment strategies is to maintain a long-term asset allocation weighted 53 per cent to public
market investments and 47 per cent to private market investments. At the end of 2012, private market investments comprised 40.1 per cent of our asset mix
compared with 42.4 per cent at the end of 2011. As illustrated in the table on page 27, the market value of our net investment assets with exposure to
private equity, infrastructure and real estate grew to $24,679 million, an increase of $1,088 million or 4.6 per cent over 2011 whereas the market value
of our assets with exposure to public markets has grown by $4,677 million, an increase of 14.6 per cent. The increase in our exposure to public market
assets has resulted from public markets investment returns, the generation of cash fl ows from the operations of private market investments as well as
the temporary redeployment of proceeds from the sale of certain private market investments to public market assets.
Our investment professionals constantly manage our asset mix exposure, monitoring our long-term targets in each asset class so that the Plan is positioned
for future growth, in accordance with the OAC Board approved allocation of the Plan net investment asset exposure between the public and private
markets. Within these two market classifi cations our investment professionals manage the asset mix allocation to the individual asset classes, which is
reported regularly to the Board. The actual asset mix as at December 31, 2012, compared to the long-term asset mix target is as follows:
Asset Mix - Actual vs. Target As at December 31,
Actual Long-Term Public/Private Market Allocation2012 2011
Public Markets
Interest bearing (i) 22.7% 28.6%
Real return bonds 7.6% 3.9%
Canadian public equities 8.2% 6.8%
Non-Canadian public equities 21.4% 18.3%
59.9% 57.6% 53.0%
Private Markets
Private equity 12.1% 13.9%
Infrastructure 14.8% 15.3%
Real estate 13.2% 13.2%
40.1% 42.4% 47.0%
(i) Includes short-term deposits, bonds and debentures, mortgages and private debt

27 2012 Annual Report OMERS Administration Corporation
Asset Class Allocation
In determining the Plans’ asset mix exposure, the market value of cash and other investment-related assets and liabilities included in net investment
assets per the Consolidated Financial Statements are allocated to the individual asset classes. In addition, derivative exposure and other items, including
transactions and balances between Investment Entities, are allocated to arrive at the Plans’ ultimate exposure by asset class. Net investment assets based
on the holdings per the Consolidated Financial Statements and after all allocations are as follows:
Asset Mix - Exposure(millions)
As at December 31,
2012 2011
Holdings Exposure Asset Mix % Holdings Exposure Asset Mix %
Public Markets
Interest bearing (i) $ 19,725 $ 13,942 22.7% $ 17,988 $ 15,926 28.6%
Real return bonds 4,128 4,649 7.6% 1,743 2,199 3.9%
Total interest bearing 23,853 18,591 30.3% 19,731 18,125 32.5%
Canadian public equities 1,823 5,036 8.2% 2,177 3,787 6.8%
Non-Canadian public equities 11,796 13,161 21.4% 10,246 10,199 18.3%
37,472 36,788 59.9% 32,154 32,111 57.6%
Private Markets
Private equity 7,465 7,459 12.1% 7,753 7,764 13.9%
Infrastructure 11,572 9,091 14.8% 9,635 8,490 15.3%
Real estate 15,846 8,129 13.2% 14,516 7,337 13.2%
34,883 24,679 40.1% 31,904 23,591 42.4%
Investment related assets 853 - - 707 - -
Investment related liabilities (ii) (11,741) - - (9,063) - -
Net investment assets $ 61,467 $ 61,467 100.0% $ 55,702 $ 55,702 100.0%
(i) Includes short-term deposits, bonds and debentures, mortgages and private debt
(ii) Includes OAC debt, amounts payable under the securities lending program, securities sold under repurchase agreements, accounts payable and other liabilities.
Internal Controls Review
OAC maintains systems of internal controls that are designed to ensure the integrity and fairness of the data presented in the Consolidated Financial
Statements and elsewhere in this Annual Report, that transactions are duly authorized and that assets are adequately safeguarded. Consistent with our
commitment to strong corporate governance and accountability, we complete an annual internal review of internal controls over fi nancial reporting and
disclosure controls using a framework derived from the Internal Control – Integrated Framework issued by the Committee of Sponsoring Organizations of
the Treadway Commission (COSO). This review is conducted under the oversight of the Audit Committee on a basis consistent with the requirements for
public companies in Canada while taking into account the unique characteristics of a pension plan. The operating effectiveness of key controls is tested by
OAC Audit Services. OAC management has reported to the Audit Committee that, based on our 2012 review, we found no signifi cant defi ciencies or
material weaknesses with our internal controls over fi nancial reporting and disclosure controls.
OAC Summary
Management’s Discussion and Analysis

28 OMERS Administration Corporation 2012 Annual Report
OMERS Administration Corporation
OMERS Pension PlansOur focus is on the future and the long-term stability of the OMERS Pension Plans.
OMERS Primary Pension Plan
The OMERS Primary Pension Plan is a multi-employer pension
plan whose members consist primarily of employees of Ontario
municipalities, local boards, public utilities and non-teaching workers
at the school boards.
The Plan is a jointly sponsored defi ned benefi t pension plan fi nanced
by equal contributions from participating employers and employees
as well as by investment earnings of the Plan. The Plan has 428,947
members as at December 31, 2012 which is an increase of 2.4 per
cent over 2011. The Plan also has 968 participating employers which
is an increase of 21 employers over 2011.
The Additional Voluntary Contributions (AVCs) component of the Plan,
a voluntary retirement savings arrangement exclusively available to
the members of the Plan, continues to gain momentum. Since its
launch in 2011, AVCs have grown to $170 million by the end of 2012.
Over 7,200 members of the Plan have thus far made voluntary
contributions and many more members are expected to transfer
lump-sum amounts from their registered retirement saving accounts,
registered plans and deferred profi t-sharing plans and to make
ongoing contributions to the AVCs to earn the net investment return
of the Plan.

29 2012 Annual Report OMERS Administration Corporation
The Plan’s defi ned benefi t component pension payments are integrated with the Canada Pension Plan as the benefi t formula includes a “bridge” benefi t if
the member retires before age 65. Including this bridge benefi t, the benefi ts paid under the Plan are calculated by multiplying two per cent of the member’s
annual average earnings for the highest paid 60 consecutive months (pensionable earnings) times years of credited service to a maximum of 35 years. At age
65, the bridge benefi t of 0.675 per cent of the pensionable earnings (or 0.675 per cent of the average of the yearly maximum pensionable earnings in the
year of retirement and the four preceding years, if this amount is less than 0.675 per cent of the pensionable earnings) is subtracted for integration with the
Canada Pension Plan.
The Plan also provides members with:
• full infl ation protection up to 6 per cent per year with any infl ation amount above that carried forward to subsequent years;
• early retirement options;
• disability protection in the event a contributing member becomes disabled and is unable to work;
• survivor benefi ts to protect a member’s family when a member dies; and
• portability to continue to be a Plan member with 968 employers across Ontario.
Retirement Compensation Arrangement
In addition to the Plan for all members, the RCA provides pension benefi ts for members whose pension benefi ts under the Plan are limited by ceilings
imposed by the Income Tax Act. The RCA provides a means to enable retirement savings and contributions on members’ total earnings. As the RCA is
not a registered pension plan, a 50 per cent refundable tax is levied by the Canada Revenue Agency (CRA) on all contributions made to the RCA as
well as on investment income received and realized investment gains. The refundable tax is held by the CRA and earns no investment income for the
RCA. The refundable tax is refunded on the basis of one dollar for every two dollars of realized losses or benefi ts paid out. The RCA is consolidated in
OAC’s fi nancial statements and is accounted for separately from the Plan. OAC invests the RCA assets, excluding the refundable tax and a small cash
balance, in public equities separate from the Plan. Net assets of the RCA were $78 million at December 31, 2012 and $68 million at December 31, 2011.
The RCA fi nancial statements are set out in note 8 to the Consolidated Financial Statements on page 112 of this Annual Report.
OMERS Supplemental Pension Plan for Police, Firefi ghters and Paramedics
The OMERS Supplemental Pension Plan for Police, Firefi ghters and Paramedics (the Supplemental Plan) became effective on July 1, 2008, pursuant to the
requirements of the OMERS Act. The Supplemental Plan is a separately funded stand-alone multi-employer pension plan that provides supplemental
pension benefi ts that “top up” those available under the Plan for members who are employed in the police and fi re sectors which, as defi ned in the
OMERS Act, includes paramedics.
The Supplemental Plan is a contributory defi ned benefi t pension plan funded by equal contributions from participating employers and members and
by the investment earnings of the Supplemental Plan assets. Participation in the Supplemental Plan is effective only upon agreement between employee
groups and their employer. As at December 31, 2012 and 2011, the Supplemental Plan had no assets and no members.
OMERS Pension Plans
Management’s Discussion and Analysis

30 OMERS Administration Corporation 2012 Annual Report
OMERS Administration Corporation
Plan Funding Status
Each year an independent actuary determines the Plan’s funded status by comparing the actuarial value of invested assets to the estimated present value
of all pension benefi ts that members have earned to date. This present value of earned benefi ts is a “target” used to evaluate whether the assets set aside
in the Fund are on track to meet the pension promise in the future, based on a number of estimates and assumptions about the future. On December 31, 2012,
the estimated accrued pension obligation for all members (including survivors) of the defi ned benefi t component of the Plan was $69,122 million, compared
with $64,548 million a year earlier. The increase of $4,574 million was primarily due to interest accrued on the pension benefi t obligation, new benefi ts
accrued during the year and the net impact of actual economic and Plan demographic factors being less favorable than what was assumed for 2012,
partially offset by benefi ts paid in 2012. For the AVC component of the Plan, the accrued pension obligation is equal to the AVC net assets.
The Plan reports a surplus/defi cit position both for accounting purposes and for the actuarial funding of the Plan. For accounting purposes, the surplus/
defi cit position is based on the fair value of net assets compared to the accrued pension obligation. In arriving at the actuarial funding surplus/defi cit, net
investment returns above or below the long-term nominal actuarial rate of return assumption are deferred and amortized over fi ve years to “smooth out”
the peaks and valleys in an individual year’s investment returns caused by market volatility. Smoothing is a common practice accepted by the actuarial
profession and pension regulators to reduce the effect of short-term market fl uctuations on pension plan funding. The annual actuarial smoothing
adjustment is based on the difference between the current year’s actual net return and the long-term return expectation (expected infl ation of 2.25 per
cent plus 4.25 per cent, equivalent to 6.50 per cent in 2012) which is deferred and recognized over fi ve years, adjusted for the recognition of equivalent
amounts from the four preceding years. This approach is in keeping with the long-term nature of the Plan and assists in maintaining stable contribution rates.
The market value of the Plan’s defi ned benefi t component net assets as at December 31, 2012 was $60,519 million compared with the smoothed actuarial
value of $59,198 million. The resulting actuarial smoothing adjustment account represents unrecognized net gains of $1,321 million as at December 31, 2012
which will be recognized in the actuarial value of net assets over the next four years. After application of the required actuarial rate of return, which is
essentially the interest on the unrecognized losses from prior years (as discussed in note 7 of the Consolidated Financial Statements on page 109 of this
Annual Report) and before recognizing any future year’s investment income above or below the long-term actuarial rate of return, the impact of the
unrecognized net losses on the Plan’s surplus/defi cit position by year of recognition will be as follows:
(millions)
For the year ended December 31, Net gains/(losses)
2013 $ 793
2014 $ 438
2015 $ (156)
2016 $ 412

31 2012 Annual Report OMERS Administration Corporation
OMERS Pension Plans
Based on the fair market value of the Plan’s net assets, the defi cit as at December 31, 2012 was $8,603 million compared with a defi cit of $9,627 million at
December 31, 2011, a decrease of $1,024 million. The decrease in the market value of the defi cit is primarily attributable to returns earned by the Plan
being higher than the long-term return expectation of 6.5 per cent.
Based on the smoothed actuarial value of the Plan’s net assets, the funding defi cit was $9,924 million as at December 31, 2012 (2011: $7,290 million).
The funding defi cit caused by the 2008 global fi nancial crisis has peaked in 2012 as all losses from 2008 have now been recognized in actuarial assets.
The Plan defi cit is expected to continue to decline as long as the Plan’s net investment returns exceed the long-term funding requirement of 6.5 per cent.
Defi cit Based on Fair Value vs. Actuarial Value of Net Assets(millions)
As at December 31, 2012 2011
Fair value of net assets of the Plan, excluding AVCs $ 60,519 $ 54,921
Accrued pension benefi t obligation 69,122 64,548
Plan defi cit based on fair value of net assets (8,603) (9,627)
Actuarial value adjustment (1,321) 2,337
Plan defi cit based on actuarial value of net assets $ (9,924) $ (7,290)
Current Year Change in Funding Defi cit
The funded ratio (actuarial value of net assets divided by accrued pension benefi t obligation) at December 31, 2012 is 85.6 per cent compared with
88.7 per cent a year earlier. The ratio of the market value of net assets at December 31, 2012 is 87.6 per cent compared with 85.1 per cent a year earlier, an
increase of approximately 3 per cent primarily due to the Plan earning a net return higher than the required long-term rate of return of 6.5 per cent for
the year.
Funding Outlook
Pension plan funding is made up of two components – the amount required to fund the cost of benefi ts earned by active members in respect of the current
year, which is the normal actuarial cost, and the amount required to eliminate any funding defi cits that have emerged.
The Sponsors Corporation is responsible for Plan design changes and setting the Plan’s contribution rates as well as determining when an actuarial
valuation of the Plan should be fi led, subject to the requirements under regulations. Under Ontario provincial regulations, a pension plan must fi le an
actuarial valuation report at least once every three years and at that time must take measures to eliminate any going-concern and solvency defi cits. The
Plan’s December 31, 2011 actuarial valuation was fi led with the Ontario pension regulator in 2012 and the next required fi ling of the actuarial valuation
report will be December 31, 2014, although the SC has the discretion to fi le earlier.
For current service, employer contributions equal member contributions under the Plan.
Management’s Discussion and Analysis

32 OMERS Administration Corporation 2012 Annual Report
OMERS Administration Corporation
During 2010, the SC approved temporary increases to the contribution rates to fund the actuarial defi cit under the Plan; these increases averaged
1.0 per cent for 2011, 1.0 per cent for 2012 and 0.9 per cent for 2013 for both members and employers. The resulting contribution rates for members
with normal retirement age (NRA) 60 and 65 for 2011, 2012 and 2013 are shown in the table below.
2013 2012 2011
NRA 65
Up to YMPE (i) 9.0% 8.3% 7.4%
Above YMPE (i) 14.6% 12.8% 10.7%
NRA 60
Up to YMPE (i) 9.3% 9.4% 8.9%
Above YMPE (i) 15.9% 13.9% 14.1%
(i) YMPE is the Year’s Maximum Pensionable Earnings as set by the Canada Revenue Agency. For the years above, YMPE was as follows: 2013 – $51,100; 2012 – $50,100; 2011 – $48,300.
Although the Plan’s defi ned benefi t component has a funding defi cit of $9,924 million at the end of 2012 (2011: $7,290 million), net cash infl ow from
contributions less benefi t payments and pension administrative expenses for 2012, and excluding cash income from investments, was $415 million
(2011: $269 million) and is expected to remain strong for the next several years as a result of the temporary contribution rate increases discussed
above. With our expected investment returns combined with post-2012 benefi t changes, we expect the Plan will return to surplus within 10 to 15 years.
Actuarial Assumptions
In calculating the funded position and the ongoing normal actuarial cost to ultimately provide benefi ts for active members, the actuary makes various
demographic and long-term economic assumptions. Demographic assumptions are used to project the future benefi ts payable to members and
benefi ciaries and include assumptions about mortality rates, termination rates and patterns of early retirement. Each of these assumptions is updated
periodically, based on a detailed review of the experience of the Plan and on the expectations for future trends. Economic assumptions about future
investment returns, i.e., the discount rate, assumptions about infl ation and member salary increases affect both the projected benefi ts and the present value
of those future benefi ts. The actuary’s major economic assumptions included in the going-concern funding valuation and normal actuarial cost as at
December 31, 2012, which were approved by the Board, are summarized below.
• Infl ation Rate
The Plan has used an infl ation rate assumption of 2.25 per cent per annum for future years in the calculation of future indexing adjustments, as a
component of the nominal discount rate for estimating liabilities and the anticipated salary increases, consistent with 2011. Any variation in the actual
infl ation rate from this assumption will result in experience gains (lower accrued pension obligation due to lower infl ation than assumed) or losses
(higher accrued pension obligation due to higher infl ation than assumed) to the Plan.

33 2012 Annual Report OMERS Administration Corporation
OMERS Pension Plans
• Discount Rate
The Plan’s annual nominal rate of return and discount rate for future years is assumed to be 6.50 per cent, the same as 2011. This is based on the
2.25 per cent assumed infl ation and a real investment return assumption, based on the Plan’s asset mix of 4.25 per cent, consistent with 2011.
A decrease/increase of 50 basis points in the real discount rate, with no change in other assumptions, would result in an approximate increase/decrease
of $5,200 million in the total accrued pension obligation of the Plan.
The real investment return assumption used in 2012 is unchanged from that used in 2011. It includes a conservative margin to account for potential
adverse investment experience, so that over the long term there is a greater chance of actuarial gains than losses arising from the Plan’s assets. This
assumption includes an estimate of the returns expected to be earned over the long term on the Plan’s assets, based on the current asset mix. In
comparison to some other public sector plans, the Plan has a higher ratio of active members to retired members and our asset mix has a higher
proportion of non-interest bearing investments. This results in a relatively lower interest bearing component in the asset mix and results in a relatively
higher real discount rate.
• Salary Increases
The estimated value of the actuarial liability includes an assumption about future increases in the salaries of active members. The salary increase
assumption uses an age-based scale which allows for increases in productivity as well as merit and promotion-related earnings increases. For members
with normal retirement age of 60, the assumption also includes service-related increases. The assumed average real salary increase (increase in excess
of infl ation) for the December 31, 2012 valuation is as illustrated below and is unchanged from 2011:
NRA 60 NRA 65
Up to 2014 After 2014 Up to 2014 After 2014
Average annual real salary increase 1.4% 1.9% 1.1% 1.6%
Retirement Compensation Arrangement
The RCA is funded using a modifi ed pay-as-you-go approach, where infl ows from contributions, investment income and the reimbursement of the
refundable tax from CRA are used to pay the current benefi ts to members. The excess of current contributions and investment income over current benefi t
payments are accumulated for future years’ benefi t payments. As a consequence of this modifi ed pay-as-you-go funding policy, the RCA’s assets will
remain small relative to its liability. A relatively small increase in the number of terminations and retirements at higher income levels can increase actual
benefi t payments from, and decrease actual contributions to, the RCA; however, our actuary estimates that if contributions to the RCA continue as
projected, the annual cash infl ow will be suffi cient to cover benefi t payments and the RCA’s assets will continue to grow for the near term. Effective
January 1, 2012, the funding of the RCA is managed and monitored to ensure that the current RCA net assets, together with future contributions and
earnings, will be suffi cient to provide for the projected benefi t payments over the 20-year period following each valuation date. The RCA accrued benefi t
obligation is also sensitive to changes in assumptions and experience gains and losses.
Management’s Discussion and Analysis

34 OMERS Administration Corporation 2012 Annual Report
OMERS Administration Corporation
Current Year Change in RCA Defi cit
The accrued pension obligation for the RCA increased from $504 million in 2011 to $555 million at the end of 2012. The change was due to new benefi ts
earned in the year, interest on the accrued pension obligation, experience gains/losses, partially offset by the monthly benefi t and lump sum payments
made in the year. The RCA had an estimated funding defi cit of $477 million at December 31, 2012 compared with a defi cit of $436 million last year as
shown below.
Change in RCA Defi cit(millions)
For the year ended December 31, 2012 2011
Defi cit, beginning of year $ (436) $ (409)
Increase in net assets 10 9
Increase in accrued pension benefi t obligation (51) (36)
Defi cit, end of year $ (477) $ (436)
Pension Benefi ts and Contributions
In 2012, the Plan ended the year with over 124,000 retired members and survivors receiving pension benefi ts. Benefi ts paid from the Plan defi ned benefi t
component in 2012 were $2,654 million, an increase of $279 million over 2011. The increase refl ected new retirements, the adjustment of benefi ts for
infl ation and higher pension values for new retirees compared with those already receiving benefi ts, as well as an increase in death benefi ts and commuted
value payments. Benefi ts paid from the AVC component were $4 million (2011: $1 million) and benefi ts paid from the RCA in 2012 were $12 million, an
increase of $5 million from 2011.
Contributions to the Plan’s defi ned benefi t component in 2012 were $3,124 million compared with $2,702 million in 2011. The increase is attributable to an
average increase in contribution rates of 1 per cent in 2012, an increase in active members of 1.3 per cent and increased members’ salaries. Contributions
to the Plan’s AVC component were $67 million in 2012, compared to $93 million in 2011. Contributions to the RCA in 2012 were $19 million, an increase of
$1 million over 2011.
The chart below compares the growth in the number of pensioners versus active members over the past 10 years. The ratio of active members to pensioners
was 2.15 at December 31, 2012, compared with 2.22 at December 31, 2011.
Growth in Number of Pensioners and Active Members
0,000
50,000
100,000
150,000
200,000
250,000
300,000
2003 2004 2005 2006 2007 2008 2009 2010 2011 20120.0
0.6
1.2
1.8
2.4
3.0
Rat
io o
f Act
ive
to r
etire
d m
embe
rs
Num
ber
of M
embe
rs/P
ensi
oner
s
• Number of Pensioners
• Number of Active Members
• Ratio of Active Members to Pensioners

35 2012 Annual Report OMERS Administration Corporation
OMERS Pension Plans
OMERS Pension Services
Mandate – Provide Excellent Service to Members and Employers
OMERS Pension Services is the primary communications link with our members and employers. Through our focus on customer satisfaction, we ensure
rapid response times and excellent service that we continually strive to enhance and improve.
A fl exible, expert team gives us the capacity to develop new pension services and features, to drive broader membership growth opportunities and to be
on the forefront of pension reform.
Our growth and service initiatives support OMERS strategic objective to raise domestic capital. Ultimately this benefi ts all Plan members, employers and
retirees. A larger discretionary capital base enables OMERS to enter into large-scale investments that can generate stable long-term returns while keeping
our portfolio properly diversifi ed. Such investments in turn will help us to meet the growing demands of changing demographics, an aging membership and
the resulting pressure on liabilities.
Three strategies are at the core of our mandate as a professional service organization:
• enhancing internal capabilities;
• responding to external drivers; and
• supporting effective plan governance.
Enhancing Internal Capabilities
To meet the needs of our membership, we continue to build our internal capabilities – by enhancing our internal structure, systems and processes and by
fostering a culture of leadership and collaboration.
In 2012, we continued the work we started in 2011 to redevelop our pension services systems. This multi-year development project, which is expected to
be completed by the end of 2014, is one of the key components in our ability to meet the changing pension business landscape, manage increasing Plan
complexity and migrate successfully to a client-centric service model. The new system will also provide a future platform to take advantage of growth
opportunities when they arise, for example, expanding our client base through the consolidation of other plans.
OMERS Pension Services continued to make improvements to its organizational structure. The corporate communications and government and stakeholder
relations functions were integrated into Pension Services to align and integrate efforts. This move supported the changing nature of a communications
model from informing to engaging and was designed to meet the needs of an increasingly diverse, involved, informed and focused audience.
Both our people and our systems will be positioned to support OMERS strategic initiatives, to address defi cit funding management programs and to
infl uence, and adapt to, pension reform over the next several years.
We are building the tools to meet our changing and challenging business needs. In addition to the systems development noted above, we will continue to
foster the leadership skills of our management team through core skills development and clear lines of accountability.
Management’s Discussion and Analysis

36 OMERS Administration Corporation 2012 Annual Report
OMERS Administration Corporation
Responding to External Drivers
Changing demographics, pension reform in Canada and Ontario, and the public debate on retirement security are just a few of the factors that affect our
business and infl uence the pension environment in which we operate. By responding quickly and strategically to external drivers, we can be instrumental
in infl uencing the pension landscape in Ontario to better meet the needs of our members.
Our membership is diverse and its growing and changing needs infl uence and drive our business:
• We now serve 968 employers and a total of 428,947 members – a 2.4 per cent increase over 2011 (see chart A on page 38);
• As shown on chart C on page 38 our members belong to a wide variety of unions and associations;
• The number of active members 45 years of age and older has increased from 48 per cent of total active members in 2003 to 58 per cent in 2012. This shift
in demographics (as illustrated in chart B on page 38) increases the demand for retirement planning services provided by OMERS. Members nearing
retirement become more interested in pension estimates and pre-retirement planning information sessions. In 2012, we received requests for over 89,500
retirement and termination estimates, representing a 10 per cent increase over last year, and we delivered over 400 member information sessions; and
• The number of individuals receiving an OMERS pension continues to grow with over 7,700 new pensioners in 2012, compared to over 5,600 just fi ve
years earlier in 2007. Pensioners now represent 29 per cent of our total membership.
Our performance in 2012 against a demanding and growing number of transactions confi rms our commitment to meeting the challenge of continuing
to provide great service, while keeping the pension promise. In 2012:
• We met or exceeded our targets for our key service standards by processing all key business activities within an average of three business days;
• We answered 94 per cent of incoming calls to Client Services within 100 seconds exceeding the target of 80 per cent in a year that saw OMERS Client
Services handle 189,900 incoming and outgoing calls;
• OMERS collected a total of $3,143 million in contributions from members and employers, and we paid retirement and disability pension payments totaling
$2,256 million to our retirees and survivors, compared with $2,047 million in 2011. In addition, where individuals transferred to other registered pension
plans, received death benefi ts or chose to leave the Plan and forego their guaranteed monthly pension benefi t, payments of $410 million were made in
2012 (2011: $335 million);
• The average annual pension for a newly retired member in 2012 was approximately $27,600 compared to approximately $24,700 in 2008, an increase of
about 12 per cent over the past 5 years (see chart D on page 39). The average annual amount of pension for all retired members and survivors in 2012
was approximately $18,600 (2011: $17,700);
• We managed over 19,900 retirement, termination, disability, and pre-retirement death benefi ts claims, an increase of more than 10 per cent over 2011,
approximately 82 per cent of which were initiated through the employer e-access channel or myOMERS; and
• We continued our practice of meeting and communicating with employers and members through a total of 2,100 onsite visits to provide technical support.
Not only do we serve many individual members on a timely basis, but the results of our 2012 independent survey of our members showed an average
satisfaction rate of 89 per cent for the overall level of service (see chart E on page 39). This is up slightly from 2011 and the ninth straight year that our
satisfaction rate exceeded 85 per cent.
Communication is a critical element of our service. We are moving from a passive “inform” model to a more active “engagement” model to better achieve
OMERS objectives and to meet the evolving needs of our stakeholders. Directly linked to this initiative is a program to collect member contact information
to support our evolution to a wider range of electronic communications.

37 2012 Annual Report OMERS Administration Corporation
Our website and the secure member and employer sites, myOMERS and e-access, continue to be popular:
• OMERS had approximately 811,000 website visits in 2012;
• At year-end 2012, 76,000 members had registered for myOMERS. myOMERS gives members secure access to their pension information, the option to
receive e-statements, as well as the ability to complete their own pension estimates using the myOMERS Retirement Income Estimator tool and to sign up
for Additional Voluntary Contributions (AVCs); and
• Employer e-access enables employers to complete the annual reconciliation and reporting process effi ciently, resulting in 99 per cent of all 2011 annual
pension statements being issued to members by June 30, 2012.
OMERS Pension Services continues to develop and support new services and voluntary options for Plan members such as AVCs and “buy-backs” for
members with employment service not originally covered in the OMERS Plan.
• AVCs enable members to invest their personal registered retirement savings in the OMERS Fund. Funds in an AVC account earn the net investment
returns generated by OMERS diverse global portfolio and are in addition to the defi ned benefi t pension provided by the OMERS Plan. By the end of 2012,
over 7,200 OMERS members contributed to an AVC account resulting in a total accumulation of funds (including investment earnings) of $170 million; and
• In 2012, we processed 4,300 transactions for members buying back employment service (buy-backs), more than double the number processed in 2011.
We also continue to offer our knowledge and expertise to support government policy discussions related to improved retirement solutions for Canadians.
With the heightened public interest in pensions today, our focus has evolved from simply administering the OMERS Pension Plans to responding to and
infl uencing pension reform. Public sector defi ned benefi t pension plans are increasingly coming under scrutiny and at times criticism by various interest
groups, the news media, government representatives and segments of the public. We have taken a more active public position in the defense of the
defi ned benefi t pension plan model and the signifi cant, long-term positive impact such plans have not only for the Plan members but for the economy and
society as a whole.
Supporting Effective Plan Governance
An effectively governed pension plan helps to ensure that we will grow, innovate and deliver on our pension promise to members. In 2012, Pension Services
supported the Member Services Committee in its fi rst year of operation, working on activities such as Plan funding, growth initiatives and oversight of the
project to redevelop our pension services systems.
In 2012, Pension Services continued to provide OMERS Sponsors Corporation (SC) with information and analysis and to implement SC decisions in the
following areas:
• the increase in contribution rates for members and employers effective the fi rst full pay in 2013;
• a new method for allocating contribution rates;
• changes to the AVC program to provide more fl exible contribution options; and
• the introduction of a new cap on contributory earnings used in the determination of pension benefi ts.
Going forward, we will maintain our focus on OMERS core objective – providing pensions to current and retired employees of more than 900 municipalities,
school boards, libraries, police and fi re departments and other agencies across Ontario.
OMERS Pension Plans
Management’s Discussion and Analysis

38 OMERS Administration Corporation 2012 Annual Report
OMERS Administration Corporation
0
10,000
20,000
30,000
40,000
50,000
60,000
20-24 25-29 30-34 35-39 40-44 45-49 50-54 55-59 60-64 65+
• 2012
2003
Chart B
Active Members by AgeAs at December 31, 2012
Chart A
Member Profi leAs at December 31, 2012
Chart C
Active Member Affi liationAs at December 31, 2012
•• 62% Active 266,414
•• 29% Retired/Survivor 124,031
•• 9% Deferred 38,502
Total 428,947
•• 45% Canadian Union of Public
Employees
•• 21% Management/non-union
•• 10% Police Associations
•• 4% Ontario Professional
Fire Fighter Association
•• 4% Ontario Secondary School
Teachers’ Federation
•• 4% Ontario Public Service
Employees Union
•• 12% Other

39 2012 Annual Report OMERS Administration Corporation
OMERS Pension Plans
Management’s Discussion and Analysis
2008 2009 2010 2011 2012$15,000
$20,000
$25,000
$30,000
$24,700
$26,900
$26,900
$27,700
$27,600
Clients with Recent Transaction
Client ServicesContact
Employers0%
25%
50%
75%
100%
90%88% 88%
Chart D
Average Annual Pension for New Retired Members 2008 - 2012As at December 31,
Chart E
Satisfaction Surveys*For the year ended December 31, 2012
* Percentage of respondents who rated OMERS
4 out of 5 or 5 out of 5 for service excellence
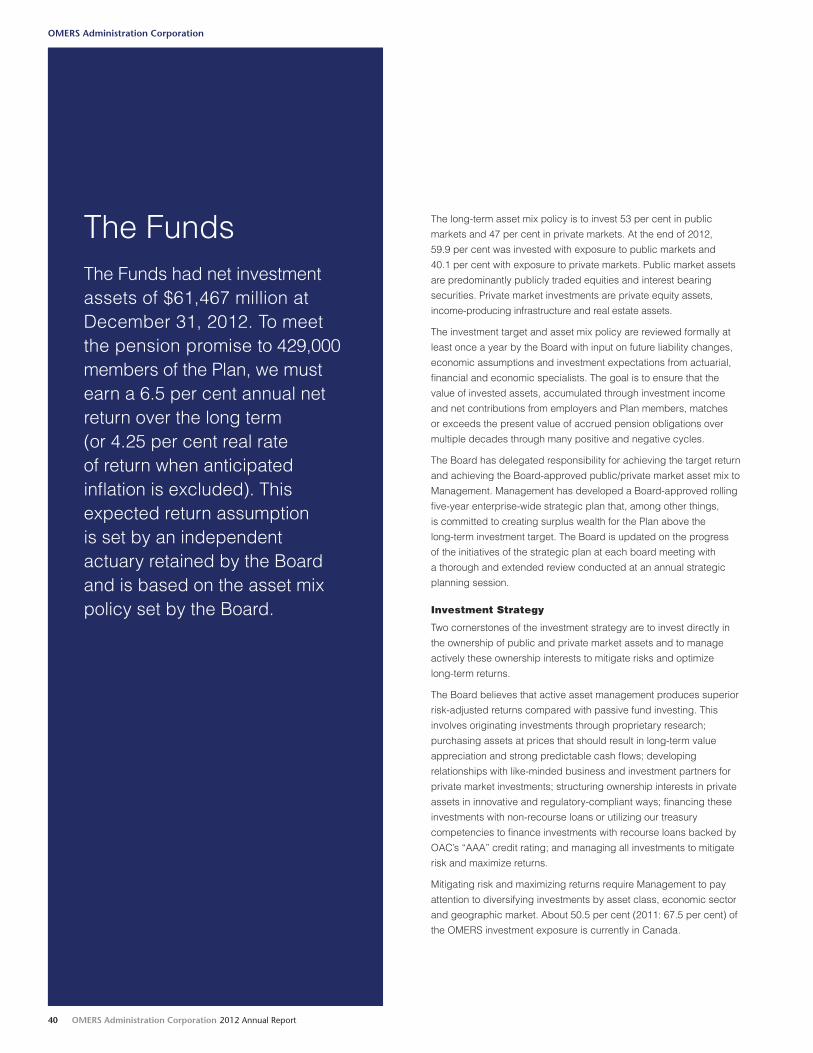
40 OMERS Administration Corporation 2012 Annual Report
OMERS Administration Corporation
The FundsThe Funds had net investment assets of $61,467 million at December 31, 2012. To meet the pension promise to 429,000 members of the Plan, we must earn a 6.5 per cent annual netreturn over the long term (or 4.25 per cent real rate of return when anticipated infl ation is excluded). This expected return assumption is set by an independent actuary retained by the Board and is based on the asset mix policy set by the Board.
The long-term asset mix policy is to invest 53 per cent in public
markets and 47 per cent in private markets. At the end of 2012,
59.9 per cent was invested with exposure to public markets and
40.1 per cent with exposure to private markets. Public market assets
are predominantly publicly traded equities and interest bearing
securities. Private market investments are private equity assets,
income-producing infrastructure and real estate assets.
The investment target and asset mix policy are reviewed formally at
least once a year by the Board with input on future liability changes,
economic assumptions and investment expectations from actuarial,
fi nancial and economic specialists. The goal is to ensure that the
value of invested assets, accumulated through investment income
and net contributions from employers and Plan members, matches
or exceeds the present value of accrued pension obligations over
multiple decades through many positive and negative cycles.
The Board has delegated responsibility for achieving the target return
and achieving the Board-approved public/private market asset mix to
Management. Management has developed a Board-approved rolling
fi ve-year enterprise-wide strategic plan that, among other things,
is committed to creating surplus wealth for the Plan above the
long-term investment target. The Board is updated on the progress
of the initiatives of the strategic plan at each board meeting with
a thorough and extended review conducted at an annual strategic
planning session.
Investment Strategy
Two cornerstones of the investment strategy are to invest directly in
the ownership of public and private market assets and to manage
actively these ownership interests to mitigate risks and optimize
long-term returns.
The Board believes that active asset management produces superior
risk-adjusted returns compared with passive fund investing. This
involves originating investments through proprietary research;
purchasing assets at prices that should result in long-term value
appreciation and strong predictable cash fl ows; developing
relationships with like-minded business and investment partners for
private market investments; structuring ownership interests in private
assets in innovative and regulatory-compliant ways; fi nancing these
investments with non-recourse loans or utilizing our treasury
competencies to fi nance investments with recourse loans backed by
OAC’s “AAA” credit rating; and managing all investments to mitigate
risk and maximize returns.
Mitigating risk and maximizing returns require Management to pay
attention to diversifying investments by asset class, economic sector
and geographic market. About 50.5 per cent (2011: 67.5 per cent) of
the OMERS investment exposure is currently in Canada.

41 2012 Annual Report OMERS Administration Corporation
The Funds
Management’s Discussion and Analysis
Total Fund Country Exposure
0%
20%
40%
60%
80%
Canada US Europe Rest of the World
50.5%
67.5%
27.4%
16.9% 14.8%10.8%
7.3%4.8%
As depicted in the chart above, the Plan’s exposure to the U.S. and other countries has signifi cantly increased.
The value of listed market capital in Canada represents less than three per cent of global market capitalization. While Canada continues to offer exceptional
long-term investment opportunities, prudence and related risk management practices make it necessary to diversify investments to global economies with
different growth profi les. This is readily accomplished in the case of public market investments due to their liquidity and ease of trading in organized
markets. In the past three years, we have increased our internal capabilities in global equity research and direct, active and worldwide trading.
The challenge of diversifi cation is different and potentially more complex in the case of private investments. Relationships with investors, business owners
and governments are critical to understanding markets and fi nding suitable investments. Typically, investments in private markets require a large single
infusion of capital, are not easily traded and must be held for several years. Research confi rms that size matters in earning superior risk-adjusted returns
due to economies of scale, securing the necessary concentration of expertise at the operating level and achieving governance effi ciencies.
Large-scale private market investments require as much as $500 million for private equity and $3 billion to $10 billion for commercial real estate portfolios
and infrastructure assets. The Fund does not generally make investments of this size on its own for risk management reasons. Consequently, a strategic
objective is to augment the Fund’s capital with third-party capital. OAC has built an expert team which now has a multi-decade history of leading or
co-leading investor consortia. Our teams in each of the private market entities also possess the negotiating skills to complete due diligence and acquire
infl uential equity positions in assets and companies on behalf of the Fund and its investment partners.
The OMERS Investment Organization
OAC today has a deep investment management organization comprised of professional teams dedicated to managing defi ned asset classes and
subclasses led by OMERS Chief Investment Offi cer (CIO). The CIO is responsible for the investment strategy and operational leadership of OMERS
Investment Entities. OMERS Capital Markets manages all public market investments and Oxford Properties Group, OMERS Private Equity and Borealis
Infrastructure manage private market investments. These organizations are discussed in greater detail on pages 42 - 59 of this Annual Report.
In addition, three corporate investment-related entities support the activities of the Investment Entities – OMERS Strategic Investments, OMERS Investment
Management Inc. and OMERS Finance Trust.
OMERS Strategic Investments
OMERS Strategic Investments, founded in 2008, leads certain corporate strategic initiatives and builds strategic investment platforms to position OMERS
as a leading global pension-based investment enterprise. Its mandate is discussed on page 60 of this Annual Report.
OMERS Investment Management
OMERS Investment Management was established in 2009 following legislative authority granted to the OAC to provide investment management services
and products through an authorized subsidiary. Eligible clients include Canadian public and private sector pension plans, governments and their agencies,
colleges, universities and their endowments, and Canadian registered charities. OMERS Investment Management offers investment arrangements that
provide eligible clients with access to all or parts of the annual investment return of the OMERS Primary Plan.
OMERS Finance Trust
OMERS Finance Trust was established in 2010 to issue debt in the capital markets under the OMERS brand and to provide an alternative source of funding
to other Investment Entities within the OMERS group. In doing so, it follows prudent leverage practices and carries the OMERS brand when it raises debt in
the capital markets. Debt securities currently issued by OMERS Finance Trust have an OMERS guarantee and are rated “AAA” by two credit rating agencies.
• 2012
• 2011

42 OMERS Administration Corporation 2012 Annual Report
OMERS Administration Corporation
OMERS Capital MarketsOMERS Capital Markets (OCM) manages OMERS public markets investment portfolio of bonds and other interest-bearing assets, publicly traded equities in Canadian and global fi nancial markets as well as currency positions.

43 2012 Annual Report OMERS Administration Corporation
Returns and BenchmarksFor the year ended December 31,
-5%
0%
5%
10%
15%
2012 2011 2010
7.50%8.74%
-0.22%
1.26%
11.04%10.11%
Performance of public market assets
A summary of public market performance returns for 2012 is discussed below:
Returns and Benchmarks2012 2011
For the year ended December 31, Rate of Return Benchmark Rate of Return Benchmark
Interest bearing investments 3.51% 3.47% 9.13% 9.22%
Real Return Bonds (i) N/A N/A 17.84% 18.35%
Canadian public equities 8.26% 7.76% -11.29% -8.71%
Non-Canadian public equities 11.62% 15.71% -4.96% -4.23%
Multi-Strategy Program 12.51% N/A N/A N/A
(i) During 2012, the real return bonds holdings were transferred into the multi-strategy program.
OMERS public market investments portfolio generated a net investment gain of $2,253 million in 2012 compared with a net investment loss of $296 million
a year earlier. The 2012 return of 7.50 per cent exceeded the 2011 return of negative 0.22 per cent as equity markets rebounded. The return is below the
benchmark return of 8.74 per cent due to the relative under performance in Non-Canadian public equities and changes to portfolio asset allocations related
to new investment strategies that began in the middle of the year. This was partly offset by better than benchmark performance in interest bearing
investments and Canadian equities and strong returns generated by the multi-strategy program.
Interest bearing investments generated a return of 3.51 per cent in 2012, which outperformed the benchmark return of 3.47 per cent. In the same period,
Canadian public equities generated a return of 8.26 per cent, which outperformed the benchmark return of 7.76 per cent. The rise in the Canadian equity
market was driven primarily by the fi nancial sector, which was partially offset by negative returns in the resource sectors.
Non-Canadian public equities generated a return of 11.62 per cent, which underperformed the benchmark return of 15.71 per cent primarily due to regional
allocation decisions. During 2012, economic weakening in global markets led OCM to underweight its exposure in the U.S., the U.K. and developed Pacifi c
regions as part of our defensive strategy.
OMERS Capital Markets
Management’s Discussion and Analysis
• Rate of Return
• Benchmark
7.50%The overall OMERS Capital Markets investments return in 2012 was 7.50%. The return is below the benchmark of 8.74%.

44 OMERS Administration Corporation 2012 Annual Report
OMERS Administration Corporation
OCM allocated assets to a multi-strategy program in 2012. The program invests in multiple asset classes, including interest bearing investments, real return
bonds and equities (Canadian and Non-Canadian). These exposures are obtained by employing various investment strategies, including direct holdings,
investment funds, long-short investment strategies and derivative instruments. The program’s investment objective is to earn absolute returns, meaning
the program is not managed against a benchmark. In 2012, the multi-strategy program generated a return of 12.51 per cent. The performance of the
multi-strategy program is tracked separately from the performance generated by interest bearing investments, Canadian public equities and Non-Canadian
public equities held outside of the program. During 2012, real return bonds were allocated to the multi-strategy program and their performance was not
tracked separately.
Public markets asset holdings and exposure
At December 31, 2012, OCM’s net investment assets were $35,024 million compared with $30,357 million at the end of 2011. This increase in public market
assets was due to (i) an increase in public market asset valuations, (ii) funds from the ongoing operations of private market investments and proceeds from
the sale of existing private market investments exceeding new investments, and (iii) the net infl ow from pension contributions exceeding benefi t payments.
Interest Bearing Investments
Interest bearing investment holdings include federal and provincial government bonds, corporate bonds, mortgages, private debt, and cash and
short-term cash equivalent securities. The total value of interest bearing investments, including those of other OAC Investment Entities, had a fair value
of $23,853 million at December 31, 2012 (2011: $19,731 million), of which $19,725 million was comprised of cash and short-term deposits, nominal bonds,
mortgages and private debt (2011: $17,988 million) and $4,128 million in real return bonds (2011: $1,743 million). These assets include $933 million
(2011: $845 million) of collateral received from securities lending activities and $842 million of assets sold under repurchase agreements. In 2012,
OAC entered into repurchase agreements whereby assets were sold in exchange for access to short-term liquidity to fund private market investments,
as well as to increase the effi ciency of short-term cash management. Certain interest bearing investments were used to obtain synthetic exposure to other
public market asset classes through the use of derivatives. At December 31, 2012, our exposure to interest bearing investments (including real return
bonds) totaled $18,591 million compared with $18,125 million at December 31, 2011.

45 2012 Annual Report OMERS Administration Corporation
OMERS Capital Markets
Public Equities
At December 31, 2012, our total exposure to public equities by geography is illustrated in the following graph:
Public Equities Exposure by Geography
0%
10%
20%
30%
40%
50%
United States Canada Europe Emerging Markets
40%42%
27%28%
17% 16%
8%5%
8% 9%
At December 31, 2012, our top 10 public equity holdings included:
• Apple Computer Inc
• Microsoft Corp
• Google Inc. Class A
• Royal Bank of Canada
• ENI SPA
• Danone
• Talisman Energy Inc.
• Santos Ltd.
• Astrazeneca Plc
• Wells Fargo Company
Canadian Public Equities
While our holdings in Canadian public equities declined from $2,177 million in 2011 to $1,823 million in 2012, our exposure to Canadian public equities
increased to $5,036 million at December 31, 2012 (2011: $3,787 million) through the use of derivatives which are a cost-effective means of investing in
volatile public markets.
Non-Canadian Public Equities
At December 31, 2012, our non-Canadian public equity holdings totaled $11,796 million (2011: $10,246 million), with exposure increasing to $13,161 million
(2011: $10,199 million) through the use of derivatives which are a cost-effective means of investing in volatile public markets.
As discussed on page 18 of this Annual Report, our long-term investment strategy is to increase direct active management of our investments. Active
management of our non-Canadian public equity portfolio has been a focus of our strategy in the past few years while at the same time we continue to
leverage the expertise offered by external managers in global markets. Over the past four years OMERS Capital Markets has been building its team of
investment professionals and its investment information systems to increase its capability to internally manage a larger portion of our non-Canadian
equities. This gives us greater control over our non-Canadian investments and is expected to substantially reduce the costs of managing these investments.
While we are continuing with this strategy, in 2012 tactical decisions were made to place funds with certain external managers as part of our strategy to miti-
gate volatility in non-Canadian equities. Since the program started four years ago, we have repatriated a net amount of $5.7 billion from external managers.
Management’s Discussion and Analysis
• 2012
• 2011

46 OMERS Administration Corporation 2012 Annual Report
OMERS Administration Corporation
Derivative Financial Instruments
In order to manage risk and enhance returns, we enter into a variety of widely used industry standard derivative contracts. These contracts are used in
combination with other investment assets. The objective of their use is to provide a cost-effi cient means to improve returns by mitigating uncompensated
risks and to add fl exibility in asset mix management. Notional values of various categories of derivatives held include:
(millions)
As at December 31, 2012 2011
Interest rate contracts $ 8,136 $ 3,382
Equity contracts 6,814 7,302
Commodity contracts 1,044 286
Foreign exchange contracts 24,285 19,038
$ 40,279 $ 30,008
Interest Rate Derivatives
We use interest rate derivatives to enhance investment yields and to manage the duration of our interest bearing investments and our fi xed versus
fl oating interest rate exposure. Types of interest rate derivative contracts used include interest rate swaps, bond index swap contracts, bond futures
contracts and bond options. At the end of 2012, interest rate derivatives with a notional value of $8,136 million were outstanding compared to a
notional value of $3,382 million at December 31, 2011. The increased exposure to interest rate derivatives was primarily driven by investments made
within the multi-strategy program.
Equity Derivatives
We use equity derivative contracts to replicate Canadian and non-Canadian equity index returns. This exposure to the indices of major equity markets
is achieved primarily through the use of equity index futures and equity index swap contracts and complements the Canadian equities portfolio and
global equity portfolios managed both internally and externally. At December 31, 2012, we had public equity derivative exposure of $6,814 million
(2011: $7,302 million), representing the notional value of derivatives as follows:
• $2,965 million in derivatives that provide exposure to the S&P/TSX Composite and the S&P/TSX 60 index; and
• $3,849 million in derivatives that provide exposure to major equity indices throughout the world.
Commodity Derivatives
We use commodity derivatives to enhance investment yields through exposure to commodities which we believe will increase/decrease in value based on
our economic analysis. Largely as a result of investments made within our multi-strategy program, the notional value of commodity derivatives increased to
$1,044 million at December 31, 2012 from $286 million at December 31, 2011.

47 2012 Annual Report OMERS Administration Corporation
OMERS Capital Markets
Foreign Exchange Derivatives
We use foreign exchange forward contracts to manage our exposure to currencies other than the Canadian dollar and to generate returns through active
trading. At December 31, 2012, $18,389 million (2011: $18,702 million) or 30 per cent (2011: 34 per cent) of our net investment assets were exposed to
foreign exchange risk before hedging. We generally hedge a portion of our exposure to public market investments denominated in 12 major currencies,
reducing their volatility relative to the Canadian dollar; however, the hedge percentage can vary depending on the outlook for the strength of individual
currencies. In addition, for non-Canadian private market investments foreign currency exposure we hedge up to 100 per cent.
Since it was implemented in 2001, our currency hedging program and other currency activities have produced a net gain of $1,976 million offsetting the
currency losses experienced on our foreign currency assets. This is largely a result of the appreciation of the Canadian dollar against most major currencies
over this period.
Our net foreign currency exposure after accounting for our foreign currency management and trading programs at December 31, 2012 was $7,235 million
(2011: $7,985 million). Our gross and net foreign currency exposure is allocated as shown in the chart below:
Gross and Net Foreign Currency ExposureAs at December 31, 2012
(millions Cdn Dollar Equivalent)
0
2,000
4,000
6,000
8,000
10,000
12,000
United States Euro Countries United Kingdom Japan Emerging Markets Other Europe
Credit Risk
The credit risk exposure for derivatives is the unpaid amount receivable from counterparties. We follow prudent risk management policies, limiting our
derivative credit risk exposure to less than fi ve per cent of total fund net investment assets. We require that all counterparties have a minimum “A” credit
rating. At December 31, 2012, the credit risk exposure from derivative contracts was 0.3 per cent of net investment assets or $213 million.
Management’s Discussion and Analysis
• Gross Foreign Currency Exposure
• Net Foreign Currency Exposure

48 OMERS Administration Corporation 2012 Annual Report
OMERS Administration Corporation
OMERS Private EquityOMERS Private Equity (OPE) manages private equity investments through direct investments in private companies and through third-party funds.
OMERS Private Equity’s investment strategy focuses on acquiring the
majority control of a company with an enterprise value between
$200 million to $1.5 billion. We will consider other ownership
structures, including joint control and/or having signifi cant infl uence
with trusted, like-minded partners as long as we have the governance
rights commensurate with our investment. Our investment approach
is premised on a long-term, active partnership with talented
management teams. Our investment mandate is fl exible to capitalize
on the prevailing market conditions and fi nancial markets and to
invest in a broad range of industries in various geographical markets.
We fi rmly believe in direct fi nancial alignment of interest amongst
ourselves, the management team of our investments and our
investment partners. Our strategic shift towards direct investing that
began in 2008 is on track and we continue to explore opportunities to
reduce our exposure to fund investments.

49 2012 Annual Report OMERS Administration Corporation
Returns and BenchmarksFor the year ended December 31,
-10%
0%
10%
20%
30%
2012 2011 2010
19.17%22.09% 22.21%
28.05%
7.23%
-5.58%
The chart below illustrates the consistent progress made by OMERS Private Equity’s shift towards a directly held and actively managed portfolio over
the last three years.
Direct vs. Fund InvestmentsAs at December 31,
0%
20%
40%
60%
80%
2012 2011 2010
66%
34%
57%
43% 43%
57%
Our geographical focus is currently Canada, the United States and Europe, with a particular emphasis on the United Kingdom. Our direct investing can
take a variety of forms, including private market transactions, secondary transactions from private equity funds and corporate carve-outs. The objective
remains to have a well diversifi ed investment portfolio, both by industry and by geography.
OMERS Private Equity
Management’s Discussion and Analysis
• Rate of Return
• Benchmark
19.17%OMERS Private Equity return in 2012 was 19.17% compared to the one-year benchmark of 22.09%.
Total Assets by SectorAs at December 31, 2012
Total Assets by GeographyAs at December 31, 2012
• 32% Industrials
• 20% Consumer Discretionary
• 18% Health Care
• 12% Information Technology
• 8% Financials
• 5% Consumer Staples
• 5% Other
• 40% United States
• 35% Canada
• 18% United Kingdom
• 3% Europe (ex. U.K.)
• 4% Other
• Directs
• Funds

50 OMERS Administration Corporation 2012 Annual Report
OMERS Administration Corporation
In evaluating investment opportunities, the key criteria that we consider are – the current market position and the market outlook for the company’s products
and services; the quality and depth of the company’s management team and their willingness to invest along with us; an assessment of the company’s
strategy for growth; and our expected return based on the purchase price to acquire the business. After acquisition of an investment, our role is to work
closely with the management team and bring the necessary resources to bear so that the business can achieve sustainable, profi table growth.
OMERS Private Equity generated net investment income of $962 million in 2012, more than double the net income of $354 million earned in 2011. This
translates to an exceptional return of 19.17 per cent compared with the return of 7.23 per cent in 2011. The return refl ects the benefi t of OMERS Private
Equity’s shift in investment strategy to focus on direct investments where the returns have signifi cantly exceeded those of private equity fund investments.
Current year’s strong performance is attributable to the solid growth in revenue and income across our portfolio of companies. Our benchmark is an
aggregate weighted average of Global Russell indices adjusted for geographic and sector exposure plus a 350 basis point illiquidity and leverage
premium. The benchmark is much higher than global public market indices because of the illiquidity premium and investment focus in the strong
performing sectors and provides a better performance comparison on a longer term basis. While our current year return of 19.17 per cent is below the
benchmark of 22.09 per cent, our average annualized return on a 2 and 3 year basis exceeds the benchmark as follows:
Average Annualized Rate of Return vs. BenchmarksFor the period ended December 31, 2012
0%
4%
8%
12%
16%
20%
2 Year 3 Year
13.04%
16.02%
13.86%
7.37%
During 2012, OMERS Private Equity’s net investment assets decreased marginally from $6,333 million in 2011 to $5,993 million in 2012. This decline refl ects
a record $1,701 million in capital returned from private equity investments through the sale of (i) our investment in Cari-All, (ii) a number of private equity
funds and (iii) over half of our investment in Constellation Software partially offset by new and follow-on investments, capital calls from private equity fund
investments and a net increase in asset valuations.
New and follow-on investments in 2012 include:
• a direct investment in Lifeways, a leading provider of supported living services for adults with learning disabilities in the U.K. market; and
• the acquisition of Golfsmith International, a U.S.-based specialty golf retailer. Golfsmith has been combined with Golf Town, our Canadian market leading
golf retailer, creating the largest golf specialty retail business in the world.
Although the private equity market is expected to remain sound in 2013, the economies of Canada, the U.S. and the U.K. are expected to experience
limited growth. We will work closely with the management of our direct investments in achieving their strategic and fi nancial goals and expect to further
expand our portfolio with new investments.
• Average Annualized Rate of Return
• Benchmark

51 2012 Annual Report OMERS Administration Corporation
OMERS Private Equity
OMERS Private Equity’s signifi cant direct investments include:
• Accelerated Rehabilitation Centers – a leading provider of traditional and specialty outpatient physical rehabilitation services in the U.S. Midwest;
• Affi nia Group Inc. – a leading manufacturer and distributor of aftermarket components for cars, trucks and off-highway vehicles. Affi nia’s
broad range of brake, fi ltration and chassis products are sold in North and South America, Europe and Asia;
• CBI Health Group – a leading provider of outpatient rehabilitation and community health care services in Canada;
• Cengage Learning – delivers highly customized learning solutions for colleges, universities, instructors, students, libraries,
government agencies, corporations and professionals around the world;
• Constellation Software Inc. – an international provider of market leading software and services to the public and private sectors.
Constellation acquires, manages and builds vertical market software businesses that provide custom mission-critical software;
• Give and Go Prepared Foods Corp. – a Toronto-based wholesale bakery producing Two-Bite Brownies™, Cinnamon Crunchies™,
butter tarts and Bite Coffee™Cakes. Give and Go products are sold throughout Canada and in the U.S;
• Golfsmith International – the world’s largest golf specialty retailer of golf merchandise from leading manufacturers together with teaching
academies, golf simulators and pro shop services. Stores located in Canada operate under the brand name of Golf Town and all stores
in the U.S. operate under the brand name of Golfsmith;
• Great Expressions Dental – a leading dental practice management company with offi ces in seven states across the midwest, south and northeast U.S.;
• Haymarket Financial LLP – an independent fi nance company providing focused lending products to corporate clients and investment management
services to institutional clients;
• Husky International Ltd. – Ontario-based global supplier of highly engineered system solutions and related aftermarket services and components
for the plastics injection moulding equipment industry;
• Lifeways – U.K.’s market leading provider of supported living services for adults with learning disabilities;
• Logibec – a market leader in North America specializing in information systems for the health and social services sector;
• Marketwire – a leading provider of newswire services with one of the largest distribution platforms in North America. Based in Toronto, Marketwire
has partnerships worldwide to distribute news;
• Maxxam Analytics – the largest privately owned analytical laboratory in Canada providing analytical testing services to government
and major companies in the environment, food, oil and gas, health, forensics and genetic markets;
• Nelson Education – Canada’s leading education publisher, from kindergarten to university and college levels, Nelson offers customized educational
solutions for core disciplines such as mathematics, science and language arts;
• Nordco – a leading designer and manufacturer of critical products and services for the maintenance of railroad infrastructure,
serving North American railroads, public transit systems, contractors and equipment leasing companies;
• Public Mobile – a new entrant within Canada’s wireless voice and data services market serving customers in Ontario and Quebec;
• V.Group Limited – a global market leader in outsourced ship management and a leading player in crew provision and related marine services.; and
• United States Infrastructure Corporation (USIC) – a leading provider of outsourced sub-surface utility locating services in the U.S.
Management’s Discussion and Analysis

52 OMERS Administration Corporation 2012 Annual Report
OMERS Administration Corporation
Borealis InfrastructureBorealis Infrastructure (Borealis) manages infrastructure investments for OAC and ranks as one of the world’s largest infrastructure investors. Borealis has a proven track record in identifying, investing and managing infrastructure investments around the globe, consistently providing steady investment returns and outperforming its benchmark.
Infrastructure investing generally involves direct investments in
infl ation-sensitive assets that are critical to the long-term success
of a modern industrial economy. Some infrastructure investments
are subject to regulatory establishment of rates, service delivery
levels or both. Individual investments generally require large
up-front or near-term capital commitments and typically generate
strong infl ation-linked cash returns – a very good fi t in meeting our
long-term pension obligations.

53 2012 Annual Report OMERS Administration Corporation
Borealis Infrastructure
Returns and BenchmarksFor the year ended December 31,
0%
5%
10%
15%
2012 2011 2010
12.68%
8.60% 8.79%8.00%
10.10%
8.50%
Borealis employs a direct drive active management strategy in originating and managing infrastructure assets that generally exhibit strong underlying,
inelastic demand with predictable, stable cash fl ows supported by regulation or long-term contracts with low-risk counterparties. We actively manage
our investments through majority or signifi cant minority positions and bring to investee companies the experience gained through managing a large
infrastructure asset portfolio as well as the relationships developed with governments, lenders, other investors and members of the business community.
Borealis also plays an active role in ensuring that each of its investments has the right management team in place with meaningful incentives that promote
alignment with shareholders. In instances where we do not hold a majority interest in an investment, we partner with like-minded investors with aligned
interests such as other pension, corporate and government investors as well as strong operating partners that can bring operational expertise to the
investment, both in evaluating its potential and in managing and improving its performance.
Borealis investments are located in Canada, the United Kingdom and the United States. Given the breadth of opportunities and low political and regulatory
risk that exists in its current markets, Borealis expects that infrastructure assets located in North America and Western Europe will remain the focus of its
efforts for the near term; however, we continue to look opportunistically at infrastructure assets in other jurisdictions or geographies which exhibit stable and
strong political and regulatory environments.
Borealis’ investments can be grouped into four primary sectors and three main geographic regions as illustrated below:
Management’s Discussion and Analysis
• Rate of Return
• Benchmark
12.68%The overall Borealis Infrastructure return in 2012 was 12.68% compared with a benchmark of 8.60%.
Total Assets by SectorAs at December 31, 2012
Total Assets by GeographyAs at December 31, 2012
• 59% Energy
• 19% Government Regulated Services
• 18% Transportation
• 4% Institutional Facilities & Other
• 50% Canada
• 27% United Kingdom
• 23% United States

54 OMERS Administration Corporation 2012 Annual Report
OMERS Administration Corporation
The energy sector includes investments in regulated utilities, power generation, power and gas, transmission and distribution and oil pipelines. We adhere
to a patient and disciplined investment approach and continue to prudently diversify our portfolio by industry sector, geography, size and stage of
development while pursuing higher probability, lower execution risk opportunities.
Borealis’ investments generated net investment income of $986 million in 2012, compared with $674 million a year earlier. The 2012 gross rate of return
before investment management expenses was 12.68 per cent, compared with 8.60 per cent for the benchmark and 8.79 per cent in 2011. In addition,
Borealis’ investments generated a cash yield of 7.2 per cent (8.4 per cent based on operating assets) in 2012 compared to 5.6 per cent (7.4 per cent
based on operating assets) in 2011. In 2012 refurbishment of Bruce Power’s Units 1 and 2 was completed with both units achieving commercial operations
in October 2012. The strong, stable returns and consistent cash fl ow generated by Borealis’ investments over the past several years illustrates that OAC’s
allocation of a signifi cant portion of its investment portfolio to infrastructure investments continues to be a successful strategic initiative.
During 2012, Borealis’ net investments increased to $9,820 million from $8,997 million in 2011. The increase in net assets primarily represents investment
value appreciation, new acquisitions and other follow-on capital contributions into existing investments. Continuing its strategy of investing in large-scale
infrastructure assets that generate stable and consistent returns, Borealis acquired a 100 per cent interest in Midland Cogeneration Venture (MCV). MCV, a
Michigan based 1,633 megawatt cogeneration plant, is the largest gas fi red power facility in the U.S. Its revenue is primarily derived from the sale of
capacity and energy under long-term power purchase agreements with investment grade counterparties. MCV represents a high-quality energy asset
generating long-term stable, high cash-yielding returns. In addition, Borealis acquired a 49 per cent interest in a portfolio of U.S.-based wind farms. The
geographically diversifi ed portfolio is comprised of four wind farms located in Illinois, Minnesota, Oregon and Texas totaling 599 megawatts, all of which are
operational with long-term power purchase agreements. This investment marks a signifi cant commitment by Borealis in the renewable clean energy sector.
Furthermore, Teranet, one of Borealis’ existing investments, has entered into an agreement in principle with the Province of Manitoba for a long-term license
to operate the province’s property registry system under an exclusive 30-year license. Under the terms of the agreement, Teranet will invest capital in
systems development to transform the existing property searches and registrations in the Province of Manitoba into a more reliable and effi cient platform.
The completion of the transaction is subject to the satisfaction of certain conditions and is expected to close in the fi rst half of 2013. Finally, LifeLabs,
another of Borealis’ existing investments, announced that it has entered into an agreement to acquire 100% of the assets of BC Biomedical Laboratories
Ltd., a medical diagnostic testing business in British Columbia (BC). Subject to the receipt of regulatory approval which is expected in the fi rst quarter of
2013, this acquisition will increase LifeLabs’ share of the BC laboratory services market.

55 2012 Annual Report OMERS Administration Corporation
Borealis Infrastructure
While Borealis prides itself on being a “buy and hold” investor, it did sell two of its infrastructure assets in 2012. These sales were strategic in nature and
involved the sale of Enwave Energy Corporation (Enwave) and Express Pipeline System (Express). Borealis completed the disposition of its 57 per cent
interest in Enwave for $223 million in October 2012. The City of Toronto sold its 43 per cent interest in Enwave as part of the same transaction. The City
is a related party to OAC as the City is an employer in the Plan; therefore, the transaction was deemed to be a “Special Transaction” under the OMERS
Special Transactions Review Policy (available on www.omers.com) and for that reason, the disposition was subject to the approval of the OAC Board,
though it otherwise would have been within Management’s delegated authority.
In addition, Borealis has entered into an agreement to sell its 33 per cent interest in Express for gross proceeds of approximately USD $430 million.
The transaction is subject to standard consents and regulatory approvals and is expected to close by the second quarter of 2013.
Signifi cant investments held by Borealis include interests in:
• Associated British Ports – the largest port owner and operator in the United Kingdom with 21 ports handling approximately 25 per cent of all seaborne
trade into and out of the United Kingdom;
• Bruce Power – the world’s largest nuclear power generation facility, (6,300 megawatts) supplying 25 per cent of Ontario’s electricity needs;
• Detroit River Tunnel – a railway tunnel that operates as one of the largest trade corridors in the world;
• HS1 Limited – the United Kingdom’s only high-speed rail line, connecting St. Pancras International Station in central London to the Channel Tunnel;
• LifeLabs – Canada’s largest provider of laboratory services which provides more than 50 million diagnostic tests to more than 10 million patients
through nearly 20,000 physicians each year;
• Oncor – a leading electricity transmission and distribution company in Texas;
• Scotia Gas Networks – the Scotland and South of England gas distribution networks, comprising 73,000 km of gas lines serving 5.6 million customers; and
• Teranet – the operator of Ontario’s Electronic Land Registry System under an exclusive agreement with the Ontario government until 2067.
Management’s Discussion and Analysis

56 OMERS Administration Corporation 2012 Annual Report
OMERS Administration Corporation
Oxford Properties GroupOxford Properties Group (Oxford) is one of North America’s largest commercial real estate investment, development and management organizations. Oxford oversees and manages approximately $22 billion (2011: approximately $19 billion) of real estate for itself and on behalf of its co-owners and investment partners as at December 31, 2012.
Oxford’s focus is to build a global platform for real estate investment,
providing superior risk-adjusted returns and secure, sustainable
and growing cash fl ows for the Plan. Oxford’s strategy focuses on
the ownership, development and active management of signifi cant
assets diversifi ed by property type, geographic market, partner
relationship and risk-reward profi le. A diversifi ed real estate portfolio
of this nature generates predictable cash fl ows, facilitating our
ability to meet both current and future pension benefi t obligations.
Furthermore, actively managed real estate generally appreciates
in capital value over time which helps to offset the infl ation exposure
of our pension liabilities.

57 2012 Annual Report OMERS Administration Corporation
Returns and BenchmarksFor the year ended December 31,
0%
5%
10%
15%
20%
2012 2011 2010
16.91%
7.15%8.40%
6.83%7.51%
6.65%
At December 31, 2012, Oxford’s direct real estate portfolio consisted of 135 assets, located primarily in Canada, the U.S., the U.K. and Germany, with a
total leasable area of 47.6 million square feet, 3,515 hotel rooms and 21,088 residential units.
Oxford’s offi ce portfolio, with the exception of four assets located in the U.K. and one in the U.S., is diversifi ed geographically in Canada across six major
markets: Toronto, Vancouver, Calgary, Edmonton, Ottawa and Montreal. The largest concentration is in the Greater Toronto Area representing approximately
38 per cent of the market value of the offi ce portfolio. The most signifi cant offi ce properties are:
• Richmond-Adelaide Complex and Metro Centre and a 50 per cent interest in each of the Royal Bank Plaza and TD Canada Trust Tower in Toronto;
• Centennial Place and a 50 per cent interest in Bow Valley Square in Calgary;
• Watermark Place and a 50 per cent interest in MidCity Place in London, U.K; and
• Green Park Business Park in Reading, U.K.
Oxford Properties Group
Management’s Discussion and Analysis
• Rate of Return
• Benchmark
16.91%The overall Oxford Properties Group return in 2012 was 16.91% compared to a benchmark of 7.15%.
Total Assets by SectorAs at December 31, 2012
Total Assets by GeographyAs at December 31, 2012
• 46% Offi ce
• 26% Retail
• 9% Residential
• 8% Hotel
• 6% Industrial
• 3% Indirect Investments
• 2% Debt Investments
• 77% Canada
• 13% Europe
• 10% United States

58 OMERS Administration Corporation 2012 Annual Report
OMERS Administration Corporation
The retail portfolio is comprised of 17 properties, primarily super regional and regional shopping centres, totaling 16.3 million square feet. The properties
are located across Canada and the United States but are predominantly located in the Greater Toronto Area. The most signifi cant properties include:
• a 50 per cent ownership interest in Yorkdale Shopping Centre, Square One Shopping Centre, Scarborough Town Centre and Hillcrest Mall in the
Greater Toronto Area;
• Upper Canada Mall in Newmarket;
• Southcentre Mall in Calgary;
• Kingsway Garden Mall in Edmonton; and
• 5th Avenue high street retail at 52nd Street in Manhattan, New York City.
The hotel portfolio includes major Canadian landmark resort properties located in Banff, Lake Louise and Jasper, Alberta; Whistler, British Columbia; and
Montebello, Quebec and two urban centre hotels in Vancouver, British Columbia and Toronto, Ontario.
Oxford’s multi-family residential portfolio consists of 22 properties located in Ontario, Quebec, Nova Scotia, and the southern U.S. and a portfolio of
10,704 residential units located in Germany. The industrial use assets include 29 properties in the Greater Toronto Area, Vancouver, Calgary and
Edmonton markets.
In addition, Oxford’s real estate portfolio includes properties held for/under development which form the basis of its active development program which
currently includes the development of two offi ce towers in Toronto and Vancouver, an offi ce tower in London, U.K. and industrial properties in Edmonton
and Calgary. Oxford is also continuing the co-development of Hudson Yards, a mixed use offi ce, retail and residential project in Manhattan, New York City.
During 2012, Oxford acquired an interest in two development sites with the future potential to co-develop a 620,000 square foot offi ce complex in
Washington D.C., U.S. and a 500,000 square foot offi ce project in London, U.K.
Oxford’s net investment income increased from $610 million in 2011 to $1,279 million in 2012. Net investment income is primarily comprised of net operating
income, income from debt investments, unrealized gains and losses resulting from changes in the market value of the real estate assets and liabilities, and
realized gains and losses.
Oxford’s net operating income increased by $160 million in 2012 to $637 million primarily due to the net impact of acquisitions and dispositions, a signifi cant
lease surrender payment negotiated at Green Park Business Park in Reading, U.K. and increased average occupancy levels in the hotel portfolio. Across
the rest of the portfolio occupancy levels remained strong even though occupancy in offi ce portfolio was impacted by the lease surrender noted above and
in the industrial portfolio by newly built facilities in the lease up phase.
Occupancy
0%
25%
50%
75%
100%
(i) (i) (i) (ii) (ii)
93% 95% 96% 96%90%
99%94% 94%
68%65%
(i) As at December 31
(ii) Based on average occupancy for the year
• Actual 2012
• Actual 2011

59 2012 Annual Report OMERS Administration Corporation
Oxford Properties Group
Net gains in real estate assets in 2012 were $625 million (2011: $119 million) representing net realized and unrealized gains of $593 million
(2011: $171 million) on real estate investments and an unrealized gain of $32 million (2011: $52 million loss) on debt obligations.
Oxford also holds debt instruments related to high quality real estate assets that yield a strong risk-adjusted return. The debt investments portfolio
contributed $24 million of net investment income in 2012 (2011: $25 million).
The overall real estate return increased to 16.91 per cent in 2012, compared to a benchmark return of 7.15 per cent and an 8.40 per cent return in 2011. The
2012 return exceeded the benchmark primarily due to the market values for real estate properties in Canada being much higher than anticipated a year ago.
Oxford’s total owned real estate assets were valued at $16,182 million (including debt investments of $336 million) at December 31, 2012, compared to
$14,679 million (including debt investments of $163 million) as at December 31, 2011, representing an increase of $1,503 million. This increase is mainly
due to the market value appreciation of the real estate portfolio and net investment activity during the year. Major acquisitions during 2012 included:
• a 25 per cent interest in Les Promenades de L’Outaouais, a retail shopping centre in Gatineau;
• LaCite Apartments, a multi-residential complex in Montreal;
• NorthPort, an industrial business park in Edmonton;
• St Martin’s Court, an offi ce building in London, U.K.;
• a 36.5 per cent interest in Olympic Tower, a mixed use offi ce and retail property in New York; and
• three U.S. debt investments associated with real estate assets in Manhattan and Boston.
Oxford continues to pursue a global investment strategy in targeted international markets to diversify its portfolio and enhance returns. In 2012, Oxford
increased its international diversifi cation to 23 per cent of its portfolio from 21 per cent in 2011 as a result of several strategic acquisitions in the U.K. and
U.S. as noted above.
Oxford also holds and manages a portfolio of indirect real estate investments (primarily real estate funds and other real estate related investments) that
were valued at $490 million as at December 31, 2012, an increase of $45 million from December 31, 2011.
Oxford’s real estate portfolio is partially funded by $6,848 million in mortgages, debentures and commercial paper as at December 31, 2012, compared to
$6,160 million as at December 31, 2011. The net increase in debt of $688 million in 2012 is primarily due to new borrowings related to acquisitions and
development projects.
Management’s Discussion and Analysis

60 OMERS Administration Corporation 2012 Annual Report
OMERS Administration Corporation
OMERS Strategic InvestmentsOMERS Strategic Investments (OSI) is a multi-purpose strategic platform which has a broad mandate to lead certain corporate strategic initiatives and to build strategic investment assets, which will position OMERS as a leading global pension-based investment enterprise.
OSI has the following overarching objectives:
• to lead specifi c corporate initiatives identifi ed in the OAC Strategic
Plan. This includes OMERS global capital formation initiatives
where OSI is leading the development and implementation of
co-investment alliances and establishing and promoting OMERS
global footprint which includes building strategic relationships with
like-minded global institutional investors; and
• to build and manage a portfolio of strategic global investments that
do not fi t into the mandates of the other Investment Entities.
A key part of OSI’s mandate is to build and manage long-term
strategic relationships with like-minded global institutional investors.
In executing this mandate OSI has formed the Global Strategic
Investment Alliance (GSIA) to enable OAC to leverage its capital
alongside new sources of co-investment capital. The GSIA enhances
OMERS ability to secure preferred large-scale private market
investments while leveraging OMERS investment management
expertise. Relationships have been initiated with many organizations
around the world and in 2012 the GSIA was launched with OAC
committing USD$5 billion and two members from Japan, the
Pension Fund Association and a consortium led by Mitsubishi
Corporation, each committing USD$1.25 billion, for a total
commitment of USD$7.5 billion.
OSI is continuing to drive to expand the GSIA in 2013 with the goal of
adding new members to the alliance.
OSI is also establishing OAC’s global footprint through promoting and
leveraging the intellectual capital of the entire enterprise under the
OMERS Worldwide brand and ensuring that OAC has a presence in
and knowledge of global markets through business relationships and
a network of OMERS Worldwide offi ces.

61 2012 Annual Report OMERS Administration Corporation
OMERS Strategic Investments
Returns and BenchmarksFor the year ended December 31,
-15%
-10%
-5%
0%
5%
10%
2012 2011 2010
8.70%
-10.13%
7.24% 6.90% 7.65% 7.00%
OSI is building the capacity to generate attractive investment opportunities and build global business relationships for the benefi t of all OMERS Investment
Entities. It also has the mandate to manage a portfolio of investments which do not fi t under the mandates of the other OMERS Investment Entities.
OSI’s current investments are in the following areas:
• The resource sector which is a major driver of Canada’s long-term economic prosperity. Resource investments represent $1 billion in net investment
assets and include:
OMERS Energy/OMERS Energy Services – a Calgary-based oil and natural gas acquisition, exploration, development and production company with oil
and gas wells throughout western Canada; and
CEDA International – a leading industrial, mechanical and electrical services company which is well established in the Alberta Oil Sands.
• The technology sector which is a major driver in the new world economy. Investments in this space include:
OMERS Ventures – OSI launched OMERS Ventures in 2011 to invest in the technology, media and telecommunications sectors. OMERS Ventures invests
throughout the lifecycle of a company, from seed investments to investments in later stages. During 2012, OMERS Ventures invested in a number of
leading companies based in Canada and deployed over $110 million of capital; and
MMM Group – a Canadian-based international engineering company that provides engineering, project management, environmental and advisory
services in Canada and in more than 40 countries on fi ve continents. MMM Group is recognized as an industry leader in the provision of quality,
cost-effective and technically excellent, multidisciplinary solutions for a diverse range of assignments.
• New markets and products which represent signifi cant investment opportunities for OAC and the opportunity to form new business relationships. These
opportunities include investing in new markets where OAC has not invested directly in the past, primarily in Latin America, South America and Asia, in a
cost-effective manner. The principal investments in this space are concession agreements to manage airports in emerging countries.
ADC & HAS Airports – OSI has formed a partnership with HAS Development Corporation, an affi liate of the Houston Airport System, and Airport
Development Corporation that focuses on the operation and, where required, the development of airports in growing and important emerging markets.
This partnership brings together the operational, technical and fi nancial expertise of the Houston Airport System, Airport Development Corporation
and OSI. Through this partnership, OAC is able to invest and conduct operations in countries where OAC does not have an investment presence,
thus opening the door to future investments by OSI and the other Investment Entities in such markets.
In 2012, OSI generated a net investment loss of $201 million for a gross investment return of negative 10.13 per cent compared with the benchmark of
8.70 per cent and net investment income of $121 million in 2011. OSI, which represents less than 2.5 per cent of OAC’s net investment assets, has its
principal assets in Alberta’s oil and gas sector. The loss in 2012 was driven by the year-end valuation of these assets which was negatively impacted as
oil and natural gas prices fell to their lowest levels in fi ve years. OMERS Energy represents OSI’s largest investment in Alberta’s oil and gas sector and
while the impact of decreasing oil and gas prices has negatively impacted OMERS Energy’s performance over the short term, the annualized return for
OMERS Energy from 2004 to 2012 is 8.54 per cent (2011: 13.07 per cent).
During 2012, OSI’s net investment assets decreased from $1,644 million at December 31, 2011 to $1,516 million at December 31, 2012. The decrease
primarily refl ects the mark-to-market writedown in value of oil and natural gas investments due to changes in market prices of those commodities.
Management’s Discussion and Analysis
• Rate of Return
• Benchmark
-10.13%The overall OMERS Strategic Investments return in 2012 was negative 10.13% compared to a benchmark of 8.70%.

62 OMERS Administration Corporation 2012 Annual Report
OMERS Administration Corporation
Risk Management We are committed to providing secure pensions to our members by investing in a broad range of assets in a manner that strives to earn superior returns without taking undue risk and is consistent with our risk tolerance. OMERS seeks to ensure that the value of the net assets of the Funds is suffi cient to pay all pensions promised to members of the OMERS Pension Plans.
For a given contribution rate, our ability to meet this objective is
affected by two factors:
• fl uctuations in the value of the investment portfolio, which are
driven by changes in investment markets (primarily market, credit
and liquidity risk); and
• changes in the value of the Plan’s accrued pension obligation,
which are driven by both economic and demographic factors.
Risk management is an essential part of our corporate and investment
strategy as it can mitigate the negative impact of the above factors on
the investment portfolio and the accrued pension obligation. Risk
management is supported by our system of internal controls,
programs such as enterprise risk management and investment risk
management and our corporate policies including our Code of
Conduct, Statement of Investment Authorities and Statements of
Investment Policies and Procedures. We continually strive to improve
our enterprise-wide approach which involves our Board, Management
and employees within all areas of OAC and our Investment Entities.
All employees are required to adhere to policies, procedures and
standards that a prudent person would reasonably exercise when
managing the assets of others.
Enterprise Risk Management
OAC manages risk within the Board-approved risk appetite to provide
reasonable assurance regarding the achievement of the strategic
objectives. Enterprise risk management (ERM) is a process applied
throughout OMERS enterprise to identify potential risks that may
either hinder the sustainable achievement of enterprise objectives or
result in the failure to identify and maximize opportunities.
OMERS main strategic objective is to administer and fully fund the
Primary Plan and as such the risk of not meeting this objective is a
primary focus of the OAC ERM Program.

63 2012 Annual Report OMERS Administration Corporation
Risk Management
Management’s Discussion and Analysis
The ERM process embeds risk management into all activities as an integral part of our business and is guided by the following key principles:
Philosophy
The enterprise will take on a level of risk in line with its appetite for risk. We believe that a proactive and systematic approach to managing risk benefi ts the
enterprise through enhanced investment performance and an enhanced brand/reputation. As such our approach is to manage and control risk rather than
avoid or eliminate it. We also believe that strong ERM practices allow for more informed risk-taking and decision-making.
Culture
OAC fosters a corporate culture which accepts informed risk-taking as fundamental to its business provided that risk identifi cation, mitigation and
monitoring processes are established.
Education
OAC promotes training and risk awareness among OAC Board members and employees. In addition, as part of our decision-making processes we promote
documenting the consideration of relevant risks and their potential impact to achieving our objectives.
Learning
OAC promotes the review of past risk events to learn from past experience.
Standards
A common approach to risk management is in place to promote consistency and the application of leading practices in managing, monitoring
and reporting of risk.
Risk ownership
Responsibility for the design of the risk management framework lies with the Enterprise Senior Leadership Team (ESLT). To support this responsibility,
accountability is assigned for managing, monitoring and reporting of specifi c risks.
Independent assurance
The enterprise will obtain periodic independent assurance that systems of risk management and internal control are operating effi ciently and effectively.
Integration
OAC promotes the integration of risk management into all areas of our business including pension administration, investment operations and
decision-making, strategic and operational planning, fi nancial reporting and the design of compensation plans.
The ERM program enhances our overall governance framework and our ability to identify and manage risk on an integrated basis; to apply consistent risk
standards, concepts and policies across the organization; and to make the concept of risk assessment and management an integral and sustainable part
of OMERS business operations. Our customized ERM program is a top-down/bottom-up methodology based on the COSO Enterprise Risk Management
Integrated Framework. As illustrated in the chart on page 64, the program is led by the ESLT Steering Committee chaired by the CEO. Each risk has been
assigned to an executive Risk Champion, who is responsible for understanding all aspects of the risk and for actively liaising with OMERS subject matter
experts. There are two cross-functional and cross-enterprise risk committees, comprised of all Investment Entity Chief Financial Offi cers (CFOs) and
corporate Senior Management, who are responsible for documenting and communicating risk management activities throughout OMERS.

64 OMERS Administration Corporation 2012 Annual Report
OMERS Administration Corporation
OAC Enterprise Risk Management Program Organization
The primary oversight responsibility for risk management rests with the Board. The Board receives annual and quarterly risk assessment updates on the
status of key risks and mitigating action plans as well as the identifi cation of any new or emerging risks.
When assessing risks, committees focus on the key risks to the Strategic Plan. These key risks are mapped against their Board-approved Risk Appetite
Statement and action plans to monitor or manage the risks are developed by the Risk Champions. In addition to the ongoing risk assessments, key projects
and strategic initiatives are also subject to a rigorous assessment of risks and mitigating controls to determine gaps and action plans.
Risks Affecting the OMERS Pension Plans
The Enterprise Risk Management program has identifi ed four categories of risks that could potentially have an adverse effect on the OMERS Pension Plans:
• investment risks (market, credit and liquidity risk) that are an inherent part of investing in capital and private markets;
• an array of operational (i.e. employee engagement, employee conduct, internal control, client service, etc.) risks that we face as an operating business;
• strategic risks inherent in the execution of our long-term plan including funding risk (i.e. funding, strategy and planning, climate change, etc.); and
• legal and compliance risks (i.e. fi duciary, contractual, etc.) that we deal with in the management and administration of the OMERS Pension Plans under
the laws of Canada as well as laws and regulations of the various countries where we invest.
Enterprise and Investment Risk
Management Committees
Board of Directors
CFOs of Investment
Entities
Senior Management
CEO
Enterprise Senior Leadship Team Steering
Committee
CFO
Risk Champions

65 2012 Annual Report OMERS Administration Corporation
Investment Risk
OAC manages investment risk though its Investment Risk Management Framework, which is comprised of fi ve steps:
• identify investment risk inherent in assets both in absolute terms and relative to the objectives and strategies of each portfolio;
• measure/assess investment risk consistently and objectively;
• manage investment risk on an ongoing basis with the objective that returns should be commensurate with the risks taken;
• report and monitor investment risk on a regular basis; and
• review the effectiveness of the Investment Risk Management Framework to continuously improve OAC’s ability to manage its investment risks.
The Plan invests in a combination of equities, infrastructure, real estate and a broad range of interest bearing instruments in various currencies. The
long-term expected return from such an investment portfolio is used to set the funding target of the Plan. This investment strategy diversifi es the investment
portfolio and assists in maintaining stable and cost-effective contribution rates. The future values of OMERS investment assets and liabilities are not known
with certainty and change over time. Investment risk (i.e. market, credit and liquidity risk) refl ects the possibility that the value of the Funds’ investments will
deviate from the actuarially assumed long-term rate of return as a result of changes in market conditions, whether those changes are caused by factors
specifi c to the individual investment or factors affecting all investments traded in the market.
The assumption of investment risk is necessary to meet the Plans’ benefi t obligations at a reasonable cost. The goal of investment risk management is
not to eliminate risk but to fi nd a balance between expected returns and the risks required to generate those returns. Further, it is generally accepted that
expected investment returns (positive or negative) increase with the amount of risk taken. The higher the risk involved in an investment, the higher the
expected return (or potential loss) from that investment. Investment risk is neither good nor bad – a certain amount is needed to generate investment
returns required to maintain stable and cost-effective contribution rates. The OAC Board defi nes the amount of investment risk to be taken by the Funds
through (a) policies, (b) delegations and (c) the long-term strategic asset mix.
a) Policies:
The OAC Board, through the Statement of Investment Beliefs and the Statements of Investment Policies and Procedures, provides direction for the
investment management and administration of the OMERS Funds.
b) Delegations:
The OAC Board annually delegates certain investment approval authority to the CEO. The Statement of Investment Authorities policy defi nes delegated
authorities including borrowing, follow-on investments and material changes to those decisions. Within the delegated authorities from the OAC Board, the
CEO may sub-delegate limits to senior management of OAC or the Investment Entities.
c) Long-term strategic asset mix:
OMERS undertakes an asset/liability study for the Primary Plan every three years to assess OMERS current strategic asset mix targets and funded status
in light of OMERS strategic objectives, forward looking economic conditions and anticipated Plan design changes. During the study, several alternative
asset mixes are assessed against the liability structure of the pension plan. The results of the study are used to identify the strategic asset mix which is
most likely to:
• provide the investment return required to meet the pension promise; and
• generate additional surplus wealth;
while striking an acceptable balance between risk and return.
The OAC Board completed its last asset/liability study in October 2012 which confi rmed the strategic decision to continue moving towards a 53 per cent
public markets and 47 per cent private markets asset mix.
OAC utilizes analytical and reporting tools including enterprise-wide and Investment Entity specifi c policies; asset/liability studies and actuarial valuations;
risk measurement and reporting; and due diligence and internal “direct drive” asset management processes to manage investment risk at the enterprise
and Investment Entity (public market and non-public market) levels.
OAC ensures that OMERS Pension Plans’ investments are well diversifi ed across assets, industry sectors and geographic regions in order to have different
segments of the investment portfolio exposed to different investment risks. This reduces the overall volatility of returns and insulates the investment portfolio
from the negative impact of adverse returns in any one asset class, industry or region.
Market, credit and liquidity risks are discussed in our Consolidated Financial Statements on pages 97 - 101 of this Annual Report.
Management’s Discussion and Analysis
Risk Management

66 OMERS Administration Corporation 2012 Annual Report
OMERS Administration Corporation
Operational Risk
Operational risk is the risk of loss arising either directly or indirectly from operational error due to failure in processes, systems, technology, actions of
personnel or due to unforeseen external events. Our framework of policies and procedures is designed to identify and manage operational risks through
the implementation of controls over data integrity, information processing, and management of information technology. These controls are independently
reviewed through internal audits and the annual review of our internal controls over fi nancial reporting and disclosure controls discussed on page 27 of
this Annual Report.
People Risk
A key component of operational risk is people risk. Our human resources practices are designed to mitigate people risk including the risk of loss of key
personnel. As OMERS implements its direct drive strategy and repatriates assets from external fund managers, continuing to manage people risk remains
a focused priority for the Board and Management.
Strategic Risk
Strategic risk is the risk of not achieving our long-term strategic goals and objectives. The Board and the CEO manage the achievement of our strategic
goals by overseeing our policies and the planning and achievement of our long-term goals. The CEO is accountable to the Board for decisions relating to
the day-to-day management of the OMERS Pension Plans and the Funds including funding policy, investment strategies and investments pursued,
investment management styles and operating results. To manage this risk, we have established a governance framework, a business strategy development
process and performance measures.
Funding Risk
The OMERS Pension Plans’ funding is a signifi cant strategic risk. Inappropriate policies or decisions related to asset allocation or actuarial methodologies
and valuation processes can impact the funding of the OMERS Pension Plans. Our ability to pay pensions is not only subject to investment risks but is also
subject to the risks associated with the assumptions used in the valuation of the Plan’s accrued pension obligation. The major assumptions that go into the
valuation of the accrued pension obligation include long-term economic conditions (e.g., infl ation, the real return on investments and the rate of member
future salary increases) and membership demographics (e.g., mortality, disability, termination and early retirement rates and marital status). The risk arises
in two ways: (i) actual market conditions and member demographics differing signifi cantly from the assumptions used in the valuation of the accrued
pension obligation; and (ii) unforeseen changes in major assumptions.
To manage these risks, the Board appoints an independent actuary to value the accrued pension obligation annually based on economic and demographic
assumptions recommended by the independent actuary, reviewed by Management and approved by the Board. The validity of all assumptions is monitored
each year against actual experience and the assumptions may be adjusted as appropriate.
Legal and Compliance Risk
Legal and compliance risks arise from changes in or non-compliance with legal and/or regulatory requirements and/or other ethical standards which can
undermine OAC’s ability to achieve its objectives. The Board and Management, with the assistance of the Legal Division (including the Compliance Offi ce)
and independent expert advisors, monitor situations affecting regulatory compliance that could result in regulatory action. We have established processes
to keep abreast of applicable regulatory developments and to advocate for changes where they are in the best interest of Plan members.
Through our governance framework and established policies and procedures, including our Code of Conduct and Personal and Insider Trading Policy for
directors and employees, we strive to ensure that values and behavioral expectations are well understood and integrated throughout the organization so
as to minimize these risks.
Risk Management

67 2012 Annual Report OMERS Administration Corporation
OAC fi nancial statements are prepared in accordance with the requirements of the Canadian Institute of Chartered Accountants (CICA) Handbook Section
4600 – Pension Plans (CICA Section 4600). For accounting policies that do not relate to the Plans’ investment portfolios or pension obligations, OAC
complies on a consistent basis with the requirements of International Financial Reporting Standards. The recognition, measurement and disclosure
contained in the 2012 year-end Consolidated Financial Statements are in compliance with the requirements of CICA Section 4600 or the relevant
International Financial Reporting Standards.
Consistent with CICA Section 4600, investment assets are presented on a non-consolidated basis even when the investment is in an entity over which
OAC has effective control. Earnings of such entities are recognized as interest is earned, dividends are declared or as real estate rental revenue is earned.
OAC total investment income includes valuation adjustments required to adjust the carrying of investments to their fair value.
Consistent with CICA Section 4600 and International Financial Reporting Standards, certain of our accounting policies require subjective or complex
judgments and estimates relating to matters that are inherently uncertain. The use of different judgments and estimates could result in materially different
amounts being recorded under different conditions or by using different assumptions. As a result, actual results could materially differ from our estimates
and assumptions applied in the Consolidated Financial Statements. Signifi cant estimates included in the Consolidated Financial Statements relate to the
valuation of investments and the valuation of our accrued pension obligation.
Our policy is to record all investments at fair value. Fair value is defi ned as the price that would be received to sell an asset or paid to transfer a liability in
an orderly transaction between market participants at the measurement date. The assessment of fair value involves considering many factors for each type
of investment held by the Funds. Fair value is based on quoted market prices, where available, and excludes transaction costs which are expensed as
incurred. For private market investments where quoted market prices are not available, fair value is generally based on internal or external valuations using
generally accepted valuation methods. The fair value of a private market investment acquired within the current fi scal year, a non-operating investment or
an investment in a start-up business may be supported by the acquisition valuation where this is considered the best estimate of fair value based upon
events since acquisition. For private equity funds, the fair value is generally based on the valuation provided by the fund’s general partner subject to
information available to OAC’s investment management. As a result, fair values for private market investments are based on estimates which are inherently
uncertain. Our policy is to obtain independent support of valuations for signifi cant private market investments through review by accredited independent
appraisers at least once every three years, or whenever the valuation changes by more than 15 per cent from the prior year for private market direct
investments and through annual audited fi nancial statements for fund investments.
Actuarial assumptions used in determining the accrued pension obligation refl ect Management’s estimates of future economic factors such as the Plans’
nominal rate of return and discount rate, rate of pensionable earnings increase and infl ation, and non-economic factors such as mortality, withdrawal and
retirement rates of Plan and RCA members. This process is supported by our independent actuary. The Plan and RCA actual experience could differ from
these estimates. Differences are recognized as experience gains or losses in future years.
A summary of our signifi cant accounting policies is presented in note 2 to the Consolidated Financial Statements starting on page 86 of this Annual Report.
Management’s Discussion and Analysis
Critical Accounting Policies

68 OMERS Administration Corporation 2012 Annual Report
OMERS Administration Corporation
Report of the Human Resources Committee
Members in 2012
David O’Brien (Chair)
Bill Aziz
Richard Faber
James Phillips
John Weatherup
Rick Miller (ex-offi cio)
The purpose of the Human Resources Committee (HRC) is to
assist the OAC Board in meeting its fi duciary oversight and related
obligations by: (i) attracting, engaging and retaining excellent
leadership at the senior executive level who are committed to the
OAC Mission Statement, Core Values and Leadership Principles;
(ii) overseeing a robust succession management process for the
position of Chief Executive Offi cer (CEO); and (iii) overseeing senior
executive performance, compensation and compensation policies.
In the 2012 fi scal year, the HRC’s work included:
• oversight of an annual performance assessment process for the
CEO;
• making recommendations to the OAC Board on compensation
for the CEO;
• reviewing the candidates for CEO and Enterprise Senior
Leadership Team (ESLT) succession as part of the succession
management process including discussion of development plans;
• recommending to the OAC Board on the recruitment of and the
proposed compensation for the ESLT;
• approving the compensation strategy, policy structure and
framework for short-term and long-term compensation plans
for the ESLT;
• approving performance-based measures for compensation plans
pertaining to the ESLT;
• reviewing compensation and benefi ts plans to ensure appropriate
strategic linkages and risk mitigation; and
• approving compensation-related disclosure in public documents
such as the OAC Annual Report.
Compensation Discussion and Analysis OMERS is committed to maintaining full transparency with our stakeholders on all facets of our executive compensation program. As part of this commitment, our goal is to provide information that is clear, relevant and appropriate.

69 2012 Annual Report OMERS Administration Corporation
Independent Compensation Advisor
To assist in executing its responsibilities, the HRC engages an independent compensation advisor, Global Governance Advisors (GGA), to provide advice.
GGA is directly retained and instructed by and reports directly to the HRC. All work is pre-approved by the HRC and GGA did not provide any non-Board
approved services to the organization during 2012.
During 2012, GGA’s scope of services included the following: (i) providing independent executive compensation advice pertaining to the ESLT
(i.e. compensation philosophy, performance management, comparator groups, competitive pay positioning and pay mix); (ii) ensuring the Committee
understood and were comfortable with the current compensation program for the ESLT; (iii) assisting and counselling the Committee on any
recommendations made by Management; (iv) conducting education sessions that provided the Board with an overview of emerging trends and best
practices; (v) assisting in any succession management initiatives; and (vi) assisting with any other items that the HRC requested.
The HRC has sole authority to approve the amount of the independent compensation advisor’s fees. The following table outlines the fees paid for services
provided in the last two fi scal years:
Advisor Executive Compensation - Related Fees All Other Fees
2012 2011 2012 2011
Global Governance Advisors $291,600 $138,500 Nil Nil
Committee Composition & Meetings
Members of the HRC are appointed by the OAC Board from amongst the Board’s members and are independent of Management. As a cohesive unit they
have skills, knowledge and experience in investment management, pensions, economics & public policy, executive leadership & strategy, risk management
and talent management. The HRC met four times during 2012 in order to review key items according to its mandate and annual work plan. At the invitation
of the Chair of the HRC, members of Management, including the CEO, and the Committee’s independent advisor, GGA, attended the meetings. At the end
of each meeting there is an in camera session without Management present.
2012 Year in Review
Our total compensation philosophy is an important element of our strategy to attract, retain and engage high performing talent; however, this is only part
of our overall approach to investing in our people. The potential growth of OMERS over the next fi ve years will require focused leadership and employee
development to ensure we have the talented teams in place to deliver on the pension promise.
Growing and Developing Talent
Our robust talent strategy is supported by performance-based incentives. We strongly believe in acquiring top talent, while we continuously develop and
promote internal talent at all levels. Over the past two years, the Committee has worked closely with Management to develop a comprehensive succession
management process designed to ensure OMERS is well positioned with the right leadership talent for the future. We have a robust process that involves
all senior leaders enterprise-wide to identify, assess and develop succession candidates for executive roles across OMERS. We are confi dent that we have
a good snapshot of the talent at OMERS and are in a position to develop our future leaders and manage the people risks related to talent for the future.
Compensation Discussion and Analysis

70 OMERS Administration Corporation 2012 Annual Report
OMERS Administration Corporation
In 2011, Management established a formal strategy for developing our people and deepening OMERS leadership capabilities with the development
of enterprise-wide Leadership Principles and the implementation of the Emerging Leaders Program. The program has been designed to accelerate
the development of our emerging leaders by helping them gain a greater understanding of the OMERS business, the growth strategy and building
and strengthening their leadership capability. OMERS has also partnered with the Ivey Leadership Institute on the design and delivery of our second
leadership development program for all leaders across the enterprise, called Investing in Leaders I, so that we have a full leadership pipeline to meet
our future strategic and operational objectives.
Approach to Compensation
The continued evolution of our compensation approach supports our talent strategy to attract, engage, reward and retain top talent. Our compensation
plans are designed to align with business objectives while ensuring we deliver market competitive compensation that rewards for performance and
differentiates across markets. The next generation of risk-adjusted compensation plans means we keep plan design simple, while ensuring the plans
are refl ective of the best governance principles. To maintain a clear focus on enterprise-wide performance, all long-term incentive plans incorporate
enterprise-wide performance measures to ensure we are all pulling in the same direction each and every day.
2012 Performance and Compensation
When determining compensation, the HRC considers a number of quantitative and qualitative performance measures that were selected due to their
alignment with OMERS fi ve-year enterprise-wide strategic plan. This year, investment performance results exceeded expectations on many fronts and
our investment performance was at the upper end of our expected average range. We continued to make substantial progress against our fi ve-year
enterprise-wide strategic plan, which included achievements in increasing the proportion of OMERS investments that we actively managed internally,
continued support of our Additional Voluntary Contributions program from our Plan members, securing additional foreign capital through the
launch of the Global Strategic Investment Alliance and infl uencing regulatory reform for the future. The committee believes that the compensation awarded
to the Named Executive Offi cers appropriately refl ects overall performance during the year.
Preparing for 2013
Given the current market conditions, salary increases were not granted to employees in executive positions. An enterprise-wide salary increase budget
of 2.8 per cent was approved for 2013 for employees below the executive level.
In 2013, we will continue to dedicate a signifi cant amount of time to the topic of talent and ensuring that OMERS has the right leaders and the right
people who will produce the results that deliver value to our Plan members. We are confi dent that our approach to compensation, which includes strong
governance practices, achieves the appropriate balance between effectively paying for performance and ensuring compensation programs do not incent
excessive risk-taking and also attracts and retains talented leadership. The HRC remains committed to being a leader in compensation governance among
pension funds and will continue to provide clear and transparent disclosure to our Plan members and stakeholders.
David O’Brien
2012 Chair of the Human Resources Committee

71 2012 Annual Report OMERS Administration Corporation
This Compensation Discussion and Analysis section highlights OMERS 2012 performance, reviews our executive compensation program in detail and
describes the compensation awards for the Named Executive Offi cers. The Named Executive Offi cers include the OAC Chief Executive Offi cer, OAC Chief
Financial Offi cer (CFO) and the three highest paid members of the ESLT.
Approach to Compensation
OMERS is committed to a pay-for-performance approach to compensation for all employees, including the senior leaders. This philosophy supports the
execution of the fi ve-year enterprise-wide strategic plan and the commitment to ensure the sustainability of the Plan’s funding by delivering realistic
risk-adjusted returns over the long term.
As a result, the total compensation programs are designed to attract, engage and retain high performing people and ensure they are motivated to pursue
OMERS overall investment goal of earning sustainable returns that meet or exceed the Plan’s long-term requirements. OMERS recognizes that this must be
done with an acceptable level of risk, and the HRC is responsible for ensuring our compensation policies and practices do not encourage undue risk-
taking. As a result, OMERS has a clear set of incentives that are aligned with the long-term investment strategy and investment risk limits, measured against
pre-established Board-approved benchmarks, and are communicated to and understood by Management and employees.
Compensation Principles
The objective of the compensation strategy is to attract, engage and retain high performing people to focus on the long-term viability of the Pension Plan
and delivery of the pension promise. To achieve this objective, the executive compensation program is based on the following principles:
1. Align with the interests of Plan members
Align employee interest with the interests of the Plan members through effective compensation plan design.
2. Align with OMERS strategy
Focus employee efforts on critical performance targets and reward for superior performance in achieving results.
3. Pay for Performance
Promote a pay-for-performance culture and reward employees for superior performance and adjust compensation when performance falls below targets.
4. Effective Risk Management
Ensure compensation plan design does not create an incentive for excessive risk-taking and review each compensation plan regularly to ensure that
it is operating as intended.
5. Pay Competitively
Reward employees in a manner consistent with competitive market practice to improve the organization’s ability to attract, engage and retain high
performing talent. For total compensation, target level performance is benchmarked to the median in the marketplace and superior level performance
is benchmarked to the 75th percentile in the marketplace.
6. Good Corporate Governance
Strive to be a leader on governance and continually review and incorporate appropriate compensation practices that align with evolving best practices.
The total compensation philosophy is approved annually by the HRC and is an integral component of the total compensation strategy.
Compensation Discussion and Analysis

72 OMERS Administration Corporation 2012 Annual Report
OMERS Administration Corporation
Elements of the Executive Compensation Plan
Executive compensation for 2012 consists of six main elements: base salary, short-term incentives, long-term incentives, benefi ts, perquisite cash
allowances and pensions. These elements provide a total compensation package designed to attract highly qualifi ed individuals, provide strong
incentive to align efforts with OMERS objectives and motivate to deliver performance that creates sustainable results for OMERS members.
Compensation Element Plan Description
Fixed Compensation
Base Salary The compensation philosophy aims to pay competitive base salaries as defi ned by the comparator group. Salaries are reviewed
annually at the beginning of each year and any increases are generally granted when an executive assumes greater
responsibilities, deepens knowledge and expertise, or when there is a signifi cant change in the compensation levels of
comparable roles in the comparator group. The HRC considers and approves base salaries of the ESLT, while the OAC Board
approves the CEO’s base salary based on the HRC’s recommendation.
Benefi ts, Perquisites and Pension Programs
Employees in Canada participate in benefi ts that include vacation, life and disability insurance, health and dental benefi ts, our
employee assistance program, and pension plan. Members of the ESLT also receive a perquisite cash allowance, which is regularly
reviewed by the HRC.
Performance Based / At Risk Compensation
Short-term Incentive Plan Short-term Incentive Plans (STIP) are designed to attract, engage and retain high-performing executives by providing competitive,
performance-based compensation targets. The STIP has been designed to align compensation with key performance and
strategic objectives and individual performance. The HRC reviews targets for the ESLT each year as well as upon hire, promotion
or when there are signifi cant changes in responsibilities.
At the beginning of each year, the HRC approves the key areas of focus, performance measures, weightings and targets against
which performance will be evaluated. The corporate performance component is based on a scorecard comprised of: (i) investment
performance, (ii) pension services performance, and (iii) objectives aligned with OMERS fi ve-year enterprise-wide strategic plan.
There is also an individual component that assesses and rewards leadership performance demonstrated by the executives in the
achievement of their key performance objectives and how well they have met their overall job performance expectations.
STIP awards are determined as follows for the CEO and corporate senior executives:
STIP AwardShort-term
Incentive Plan Target x [ Performance on Strategic
Planning and Execution +Investment
Performance +Pension Services
Performance +Individual
Performance ]Investment Entity leaders have a similar STIP based on performance of their specifi c business.
Long-term Incentive Plan The Long-Term Incentive Plan (LTIP) is designed to encourage and reward executives for the achievement of superior and sustained
investment performance and align the interests of executives with those of Plan members. The LTIP rewards performance over
multiple years to incent the achievement of consistent longer term outcomes. The awards mature on December 31 of the third year
following the award date.
LTIP awards are determined as follows for the CEO and corporate senior executives:
LTIP AwardLong-term
Incentive Plan Target x [ Investment Performance ] xOMERS Total Fund
Absolute Return MultiplierTotal Public Markets Performance + Total Private Markets Performance
Investment Entity leaders have a similar LTIP based on performance of their specifi c business.
Long-term Performance Plan The Long-term Performance Plan (LTPP) was implemented in 2010 to align executives with the fi ve-year strategic plan and to
provide motivation to grow OMERS assets, including third-party assets. Under the LTPP, performance units may be awarded to the
President and CEO and to other key members of the ESLT based on performance or market-related considerations. LTPP is based
on the value-add generated from growth in new assets under management. The value fl uctuates in accordance with the Fund’s
absolute performance as well as the size of the Fund over the three-year period. Once fully vested, the performance unit value will
be determined and paid out in cash.
LTPP awards are determined as follows:
LTPP AwardLong-term Performance
Plan Target x [ Third-party Committed
Capital Raised +Management Fees for Third-party
Committed Capital Raised ]

73 2012 Annual Report OMERS Administration Corporation
Comparator Groups Used to Set Competitive Pay
OMERS has identifi ed comparator groups for its various businesses in setting competitive compensation to closely refl ect the marketplace. The comparator
groups are reviewed on a regular basis and approved by the HRC. Typical considerations include other organizations that compete for similar talent,
industry-specifi c organizations or organizations with similar objectives. Within these comparator groups, OMERS reviews compensation levels of comparable
positions and assesses relative performance and size of the comparator groups. Annually, the compensation comparator groups are used to benchmark
compensation for all employees enterprise-wide. The following chart captures the general parameters used to develop the annual comparator groups:
Geographic Location: Canada Sample Organizations
Corporate functions • General industry organizations with revenues greater than $1 billion
Pensions services • Pension funds
Investment teams • Investment management organizations, including pension funds, asset management fi rms and banks
Oxford Properties • Real Estate organizations
• Investment management organizations, including pension funds, asset management fi rms and banks
Outside of Canada, local market data is gathered on the same basis to set compensation levels.
Alignment to Financial Stability Board Principles – For Effective Governance of Compensation
The HRC has taken steps to further strengthen our approach to compensation, including incorporating the Financial Stability Board Principles for Sound
Compensation Practices and the associated Implementation Standards. These principles and standards, established in 2009, are intended to ensure
effective governance of compensation, alignment of compensation with prudent risk-taking, effective supervisory oversight and stakeholder engagement
in compensation. The following paragraphs discuss how OMERS approach to compensation is aligned with these principles and standards.
The HRC is composed entirely of independent directors and meets on a regular basis to discuss various compensation and human resources matters.
They are responsible for approving compensation plans and policies for the ESLT, including base salary and incentive compensation. The HRC has a
formal and comprehensive process for approving the design of compensation plans across the organization. On an annual basis, the HRC approves the
performance measures, weightings and targets at the beginning of the year. At the end of the year, the results are evaluated to determine actual payouts.
Executives have a competitive mix of base salary, variable and deferred compensation. The mix varies by position and level within the organization, with a
higher weighting of variable and at risk compensation at higher executive levels. All STIP and LTIP award payouts are dependent on performance results
based on pre-determined HRC approved measures and the level of risk taken in achieving results versus OMERS risk framework. Executives receive a
meaningful portion of their compensation in LTIP awards, subject to performance and vesting requirements. All compensation plans reviewed or designed
after 2010 include a comprehensive review of risk measures to determine the impact on compensation awards. The HRC uses both quantitative measures
and judgment in determining risk adjustments. The risk adjustments account for all types of risk which include, but are not limited to, asset allocation and
concentration risk, active risk, regulatory breaches, operational risk and people risk.
OMERS continues to ensure effective governance of compensation and alignment of compensation with prudent risk-taking. The HRC remains committed
to being a leader in compensation governance among Canadian pension funds and will continue to strive for improvements in disclosure to our Plan
members and stakeholders.
Compensation Discussion and Analysis

74 OMERS Administration Corporation 2012 Annual Report
OMERS Administration Corporation
2012 Performance and Executive Compensation
Incentive compensation for the CEO and corporate senior executives is based on performance against pre-determined investment performance results,
pension services performance and performance against OMERS fi ve-year enterprise-wide strategic plan. This section highlights the performance during
the year and how it translates into the compensation awarded to the Named Executive Offi cers.
2012 Corporate Performance
Under Michael Nobrega’s leadership, OMERS continues to evolve as a strategic leader with innovative programs and services in the pension industry and
investment community.
OMERS performed strongly against the fi ve-year strategic plan objectives by continuing to implement the long-term asset mix policy and the initiatives to
gain access to domestic and foreign capital, as well as identifying strategic investment opportunities and removing barriers to OMERS growth. These
strategic initiatives are discussed in the MD&A section of this Annual Report.
Pension Services met or exceeded all targets to ensure our Plan members and employers receive excellent service by continuing to enhance our internal
capabilities, focusing on excellent execution and supporting effective plan governance. We successfully completed phase one of the redevelopment of our
internal technology systems to accommodate increased Plan complexity and position ourselves to support OMERS strategic initiatives. The successful
launch of the Additional Voluntary Contributions (AVC) program in 2011 continues to gain momentum among Plan members.
Investment performance is critical to fulfi ll the pension promise to our current and future retirees as OMERS must produce investment returns that exceed
the actuarially assumed rate of return, within an acceptable risk tolerance. At the start of every year the OAC Board approves benchmarks for the asset
classes in which OMERS invests. OMERS achieved excellent investment results for 2012 with a 10.03 per cent total Fund return. For our asset classes that
are benchmarked based on projected absolute returns, Borealis Infrastructure and Oxford Properties exceeded expected performance levels; however,
OMERS Strategic Investments returns were below the benchmark. While OMERS Capital Markets and OMERS Private Equity returns were below the
benchmarks, returns were within or exceeded our absolute performance expectations. Results for each entity are further discussed in the MD&A section of
this Annual Report.
Compensation Decisions
When determining compensation, the HRC ensures there is a strong link between executive compensation and actual performance achieved. Given the
2012 performance results, the HRC approved the STIP performance factor of 162.3 per cent for the CEO, which resulted in actual STIP awards reported in
the charts below. For the 2010 LTIP award that matured on December 31, 2012, the three-year pre-determined performance measures resulted in a LTIP
performance factor of 90.7 per cent, which recognized the investment returns over the three-year period. The 2010 LTPP award measured performance
against the growth in third-party assets over the three-year period. The resulting payment was 55.6 per cent of target, as the fi rst close of the GSIA initiative
occurred in 2012. The HRC believes that the compensation awarded to the Named Executive Offi cers closely refl ects the actual performance of OMERS
and continues to emphasize executive retention as well as supporting the OMERS pay-for-performance philosophy.

75 2012 Annual Report OMERS Administration Corporation
Summary Compensation Table
The table below represents disclosure of salary, short-term incentives, long-term incentives, employer portion of pension contributions, and other
compensation paid to or earned by each Named Executive Offi cer during the three most recently completed fi nancial years. To align with disclosure rules
set out by the Canadian Securities Administrators (CSA) the compensation reported in each respective year represents what was awarded to each Named
Executive Offi cer for their contribution and performance. It is important to note that all numbers below have been restated to conform to this methodology
as prescribed by the CSA.
Non-Equity Incentive Compensation ($)
Name and Principal Position Year Salary ($)
Short -Term Incentive
Plan
Long-Term Incentive
Plan (i)
Long-Term Performance
Plan (i)Pension
Value ($) (ii)All Other
Compensation ($)Total
Compensation ($)
Michael NobregaPresident & CEO
2012 $515,000 $1,044,806 $1,287,500 $386,250 $158,175 $95,697 $3,487,428
2011 $515,000 $777,263 $1,287,500 $386,250 $145,715 $95,652 $3,207,380
2010 $515,000 $1,179,496 $1,287,500 $386,250 $276,707 $90,573 $3,735,526
Patrick CrowleyChief Financial Offi cer
2012 $438,000 $613,200 $547,500 n/a $102,454 $28,693 $1,729,847
2011 $438,000 $600,000 $547,500 n/a $95,261 $29,462 $1,710,223
2010 $438,000 $613,200 $547,500 n/a $152,824 $31,531 $1,783,055
Michael LatimerExecutive Vice President & Chief Investment Offi cer
2012 $500,000 $1,100,000 $1,250,000 n/a $149,124 $105,422 $3,104,546
2011 $500,000 $1,000,000 $1,250,000 n/a $112,009 $105,186 $2,967,195
2010 $500,000 $1,100,000 $1,250,000 n/a $214,257 $122,638 $3,186,895
Blake Hutcheson (iii)
President & CEO, Oxford Properties Group
2012 $475,000 $950,000 $1,025,000 n/a $42,750 $98,085 $2,590,835
2011 $475,000 $950,000 $1,025,000 n/a $42,750 $98,066 $2,590,816
2010 $435,417 $755,105 $1,025,000 n/a $39,188 $66,868 $2,321,578
Michael Rolland President & CEO, Borealis Infrastructure
2012 $438,000 $830,000 $1,095,000 n/a n/a $71,531 $2,434,531
2011 $438,000 $812,769 $1,095,000 n/a n/a $71,066 $2,416,835
2010 $438,000 $841,377 $1,095,000 n/a n/a $67,537 $2,441,914
(i) The amounts shown represent the value of awards as of the grant date in each calendar year.
(ii) Represents the employer contributions to the Plan and employer contributions to third-party providers of defi ned contribution pension plans.
(iii) In addition to the compensation reported above, Mr. Hutcheson was awarded a one-time payment of $475,000 in 2010, 2011 and 2012 to replace income that would be forfeited or foregone as a result of his change of employers.
Compensation Discussion and Analysis

76 OMERS Administration Corporation 2012 Annual Report
OMERS Administration Corporation
Incentive Plan Awards
Long-term Incentive awards are granted at the start of the fi scal year and paid out at the end of the vesting period. The following table presents the
outstanding long-term incentive awards and most recent payments for each Named Executive Offi cer.
Name Year Type of Award Award Target Value ($) Award Maximum Value ($) Actual Value at Payout ($)
Michael NobregaPresident & CEO
2012 LTPP $386,250 n/a
2012 LTIP $1,287,500 $2,575,000
2011 LTPP $386,250 n/a
2011 LTIP $1,287,500 $2,575,000
2010 LTPP $386,250 n/a $214,583
2010 LTIP $1,287,500 $2,575,000 $1,168,265
Patrick CrowleyChief Financial Offi cer
2012 LTIP $547,500 $1,095,000
2011 LTIP $547,500 $1,095,000
2010 LTIP $547,500 $1,095,000 $496,796
Michael LatimerExecutive Vice President & Chief Investment Offi cer
2012 LTIP $1,250,000 $2,500,000
2011 LTIP $1,250,000 $2,500,000
2010 LTIP $1,250,000 $2,500,000 $1,134,238
Blake HutchesonPresident & CEO, Oxford Properties Group
2012 LTIP $1,025,000 $1,691,000
2011 LTIP $1,025,000 $1,691,000
2010 LTIP $1,025,000 $1,691,000 $1,655,375
Michael Rolland President & CEO, Borealis Infrastructure
2012 LTIP $1,095,000 $2,190,000
2011 LTIP $1,095,000 $2,190,000
2010 LTIP $1,095,000 $2,190,000 $2,142,915
The 2010 LTIP awards matured at the end of 2012 and were paid out, leaving the 2011 and 2012 LTIP awards outstanding. All LTIP awards vest and mature
on December 31st of the third year of the plan.

77 2012 Annual Report OMERS Administration Corporation
Defi ned Benefi t Pension Plan
The table below represents disclosure of estimated pension information for the Named Executive Offi cers as at December 31, 2012.
Annual Benefi ts Payable ($)
Name
Number of
Years Credited
Service (#) At Year End At Age 65
Opening Present
Value of Defi ned
Benefi t Obligation ($)
Compensatory
Change ($)
Non-Compensatory
Change ($)
Closing Present
Value of Defi ned
Benefi t Obligation ($)
Michael NobregaPresident & CEO
5.808 $272,795 n/a $3,040,327 $290,969 $311,085 $3,642,381
Patrick Crowley (i)
Chief Financial Offi cer11.660 $147,760 $215,959 $1,397,583 $232,891 $236,506 $1,866,980
Michael LatimerExecutive Vice President & Chief Investment Offi cer
7.843 $172,731 $256,920 $1,831,229 $294,032 $231,480 $2,356,741
(i) Mr. Crowley purchased additional years of credited service in 2010 of 3.833 years and 1.750 years in 2012.
Defi ned Contribution Pension Plan
The table below shows the pension information for the Named Executive Offi cer participating in the organization’s defi ned contribution pension arrangement
as at December 31, 2012.
Name Name of the ArrangementAccumulated Value
at Start of Year ($) Compensatory ($)Accumulated Value
at Year End ($)
Blake Hutcheson President & CEO, Oxford Properties Group
DC Plan $49,246 $28,179 $77,425
DC SERP $38,276 $21,764 $60,040
Total $87,522 $49,943 $137,465
Termination Benefi ts
The treatment under each of the termination scenarios is governed by the terms of the various incentive plans, which are summarized in the following table.
Short-term Incentive Plan Long-term Incentive Plan Long-term Performance Plan
Resignation Forfeited Forfeited Forfeited
Retirement Entitled to a partial award, pro-rated to refl ect the period of active employment
Entitled to a partial award, pro-rated to refl ect the period of active employment
Entitled to a full award which will mature in normal course
Termination without Cause Entitled to a partial award, pro-rated to refl ect the period of active employment
Entitled to a partial award, pro-rated to refl ect the period of active employment
Entitled to a partial award, pro-rated to refl ect the period of active employment
Termination with Cause Forfeited Forfeited Forfeited
Conclusion
All OMERS employees are committed to delivering realistic risk-adjusted returns over the long term to meet the pension promise to Plan members. The
approach to executive compensation motivates executives to achieve OMERS strategic objectives prudently by encouraging an appropriate balance
between risk and reward. OMERS remains committed to ensuring our compensation policies and programs support our talent management strategy to
continue to attract, engage and retain high performing people who will produce the results that deliver value to our Plan members.
Compensation Discussion and Analysis

78 OMERS Administration Corporation 2012 Annual Report
OMERS Administration Corporation
Responsibilities of Management, Actuary and Independent AuditorsThe OMERS Administration Corporation (OAC) is the administrator of the OMERS pension plans (the OMERS Pension Plans) as defi ned in the Ontario
Municipal Employees Retirement System Act, 2006 (the OMERS Act). The OMERS Pension Plans include OMERS Primary Pension Plan (the Primary Plan or
the Plan), which includes the Defi ned Benefi t and the Additional Voluntary Contribution (AVC) components, and the Retirement Compensation Arrangement
(the RCA) associated with the Plan and the OMERS Supplemental Pension Plan for Police, Firefi ghters and Paramedics (the Supplemental Plan). OAC is
responsible for managing the funds of the Plan, the RCA and the Supplemental Plan (collectively, the Funds). As at December 31, 2012, membership in the
Supplemental Plan was nil.
The consolidated fi nancial statements of OAC have been prepared by Management and approved by the Board of the OAC (the OAC Board). Management
is responsible for the contents of the consolidated fi nancial statements and the fi nancial information contained within the Annual Report.
Management maintains systems of internal controls and supporting procedures that are designed to ensure the integrity and fairness of the data presented,
that transactions are duly authorized and that assets are adequately safeguarded. These controls include clear division of responsibilities, accountability for
performance, timely communication of policies and procedures throughout the organization and high standards in the hiring and training of employees. In
addition, Corporate Audit Services reviews OAC’s systems of internal controls to determine whether these controls are appropriate and operating effectively.
The OAC Board is responsible for approving the annual consolidated fi nancial statements. The Audit Committee, which is comprised of directors who are
not offi cers or employees of OAC, assists the OAC Board in executing this responsibility. The Audit Committee meets regularly with Management and the
internal and external auditors to review the scope and timing of their respective audits as well as to review any internal control or fi nancial reporting issues
and their resolution. The Audit Committee reviews the annual consolidated fi nancial statements and recommends them to the OAC Board for approval.
The independent actuary is appointed by the OAC Board. It is the independent actuary’s responsibility to carry out annual valuations of the accrued
pension obligations of the OMERS Pension Plans in accordance with accepted actuarial practice and to report thereon to the OAC Board. The Member
Services Committee assists the OAC Board in executing this responsibility. The results of the independent actuary’s valuation are set out in the Actuarial
Opinion. In performing the valuation, the independent actuary values the benefi ts provided under the OMERS Pension Plans using appropriate assumptions
about future economic conditions (such as infl ation, salary increases and investment returns) and demographic factors (such as mortality, termination rates
and retirement ages). These assumptions take into account the circumstances of OAC and its active, inactive and retired members.
The independent auditors are also appointed by the OAC Board. Their responsibility is to report to the OAC Board whether in their opinion the consolidated
statements of fi nancial position as at December 31, 2012 and 2011 and the consolidated statements of changes in net assets available for benefi ts and the
statements of changes in pension obligations for the years ended December 31, 2012 and 2011 present fairly in all material respects the fi nancial position,
the changes in net assets available for benefi ts and changes in pension obligations in accordance with Canadian accounting standards for pension plans.
The independent auditors have full and unrestricted access to Management and the Audit Committee to discuss any fi ndings arising from their audit related
to the integrity of fi nancial reporting and the adequacy of internal control systems on which they rely for the purposes of their audit. The auditors’ report
outlines the scope of their examination and opinion.
Based on my knowledge, the Annual Report does not contain any untrue statement of a material fact, or omit to state a material fact, that is necessary to
make a statement not misleading in light of the circumstances under which it was made, with respect to the period covered by this Annual Report.
Based on my knowledge, the annual fi nancial statements, together with the other fi nancial information included in this Annual Report, fairly present in all
material respects the fi nancial position, changes in net assets available for benefi ts and changes in pension obligations of OAC as of the date and for the
periods presented in this Annual Report.
Michael Nobrega
President and Chief Executive Offi cer
Patrick G. Crowley
Executive Vice President and Chief Financial Offi cer
Toronto, Canada
February 21, 2013
79 2012 Annual Report OMERS Administration Corporation
Actuarial Opinion
We conducted actuarial valuations as at December 31, 2012 of the OMERS Primary Pension Plan (the Primary Plan) and the Retirement Compensation
Arrangement for the OMERS Primary Pension Plan (the RCA) administered by OMERS Administration Corporation (the OAC). The Primary Plan consists of a
defi ned benefi t component and an additional voluntary contribution (AVC) component. The purpose of the valuations is to fairly present the actuarial funded
status of the Primary Plan and the RCA as at December 31, 2012, for inclusion in this Annual Report in accordance with Section 4600 of the Canadian
Institute of Chartered Accountants Handbook Part IV.
The results of the actuarial valuation of the Primary Plan disclosed total going concern actuarial liabilities of $69,292 million in respect of benefi ts accrued
for service to December 31, 2012 (comprising $69,122 million with respect to the defi ned benefi t component and $170 million with respect to the AVC
component). The actuarial assets at that date were $59,368 million (comprising $59,198 million with respect to the defi ned benefi t component and
$170 million with respect to the AVC component), indicating a going concern actuarial defi cit of $9,924 million. Ongoing adequacy of the Primary Plan’s
contribution rates will need to be monitored to ensure that future contributions, together with the Primary Plan assets and future investment earnings
thereon, will be suffi cient to provide for its future benefi ts.
The RCA provides for pension benefi ts in excess of the maximum pension benefi ts under the Primary Plan. The RCA is not fully pre-funded. The actuarial
liability in respect of RCA benefi ts accrued for service to December 31, 2012 (determined using assumptions consistent with those used for the Primary
Plan except that the discount rate is adjusted to approximate the effect of the 50 per cent refundable tax under the RCA), net of the RCA assets, was
$477 million. Contributions, based on the top-tier Primary Plan contribution rates, are payable to the RCA on the excess of earnings over a defi ned
earnings threshold. The funding of the RCA is managed on a modifi ed pay-as-you go basis and monitored to ensure that the fund will have suffi cient
assets to provide for the projected benefi t payments over the 20-year period following each valuation date.
The actuarial valuations of the Primary Plan and the RCA as at December 31, 2012 were conducted using the Unit Credit Actuarial Cost Method with
projection of earnings and membership data as at December 1, 2012 and fi nancial information as at December 31, 2012 supplied by the OAC. The
December 1, 2012 membership data was adjusted, among other things, for the following:
• actual infl ationary increases to pensions in payment and deferred pension payments effective January 1, 2013,
• estimated credited service accruals in 2012, and
• estimated earnings for 2012.
We reviewed the data for reasonableness and consistency with the data provided in prior years. In our opinion,
• the membership data are suffi cient and reliable for the purpose of the valuations;
• the assumptions adopted were set with reference to the Primary Plan’s funding policy and with allowance for refundable taxes under the RCA
and are appropriate for the purpose of the valuations; and
• the methods employed in the valuations are appropriate for the purpose of the valuations.
The future experience of the Primary Plan and the RCA may differ from the actuarial assumptions, resulting in gains or losses which will be revealed
in future valuations.
The valuations were prepared and our opinions are given in accordance with accepted actuarial practice in Canada.
Respectfully submitted
Towers Watson Canada Inc.
Ian Markham
Fellow, Canadian Institute of Actuaries
Philip A. Morse
Fellow, Canadian Institute of Actuaries
Toronto, Canada
February 21, 2013

80 OMERS Administration Corporation 2012 Annual Report
OMERS Administration Corporation
Independent Auditors’ Report
To the Board of OMERS Administration Corporation
We have audited the accompanying consolidated fi nancial statements of OMERS Administration Corporation and its subsidiaries, which comprise the
consolidated statements of fi nancial position as at December 31, 2012 and 2011 and the consolidated statements of changes in net assets available for
benefi ts and changes in pension obligations for the years then ended, and the related notes, which comprise a summary of signifi cant accounting policies
and other explanatory information.
Management’s responsibility for the consolidated fi nancial statements
Management is responsible for the preparation and fair presentation of these consolidated fi nancial statements in accordance with Canadian accounting
standards for pension plans, and for such internal control as management determines is necessary to enable the preparation of fi nancial statements that
are free from material misstatement, whether due to fraud or error.
Auditor’s responsibility
Our responsibility is to express an opinion on these consolidated fi nancial statements based on our audits. We conducted our audits in accordance with
Canadian generally accepted auditing standards. Those standards require that we comply with ethical requirements and plan and perform the audits to
obtain reasonable assurance about whether the consolidated fi nancial statements are free from material misstatement.
An audit involves performing procedures to obtain audit evidence about the amounts and disclosures in the consolidated fi nancial statements. The
procedures selected depend on the auditor’s judgment, including the assessment of the risks of material misstatement of the consolidated fi nancial
statements, whether due to fraud or error. In making those risk assessments, the auditor considers internal control relevant to the entity’s preparation and
fair presentation of the consolidated fi nancial statements in order to design audit procedures that are appropriate in the circumstances, but not for the
purpose of expressing an opinion on the effectiveness of the entity’s internal control. An audit also includes evaluating the appropriateness of accounting
policies used and the reasonableness of accounting estimates made by management, as well as evaluating the overall presentation of the consolidated
fi nancial statements.
We believe that the audit evidence we have obtained in our audits is suffi cient and appropriate to provide a basis for our audit opinion.
Opinion
In our opinion, the consolidated fi nancial statements present fairly, in all material respects, the fi nancial position of OMERS Administration Corporation as at
December 31, 2012 and 2011 and the changes in its net assets available for benefi ts and changes in its pension obligations for the years then ended in
accordance with Canadian accounting standards for pension plans.
Chartered Accountants, Licensed Public Accountants
Toronto, Ontario
February 21, 2013

81 2012 Annual Report OMERS Administration Corporation
Consolidated Statement of Financial Position
(millions)
As at December 31, 2012 2011
Net Assets Available For Benefi ts
Assets
Investments (note 3) $ 72,355 $ 64,058
Other investment assets (notes 3 and 5) 366 332
Amounts due from pending trades (note 3) 487 375
Contributions receivable
Employers 121 114
Members 121 114
Other assets 79 65
Total Assets 73,529 65,058
Liabilities
Investment liabilities (notes 3 and 6) 11,249 8,802
Due to administered funds 905 828
Amounts payable from pending trades (note 3) 492 261
Other liabilities 116 84
Total Liabilities 12,762 9,975
Net Assets Available for Benefi ts $ 60,767 $ 55,083
Accrued Pension Obligation And Defi cit
Primary Plan (note 7)
Defi ned benefi t component
Accrued pension obligation $ 69,122 $ 64,548
Defi cit
Funding defi cit (9,924) (7,290)
Actuarial value adjustment of net assets 1,321 (2,337)
(8,603) (9,627)
60,519 54,921
Additional Voluntary Contributions component pension obligation 170 94
60,689 55,015
Retirement Compensation Arrangement (note 8)
Accrued pension obligation 555 504
Defi cit (477) (436)
78 68
Accrued Pension Obligation and Defi cit $ 60,767 $ 55,083
The accompanying notes to the fi nancial statements are an integral part of these consolidated fi nancial statements.
Signed on behalf of the Board of OMERS Administration Corporation:
Rick Miller
OAC Chair
Monty Baker
Chair, Audit Committee
Consolidated Financial Statements

82 OMERS Administration Corporation 2012 Annual Report
OMERS Administration Corporation
Consolidated Statement of Changes in Net Assets Available for Benefi ts
(millions)
For the year ended December 31, 2012 2011
Changes Due to Investment Activities (note 9)
Investment income $ 2,352 $ 2,103
Changes in fair values of investment assets and
liabilities and derivatives 3,192 (455)
Investment management expenses (note 13 (b)) (265) (264)
Income allocated to administered funds (79) (21)
5,200 1,363
Changes Due to Pension Activities
Contributions (note 11)
Employers 1,523 1,317
Members 1,580 1,362
Transfers in 40 41
Additional Voluntary Contributions 67 93
3,210 2,813
Benefi ts (note 12)
Payments (2,485) (2,193)
Transfers out (185) (190)
(2,670) (2,383)
Pension administrative expenses (note 13 (a)) (56) (59)
484 371
Total Increase 5,684 1,734
Net assets available for benefi ts, beginning of year 55,083 53,349
Net Assets Available for Benefi ts, End of Year $ 60,767 $ 55,083
The accompanying notes to the fi nancial statements are an integral part of these consolidated fi nancial statements.

83 2012 Annual Report OMERS Administration Corporation
Consolidated Financial Statements
Statement of Changes in Pension Obligations
(millions)
For the year ended December 31, 2012 2011
OMERS Primary Pension Plan (note 7)
Defi ned Benefi t Component
Accrued pension obligation, beginning of year $ 64,548 $ 60,035
Interest accrued on benefi ts 4,193 3,904
Benefi ts accrued 2,561 2,434
Benefi ts paid (note 12) (2,654) (2,375)
Experience losses 474 560
Changes in actuarial assumptions and methods - (10)
Accrued pension obligation, end of year 69,122 64,548
Additional Voluntary Contributions Component
Additional Voluntary Contributions obligation, beginning of year 94 -
Contributions (note 11) 67 93
Withdrawals (note 12) (4) (1)
Attributed net investment income 13 2
Additional Voluntary Contributions obligation, end of year 170 94
Accrued Pension Obligation, End of Year $ 69,292 $ 64,642
(millions)
For the year ended December 31, 2012 2011
Retirement Compensation Arrangement (note 8)
Accrued pension obligation, beginning of year $ 504 $ 468
Interest accrued on benefi ts 16 15
Benefi ts accrued 24 24
Benefi ts paid (note 12) (12) (7)
Experience losses 34 4
Change in RCA provisions (11) -
Accrued Pension Obligation, End of Year $ 555 $ 504
The accompanying notes to the fi nancial statements are an integral part of these consolidated fi nancial statements.

84 OMERS Administration Corporation 2012 Annual Report
OMERS Administration Corporation
Description of Plans Administered by OMERS Administration Corporation
OMERS Administration Corporation (OAC) is a corporation without share capital under the Ontario Municipal Employees Retirement System Act, 2006
(the OMERS Act). OAC is the administrator of the OMERS pension plans (the OMERS Pension Plans) as defi ned in the OMERS Act and trustee of the
pension funds. As trustee, OAC holds legal title to the pension fund assets and the trust benefi ciaries are primarily Plan members. The OMERS Pension
Plans include OMERS Primary Pension Plan (the Primary Plan or the Plan), the Retirement Compensation Arrangement (the RCA) associated with the Plan
and the OMERS Supplemental Pension Plan for Police, Firefi ghters and Paramedics (the Supplemental Plan). OAC is responsible for administrating the
Plans and investing the funds of the Plan, the RCA and the Supplemental Plan (collectively, the Funds), in accordance with the Pension Benefi ts Act
(Ontario) (the PBA), the Income Tax Act (Canada) (the Income Tax Act or the ITA), and the OMERS Act. Under the OMERS Act, the OMERS Sponsors
Corporation (the SC) is the sponsor of the OMERS Pension Plans.
These fi nancial statements include the fi nancial position, changes in net assets available for benefi ts and changes in pension obligations for OAC and
the OMERS Pension Plans.
The accrued pension obligations of any of the OMERS Pension Plans cannot be funded by the assets of either of the other two OMERS Pension Plans.
As at December 31, 2012, there were no members in the Supplemental Plan.
OMERS Primary Pension Plan
The Plan is a multi-employer jointly sponsored pension plan, created in 1962 by an Act of the Ontario Legislature, whose members are mainly employees of
Ontario municipalities, local boards, public utilities and non-teaching school board staff. The Plan is governed by the OMERS Act and the benefi t provisions
and other terms of the Plan are set out in the Plan text. The Plan consists of both the defi ned benefi t component and the Additional Voluntary Contributions
(AVCs) component.
The Plan is registered with the Financial Services Commission of Ontario (FSCO) and the Canada Revenue Agency (CRA) under Registration #0345983.
Attributes of the defi ned benefi t component of the Primary Plan include:
a) Funding – The defi ned benefi t component of the Primary Plan is funded by equal contributions from participating employers and members and by the
investment earnings of the Plan assets. Contribution rates for the defi ned benefi t component are set by the SC and are determined in accordance with
the OMERS Act, the ITA and the PBA.
b) Pensions – The normal retirement age (NRA) is 65 years for all Plan members, except police offi cers and fi refi ghters, who generally have a normal
retirement age of 60 years. The normal retirement pension is calculated using a member’s years of credited service and two per cent of the annual
average earnings during the member’s highest 60 consecutive months of earnings. The Plan benefi ts are integrated with the Canada Pension Plan
at age 65.
c) Death Benefi ts – Death benefi ts are available to a surviving spouse, eligible dependent children or designated benefi ciary upon the death of a member.
Depending upon eligibility requirements, the benefi ts may be paid in the form of a survivor pension, lump sum payment or both.
d) Withdrawals and Transfers from the Plan – Subject to locking in provisions, a member that has terminated employment prior to eligibility to retire has the
option to withdraw or transfer a lump sum equivalent value of his/her benefi ts from the Plan to another retirement savings vehicle.
e) Escalation of Pensions – Pension benefi ts are increased for infl ation through an annual adjustment equal to 100 per cent of the increase in the average
Consumer Price Index (CPI) from the prior year. This is subject to a limit of six per cent in any one year. If the increase in the average CPI exceeds the
six per cent limit, any excess is carried forward to future years.
f) Disability Pensions – A disability pension is available at any age to a member who becomes totally disabled as defi ned by the Plan. The pension
is calculated using a member’s years of credited service and the annual average earnings during the member’s highest 60 consecutive months of
earnings consistent with a standard pension. Disability pensions continue until normal retirement or until the member is able to return to work.
g) Income Taxes – The Plan is a Registered Pension Plan as defi ned in the Income Tax Act and as such is not subject to income taxes for contributions or
investment income received. The operations of certain entities holding private equity, infrastructure or real estate investments may be taxable.
Notes to Consolidated Financial StatementsYear ended December 31, 2012
NOTE 1

85 2012 Annual Report OMERS Administration Corporation
Description of Plans Administered by OMERS Administration Corporation (continued)
The Plan also contains a component enabling members to make Additional Voluntary Contributions on which the member receives the net investment return
of the defi ned benefi t component of the Plan. For the AVC component of the Plan the only liability of OAC is the members’ contributions plus/minus the net
investment income or loss of the Plan.
Funds in an AVC account can be fully withdrawn when members retire or leave their OMERS employer (subject to any locking-in requirements); however,
while a member is active, withdrawals are limited to a maximum of 20 per cent of the previous year-end balance, subject to a minimum of $500. As well,
withdrawals are permitted only from March 1 to April 30 of each year.
Retirement Compensation Arrangement
The RCA is an arrangement that provides pension benefi ts for individuals with earnings exceeding the amount that generates the maximum pension
allowed by the ITA. It is a separate trust arrangement and is not governed by the PBA and is not a registered plan under the ITA. The RCA is governed by
the OMERS Act and is funded by equal contributions from participating employers and members and by the investment earnings of the RCA fund.
Contributions are determined to ensure that the RCA fund has suffi cient amounts to pay projected benefi ts for 20 years from the actuarial valuation date.
The RCA net assets available for benefi ts are invested and accounted for separately from the Plan and the Supplemental Plan, and the accrued pension
obligation of the RCA is valued separately from the Plan and Supplemental Plan accrued pension obligations.
OMERS Supplemental Pension Plan for Police, Firefi ghters and Paramedics
The Supplemental Plan became effective on July 1, 2008, pursuant to the requirements of the OMERS Act. The Supplemental Plan is a separately funded,
jointly sponsored, multi-employer pension plan that provides supplemental pension benefi ts that “top up” those available under the Plan for members of the
Plan who are employed in the police and fi re sectors which, as defi ned in the OMERS Act, includes paramedics. The Supplemental Plan is governed by the
OMERS Act and the benefi t provisions and other terms of the Supplemental Plan are set out in the plan text. The Supplemental Plan is registered with FSCO
and with CRA under Registration #1175892.
The Supplemental Plan is a contributory defi ned benefi t pension plan funded by equal contributions from participating employers and members and by
the investment earnings of the Supplemental Plan assets. Contribution rates are set by the SC. Participation in the Supplemental Plan is effective only upon
agreement between an employee group and an employer. As at December 31, 2012 and 2011, the Supplemental Plan had no assets and no members.
Neither the Plan nor the RCA is permitted to pay costs for the Supplemental Plan. As such, until March 31, 2018, unless the Supplemental Plan has
suffi cient funds based on the administrative portion of contributions, any administrative costs of the Supplemental Plan are funded through a start up
grant from the Province of Ontario.
NOTE 1
Notes to consolidated Financial Statements

86 OMERS Administration Corporation 2012 Annual Report
OMERS Administration Corporation
Summary of Signifi cant Accounting Policies
Basis of Presentation
OAC follows the requirements of the Canadian Institute of Chartered Accountants (CICA) Handbook Section 4600 – Pension Plans, which is the basis for
Canadian accounting standards for pension plans. The recognition and measurement of OAC assets and liabilities are consistent with the requirements of
CICA Section 4600. For accounting policies that do not relate to its investment portfolio or pension obligations, OAC follows the requirements of International
Financial Reporting Standards.
These fi nancial statements include the fi nancial position, changes in net assets available for benefi ts and changes in pension obligations of OAC and the
OMERS Pension Plans. Investments are managed by the following entities: OMERS Capital Markets (which is primarily responsible for investing in publicly
traded interest bearing and equity investments as well as commercial mortgages and private debt investments); OMERS Private Equity (which manages
private equity investments); Borealis Infrastructure (which manages infrastructure investments); Oxford Properties Group (which manages real estate
assets); and OMERS Strategic Investments (which manages strategic investments across all asset classes) (collectively the Investment Entities). In
accordance with CICA 4600, the consolidated fi nancial statements present the assets and liabilities of the Investment Entities on a consolidated basis
and the fair value of investments on a non-consolidated basis even where OAC has effective control over the operations of that investment.
Inter-company transactions and balances between OAC and the Investment Entities of OAC are eliminated in arriving at the consolidated fi nancial statements.
Certain comparative fi gures have been restated to conform to the current year’s presentation.
Use of Estimates
The preparation of consolidated fi nancial statements requires Management to make estimates and assumptions that affect the reported values of assets
and liabilities, income and expenses, accrued pension obligations and related disclosures. Actual results could differ from these estimates. Signifi cant
estimates included in the consolidated fi nancial statements relate to the valuation of investments and the determination of the accrued pension obligation.
NOTE 2

87 2012 Annual Report OMERS Administration Corporation
Summary of Signifi cant Accounting Policies (continued)
Investments
The Funds’ investments consist of the following major asset classes: public markets (which include public equities and interest bearing investments such
as treasury bills, bonds, mortgages and private debt), private equity, infrastructure and real estate.
In 2011, the CICA introduced International Financial Reporting Standard 13 – Fair Value Measurement. This standard defi nes fair value and sets out a
framework for measuring fair value. It is effective for annual periods beginning on or after January 1, 2013; however, early adoption is permitted. OAC
has chosen to early adopt the requirements of IFRS 13 for the period beginning January 1, 2011.
All investment transactions are recorded at the point when the risks and rewards of ownership are transferred. Purchases and sales of publicly traded
investments are recorded as of the trade date.
Investments are stated at fair value. Fair value is the price that would be received to sell an asset or paid to transfer a liability in an orderly transaction
between market participants at the measurement date. It is best evidenced by a quoted closing market price in an active market, if one exists.
The determination of fair value is based on market conditions at a specifi c point in time and may not be refl ective of future fair values.
Fair value may be determined by reference to a market index, publicly observable market data or through the use of valuation techniques and models
which utilize assumptions based on information that is not publicly observable. Where a public market price in an active market is not available for an
investment asset or liability, a suitable method of valuation is used annually by OAC Management (Management) to determine fair value. Valuation
techniques used include the use of discounted cash fl ows, earnings multiples, prevailing market rates for instruments with similar characteristics or other
pricing models, as appropriate. In these cases the fair value may differ signifi cantly when varying assumptions are used. Accredited independent external
valuation experts are required to perform a review of Management’s valuations to determine the reasonableness of the valuations for each signifi cant
private market investment at least once every three years or in any year where the valuation changes by more than fi fteen per cent from the prior year.
The difference between the value of an asset or liability at the time it was acquired and its current fair value takes into account changes in market rates and
credit risk of the issuer that have occurred since original acquisition. Unrealized appreciation/depreciation in the fair value of investments is the change in
fair value adjusted for cash fl ows recognized during the year and is refl ected in net investment income/loss in the Consolidated Statement of Changes in
Net Assets Available for Benefi ts.
Investment Income/Loss
Investment income/loss includes accrued interest, dividends and real estate rental income. Gains and losses that have been realized on the disposal of
investments and the unrealized appreciation/depreciation required to adjust investments to their fair value are added to investment income to arrive at total
investment income.
Income is recognized as interest and real estate rental income is earned, as dividends or distributions are declared, as investments are disposed and as
investments are adjusted to their fair value.
NOTE 2
Notes to consolidated Financial Statements

88 OMERS Administration Corporation 2012 Annual Report
OMERS Administration Corporation
Summary of Signifi cant Accounting Policies (continued)
Transaction and Pursuit Costs
Transaction and pursuit costs which include broker commissions, legal and other professional fees incurred as a part of the due diligence of a potential or
completed transaction are expensed to total investment income as incurred.
External Manager Fees
Base external manager fees for portfolio management are expensed in investment management expenses as incurred. Performance fees which are
contractually due to external managers for superior investment returns and fees for pooled funds where OAC’s investment return from the Fund is net of
fees are expensed in investment income as incurred.
Investment Liabilities
Investment liabilities include commercial paper, debentures, mortgages and other debt obligations incurred by OAC to acquire an investment, primarily in
the real estate and infrastructure asset classes. Investment liabilities also include the Funds’ liability to return cash collateral received in securities lending
transactions as well as the amounts payable in respect of securities sold under agreements to repurchase (Repo Agreements). The fair value of investment
liabilities is estimated using discounted cash fl ows based on current market yields, except for items that are short-term in nature for which cost plus
accrued interest approximates fair value.
Liabilities incurred in entities in which OAC has invested are netted as part of investment assets, even when the investment is in an entity over which OAC
has effective control or can exercise signifi cant infl uence.
Amounts Due/Payable from Pending Trades
For securities transactions, the fair value of amounts due from pending trades and amounts payable from pending trades approximate their carrying
amounts due to their short-term nature. For derivative contracts, unrealized gains and losses are included in amounts due/payable from pending trades.
Foreign Currency Translation
Certain investments are denominated in foreign currencies. The fair values of such investments are translated into Canadian dollars at the year-end rate of
exchange. Unrealized foreign exchange gains and losses arising from this translation are included in net gain/loss on investments. Once a foreign currency
denominated investment is sold, the realized foreign exchange gain or loss based on the settlement is recognized in realized gains/losses.
Due to Administered Funds
Under contractual agreements and with the approval of the Government of Ontario, OAC invests funds on behalf of The Board of Trustees of Ryerson
University, the Minister of Energy for the Province of Ontario (The Ontario Hydro Guarantee Fund) and the Transit Windsor Fund. OAC is authorized under
the terms of the various agreements to recover expenses for administering such funds.
The amount due to administered funds is credited with income based upon their proportionate interest in the Plan’s net investment income and the balance
refl ects the Plan’s obligation to return funds to the administered funds.
NOTE 2

89 2012 Annual Report OMERS Administration Corporation
Summary of Signifi cant Accounting Policies (continued)
Accrued Pension Benefi ts and Accrued Pension Obligation
The value of the accrued pension obligation of the Plan’s defi ned benefi t component is based on a projected accrued benefi ts method (pro-rated on
service) actuarial valuation prepared by an independent fi rm of actuaries. This accrued pension obligation is measured in accordance with accepted
actuarial practice in Canada using actuarial assumptions and methods adopted by OAC for the purpose of establishing the long-term funding requirements
of the Plan. The actuarial valuation included in the consolidated fi nancial statements is consistent with the valuation for funding purposes.
The AVC pension obligation represents OAC’s liability to repay AVC contributions including a pro-rata share of investment income or losses.
The valuation methodology used in the estimation of the accrued pension obligation of the RCA is developed on a basis consistent with the accrued
benefi t obligation of the Plan’s defi ned benefi t component. The AVC pension obligation and the accrued pension obligation of the RCA are separate
from the accrued pension obligation of the Primary Plan’s defi ned benefi t component.
Actuarial Value of Net Assets and Actuarial Value Adjustment
The actuarial value of net assets for the Plan is used in assessing the funding position of the Plan, including the determination of contribution rates.
The actuarial value adjustment to the fair value of net assets is the amount of net investment returns above or below the actuarial long-term rate of return
assumption that are being smoothed and recognized over a fi ve-year period. The fair value of net assets is adjusted by the unrecognized actuarial
value adjustment to arrive at the actuarial value of net assets.
Surplus/Defi cit
For fi nancial statement reporting, the surplus/defi cit of the Plan is based on the difference between the fair value of the Plan net assets available for benefi ts
and the Plan accrued pension obligation. For funding purposes, the Plan surplus/defi cit is based on the difference between the Plan actuarial value of net
assets and the Plan accrued pension obligation. For the RCA, the surplus/defi cit for both fi nancial statement reporting and funding purposes is based on
the difference between the fair value of RCA net assets available for benefi ts and the RCA accrued pension obligation.
Contributions
Contributions from employers and members due to the OMERS Pension Plans as at the end of the year are recorded on an accrual basis. Service
purchases that include, but are not limited to, leaves of absence and conversion of normal retirement age and transfers from other pension plans are
recorded and service is credited when the purchase amount is received. Contributions for AVCs are recorded when the contribution is received.
Benefi ts
Benefi t payments to retired members are recorded as they are due, at the fi rst of each month. Commuted value payments and transfers to other pension
plans are recorded in the period in which OAC is notifi ed. Accrued benefi ts for active members are recorded as part of the accrued pension obligation.
Administrative Expenses
Administrative expenses are incurred for direct pension administration, direct investment management and corporate services and are recorded on an
accrual basis. Direct pension administration expenses represent expenses to provide direct services to OMERS members and employers. Direct investment
management expenses represent expenses of the Investment Entities managing OMERS investments. Corporate services expenses primarily include
corporate information systems, accounting, legal and other governance expenses incurred to support either the pension administration or the investment
management functions. These are allocated between pensions and investments based on an estimate of the use of resources.
Approval of the Financial Statements
These fi nancial statements were approved by the Board of Directors on February 21, 2013.
NOTE 2
Notes to consolidated Financial Statements

90 OMERS Administration Corporation 2012 Annual Report
OMERS Administration Corporation
Investments
Investments by Fair Value and Cost
Total investments, before allocating the effect of derivative contracts, and investment related assets and liabilities are as follows:
(millions)
As at December 31, 2012 2011
Fair Value Cost Fair Value Cost
Public Market Investments
Interest Bearing Investments
Cash and short-term deposits (i) $ 7,973 $ 7,973 $ 6,120 $ 6,120
Bonds and debentures (ii) 10,112 9,677 10,173 9,522
Real return bonds 4,128 3,707 1,743 1,266
Mortgages and private debt (iii) (iv) 1,640 1,577 1,695 1,583
23,853 22,934 19,731 18,491
Public Equity (iv)
Canadian public equities 1,823 1,737 2,177 2,153
Non-Canadian public equities 11,796 10,902 10,246 9,750
13,619 12,639 12,423 11,903
Total Public Market Investments 37,472 35,573 32,154 30,394
Private Equity (v)
Canadian private equities (vi) (vii) 3,718 3,453 3,827 3,295
Non-Canadian private equities 3,747 3,767 3,926 4,114
Total Private Equity Investments 7,465 7,220 7,753 7,409
Infrastructure Investments (v) 11,572 10,305 9,635 8,807
Real Estate Investments 15,846 13,595 14,516 13,014
Total Investments 72,355 66,693 64,058 59,624
Investment Related Assets
Other investment assets (note 5) 366 494 332 501
Amounts due from pending trades 487 277 375 64
853 771 707 565
Investment Related Liabilities
Investment liabilities (note 6) (11,249) (10,984) (8,802) (8,560)
Amounts payable from pending trades (492) (196) (261) (73)
(11,741) (11,180) (9,063) (8,633)
Net Investment Assets $ 61,467 $ 56,284 $ 55,702 $ 51,556
(i) Includes restricted cash of $92 million (2011: $86 million), treasury bills of $442 million (2011: $400 million) and term deposits of $162 million (2011: $187 million).
(ii) Includes non-Canadian bonds and debentures with a fair value of $905 million (2011: $289 million).
(iii) Includes mortgages with a fair value of $1,390 million (2011: $1,235 million).
(iv) Includes externally managed investments of $4,638 million (2011: $5,482 million).
(v) Investment assets are net of long-term debt incurred in entities where OAC has effective control as presented in note 6 (a).
(vi) Includes resource properties with a total fair value of $495 million (2011: $660 million).
(vii) Includes venture capital of $117 million (2011: $5 million).
NOTE 3

91 2012 Annual Report OMERS Administration Corporation
Investments (continued)
The Funds’ net investment assets by Investment Entity responsible for managing the Funds’ investments are as follows:
(millions)
As at December 31, 2012
OMERS Capital Markets
OMERS Private Equity
Borealis Infrastructure
Oxford Properties
Group
OMERS Strategic
Investments Total
Investment assets $ 37,136 $ 6,016 $ 11,501 $ 16,182 $ 1,520 $ 72,355
Allocation of cash and other (291) - 70 210 11 -
Investment related assets 575 6 34 236 2 853
Investment related liabilities (2,396) (29) (1,785) (7,514) (17) (11,741)
Net Investment Assets $ 35,024 $ 5,993 $ 9,820 $ 9,114 $ 1,516 $ 61,467
(millions)
As at December 31, 2011
OMERS Capital Markets
OMERS Private Equity
Borealis Infrastructure
Oxford Properties
Group
OMERS Strategic
Investments Total
Investment assets $ 31,990 $ 6,230 $ 9,515 $ 14,679 $ 1,644 $ 64,058
Allocation of cash and other (1,004) 94 674 223 13 -
Investment related assets 474 9 11 210 3 707
Investment related liabilities (1,103) - (1,203) (6,741) (16) (9,063)
Net Investment Assets $ 30,357 $ 6,333 $ 8,997 $ 8,371 $ 1,644 $ 55,702
NOTE 3
Notes to consolidated Financial Statements

92 OMERS Administration Corporation 2012 Annual Report
OMERS Administration Corporation
Investments (continued)
Investment Valuation Practices
Fair values are based on quoted prices in an active market or, where such pricing is not available, fair value is estimated using observable market inputs
such as interest rates, quoted prices of comparable securities or unobservable inputs such as Management assumptions.
Fair values are determined as follows:
a) Short-term deposits are recorded at amortized cost, which together with accrued interest income approximates fair value.
b) Bonds and debentures, real return bonds and public equities are valued at year-end quoted market prices, where available. For public equities the
quoted market prices are based on exchange prices while bonds and real return bonds are based on quotes from industry standard sources. For
public market investments where quoted market prices are not available such as mortgages and private debt, estimated values are calculated using
discounted cash fl ows based on current market yields for comparable securities, independent asset appraisals, and fi nancial analysis. Externally
managed hedge funds where details of individual securities are not maintained by the Fund are valued based on values provided by the fund manager.
c) Private market investments include investments in private equity, infrastructure and real estate assets, held either directly or as a limited partner, which
generally do not have a publicly available market price. For private market investments, the completion of a purchase or sale of an identical or similar
investment is often the most objective determination of fair value. While not exact, valuation procedures are able to provide estimates or identify likely
ranges that a reasonable counterparty would pay for such assets.
The Funds’ private market investments are valued as follows:
• For investments that have reasonably predictable future revenue streams or that derive their value based on property or commodity values,
the valuation is derived by:
• discounting projected future cash fl ows of an investment using discount rates which refl ect the risk inherent in the projected cash fl ows.
Discount rates and projected cash fl ows are based on internal assumptions and external inputs.
• assessing the investment assets against the value of comparable publicly listed entities.
• For non-operating and/or start-up directly held private investments, the value may be held at cost where cost is considered the best estimate of fair
value, until there is evidence to support a change in valuation.
• The fair value of a private fund investment where OAC’s ability to access information on underlying individual fund investments is restricted, such
as under the terms of a limited partnership agreement, is equal to the value provided by the fund’s general partner unless there is a specifi c and
objectively verifi able reason to vary from the value provided by the general partner.
d) Fair value of derivatives, including swap, futures, option and forward contracts, are determined using quoted market prices, where available, or
discounted cash fl ows using current market yields, where quoted market prices are not available.
Investment Fair Value Hierarchy
Fair value measurements of investment assets and liabilities are based on inputs from one or more levels of a fair value hierarchy as follows:
Level 1
Fair value is based on unadjusted quoted prices in active markets for identical assets or liabilities traded in active markets. Level 1 primarily includes
publicly listed equity investments.
Level 2
Fair value is based on valuation methods that make use of inputs, other than quoted prices included within Level 1, that are observable by market participants
either directly through quoted prices for similar but not identical assets or indirectly through observable market information used in valuation models.
Level 2 primarily includes debt securities and derivative contracts not traded on a public exchange and public equities not traded in an active market.
Level 3
Fair value is based on valuation methods where inputs that are based on non-observable market data have a signifi cant impact on the valuation. Level 3
primarily includes mortgages and private market investments valued based on discounted future cash fl ow models, comparable publicly listed entities,
or sales of similar entities which refl ect assumptions that a market participant would use when valuing such an asset or liability.
NOTE 3

93 2012 Annual Report OMERS Administration Corporation
Investments (continued)
Net investment assets based on the valuation level within the fair value hierarchy are as follows:
(millions)
As at December 31, 2012 Level 1 Level 2 Level 3 Total
Public Market Investments
Interest Bearing Investments
Cash and short-term deposits $ 567 $ 7,406 $ - $ 7,973
Bonds and debentures - 10,112 - 10,112
Real return bonds - 4,128 - 4,128
Mortgages and private debt - - 1,640 1,640
567 21,646 1,640 23,853
Public equity 9,816 88 59 9,963
Public fund investments - 2,856 800 3,656
Total Public Market Investments 10,383 24,590 2,499 37,472
Private Equity Investments
Direct investments 42 273 5,170 5,485
Fund investments - - 1,980 1,980
Total Private Equity Investments 42 273 7,150 7,465
Infrastructure Investments - - 11,572 11,572
Real Estate Investments - - 15,846 15,846
Total Investments 10,425 24,863 37,067 72,355
Investment Related Assets
Other investment assets - 96 270 366
Amounts due from pending trades (i) 347 131 9 487
347 227 279 853
Investment Related Liabilities
Debt - (3,434) (5,027) (8,461)
Payables under securities lending program - (933) - (933)
Securities sold under repurchase agreements - (842) - (842)
Other payables and liabilities (255) (12) (746) (1,013)
Amounts payable from pending trades (i) (227) (127) (138) (492)
(482) (5,348) (5,911) (11,741)
Net Investment Assets $ 10,290 $ 19,742 $ 31,435 $ 61,467
(i) Includes fair value of derivatives.
NOTE 3
Notes to consolidated Financial Statements

94 OMERS Administration Corporation 2012 Annual Report
OMERS Administration Corporation
Investments (continued)
(millions)
As at December 31, 2011 Level 1 Level 2 Level 3 Total
Public Market Investments
Interest Bearing Investments
Cash and short-term deposits $ 296 $ 5,094 $ 730 $ 6,120
Bonds and debentures - 10,173 - 10,173
Real return bonds - 1,743 - 1,743
Mortgages and private debt - - 1,695 1,695
296 17,010 2,425 19,731
Public equity 9,400 - 135 9,535
Public fund investments - 2,608 280 2,888
Total Public Market Investments 9,696 19,618 2,840 32,154
Private Equity Investments
Direct investments 31 484 4,541 5,056
Fund investments - - 2,697 2,697
Total Private Equity Investments 31 484 7,238 7,753
Infrastructure Investments - - 9,635 9,635
Real Estate Investments - - 14,516 14,516
Total Investments 9,727 20,102 34,229 64,058
Investment Related Assets
Other investment assets - 99 233 332
Amounts due from pending trades (i) 54 321 - 375
54 420 233 707
Investment Related Liabilities
Debt - (3,441) (3,798) (7,239)
Payables under securities lending program - (845) - (845)
Other payables and liabilities (50) (10) (658) (718)
Amounts payable from pending trades (i) (54) (143) (64) (261)
(104) (4,439) (4,520) (9,063)
Net Investment Assets $ 9,677 $ 16,083 $ 29,942 $ 55,702
(i) Includes fair value of derivatives.
NOTE 3

95 2012 Annual Report OMERS Administration Corporation
Investments (continued)
The Level 3 classifi cation includes all assets and liabilities related to investments valued based on non-observable market data. Where the investment
asset is being valued as an entity, the Level 3 category includes the fair value of that entity. In addition, where the investment asset is hedged against
foreign currency gains and losses, the impact of the hedging activity is included in the valuation.
The following table presents the changes in the fair value measurements in Level 3 of the fair value hierarchy:
(millions)
Fair Value Dec 31, 2011
Total Gain/(Loss)
Included in Net Income
Transfers In (Out) (i)
Contributed Capital
Capital Returned (ii)
Fair Value Dec 31, 2012
Unrealized Gains/Losses Attributable
to Investments Held at Dec 31, 2012 (iii)
Mortgages and private debt $ 1,695 $ 12 $ - $ 172 $ (239) $ 1,640 $ 16
Public equity investments 135 13 (88) 20 (21) 59 12
Public fund investments 280 35 - 765 (280) 800 9
Private equity-direct investments 4,537 466 46 754 (675) 5,128 231
Private equity-fund investments 2,791 132 - 203 (1,142) 1,984 (54)
Infrastructure investments 9,405 993 (46) 1,717 (1,400) 10,669 468
Real estate investments 13,715 479 - 1,395 (661) 14,928 500
Real estate fund investments 445 23 - 55 (33) 490 23
Debt (3,061) (130) - 267 (1,339) (4,263) (2)
Total $ 29,942 $ 2,023 $ (88) $ 5,348 $ (5,790) $ 31,435 $ 1,203
(millions)
Fair Value Dec 31, 2010
Total Gain/(Loss)
Included in Net Income
Transfers In (Out) (i)
Contributed Capital
Capital Returned (ii)
Fair Value Dec 31, 2011
Unrealized Gains/Losses Attributable
to Investments Held at Dec 31, 2011(iii)
Mortgages and private debt $ 1,882 $ (25) $ - $ 104 $ (266) $ 1,695 $ (25)
Public equity investments 96 18 - 56 (35) 135 35
Public fund investments 290 9 - - (19) 280 9
Private equity-direct investments 3,143 220 61 1,418 (305) 4,537 164
Private equity-fund investments 3,258 144 - 342 (953) 2,791 (61)
Infrastructure investments 9,293 682 (61) 550 (1,059) 9,405 288
Real estate investments 11,877 251 - 1,724 (137) 13,715 251
Real estate fund investments 418 (46) - 85 (12) 445 (46)
Debt (2,154) (147) - 157 (917) (3,061) (43)
Total $ 28,103 $ 1,106 $ - $ 4,436 $ (3,703) $ 29,942 $ 572
(i) Represents amounts transferred between assets classes, the net amount $(88) million represents a private investment that became publically traded in 2012.
(ii) Includes return of realized hedging gains. Prior to 2012 the cumulative realized and unrealized gains and losses from hedging private markets foreign currency denominated holdings were recorded as part of the valuation of such assets. Effective 2012, only the unrealized hedging gains and losses are recorded as part of the valuation of such assets.
(iii) Amount represents unrealized market value adjustments recorded during the year which are included in the valuation of assets held at year end only.
NOTE 3
Notes to consolidated Financial Statements

96 OMERS Administration Corporation 2012 Annual Report
OMERS Administration Corporation
Investments (continued)
Fair Value Assumptions and Sensitivity
Level 3 fi nancial instruments are valued using internal models and the resulting valuations are signifi cantly affected by non-observable inputs, the most
signifi cant of which is the discount rate as the discount rate refl ects both current interest rates as well as the uncertainty of future cash fl ows from the
investment.
The discount rate is composed of two elements, a risk-free rate, which is the return that would be expected from a secure, virtually risk-free investment,
such as a high quality government bond, plus a risk premium that compensates for the relative level of risk associated with a particular investment. The
selected discount rates are chosen to be consistent with the risk inherent in the stream of cash fl ows to which they are applied.
Discount Rate MethodologiesDiscount Rate Ranges as at December 31, 2012
Mortgage and Private Debt investments A base rate derived from a risk-free rate yield curve plus credit spread. 1.7% to 5.1%
Private equity – direct investments Implied values from similar publicly traded entities or sales of similar entities or risk-free rate adjusted for the risk inherent in projected future cash fl ows.
8.6% to 20.6%
Infrastructure investments Risk-free rate adjusted for the risk inherent in projected future cash fl ows. 8.7% to 16.7%
Real estate investments Risk-free rate adjusted for the risk inherent in projected future cash fl ows and recent sales of similar properties.
6.1% to 10.3%
The following hypothetical analysis illustrates the sensitivity of the Level 3 valuations to reasonably possible alternative discount rate assumptions for
asset categories where such reasonably possible alternative assumptions would change the fair value signifi cantly. The alternative discount rates below
are based on the volatility of the respective asset classes. The impact to the valuation from such changes to the discount rate has been calculated
independently of the impact of changes in other key variables. In actual experience, a change in the discount rate may be the result of changes in a
number of underlying assumptions which could amplify or reduce the impact on the valuation.
As at December 31, 2012
Increase/(Decrease) in Discount Rate (basis points)
(Decrease)/Increase in Net Investment Assets (millions)
Private equity - direct investments 70 $ 339
Infrastructure investments 20 180
Real estate investments 25 325
Total Impact on Net Investment Assets $ 844
As at December 31, 2011
Increase/(Decrease) in Discount Rate (basis points)
(Decrease)/Increase in Net Investment Assets (millions)
Private equity - direct investments 60 $ 230
Infrastructure investments 20 180
Real estate investments 25 300
Total Impact on Net Investment Assets $ 710
The fair value of public market, private equity and real estate fund investments where OAC does not have access to the underlying investment information
is based on the value provided by the general partner or other external manager and therefore, in the absence of specifi c information to support deviating
from this value, no other reasonably possible alternative assumptions could be applied.
NOTE 3

97 2012 Annual Report OMERS Administration Corporation
Investments (continued)
Signifi cant Investments
The Funds held investments, each having a fair value or cost exceeding one per cent of the fair value or cost of net investment assets, as follows:
2012 2011
(millions)
As at December 31,
Number of Investments Fair Value Cost
Number of Investments Fair Value Cost
Public market investments 1 $ 702 $ 680 3 $ 1,707 $ 1,662
Private market investments 13 13,408 11,898 14 12,011 11,158
14 $ 14,110 $ 12,578 17 $ 13,718 $ 12,820
Public market investments where the individual issue has a cost or fair value exceeding one per cent of the cost or fair value of net investment assets
include an investment in a Provincial Government interest bearing security.
Private market investments having a cost or fair value exceeding one per cent of the cost or fair value of net investment assets include a limited partnership
interest in Bruce Power; ownership interests in Teranet, Oncor, Associated British Ports, Midland Cogeneration Venture, Scotia Gas Networks, HS1, LifeLabs
and CEDA; and real estate ownership interests in Yorkdale Shopping Centre located in Ontario, the Richmond Adelaide Complex located in Ontario,
Centennial Place located in Alberta and Green Park Business Park located in Reading, England.
The effective date of the most recent valuation for the above listed investments was December 31, 2012.
Investment Risk
OAC is exposed to a variety of investment risks as a result of its investment activities. Formal policies and procedures govern the management of investment
risk (market, credit and liquidity risk) across the organization. The objective of investment risk management is to minimize unanticipated losses, to optimize
the reward-risk trade-off for the Funds and to enhance the ability of the Plans to meet their respective obligations.
Investment Entity and asset managers are responsible for understanding the extent of investment risk in the various strategies and assets that they manage.
Furthermore, they must ensure that the returns from those strategies and assets are commensurate with the risks involved. Investment risk is managed
through various policies including policies which establish a target asset mix between public market and private market investments. Within public market
investments, policies establish targets between interest bearing and public equity investments and within private markets investments, policies establish
targets among private equity, infrastructure and real estate investments to ensure diversifi cation across and within asset classes. OAC utilizes analytical and
reporting tools to manage investment risk and achieve its desired level of risk at the enterprise, public market and private market levels. In addition,
derivative fi nancial instruments are used, where appropriate, to assist in the management of these risks (note 4).
a) Market Risk
Market risk is the risk that the value of an investment will fl uctuate as a result of changes in market conditions, whether those changes are caused by
factors specifi c to the individual investment or factors affecting all securities traded in the market. Market risk encompasses a variety of fi nancial risks,
such as foreign currency risk, interest rate risk and price risk. Signifi cant volatility in interest rates, equity values and the value of the Canadian dollar
against the currencies in which our investments are held can impact the value of OAC investments and the funded status of the OMERS Pension Plans.
OAC uses various investment strategies such as diversifi cation, hedging and the use of derivative instruments to mitigate the various forms of market
risk. In addition, investment exposure in various assets and markets are monitored daily.
NOTE 3
Notes to consolidated Financial Statements

98 OMERS Administration Corporation 2012 Annual Report
OMERS Administration Corporation
Investments (continued)• Foreign Currency Risk
Investments denominated in currencies other than the Canadian dollar expose the Funds to fl uctuations in foreign exchange rates. Fluctuations in the
relative value of the Canadian dollar against these foreign currencies can result in a positive or a negative effect on the fair value of investments. OAC
has currency exposure management programs under which it hedges foreign currency exposure through the use of foreign exchange forward contracts.
OAC also may make active investments in foreign currencies with the objective of adding value. The net exposure to foreign currencies represents
12 per cent (2011: 15 per cent) of net investment assets at December 31, 2012.
OAC’s total currency exposure before the impact of currency hedging and trading activities, the impact of hedging and trading activities and the net
currency exposure are as follows:
(millions Canadian dollar equivalent)
As at December 31,
2012 Fair Value By Currency
2011Fair Value By Currency
Total Exposure (i)
Hedging/ Trading
Activities Net Exposure % of TotalTotal
Exposure (i)
Hedging/ Trading
Activities Net Exposure % of Total
Canada $ 43,078 $ 11,154 $ 54,232 88% $ 37,000 $ 10,717 $ 47,717 85%
United States 10,489 (5,927) 4,562 7% 10,846 (5,341) 5,505 10%
Euro Countries 1,887 (1,250) 637 1% 1,606 (1,398) 208 0%
United Kingdom 4,368 (3,861) 507 1% 3,454 (2,822) 632 1%
Japan 364 (52) 312 1% 726 (402) 324 1%
Other Pacifi c 574 (64) 510 1% 936 (377) 559 1%
Emerging Markets 392 29 421 1% 538 (155) 383 1%
Other Europe 315 (29) 286 0% 596 (222) 374 1%
$ 61,467 $ - $ 61,467 100% $ 55,702 $ - $ 55,702 100%
(i) Currency exposure before the impact of currency hedging and trading activities.
Foreign Currency Sensitivity
After giving effect to the impact of hedging and trading activities and with all other variables and underlying values held constant, a ten per cent
increase/decrease in the value of the Canadian dollar against major foreign currencies would result in an approximate decrease/increase in the Funds’
net assets available for benefi ts and an unrealized (loss)/gain as noted below:
(millions Canadian dollar equivalent)
As at December 31, 2012 2011
CurrencyChange in value of
Canadian Dollar Unrealized gain/loss Unrealized gain/loss
United States +/- 10% -/+ $ 456 -/+ $ 551
Euro Countries +/- 10% -/+ 64 -/+ 21
United Kingdom +/- 10% -/+ 51 -/+ 63
Other +/- 10% -/+ 153 -/+ 164
-/+ $ 724 -/+ $ 799
NOTE 3

99 2012 Annual Report OMERS Administration Corporation
Investments (continued)• Interest Rate Risk
Interest rate risk refers to the effect on the fair value of the Funds’ assets and liabilities due to fl uctuations in interest rates. Due to the discount rate
methodology employed to determine the accrued pension obligation, the accrued pension obligation is not materially impacted by short-term
fl uctuations in interest rates. The impact to the Fund’s assets from a change in interest rates will be mitigated as the impact on the valuation of investment
assets is generally opposite from the impact on investment liabilities. The interest bearing investment portfolio has guidelines on concentration and
duration which are also designed to mitigate the risk of changes in interest rates.
The term to maturity classifi cations of interest bearing investments, based upon the contractual maturity of the securities, are as follows:
(millions)
As at December 31, 2012 2011
Within 1 Year
1 to 5 Years
Over 5 Years Total
Average Effective
Yield (i) Total
Average Effective
Yield (i)
Cash and short-term deposits $ 7,973 $ - $ - $ 7,973 1.12% $ 6,120 1.07%
Bonds and debentures 609 4,025 5,478 10,112 2.37% 10,173 1.76%
Real return bonds (ii) 26 50 4,052 4,128 -0.06% 1,743 0.26%
Mortgages and private debt 205 545 890 1,640 3.20% 1,695 3.22%
$ 8,813 $ 4,620 $ 10,420 $ 23,853 1.59% $ 19,731 1.54%
(i) Average effective yield represents the weighted average rate required to discount future contractual cash fl ows to current market value.
(ii) Real return bond yields are based on real interest rates. The ultimate yield will be impacted by infl ation as it occurs.
After giving effect to derivative contracts (note 4), OAC debt liabilities and amounts payable under OAC securities lending programs and securities sold
under repurchase agreements (note 6), a one per cent increase/decrease in nominal interest rates, with all other variables held constant, would result in
an approximate decrease/increase in the value of net interest bearing investments and an unrealized (loss)/gain of $443 million (2011: $579 million).
Similarly, a one per cent increase/decrease in real interest rates would result in an approximate decrease/increase in the value of real return bonds and
an unrealized (loss)/gain of $668 million (2011: $326 million).
• Price Risk
Price risk is the risk that the fair value of a fi nancial instrument will fl uctuate because of changes in market prices (other than those arising from foreign
currency risk or interest rate risk) whether those changes are caused by factors specifi c to the individual fi nancial instrument, its issuer, or factors
affecting all similar fi nancial instruments traded in the market. OAC is subject to price risk through its public equity investments and, in addition to
geographic, industrial sector and entity specifi c analysis, uses strategies such as diversifi cation and the use of derivative instruments to mitigate the
overall impact of price risk. OAC’s private market investments are also subject to price risk as they are impacted by many general and specifi c market
variables.
After giving effect to derivative contracts, a ten per cent increase/decrease in the value of all public equity and private market investments would result in
an approximate increase/decrease in the value of public and private market exposure and an unrealized gain/(loss) as noted below:
(millions)
As at December 31, 2012 2011
Change in market prices Unrealized gain/loss Unrealized gain/loss
Canadian public equities +/- 10% +/- $ 504 +/- $ 379
Non-Canadian public equities +/- 10% +/- 1,316 +/- 1,020
Private Market Investments +/- 10% +/- 2,468 +/- 2,359
+/- $ 4,288 +/- $ 3,758
NOTE 3
Notes to consolidated Financial Statements

100 OMERS Administration Corporation 2012 Annual Report
OMERS Administration Corporation
Investments (continued)b) Credit Risk
Credit risk is the risk of loss arising from the failure of a counterparty to honour its fi nancial obligations with OAC, including its inability or unwillingness
to pay borrowed principal, interest or rent when they come due. Credit risk can also lead to losses when issuers and debtors are downgraded by credit
rating agencies, usually leading to a fall in the market value of the debtors’ obligations. OAC has put in place investment policies and procedures that
have established investment criteria designed to manage credit risk by setting limits to credit exposure from individual corporate entities and by requiring
collateral where appropriate. The credit quality of fi nancial assets is generally assessed by reference to external credit ratings, where available, or to
historical information about counterparty default rates. Credit risk associated with derivative fi nancial instruments is discussed in note 4.
OAC’s most signifi cant credit risk exposure arises from its interest bearing investments. The Funds’ interest bearing investments exposed to credit risk
are as follows:
(millions)
As at December 31, 2012 2011
Credit Quality (i)Interest Bearing
Investments % of TotalInterest Bearing
Investments % of Total
Federal governments (ii) AAA $ 8,279 35% $ 6,233 32%
Provincial governments A to AAA 3,310 14% 3,323 17%
Municipal AAA 22 0% 22 0%
Corporate
Investment grade
AAA- to AAA 278 1% 301 2%
AA- to AA+ 7,267 31% 5,680 29%
A- to A+ 1,283 5% 1,128 6%
BBB- to BBB+ 1,428 6% 1,461 7%
Non-investment grade 527 2% 461 2%
Securities lending cash collateral 933 4% 845 4%
Cash on deposit 526 2% 277 1%
$ 23,853 100% $ 19,731 100%
(i) Based on average rating of major credit rating agencies.
(ii) Includes Canadian and U.S. federal governments.
NOTE 3

101 2012 Annual Report OMERS Administration Corporation
Investments (continued)• Securities Lending Program
OAC participates in a securities lending program where it lends securities that it owns to third parties for a fee. For securities lent, the Fund receives a
fee and the borrower provides cash or readily marketable securities of higher value as collateral which mitigates the credit risk associated with the
program. As at December 31, 2012, securities with an estimated fair value of $2,154 million (2011: $2,101 million) were loaned out, while collateral held
had an estimated fair value of $2,234 million (2011: $2,182 million) of which $933 million (2011: $845 million) was cash collateral invested in short-term
interest bearing investments.
c) Liquidity Risk
Liquidity risk describes the Fund’s ability to manage fi nancial liability related cash requirements in a timely and cost-effective manner. OAC has
developed forward looking liquidity risk models which are used on a periodic basis to assess the impact of tactical and strategic initiatives on Fund
liquidity.
OAC’s primary future liabilities include the accrued pension obligation of the Plan (note 7) and the RCA (note 8) and debt fi nancing investments (note 6).
The contractual undiscounted principal and interest repayments and term to maturity of the investment liabilities are disclosed in note 6.
In the normal course of business, OAC enters into contracts that give rise to commitments for future payments which may also impact our liquidity (note 16).
The cash requirements to meet these liabilities are managed using net investment income from public and private investments (note 9), contributions
made by both members and employers (note 11), net of administrative expenses (note 13), and through investing in assets which may be effi ciently
converted to cash in both normal and stressed market conditions.
Another part of liquidity risk is OAC’s ability to cover its commercial paper issuance. OAC is authorized to issue up to $3,100 million in commercial paper
to help fi nance future investment opportunities. OAC holds at least 1.5 times the authorized size of the commercial paper program in high quality liquid
assets.
NOTE 3
Notes to consolidated Financial Statements

102 OMERS Administration Corporation 2012 Annual Report
OMERS Administration Corporation
Derivative Financial InstrumentsDerivative fi nancial instruments are fi nancial contracts, the value of which is derived from changes in underlying assets or indices. Derivative transactions
are conducted in over-the-counter markets directly between two counterparties or on regulated exchange markets.
Derivative fi nancial instruments are used, when appropriate, to manage the Funds’ asset mix and to assist in managing the exposure to market risk by
increasing or decreasing foreign currency, interest rate and price risk, without directly purchasing or selling the underlying assets or currencies. In certain
circumstances, derivatives are also used to increase returns or to replicate investments synthetically.
Derivative Contracts
Swaps
Swaps are contractual agreements between counterparties to exchange a series of cash fl ows. The swap agreements entered into by the Funds are as follows:
• Interest Rate Swaps – contractual agreements to exchange fi xed and/or fl oating interest payments based on notional amounts.
• Equity Swaps – contractual agreements to exchange the return on an equity security or a group of equity securities for the return based on a fi xed or
fl oating interest rate or the return on another equity security or group of equity securities.
• Bond Swaps – contractual agreements to exchange the return on a bond or a bond index for the return based on a fi xed or fl oating interest rate.
• Commodity Swaps – contractual agreements to exchange the return on a commodity index for the return based on a fi xed or fl oating interest rate.
Forwards and Futures
Forwards and futures are contractual agreements between counterparties to either buy or sell a specifi ed amount of a currency, commodity or interest
bearing fi nancial instrument or index at a specifi c price and date in the future. The forward contracts entered into by OAC are as follows:
• Bond Forward Contracts – contractual agreements to buy or sell bonds or a bond index at a specifi ed price and date in the future.
• Foreign Exchange Forward Contracts – contractual agreements to exchange one currency for another at a specifi ed price for settlement on a
predetermined date in the future.
Futures are transacted in standardized amounts on regulated exchanges and are subject to daily cash margining. The futures contracts that OAC
enters into are as follows:
• Equity Index Futures Contracts – agreements to either buy or sell a specifi ed equity index at a specifi ed price and date in the future.
• Commodity/Bond Futures Contracts – agreements to either buy or sell a commodity/bond index at a specifi ed price and date in the future.
Options
Options are contractual agreements that convey to the purchaser the right but not the obligation to either buy or sell a specifi ed amount of a currency,
commodity or interest bearing fi nancial instrument or index at a fi xed future date or at any time within a fi xed future period. The seller receives a premium
from the purchaser for this right. Options may be transacted on a regulated exchange or in the over-the-counter market.
• Swaptions – contractual agreements that convey to the purchaser the right but not the obligation to enter into or cancel a swap agreement at a fi xed
future date or at any time within a fi xed future period. The seller receives a premium from the purchaser for this right.
NOTE 4

103 2012 Annual Report OMERS Administration Corporation
Derivative Financial Instruments (continued)
Market Risk
Derivative instruments are subject to market risk. Market risk arises from potential adverse changes in the value of derivative instruments as a result
of changes in the underlying market variables. These underlying market variables may include the absolute and relative levels of interest rates, foreign
exchange rates, equity and commodity prices and their implied volatilities. Market risks, including derivative investments, are discussed in note 3.
Credit Risk
The Funds are exposed to credit-related losses in the event of non-performance by counterparties to derivative fi nancial instruments. The credit risk
associated with derivatives is normally a small amount relative to the notional amount of the derivative instrument. In order to mitigate this risk, the Funds:
• deal only with highly rated counterparties, normally major fi nancial institutions with minimum credit standard of “A” rating, as supported by a recognized
credit rating agency; and
• arrange credit risk mitigation in the form of periodic prepayments of the fair value of contracts.
Credit risk represents the maximum amount that would be at risk as at the reporting date if the counterparties failed to perform under the contracts and if
the right of offset proved to be non-enforceable. Credit risk exposure on derivative fi nancial instruments is represented by the replacement cost receivable
of contracts with counterparties, less any prepayment collateral or margin received, as at the reporting date.
Credit risk on futures contracts is minimal as the counterparty is an exchange rather than a corporate entity and contracts are marked to market and margin
receivables and payables are settled in cash daily.
NOTE 4
Notes to consolidated Financial Statements

104 OMERS Administration Corporation 2012 Annual Report
OMERS Administration Corporation
Derivative Financial Instruments (continued)The following summarizes the Funds’ derivative portfolio and related credit exposure:
(millions)
As at December 31, 2012 2011
Fair Value (ii) Fair Value (ii)
Notional Value (i) Assets (iii) Liabilities Notional Value (i) Assets (iii) Liabilities
Interest Rate Contracts
Interest rate swap contracts $ 1,935 $ 19 $ (42) $ 2,332 $ 11 $ (66)
Swaption written 126 - (1) - - -
Swaption purchased 294 1 - - - -
Bond index swap contracts 806 6 (1) 904 10 (2)
Bond futures 2,983 - (7) 80 1 -
Bond options written 996 - - - - -
Bond options purchased 996 1 - 66 1 -
8,136 27 (51) 3,382 23 (68)
Equity Contracts
Equity index futures contracts 5,519 70 (27) 5,167 20 (13)
Equity index swap contracts 1,295 23 (1) 663 10 (3)
Equity options written - - - 941 - (18)
Equity options purchased - - - 531 22 -
6,814 93 (28) 7,302 52 (34)
Commodity Contracts
Commodity futures contracts 945 4 - 48 1 -
Commodity swap contracts 96 - - 190 - -
Commodity options written - - - 25 - -
Commodity options purchased 3 - - 23 - -
1,044 4 - 286 1 -
Foreign Exchange
Currency futures 513 - - - - -
Currency options written 76 - - - - -
Currency options purchased 52 - - - - -
Foreign exchange forward contracts 23,644 89 (220) 19,038 267 (109)
24,285 89 (220) 19,038 267 (109)
Total $ 40,279 $ 213 $ (299) $ 30,008 $ 343 $ (211)
(i) Notional value represents the contractual amount to which a rate or price is applied in order to calculate the exchange of cash fl ows and is therefore not recorded in the consolidated fi nancial statements. Notional amounts do not necessarily indicate the amounts of future cash fl ows or the current fair value of the derivative contracts and, therefore, do not necessarily indicate the Plan’s exposure to credit or market risks.
(ii) Fair value represents unrealized gains or losses from derivative contracts which are recorded in the consolidated statement of fi nancial position based on the fair value of the derivative contract. Fair value represents the cost of replacing all outstanding contracts under current market conditions. Contracts with a positive fair value are recorded as part of amounts due from pending trades. Contracts with a negative fair value are recorded as part of amounts payable from pending trades.
(iii) The fair value of derivative contracts recorded as an asset represents the credit risk replacement cost or the loss to which the Funds are exposed should counterparties fail to perform under the derivative contracts. The amounts do not take into consideration legal contracts that permit offsetting of positions or any collateral which may be held.
NOTE 4

105 2012 Annual Report OMERS Administration Corporation
Derivative Financial Instruments (continued)The term to maturity based on notional value is as follows:
(millions)
As at December 31, 2012 2011
Within 1 Year
1 to 5 Years
Over 5 Years Total
Within 1 Year
1 to 5 Years
Over 5 Years Total
Interest rate Contracts $ 6,422 $ 1,527 $ 187 $ 8,136 $ 1,493 $ 1,852 $ 37 $ 3,382
Equity contracts 6,814 - - 6,814 7,302 - - 7,302
Commodity contracts 1,044 - - 1,044 286 - - 286
Foreign Exchange contracts 24,285 - - 24,285 19,038 - - 19,038
$ 38,565 $ 1,527 $ 187 $ 40,279 $ 28,119 $ 1,852 $ 37 $ 30,008
The term to maturity based on the fair value is as follows:
(millions)
As at December 31, 2012 2011
Within 1 Year
1 to 5 Years
Over 5 Years Total
Within 1 Year
1 to 5 Years
Over 5 Years Total
Interest rate contracts $ 4 $ (32) $ 4 $ (24) $ 11 $ (58) $ 2 $ (45)
Equity contracts 65 - - 65 18 - - 18
Commodity contracts 4 - - 4 1 - - 1
Foreign Exchange contracts (131) - - (131) 158 - - 158
$ (58) $ (32) $ 4 $ (86) $ 188 $ (58) $ 2 $ 132
NOTE 5
Other Investment Assets Other investment assets are comprised of operational accounts receivable, accrued income and other assets related to private equity, infrastructure
and real estate investments.
(millions)As at December 31, 2012 2011
Investment receivables $ 220 $ 197
Deferred assets, prepaid and other 146 135
Other investment assets $ 366 $ 332
NOTE 4
Notes to consolidated Financial Statements

106 OMERS Administration Corporation 2012 Annual Report
OMERS Administration Corporation
Investment LiabilitiesThe liabilities incurred by OAC in investment related activities are as follows:
(millions)
As at December 31, 2012 2011
Debt (a) $ 8,461 $ 7,239
Payable under securities lending program (b) 933 845
Securities sold under repurchase agreements (c) 842 -
Payables and other liabilities 1,013 718
Total $ 11,249 $ 8,802
a) Debt is comprised of the following:
(millions)
As at December 31, 2012 2011
Fair Value CostWeighted Average
Interest Rate Fair Value CostWeighted Average
Interest Rate
Oxford Properties Group
Secured debt (i) $ 4,298 $ 4,189 3.18% $ 3,175 $ 3,092 3.81%
Series A debentures (ii) - - - 520 500 1.49%
Series C debentures (iii) 404 400 1.42% 414 400 1.56%
Series D debentures (iv) 224 200 2.37% 226 200 2.51%
ORCH debentures (v) 185 170 2.06% 188 170 2.15%
ORCH Two debentures (vi) 186 180 1.63% 190 180 1.65%
5,297 5,139 2.92% 4,713 4,542 3.14%
Borealis Infrastructure
Secured debt (vii) 763 759 2.13% 738 735 2.50%
OMERS Finance Trust (viii)
Oxford Properties Group
commercial paper 1,551 1,551 1,447 1,447
Borealis Infrastructure
commercial paper 849 849 341 341
Other 1 1 - -
2,401 2,401 1.12% 1,788 1,788 1.10%
Total (ix) $ 8,461 $ 8,299 2.34% $ 7,239 $ 7,065 2.57%
(i) Includes mortgages and other secured debt with various terms to maturity up to 2027 with each debt instrument secured by a specifi c real estate asset.
(ii) OMERS Realty Corporation Series A 5.48% Debentures issued December 4, 2002, matured December 31, 2012.
(iii) OMERS Realty Corporation Series C 4.09% Debentures issued May 8, 2008, maturing June 4, 2013.
(iv) OMERS Realty Corporation Series D 4.74% Debentures issued May 8, 2008, maturing June 4, 2018.
(v) OMERS Realty CTT Holdings Inc. Series A 4.75% Debentures issued May 5, 2009, maturing May 5, 2016.
(vi) OMERS Realty CTT Holdings Two Inc. Series A 4.05% Debentures issued May 5, 2009, maturing May 5, 2014.
(vii) Includes secured debt with various terms to maturity up to 2015 with each debt secured by a specifi c infrastructure asset.
(viii) OMERS Finance Trust’s Commercial Paper program is authorized up to $3,100 million. Commercial Paper outstanding has maturities from January 2, 2013 to March 22, 2013.
(ix) Scheduled undiscounted principal and interest repayments for the fi ve years subsequent to December 31, 2012 and thereafter are as follows:
NOTE 6

107 2012 Annual Report OMERS Administration Corporation
Investment Liabilities (continued)(millions)
2013 $ 4,342
2014 578
2015 803
2016 1,099
2017 753
Thereafter 1,473
$ 9,048
Investment assets where OAC has effective control are presented in the Statement of Financial Position on a non-consolidated basis at fair value. These
investments typically incur third-party debt, which is non-recourse to OAC. The cost of debt incurred in such investments is as follows:
(millions)
As at December 31, 2012 2011
Borealis Infrastructure $ 6,409 $ 5,998
OMERS Private Equity 1,464 1,381
OMERS Strategic Investments 165 181
Total $ 8,038 $ 7,560
b) As part of the securities lending program, OAC receives cash collateral that it invests in short-term interest bearing investments. The Plan is obligated
to return the cash collateral upon termination of the arrangement. The securities lending agreements may be terminated at any time and as such the
collateral is repayable on demand.
c) OAC sells securities under agreement to repurchase (Repo Agreements) to access liquidity by selling securities and receiving cash. At the time of the
sale, OAC agrees to repurchase from the counterparty securities equivalent to those that were sold at a specifi ed time and at an agreed repurchase
price. OAC retains economic exposure to changes in the value of the sold securities as well as any income from the sold securities. Repo Agreements
are executed under master repurchase agreements and with counterparties with a credit rating of at least “AA low” or equivalent. Terms are in place to
provide OAC the ability to immediately unwind a demand Repo Agreement and to negotiate the early termination of a term Repo Agreement.
NOTE 6
Notes to consolidated Financial Statements

108 OMERS Administration Corporation 2012 Annual Report
OMERS Administration Corporation
OMERS Primary Pension PlanA summary of the fi nancial statements of the Primary Plan is as follows:
Statement of Financial Position
(millions)
As at December 31, 2012 2011
Net Assets Available for Benefi ts
Investments $ 72,318 $ 64,026
Other investment assets 366 332
Amounts due from pending trades 487 375
Contributions receivable 241 227
Other assets 38 29
Investment liabilities (11,249) (8,802)
Due to administered funds (905) (828)
Amounts payable from pending trades (492) (261)
Other liabilites (115) (83)
Net Assets Available for Benefi ts $ 60,689 $ 55,015
Accrued Pension Obligation and Defi cit
Defi ned benefi t component
Accrued pension obligation $ 69,122 $ 64,548
Defi cit
Funding defi cit (9,924) (7,290)
Actuarial value adjustment of net assets 1,321 (2,337)
(8,603) (9,627)
Additional Voluntary Contributions Component
Pension obligation 170 94
Total Primary Plan Accrued Pension Obligation and Defi cit $ 60,689 $ 55,015
NOTE 7

109 2012 Annual Report OMERS Administration Corporation
OMERS Primary Pension Plan (continued)
Statement of Changes in Net Assets Available for Benefi ts
(millions)
For the year ended December 31, 2012 2011
Statement of Changes in Net Assets
Net investment income $ 5,196 $ 1,364
Contributions 3,191 2,795
Benefi ts (2,658) (2,376)
Pension administrative expenses (55) (58)
Total Increase 5,674 1,725
Net assets available for benefi ts, beginning of year 55,015 53,290
Net Assets Available for Benefi ts, End of Year $ 60,689 $ 55,015
Actuarial Value of Net Assets of the Defi ned Benefi t Component
The actuarial valuation of the Plan was performed by Towers Watson Canada Inc. Under the PBA an independent actuarial valuation must be fi led with
FSCO at least once every three years. The Plan valuation was last fi led for the December 31, 2011 year-end and, if not fi led earlier, must be fi led for the
December 31, 2014 year-end.
The actuarial value of net assets of the Plan is established such that investment returns above or below the long-term return assumption in effect for
the year, 6.50 per cent for 2012 (2011: 6.50 per cent) are recognized over 5 years to smooth fl uctuations in the market value of net assets. For 2012,
$1,280 million was credited to the actuarial valuation adjustment because the investment return was in excess of the long-term rate of return assumption.
This compares with 2011 when $1,686 million was debited to the actuarial valuation adjustment because the investment return was below the long-term
rate of return assumption.
As a result, at December 31, 2012, the Plan has $1,321 million in the actuarial valuation adjustment reserve representing the net unrecognized returns in
excess of the long-term rate of return assumption (2011: $2,337 million net unrecognized returns below the long-term rate of return assumption). The
present value of unrecognized net investment returns by initial year they were established and the amounts to be recognized from 2013 through 2016,
after application of the long-term return assumption, are as follows:
(millions)
Initial Year Earned
Actuarial Valuation Adjustment as at Unrecognized Investment Returns to be Recognized in
Actuarial Valuation Adjustment as at
Dec. 31, 2012 (i) 2013 2014 2015 2016 Dec. 31, 2011
2008 $ - $ - $ - $ - $ - $ (2,773)
2009 359 382 - - 673
2010 1,030 548 584 - 1,449
2011 (1,348) (478) (509) (543) - (1,686)
2012 1,280 341 363 387 412 -
Total $ 1,321 $ 793 $ 438 $ (156) $ 412 $ (2,337)
(i) For each initial year, amounts in the actuarial valuation adjustment reserve are escalated annually by the long-term return assumption. Reserve amounts are recognized in actuarial assets based on the number of years remaining in the fi ve-year smoothing period.
NOTE 7
Notes to consolidated Financial Statements

110 OMERS Administration Corporation 2012 Annual Report
OMERS Administration Corporation
OMERS Primary Pension Plan (continued)The change in the actuarial adjustment is as follows:
(millions)
For the year ended December 31, 2012 2011
Expected interest on beginning actuarial valuation adjustment (i) $ (152) $ (148)
Current year returns in excess of/(below) the funding rate (i) 1,280 (1,686)
Prior years' returns below the funding rate recognized in the year 2,530 1,775
Increase/(Decrease) 3,658 (59)
Actuarial valuation adjustment, beginning of year (2,337) (2,278)
Actuarial Valuation Adjustment, End of Year $ 1,321 $ (2,337)
(i) Based on the funding rate in effect during the year, 2012 – 6.50.per cent (2011: 6.50 per cent).
Accrued Pension Obligations of the Defi ned Benefi t Component
The actuarial present value of the accrued pension obligation is an estimate of the value of pension obligations of the Plan in respect of benefi ts accrued to
date for all active and inactive members. This obligation is measured using the same actuarial assumptions and methods adopted by OAC for determining
the Plan’s minimum funding requirements as set out under the PBA. As the experience of the Plan unfolds, and as underlying conditions change over time,
the actual value of accrued benefi ts payable in the future could be materially different than the actuarial present value.
The projected benefi t method pro-rated on service is used for the actuarial valuation. Under this method, the cost of providing benefi ts to an individual
member will increase as the individual member ages and gets closer to retirement.
The following are the primary economic actuarial assumptions which have been used in the actuarial valuation of the Plan as at December 31:
2012 2011
Assumed rate of infl ation 2.25% 2.25%
Real rate of return assumed on Plan assets 4.25% 4.25%
Discount rate (rate of infl ation plus real rate of return) 6.50% 6.50%
The assumed increases in the real rate of pensionable earnings (i.e. increase in excess of the assumed infl ation rate) are dependent on the attained age of
the members. These rates of increase were updated in 2009 to refl ect recent experience of the Plan and current expectations for future years.
2012 2011
NRA 60 (i) NRA 65 (i) NRA 60 (i) NRA 65 (i)
Until 2014 After 2014 Until 2014 After 2014 Until 2014 After 2014 Until 2014 After 2014
Assumed real rate of pensionable earnings increases
(weighted average of a table of age related increases)1.40% 1.90% 1.10% 1.60% 1.40% 1.90% 1.10% 1.60%
Rate of pensionable earnings increases (assumed rate of
infl ation plus real rate of pensionable earnings increases)3.65% 4.15% 3.35% 3.85% 3.65% 4.15% 3.35% 3.85%
(i) Normal Retirement Age of 60 and 65 years of age respectively.
NOTE 7

111 2012 Annual Report OMERS Administration Corporation
OMERS Primary Pension Plan (continued)In addition, demographic assumptions are used to estimate when future benefi ts are payable to members and benefi ciaries, including assumptions about
mortality rates, termination rates and patterns of early retirement. Each of these assumptions is updated periodically, based on a detailed review of the
experience of the Plan and on the expectations for future trends. During 2010, the early retirement assumption was updated to refl ect the Plan’s recent
retirement experience and to account for an anticipated future trend towards older retirement ages. The OAC external actuary has provided their opinion
that assumptions adopted are appropriate for valuing the Plan’s accrued pension obligation.
The accrued pension obligation as at December 31, 2012 takes account of known changes in the Plan membership up to December 1, 2012, actual
infl ationary increases to pension payments and deferred pension payments to be implemented as at January 1, 2013, and estimated pensionable earnings
and credited service accruals in 2012.
The defi cit of the Plan’s actuarial value of net assets available for benefi ts over accrued pension obligation is as follows:
(millions)
For the year ended December 31, 2012 2011
Primary Plan fair value of net assets available for benefi ts $ 60,689 $ 55,015
Less Additional Voluntary Contribution net assets 170 94
Defi ned benefi t net assets available for benefi ts 60,519 54,921
Actuarial value adjustment (1,321) 2,337
Actuarial value of net assets available for benefi ts 59,198 57,258
Defi ned benefi t accrued pension obligation 69,122 64,548
Funding defi cit of actuarial value of net assets available for benefi ts over accrued pension obligation (9,924) (7,290)
Reversal of actuarial value adjustment 1,321 (2,337)
Defi cit of Net Assets Available for Benefi ts Over Accrued Pension Obligation $ (8,603) $ (9,627)
As the Plan provides 100 per cent infl ation protection, the accrued pension obligation is particularly sensitive to changes in the assumed real rate of
pensionable earnings increases, which impacts future benefi ts, and the assumed real rate of return on plan assets, which is used in the discounting of
these future benefi ts. A 50 basis point change in the following assumptions (with no change in other assumptions) would have the following approximate
effects on the accrued pension obligation:
50 Basis Point Decrease/Increase Approximate Effect on Accrued Pension Obligation
Real rate of pensionable earnings increases -/+ $1,500 million
Real return on plan assets and discount rate +/- $5,200 million
NOTE 7
Notes to consolidated Financial Statements

112 OMERS Administration Corporation 2012 Annual Report
OMERS Administration Corporation
Retirement Compensation Arrangement The Retirement Compensation Arrangement provides pension benefi ts for those members with earnings exceeding the amount that generates the
maximum pension allowed by the ITA with respect to service after 1991. Under the OMERS Act, OAC is the administrator of the RCA. As the RCA is not a
registered pension plan, a 50 per cent refundable tax is levied by the Canada Revenue Agency (CRA) on all contributions made to the RCA as well as on
investment income received and realized investment gains. The refundable tax is held by the CRA and earns no investment income for the RCA; it is
refunded on the basis of one dollar for every two dollars of realized losses or benefi ts paid out. The remaining assets of the RCA are managed separately
from those of the Plan and are primarily invested in the public markets.
The full earnings pension benefi ts provided by the RCA are not fully funded but are funded on a modifi ed pay-as-you-go basis in order to minimize the
impact of the 50 per cent refundable tax applicable to all RCA plans under the ITA. Contributions to the RCA are based on the top-tier Plan contribution
rates and are currently payable to the RCA on the excess of contributory earnings over a defi ned earnings threshold, which was $149,242 for 2012
(2011: $143,912). For purposes of determining benefi t entitlements and contributions effective January 1, 2012, the defi ned earnings threshold is actively
managed and monitored in such a way that future contributions to the RCA, together with the existing RCA Fund and future investment earnings, are
expected to be suffi cient to provide for projected benefi t payments over the 20-year period following each annual valuation date. Benefi ts in excess of the
maximum amounts payable from the Plan as allowed by the ITA are paid from the RCA.
A summary of the fi nancial statements for the RCA is as follows:
Statement of Financial Position
(millions)
As at December 31, 2012 2011
Net Assets Available for Benefi ts
Net investment assets $ 37 $ 32
Other assets 41 36
Contributions receivable 1 1
Other liabilities (1) (1)
Net Assets Available for Benefi ts $ 78 $ 68
Accrued Pension Obligation and Defi cit
Accrued pension obligation $ 555 $ 504
Defi cit (477) (436)
Accrued Pension Obligation and Defi cit $ 78 $ 68
Statement of Changes in Net Assets Available for Benefi ts
(millions)
For the year ended December 31, 2012 2011
Statement of Changes in Net Assets
Net investment income/(loss) $ 4 $ (1)
Contributions 19 18
Benefi ts (12) (7)
Administrative expenses (1) (1)
Total Increase 10 9
Net assets available for benefi ts, beginning of year 68 59
Net Assets Available for Benefi ts, End of Year $ 78 $ 68
NOTE 8

113 2012 Annual Report OMERS Administration Corporation
Retirement Compensation Arrangement (continued)The actuarial assumptions used for the RCA are consistent with those used for the Plan except that the discount rate as at December 31, 2012 is
3.25 per cent (2011: 3.25 per cent), which approximates the effect of the 50 per cent refundable tax applicable to the RCA. A 50 basis point decrease/
increase in the assumed rate (with no change in other assumptions) before refl ecting the 50 per cent refundable tax would have a +/- $25 million
(2011: +/- $25 million) impact on the accrued pension obligation.
Determination of the value of the RCA accrued pension obligation is made on the basis of an actuarial valuation. The defi cit of net assets over accrued
pension obligation as at December 31 is as follows:
(millions)
As at December 31, 2012 2011
Fair value of net assets at end of year $ 78 $ 68
Accrued pension obligation at end of year 555 504
Defi cit of Actuarial Value of Net Assets Over Accrued Pension Obligation $ (477) $ (436)
NOTE 8
Notes to consolidated Financial Statements

114 OMERS Administration Corporation 2012 Annual Report
OMERS Administration Corporation
Net Investment Income/(Loss) The Funds’ investments consist of the following major asset classes: public markets (which includes public equities and interest bearing investments such
as treasury bills, bonds, mortgages and private debt), private equity, infrastructure and real estate.
The Funds’ investment income/(loss) by asset classes is as follows:
(millions)
For the year ended December 31, 2012
Investment Income (i) (ii)
Net Gain/(Loss) on Investment
Assets, Liabilities and Derivatives (iii)
Total Investment Income/(Loss)
Investment Management
Expenses (note 13 (b))
Net Investment Income/(Loss)
Public Market Investments
Interest Bearing Investments
Short-term deposits $ 52 $ (5) $ 47
Bonds and debentures 375 148 523
Mortgages and private debt 119 (30) 89
546 113 659
Real return bonds 36 (14) 22
Public Equity
Canadian public equities 47 (31) 16
Non-Canadian public equities 263 1,424 1,687
310 1,393 1,703
Total Public Market Investments 892 1,492 2,384 (107) 2,277
Private Equity
Canadian private equities 182 94 276
Non-Canadian private equities 63 489 552
Total Private Equity Investments 245 583 828 (90) 738
Infrastructure Investments 578 492 1,070 (61) 1,009
Real Estate Investments (iv) 637 625 1,262 (7) 1,255
$ 2,352 $ 3,192 $ 5,544 $ (265) 5,279
(Income)/loss credited to administered funds (79)
Net Investment Income/(Loss) $ 5,200
NOTE 9

115 2012 Annual Report OMERS Administration Corporation
Net Investment Income/(Loss) (continued)(millions)
For the year ended December 31, 2011
Investment Income (i) (ii)
Net Gain/(Loss) on Investment
Assets, Liabilities and Derivatives (iii)
Total Investment Income/(Loss)
Investment Management
Expenses (note 13 (b))
Net Investment Income/(Loss)
Public Market Investments
Interest Bearing Investments
Short-term deposits $ 45 $ 29 $ 74
Bonds and debentures 339 582 921
Mortgages and private debt 109 (21) 88
493 590 1,083
Real return bonds 38 232 270
Public Equity
Canadian public equities 110 (1,230) (1,120)
Non-Canadian public equities 228 (581) (353)
338 (1,811) (1,473)
Total Public Market Investments 869 (989) (120) (111) (231)
Private Equity
Canadian private equities 236 112 348
Non-Canadian private equities 70 109 179
Total Private Equity Investments 306 221 527 (89) 438
Infrastructure Investments 451 273 724 (53) 671
Real Estate Investments (iv) 477 119 596 (11) 585
$ 2,103 $ (376) $ 1,727 $ (264) 1,463
Gain/(loss) from currency hedging activities (79)
(Income)/loss credited to administered funds (21)
Net Investment Income/(Loss) $ 1,363
(i) Investment income includes interest, dividends and real estate operating income accrued or received net of interest expense on liabilities incurred in investment related activities. Investment income is net of external manager performance and pooled fund fees of $34 million (2011: $51 million).
(ii) Interest on investment related activities includes interest on real estate investment liabilities of $234 million (2011: $204 million), interest on infrastructure investment liabilities of $49 million (2011: $48 million).
(iii) Includes net realized gain of $2,155 million (2011: $698 million) and is net of transaction costs of $109 million (2011: $121 million).
(iv) Real estate investment income includes Oxford Properties Group’s operating expenses (net of property management income) of $33 million (2011: $9 million) which includes audit costs of $3.1 million (2011: $3.3 million).
NOTE 9
Notes to consolidated Financial Statements

116 OMERS Administration Corporation 2012 Annual Report
OMERS Administration Corporation
Net Investment Income/(Loss) (continued)The Funds’ net investment income/(loss) by Investment Entity is as follows:
(millions)
As at December 31, 2012
OMERS Capital Markets
OMERS Private Equity
Borealis Infrastructure
Oxford Properties
Group
OMERS Strategic
Investments Total
Public market investments $ 2,253 $ - $ - $ 24 $ - $ 2,277
Private equity investments - 962 - - (224) 738
Infrastructure investments - - 986 - 23 1,009
Real estate investments - - - 1,255 - 1,255
Net Investment Income/(Loss) (i) $ 2,253 $ 962 $ 986 $ 1,279 $ (201) $ 5,279
(millions)
As at December 31, 2011
OMERS Capital Markets
OMERS Private Equity
Borealis Infrastructure
Oxford Properties
Group
OMERS Strategic
Investments Total
Public market investments $ (296) $ - $ - $ 25 $ 40 $ (231)
Private equity investments - 354 - - 84 438
Infrastructure investments - - 674 - (3) 671
Real estate investments - - - 585 - 585
Net Investment Income/(Loss) (i) $ (296) $ 354 $ 674 $ 610 $ 121 $ 1,463
(i) Before income/(loss) credited to administered funds.
NOTE 9

117 2012 Annual Report OMERS Administration Corporation
Investment Returns OAC investment returns are calculated using a time-weighted rate of return formula in accordance with industry standard methods, based upon the
following principles:
a) Investment Entity returns are calculated as the percentage of Investment Entity income to the weighted average fair value of the Investment Entity net
assets during the period.
b) Fair value is determined as described in notes 2, 3 and 4.
c) Income is determined as described in notes 2 and 9.
d) The Total Fund return includes all Investment Entity returns.
The percentage returns for the year ended December 31 are as follows:
For the year ended December 31, 2012 2011
OMERS Primary Pension Plan Gross Returns by Entity (i)
OMERS Capital Markets 7.50% -0.22%
OMERS Private Equity 19.17% 7.23%
Borealis Infrastructure 12.68% 8.79%
Oxford Properties 16.91% 8.40%
OMERS Strategic Investments -10.13% 7.24%
Total OMERS Primary Pension Plan 10.03% 3.17%
Retirement Compensation Arrangement Gross Returns
RCA Investment Fund (ii) 11.84% -2.42%
The above gross returns are before the impact of base and performance fees paid to external fund managers and administrative expenses. The Plan net
return after all investment costs for the year ended December 31, 2012 was 9.50 per cent (2011: 2.59 per cent).
(i) Effective January 1, 2012, Investment Entity returns refl ect the results of the Plan’s currency hedging related activities with external counterparties. Prior to 2012, currency hedging for private market Investment Entities was based on internal transactions. For all years, total Plan returns include the results of the Plan’s currency hedging activities.
(ii) Excludes the RCA refundable tax balance with CRA. Including the refundable tax balance, the RCA December 31, 2012 rate of return was 5.47 per cent (2011: negative 1.25 per cent).
NOTE 10
Notes to consolidated Financial Statements

118 OMERS Administration Corporation 2012 Annual Report
OMERS Administration Corporation
Contributions(millions)
For the year ended December 31, 2012 2011
Current service required contributions (i) $ 3,026 $ 2,618
Transfers from other pension plans 40 41
Past service contributions from members (ii) 67 53
Past service contributions from employers (ii) 10 8
AVC contributions 67 93
$ 3,210 $ 2,813
(i) Current service contributions are funded equally by employers and members. For NRA 65 members, the 2012 contribution rate was 8.3 per cent (2011: 7.4 per cent) of earnings up to $50,100 (2011: $48,300) and 12.8 per cent (2011: 10.7 per cent) of earnings above that level. For NRA 60 members, the 2012 contribution rate was 9.4 per cent (2011: 8.9 per cent) of earnings up to $50,100 (2011: $48,300) and 13.9 per cent (2011: 14.1 per cent) of earnings above that level.
(ii) Past service contributions include amounts for leaves of absence, conversion of normal retirement age and contract adjustments.
Contributions by plan are as follows:
(millions)
For the year ended December 31, 2012 2011
Primary Plan (note 7)
Defi ned benefi t component $ 3,124 $ 2,702
AVC component 67 93
3,191 2,795
RCA (note 8) 19 18
$ 3,210 $ 2,813
NOTE 11

119 2012 Annual Report OMERS Administration Corporation
Benefi ts(millions)
For the year ended December 31, 2012 2011
Retirement benefi ts $ 2,229 $ 2,021
Disability benefi ts 27 26
Transfers to other registered plans 185 190
Death Benefi ts 79 66
Commuted value payments and members’ contributions plus interest refunded 146 79
AVC benefi ts 4 1
$ 2,670 $ 2,383
Benefi ts by plan are as follows:
(millions)
For the year ended December 31, 2012 2011
Primary Plan (note 7)
Defi ned benefi t component $ 2,654 $ 2,375
AVC component 4 1
2,658 2,376
RCA (note 8) 12 7
$ 2,670 $ 2,383
NOTE 12
Notes to consolidated Financial Statements

120 OMERS Administration Corporation 2012 Annual Report
OMERS Administration Corporation
Pension Administrative And Investment Management Expensesa. Pension administrative expenses (i)
(millions)
For the year ended December 31, 2012 2011
Salaries and benefi ts $ 36 $ 35
System development and other purchased services 7 5
Premises and equipment 4 4
Professional services (ii) 5 10
Travel and communication 4 5
$ 56 $ 59
b. Investment management expenses (i)
(millions)
For the year ended December 31, 2012 2011
Salaries and benefi ts $ 172 $ 147
System development and other purchased services 15 14
Premises and equipment 5 11
Professional services (ii) 20 22
Travel and communication 14 12
Investment management services (iii) 39 58
$ 265 $ 264
(i) Includes allocation of corporate expenses.
(ii) Total professional services expenses include independent actuarial costs of $1.0 million (2011: $1.1 million) and external audit costs of $1.0 million (2011: $0.9 million).
(iii) Includes external management and custody fees and is net of private equity management fees earned from portfolio investments of $14 million (2011: $18 million).
NOTE 13

121 2012 Annual Report OMERS Administration Corporation
Related Party DisclosuresOAC manages its real estate, infrastructure and private equity businesses through OAC Investment Entities as discussed in note 1 and holds investments
through a network of investment structures or subsidiary companies established in compliance with the OMERS Act, the PBA, the ITA and other statutory,
regulatory and tax legislation governing OAC.
OAC’s related parties include 968 employers whose employees are members of the Plan, the SC, members of the OAC Board, key management personnel
(defi ned below) and investments where OAC has a controlling interest. Transactions with related parties include the following:
• OAC, in the normal course of business, purchased bonds at the prevailing market prices that were issued by a municipal employer. The fair market
value of the bonds outstanding at December 31, 2012 was $22 million (2011: $22 million).
• OAC through its Oxford Properties Group paid property taxes to municipal employers of $226 million (2011: $231 million) and utility payments to our
investee entities of $17 million (2011: $16 million) for the year end ended December 31, 2012. The amounts of property taxes paid were based on
normal levies by the individual municipal employers and were consistent with those that would be paid by a non-related party. The utility payments
made to utility companies which are OAC investee entities were based on normal usage and rates that would be paid by a non-related party.
Key Management Personnel Compensation
Key management personnel consist of members of the OAC’s Board of Directors and the Chief Executive Offi cer, Chief Financial Offi cer, Chief Investment
Offi cer, Chief Pension Offi cer and the chief executive offi cers of OMERS Capital Markets, Oxford Properties Group, Borealis Infrastructure and OMERS
Private Equity. The aggregate key management personnel compensation is shown below:
(millions)
For the year ended December 31, 2012 2011
Salaries and short-term employee benefi ts $ 16 $ 14
Post-employment benefi ts 1 1
Other long-term benefi ts 6 6
$ 23 $ 21
Other than the above, OAC had no other transactions with key management personnel during the year.
NOTE 14
Notes to consolidated Financial Statements

122 OMERS Administration Corporation 2012 Annual Report
OMERS Administration Corporation
CapitalOAC defi nes its capital as the funded status (surplus/(defi cit)) of each of the OMERS Pension Plans, as determined annually based on the fair value of the
net assets of the OMERS Pension Plans, the actuarial value adjustment of the Plan net assets and the going concern actuarial valuation prepared by OAC’s
independent actuary. The funded status of the Plan is discussed in note 7 and the funded status of the RCA is discussed in note 8.
OAC’s objective is to ensure that the Plan defi ned benefi t component is fully funded over the long term through the management of investments, contribution
rates and benefi ts. Investments (note 3), the use of derivatives (note 4) and leverage (note 6) are based on asset mix and risk management policies and
procedures that are designed to enable the Plan to meet or exceed its long-term funding requirement within an acceptable level of risk, consistent with the
Plan’s Statement of Investment Policies and Procedures as approved by the OAC Board. As the Plan’s administrator OAC has adopted a Statement of
Investment Policies and Procedures (the SIP&P) for the Plan which sets investment objectives, guidelines and benchmarks used in investing the Plan’s assets,
permitted categories of investments, asset mix diversifi cation and rate of return expectations. The Plan’s SIP&P was last amended on December 14, 2012.
The Plan AVC component accrued pension obligation is based on net contributions plus net investment income and as such does not have a surplus/
(defi cit) position. The Supplemental Plan has no members, net assets or accrued pension obligations. The Supplemental Plan SIP&P was last amended on
December 14, 2012.
The RCA is funded on a modifi ed pay-as-you-go basis in order to minimize the impact of the 50 per cent refundable tax applicable to all RCA plans. The
RCA investments are based on an asset mix and Statement of Investment Policies and Procedures separate from those of the Plan. The RCA SIP&P was
last amended on December 14, 2012.
The funded status of each plan and the related cash fl ows are also impacted by the level of contributions (note 11) and benefi ts (note 12). The SC is
responsible for setting contribution rates above the minimum required to fund the plan, subject to compliance with legislation, and determining benefi ts for
the OMERS Pension Plans.
The Plan and Supplemental Plan are subject to FSCO regulations which require the Plan to fi le an actuarial valuation report for a funding valuation at least
once every three years. At that time, the Plan must take measures to eliminate any going concern funding defi cits over a period not to exceed 15 years.
Where the funded status of the Plan is fi led with a surplus position greater than ten per cent of the accrued pension obligation, the ITA requires contributions
be reduced with the amount of the reduction increasing as the percentage surplus increases. Once the fi led surplus reaches twenty-fi ve per cent of the
accrued pension obligation, regular contributions must be eliminated. The SC is responsible for determining the contributions above the level required to
fully fund the Plan and for determining when an actuarial valuation of the Plan and Supplemental Plan should be fi led, subject to the requirements under the
regulations. There are no similar fi ling requirements for the RCA as the RCA is not a registered pension plan.
NOTE 15

123 2012 Annual Report OMERS Administration Corporation
Guarantees, Commitments and ContingenciesAs part of normal business operations, OAC enters into commitments and guarantees related to the funding of investments. Future commitments to fund
investments include, but may not be limited to, investments in infrastructure, real estate and private equity direct investments and limited partnership
agreements. The future commitments are generally payable on demand based on the capital needs of the investment. As at December 31, 2012, these
future commitments totaled $3.9 billion (2011: $4.2 billion). The maximum amount payable under guarantees and standby letters of credit provided as part
of investment transactions was $955 million as at December 31, 2012 (2011: $740 million). Guarantees and commitments are often provided as part of
developing or holding an investment and as such often have no fi xed expiration date.
OAC, in the normal course of business, indemnifi es its directors, offi cers, employees, its Investment Entities and certain others in connection with proceed-
ings against them to the extent that these individuals are not covered under another arrangement. In addition, OAC may in certain circumstances in the
course of investment activities agree to indemnify a counterparty. Under the terms of such arrangements, OAC may be required to compensate these
parties for costs incurred as a result of various contingencies such as changes in laws and regulations or legal claims. The contingent nature of the
liabilities in such agreements and the range of indemnifi cation prevent OAC from making a reasonable estimate of the maximum amount that would be
required to pay such indemnifi cations.
As at December 31, 2012, OAC was involved in certain litigation and claims. The outcome of such litigation and claims is inherently diffi cult to predict;
however, in the opinion of Management, any liability that may arise from such contingencies would not have a signifi cant adverse effect on the consolidated
fi nancial statements of OAC.
NOTE 16
Notes to consolidated Financial Statements

124 OMERS Administration Corporation 2012 Annual Report
OMERS Administration Corporation
Ten-
Year
Fin
anci
al R
evie
w
($ m
illio
ns)
2012
2011
2010
(ii)
2009
2008
2007
2006
2005
2004
2003
Net
Ass
ets
Ava
ilab
le fo
r B
enefi
ts
as a
t Dec
emb
er 3
1,
Pub
lic m
arke
ts 3
7,47
2 3
2,15
4 3
4,12
3 3
1,33
6 2
8,76
3 4
3,29
1 4
3,53
3 3
9,33
8 3
0,28
3 3
0,16
8
Priv
ate
equi
ty 7
,465
7
,753
6
,633
5
,048
4
,162
3
,608
2
,951
2
,391
1
,460
9
14
Infr
astr
uctu
re
11,
572
9,6
35
9,5
93
12,
195
12,
140
8,4
12
5,5
85
3,7
19
2,3
14
1,4
26
Rea
l est
ate
15,
846
14,
516
12,
599
11,
975
12,
037
10,
904
8,5
41
6,1
80
6,8
98
6,9
20
7
2,35
5 6
4,05
8 6
2,94
8 6
0,55
4 5
7,10
2 6
6,21
5 6
0,61
0 5
1,62
8 4
0,95
5 3
9,42
8
Oth
er in
vest
men
t ass
ets
853
7
07
645
1
,173
1
,366
1
,001
6
99
765
4
94
578
Inve
stm
ent l
iab
ilitie
s(1
1,74
1)(9
,063
)(9
,628
)(1
3,33
8)(1
4,47
4)(1
5,02
9)(1
3,08
8)(1
0,77
2)(5
,267
)(7
,297
)
Net
inve
stm
ent a
sset
s 6
1,46
7 5
5,70
2 5
3,96
5 4
8,38
9 4
3,99
4 5
2,18
7 4
8,22
1 4
1,62
1 3
6,18
2 3
2,70
9
Non
inve
stm
ent a
sset
s/(li
abili
ties)
Due
to a
dm
inis
tere
d fu
nds
(905
)(8
28)
(809
)(7
34)
(672
)(8
00)
(741
)(6
39)
(553
)(4
96)
Oth
er a
sset
s/(li
abili
ties)
205
2
09
193
1
77
155
1
29
125
8
3 2
6 (1
20)
Net
Ass
ets
Ava
ilab
le f
or
Ben
efi t
s 6
0,76
7 5
5,08
3 5
3,34
9 4
7,83
2 4
3,47
7 5
1,51
6 4
7,60
5 4
1,06
5 3
5,65
5 3
2,09
3
Acc
rued
Ben
efi t
Obl
igat
ion
and
Sur
plus
/(Defi
cit)
as a
t Dec
emb
er 3
1,
OM
ER
S P
rim
ary
Pen
sio
n P
lan
Defi
ned
Ben
efi t
Co
mp
on
ent
Acc
rued
pen
sion
ob
ligat
ion
69,
122
64,
548
60,
035
54,
253
50,
080
46,
830
44,
167
41,
123
37,
774
35,
466
Fund
ing
sur
plu
s/(d
efi c
it)(9
,924
)(7
,290
)(4
,467
)(1
,519
)(2
79)
82
(2,3
82)
(2,7
84)
(963
) 5
09
Act
uaria
l val
ue a
dju
stm
ent o
f net
ass
ets
1,3
21
(2,3
37)
(2,2
78)
(4,9
50)
(6,3
63)
4,5
67
5,7
91
2,7
07
(1,1
68)
(3,8
88)
(8
,603
)(9
,627
)(6
,745
)(6
,469
)(6
,642
) 4
,649
3
,409
(7
7)(2
,131
)(3
,379
)
6
0,51
9 5
4,92
1 5
3,29
0 4
7,78
4 4
3,43
8 5
1,47
9 4
7,57
6 4
1,04
6 3
5,64
3 3
2,08
7
Add
ition
al V
olun
tary
Con
trib
utio
ns C
ompo
nent
Pen
sion
ob
ligat
ion
170
9
4 -
-
-
-
-
-
-
-
Net
ass
ets
avai
lab
le fo
r b
enefi
ts 6
0,68
9 5
5,01
5 5
3,29
0 4
7,78
4 4
3,43
8 5
1,47
9 4
7,57
6 4
1,04
6 3
5,64
3 3
2,08
7
RC
A Acc
rued
pen
sion
ob
ligat
ion
555
5
04
468
4
86
285
2
36
172
1
57
149
6
9
(Defi
cit)
(477
)(4
36)
(409
)(4
38)
(246
)(1
99)
(143
)(1
38)
(137
)(6
3)
Net
ass
ets
avai
lab
le fo
r b
enefi
ts 7
8 6
8 5
9 4
8 3
9 3
7 2
9 1
9 1
2 6
Tota
l Acc
rued
Pen
sion
Obl
igat
ion
and
Defi
cit
60,
767
55,
083
53,
349
47,
832
43,
477
51,
516
47,
605
41,
065
35,
655
32,
093

125 2012 Annual Report OMERS Administration Corporation
($ m
illio
ns)
2012
2011
2010
(ii)
2009
2008
2007
2006
2005
2004
2003
Ch
ang
es in
Net
Ass
ets
Ava
ilab
le f
or
Ben
efi t
sfo
r th
e ye
ar e
nded
Dec
emb
er 3
1,
Net
ass
ets,
beg
inni
ng o
f the
yea
r 5
5,08
3 5
3,34
9 4
7,83
2 4
3,47
7 5
1,51
6 4
7,56
8 (ii
i) 4
1,06
5 3
5,65
5 3
2,09
3 2
9,50
5
Ch
ang
es D
ue
to In
vest
men
t Act
ivit
ies
Tota
l inv
estm
ent i
ncom
e (i)
5,5
44
1,6
48
5,7
35
4,6
23
(7,9
10)
4,2
00
6,8
03
5,7
67
3,9
07
3,7
51
Inve
stm
ent m
anag
emen
t exp
ense
s (i)
(265
)(2
64)
(268
)(2
46)
(227
)(2
01)
(169
)(1
60)
(147
)(1
58)
5
,279
1
,384
5
,467
4
,377
(8
,137
) 3
,999
6
,634
5
,607
3
,760
3
,593
(Inc
ome)
/Los
s cr
edite
d to
ad
min
iste
red
fund
s(7
9)(2
1)(8
3)(6
7) 1
24
(61)
(104
)(9
2)(6
6)(5
1)
Net
inve
stm
ent i
ncom
e/(lo
ss)
5,2
00
1,3
63
5,3
84
4,3
10
(8,0
13)
3,9
38
6,5
30
5,5
15
3,6
94
3,5
42
Cha
nges
Due
to P
ensi
on A
ctiv
ities
Con
trib
utio
ns
Cur
rent
Ser
vice
3,0
26
2,6
18
2,2
27
2,0
77
1,9
75
1,8
40
1,7
39
1,4
98
1,3
63
404
Oth
er c
ontr
ibut
ions
184
1
95
86
66
73
46
53
36
46
42
3
,210
2
,813
2
,313
2
,143
2
,048
1
,886
1
,792
1
,534
1
,409
4
46
Ben
efi ts
Pen
sion
s p
aid
(2,2
56)
(2,0
47)
(1,8
90)
(1,7
81)
(1,6
56)
(1,5
54)
(1,4
92)
(1,4
10)
(1,3
53)
(1,2
46)
Com
mut
ed v
alue
and
oth
er p
aym
ents
(414
)(3
36)
(236
)(2
69)
(371
)(2
79)
(252
)(1
93)
(145
)(1
10)
(2
,670
)(2
,383
)(2
,126
)(2
,050
)(2
,027
)(1
,833
)(1
,744
)(1
,603
)(1
,498
)(1
,356
)
Pen
sion
ad
min
istr
ativ
e ex
pen
ses
(56)
(59)
(54)
(48)
(47)
(43)
(38)
(36)
(43)
(44)
Net
ass
ets
avai
lab
le fo
r b
enefi
ts, e
nd o
f yea
r 6
0,76
7 5
5,08
3 5
3,34
9 4
7,83
2 4
3,47
7 5
1,51
6 4
7,60
5 4
1,06
5 3
5,65
5 3
2,09
3
Tota
l An
nu
al R
ate
of
Ret
urn
for
year
end
ed D
ecem
ber
31,
OM
ER
S P
rim
ary
Pen
sio
n P
lan
Defi
ned
Ben
efi t
Co
mp
on
ent
Tim
e w
eig
hted
retu
rn o
n m
arke
t val
ue10
.03%
3.17
%12
.01%
10.6
%-1
5.3%
8.7%
16.4
%16
.0%
12.1
%12
.7%
Ben
chm
ark
9.75
%2.
52%
11.4
7%12
.1%
-13.
2%5.
6%13
.7%
13.2
%9.
9%15
.5%
Ad
diti
onal
Vol
unta
ry C
ontr
ibut
ions
Com
pon
ent
Tim
e w
eig
hted
net
retu
rn o
n m
arke
t val
ue9.
50%
2.59
% -
-
-
-
-
-
-
-
RC
A In
vest
men
t F
un
d (iv
)
Tim
e w
eig
hted
retu
rn o
n m
arke
t val
ue11
.84%
-2.4
2%7.
99%
11.3
%-2
6.1%
8.7%
16.4
%16
.0%
12.1
%12
.7%
Ben
chm
ark
12.2
1%-2
.43%
10.0
9%16
.6%
-27.
3%5.
6%13
.7%
13.2
%9.
9%15
.5%
(i) In
pre
par
ing
fi na
ncia
l sta
tem
ents
in 2
012,
OA
C h
as re
clas
sifi e
d p
ursu
it co
sts
from
inve
stm
ent m
anag
emen
t exp
ense
s to
tota
l inv
estm
ent i
ncom
e. 2
011
amou
nts
wer
e ad
just
ed to
refl e
ct th
is re
clas
sifi c
atio
n.
(ii) S
tart
ing
with
201
0, a
mou
nts
are
pre
sent
ed in
acc
ord
ance
with
CIC
A H
and
boo
k S
ectio
n 46
00-P
ensi
on P
lans
and
IFR
S.
(iii)
2007
beg
inni
ng o
f the
yea
r net
ass
ets
wer
e d
ecre
ased
by
$37
mill
ion
to re
fl ect
a c
hang
e in
acc
ount
ing
pol
icy
for t
rans
actio
n co
sts.
(iv) E
xclu
des
the
RC
A re
fund
able
tax
bal
ance
with
the
Can
ada
Rev
enue
Ag
ency
.

126 OMERS Administration Corporation 2012 Annual Report
OMERS Administration Corporation
Glossary
Absolute Return Strategies
Strategies expected to generate positive returns regardless of the
movements of the fi nancial markets due to their low correlation to broad
fi nancial markets. Absolute return strategies may be used with the
objective of increasing the overall investment portfolio risk-adjusted return
while contributing to the stability of the overall investment portfolio returns.
Accrued Pension Obligation
The actuarial present value of future pension benefi ts earned to date.
Actuarial Smoothing
A common practice accepted in the actuarial profession and by pension
regulators to reduce the effect of short-term market fl uctuations on pension
plan funding by deferring and recognizing changes in net assets above or
below the long-term funding objective over fi ve years.
Actuarial Valuation Report
A report issued by the OAC’s actuary on the funded status of the
OMERS Pension Plans. The actuarial valuation is based on a set of
demographic and economic assumptions approved by the OAC Board.
Additional Voluntary Contributions (AVCs)
A retirement savings opportunity for members of the OMERS Primary
Pension Plan, effective January 1, 2011. AVCs will enable members and
retirees (to age 70) to take advantage of OMERS investment returns
by making additional contributions. Such contributions can include
ongoing withdrawals from a bank account (for active members) as well
as lump sum transfers from other registered retirement vehicles (for
active, retired and deferred members).
Basis Point
One basis point equals 1/100th of one percentage point.
Benchmark
A benchmark is a standard or point of reference against which
performance of an investment is measured. It is generally a passive
external index (e.g., the S&P/TSX Composite Index) or for the OAC’s
infrastructure and real estate investments a predetermined absolute
return based on operating plans approved by the OAC Board.
Benefi t Accrual
The accumulation of pension benefi ts based on a formula using years
of credited service, pensionable earnings and an accrual rate. This is
expressed in the form of an annual benefi t to begin payment at normal
retirement age.
Bridge Benefi t
A temporary benefi t provided to employees who retire prior to age 65. The
bridge benefi t supplements the pension income until age 65. The bridging
benefi t is not necessarily related to the size of the prospective government
benefi ts.
Commercial Paper
Short-term unsecured debt instruments issued by companies typically to
meet short-term fi nancing needs.
Commuted Value
The lump sum payment made in lieu of a member’s future pension amount
based on the member’s service and earnings to date. The commuted value
fl uctuates with changes in factors such as the member’s age, current
infl ation and interest rates.
Currency Hedging
A technique used to offset the risks associated with the changing value of
currency.
Custom Benchmark
A benchmark calculated based on the weighted average allocation to two
or more underlying benchmarks (e.g., Blended DEX 30 day Treasury Bill
Index and DEX Universe).
Debentures
Bonds that are not secured by specifi c assets of a fi rm.
Defi ned Benefi t Plan
In a defi ned benefi t plan members’ benefi ts are determined by a formula
usually based on years of service times earnings, rather than by the
investment returns made on their pension contributions.
Derivative/Derivative Financial Instrument
A fi nancial contract that derives its value from changes in underlying
assets or indices. Derivative transactions can be conducted on public
exchanges or in the over-the-counter market using investment dealers.
Derivative contracts include forwards, futures, swaps and options and are
discussed in more detail in note 4 of the OAC Consolidated Financial
Statements.
Direct Drive Active Management
Direct drive active management is where we have involvement in ongoing
decisions within the businesses we invest in with respect to strategy, major
investment decisions, annual fi nancial target setting and the monitoring of
performance against these targets, risk management and governance
oversight.
Discount Rate
A discount rate is the interest rate used to compute the present value of
anticipated future benefi t payments.

127 2012 Annual Report OMERS Administration Corporation
Enterprise-wide
This refers to OAC, including OMERS Pension Group, OMERS Capital
Markets, Borealis Infrastructure, OMERS Private Equity, Oxford Properties
Group, OMERS Strategic Investments and corporate functions.
International Financial Reporting Standards (IFRS)
IFRS are a set of principles-based accounting standards developed by the
International Accounting Standards Board that are becoming the global
standard for the preparation of public company fi nancial statements.
Infrastructure
Infrastructure investing involves direct investments in infl ation-sensitive
assets that are critical to the long-term success of a modern industrial
economy. Some infrastructure investments are subject to regulatory
establishment of rates, service delivery levels or both.
Modifi ed Pay-As-You-Go Funding Policy
Promised retirement benefi ts are not fully pre-funded; instead
contributions are paid to ensure that they are suffi cient to fund current
benefi ts. This variation of the funding method is used by OAC for
the RCA in order to minimize the 50 per cent refundable tax applicable
to RCA plans.
Nominal Bonds
Bonds that pay interest and principal without contractual adjustments
for infl ation.
OAC Board
The Board of Directors of the OMERS Administration Corporation.
OMERS Governance Review 2012
The OMERS Review Act required that OMERS governance model,
established by the OMERS Act be reviewed by Ontario’s Ministry of
Municipal Affairs and Housing by 2012.
OMERS Pension Plans or Plans
Collectively, the OMERS Primary Pension Plan, the associated Retirement
Compensation Arrangement and the OMERS Supplemental Pension Plan
for Police, Firefi ghters and Paramedics.
OMERS Primary Pension Plan or the Plan
The primary registered pension plan administered by OAC under
the OMERS Act. This includes the defi ned benefi t component and
the AVC component.
Passive Management
Investing in a manner that replicates the performance of a market index
(eg. S&P/TSX Composite Index).
Plan Sponsor
The organization or body which has the fi nal authority to create a pension
plan and/or make revisions to an existing pension plan. Usually the plan
sponsor is an employer, but it can also be a union, an association, the
government, or a mixture. For the OMERS Pension Plans, the Sponsors
Corporation is made up of employer and member representatives and acts
as the sponsor.
Private Equity
Private equity is the ownership of equity or equity-like securities in
companies that do not generally trade publicly.
Proxy Voting
Proxy voting is the process by which shareholders express their views on
proposed corporate actions by submitting their vote at a company’s annual
meeting.
Public Market Investments
Investments in interest bearing (i.e., bonds, debentures and treasury bills)
and equity securities (i.e., stocks, trust units, warrants and mutual fund
units) traded on recognized public exchanges.
Real Rate of Return
Nominal return adjusted to exclude the impact of infl ation.
Real Return Bonds
Interest bearing marketable bonds that pay a semi-annual coupon rate
calculated based upon the sum of the principal amount and an infl ation
compensation component that adjusts for infl ation.
Retirement Compensation Arrangement or RCA
The plan for those of the OMERS Pension Plan members with earnings
exceeding the amount that generates the maximum pension allowed
by the Income Tax Act.
SC
The OMERS Sponsors Corporation.
Secured Debt
Debt backed or secured by collateral to reduce the risk associated with
lending for creditors given that if the debtor defaults the creditor may seize
the collateral as repayment of the debt.
Supplemental Plan
The OMERS Supplemental Pension Plan for Police, Firefi ghters and
Paramedics is a stand-alone registered pension plan which offers benefi ts
not available in the OMERS Primary Pension Plan and which is not funded
from the OMERS Primary Pension Plan.
Unsecured Debt
Debt which is not backed or secured by collateral property.


2012 Annual Report

OMERSSponsors CorporationTable of Contents
2 Message from the CEO
4 Year in Review
6 Governance: OMERS Sponsors Corporation
12 Sponsors Corporation Members
13 Independent Auditors’ Report
14 Financial Statements
16 Notes to Financial Statements

1 2012 Annual Report OMERS Sponsors Corporation

2 OMERS Sponsors Corporation 2012 Annual Report
OMERS Sponsors Corporation
“ The joint SC and OAC Board sessions demonstrated the kind of open and transparent dialogue that will drive greater understanding of shared challenges and opportunities as we move forward.”
Deb Preston
Chief Executive Offi cer
OMERS Sponsors Corporation

3 2012 Annual Report OMERS Sponsors Corporation
2012 represented a year of engagement and progress for the OMERS Sponsors Corporation (SC) and OMERS. The sixth full year of operation by the SC
witnessed continued evolution of a framework for growth and a collaborative approach to strategic planning. The joint SC and OMERS Administration
Corporation (OAC) Board sessions demonstrated the kind of open and transparent dialogue that will drive greater understanding of shared challenges and
opportunities as we move forward. There is no question the discussions between the two Boards clearly highlighted a greater recognition of the importance
of good governance for all stakeholders. We look forward to building on that progress as a new year unfolds.
This was also the year of the OMERS Governance Review 2012 (the Review). This represents a welcome opportunity for an external perspective on the
current state of governance at OMERS, its evolution since 2006 and thoughts on where it should and could be over the longer term. There is a recognition
that OMERS governance can be enhanced and a willingness and desire by all parties to see that happen. This process will continue into 2013 now that the
report from the Review is available.
Throughout 2012, the SC continued its focus on ensuring the health and long-term viability of the OMERS Primary Pension Plan (the Primary Plan or the
Plan). As noted by the Co-Chairs, a key priority in 2012 was monitoring the fi nancial status of the Plan, the funding outlook, and implementing the last phase
of the three-year initiative to manage the funding of the Plan. We expect market conditions will continue to be turbulent and challenging, requiring regular
and ongoing monitoring of the Plan’s funded position and to make appropriate interventions if required.
As in 2012, we will work with the OAC to implement the strategic plan which will help return the Plan to a fully funded position. Our mutual goal is to deliver
affordable, sustainable plans for members and employers – with the best governance and communication.
Over the year, pensions and pension reform remained in the headlines as the federal and provincial governments continue to discuss how best
to expand pension coverage to more Canadians while balancing cost with benefi t adequacy. We saw this in the initiatives to reduce pension costs which
were fi rst communicated in the spring Ontario Budget announcement. Some of these initiatives have already had an impact on jointly sponsored pension
plans. The impact of other initiatives will not be known until the government considers its response to the report on the review of public sector pension plan
investment consolidation.
We are also seeing a renewed interest in an expansion of the Canada Pension Plan. Defi ned benefi t pension plans like the Canada Pension Plan and
OMERS are an effective tool for pooling risk across members, and across time. They allow economies of scale and retirement stability that individuals
cannot readily access on their own. While the 2008 fi nancial crisis and current market turmoil present challenges for defi ned benefi t pension plans
like OMERS, these challenges are much more diffi cult for individuals to bear on their own, especially those who are close to retirement and cannot wait
for a recovery.
This is an important time for pension plans such as OMERS and, together with the OAC, we will continue to monitor and participate in pension reform
discussions to ensure that OMERS is well represented. OMERS, and many of its counterparts, stand as examples of the effectiveness of the defi ned benefi t
pension model. We are fully committed to ensuring that this continues well into the future and will work with our colleagues at the OAC to implement the
strategic plan with that goal in mind.
I want to welcome Chris Vanden Haak in the role of Director, Pension Policy and Communications. Chris is responsible for advising the SC on pension
industry trends and for monitoring and analyzing developments in applicable legislation. With his many years of actuarial experience in the pension
consulting industry advising plan sponsors on a broad spectrum of issues, Chris brings a unique and important perspective to the SC as it faces the
economic and political challenges of today and, more importantly, as it prepares for tomorrow.
I would like to thank SC staff for the tremendous work they do, as well as the Co-Chairs and Board Members for their ongoing support. I am very pleased
to be part of the SC leadership team and look forward to working with the SC and the OAC to meet the challenges of these turbulent times.
Deb Preston
Message from the CEO

4 OMERS Sponsors Corporation 2012 Annual Report
OMERS Sponsors Corporation
Good Governance and Funding Strategy
Our funding strategy continues to meet the funding challenges
presented by volatile markets and the diffi cult economic environment.
As expected, our funding defi cit now fully refl ects the signifi cant
2008 market losses. The current defi cit is largely due to those
losses, but also refl ects losses due to actuarial assumption
changes and an aging, active population.
As of December 31, 2012, OMERS net assets available for benefi ts
were $60.8 billion, of which $60.5 billion related to the Plan defi ned
benefi t component resulting in a current funding defi cit on a smoothed
basis of $9.9 billion. Based on the year-end actuarial value of net
assets, the Plan is approximately 86 per cent funded – that is, it has
$86 in assets for every $100 of long-term pension obligations.
Our multi-year, phased approach to address the defi cit included
increasing contributions by an average of 2.9 per cent for both
employers and members over three years, with the last increase
effective January 1, 2013. The strategy also included benefi t
changes for some members effective January 1, 2013.
The SC conducted an independent actuarial review of contribution
rate allocations to determine how contributions would be allocated
in the future. Through this process, the SC reached agreement
on the allocation of the 2013 contribution rates refl ecting the last
increase under the funding strategy, as well as agreement on how
contributions would be allocated in the future. Under the adopted
approach, members whose Normal Retirement Age is age 60
(NRA 60) would pay the cost of their unique benefi t provisions and
any cost difference due to the difference in assumed future salary
increases. Additional cost differences associated with experience
and demographics are partially pooled and split between the two
NRA groups.
Year in ReviewAs always, we remain committed to the good governance of your pension plans and ensuring their health, viability and sustainability long into the future.

5 2012 Annual Report OMERS Sponsors Corporation
Year in Review
Based on the strategy approved in 2010, starting in 2013, there are
changes to the calculation of benefi ts members receive if they
terminate employment before they are eligible for an early retirement
pension – before age 55 (for NRA 65) and before age 50 (for NRA 60).
The changes will only impact service entitlements accrued after 2012.
These Plan members will not receive pre-retirement infl ation protection,
nor will they receive subsidized early retirement. These changes will
reduce the Plan’s long-term liabilities.
There will be no change in the benefi t entitlements of current retirees,
member survivors or active members who stay in the Plan until their
early retirement date.
In 2012, the SC made changes to the defi nition of contributory earnings
which limits earnings for pension purposes to seven times the CPP
earnings limit. Had the limit been in place for 2012 it would have been
roughly $350,000. The change will have effect from January 1, 2014 for
members enrolling in OMERS on or after that date. The change will have
effect from January 1, 2016 for members enrolling prior to January 1, 2014.
The new earnings limit will be in addition to the limit under which the
amount of incentive pay included in contributory earnings is limited to
50 per cent of base pay which became effective January 1, 2011.
The SC also decided to fi le the December 31, 2011 Primary Plan
and OMERS Supplemental Pension Plan for Police, Firefi ghters and
Paramedics (the Supplemental Plan) valuations with the regulators and
so the next required fi ling will be for the December 31, 2014 year-end.
In 2012, the SC invested signifi cant educational time and effort on the
broad issues of risk and growth and engaged external advisors in that
effort to gain additional perspectives. The related discussions on risk
and the potential impact of growth will enable the SC to fully consider
the notions of sustainability and affordability when making decisions on
benefi t design and contribution rate levels – decisions not taken lightly.
The SC established a Statement of Plan Design Objectives and Strategy
(SPDOS) which sets out the funding approach for the Retirement
Compensation Arrangement (RCA), including the establishment of the
Allocation Threshold, which was approved in 2011.
As discussed earlier in the reports by the Co-Chairs and CEO, strategic
planning and the governance review were also signifi cant areas of focus
in 2012.
Summary
The Plan’s funding defi cit fully refl ects the impact of the 2008
market losses. With our 2010 strategy of contribution and benefi t changes
fully implemented, and the OAC investment strategy, we expect
that the Plan will return to a fully funded position in the next
10 to 15 years.
We remain vigilant in monitoring the funded status of the OMERS Pension
Plans as we continue to face the impact of a slow global economy. While
we remain optimistic that the Plan will recover, as it has done in the past,
we will be ready to respond should further interventions be required.
As always, we remain committed to the good governance of your
pension plans and ensuring their health, viability and sustainability
long into the future.

6 OMERS Sponsors Corporation 2012 Annual Report
OMERS Sponsors Corporation
Governance:OMERS Sponsors Corporation“ The best interests of the Sponsors Corporation include governance and decision-making practices which support the health and long-term viability of the jointly sponsored OMERS Pension Plans, and give due consideration to the interests of the stakeholders and other relevant circumstances.”
The Ontario Municipal Employees Retirement System Act, 2006 (the
OMERS Act) created the SC to fulfi ll the role of plan sponsor, giving
employers and employees more direct control over the pension plan.
The SC has committed itself to upholding OMERS long history of
exemplary corporate governance through maintaining high standards
of integrity, education, transparency and communication in carrying
out its responsibilities.
Governance
The SC strives to achieve best practice standards in corporate
governance. To achieve this goal, the SC has developed policies
and practices with input and advice from third-party advisors
who are expert and experienced in the fi eld. The governance
structure includes:
• Corporate by-laws and policies that support the commitment
to a best practice standard.
• An education program for members which includes learning
opportunities in the areas of governance, pension administration,
benefi ts strategies and pension plan trustee development,
as well as mandatory orientation to the OMERS Pension Plans.
• A process for reviewing SC governance policies and processes
to ensure the ongoing effi ciency and effectiveness of its practices.
• Transparency and accountability to OMERS Plan participants
through regular meetings with plan participants and stakeholders,
together with timely print and electronic communication carried
out in conjunction with the OAC, as well as regular web site
updates and posting of by-laws, by-law amendments and
information for submitting proposals for plan design changes.
In 2011, the SC also developed and published the “SC Governance,
Mandates and Responsibilities”. This document consolidates and
articulates the SC governance structure, as well as the mandates and
responsibilities of the Board, Committees, individual Board Members,
Co-Chairs, Committee Chairs and the Chief Executive Offi cer.

7 2012 Annual Report OMERS Sponsors Corporation
Key Board Responsibilities
The SC’s key responsibilities include:
• making decisions about the design of the OMERS Pension Plans,
including benefi ts to be provided and contributions to be made;
• deciding whether to establish a reserve;
• deciding whether to fi le a valuation more frequently than
is required under the Pension Benefi ts Act;
• establishing composition, remuneration and expense reimbursement
policies for the Boards of the SC and the OAC;
• appointing members to the OAC Board;
• appointing the SC independent auditor, legal and actuarial advisors
and the CEO; and
• approving the Corporation’s budget and audited
fi nancial statements.
The SC members owe a fi duciary duty to the Corporation and must act
in the best interests of the SC.
The SC believes that:
“ The best interests of the Sponsors Corporation include governance and
decision-making practices which support the health and long-term viability
of the jointly sponsored OMERS Pension Plans and give due consideration
to the interests of the stakeholders and other relevant circumstances.”
Board Membership
The composition of the Board was established under legislation and
confi rmed by SC By-Law #4 and is based on a balanced formula refl ecting
plan membership.
The SC has a representative Board with seven Plan member
representatives and seven employer representatives. Members are
appointed by their Sponsoring Organizations (as outlined in By-Law #4) for
a three-year term. Terms are staggered to ensure ongoing continuity
and effectiveness of the Board.
Employer Representatives
• Association of Municipalities of Ontario (AMO) (2 members)
• City of Toronto (1 member)
• School Boards, rotating between Public and Catholic Boards (1 member)
• Ontario Association of Police Services Boards (1 member)
• Ontario Association of Children’s Aid Societies (1 member)
• Electricity Distributors Association (Ontario) (1 member)
Plan Member Representatives
• Canadian Union of Public Employees (CUPE Ontario) (1 member)
• Canadian Union of Public Employees rotating between
Locals 79 and 416 (1 member)
• Police Association of Ontario (1 member)
• Ontario Professional Fire Fighters Association (1 member)
• Ontario Secondary School Teachers’ Federation (1 member)
• Ontario Public Service Employees Union (1 member)
• Retiree Group – appointed from among the Municipal Retirees
Organization Ontario, the Police Pensioners Association of Ontario,
the Police Retirees of Ontario and the Retired Professional Fire
Fighters of Ontario (1 member)
Governance

8 OMERS Sponsors Corporation 2012 Annual Report
OMERS Sponsors Corporation
The Board is headed by two Co-Chairs, one appointed by the Plan
member representatives and the other appointed by employer
representatives. There are 18 total votes on the SC. The number of votes
is equally split between employer and Plan member representatives and
is further proportionately distributed using a weighted voting system.
A review of SC composition was last undertaken in 2009 to ensure the SC
continued to provide appropriate representation of the participants in the
OMERS Pension Plans. In accordance with its by-laws, the SC began the
process of conducting a review of Board composition and representation
in 2012 which included an invitation for stakeholders to provide input.
As required under the OMERS Review Act, a review of OMERS governance
was conducted in 2012 by Mr. Tony Dean. His report was delivered in early
2013. The report will enable the SC to complete its review of Board
composition and appointments in 2013.
Compensation and Expenses for SC Members
Compensation
SC members are compensated through a combination of an annual
retainer and meeting fees covering attendance at Board and committee
meetings and at other meetings or events such as the SC’s annual planning
session and the spring and fall information sessions for stakeholders.
A member’s compensation may be paid directly to the Member or to the
organization with which they are affi liated.
SC member compensation was reviewed in 2011, resulting in no changes
to the June, 2009 structure, as follows:
Annual Retainer Meeting Fee*
Sponsors Corporation Co-Chairs $70,000 $0
Committee Chair $17,800 $750
All other members $12,800 $750
* maximum number of compensable meetings is 24
Board compensation is slated for a detailed review in 2013.
Reimbursement of Expenses
SC members are entitled to reimbursement of reasonable and necessary
expenses incurred in connection with carrying out the business of the SC,
subject to the necessary approvals under By-Law #6.
SC members are also reimbursed for travel, tuition and other expenses
incurred in attending pension and governance conferences, or other
educational programs, which are approved or mandated by the SC
under By-Law #6.
Board Committees
The SC has four standing committees to assist the Board in discharging
its responsibilities. In addition, the SC and OAC have established a Joint
Council to address matters of importance to both Boards.
Plan Design Information Committee (PDIC)
The Plan Design Information Committee assists with responsibilities
relating to design of the OMERS Pension Plans including:
• coordinating and facilitating the process of gathering and considering
information; and
• arranging for the referral of questions to OAC management and legal,
actuarial and other professionals engaged by the SC.

9 2012 Annual Report OMERS Sponsors Corporation
Human Resources and Compensation Committee (HRCC)
The Human Resources and Compensation Committee’s
responsibilities relate to:
• staff levels and succession planning;
• training, education and orientation programs for members of the SC;
• compensation structure, including benefi ts, of employees of the SC;
• expense reimbursement policies in respect of employees of the SC;
• compensation and expense reimbursement policies in respect of SC
members and members of the OAC Board; and
• a performance evaluation process for the Chief Executive Offi cer.
Corporate Governance Committee (CGC)
The Members of the SC are assisted by the Corporate Governance
Committee with regard to:
• developing appropriate corporate governance practices, guidelines
and benchmarks for the SC; and
• developing by-laws for the SC.
Audit Committee
The Audit Committee assists the members in fulfi lling their responsibilities
of oversight and supervision of:
• the quality and integrity of the fi nancial statements of the SC;
• the compliance by the SC with legal and regulatory requirements
in respect of fi nancial disclosure and reporting;
• the adequacy of the internal accounting controls and procedures
of the SC; and
• the qualifi cations, independence and performance of the independent
auditor of the SC.
OAC/SC Joint Council
The Joint Council is comprised of an equal number of members from the
SC and OAC Boards and is intended to discuss and address matters of
importance to either Board with respect to the oversight and governance
of the OMERS Pension Plans.
Meeting Attendance
There were 12 regular meetings of the Board and two days of strategic
planning with the OAC Board; 22 meetings of standing committees and
7 Joint Council meetings. Overall attendance was 97 per cent, compared
to 96 per cent in 2011.
Other Events/Meetings
In 2012, SC members also attended anywhere from 9 to 32 other business
events and meetings, including: half-day Member Information sessions in
the Spring and Fall, in-house education programs on risk and growth,
meetings with government representatives, committee meetings of which
they are not members, telephone updates on issues of importance to the
SC Board and other business meetings as necessary. Numerous caucus
(employer and employee) group and individual SC members’ meetings
with their sponsor organizations are not tracked but may occur monthly for
some SC members.
Educational Programs/Conferences
SC members participate in various educational programs and industry
conferences which are either approved or mandated by the SC,
particularly for new SC members. In 2012, 10 SC members attended from
one to three industry-related conferences and seminars within North
America, lasting from one to fi ve days.
In addition, one SC member (Bruce Miller) attended a four-day Board
Governance program provided by Queen’s University.
Governance

10 OMERS Sponsors Corporation 2012 Annual Report
OMERS Sponsors Corporation
SC Board Remuneration and Expenses
2012 2011For the year ended December 31, Remuneration (i) Expenses (ii) Remuneration (i) Expenses (ii)
Marianne Love (Co-Chair) $ 70,000 $ 16,475 $ 70,000 $ 21,530
Brian O'Keefe (Co-Chair) 70,000 6,596 70,000 10,098
Wm. (Joe) Aitchison (iii) 35,800 10,722 35,800 7,222
Paul Bailey 30,800 11,739 30,800 9,625
Diana Clarke(iv) 30,800 7,298 24,167 4,755
Mark Ferguson 30,800 817 30,800 2,342
John Fleming 30,800 6,553 35,800 7,077
Jack Jones (iii) 35,800 22,967 30,800 23,527
Charlie Macaluso 30,800 3,155 30,050 2,328
Wayne McNally (iii) 33,550 2,851 30,050 8,202
Bruce Miller (iii) (v) 36,050 26,076 35,550 19,562
Garth Pierce 29,300 11,160 33,550 9,854
Frank Ramagnano 30,800 11,857 30,800 13,373
Bruce Stewart 30,050 7,172 30,800 3,858
Former Board Members - - 3,633 -
Other Expenses (vi) - 44,862 - 43,599
Total $ 525,350 $ 190,300 $ 522,600 $ 186,952
(i) Remuneration is in accordance with By-Law #6. Members receive a base retainer plus a per meeting attendance fee to prescribed maximum levels.
(ii) Includes reimbursement of reasonable and necessary expenses incurred in connection with carrying out the business of the SC or in attending pension and goverance conferences or other educational programs, including meals, travel and communications expenses; travel time is not compensated.
(iii) Committee ChairsWm. (Joe) Aitchison - CGC - Corporate Governance CommitteeJack Jones - PDIC - Plan Design Information CommitteeWayne McNally - Audit CommitteeBruce Miller - HRCC - Human Resources and Compensation Committee
(iv) Term commenced March 1, 2011
(v) Remuneration for this Member was adjusted in 2012 to correct for an underpayment in 2011.
(vi) Other Expenses include Board meeting expenses not allocated to individuals.

11 2012 Annual Report OMERS Sponsors Corporation
Governance
2012 Board/Committee Meetings
MemberSC Board
Meetings (i)Audit
CommitteeCGC
MeetingsHRCC
MeetingsPDIC
Meetings
Joint Council
MeetingsCommittees
(Total)Overall
AttendanceOther (iv)
Events/Meeting
Attended % Attended Attended Attended Attended Attended Attended % Attended %
Marianne Love (Co-Chair) (ii) 14/14 100% 1/1 7/7 4/4 7/7 7/7 26/26 100% 40/40 100% 31
Brian O'Keefe (Co-Chair) (ii) 14/14 100% 1/1 7/7 3/4 6/7 7/7 24/26 92% 38/40 95% 32
Wm. (Joe) Aitchison 14/14 100% 7/7 4/4 11/11 100% 25/25 100% 18
Paul Bailey (iii) 14/14 100% 4/4 4/4 8/8 100% 22/22 100% 19
Diana Clarke 14/14 100% 5/7 5/7 71% 19/21 90% 14
Mark Ferguson 13/14 93% 7/7 7/7 100% 20/21 95% 9
John Fleming(iii) 14/14 100% 7/7 7/7 14/14 100% 28/28 100% 23
Jack Jones 14/14 100% 7/7 7/7 14/14 100% 28/28 100% 16
Charlie Macaluso 13/14 93% 6/7 6/7 12/14 86% 25/28 89% 10
Wayne McNally(iii) 13/14 93% 4/4 4/4 8/8 100% 21/22 95% 10
Bruce Miller 14/14 100% 4/4 4/4 8/8 100% 22/22 100% 20
Garth Pierce 14/14 100% 4/4 4/4 100% 18/18 100% 13
Frank Ramagnano(iii) 14/14 100% 7/7 7/7 14/14 100% 28/28 100% 22
Bruce Stewart(iii) 14/14 100% 6/7 6/7 86% 20/21 95% 15
Overall Attendance 98% 100% 93% 96% 95% 100% 96% 97%
(i) Board meetings consisted of 12 regularly scheduled meetings of the full SC and two days of strategic planning with the OAC Board.
(ii) Until September, the Co-Chairs were ex-offi cio members of all committees except Audit, which they had previously attended only by invitation.
(iii) Non-committee members are welcome to attend with permission of the committee chair and are not eligible for a compensable meeting fee unless specifi cally requested to attend by the commit-tee chair; CGC - Paul Bailey and Wayne McNally attended 1; Frank Framagnano and Bruce Stewart attended 2; John Fleming attended 3; these are recorded under ‘Other Events/Meetings’.
(iv) Members also attended from 9 - 32 Other Events such as: the Spring and Fall Information meetings, in-house education sessions, telephone updates from the Co-Chairs on issues of importance to the SC Board and other business meetings as required, some of which may be compensable. Many Members also attended pension and governance conferences and/or recognized edu-cation programs. Co-Chairs Marianne Love and Brian O’Keefe attended an additional 8 meetings regarding the OMERS Governance Review 2012 and the Reviewer’s recommendations to the Minister of Municipal Affairs and Housing.

12 OMERS Sponsors Corporation 2012 Annual Report
OMERS Sponsors Corporation
Marianne Love, Co-ChairEmployer Representative for Association of Municipalities of Ontario
Diana ClarkePlan Member Representative for Ontario Public Service Employees Union
Wm. (Joe) AitchisonEmployer Representative for Ontario Association of Children’s Aid Societies
John FlemingEmployer Representativefor the City of Toronto
Brian O’Keefe, Co-ChairPlan Member Representative for CUPE Ontario
Mark FergusonPlan Member Representativefor CUPE Local 416
Paul BaileyPlan Member Representative for Retiree Group
Charlie MacalusoEmployer Representative for Electricity Distributors Association
Frank RamagnanoPlan Member Representativefor Ontario Professional Fire Fighters Assocaition
Bruce MillerPlan Member Representativefor Police Association of Ontario
Wayne McNallyEmployer Representative for Ontario Catholic School Trustees’ Association
Garth PierceEmployer Representativefor Ontario Association of Police Services Boards
Sponsors Corporation Members
Jack JonesPlan Member Representative for Ontario Secondary School Teachers’ Federation
Bruce StewartEmployer Representativefor Association of Municipalitiesof Ontario

13 2012 Annual Report OMERS Sponsors Corporation
To the Board of OMERS Sponsors Corporation
Report on the Financial Statements
We have audited the accompanying fi nancial statements of OMERS Sponsors Corporation, which comprise the statement of fi nancial position as at
December 31, 2012, December 31, 2011 and January 1, 2011 and the statements of operations and cash fl ows for the years ended December 31, 2012
and December 31, 2011 and a summary of signifi cant accounting policies and other explanatory information.
Management’s Responsibility for the Financial Statements
Management is responsible for the preparation and fair presentation of these fi nancial statements in accordance with Canadian accounting standards for
not-for-profi t organizations, and for such internal control as management determines is necessary to enable the preparation of fi nancial statements that are
free from material misstatement, whether due to fraud or error.
Auditors’ Responsibility
Our responsibility is to express an opinion on these fi nancial statements based on our audit. We conducted our audit in accordance with Canadian Auditing
Standards. Those standards require that we comply with ethical requirements and plan and perform the audit to obtain reasonable assurance about
whether the fi nancial statements are free from material misstatement.
An audit involves performing procedures to obtain audit evidence about the amounts and disclosures in the fi nancial statements. The procedures selected
depend on the auditor’s judgment, including the assessment of the risks of material misstatement of the fi nancial statements, whether due to fraud or error.
In making those risk assessments, the auditor considers internal control relevant to the entity’s preparation and fair presentation of the fi nancial statements
in order to design audit procedures that are appropriate in the circumstances, but not for the purpose of expressing an opinion on the effectiveness of the
entity’s internal control. An audit also includes evaluating the appropriateness of accounting policies used and the reasonableness of accounting estimates
made by management, as well as evaluating the overall presentation of the fi nancial statements.
We believe that the audit evidence we have obtained is suffi cient and appropriate to provide a basis for our audit opinion.
Opinion
In our opinion, these fi nancial statements present fairly, in all material respects, the fi nancial position of OMERS Sponsors Corporation as at December 31, 2012,
December 31, 2011 and January 1, 2011 and the results of its operations and its cash fl ows for the years ended December 31, 2012 and December 31, 2011
in accordance with Canadian accounting standards for not-for-profi t organizations.
Chartered Accountants, Licensed Public Accountants
Markham, Ontario, Canada
February 20, 2013
Independent Auditors’ Report

14 OMERS Sponsors Corporation 2012 Annual Report
OMERS Sponsors Corporation
Financial Statements
Statement of Financial Position
As at, December 31, 2012 December 31, 2011Opening Balance
January 1, 2011
Assets
Current
Cash and cash equivalents (note 4) $ 1,981,356 $ 1,979,324 $ 1,866,949
OAC receivable 636,496 594,738 808,490
Prepaid expenses and other assets 9,918 6,272 7,899
$ 2,627,770 $ 2,580,334 $ 2,683,338
Liabilities
Current
Accounts payable and accrued liabilities $ 171,357 $ 137,336 $ 249,885
Net Assets
Excess/(defi cit) of revenues over expenses from operations
Balance at beginning of year 2,442,998 2,433,453 2,437,851
Current year 13,415 9,545 (4,398)
Balance at end of year 2,456,413 2,442,998 2,433,453
$ 2,627,770 $ 2,580,334 $ 2,683,338
The accompanying notes to the fi nancial statements are an integral part of these fi nancial statements.
Signed on behalf of the Board of OMERS Sponsors Corporation:
Marianne Love
Co-Chair
Brian O’Keefe
Co-Chair
Wayne McNally
Chair, Audit Committee

15 2012 Annual Report OMERS Sponsors Corporation
Statement of Operations
For the year ended December 31, 2012 2011
Revenues
OAC expense reimbursement $ 1,978,920 $ 1,941,961
Interest income 14,949 16,042
1,993,869 1,958,003
Expenses
Contract and administrative salaries, including payroll taxes and benefi ts 696,470 688,702
Legal 194,285 181,333
Audit 6,215 5,605
Actuarial 75,261 68,679
Professional advisors and other administrative expenses (note 5) 191,530 203,512
Insurance 77,638 77,638
Board remuneration including payroll taxes and benefi ts (note 6) 548,755 536,037
Board expenses (note 6) 190,300 186,952
1,980,454 1,948,458
Excess Of Revenues Over Expenses from Operations $ 13,415 $ 9,545
The accompanying notes to the fi nancial statements are an integral part of these fi nancial statements.
Statement of Cash Flows
For the year ended December 31, 2012 2011
Cash And Cash Equivalents Were Provided By (Used In):
Operating Activities
Excess of revenues over expenses $ 13,415 $ 9,545
Changes in non-cash working capital accounts
OAC receivable (41,758) 213,752
Prepaid expenses and other assets (3,646) 1,627
Accounts payable and accrued liabilities 34,021 (112,549)
Increase In Cash 2,032 112,375
Cash And Cash Equivalents (note 4) - Beginning Of Year 1,979,324 1,866,949
Cash And Cash Equivalents (note 4) - End Of Year $ 1,981,356 $ 1,979,324
The accompanying notes to the fi nancial statements are an integral part of these fi nancial statements.
Financial Statements
16 OMERS Sponsors Corporation 2012 Annual Report
OMERS Sponsors Corporation
NOTE 1
Nature of OperationsThe OMERS Sponsors Corporation (the SC) is a corporation without share capital under the Ontario Municipal Employees Retirement System Act, 2006 (the
OMERS Act). The SC is the sponsor of the OMERS Pension Plans as defi ned in the OMERS Act. The OMERS Pension Plans are administered by OMERS
Administration Corporation (OAC) and include the OMERS Primary Pension Plan (the Plan) and the Retirement Compensation Arrangement (the RCA)
associated with the Plan and the OMERS Supplemental Pension Plan for Police, Firefi ghters and Paramedics (the Supplemental Plan). The SC is
responsible for making decisions about the design of the Plan, the RCA, and the Supplemental Plan, amendments to those plans, setting contribution rates,
and deciding whether to fi le actuarial valuations more frequently than is required under the Pension Benefi ts Act (Ontario) (the PBA).
The SC is not subject to income taxes.
NOTE 2
Change in Basis of AccountingThe Company has elected to adopt the Canadian accounting standards for not-for-profi t organizations as outlined in Part III of the CICA Accounting
Handbook, hereafter referred to as (ASNPO). These fi nancial statements are the fi rst fi nancial statements for which the Company has applied ASNPO.
The fi nancial statements for the year ended December 31, 2012 were prepared in accordance with ASNPO including the provisions set out in
Section 1500, which addresses matters related to fi rst-time adoption of this basis of accounting.
The adoption of this new fi nancial reporting framework had no impact on the previously reported fi nancial position as at January 1, 2011 and December 31, 2011
or to previously reported excess (defi cit) of revenue over expenses from operations or net assets for the year ended December 31, 2011. Consequently, a
reconciliation of previously reported net assets to excess (defi cit) of revenue over expenses from operations as reported using ASNPO was not required.
NOTE 3
Signifi cant Accounting PoliciesThese fi nancial statements have been prepared in accordance with Canadian ASNPO and include the following signifi cant accounting policies:
a) Government Grant Revenue Recognition and Net Assets
In previous years the SC received grants for operations from the Ministry of Municipal Affairs and Housing of the Ontario Government (the Ministry).
These amounts receivable were recognized as income once the amount to be received could be reasonably estimated and collection was reasonably
assured. The initial funding agreement with the Ministry, which was put in place during 2007, stated that any part of the grant funds that have not been
used or accounted for by the SC at the time the agreement was to expire, on March 31, 2009, would belong to the Ministry.
In July 2008, following the establishment of, and agreement to, a joint SC/OAC protocol for SC expenditure reimbursement from the OAC and an Ontario
Superior Court of Justice decision that confi rmed that the OAC may lawfully reimburse the SC in accordance with the categories outlined in the protocol,
the Ministry agreed to amend their initial agreement with the SC. The amended agreement authorizes the SC to use the remaining provincial funding
for a period of up to fi ve years (to March 31, 2014), to pay for the SC costs that, under the protocol, cannot be reimbursed from the OAC. OAC expense
reimbursement is recorded as revenue after the expenses are incurred in accordance with the joint SC/OAC protocol. Net assets consist of government
grant funds received, net of expenditures not reimbursed by the OAC, plus interest earned. Interest income for operations is recognized as income in
the year earned.
Notes to Financial StatementsYear ended December 31, 2012

17 2012 Annual Report OMERS Sponsors Corporation
b) Use of Estimates
The preparation of fi nancial statements is in conformity with Canadian accounting standards for not-for-profi t organizations which require management
to make estimates and assumptions that affect the reported values of assets and liabilities, income and expenses, and related disclosures. Such
estimates include the OAC receivable and accounts payable and accrued liabilities. Actual results could differ from these estimates.
c) Cash Equivalents
Cash equivalents are treasury bills which have been issued for terms not exceeding 365 days that are readily convertible to known amounts of cash
and that are subject to an insignifi cant risk of changes in value.
NOTE 4
Cash and Cash EquivalentsCash and cash equivalents consist of the following:
December 31, 2012 December 31, 2011 Opening Balance January 1, 2011
Cash on hand and balances with banks $ 498,130 $ 569,355 $ 467,880
Short-term investments 1,483,226 1,409,969 1,399,069
$ 1,981,356 $ 1,979,324 $ 1,866,949
NOTE 5
Professional Advisors and Other Administrative ExpensesProfessional advisors and other administrative expenses consist primarily of various professional advisors for information technology and governance
issues, training and other administrative expenses.
NOTE 6
Board Remuneration and ExpensesBoard remuneration and board expenses are in accordance with SC By-Law #6.
NOTE 7
Financial Instruments
Fair Value of Financial Instruments
Financial instruments of the Corporation consist of cash and cash equivalents, OAC receivable and accounts payable and accrued liabilities.
The carrying values of the above items approximate their fair value due to their short-term nature.
Credit Risk
The SC’s cash is held at a major fi nancial institution and cash equivalents are all Ontario treasury bills. The OAC receivable is due from an organization
with an “AAA” rating and therefore there is virtually no credit risk.
NOTE 8
Contingent LiabilityAs described in note 3(a), the SC could be required to repay funding received in 2007 from the Ministry, which has not been used, after March 31, 2014.
An estimate cannot be made but this amount would not exceed $2,500,000.
Notes to Financial Statements

One University Avenue, Suite 400Toronto, Ontario M5J 2P1
Telephone: 416.369.2444Toll-free: 1.800.387.0813Email: [email protected]
www.omers.com