Omega Pharma Consumer Health O T C - midcapforums.com · In 2011, Omega Pharma will have an...
22
p. 1 January-February 2008 Omega Pharma Consumer Health A pure OTC company with a strong balance sheet O T C O T C
Transcript of Omega Pharma Consumer Health O T C - midcapforums.com · In 2011, Omega Pharma will have an...

p. 1
January-February 2008
Omega Pharma
Consumer Health
A pure OTC company
with a strong balance sheet
O T CO T C

p. 2
January-February 2008
The OTC market
Definition Omega Pharma: all products available at the
pharmacy that can be bought without doctor’s prescription
OTC
Dermo-cosmetics
Food supplements
Non-prescription pharma-ceuticals
Medical devices

p. 3
January-February 2008
Brief history: 20 years of growth
� 1987: foundation by 2 pharmacists, including Marc Coucke
� “By pharmacists, for pharmacists”
� 1994: MBO by Marc Coucke
� 1998: IPO � acquisitions � critical mass + diversification
� 1998 ���� development B2B/Arseus
� 2000 ���� international development of OTC
� 2000 – Pharmygiène � France
� 2000 - Chefaro � Spain, UK, Germany, the Netherlands
� 2004 – Wartner + 60 ex-Pfizer brands � brand portfolio
� 2004 – Medestea, Aco Hud � Italy and Scandinavia
� 2007 – Bittner Pharma � rest of Europe, Russia, Ukraine,…
� 5 Oct. 2007: IPO Arseus
� � Omega = pure OTC player
� � Strong balance sheet
Marc Coucke, co-founder and current Chairman of
the Board

p. 4
January-February 2008
Omega Pharma today
� Pure OTC company
� Carve-out Arseus (24% participation through equity method)
� In Belgium (and only in Belgium) also long-term partnership with
EG/Stada for distribution of generics
� 5 reporting segments
� Belgium: historical home market
� France: first market abroad since 2000 – integrated in 2005-2006
� North-Europe: Scandinavia, Germany
� South-Europe: Portugal-Spain-Italy-Greece
� Rest of Word: CEE and key account markets (UK, Ireland,
Netherlands)
• Entered CEE in January 2007
• First step beyond Western Europe
S-Europe
18%
N-Europe
13%
ROW
21%
France
23%
Belgium
25%
Emerging
Markets
9%
Western
Europe
91%
p. 5
January-February 2008
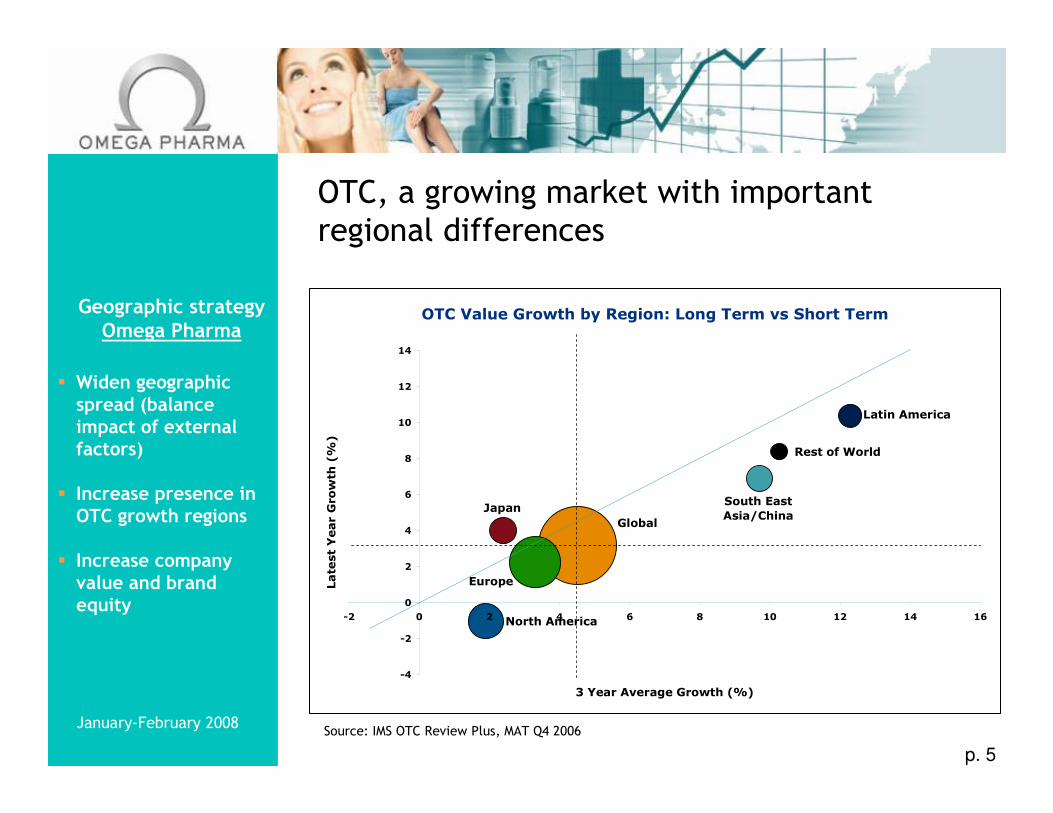
OTC, a growing market with important
regional differences
OTC Value Growth by Region: Long Term vs Short Term
Rest of World
Global
Europe
North America
JapanSouth East
Asia/China
Latin America
-4
-2
0
2
4
6
8
10
12
14
-2 0 2 4 6 8 10 12 14 16
3 Year Average Growth (%)
Latest Year Growth (%)
Source: IMS OTC Review Plus, MAT Q4 2006
Geographic strategy Omega Pharma
� Widen geographic spread (balance impact of external factors)
� Increase presence in OTC growth regions
� Increase company value and brand equity
p. 6
January-February 2008
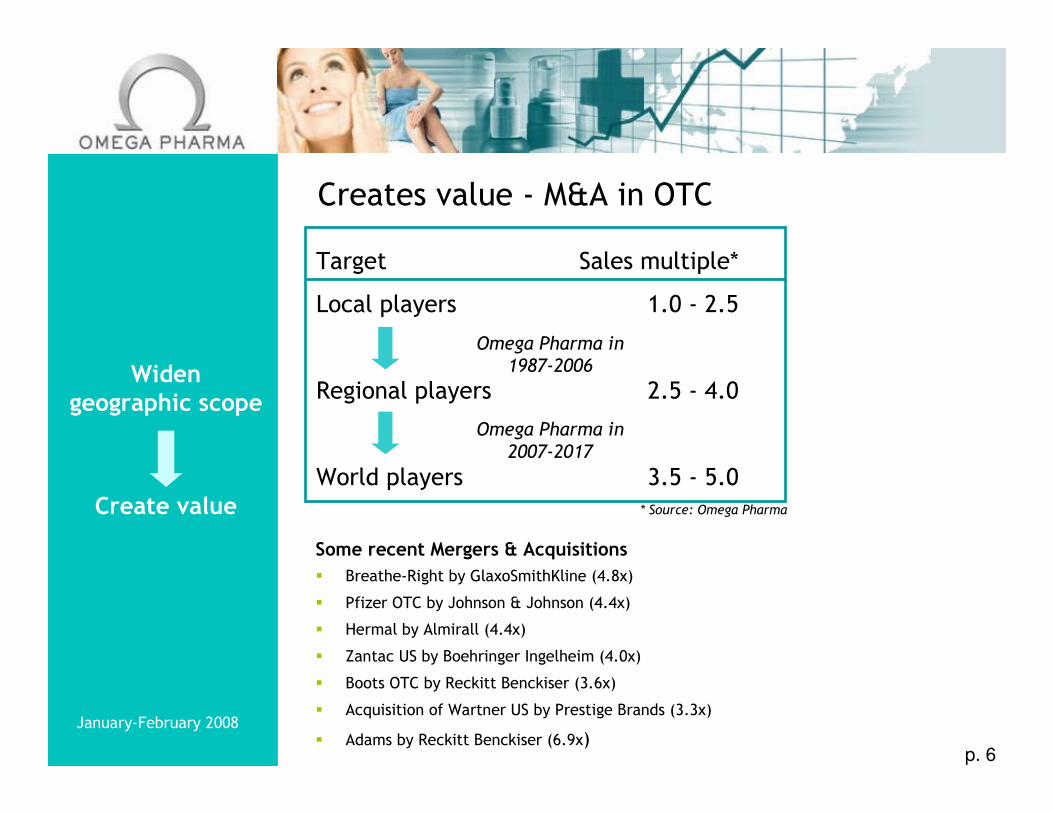
Creates value - M&A in OTC
Target Sales multiple*
Local players 1.0 - 2.5
Regional players 2.5 - 4.0
World players 3.5 - 5.0
Some recent Mergers & Acquisitions
� Breathe-Right by GlaxoSmithKline (4.8x)
� Pfizer OTC by Johnson & Johnson (4.4x)
� Hermal by Almirall (4.4x)
� Zantac US by Boehringer Ingelheim (4.0x)
� Boots OTC by Reckitt Benckiser (3.6x)
� Acquisition of Wartner US by Prestige Brands (3.3x)
� Adams by Reckitt Benckiser (6.9x)
Create value * Source: Omega Pharma
Omega Pharma in
1987-2006
Omega Pharma in
2007-2017
Widen geographic scope

p. 7
January-February 2008
Worldwide OTC ranking
Source: OTC Bulletin, 31 May 2007 (based on the figures reported by the companies concerned)
(*) The acquisition of the OTC activities from Pfizer is not yet fully included in the 2006 figures of
Johnson&Johnson.
(**) = 100 % since IPO Arseus
OTC Market
� Highly fragmented
market (top 10
companies = 33% of
world market)
� Market
consolidation
expected in 2008-
2010.
� Most companies
still have dual focus
(Rx – OTC).
� Omega Pharma is
the only pure OTC
player worldwide.
� Omega Pharma has
a unique business
model.
No separate reporting for OTCNovartis
No separate reporting for OTCSanofi-Aventis
No separate reporting for OTCProcter & Gamble
6.4%EUR 398 millionConsumer Health CareMerck KGaA
5.3%EUR 415 millionOTCSchering Plough
72%**EUR 729 millionConsumer HealthOmega Pharma **
61.8%EUR 916 millionSelf MedicationTaisho
10.1%EUR 1 064 millionConsumer Health CareBoehringer Ing.
25.0%EUR 1 814 millionHealth & Personal CareReckitt Benckiser
12.4%EUR 1 882 millionConsumer HealthcareWyeth
5.1%EUR 2 040 millionMcNeil OTC & NutritionalsJohnson & Johnson *
6.4%EUR 2 207 millionOTC MedicinesGlaxoSmithKline
21.6%EUR 2 531 millionConsumer CareBayer HealthCare
OTC as % oftotal group turnover
Turnover of theOTC divisionin 2006
OTC divisionGroup
The new ambition
p. 8
January-February 2008
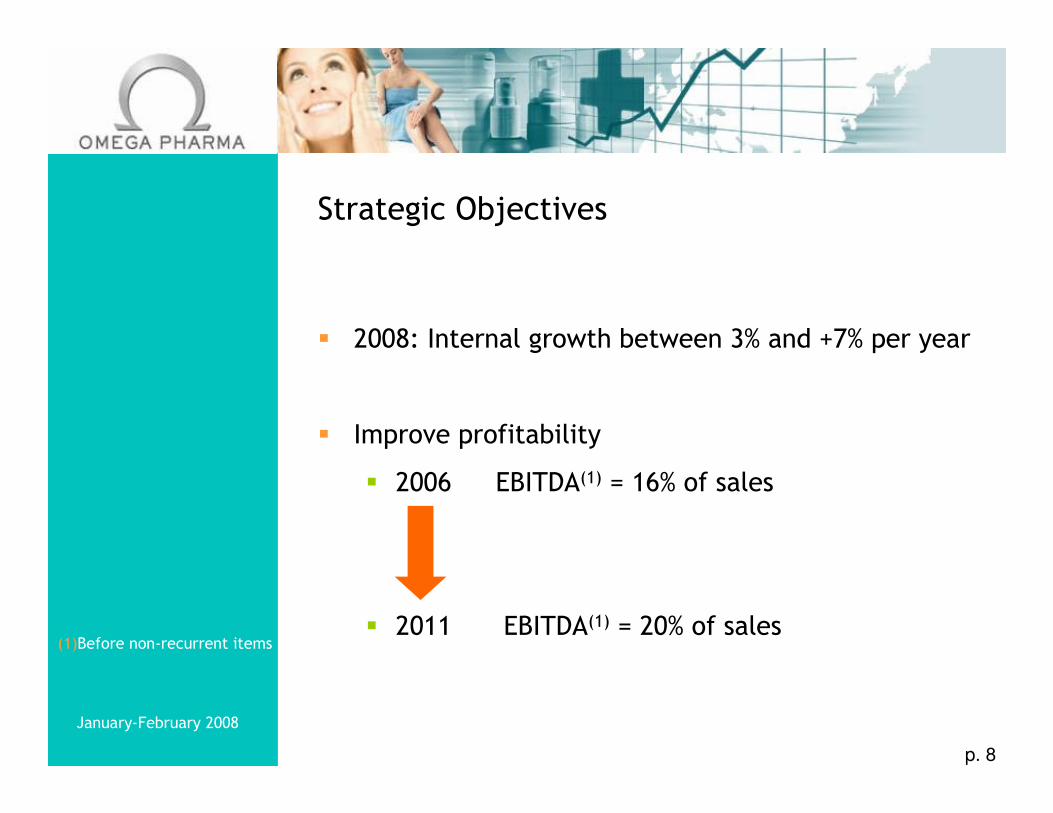
Strategic Objectives
� 2008: Internal growth between 3% and +7% per year
� Improve profitability
� 2006 EBITDA(1) = 16% of sales
� 2011 EBITDA(1) = 20% of sales(1)Before non-recurrent items

p. 9
January-February 2008
3. Operational Excellence
2. Strengthen Star Brand &
Core Category approach
1. More focus on growth markets
�
� � �
� � �
Internal
sales
growth
� � �
� � �
� �
EBITDA
≥ 20%
Clear action programs

p. 10
January-February 2008
Source: OTCims and MIDAS – Data to Quarter 4 in both years
14
54
22
105
15
-40 0 40 80 120
TotalChange
LineExtn.
NewProds
PriceChange
BaseVolumeChange
CEE
9
3
13
4
-11
-40 -20 0 20 40
TotalChange
LineExtn.
NewProds
PriceChange
BaseVolumeChange
Western Europe
1. More focus on growth areas
/CIS
OTC market growth 2001-2006
p. 11
January-February 2008
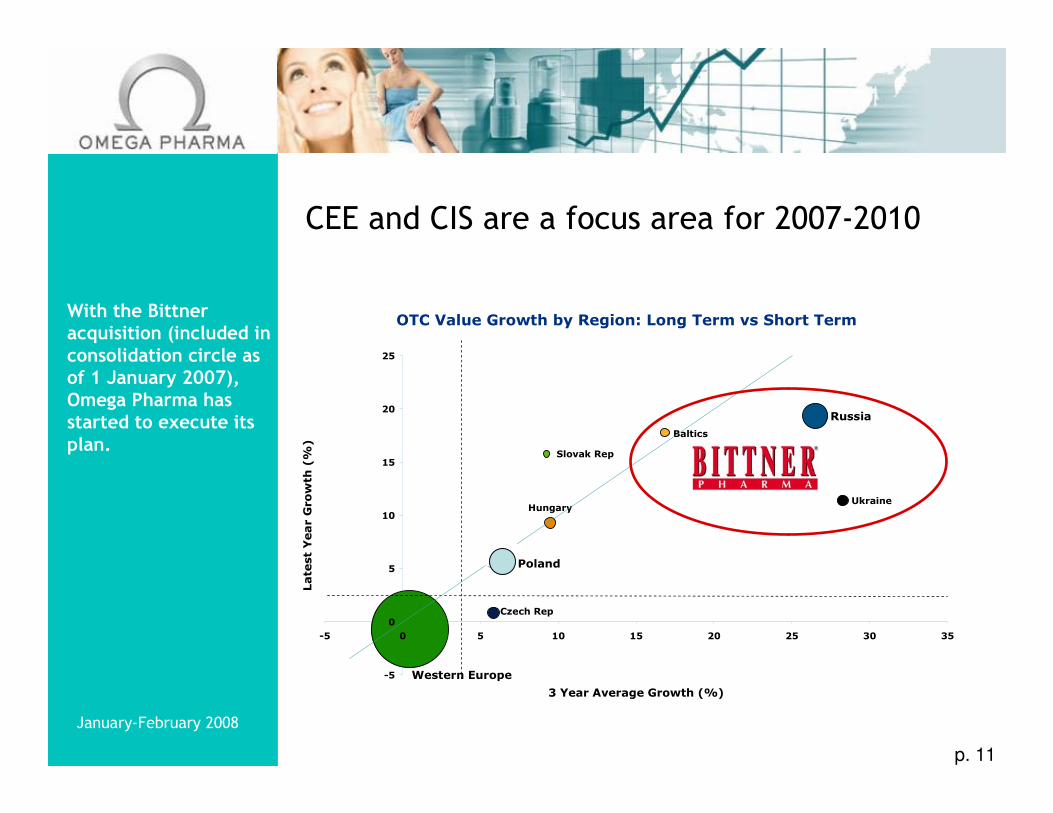
OTC Value Growth by Region: Long Term vs Short Term
Slovak Rep
Western Europe
UK
Russia
Poland
Czech Rep
HungaryUkraine
Baltics
-5
0
5
10
15
20
25
-5 0 5 10 15 20 25 30 35
3 Year Average Growth (%)
Latest Year Growth (%)
With the Bittner acquisition (included in consolidation circle as of 1 January 2007), Omega Pharma has started to execute its plan.
CEE and CIS are a focus area for 2007-2010

p. 12
January-February 2008
5060 67
5040 33
0%
50%
100%
2006 9m2007 2011e
Star Brand & Core Categories Other brands
In 2011, Omega Pharma will have an integrated portfolio, fully competitive with peers ���� 2/3 = international activities
Contribution to Omega Pharma’s branded OTC sales (in %)
2. Star Brand & Core Category approach

p. 13
January-February 2008
Non-Core &
Generics
Anti-InsectNatural Remedies
Home Diagnostics
Dermo Category
2. Star Brand & Core Category approachCore Categories
� 62% of 2007 Sales
� Higher Gross Margin
� Top 3 position in (niche) segments
� High potential for further group synergies
2007 turnover per
product category
38%
Synergy Potential
� Product Development
� Marketing Concepts
� Marketing Communication
� Production & Procurement
p. 14
January-February 2008
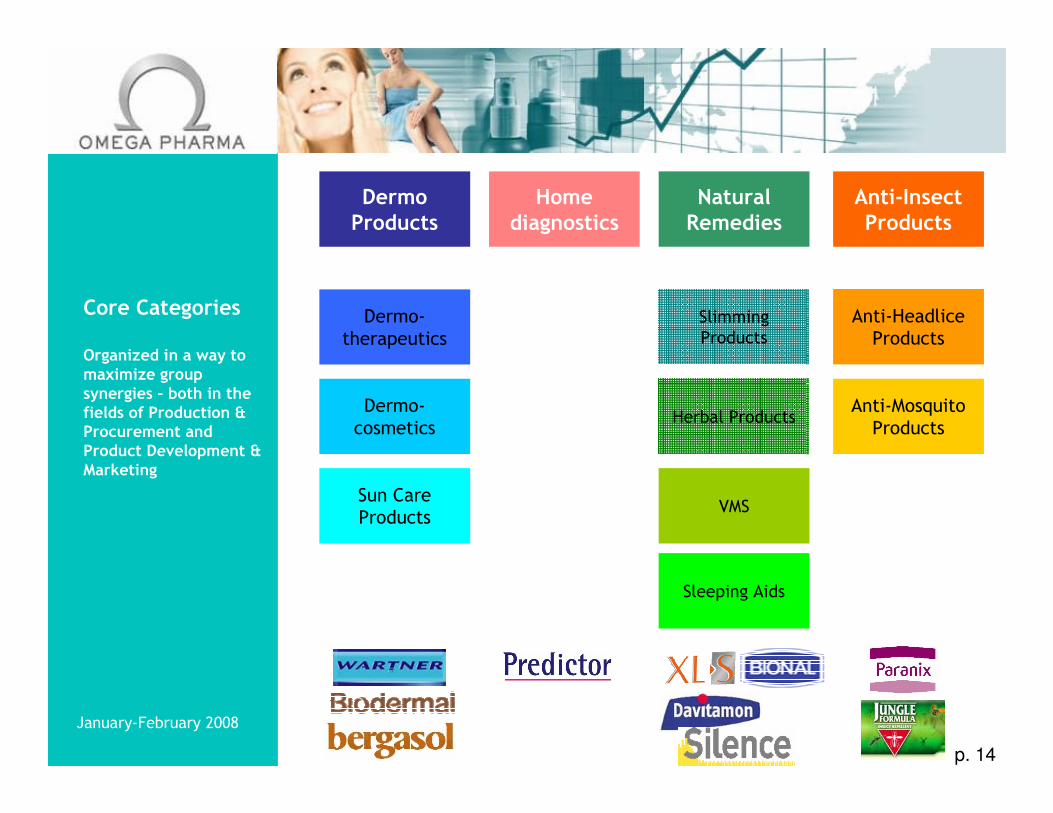
Anti-Insect Products
Home diagnostics
Natural Remedies
DermoProducts
Anti-Headlice
Products
Anti-Mosquito
Products
Dermo-
therapeutics
Dermo-
cosmetics
Sun Care
Products
Slimming
Products
Herbal Products
VMS
Sleeping Aids
Core Categories
Organized in a way to maximize group synergies – both in the fields of Production & Procurement and Product Development & Marketing

p. 15
January-February 2008
Strong in innovation
� Product development and marketing innovation
� Center of Excellence for each Core Category

p. 16
January-February 2008
Further development CEE/CIS
Roll out
Star Brands
in CEE/CIS
(3 in 2008)

p. 17
January-February 2008
Transversal
Efficiency
Marketing &
New Product
Development
Flow of
Information
Procurement
& Production
Flow of Goods
Profitable and Sustainable Growth
3. Operational Excellence

p. 18
January-February 2008
Omega Pharma - 1st Half 2007
(1) Before non-recurrent items
and corporate costs 18.6%+28%78.7+14%422.0Consumer Health (OTC)
29.6%+65%21.1+53%71.4Omega Europe ‘Rest Of World’
20.7%+38%17.4+12%84.1Omega Pharma Southern Europe
26.4%+7%14.3+5%54.1Omega Pharma Northern Europe
25.2%+36%52.8+21%209.6Omega Pharma Europe
11.0%+35%10.8+12%98.4Omega Pharma France
13.3%+3%15.1+4%113.9Omega Pharma Belgium
1H07 margin
Growth2007Growth2007Consolidated results
in EUR million (in %)
EBITDA (1)TurnoverNon-audited management figures

p. 19
January-February 2008
Omega Pharma – 2nd Half 2007
+8%729.4789.1+2%367.2Consumer Health (OTC)
+42%110.5157.2+34%85.8Omega Europe ‘Rest Of World’
+10%129.6143.1+9%59.0Omega Pharma Southern Europe
+3%96.399.6+1%45.5Omega Pharma Northern Europe
+19%336.4400.0+17%190.4Omega Pharma Europe
+10%172.8190.4+8%92.0Omega Pharma France
-10%220.2198.7-23%84.8Omega Pharma Belgium
Growth20062007Growth2007Consolidated results
in EUR million (in %)
Full Year Turnover2nd Half -Turnover
Non-audited management figures
+ 50 million euro below initial
expectations because of:
• Poor summer in Europe -19m (e)
• Substantial drop in dynamics of
Generics in Belgium -31m (e)
• Good performance in South-
Europe, Nordics, France, CEE
• Business fundamentals intact
• Strategic ambitions remain valid
Generics Belgium
� Significant part of turnover in Belgium
� Partnerships with Eurogenerics/Stada
� Generic penetration from 3% to 8%. Still below EU average.
� EG holds >50% MS
� Promising products become off-patent in near future:
� EPO (2008, hemo-dialysis, cancer)
� Recombinate (2008, hemophylia)
� Betaferon (2008, multiple sclerosis)
� Efexor (2008, depression, fobia)
� Xenical (2009, overweight)
� …
p. 20
January-February 2008
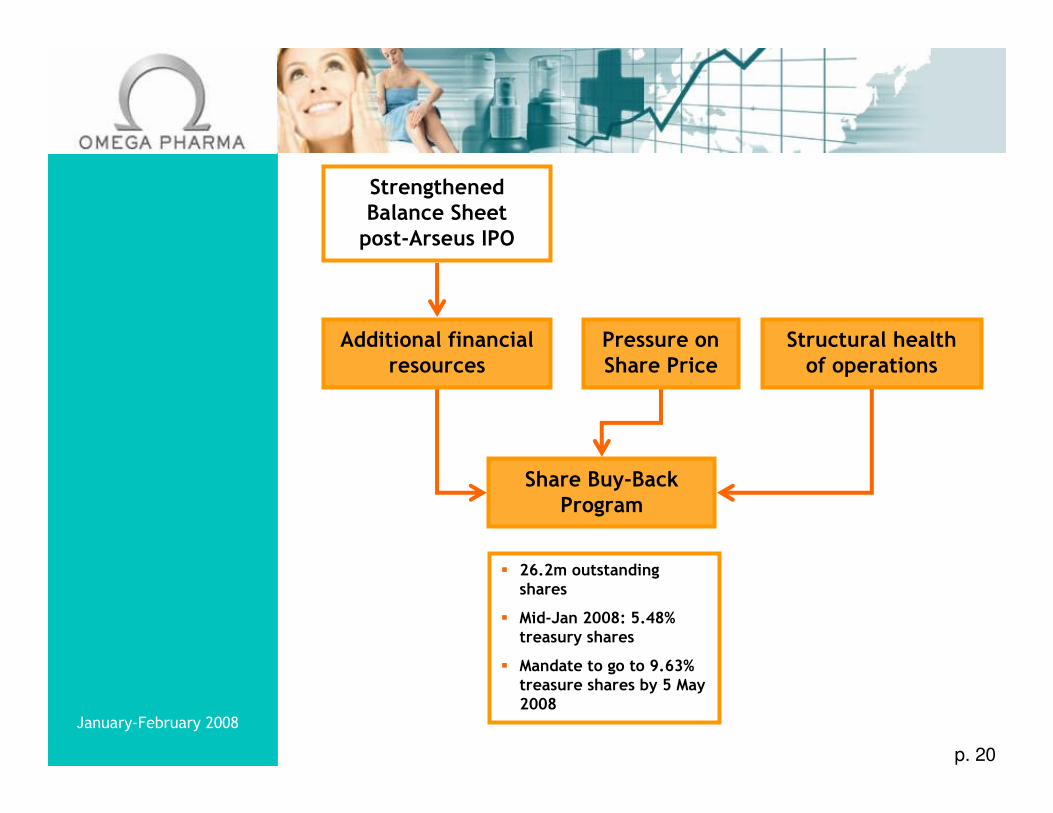
Strengthened Balance Sheet post-Arseus IPO
Share Buy-Back Program
Structural health of operations
Pressure on Share Price
Additional financial resources
� 26.2m outstanding shares
� Mid-Jan 2008: 5.48% treasury shares
� Mandate to go to 9.63% treasure shares by 5 May 2008

p. 21
January-February 2008
Omega OTC Conclusions
� Unique positioning in very attractive market
� Fundamentally strong business model with high
value creation
� High growth potential
� Further internationalisation
� Focus on growth areas
� Star Brands internationalisation
� Cross-selling of products
� Product innovation
� Corporate development / licensing-in
� Local initiatives
� High synergy potential
� Good organic/external growth opportunities
Strengths
� OTC focus
� Pharmacists’
network
� Brand strategy
� Segment selection
� Cross fertilization
Opportunities
� Attractiveness of
OTC worldwide
(CEE, SE-Asia, Latin
America)
� Active role in
consolidation of the
European OTC
market
� Competition not
focused on OTC (Rx
or mass market)

p. 22
January-February 2008
This presentation includes forward-looking statements (statements
that are not historical facts and relate to the future activities and
performance) that involve risks and uncertainties. These forward-
looking statements include statements about future strategies and the
anticipated benefits of these strategies, and they are subject to risks
and uncertainties. Actual results may differ materially from those
stated in any forward-looking statement based on a number of factors,
including the early stage of Omega Pharma group’s consideration of
these strategies, the possibility that Omega Pharma group may decide
not to implement these strategies, the ability of Omega Pharma group
to successfully implement them, and the possibility that the
anticipated benefits of these strategies are not achieved. Omega
Pharma group assumes no obligation to update the information
contained in this presentation.