»OLT BERANEK AND NEWMAN «' - Defense Technical ... j lCT public «to««;^80« ",„ I ^iMributiem...
78
*ws:Ä;r,»r ! --—-»— w - ——^--"— »OLT BERANEK AND NEWMAN «' CONSUITING DEVELOPMENT I | $ E A I C H iß Report No. 1769 I I I ! E [ alt AVENUMBER-FREQUENCY SPECTRA OF RBULENT-BOUNDARY-LAYER PRESSURE ASURED BY MICROPHONE ARRAYS By William K. Blake and David M. Chase Contract No. Nonr 3468(00) Task 2.3 3BN Job No. 11295 25 April 1969 C [ c c c [ Submitted to: Acoustics Branch, Code 468 Office of Naval Research Washington, D.C. 20360 Attention: Mr. Marvin Lasky Reproduced by the CLEARINGHOUSE for Federal Scientific & Technical Information Springfield Va 22151 ra j lCT public «to««;^ 80 « ",„ I ^iMributiem is unload __^ °-S<S CAMtllDGE NEW YOU CHICAGO I O S A N G E I E S
Transcript of »OLT BERANEK AND NEWMAN «' - Defense Technical ... j lCT public «to««;^80« ",„ I ^iMributiem...
*ws:Ä;r,»r! --—-»— w ■- ——^--"—
»OLT BERANEK AND NEWMAN ■«'
CONSUITING DEVELOPMENT I | $ E A I C H
iß Report No. 1769
I I I !
E
[
alt AVENUMBER-FREQUENCY SPECTRA OF RBULENT-BOUNDARY-LAYER PRESSURE
ASURED BY MICROPHONE ARRAYS
By
William K. Blake and David M. Chase
Contract No. Nonr 3468(00)
Task 2.3
3BN Job No. 11295
25 April 1969
C
[ c c c [
Submitted to:
Acoustics Branch, Code 468 Office of Naval Research Washington, D.C. 20360
Attention: Mr. Marvin Lasky
Reproduced by the CLEARINGHOUSE
for Federal Scientific & Technical Information Springfield Va 22151
ra j lCT public «to««;^80« ",„ I ^iMributiem is unload __^
°-S<S
CAMtllDGE NEW YOU CHICAGO I O S A N G E I E S

., .-,—^ ■ .,„■■., ————■" "-——*———w» ;.■ -■j» a . —*wmmm' " ■..»^.MJimiPM^» ^■'■'■'«W«
n
n
D D Q
WAVENUMBER-FREQUENCY SPECTRA OP
TURBULENT-BOUNDARY-LAYER PRESSURE
MEASURED BY MICROPHONE ARRAYS
By
William K. Blake and David M. Chase
Contract No. Nonr 3^68(00)
Task 2.3
Flow Noise Evaluation
D D 0 D
Report No. 1769
Job No. 11295
J 25 April 1969
D D D
Submitted by:
Ü
Submitted to:
Acoustics Branch, Code 468 Office of Naval Research Washington, D.C. 20360
Attention: Mr. Marvin Lasky
3olt Beranek and Newman Inc. 50 Moulton Street
Cambridge, Massachusetts 02138
"^BMWaBHM—»——"mm" " ' ' ' ' ' ' — '*'" '"' ws*a>

"*"-*'■' '■ '" ■■'* "^-" rT!^*""WPWWI
G D D D D D G
D D
,.£ -tfjaK jmxix*i] iM'iflrt'Wfi.1 «WT" 11'"' i ■ JIB —*■ m 11" '!■ ' -- - i nifi«! i fjin - - ----- --
Report No. 1769 Bolt Beranek and Newman Inc.
ABSTRACT
Measurements of frequency spectra of pressure along a
wind-tunnel wall have been made by single microphones and
by a longitudinal array of four flush 0.8-inch circular micro-
phones connected with alternating and with common phase. The
alternating-phase array was designed to suppress by its wave-
number filtering the background acoustic duct noise at fre-
quencies near 3 kHz. The measured levels set upper limits on
low-wavenumber boundary-layer pressure. Analysis indicates
that the high-wavenumber (convective) contribution in this
frequency range was probably negligible, but it could not be
definitely established whether background noise dominated the
spectra or whether the upper bound set on low-wavenumber
boundary-layer noise is a close one. On assumption of wave-
number independence in most of the pertinent low-wavenumber
domain, an upper bound is given for the wavenumber spectral
density of boundary-layer pressure, and its generalization by
assumption of {„-independence is discussed. At lower frequen-
cies, in identifiable domains where single-microDhone and array
spectra are dominated by the convective wavenumber comoonent of
boundary-layer pressure, satisfactory agreement is found with
theoretical predictions based on current knowledge of the
spectral density in the convective-wavenumber domain and on a
measured facial sensitivity distribution for the microphone.
In general, salient features of the array spectra correlate
well with expectation, and the array technique is demonstrated
to be a useful one for the subject purposes.
W*j .■«■UIMI—IDMII IUIII»I1HIWIWW Will ■ I ^m | .—W|— liwwyi.1
u
LiuwM*MUjwmi UP M'IW i in 'niiinflrtinMw
n Report No. 1769 Bolt Beranek and Newman Inc.
LJ FOREWORD
J Participation by Dr. Robert D. Collier in planning the
experimental work reported here is gratefully acknowledged.
The experiment was conducted by the first coauthor of this
report (WKB). n u
D □ n LJ
LI
□ Ö
D □ D
li
gg ——=—•■—g ..... i-.i.i m i i mmvmmmwtm x„mmm_,^m:^ "'mam *""*y!
n . »"»■! I» Ml I r
n
n ij
D D
D D D D D D D D
Report No. 1769 Bolt Beranek and Newman Inc.
TABLE OP CONTENTS
Abstract ..... 1
Foreword 11
List of Symbols lv
1. Introduction . . . 1
2. Pressure Spectra Wavenumber-Piltered by a Microphone Array 4
3. Description of the Microphone Array 9
4. Results of Measurements 11
4.1 Calibration of the Array Response 11 4.2 Boundary Layer Description 12 4.3 Pressure Spectra Measured by Single Microphones. . 14 4.4 Pressure Spectra Measured by Arrays 15
5. Detailed Analysis 20
5.1 Spurious Acoustic Noise 20 5.2 Wavenumber Filtering by a Single Microphone. ... 22 5.3 Estimates Concerning the Low-Wavenumber Boundary-
Layer Contribution to Pressure Spectra 25 5.4 The Convective Boundary-Layer Contribution to
Pressure Spectra 34
6. Conclusion 42
References 46
Captions for Figures 47
iii

% —' * ■"'■■ "»«u^^» n.iiFii i..jja—i^i»HI!'BimemmBHiM
U free-stream flow velocity 00
2 q dynamic pressure (»pU^/2)
U effective boundary-layer convection velocity c vt boundary-laver friction velocity
6* displacement thickness
*(k,u) '■•", wavenumber-frequency spectral density of pressure on wall
$(w) frequency spectrum of pressure at point on wall
normalized microphone frequency response
frequency spectrum of area-averaged pressure measured by single microphone
frequency spectrum of wavenumber-filtered pressure measured by array of microphones
relative bandwidth of fractional-octave filter
[■ (A<J/2TT)*..(«)] single-microphone spectrum measured in relative bandwidth Aw/w.
|P(u))|2
•„(«> ♦A(w)
Aw/w
*MCw)
[] Report No. 1769 Bolt Beranek and Newman Inc.
1 I D
LIST OF SYMBOLS
p fluid mass density (air in wind tunnel)
v kinematic viscosity
c sound velocity
x=(x,,x-) position vector in plane of wall (x1 streamwise)
k«lk,,k~) wavenumber vector
y normal distance from wall
b) radian frequency D □
U(y) mean flow velocity
0 D D 0 D D
*(k,w) average over angle of k of boundary-layer con- tribution to $(k,w) U
[J
D __ -_.-.. • ' -—
. . j. ii^.. H .1 ,ywr ■WJ|;U|W ■! •——.'— '"
L
Report No. 1769 Bolt Beranek and Newman Inc.
n Ö
Ö
n o D
n
n
LIST OF SYMBOLS (Continued.)
♦M (u),*A (w) low-wavenumber boundary-layer pressure contribu- tion to *M(w),*A(w), respectively
*_(u>)
* U) m
R
Six)
|H(k)|2
B,o,B
Re
Rc
N
d
|A(k)|2
weighted average of *(k,u) over low-wavenumber range pertinent to single microphone
boundary-layer contribution to *A_(w) from vicinity
of major wavenumber lobe m of array response
weighted average over k, [pertinent to *_(<»>)]
of boundary-layer part of *(k ,k^,ü>), where k
is wavenumber of mth major-lobe peak in array
response
radius of sensitive area of circular microphones
normalized facial sensitivity distribution of microphone
wavenumber filter expressing area averaging by single microphone characterized by S(x)
constants in approximate function fitted to measured S(x) for microphones used in present array measure- ments
(=5.93) coefficient related ';o function approximat- ing microphone facial response
effective radius of array microphones with reference to low-wavenumber pressure components
radius of arbitrary pressure sensor with uniform facial response
number of elements in linear array
center spacing of elements in array
array wavenumber filter (assuming arbitrary identical elements)
yi i > i ii iijufw-'j i» »M'jjj^iix IWITI 11 .■ i.iu.p jiyj! ■ i i 1^11 ^.pji ^mtmm^mvmm *m*m iinJW.nwnw
■IIW ■»■■win. ■"■■Ai. w.- i»^a -T>iM ■>',„ , .«^^ J^MvSo«'->>«
A. same as A„ for measurement by array of microphones
A coefficient in conjectured 6*-independent, o
a same as A with vt instead of U^ as velocity scale o
ao
[G =2TTCV1S, A-aJv./Uj*»] o ' - o
ratio of largest scale of transverse to streamwise correlation at fixed time
r Report No. 1769 Bolt Beranek and Newman Inc.
ß (»uR/U«) dimensionless frequency based on element radius L.J
2 4 AM [= 2Tr(w/Aü>)i|>M(w)/p U^] dimensionless pressure
spectrum measured by single microphone in i
relative bandwidth Aw/co. 1
wavenumber-independent spectral density of boundary-layer pressure at low wavenumbers (Ec. 22)
C,G ,A numerical constants measuring wavenumber-frequency 0 spectral density of boundary-layer pressure in
the convective ridge, as given by space-time Isotropie, scale-independent form Eq. 31*
Li
n
v (»SV,,) parameter in Eq.34 expressing velocity dispersion relative to mean convection velocity r_
-1 » a (=b6 ) parameter in Eq. 31* measuring largest scale of L_ correlation in streamwise (x,) direction
D ted time
= [l+(u/aUcr2]1/2 []
D D LI
Li I! !!

»I.»mn .MI». 1.I..-I -■ III.I. ■■«■ i ij ■ i I iipn '
I I
I I
:
0 D a Li
Report No. 1769 Bolt Beranek and Nev/man Inc.
1. INTRODUCTION
Past investigations of turbulent-boundary-layer wall-
pressure fluctuations have proceeded mainly by measurements of
frequency spectra of average pressure on single elements of
various sizes and by measurements of narrow- or broad-band
correlations. In the present work in the BBN wind tunnel, the
technique of using instead a coherent array of (four) elements
was Implemented for measurements of frequency spectra directed
mainly toward establishing bhe wavenumber-frequency spectrum
of boundary-layer pressure in the low-wavenumber domain.
In brief preliminary summary, the technique has been suc-
cessfully demonstrated and an upper limit placed on the low-
wavenumber contribution to boundary-layer noise. In a
certain frequency range the alternating-phase array discriminated
effectively against background duct noise; nevertheless, it has not
been excluded that this spurious source was still dominant. A
contribution from high-wavenumber (convective) boundary-layer
pressure was also present, but analysis suggests that this was
relatively small.
On the basis of previous measurements of turbulent boundary-
layer pressure, as well as the rudimentary kinematics of convec-
tion of pressure-generating eddies, it is recognized that the
joint wavenumber-frequency spectrum of wail pressure, say,
$(k,co) [where k=(k.,k-)], is sharply peaked with regard to
streamwise wavenumbers (k, ) at a value k,*u/U , where U is a 1 1 c c convection velocity weakly dependent on frequency and equal to
some major fraction of the free-stream velocity Uw. The decrease
with spanwise wavenumber (|kJ) is much slower, so that $(k,w)
Report No. 1769 Bolt Beranek and Newman Inc.
possesses a "convective ridge" centered at (k1,k-,) = (u»/Uc,0)
and oriented normal to the flow. Well removed from this convec-
tive domain, in a low-wavenumber domain defined by k<<u/U00,
<Kk,ü>) fails to vanish only on account of improbably high
fluctuating convection velocities and distortion and decay of ^
eddies. This latter domain, though hitherto subjected to little
conclusive investigation, has great importance in various
Instances where the system response heavily weights the low
wavenumbers. ~1
U D
Correlations and frequency spectra of pressure on individ-
ual elements have been measured by various investigators, in-
cluding Bull (1967), Willmarth and Wooldridge (1962), and
Blake (1969). The cross-spectral density of pressure on pairs
of elements have also been measured in considerable detail, for
example by Bull (1967), Blake (1969), and Wills (1967). These
latter measurements may be used to compute approximately, by
Fourier inversion, the wavenumber-frequency spectrum of pressure;
the measured cross-spectra, however, are dominated by the con-
tribution from the convective domain, so that no reliable in-
ference is possible concerning the spectral density at low
wavenumbers. Boundary-layer pressure spectra on single large
elements, on the other hand, because of the weighting represented .-,
by area-averaging, may be dominated by the low-wavenumber con- j f
tributions, but inference of the low-wavenumber level from such n measurements is ordinarily questionable on account of the rela-
tively low values of *(k,w) and the possible contamination by
spurious background acoustic noise or noise associated with |
vibration of the flow-bounding walls.
D
D D [J

■T — 1 -' ' ■ ■ ■ '
0 n
n
o n n
U
«•
ö
Report No'. 1769 Bolt Beranek and Newman Inc.
What is needed is a more discriminating wavenumber filter
that largely rejects a spurious acoustic field. The use of
alternating-phased, or more generally of phase-differenced
(steered), arrays of elements with outputs added coherently
constitutes a powerful tool for this purpose. "iis technique
was originally proposed at BBN by Dr. James E. Barger and
pursued in the present work. A description of the use oT
such an array system ha; been given by Maidanik and Jorgensen
(1967).
■***wwi a w—■
Report No. 1769 Bolt Beranek and Newman Inc.
2. PRESSURE SPECTRA WAVENUMBER-FILTERED BY A MICROPHONE ARRAY
In this section the method of wavenumber-frequency filtering
is supported mathematically. General relations and definitions
are presented with minimal derivations in view of their avail-
ability in cited references.
The space-time correlation of the wall pressures at point x,
time t and point x+r, time t+x can be written as
R(r,x) = <p(x,t)p(x+r,t+t)> , (1)
where the brackets denote time averages for this (assumed) spa-
tially homogeneous and temporally stationary field. The wavenumber-
frequency spectral density is the Fourier transform of the space-
time correlation, expressed as
I n
-q
i D
*(k,w) = (2IT)"3 /// R(r,T)e"i[k'r"u,T]d2rdT (2)
where integrals run over the infinite domain unless otherwise
indicated. The frequency spectral density of wall-pressure
fluctuations is
*(w) = ^ / R(0,T)eiü)Tdx = // $(k,ü))d2k . (3)
The measurement of the frequency spectral density of wall
pressure fluctuations involves the influence of the microphone
facial sensitivity distribution S(x) in averaging small wavelength
wall-pressure components. Thus, assuming instantaneous response,
when subject to a pressure field p(x,t), the microphone measures
an area-averaged pressure
1 □ D D D 11 []
[]
D
«snpia -r- npr — -ninf? "———r- . -a.) »»m ' - I-.» ■■ ~T- ■■■ ■., _ ., -^ ,|^^IP, --—
i
n i
ö
n
:I
!I
a
Report No. 1769 Bolt Beranek and Newman Inc.
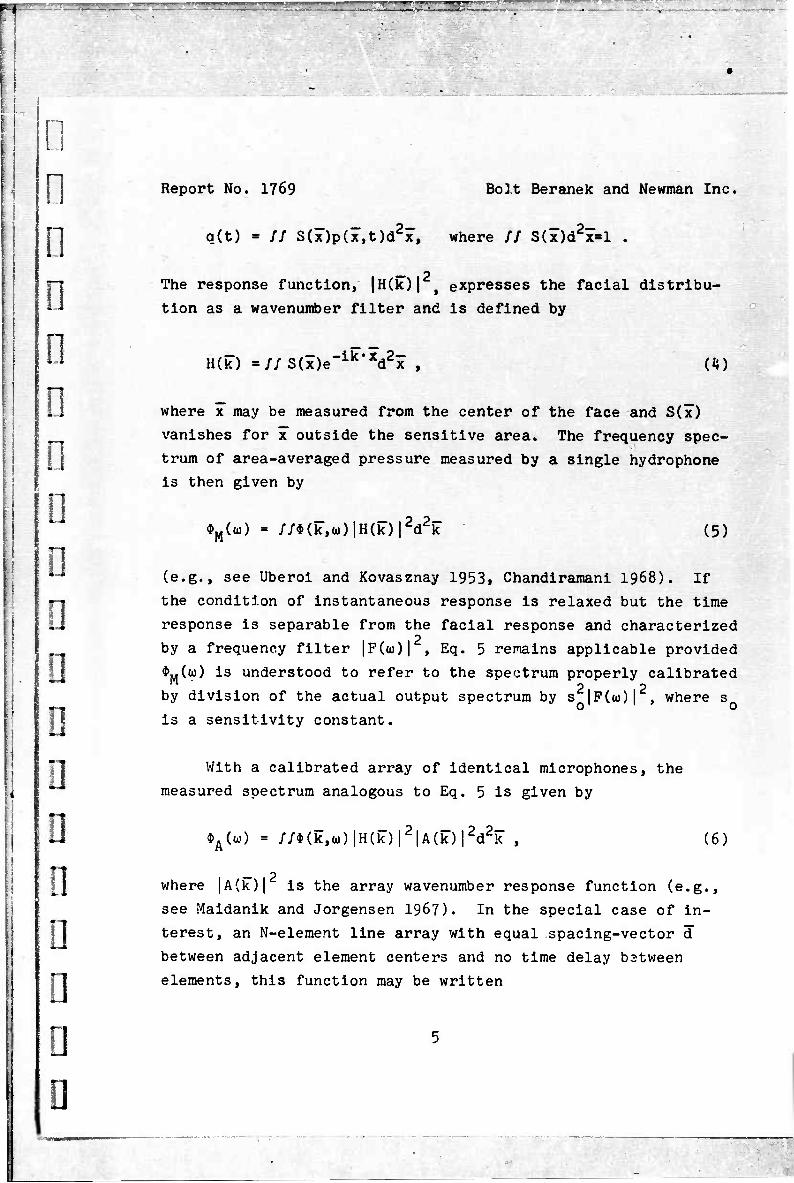
o_(t) = // S(x)p(x,t)d2x, where // S(x)d2x=l .
The response function, |H(k)| , expresses the facial distribu-
tion as a wavenumber filter and is defined by
H(k) =//S(x)e"ik*xd2x , (!})
where x may be measured from the center of the face and S(x)
vanishes for x outside the sensitive area. The frequency spec-
trum of area-averaged pressure measured by a single hydrophone is then given by
•„(«) = //$(k,a))|H(k)|2d2k (5)
(e.g., see Uberoi and Kovasznay 1953, Chandiramani 1968). If
the condition of instantaneous response is relaxed but the time
response is separable from the facial response and characterized
by a frequency filter |F(u)| , Eq. 5 remains applicable provided
$M(u)) is understood to refer to the spectrum properly calibrated 2 2 by division of the actual output spectrum by s |F(a>) | , where s
is a sensitivity constant.
With a calibrated array of identical microphones, the
measured spectrum analogous to Eq. 5 is given by
•A(w) = //*(k,w)|H(k)|2|A(k)|2d2k , (6)
where |A(k)|' is the array wavenumber response function (e.g.,
see Maidanik and Jorgensen 1967). In the special case of in-
terest, an N-element line array with equal spacing-vector d
between adjacent element centers and no time delay b3tween
elements, this function may be written
n Report No. 1769 Bolt Beranek and Newman Inc.
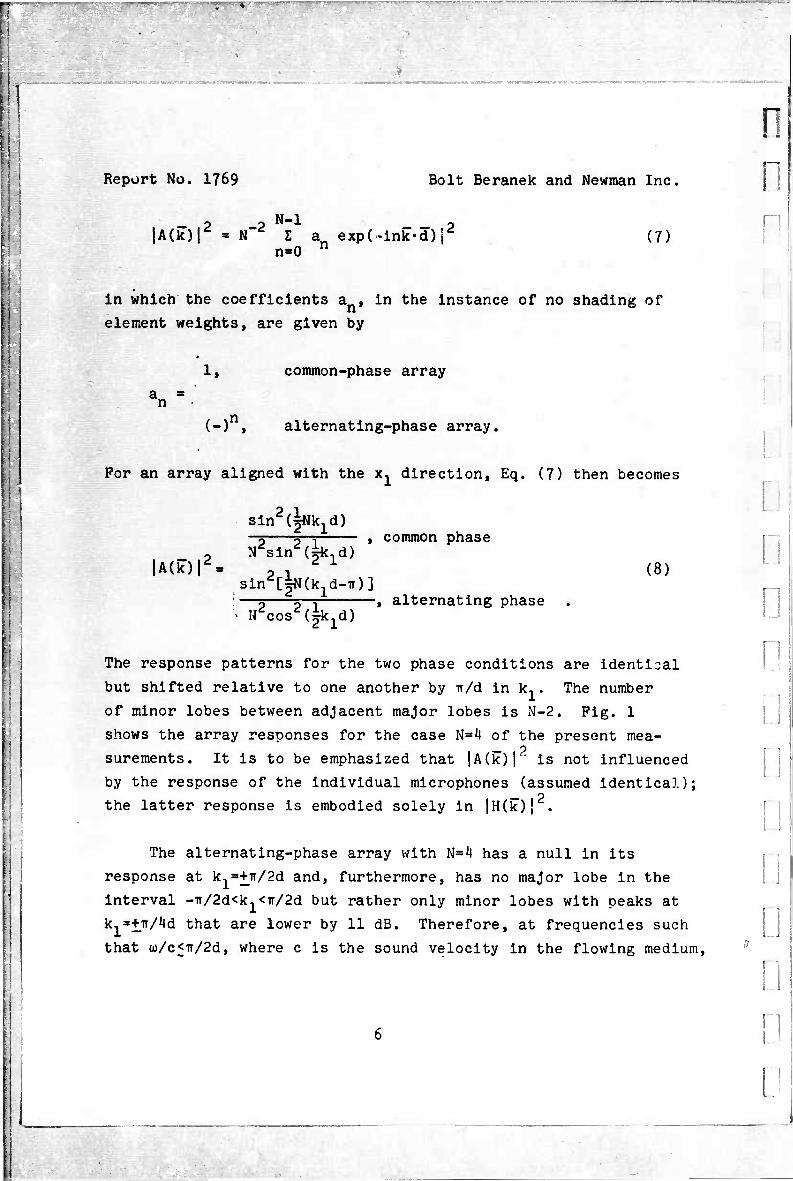
H N-l |A(k)|2 = N~2 I a„ exp(~ink-d)j2 (7)
n»0 n
in which the coefficients a , in the instance of no shading of element weights, are given by
1, common-phase array an =
(-)n, alternating-phase array.
For an array aligned with the x, direction, Eq. (7) then becomes
sin^lfflCjd) —5 5—? , common phase r~
|A(k)|2» ? , 2 X (8) sin^fN^d-ir)]
: —5 5—T , alternating phase > ircosd(^k1d)
The response patterns for the two phase conditions are identical but shifted relative to one another by ir/d in k, . The number of minor lobes between adjacent major lobes is N-2. Pig. 1 shows the array responses for the case N=^ of the present mea- surements. It is to be emphasized that |A(k)| ' is not influenced by the response of the individual microphones (assumed identical); the latter response is embodied solely in |H(k)j .
n
u D
The alternating-phase array with N=4 has a null in its response at k,=+Tr/2d and, furthermore, has no major lobe in the interval -ir/2d<k1<ir/2d but rather only minor lobes with peaks at k,=+ir/4d that are lower by 11 dB. Therefore, at frequencies such that ü)/c<ir/2d, where c is the sound velocity in the flowing medium,
Ü

. .~".".~—~"~ "~"""" •fK.vmmv..yn'tvm>i
n
n
u
n
D D
[]
D U
Report No. 1?69 Bolt Beranek and Newman Inc.
acoustic fields (for which k<w/c) arc- substantially attenuated
by the array. More important, to the extent that spurious
acoustic noise originates in the wind-tunnel blower and propa-
gates up the tunnel purely via a longitudinal wave with
k.ss-u/c,at that particular frequency given by <i>/c=u/2d the
array response to such noise is nil. This same null occurs
in the case of the common-phase array, but the latter array
presents a major-lobe rather than only a minor-lobe response
to non-longitudinal sound waves having |k,|<u/c.
o The response |H(k)j has an upper bound that decreases
with kR for kR>ir and thus attenuates the high-wavenumber compo-
nents of the pressure field; in particular, when uR/U^ir, it
attenuates the convective component (k,*w/U ) of the boundary-
layer pressure. Hence the array is most sensitive at the
lowest-k major lobes of the comb filters (8), i.e., at
k.s+wir/d for alternating phase and at k.=0 and k,*+2ir/d for
common phase. The contribution from the next higher major lobes
for the alternating-phase array, k,=+3ir/d, can be nearly eliminated
by choice of transducer radius (and facial response) such that
H(k)=0 at k=3ir/d. In such case, assuming that the attenuation of
the background acoustic field and the high-wavenumber boundary-
layer pressure field suffices, the alternating-phase array mea-
surement yields a weighted integral over k, of the boundary-
layer pressure spectrum 0(k,<D) at a relatively well defined, low
(nonconvective) streamwise wavenumber such that |k, |=ir/d.
For a circular element of radius R and uniform facial sensi-
tivity, we have
|H(k)|2 = [2J1(kR)/kR]2 (k2=k2+k2) , (9)
wmum

t { ^.«.w»^-«-»—~.-_
n ri
whose upper bound decreases for kR>ir as (kR)~ . In this
instance the condition H(k>0 at k=3*/d yields (3w/d)R=3.8
or d/R*2.5. Pigs. 2a and 2b show the corresponding computed
function |A(k1)|2|H(k1)|
2 at k3=0 for both phase relations.
The microphones actually used had a facial sensitivity signifi-
cantly nonuniform, as discussed in Section 5.2.
,J
i I
D
IT
Li
D
D
:■ ■■ ' :
gggS^S***!^ in.■] Jiimiiim.iiiiip.lm.i ii jW.ua, JWi law■ ^ !.'"1SSL^_-_"~ yji^BjMPaMTiM^»1*'^'-/
MIMIIIHIIM .
Report No. 1769 Bolt Beranek and Newman Inc,
-A lil
! i
I G 1 0 D D □ □ □ D □ D []
D a
3. DESCRIPTION OP THE MICROPHONE ARRAY
The measurements were made using an array of four Brüel &
Kjaer No. 4131 1-in. diameter microphones with 1.06-in. separa-
tions. An area of the microphone diaphragm at least 0.8 in.
in diameter is sensitive to pressure (Brüel and Rasmussen 1959).
The design of the array system was guided by three factors:
1) Simplicity in construction
2) Cost of instrumentation
3) Desired suppression of high-wavenumber, convective
boundary-layer contribution to measured spectra at
high frequencies by area averaging by large micro-
phones .
The first two factors were important because the experi-
ments were considered as preliminary studies. Development of
an inexpensive array system was considered sufficient to in-
dicate the usefulness of the array approach to the boundary-
layer measurements. The third factor reflects the objective
of setting a minimum upper limit on the low-wavenumber boundary-
layer contribution to array spectra in the frequency range of
high discrimination against background acoustic noise.
The four B&K microphones were flush mounted in a plexiglass
support, which was mounted in the wind tunnel with the micro-
phones aligned in the streamwise direction. (The description of
the tunnel is in Section 3.1.) The microphones were driven
by four B&K No. 2801 power supplies, the outputs of which led to
a phase control circuit and transformer to provide the common
and alternating phase characteristic for the array.

'.-?
Report No. 1769 Bolt Beranek and Newman Inc.
The phase-control circuit put the 200-ohm impedance
outputs from the power supply transformers in series. The
phase shifting was accomplished by alternating the voltage
level (positive or negative) with respect to the common ground.
The voltage level was shifted by using three-way toggle
switches, and the combined signal from the power-supply outputs
was fed to the high-impedance side of a transformer. The
summed output was fed to an Ithaco No. 255-A low-noise, high-
gain amplifier.
Frequency analysis was performed using filters of l/10th-
octave bandwidth of a General Radio (G.R.) sound and vibration
analyzer No. 1564-A and a G.R. graphic level recorder
No. 1521-A.
n n
I!
10

B—wTj»gv?wpi|||»!ay^jiia.•^-«^■-^" __• ;__. . ■
.
|
: i I I
n D □
n D D □ D □ □
□ □
^j-~m»sai^mm JMttAlBW IM»VljUi:!^lP&;»aSfe^^^^^ yy^wK;
Report No. 1769 Bolt Beranek and Newman Inc.
k. RESULTS OP MEASUREMENTS
! 4.1 Calibration of the Array Response
The microphones in the array were matched to give identical
outputs to a 124 dB (re 0.0002pb) acoustic signal generated by a
B&K No. 4220 pistonphone. Variable resistors in the phase cir-
cuitry permitted attenuation of the signal generated by the most
sensitive microphones in the array so that all microphones could
be tuned to give identical outputs to the calibration pressure.
_ p The array response, |A(k)j , was determined by passing
plane-wave sound over the microphone array. The array was
mounted in a plywood panel supported from the ceiling of the
BBN anechoic chamber. A ten-inch speaker situated 10 feet from
the array was used to generate the sound field. The plane of
the array and plywood panel was parallel to the axis of the
speaker. The wavenumber of the sound field is 2irf/c, where f is
the frequency and c is the speed of sound in air. Fig. 3 shows
the measured array response as a function of sound-field fre-
quency after correction for the microphone frequency response
and area-averaging effects. Points calculated for the total response
function, s^|A(k)|2|H(k)| , are included.* The common-phase 0 2 2 9
array response was not measured; the calculated points of s |A| JH|
are shown in Fig. 4. The computation of |A|2 is considered reliable
in view of the excellent agreement between measurement and
computation shown in Fig. 3 for the alternating-phase array.
The frequency responses of the microphones and the speaker
efficiency decrease rapidly above 10 kHz so that the array cali-
bration was not possible at high frequencies.
*The microphone response factor was computed for uniform facial response rather than the actual one (see Figs. 15, 16); use of the latter would raise the minor-lobe peak at 10.5 kHz by 2.2 dB and have a decreasing effecc at lower frequencies.
11

_______
-
4.2 Boundary Layer Description
The turbulent boundary layer measurements were performed
in the BBN wind tunnel facility described by Chandiramani and
Blake (1968). Three sides of the test-section ducting were
lined with 6-inch thick "Ultrafine" acoustic insulation which
diminished the reverberant field in the ducting above about
1 kHz. The boundary layer was formed on the formica-coated
test-section bottom and was artificially thickened by covering
the first 7-1/2 inches of the panel with coarse sandpaper. The
mean velocity profile was measured with an 0.040-inch diameter
flattened-tip total-head tube. The velocity data were extracted
from readings of total less static head obtained on a slanted
tube manometer. The readings were recorded to 0.01 inch of
water. The static pressure was obtained with a 0.1-inch I.D.
copper tube flush-mounted in the floor of the test section. All
12
n n n n n
Report No. 1769 Bolt Beranek and Newman Inc.
The sensitivity of each microphone was determined as
-63.12 dB re lV/ub, and the sensitivity of the major lobe of the
alternating-phase array was measured as -51.5 dB. This is con-
sistent with the level as calculated from the array response of
Pig. 2a within a + 1 dB uncertainty in the measurement.
There is nearly complete cancellation of the 3kHz sound _
field as would be expected by examining Fig. 2a for the com-
puted alternating-and common-phase array responses. The fre-
quency responses of the microphones were identical up to 6 kHz;
they remained constant within 1 dB to 2 kHz, decreased to
-1.75 dB at 3 kHz, -3 dB at 4 kHz, and -5 dB at 6 kHz. None
of the pressure spectra have been corrected for this decrease
in response, but the data analysis is largely confined to fre-
quencies below 3 kHz.
n D Ö
D D
U II Ü
Q
m_r 'r^^rf'jf "'■'^y^f1'"''**" '"''" jiw,»»)"»'w!"1 ■'.'-»»j". . i ..'i..IT»i.. .. ^if.pii ii ——'"—: > —«-»w»»^»»».?
□ D n a G a G o
[ n
Report No. 1769 Dolt Beranek and Newman Inc
measurements were made at 4.5 feet from the test-section inlet
which is the assumed boundary-layer origin. The plate Reynolds
number for the measurements, NRex = xU^/v , ranged from 10v
L* to 1.7 (105) for Uw = 40 ft/sec to 63 ft/sec.
G G
Fig. 5 shows the mean velocity profile (U/U^ vs. y/*o.99^
for the three free-stream velocities considered in these measure-
ments. The boundary-layer thickness was determined as the dis-
J-J tance from the wall at which U(y) = 0.99U« . The displacement
thickness was determined by mechanical integration of the mean
velocity profile according to the definition
6* = / (1-U/U )dy . G 1
The outer mean flows of the boundary layers follow quite
closely the velocity-defect law derived from Coles' wake law.
This law may be written
U -U - — -5.75 log(y/60i99)+£ [2-w(y/60<99) ] ". (10)
where, from Hinze's (I960) curve fitting to Coles' data
w(y/6) ■ 1+sin [(2y/6-l)ir/2]
and n = 0.55 for the zero-pressure-gradient boundary layer.
< is the von Karman universal constant and is given the value of
O.i, by Coles. The agreement between measurements and Eq. 10
in Fig. 6 is very good.
13

n Report No. 1769 Bolt Beranek and Newman Inc.
These velocity measurements are of limited extent, but
they give evidence that an experimentally reproducible boundary
layer flow has been considered. In addition, the measurements
indicate that the boundary-layer outer flow is described by the *~*
universally applicable velocity-defect law for zero-pressure-
gradient boundary layers.
39.5 1.2
51.5 1.25
63 1.15
f
The effect of nonvanishlng microphone size on the measured
14
n TABLE OF BOUNDARY LAYER PROPERTIES l-J
U.Cft/see) 60>99(in.) S*(in.) v„/UM NRe6, rj
0.184 0.0405 3.6xl03
0.205 0.0401 4.6xl03
0.184 0.0395 5.7x10³
Ö 4.3 Pressure Spectra Measured by Single Microphones
The frequency spectral density of wall-pressure fluctuations
is shown in Pig. 7 in the non-dimensional form
*M(ü,)U»/q25* vs- W6VU«, (q-pl^/2).
The single-microphone spectrum measurement is represented by the
mathematical equivalent in Eq. 5. The spectrum is two sided,
i.e.,
2 <P^> = 2 / ♦(w)du. (ID y
■■
spectrum is shown by comparing the current measurements with those |-r
of Blake (1969) and Willmarth and Wooldridge (1962). The present
LI
•

■ ■ ■ <t
n n n n n D
[]
LI
D D
D D U
[]
[J
LI
Report No. 1769 Bolt Beranek and Newman Inc.
measurements were made with microphones approximately 0.8 inch
and 0.2 inches in diameter (B&K No. 4131 1-inch and B&K No.
4136 1/4-inch condenser microphones respectively). The spectra
were-measured over a wide range of nominal microphone diameters (D),
0.11 <D/6«<4 (12)
and may be shown qualitatively consistent by applying Corcos'
(1963) correction. The flagged points of the current data and
the arrows on the spectra of Willmarth and of Blake denote fre-
quencies for which coR/U =1. A Corcoi correction of about +3 dB
would be required at this frequency. When the Corcos correction
is applied to the data, all corrected spectra are spread about
the uncorrected Elake (1969) line within +3 dB for frequencies
less than u)6*/U =10.
h.Ü Pressure Spectra Measured by Arrays
The measurements obtained with each of the two array con-
figurations, alternating-phase and common-phase, are reported
here in this order, and the salient features identified. De-
tailed analysis is given in Section 5.
The l/10th-octave pressure levels as filtered by the
alternating-phase array are shown in Figs. 8, 9, and 10 for
the three flow speeds considered. The corresponding levels
measured by a single one-inch microphone are shown for compari-
son. The array sensitivity used to convert voltage to SPL per
15
».fcn ■ WIM \»m 11
Report No. 1769 Bolt Beranek and Newman Inc.
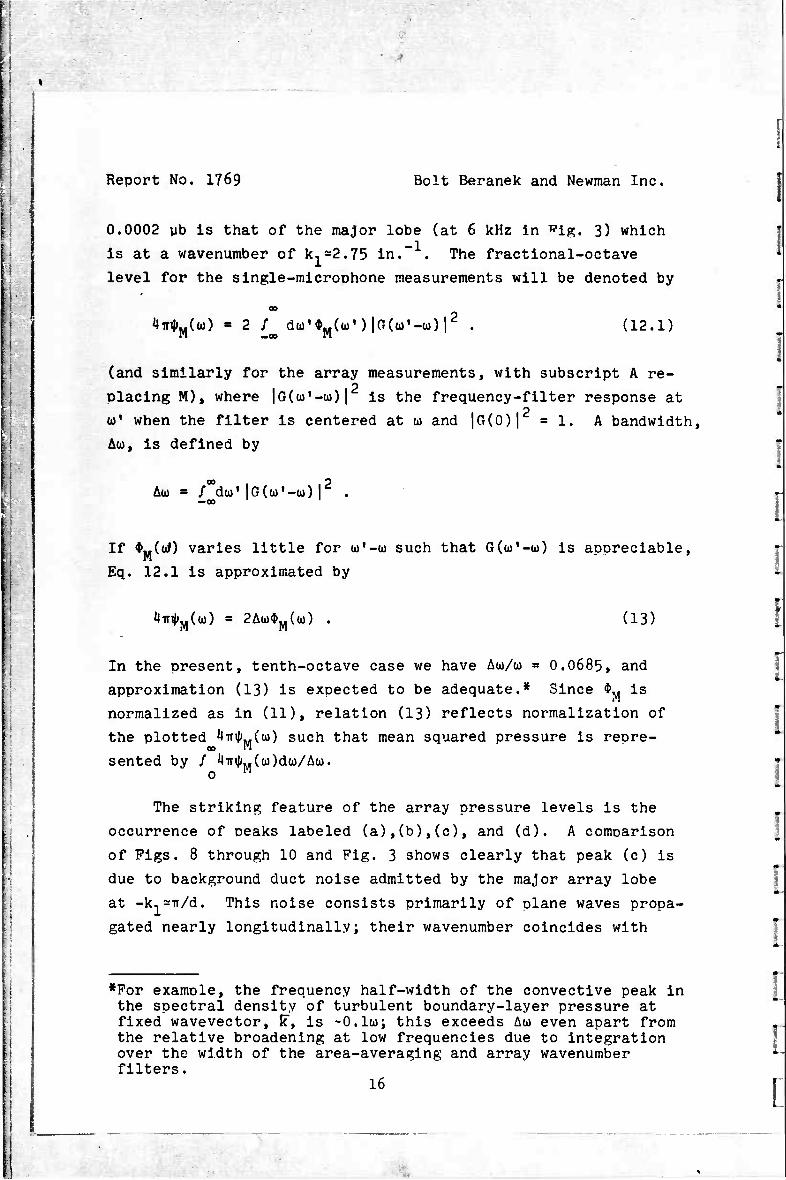
0.0002 ub is that of the major lobe (at 6 kHz in wig. 3) which
is at a wavenumber of k,=2.75 in. . The fractional-octave
level for the single-microphone measurements will be denoted by
*»in|»M(u) = 2 / dü)'*M(w')|0(u>f-ü))r . (12.1)
(and similarly for the array measurements, with subscript A re-
placing M), where |G(co• —to) | is the frequency-filter response at
u' when the filter is centered at w and |G(0)| =1. A bandwidth,
Aw, is defined by
Au = /"du1 iGU'-uOl2 . ••00
If *M(«J) varies little for u'-w such that Gdo'-aO is appreciable,
Eq. 12.1 is approximated by
**inJ»M(ü)) = 2Au)$M(w) . (13)
In the present, tenth-octave case we have Au/u = O.O685, and
approximation (13) is expected to be adequate.* Since $„ is
normalized as in (11), relation (13) reflects normalization of
the plotted 4TH|; (w) such that mean squared pressure is repre-
sented by / ^in^M(w)da)/Au. o in
The striking feature of the array pressure levels is the
occurrence of Deaks labeled (a),(b),(c), and (d). A comoarison
of Figs. 8 through 10 and Fig. 3 shows clearly that peak (c) is
due to background duct noise admitted by the major array lobe
at -k,=ir/d. This noise consists primarily of plane waves propa-
gated nearly longitudinally; their wavenumber coincides with
*For example, the frequency half-width of the convective peak in the spectral density of turbulent boundary-layer pressure at fixed wavevector, k~, is -O.lto; this exceeds AOJ even apart from the relative broadening at low frequencies due to integration over the width of the area-averaging and array wavenumber filters.
16
■
0 n n n n
n
n D
D Ü
Reoort No. 1769 Bolt Beranek and Newman Inc.
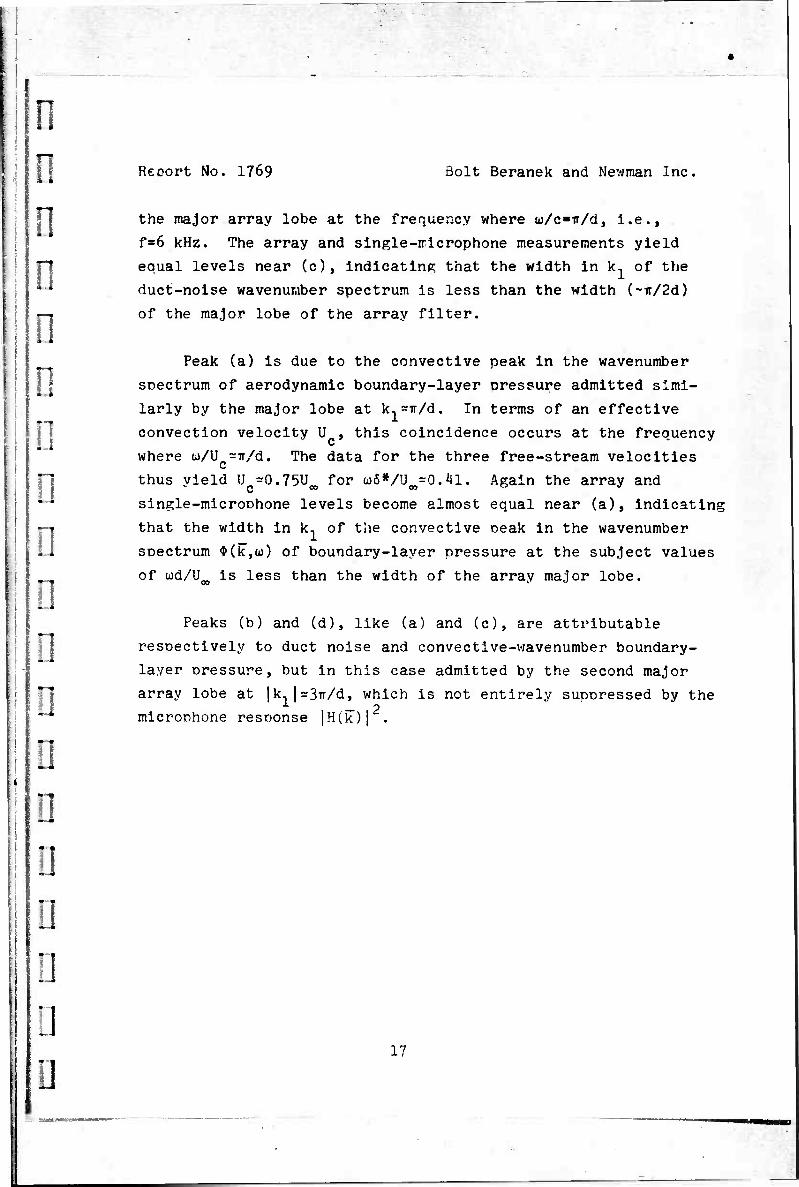
the major array lobe at the frequency where u/c=ir/d, i.e.,
f=6 kHz. The array and single-microphone measurements yield
equal levels near (c), indicating that the width in k, of the
duct-noise wavenumber spectrum is less than the width (~ir/2d)
of the major lobe of the array filter.
Peak (a) is due to the convective peak in the wavenumber
sDectrum of aerodynamic boundary-layer pressure admitted simi-
larly by the major lobe at k^ir/d. In terms of an effective
convection velocity U , this coincidence occurs at the frequency
where u/U =ir/d. The data for the three free-stream velocities
thus vield U =0.75U for u6*/U =0.41. Again the array and ** c oo oo " "
single-microDhone levels become almost equal near (a), indicating
that the width in k, of the convective peak in the wavenumber
spectrum <J>(k,<*>) of boundary-layer pressure at the subject values
of ud/U^ is less than the width of the array major lobe.
Peaks (b) and (d), like (a) and (c), are attributable
resoectively to duct noise and convective-wavenumber boundary-
layer oressure, but in this case admitted by the second major
array lobe at |k, | =3ir/d, which is not entirely suppressed by the — 2 microphone resnonse |H(k)| .
17
Report No. 1769 Bolt Beranek and Newman Inc.
-18-
t
I !
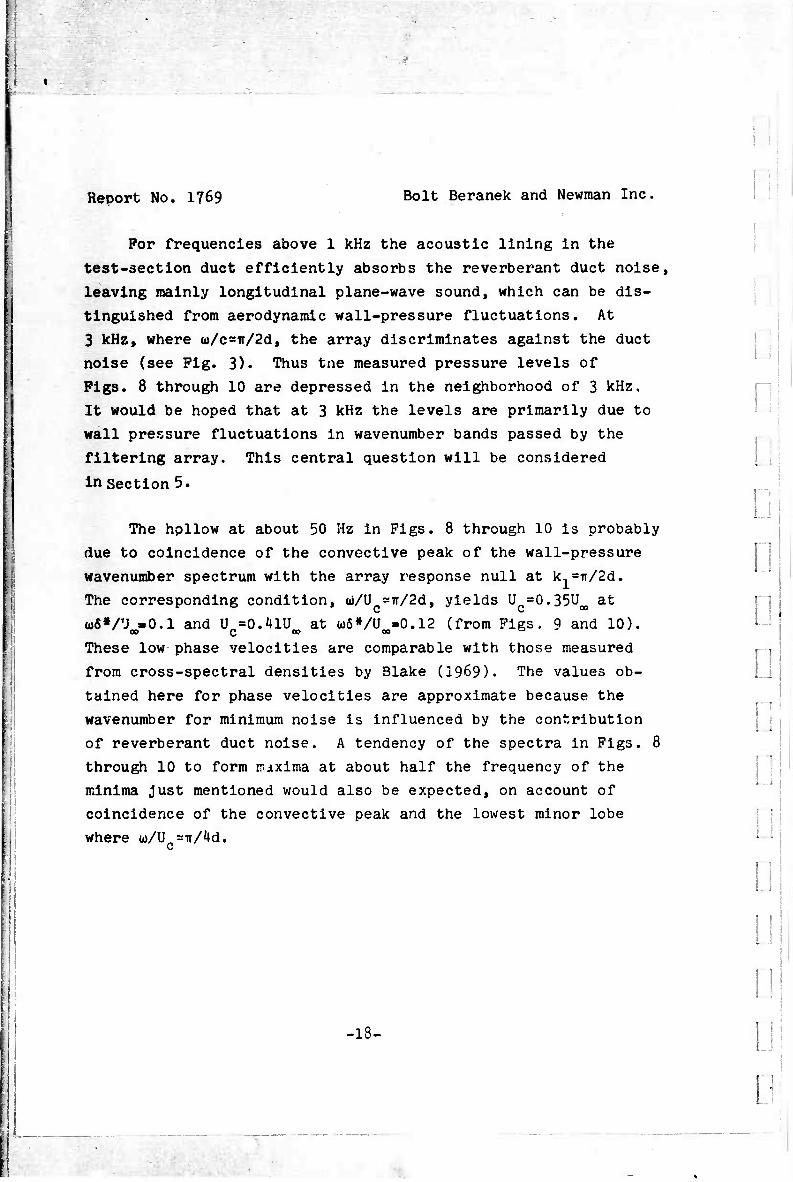
For frequencies above 1 kHz the acoustic lining in the
test-section duct efficiently absorbs the reverberant duct noise,
leaving mainly longitudinal plane-wave sound, which can be dis-
tinguished from aerodynamic wall-pressure fluctuations. At
3 kHz, where w/c=ir/2d, the array discriminates against the duct
noise (see Fig. 3). Thus tne measured pressure levels of
Figs. 8 through 10 are depressed in the neighborhood of 3 kHz.
It would be hoped that at 3 kHz the levels are primarily due to
wall pressure fluctuations in wavenumber bands passed by the
filtering array. This central question will be considered
in section 5.
i !
r ! . i
i
D D
The hpllow at about 50 Hz in Figs. 8 through 10 is probably
due to coincidence of the convective peak of the wall-pressure
wavenumber spectrum with the array response null at k,=ir/2d.
The corresponding condition, oi/U =ir/2d, yields U =0.35U at
wfiV'J »0.1 and U =0.4lU at w5*/U -0.12 (from Figs. 9 and 10). 00 Q DO 00 *-*
These low phase velocities are comparable with those measured j—.
from cross-spectral densities by Blake (1969). The values ob- LJ
tained here for phase velocities are approximate because the
wavenumber for minimum noise is influenced by the contribution
of reverberant duct noise. A tendency of the spectra in Figs. 8
through 10 to form maxima at about half the frequency of the
minima just mentioned would also be expected, on account of
coincidence of the convective peak and the lowest minor lobe
where w/U =Tr/4d. LJ
LI
LJ D
■ ' ■"
n n 3
:;
■ i
r
U
Report No. 1769 Holt Beranek and Newman Inc.
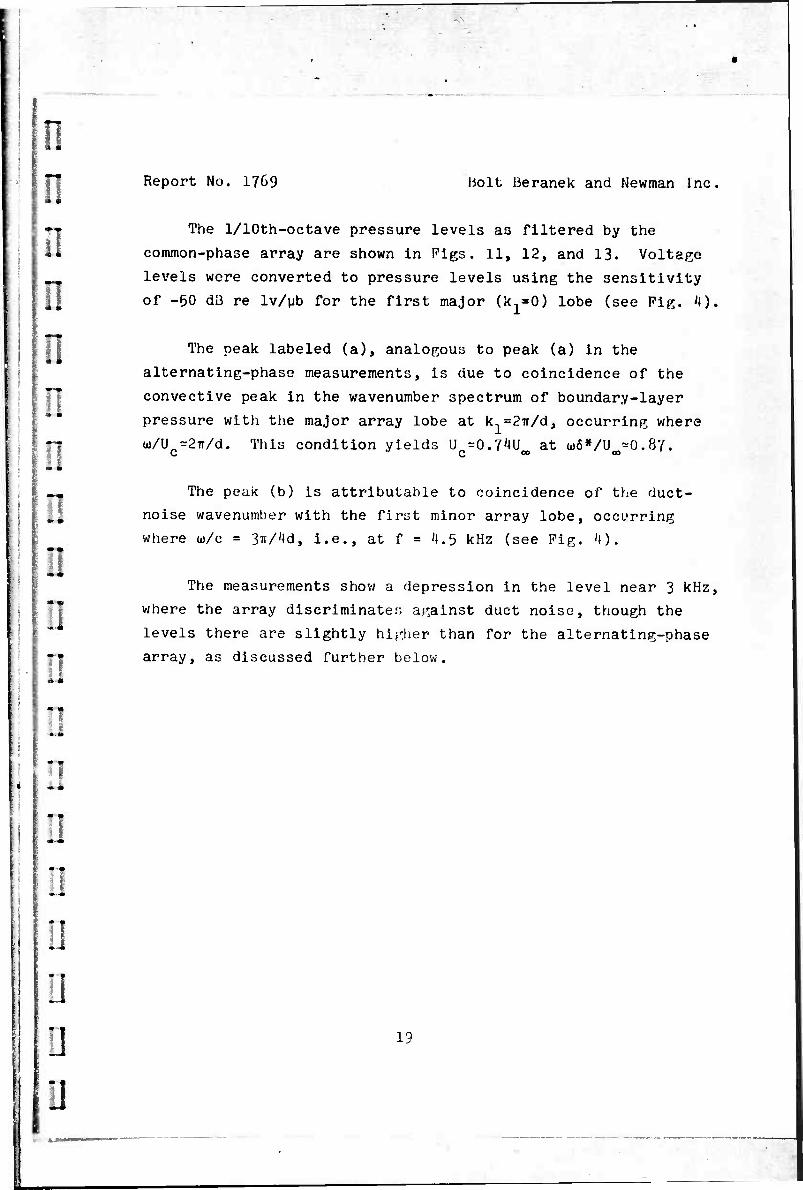
The 1/lOth-octave pressure levels as filtered by the
common-phase array are shown in Pigs. 11, 12, and 13. Voltage
levels were converted to pressure levels using the sensitivity
of -50 dß re lv/ub for the first major (k.=0) lobe (see Pig. 4).
The peak labeled (a), analogous to peak (a) in the
alternating-phase measurements, is due to coincidence of the
convective peak in the wavenumber spectrum of boundary-layer
pressure with the major array lobe at k-^Tr/d, occurring where
w/U =2Tr/d. This condition yields U =0.7^ at w6*/U =0.87. C C co 00
The peak (b) is attributable to coincidence of the duct-
noise wavenumber with the first minor array lobe, occurring
where u>/c = 3ir/J*d, i.e., at f = '4.5 kHz (see Fig. 'I).
The measurements show a depression in the level near 3 kHz,
where the array discriminates against duct noise, though the
levels there are slightly higher than for the alternating-phase
array, as discussed further below.
19

Report No. 1769 Bolt Beranek and Newman Inc. i
5. DETAILED ANALYSIS
In this section we consider further the question whether
the measured array spectra are actually dominated by low-
wavenumber turbulent boundary-layer pressure fluctuations in
the range of high discrimination against duct noise and against
high-wavenumber (convective) boundary-layer noise, and whether,
at any rate, the upper limit placed on the low-wavenumber
spectral density is usefully low. We also compare the spectra
for the arrays and single microphones with the convective con- r
tribution estimated by a suitable model of boundary-layer
pressure; we thereby attempt to demonstrate consistency, if
not improve the determination of the model parameters, in the
domain where the convective contribution dominates the spectra,
and to estimate this contribution to array spectra in the domain
where it may be hoped to be smaller than the lcw-wavenumber
contribution. Due consideration is given to the wavenumber
filter corresponding to the actual facial response of the
microphones.
5.1 Spurious Acoustic Noise
20
Li
:
We consider the possible level of spurious noise in the
vicinity of 3 kHz where the arrays most discriminate against it.
One indication is provided by the difference in levels at 3 kHz
measured by the array and by a single microphone; this difference
may be compared with the difference in levels at this frequency
in calibration, as implied by the array calibration in Pig. 3.
The former difference (10.5 to 12 dB at the three speeds) is
much less than the difference in the instance of the calibration
signal, so that it is at least not excluded that the array noise
level at 3 kHz is much higher than the extant acoustic background
on account of the boundary-layer noise contribution, as desired.
[

n n n n D ..
Ö
1 []
- »
;
;I !
D
Report No. 1769 Bolt Beranek and Newman Inc.
t
On the other hand, the decreased level difference for noise
measured during flow relative to that in calibration could be
due instead to an angular distribution of the spurious acoustic
noise that is less sharply peaked in the longitudinal direction
(~k,=u>/c,k^=0), and hence less discriminated against at 3 kHz
by the array, than is true of the highly longitudinal acoustic
field produced by the calibration source in the absence of
flow-excited modes in the tunnel. Hence, the smaller differ-
ence between the subject levels and the shift of the noise
minimum for the alternating-phase array from 3 kHz to a somewhat
higher frequency, though encouraging, do not necessarily imply
that dominance by spurious acoustic noise is excluded even
near 3 kHz.
A possible further indication is provided by comparison of
the levels measured by the alternating-phase and common-phase
arrays. The difference in measured levels at the three speeds
is shown in Fig. 14 for the entire frequency range above 1 kHz.
Also shown is the difference predicted for a purely longitudinal
acoustic field using the theoretical array responses (for the
alternating-phase array this closely approximates that measured
in calibration, Fig. 3)- In this way we use the common-phase
measurements to estimate the background noise spectrum for the
alternating-phase measurements.*
*An estimated single-microphone background-noise spectrum is shown in Figs. 11-13.
21

Report No. 1769 Bolt Beranek and Newman Inc.
Since the excess of the alternating-phase level over the
common-phase level Pttains a maximum at about 7 kHz, it is again
evident that the noise in this range cannot be predominantly due
to a more or less Isotropie acoustic field, for in that event
the alternating-phase level would continue to increase relative
to the other all the way to roughly 9 kHz (see Pigs. 3,*0. At
the same time, if the noise were strictly longitudinal and
acoustic, i.e., *(k,w)«5(k,+<»>/c)6(k.,), the maximum would occur
back at 6 kHz. Further, under this assumption the levels would
be equal at 3 kHz, rather than at about 4 kHz, as measured. It
does not seem excluded, however, that in the frequency range in
question, including, in particular, 3 kHz, the predominant noise
on both arrays may be acoustic, having a wavenumber spectrum
peaked where k, is slightly less than m/c and |k~|<<k,, i.e.,
peaked in the longitudinal direction but with significant magni-
tude for k, somewhat less than a>/c.
The scaling of measured levels with flow speed is also per-
tinent and will be considered in Section 5-3.
In all, the evidence does not appear to permit a conclusion
as to whether the dominant array noise in the neighborhood of
3 kHz is spurious acoustic noise or boundary-layer pressure
fluctuations. Hence the measurements place only an upper limit
on the latter contributions.
5.2 Wavenumber Filtering by a Single Microphone
D
! In preparation for detailed analysis of the contribution to
measured pressure spectra by the turbulent boundary layer, we
must consider the specific area-averaging function |H(k)| for
the microphones with their particular facial sensitivity distri-
bution (see Section 3).
22 :
- «4ggrcue2£EimmNMre*'.8£9aiu>.wc^-
n . Report No. 1769 Bolt Beranek and Newman Inc.
A measured sensitivity distribution across the diaphgram
diameter of a microphone of the subject type has been given by
Brttel and Rasmussen (1959, Fig. 1*0. The sensitivity function
has negligible frequency dependence up to 2 kHz, and, though
r-7 the frequency filter |P(OJ)| decreases perceptibly beyond this,
the spatial function S(x) for use in Eq. 4 changes little on
up to 4 kHz. The function S(x) derived from the measured sensi-
tivity distribution with neglect of small phase differences and
assumption of circular symmetry is shown in Pig. 15 (Brüel
and Rasmussen 1959).
D n
This function, which we now write S(r/R) with argument (r/R)
defined as distance from the element center in units of the
D D L! LJ
sensitive radius (R-0.378 in.), can be closely approximated by a
function of the form
S(r/R)/S(0) = B[l-3JQ(or/R)] (0<r<R) , (14)
with
B-0.198, ct=2.96, B=-4.06; (15)
the latter function is also shown in Fig. 15. Form (14)permits
the quadrature of Eq. 4 to be performed to yield the correspond-
ing area-averaging function, written as |H(k)| =|H(kR)| , where
(Chase 1969) z[l-3J (a)]J,(z)+aßJn (a)J^(z)-a
2z_1j (z) H(z) = ° . I -i 2 1 ' (16)
(z£i-a^)[l/2-(B/ot)J1(a)]
23
24
::
D Report No. 1769 Bolt Beranek and Newman Inc. ||
In general, as kR-*», the least upper bound on |H(kR)|
decreases as (kR)~^ if S(r/R) Is discontinuous at r=R [i.e.,
S(1)*0] and as (kR)"5 if S(1)=0 but the first derivative
S'(r/R) is discontinuous [i.e., S»(D/0]. The parameter
values (15) satisfy the latter conditions, and (16) yields in -•
this case **
|H(kR)|2-*2co(kR)"5cos2(kR-ir/i|) , (17)
where
4a2B2J2(a) c s i , 5.93 , 0 Tr[l-2(ß/a)J1(a)]^
for kR>>a and kR>>l. Though the approximation given by (14) and
(15) to the measured sensitivity is generally good, as shown by
Fig. 15, it has limited validity with regard to the small-scale
variation of the true sensitivity near the element periphery.
Accordingly, because of the sensitivity of H(ic) to this varia-
tion at large kR, beyond some maximum kR we should not use (16)
and (15), or the limiting form (17), except for order-of-
magnitude considerations; this safe maximum kR, however, will be
large compared to IT.
The area-averaging function |H(kR)| for the microphone, as
approximated by (16) and (15), is shown in Fig. 16 along with
the result in Eq. 9 that would apply if the facial sensitivity
were uniform. The difference is evidently consequential, the
actual lobes being much wider and the rate of decrease from lobe
to lobe more rapid. There is no possible choice of a constant
Ü
n .
! J
n i !
Report No. 1769 Bolt Beranek and Newman Inc.
effective radius in a wavenumber filter corresponding to uniform
facial sensitivity that can yield this second property; the
actual microphone discriminates more effectively against higher
wavehumbers.
I
n n
Li
□ n u D D
According to Pig. 16, the level of |H(k)| for the non-
uniform facial sensitivity is given at the first two major lobes
k,=Tr/d, 3ir/d of the alternating-phase array (for k_*0) by
»0.7 dB and -7.1 dB, respectively; thus in contrast to Fig. 2a
for uniform sensitivity, in the configuration used the second
major lobe is not very well suppressed by the microphone response.
5.3 Estimates Concerning the Low-Wavenumber Boundary-Layer Contribution to Pressure Spectra
So far as the major lobe of |H(kR)| is concerned, for kR up
to where 10 log |H(kR)j =-20 dB, as seen from Fig. 16,
the averaging is rather well approximated by the function (9)
for the uniform case, provided the effective radius is taken as
Re=XR with X=0.72 (and R=0.378 in.).
We may thus approximate the low-wavenumber contribution,
say $„ (w), to the sinLle-microphone spectrum $M(«) of Eq. 5 as
~ff/R„ $M_(cü)=2ir / dk k[2J1(kRe)/kRe]'1<I>(k,w) (18)
where $(k,oj) represents the average of $(k,uj) over the angle of
k and the upper limit is chosen to include just the low-k domain
where -the area-averaging function is large. If the wavenumber
spectrum Hk,w) is roughly constant in the pertinent domain, say A
equal to $ (w), (18) becomes
25
W.V-—«*■«««"*•-

j v
-
appears highly likely since ir/2d<<5j[ . Then from Eqs. 6 and 8
*A_U)*E *m_(w) s (20a) m
oo p p 1/2 p 2 1/2 2 *m_(ü>) = (n/2d)/oodk3[2J1((k^+kp Re)/(kJ+kp Rg] *(km,k3,W) ,
(20b)
where k denotes the wavenumbers of major lobes, i.e., m '
km =
(2m+l)TT/d, alternating phase
2rmr/d, common phase ,
and the sum runs over those small integers (positive, negative, and
zero) corresponding to major lobes that may contribute appreciably.
If the wavenumber spectrum $(k ,k,,w) is roughly independent of k..
in the domain where the .integrand may be appreciable, say equal
to $ (u)), En. 20b becomes m
26
n Report No. 1769 Bolt Beranek and Newman Inc.
♦MJ«MIR;2$_(W) ; (19) O
for nonconstant $(k,w), Eq. 19 may be regarded as defining an A * "
average ♦ (w) for the low-k region.
n With regard now to the low-wavenumber contribution to the
array spectra, say ♦»_(«*>), we tentatively suppose that 4>(k,<*>)
remains roughly constant over the width (~ir/2d) in k, of each **
major array lobe; except for the possible radiative boundary-
layer contribution from wavenumbers k near co/c, this condition
appears hi
we obtain ::
iu
L «

1
n n Report No. 1769 Bolt Beranek and Newman Inc.
$m (u)*2ir(dR )"1(k R )"2S.(2k R )«(w) , (21) m- e me lmem
n Li
v;here S. denotes a Struve function; more generally, like Eq. 19,
this equation defines average values ♦m(*«0 of *(k ,k,,u). (I for given m, we note, is not identical for the two types cf
array.) From (19) and (21) the ratio of the m-th lobe part of
the array spectrum to the single-microphone spectrum may be
written
*m_(ü))/$M_(ü>)--(2TT2)~ Nm
2(d/Re)S1(2irNmRe/d)[$m(ü))/*_>(ü))] , (22 )
where
2m+l, alternating phase
ü n U
D □ n
D ii
N = m
2m, common phase, m^O ;
for the special instance of common phase, m=0 lobe,
*0_(w)/$M_(w) = (V3ir)(Re/d)[$0(u>)/*_(«)] . (22b)
Including in the sum (20a) the major lobes k =+ir/d, +3n/d
for the alternating-phase array and k =0,+2ir/d, HMJir/d for the
common phase array, and inserting in (22) numerical values for
the present measurements, we obtain
*A-(u)/*M-(w)l
[[O.I83* (u>)+0.038*^w) ]/*_(u),
alternating phase
[C0.109*o(u)+0.105*1(t0 + 0.010i2(u)]/*_(uj) ,
common phase ,
(23)
27
Report No. 1769 Bolt Beranek and Newman Inc.
where we have assumed * independent of the sign of k , as m m appropriate provided k <<u)/UoB. Assuming that the wavenumber
spectrum <Mk,w) is roughly independent of ic over all the per-
tlnent domains, so that * (w)=*_(w)=*(k,w), Eq. 23 yields
10 log[*A_(u>)/*M_(ü))] =
-6.6 dB, alternating phase
-6.5 dB, common phase
(24)
Thus the low-wavenumber boundary-layer contribution to the array
spectra is estimated, on assumption of constant $(k,w), to lie
below the single-microphone spectra by about 6.5 dB for both
arrays (at all speeds). If a measured array spectrum is domi-
nated by this boundary-layer contribution rather than by spurious
noise, we should therefore expect that the corresponding single-
microphone spectrum would exceed it by about 6.5 dB or more
(more if the single-microphone spectrum contains appreciable
spurious noise).* The measured spectra in the neighborhood of
3 kHz satisfy this condition and are thus not inconsistent with
domination of array spectra by the boundary-layer contribution.
Since the measured spectra for the common-phase array exceed those
for the alternating-phase array in this frequency range, result
(24) would imply that the former spectra are dominated by spurious
noise; since the differences are only a few dB, however, the
crude assumption of wavenumber-independent $(k,w) entailed in
result (24) renders such a conclusion uncertain.
. .
*It will be indicated in Section 5.4 that the high-wavenumber, convective boundary-layer contribution to spectra is not dominant at frequencies >1.5 kHz. ::
28
Ü
0
! r
:i
Report No. 1769 Bolt Beranek and Newman Inc.
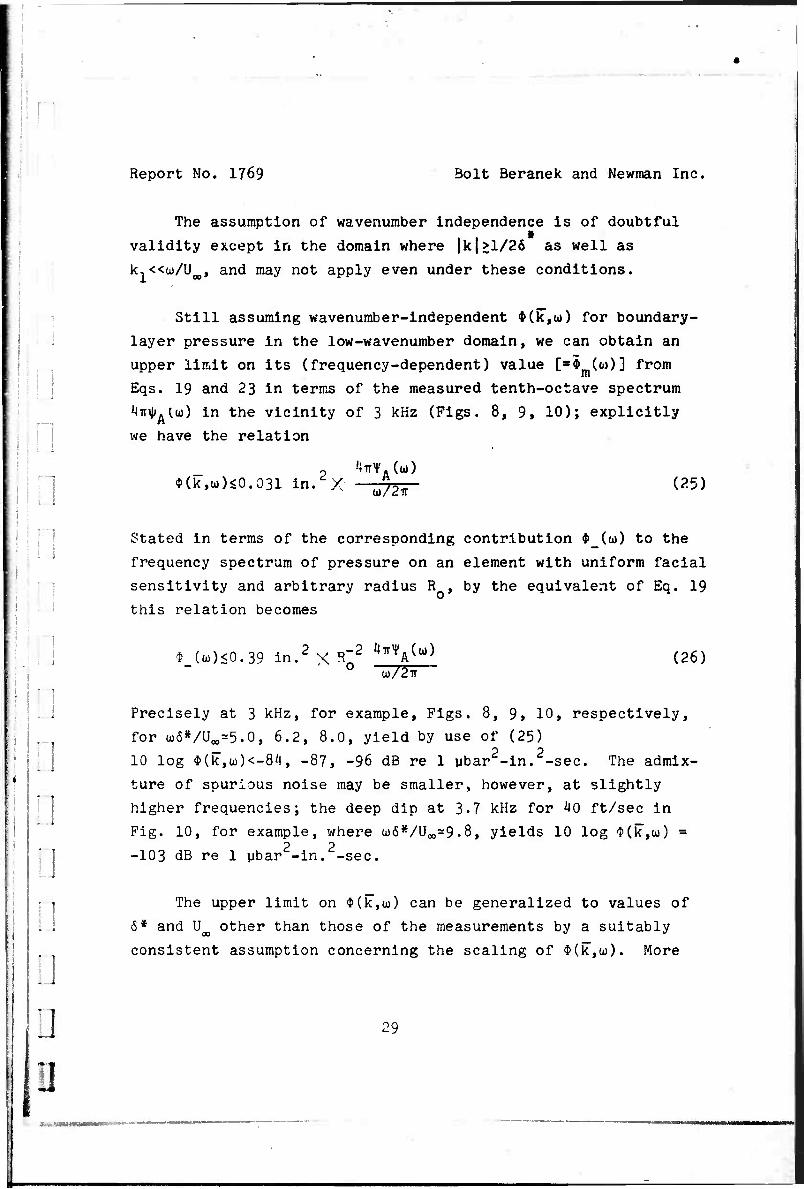
The assumption of wavenumber independence is of doubtful
validity except in the domain where |k|>l/26 as well as
k1<<ü)/Uoo, and may not apply even under these conditions.
! !■ I
Still assuming wavenumber-independent *(k,w) for boundary-
layer pressure in the low-wavenumber domain, we can obtain an
upper limit on its (frequency-dependent) value [=*(&))] from
Eqs. 19 and 23 in terms of the measured tenth-octave spectrum
4TnJiAtu>) in the vicinity of 3 kHz (Figs. 8, 9, 10); explicitly
we have the relation
0 1ir¥.(u) *(k,ui)<0.031 in/X w/2ir (25)
! i
" ] ; <
\ i
]
Stated in terms of the corresponding contribution $ (w) to the
frequency spectrum of pressure on an element with uniform facial
sensitivity and arbitrary radius R , by the equivalent of Eq. 19
this relation becomes
* (w)<0.39 in.2 X R"2 ^V") (26) 0 U)/2TT
D D 0 D
Precisely at 3 kHz, for example, Figs. 8, 9, 10, respectively,
for Cü6*/UOO=5.0, 6.2, 8.0, yield by use of (25)
10 log $(k,ü>)<-84, -87, -96 dB re 1 ubar2-in.2-sec. The admix-
ture of spurious noise may be smaller, however, at slightly
higher frequencies; the deep dip at 3.7 kHz for HO ft/sec in
Fig. 10, for example, where u6*/U00=9.8, yields 10 log <I>(k,u>) = 2 2
-103 dB re 1 ubar -in. -sec.
The upper limit on $(k,u) can be generalized to values of
6* and U^ other than those of the measurements by a suitably
consistent assumption concerning the scaling of $(k,üj). More
29
Report No. 1769 Bolt Beranek and Newman Inc.
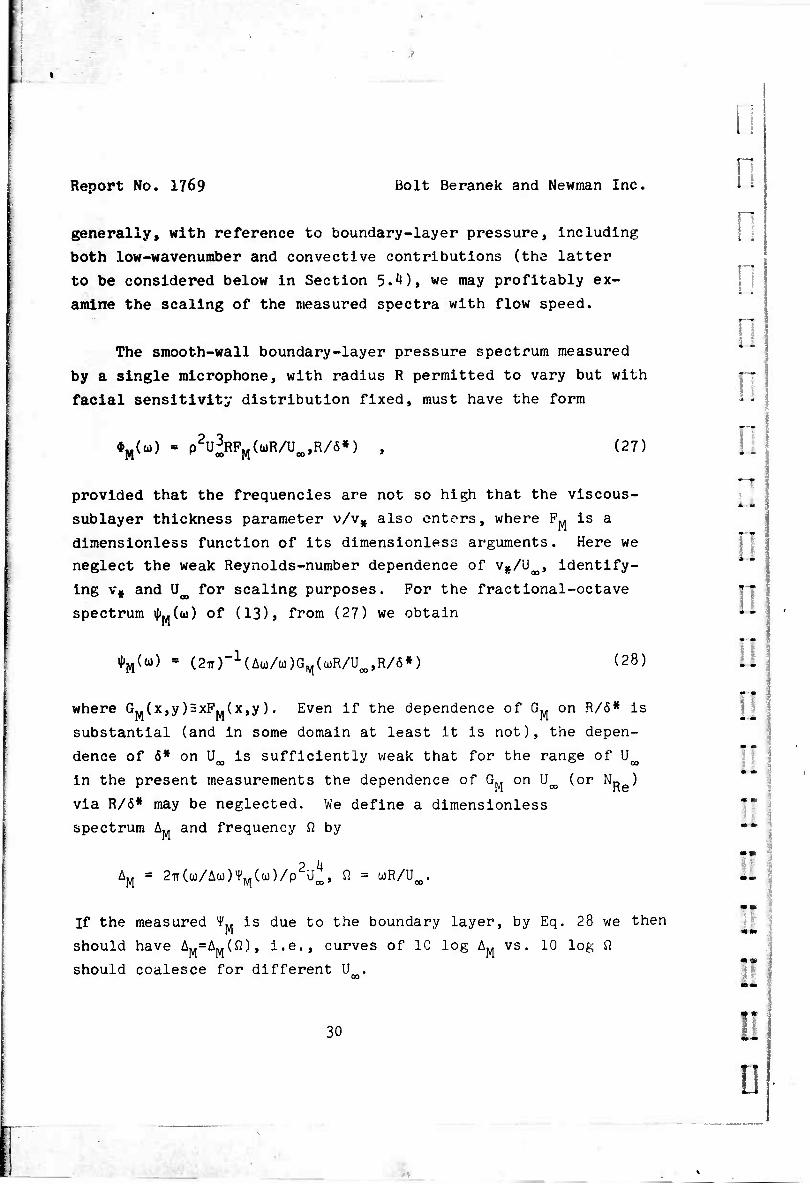
The smooth-wall boundary-layer pressure spectrum measured
by a single microphone, with radius R permitted to vary but with
facial sensitivity distribution fixed, must have the form
should coalesce for different U
should have AM=A..(ft), i.e., curves of 1C log AM vs. 10 log ft
30
ii n n generally, with reference to boundary-layer pressure, including
both low-wavenumber and convective contributions (the latter
to be considered below in Section 5.1*), we may profitably ex-
amine the scaling of the measured spectra with flow speed.
Ö
n *M(u) = p2U^RPM(uR/UM,R/6») , (27)
provided that the frequencies are not so high that the viscous-
sublayer thickness parameter v/v* also enters, where FM is a
dimensionless function of its dimensionless arguments. Here we
neglect the weak Reynolds-number dependence of v^/U^, identify-
ing vf and UB for scaling purposes. For the fractional-octave
spectrum i|>M(u) of (13), from (27) we obtain ::
*M(«) " (2ir)~1(Au)/u))GM(u)R/Uoo,R/6*) (28)
where GM(x,y)HxFM(x,y). Even if the dependence of G„ on R/6* is
substantial (and in some domain at least it is not), the depen-
dence of 6* on Uw is sufficiently weak that for the range of U^
in the present measurements the dependence of GM on U^ (or NR )
via R/6* may be neglected. We define a dimensionless If
spectrum Aw and frequency ft by "*■
AM = 2TT(W/AO))4'W!((O)/P2U^, ft = coR/U^. U
If the measured VM is due to the boundary layer, by Eq. 28 we then
».
ii
; ! !
•
Report No. 1769 Bolt Beranek and Newman Inc.
i !
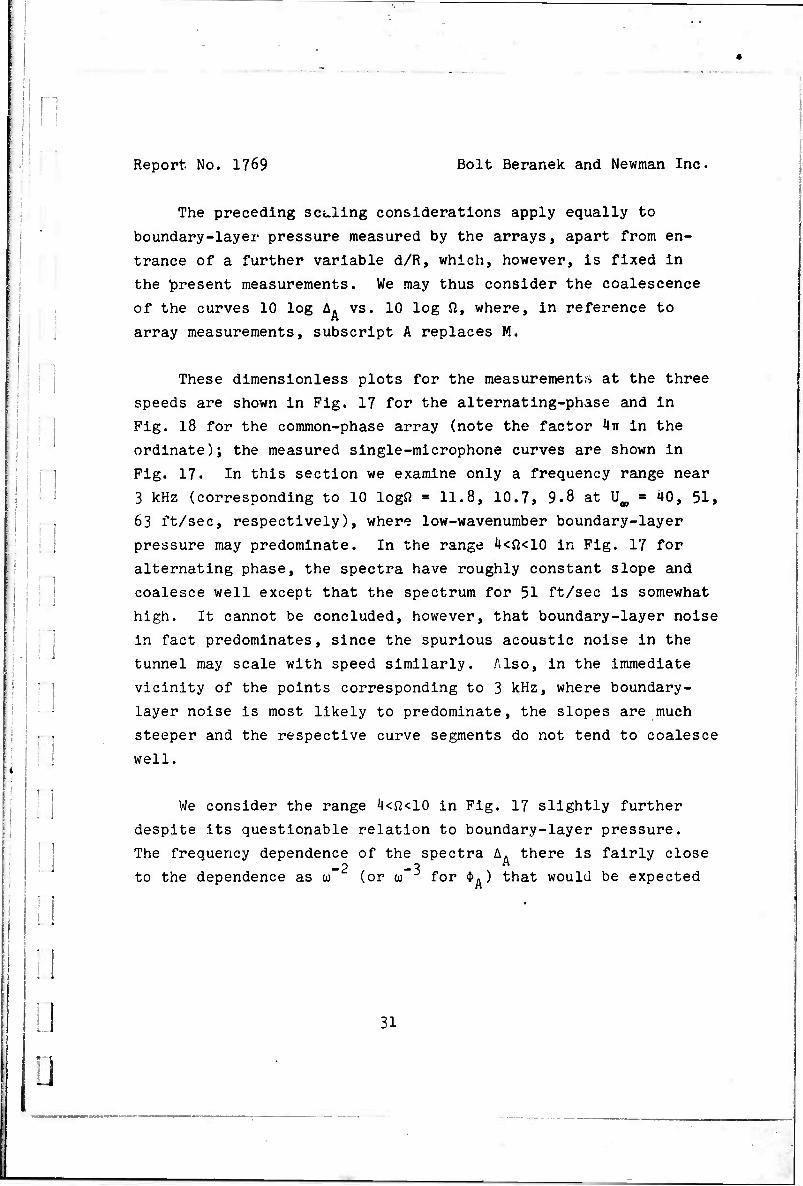
The preceding sc«-ling considerations apply equally to
boundary-layer pressure measured by the arrays, apart from en-
trance of a further variable d/R, which, however, is fixed in
the present measurements. We may thus consider the coalescence
of the curves 10 log A. vs. 10 log fi, where, in reference to
array measurements, subscript A replaces M.
n
: i
These dimensionless plots for the measurements at the three
speeds are shown in Fig. 17 for the alternating-phase and in
Fig. 18 for the common-phase array (note the factor 4TT in the
ordinate); the measured single-microphone curves are shown in
Fig. 17. In this section we examine only a frequency range near
3 kHz (corresponding to 10 logo = 11.8, 10.7, 9.8 at \JW = 40, 51,
63 ft/sec, respectively), where low-wavenumber boundary-layer
pressure may predominate. In the range 4<fl<10 in Fig. 17 for
alternating phase, the spectra have roughly constant slope and
coalesce well except that the spectrum for 51 ft/sec is somewhat
high. It cannot be concluded, however, that boundary-layer noise
in fact predominates, since the spurious acoustic noise in the
tunnel may scale with speed similarly. Also, in the immediate
vicinity of the points corresponding to 3 kHz, where boundary-
layer noise is most likely to predominate, the slopes are much
steeper and the respective curve segments do not tend to coalesce
well.
We consider the range 4<ft<10 in Fig. 17 slightly further
despite its questionable relation to boundary-layer pressure.
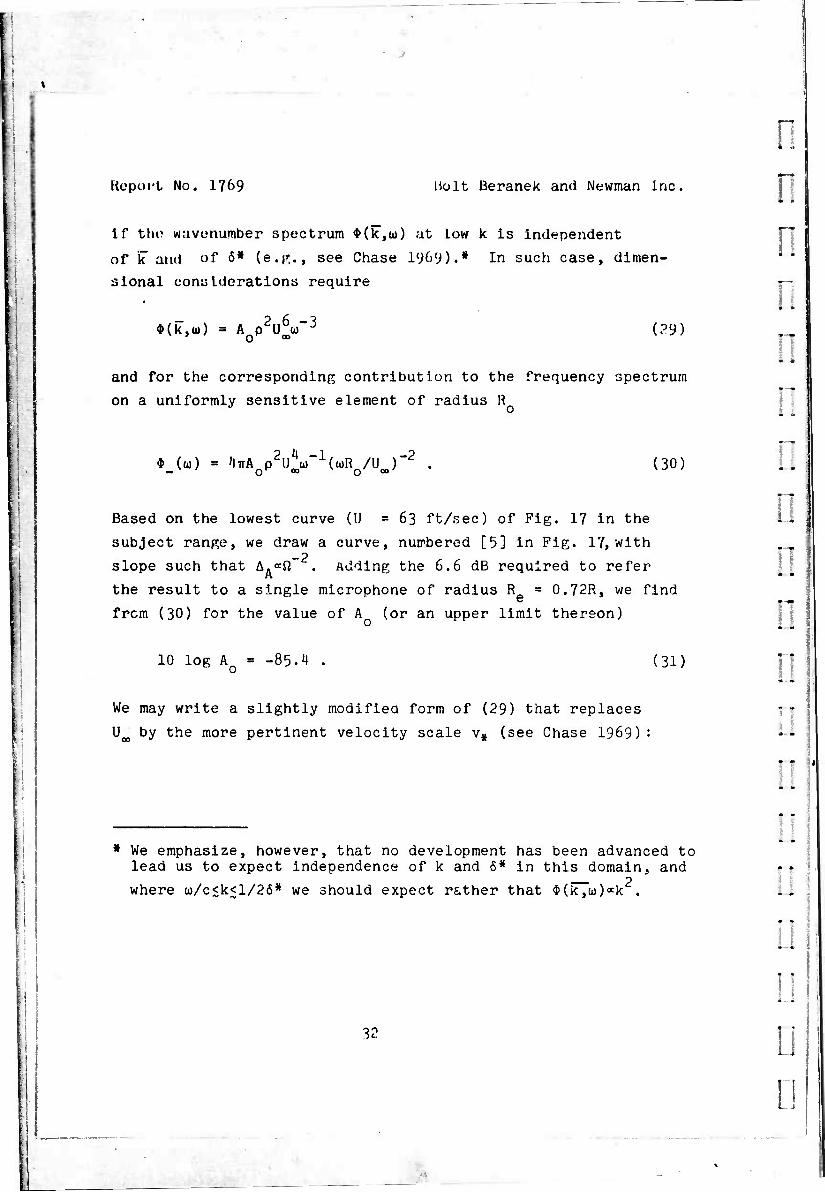
The frequency dependence of the spectra A. there is fairly close -2 -3 to the dependence as w (or CJ for $.) that would be expected
Ü 31
• J
f j
» I
\
Report No. 1769 Holt Beranek and Newman Inc.
If the wavenumber spectrum *(k,w) at low k is independent
of k and of 5* (e.g., see Chase 1969).* In such case, dimen-
sional considerations require
*(k,a>) = Aop2ufw"3 (29)
and for the corresponding contribution to the frequency spectrum
on a uniformly sensitive element of radius R
* (u) = n*A oVw-1((dR /U )-2 . (30)
Based on the lowest curve (U = 63 ft/sec) of Fig. 17 in the
subject range, we draw a curve, numbered [5] in Pig. 17, with
slope such that A.<*°, . Adding the 6.6 dB required to refer
the result to a single microphone of radius R = 0.72R, we find
from (30) for the value of A (or an upper limit thereon)
10 log Ao = -85.4 . (3D
We may write a slightly modified form of (29) that replaces rj
U^ by the more pertinent velocity scale v# (see Chase 1969) : sJi
::
* We emphasize, however, that no development has been advanced to lead us to expect independence of k and 6* in this domain, and
where w/c<k<l/26* we should expect rather that $(k~7co)«k • L
Li
Li
I I Report No. 1769 Bolt Beranek and Newman Inc.
D
*(k,o>) = a p v#u_:5 ; (32)
the value of a implied by agreement with the inferred result (32)
at the ratio Va/U^O.04 of the present measurement is given by
■ 10 log a - -1.4 . (33)
r~i
;
Equations 29-31 generalize relations (25), (26) under the
further supposition of 6* independence. As noted above, however,
the range in Fig. 18 where A.«fi does not extend up to values
of Q corresponding to 3 kHz, and the measured spectra near 3 kHz
dip steeply to levels below the straight line fitted to *. on -2 assumption of such ß variation. Also, measurements in water
for single elements of various sizes by Foxwell (1966), though
subject to reservations in the present regard, yield an average 2 3 dimensioniess spectrum $M(u>)/p U^R that lies somewhat below the
2 3 upper limit on the low-wavenumber contribution $_(w)/p U^R given
by Eq. 30 with the value (3D and, in fact, would imply
10 log a <-3 in place of the upper limit (33) inferred from the
present array measurement.*»** Thus the scaling in (29) and the
utility of estimate (3D are questionable.
ij
* We assume Foxwell's P(f) is normalized over positive and negative frequencies with f as integration variable.
** Form (3*0 of the following section, which approximates $(k,w) in the vicinity of the convective ridge, conforms to the scaling (32) in the low-wavenumber domain but is unfounded there. With the coefficient C given the value inferred from the small-element spectrum of Blake (1969) shown in Fig. 7, Eq. (3*0 would yield 10 log a *-l. [In terms of A defined
in Sec. 5.4, (3*0 asserts A /A*(2IO~1Y(V/U(J2. ]
33

Report No. 1769 Bolt Beranek and Newman Inc.
5.4 The Convectlve Boundary-Layer Contribution to Pressure Spectra
As indicated by the generally excellent coalescence of dim-
ensionless spectra in Pigs. 17 and 18 and by the discussion in
Section 4.4, boundary-layer pressure associated with convectlve
wavenumbers (k. ~w/U ) predominates in the measured spectra over
a substantial frequency range above toR/U^sl/4. The upper limit
on this range will be estimated here, and the measured array and
single-microphone spectra in the range will be studied in the
light of present knowledge of ^(k,w) in the convectlve domain.
An array with a sufficiently large number of closely spaced
elements would permit more direct and precise exploration of the
wavenumber spectral density <t»(k,w) in the domain of the convectlve
ridge than is readily attained by the usual measurement of cross-
spectral densities of pressure between pairs of elements. For
the limited array of the present experiment, it is appropriate to
compare results with those predicted by a model of $(k,u)) in the
convectlve domain that is known to describe the salient properties
fairly well. The model considered uniquely satisfies certain
kinematic and similarity conditions expected to have approximate
validity.
The form referred to is discussed by Chase (1969) and is
given by
-3/2 $(k,ü)) = C2p2v^[k^+Y2k3+(oj-Uck1)
2/v2+a2] (34)
with U =nUB, v=sva, a=(b<5*)~ and the coefficients a,n,s,Y» and
b regarded as substantially constant in the domain considered. 2
For w6*/U >1, the term a may be neglected, and the resulting
3^
f ■ ■ ■■.;.■■--,-.
1 ! !—1 1 n r—i
il
I
n a i
n n n i. i
o
n
p u
D [J
U
Report No. 1769 Bolt Beranek and Newman Inc.
form Is uniquely characterized by the following two properties:
[1] It satisfies the similarity condition that the only length
scale for boundary-layer pressure in the subject domain is
U^/to. [2] The corresponding pressure correlation function is
space-time Isotropie in a frame convected at velocity U (ex-
cept that streamwise-spanwise spatial anisotropy is permitted
in this frame (yjtl)).* Prom measurements by Blake (1969) we
infer, in the manner discussed by Chase (1969),
v/Uc=0.13, Y_1=0.9, b=1.6 ; (34a)
in the computations below, however, it was assumed that
v/U =0.12, Y~1=0.7. U„ may be identified with
the convection velocity defined in the usual way from measure-
ments of longitudinal cross-spectral density (Corcos 1964),
We consider first the single-element spectrum $M(w) pre-
dicted from (34) by use of (5):
$M(w)=C2p2v|//d2k|H(kR)|2[k2+Y2k3+(üJ-Uck1)
2/v2+a2]"3/2 ,(35)
*A form similar to (34) but with power -2 instead of -3/2 has been considered by Chandiramani and Blake (1968). Such a form does not satisfy the similarity condition [1] in the appro- priate limit (though the resulting normalized cross-spectra do). It also yields normalized cross-spectra whose slopes with re- spect to the separation variables w£,/U , w^/U vanish with
ü)£./U , unlike form (34) and apparently in conflict with experi- -2 ment. Likewise, the derived point pressure varies as oo ,
rather than w~ as in (37).
1 J 35
liiMtfKuT Truw

Report No. 1769 Bolt Beranek and Newman Inc.
where H(kR) for the present microphone Is given by (16) and (15).
For wR/U <1, we may set |H(kR)| -1 and obtain the point- c microphone spectrum implied by (3*0
*(a))-Gop2viJ(u2+U^/b26*2)"1/2 (36)
where G =2TrC2Y~1s(and we neglect v2/U2). For w6»/U >1, this o c
assumes the similarity form
• (<o)*Q Vvj«"1 , (37) o w
discussed by Bradshaw (1967) and Foxwell (1966). Form (37)
approximates the measured dependence, which is more closely ap- -0 7 proximated as ~w , obtained over a wide frequency interval
(0.8<u6*/U0O<7) for a very small element by Blake (1969), as shown
in Fig. 7, and also by Hodgson (reported by Bradshaw 1967). For
fractional-octave spectra such as plotted in Figs. 8 through 10,
or the corresponding dimensionless spectra as plotted in Figs.
17 and 18, Eq. 37 yields a value independent of frequency:
^M(ü))=Go(2Tr)-1(Aü)/ü))p2v|j or A^O^/UJ^A . (38)
The decrease in the measured A™ in Figs. 17 and 18 for frequencies below that for maximum A,, is attributed to entrance of dependence
on 6* where w6*/U <l/2, somewhat as given by (36) for the model (3^).*
36
1 I I
r
* Eq. 36 may be written as -1/2
$(u)/p2RU^=An"1(b5*/R)[l+(b6*/R)2n"2n2]
where n=U /U . corresponding to a point spectrum constant and C i . j
proportional to 5* where W6*/UOU<<1 .
I!
■
s n
i! ! Report No. 1769 Bolt Beranek and Newman Inc.
I. i
The decrease at dimensionless frequencies Qzl is due to area
averaging (|H|2 in (35)).
n
In the opposite limit of very large kR, we can satisfac-
torily estimate the result of (35). First, for u>R/U >11TT, i.e.,
fi>6ir or 10 logo,>13, to the extent that (16) still represents
the microphone filter at such high kR, we have
$M(u))=coC2p2v|R"5/dk3/dk1(k^+k2)"
5/2
X[k2+Y2k3+(w-Uck1)2/v2+a2]"3/2 ,
(39)
D r
where CQ was given at (17). In a rough approximation, becoming
valid for 8(v/U )<<1, we may further replace the last factor in
(39) by a factor «5(k,-w/U ) and obtain 1 c
$M(ü)) = 4COC2Y"
2A5/2P
2V3 V(ü'
1(WR/UC)"
5 , 'W
where
r!
r 1
00 P -Cj/P P _P P -1 _P 1/2 A5/2-/ dz(z*+l)
0/d{zd+y daQ) , o0»[l+Cbu6*/Uc) dl
-(TT/2)Ya^(l + Y~2aQ)
the approximation to Ac/P becoming exact for y~ a <<1. Express-
ing this final result in terms of
point spectrum in (36), we obtain
ing this final result in terms of the ratio of *M(w) to the
?-?
Report No. 1769 Bolt Beranek and Newman Inc.
♦MU)/*(w)*C0(l+Y oTQ) (ü)R/UC)_:5
,-5 (40)
:2.1(ü>R/U ) ^ for w6*/U >1 . c °°
This ratio represents the asymptotic area correction factor to
be applied to the constant &M given In (38) to obtain the A,,
for comparison with measured results in Pig. 17.
For intermediate values of Q, the integral (35) could be
straightforwardly evaluated numerically. Short of this, we can
indicate its rough variation. To this end, we find the result
applicable in an imagined limit y~ <<1, contrary to the actual value (3^a) but corresponding to a tractable limit where the
last factor in (35) may be considered to be «ö(k^) except for
k, near H(k, )=0. At k-.=0, the full width in k, at half maximum 113 l of *(k,u) in (35) is
6 k, =1. 54a (v/U )w/U ~0 • 19w/U„ . (n)
Hence, except near H(u>R/U ) = 0, we may again regard $(k,,0,w) as
«6(k,-u/U ) when 0.1/ j. c
limit we thus obtain
*5(k,-ü>/U ) when 0.17w/U <<IT/R, or 10 logß £ 5. In the imagined XL« U
$M(u))/$(w)^|H(u)R/Uc)|: (42)
which, for assumed U /U , is given as a function of 8 from Pig. 16.
We regard the constant G or A in Eq. 38 [or C in (3^)] as
adjustable to fit the measured *Md»0 and later compare the value
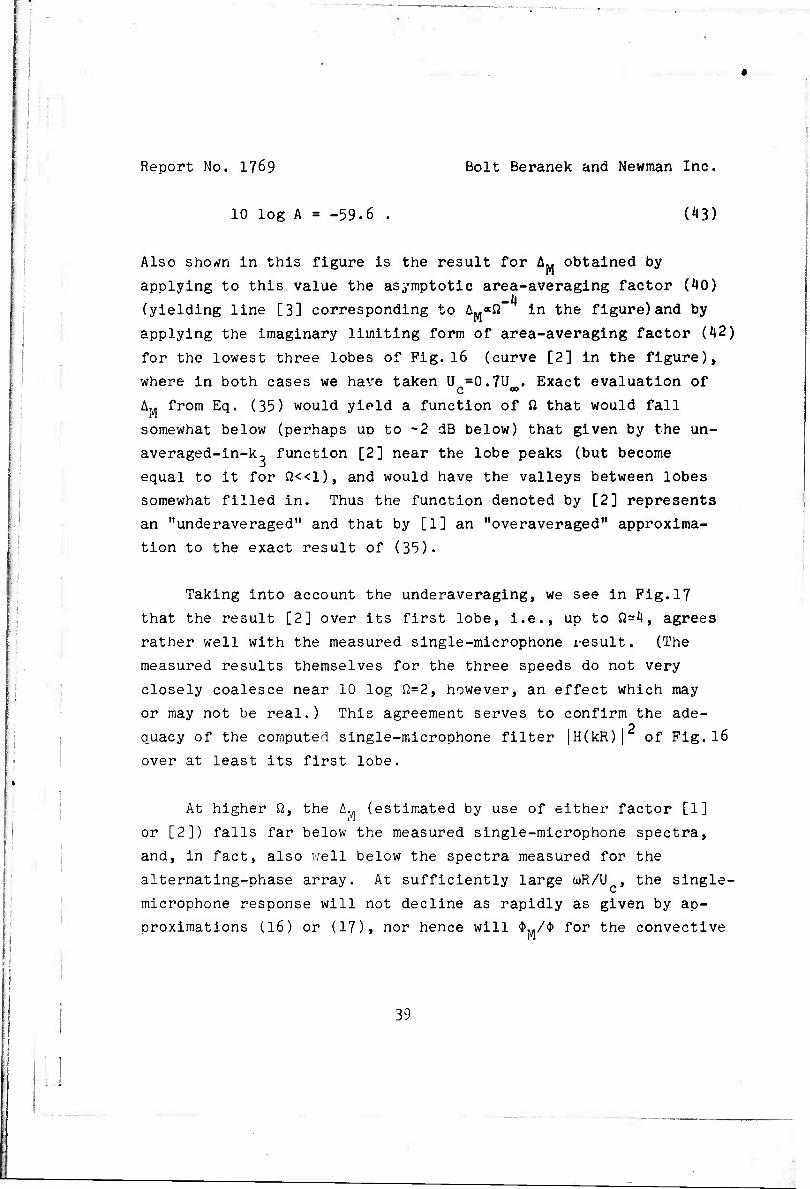
with that given by other measurements. The horizontal line [1]
in Pig. 17 corresponds to a dimensionless point spectrum (38)
given by
38
Report No. 1769 Bolt Beranek and Newman Inc.
10 log A = -59.6 . (13)
I
Also shorfn in this figure is the result for AM obtained by
applying to this value the asymptotic area-averaging factor (10)
(yielding line [3] corresponding to AM*ft~ in the figure)and by
applying the imaginary limiting form of area-averaging factor (12)
for the lowest three lobes of Fig. 16 (curve [2] in the figure),
where in both cases we have taken U =0.7U . Exact evaluation of c °° A« from Eq. (35) would yield a function of ß that would fall
somewhat below (perhaps up to ~2 dB below) that given by the un-
averaged-in-k, function [2] near the lobe peaks (but become
equal to it for £2<<1), and would have the valleys between lobes
somewhat filled in. Thus the function denoted by [2] represents
an "underaveraged" and that by [1] an "overaveraged" approxima-
tion to the exact result of (35).
Taking into account the underaveraging, we see in Fig.17
that the result [2] over its first lobe, i.e., up to 8*1, agrees
rather well with the measured single-microphone i-esult. (The
measured results themselves for the three speeds do not very
closely coalesce near 10 log n=2, however, an effect which may
or may not be real.) This agreement serves to confirm the ade-
quacy of the computed single-microphone filter |H(kR)| of Fig. 16
over at least its first lobe.
At higher ft, the A,, (estimated by use of either factor [1]
or [2]) falls far below the measured single-microphone spectra,
and, in fact, also well below the spectra measured for the
alternating-phase array. At sufficiently large ooR/U , the single-
microphone response will not decline as rapidly as given by ap-
proximations (16) or (17), nor hence will *«/$ for the convective
39
Report No. 1769 Bolt beranek and Newman Inc.
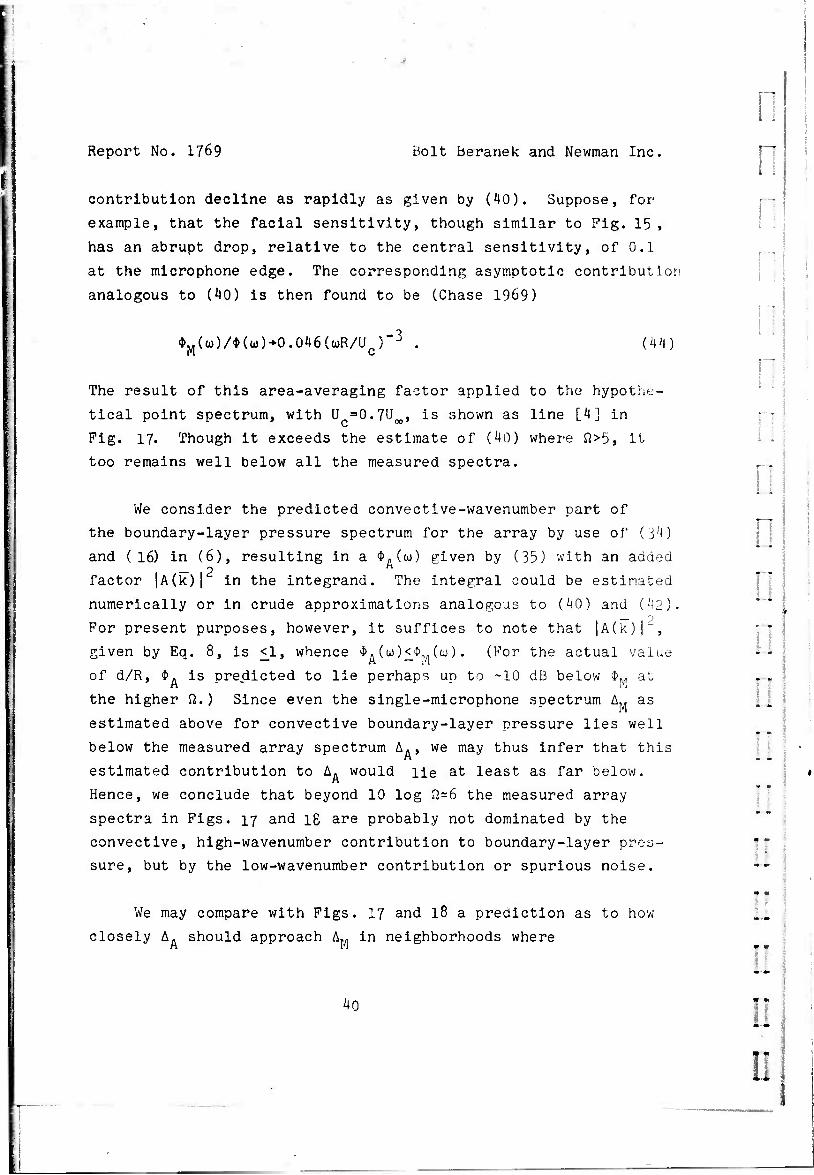
contribution decline as rapidly as given by (40). Suppose, for
example, that the facial sensitivity, though similar to Pig. 15 ,
has an abrupt drop, relative to the central sensitivity, of 0.1
at the microphone edge. The corresponding asymptotic contribution
analogous to (40) is then found to be (Chase 1969)
♦M(w)/*(w)+0.046((i>R/U ) v-3 (44)
The result of this area-averaging factor applied to the hypothe-
tical point spectrum, with U =0.7U , is shown as line [4] in
Fig. 17. Though it exceeds the estimate of (40) where Q>5, it
too remains well below all the measured spectra.
We consider the predicted convective-wavenumber part of
the boundary-layer pressure spectrum for the array by use of (34)
and (16) in (6), resulting in a *.(w) given by (35) with an added
factor |A(k)| In the integrand. The integral could be estimated
numerically or in crude approximations analogous to (40) and (42).
For present purposes, however, it suffices to note that |A(k)| ,
given by Eq. 8, is <1, whence $„ (u>)<$„.(to). (For the actual value
of d/R, <J>. is predicted to lie perhaps up to -10 dB below $M at
the higher tt.) Since even the single-microphone spectrum A,, as
estimated above for convective boundary-layer pressure lies well
below the measured array spectrum A., we may thus infer that this
estimated contribution to A. would He at least as far below.
Hence, we conclude that beyond 10 log Q=6 the measured array
spectra in Figs. 17 and 18 are probably not dominated by the
convective, high-wavenumber contribution to boundary-layer pres-
sure, but by the low-wavenumber contribution or spurious noise.
We may compare with Figs. 17 and 18 a prediction as to how
closely A. should approach A., in neighborhoods where
r
r~i
ni
-
:.
T 1 ;
■
[j ; 1 n
40
u
i ! Report No. 1769 Bolt Beranek and Newman Inc.
i
• !
|A(ü)/U„,k,,w) |'" ir near unity (major-lobe peaks). The full
width at half maximum of |A(ic)|^ is Ö^^O.^öir/d. By (41)
and its generalization to k^O, we infer that the ratio of the
pertinent average width in k, of the convective peak in *(k,w)
to the width of a major lobe of the array filter is roughly
wd/3irU . For U /U =0.75, this is unity at ß=2. Therefore, we C C oo *
expect *A/*M will closely approach unity at peaks where ß<2,
and less closely as fi increases. This expectation accords with
the results in Figs. 17 and 18. Likewise, at these lower values
of n the variation of $. is determined mainly by the array filter
form rather than by the form of the pressure spectrum $(k,w).
To obtain information about the variation of $(k,o)) with k, over
the convective peak (k =ü>/U ) at given <D/U , we must have a
number of elements N and spacing d such that ud/U >>40/N; at the
same time, to sample $(k,(j) only at the k, for a single major
lobe, rather than a sum over two or more lobes, we would require
tod/U"c<30.
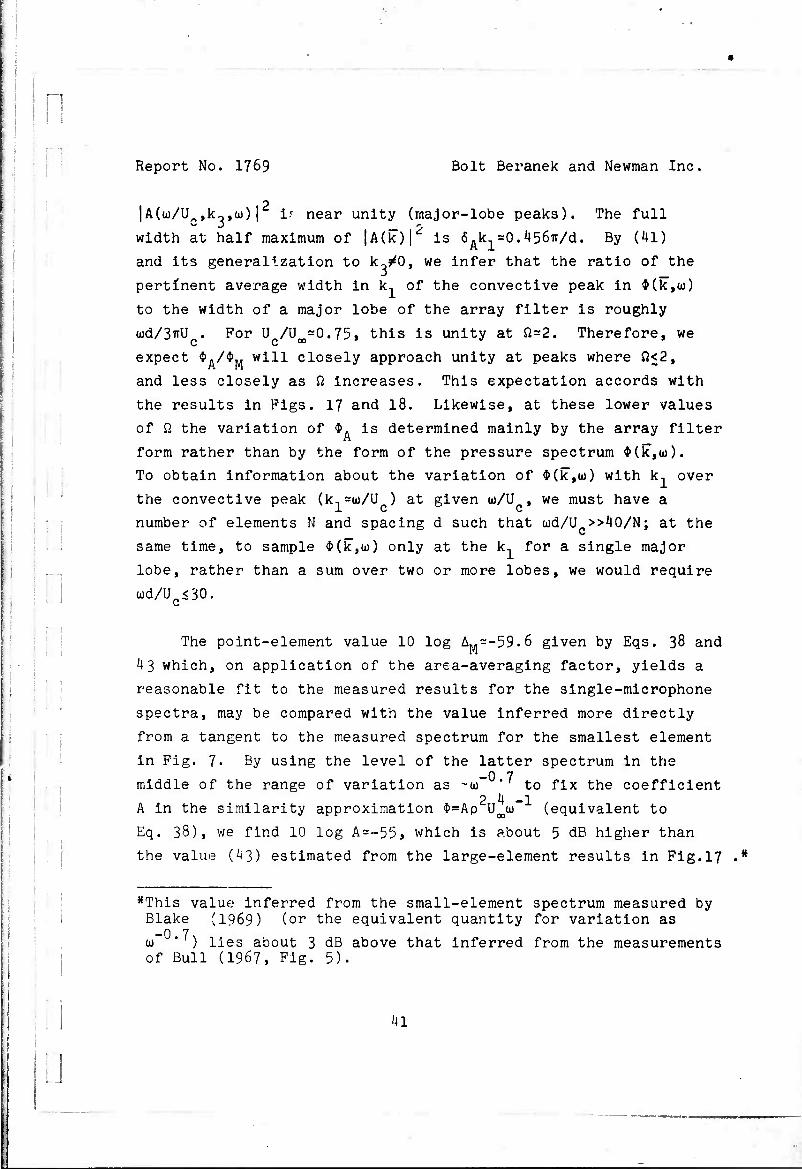
The point-element value 10 log A,.=-59.6 given by Eqs. 38 and
4 3 which, on application of the area-averaging factor, yields a
reasonable fit to the measured results for the single-microphone
spectra, may be compared with the value inferred more directly
from a tangent to the measured spectrum for the smallest element
in Fig. 7. By using the level of the latter spectrum in the -0 7 middle of the range of variation as ~to to fix the coefficient 2 4-1 A in the similarity approximation $=Ap U^OJ (equivalent to
Eq. 38), we find 10 log A»-55» which is about 5 dB higher than
the value (43) estimated from the large-element results in Fig.17 •*
*This value inferred from the small-element spectrum measured by Blake (1969) (or the equivalent quantity for variation as -0 7 a) ) lies about 3 dB above that inferred from the measurements
of Bull (1967, Fig. 5).
41
LJ

./
Report No. j.769 Bolt Beranek and Newman Inc r
This discrepancy is not excessive in view of errors associated
with the measurements and fitting by the theoretical curves.
6. CONCLUSION
The following conclusions may be drawn from the measure-
ments:
1) The microphone array is a useful device for measuring
the wavenumber-frequency spectral density of the wall pressure
fluctuations, particularly in the domain of low wavenumbers in-
accessible to more usual experimental techniques. The common-
phase array is less effective with regard to discrimination
against spurious background noise in this measurement than the
alternating-phase array but provides a simple means of estimat-
ing the background noise spectrum.
2) By measurements with the alternating-phase array, an
upper limit has been set on the average low-wavenumber spectral
density of boundary-layer pressure fluctuations at given fre-
quency in a high-frequency range, as given by Eqs. 25, 29, and 31,
Depending on the scaling law and wavenumber dependence at low
wavenumbers, however, this limit may be less restrictive than
that implied by certain previous measurements of single-element
spectra (Foxwell 1966). Background noise in the tunnel may still
have been dominant, and a contribution from high-wavenumber
(convective) boundary-layer pressure remained, though it was
estimated to be small.
3) In an identifiable domain of dominance by the convective-
wavenuuber component of boundary-layer pressure, the spectra
measured by a single microphone and by arrays show consistency
with theoretical predictions based on current knowledge of the
k2
n
n
n
I I !
t»
uj ul 0!
n i»
Report No. 1769 Bolt Beranek and Newman Inc,
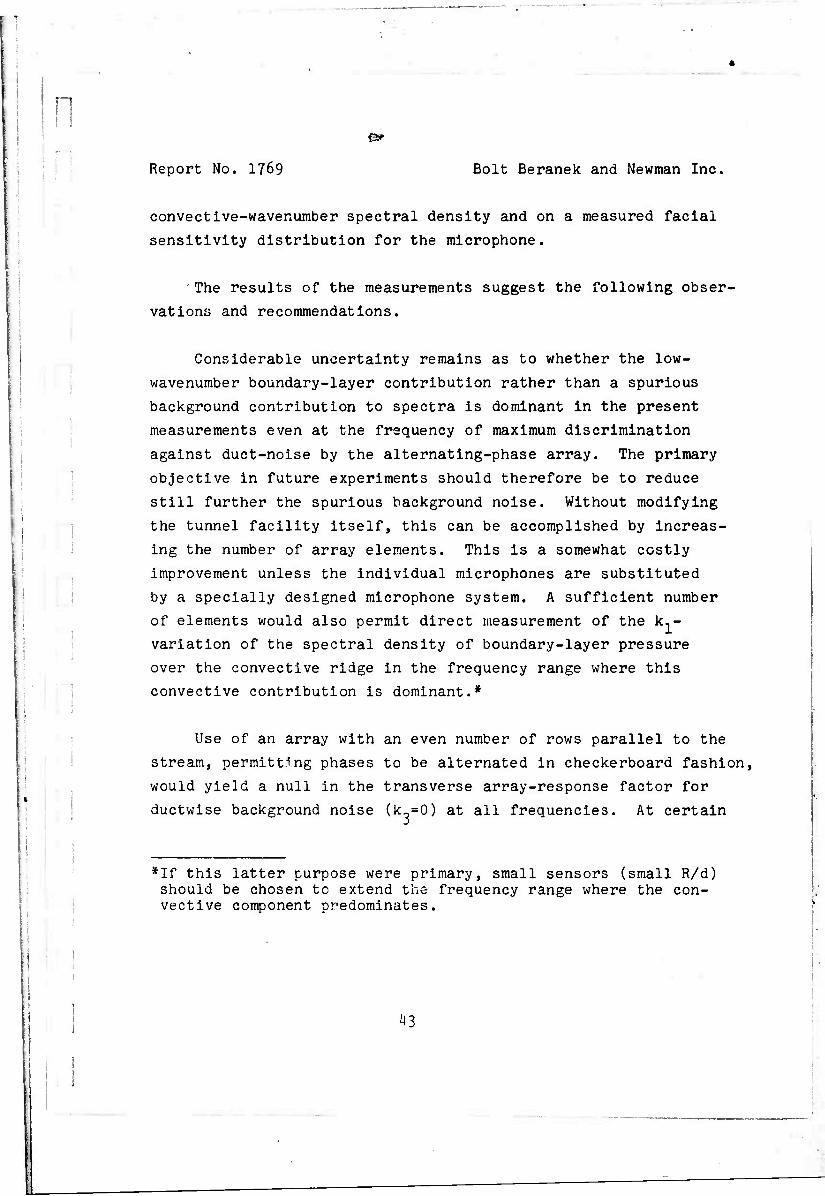
convectlve-wavenumber spectral density and on a measured facial
sensitivity distribution for the microphone.
The results of the measurements suggest the following obser-
vations and recommendations.
Considerable uncertainty remains as to whether the low-
wavenumber boundary-layer contribution rather than a spurious
background contribution to spectra is dominant in the present
measurements even at the frequency of maximum discrimination
against duct-noise by the alternating-phase array. The primary
objective in future experiments should therefore be to reduce
still further the spurious background noise. Without modifying
the tunnel facility itself, this can be accomplished by increas-
ing the number of array elements. This is a somewhat costly
improvement unless the individual microphones are substituted
by a specially designed microphone system. A sufficient number
of elements would also permit direct measurement of the k,-
variation of the spectral density of boundary-layer pressure
over the convective ridge in the frequency range where this
convective contribution is dominant.*
Use of an array with an even number of rows parallel to the
stream, permitting phases to be alternated in checkerboard fashion,
would yield a null in the transverse array-response factor for
ductwise background noise (k-=0) at all frequencies. At certain
*If this latter purpose were primary, small sensors (small R/d) should be chosen tc extend the frequency range where the con- vective component predominates.
43
"
Report No. 1?69 Bolt Beranek and Newman Inc. I! frequencies, as for the present single-row array, the longitudin;
array-response factor would also vanish, yielding a two-fold
null. Choice of small center spacing, d^, in the transverse
sense would keep the rate of increase of the transverse response
factor small where |A(k)| «d., near k^=0, thereby reducing the
acoustic background noise, especially the nearly ductwise com-
ponent. In order still to maintain high attenuation of the
convective pressure contribution by streamwise area averaging
without having to operate at higher frequency, one may then
consider using rectangular sensors (L,xL.) elongated in the
streamwise sense. The small width L.. implied by small d., also
emphasizes the low-wavenumber boundary-layer contribution rela-
tive to the acoustic background by increasing the range of
transverse wavenumber acceptance ( |k-J <2IT/L.,) .
Choice of relatively small d~ and hence L-. is open to the
criticism, that the resulting range of transverse wavenumbers k,
accepted exceeds that for the larger sensors of main practical
interest. This point seems less serious than might appear,
however, since, first, the expected dip in the spectral density
of boundary-layer pressure where k<l/26* (but k>w/c) will not
seriously affect the noise measured with any sensor having
L^<<4TT6* and, second, if the number of streamwise rows is four
(or six, etc.) the opportunity exists to partially infer the k-,
dependence of the pressure, and hence extrapolate to somewhat
wider sensors, by varying the weighting coefficients assigned to
elements in the various transverse positions.
*If L-j/L, were so small that wL0/U <IT at the useful frequencies,
smaller L^ would probably emphasize the low-wavenumber boundary-
layer contribution also relative to the convective contribution,
44
n t ■ n n
Q
n
m
« .
m%i

n
Report No. 1769 Bolt Beranek and Newman Inc.
The longitudinal facial sensitivity of a rectangular sensor
should preferably be designed to taper smoothly toward the
edges for maximum attenuation of convective (high-wavenumber)
pressure.
Use of rectangular sensors has the additional advantage
that their wavenumber filters for area averaging are separable
into longitudinal and transverse factors, simplifying the
theoretical analysis (e.g., see Chase 1969).
We therefore recommend extension of measurements of the
present kind to arrays with even-multiple streamwise rows,
preferably using closely packed rectangular sensors relatively
narrow spanwise, with variable element weights.
There is some advantage in employing a microphone spacing
such that the second major lobe (k,=3ir/d) of the alternating-
phase array is more nearly suppressed by microphone area averag-
ing for the particular facial sensitivity distribution of the
microphones, in order to confine low-wavenumber contributions
largely to the vicinity of a single value of k,. The considera-
tion of maximum attenuation of convective pressure at an accept-
able frequency of operation appears, however, a more important
design criterion.
Consideration should be given also to providing steering of
the array (Maidanik and Jorgensen 1967) by use of delay lines
or by equivalent digital processing of time-referenced individual
records. This step would permit, in particular, achieving maxi-
mum discrimination against duct noise at any given frequency,
rather than only one or a few, with fixed microphone spacing.
45
1
U
Report No. 1769 Bolt Beranek and Newman Inc,
REFERENCES
Blake, W.K. 1969 M.I.T. Dept. of Naval Arch, and Engin., Acoustics
and Vibration Lab. Rept. No. 70208-1.
Bradshaw, P. 1967 J. Fluid Mech. 30, 24l.
Brüel, P.V. and Rasmussen, G. 1959 Bruel & Kjaer Tech. Rev., No.2.
Bull, M.K. 1967 J. Fluid Mech. 2£, 719.
Chandiramani, K.L. & Blake, W.K. 1968 Bolt Beranek and Newman Inc.
Report No. 1557.
Corcos,G.M. 1964 J. Fluid Mech. 18, 353.
Foxwell, J.H. 1966 Admiralty Underwater Weapons Establishment Tech.
Note 218/66.
Hinze, J.O. 1959 Turbulence (McGraw-Hill Book Co., Inc., New York).
Maidanik, G. and Jorgensen, D.W. 1967 J. Acoust. Soc. Amer. 42, 494.
Uberoi, M.S. and Kovasznay, L.S.G. 1953 Quart. Appl. Math. 10_> 375.
Willmarth, W.W. & Woodridge, C.E. 1962 J. Fluid Mech. 14_, 187.
Wills, J.A.B. 1967 National Physical Laboratory, Teddington,
Aero Rept. No. 122 4.
46
; ' !
• i
l i !
il
n
Chandiramani, K.L. 1968 Bolt Beranek and Newman Inc. Report No. 1728. J"
Chase, D.M. 1969 J. Acoust. Soc. Amer., in publication. r
Corcos,G.M. 1963 J. Acoust. Soc. Amer. 35, 192.
1
n h if
..
. »
•»
M>
T
xawBiM»;
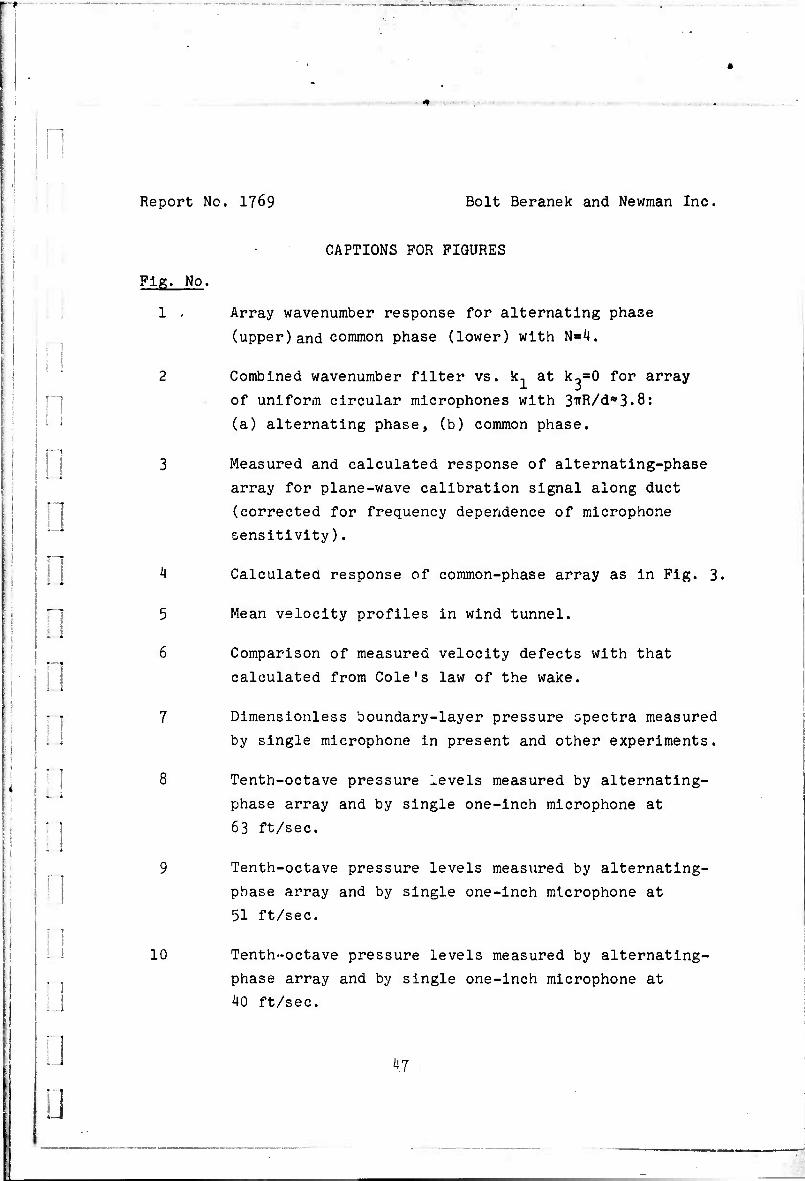
■
*
'■ ' Report No. 1769 Bolt Beranek and Newman Inc.
:
n
! f—J
■ i
r !
u
CAPTIONS FOR FIGURES
Fig. No.
1 . Array wavenumber response for alternating phase
(upper) and common phase (lower) with N=1.
2 Combined wavenumber filter vs. k, at k~=0 for array
of uniform circular microphones with 3ffR/d*3.8:
(a) alternating phase, (b) common phase.
3 Measured and calculated response of alternating-phase
array for plane-wave calibration signal along duct
(corrected for frequency dependence of microphone
sensitivity).
1
5
6
10
Calculated response of common-phase array as in Fig. 3.
Mean velocity profiles in wind tunnel.
Comparison of measured velocity defects with that
calculated from Cole's law of the wake.
Dimensionless boundary-layer pressure spectra measured
by single microphone in present and other experiments.
Tenth-octave pressure levels measured by alternating-
phase array and by single one-inch microphone at
63 ft/sec.
Tenth-octave pressure levels measured by alternating-
phase array and by single one-inch microphone at
51 ft/sec.
Tenth-octave pressure levels measured by alternating-
phase array and by single one-inch microphone at
10 ft/sec.
1.7
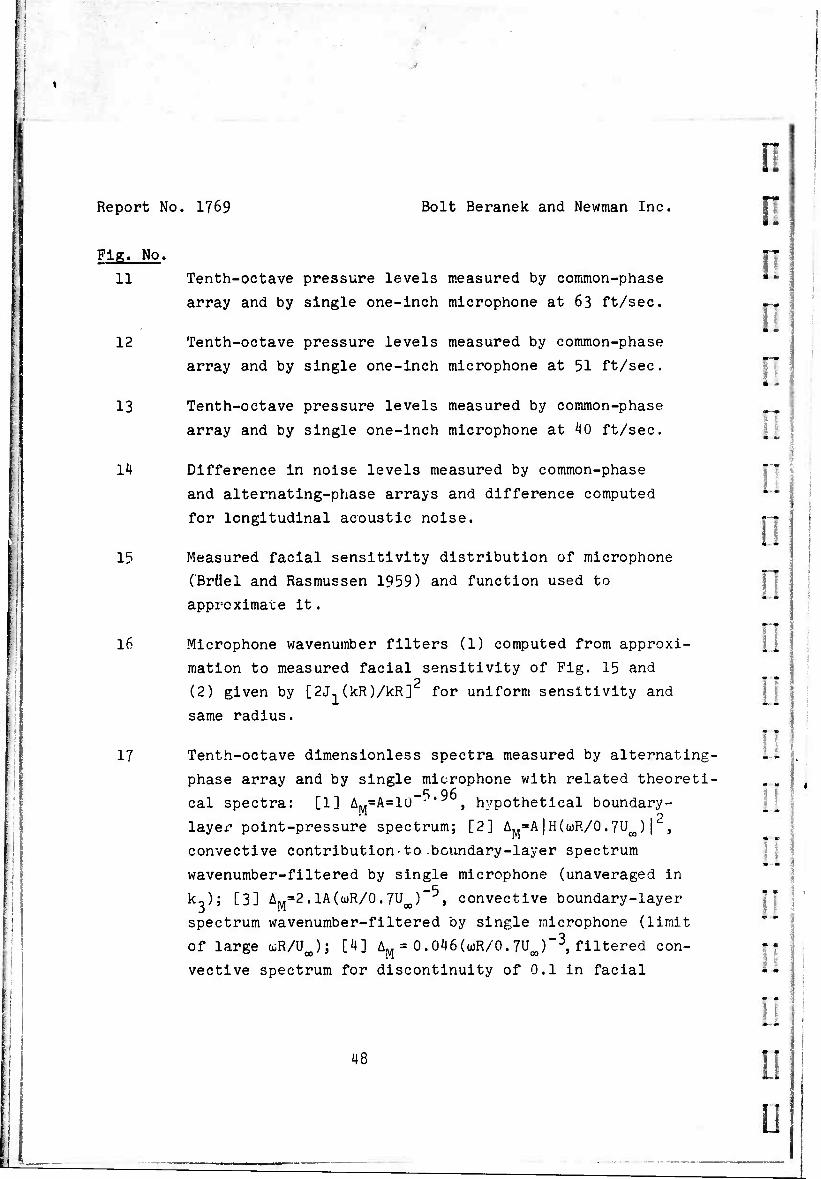
Report No. 1769 Bolt Beranek and Newman Inc.
F1s- NO. n 11 Tenth-octave pressure levels measured by common-phase *«■
array and by single one-inch microphone at 63 ft/sec. -^ n 12 Tenth-octave pressure levels measured by common-phase
array and by single one-inch microphone at 51 ft/sec. • i
13 Tenth-octave pressure levels measured by common-phase r9 ]
array and by single one-inch microphone at 40 ft/sec.
48
i I £
II 14 Difference in noise levels measured by common-phase
and alternating-phase arrays and difference computed
for longitudinal acoustic noise.
15 Measured facial sensitivity distribution of microphone
(Brüel and Rasmussen 1959) and function used to
approximate it.
16 Microphone wavenumber filters (1) computed from approxi-
mation to measured facial sensitivity of Fig. 15 and 2
(2) given by [2J,(kR)/kR] for uniform sensitivity and
same radius.
f! 17 Tenth-octave dimensionless spectra measured by alternating- Li
phase array and by single microphone with related theoreti- „ -5 96 cal spectra: [1] AM=A=1D -'* , hypothetical boundary-
layer point-pressure spectrum; [2] AM=A|H(üJP./0.7UOO) | ,
convective contribution-to .boundary-layer spectrum
wavenumber-filtered by single microphone (unaveraged in
kO; [3] Ap.=2.1A(wR/0.7Uoo) , convective boundary-layer
spectrum wavenumber-filtered by single microphone (limit
of large coR/Uj; [4] AM = 0.046(wR/O^Uj-3, filtered con- ||
vective spectrum for discontinuity of 0.1 in facial
::
y

■ ...I—u *.!;■■
n n Report No. 1709 Uolt Beranek and Newman Inc.
i
! i i
! : i
i i
1'lR. No,
(17)
18
sensitivity (limit of large uR/U.); [5] A^UR/U«,)"2,
fit to lowest measured array spectrum in range
7<10 logUR/U )<10.
Tenth-octave dimensionless spectra measured by common-
phase array.
*9
w*acM»w* äÄs» ■ ....^^Ä=«'**^^
D
D
Report No. 1769 Bolt Beranek and Newman Inc
n
n t i
n Li
CM
(4
z
k,d/7T
D D D []
■
M z
—r r i i 1 1 1 1 1 COMMON PHASE
1' CSI cvilz 1 Aö 1^/ 1 \r\I^J 1 \r^l 1 \rsls>~ 1 1
k,d/7r
FIG.l
10
::—__^.._.::._. ... " "
n :.• T_*ue*craiij.«.-;'_J5:«.ii1JJ5™ fcjcbfe TOa=E--iaäe:=nwot>*i>^ ■ - •
Report No. 1769 Bolt Beranek and Newman Inc
■
tO *• CM O OD to ^f c\J
.|PI)»|.|«)H|
is
a ——

=s»et*:wfs*»'J«t*'''ii- w
Report. No. 1769 Bolt Beranek and Newman Inc
n
D
D L_J
□
(dvaoyom/Ai 3a ap) AIIAIIISN3S AVUHV
CO
as
- ■■"-'■ -■'■.'■ ■>"
•■.■",.^:v*. . '•*,-
regpspatspB^ss-'.'-jg3gggagau:^ga^gi^BeBg-r?~ " - ^ - ••■77"yr - • .^frr "
n »•■<>M»MA'«giM>^WJ^MimimMWK^
n I. I I Report No. 1769
•
J
~|
D
D
Ü
Bolt Beranek and Newman Inc
(Hvaoyoiw/Ai 3d gp) AIIAIIISNBS AVUHV
1]
I
Report No. 1769 Bolt Beranek and Newman Inc
n
U 1 n
D
i—I
l I
K)
'
1 i \ 1 (\J
> I «2 8 ev. «o_;__'
~~ .
• Q. ^ ro - O 9 (0 m ^
3
O 1 3
i ■■- 05 O
< n O D < 00
o
8 <
— N d
(0
a 0
- <
o
m d
" o *
j h o
d
M
1 i 5 °l o° 1 1
O
d
/
0> 00 N (0 IO * 10 CM d d d d d o d d
»n/n
D

n Reoort No. 1769 Bolt Beranek and Newman Inc
n
a D □ D □ D 0 D □ D Ü 1]
3 I
8
1 1 1 1 1 III 1 ■ 1 1 1 1 1 1 1
0 U<os:63fpS A U<JO= 51 fps a Uoj=40fps 14
% » A
^S^EQUATION 10 X, O 12
10
8
6
>**<>
- •■
13ft. 0
•
^£
2
n
9
"^t o
1 1 1 1 1 1 II i i i i 11 ft .0 2 3 4 5 6 8 2 3 4 5 6 8
0.01 0.1
y/8.99
FIG.6
1.0 2.0
-r r
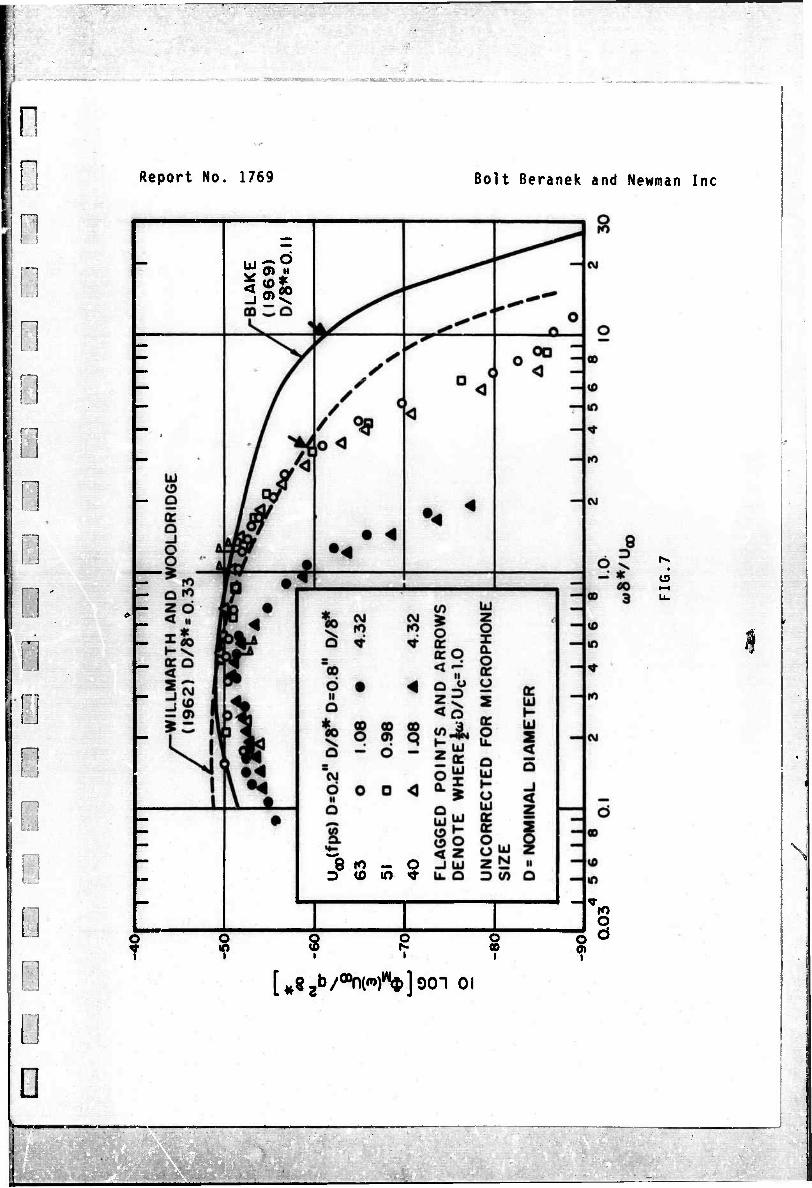
-^■i'3xas***Hawa»--TS"!*W*r:: ■>)«$*&iK&B&a&^MtHL&pmfim**,
n 1
n
n n II
0 []
s [7 ] Ü I
0
D
Report No. 1769 Bolt Beranek and Newman Inc
8 ro - o 3 to in *
o i
s % o CO I
o o en
i
[^gb/OOntm^jOOl 01
D
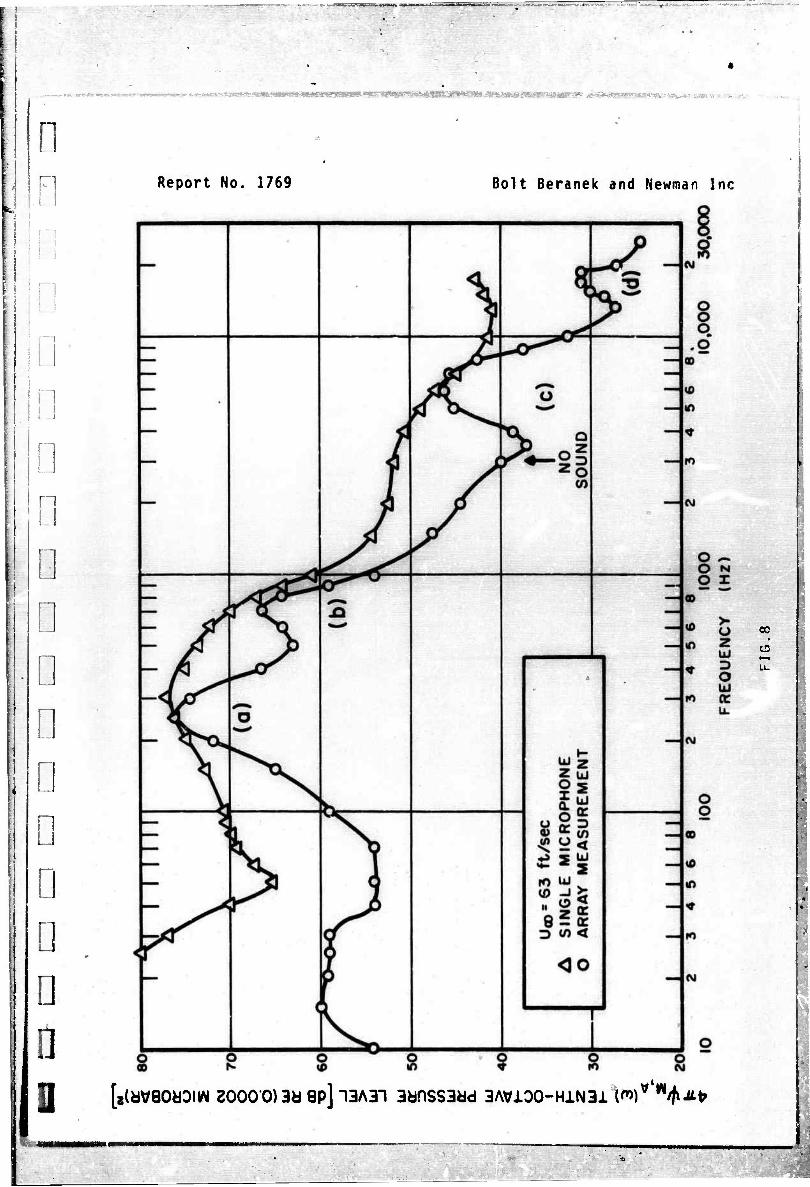
n f ^M<1£Stgmct!T^'-it?i^># •;»»>«
Report No. 1769 Bolt Beranek and Newman Inc
~~i
I □
G D D D D n U [8(UV90kOIW 20000) 3d 8p] H3A3H 3anSS3üd 3AV100-H1N31 \m)*>tH/tiJL*
00
15
«MM

imvxMamh^'ü
n n n
n
LJ*--
□
q
Iß
I G 1 D D
Report No. 176S Polt Beranek and Newman Ine
[8(dV80d3IW 20000) 3d ap] 13A3-I 3änSS3äd 3AV100-H1N31 (*)*'%**
tu
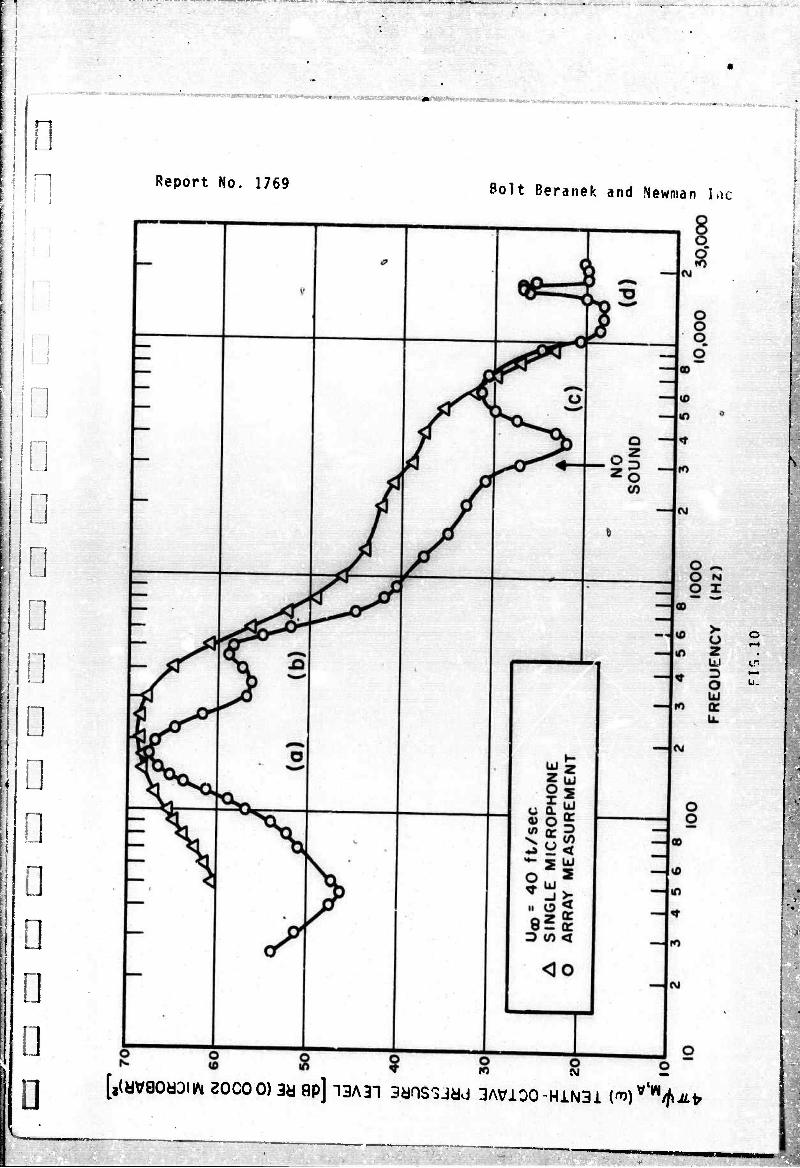
,-i^__^—-£.:i*5_
**~i**™W'*ia9a«E«,*^!«*0«l»«KS^^ ■rÄV»»*M. •
n
! ! 1
1 D 1 a
a a
a LI
a
Report No. 1769 Bolt Beranek and Newman Inc
u.
[IM IM —
*(UV8OU0l|* 20COO) 3d 8P] 13A31 BdHSSJdd 3AV1DO-H1N31 Coj^iLfr

■Jt
^.^i*«*!*«.«-*»«*^^
0
n
j ! ! '■■■■
n
I D
! n
D G
Report No. 1769 Bolt Beranek and Newman Inc
o
—4M
—I*
—
S A
0(
—
—
J>1
1 4 1 f
o <♦ o
o
0 o° > a
zO en
Ill 1 1 1 1 1
- < - «o - <3
-< <
<
0 1 1
0 1 £' 0 |
0 1
i a ° 1
r —
Uoo
= 6
3 f
t/s
ec
A
S
ING
LE
MIC
RO
PH
ON
E
O
AR
RA
Y
ME
AS
UR
EM
EN
T
E
STI
MA
TED
BA
CK
GR
OU
ND L
EV
EL
—
I 1
r ° - 0
k —
8
o o o. o
oo
m
to
CVJ
O r- O N O I
—I>n
—I* to
(VJ
> O Z UJ Z> O UJ CE U.
O O
10
in
—l<Vi
O i g 8 8 9 [,(awaoM0iw zoooo)3«ap]n3A3i sansssad SAVIOO-HINSI (<■»* "+*»
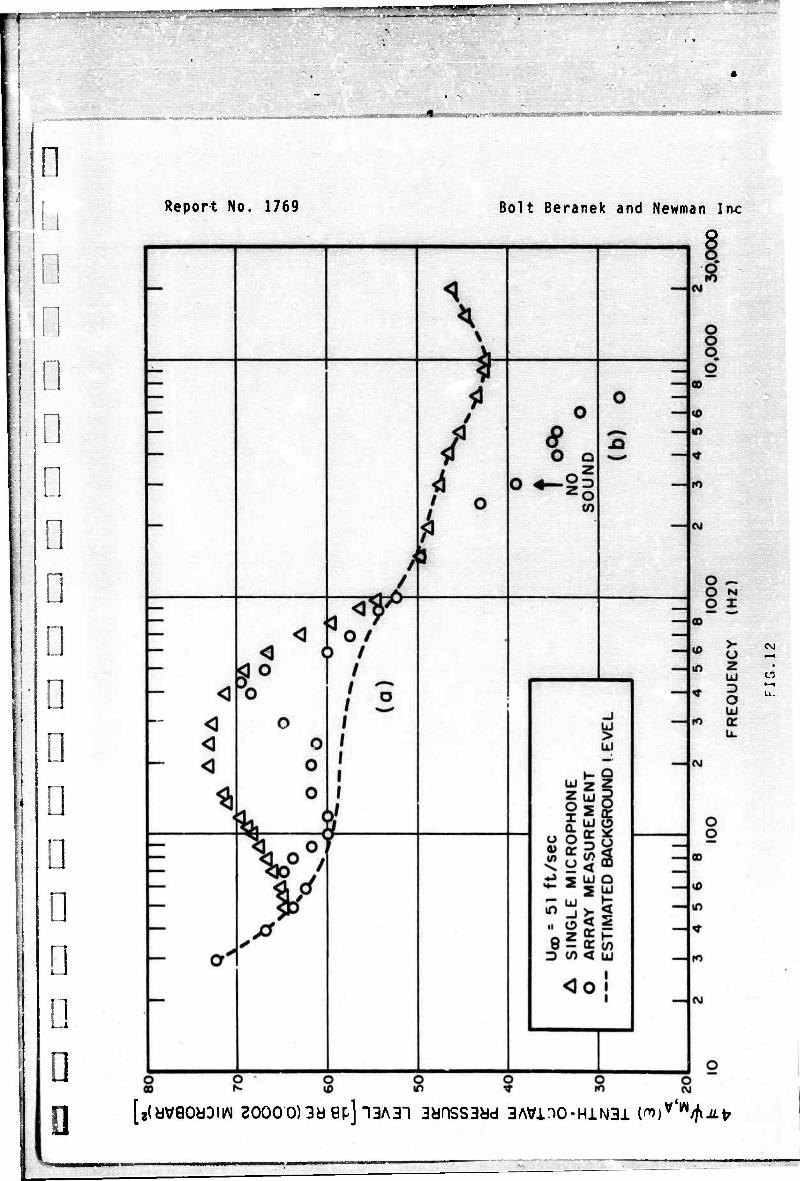
- sszs^msssrzr*? -,'. ■ ■.', ;.s»'.'. .Z.'aZSZZUL -'.-Z^SÜ^Ü U»I.-l. i —-' ■ " -" ■ JI'IM',1:-'.1»«"«
^
n
n
1 1 n ■—■
i □ D :i D
ü o D □ D 0
Report No. 1769 Bolt Beranek and Newman Inc
[2(aV80äDllAI 2000 0)30 9p]l3A3~l 3JdOSS3bd 3AV.n0-HlN31 {v^/fuLi?
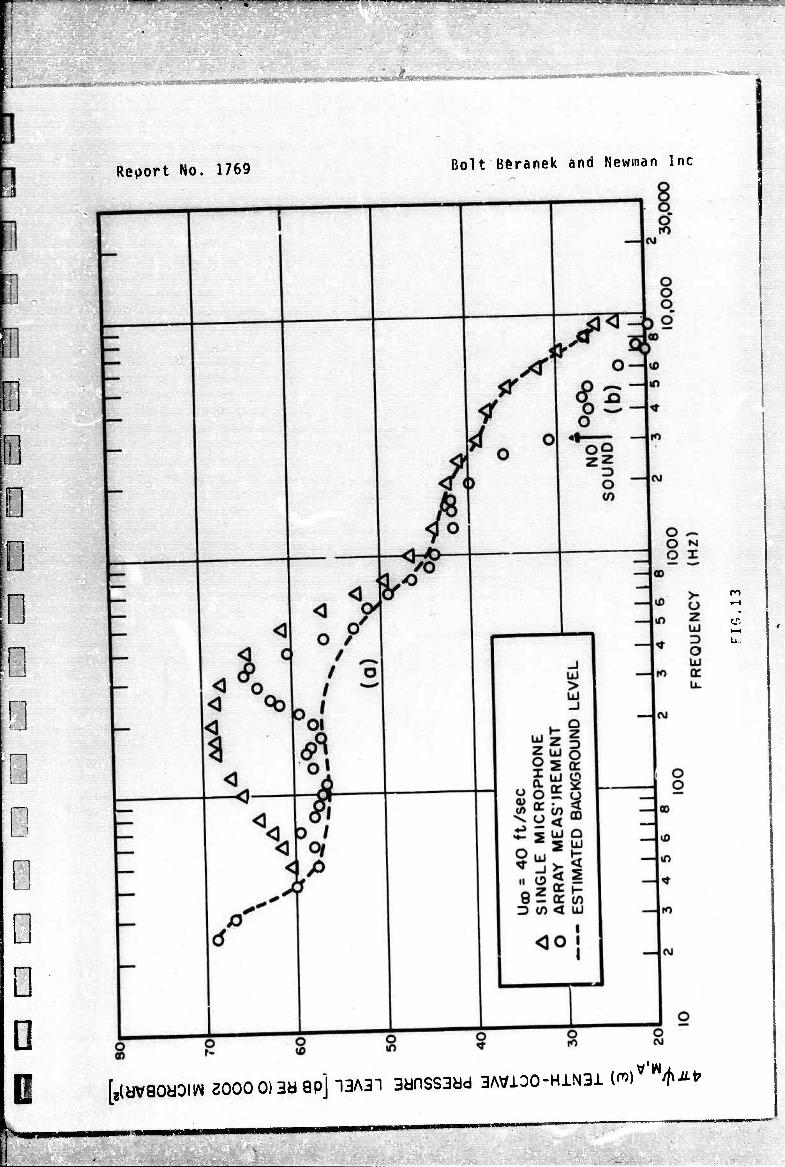
Wffp ' VJi ''- ■«■^-■-k— .■".■ I
ff****^ i^l''*wii»w'nwaipsag§i»#«wa'*g^»
Report No. 1769 Bolt'Beranek and Newman Inc
P D D D 1
cr. *—• u.
[„(avaoaoiw 20000) 3d ap] i3A3i 3anss3dd 3AVIOO-HIN3I N v'w/^>

; „ ■ -■ - - ■■""•■■" ■^«'"«"'
n i
VI 1 1
I i
i
a □ D D a
D D G
Report No. 1769 Bolt Beranek and Newman Inc
(0
«a-
C9
[OSVHd 9NllVNd3nv)v<I)/(3SVHd Nl )Vd>] 901 01

——"""''—■' ■ i' ■ ■ ■ ■ oim 'ifiifBfffft ''ji
n*™**Wti*sflWliW*«
Report No. 1769 Bolt Beranek and Newman Inc
1.0
08
2 0.6 <0
w0.4
02
^
K -0.196 [l+4
1 .06 J0 (2.96
1 — MEASU
: r/R)'
*ED
1
V^ '
VA V\
V V> \
^ 0 12 3 4 5 6
r(mm) 7 8 9 4 10
FIG.15

""■■■: "TV _ , ,— ^mpBtMHu^.ni. n i ii i.■"■■ mmammfim.«
■ iiijinimwJgc—m-n-m
n n i n
D 1 1 D LI
D □ □ D D D D
D D D
Report No. 1769 Bolt Beranek and Newman Inc
FIG.16
-—-■•■
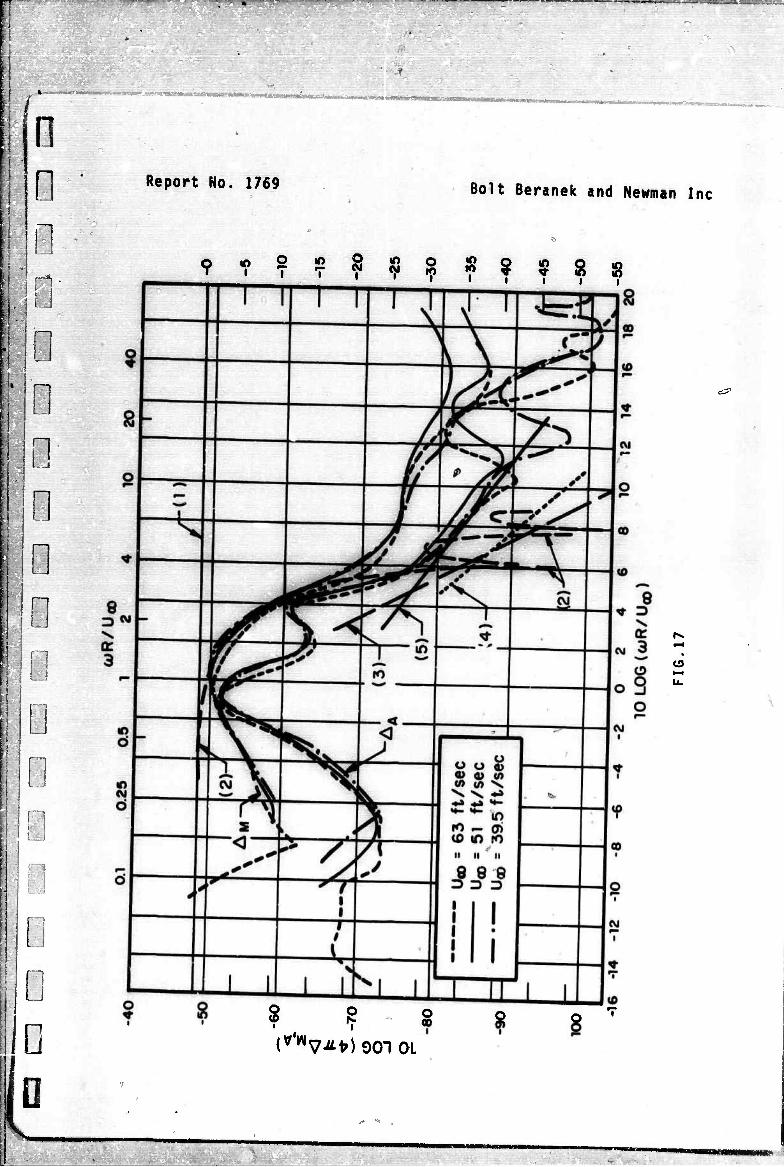
F 1 i
I t
-1
w B
In ■ i i 1 *
i n • B In)'
In f 1 n
IF: J
"-"_ t ■■".."■'
n D n
Li
n j i !
! . i
o 0
Report No. 1769 Bolt Beranek and Newman Inc
Q * 9 £ S IG ° & 2 <" Q 0 Y ' 7 7 ? ? •? T T T V V
? ? -8
C3

„- „.„. ... : !~-"—7" -•* ' '"-' "* r~! ^"^ ....._. ■ ■■M ^Hiunifi ii.JiUJ ■
,-— ■I,..-^ ^ .■.^Mni...—.,...,.,. ,,r .-,■.—■ ' ■illiw^l.riWB''«-«! LMMTHl^ir^Ha
n n
n
a
a a D
D D D D D D
Report No. 1769 Bolt Beranek and Newman Inc
o o f
o o rj. cp
{vV-fcfr) 901 01
o en i
o
CO l-H
CD
*vm

"*• ■_ ■ ■ l»HH«W<i'U ■*j.g.iL:??;:""-: • •.:—.'.'-- „-":—T1T~———-—— <—
I
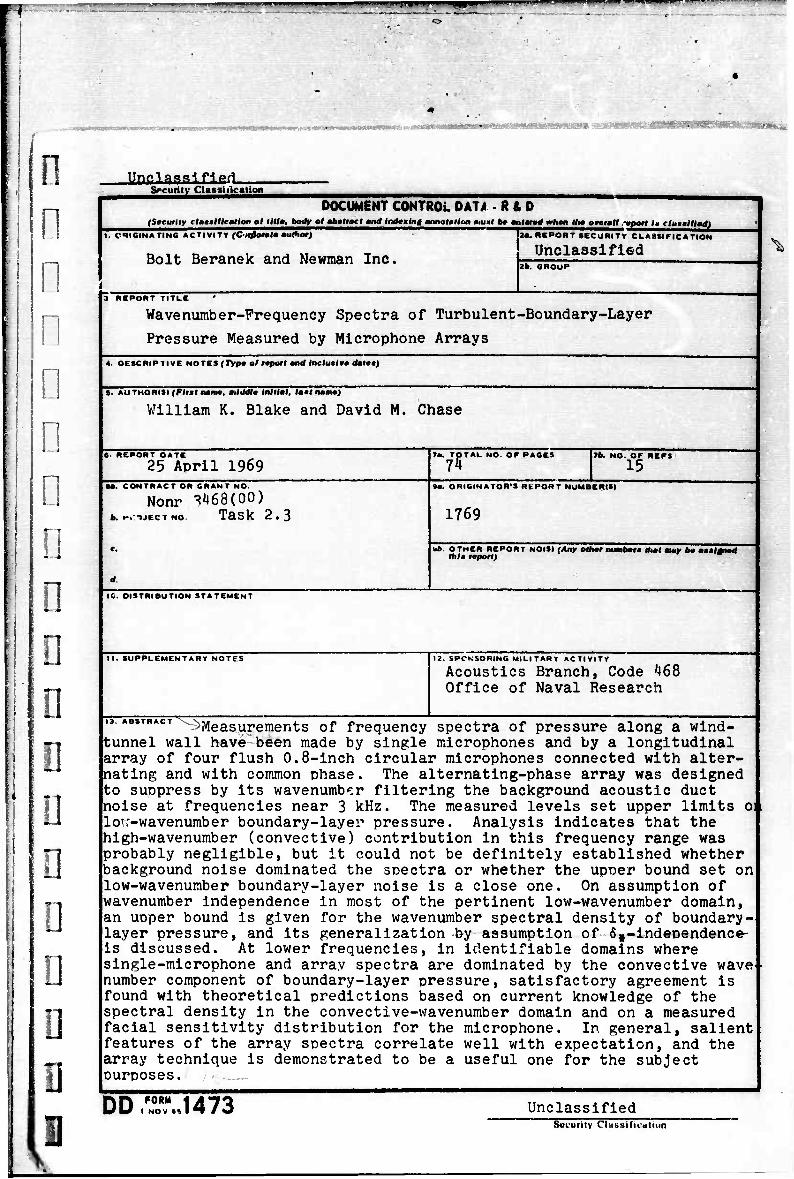
/
mvat^miaiaifi'MltWCVr'
i
n n
n i
i n D [j
n
D
D D D D
Unfi1.af.Rl fled. Security Classuication
DOCUMENT CONTROL DAT* R&D (Security claaalHeatiort ol till: oooV o/ mbtltacl and indexing annotation mu*t be entered whew Hi« overall -»pott I» clumalllad)
ORIGINATING ACTIVITY (C->rflorate author)
Bolt Beranek and Newman Inc.
Za. REPORT SECURITY CLASSIFICATION
Unclassified 26. CROUP
3 REPORT TITLE '
Wavenumber-Frequency Spectra of Turbulent-Boundary-Layer
Pressure Measured by Microphone Arrays
4. DESCRIPTIVE NOTES (Type o/ report and inclusive dun)
8- AUTHORISI (Pint name, middle initial, tarnt name)
William K. Blake and David M. Chase
«. REPORT OATE
25 April 1969 •a. CONTRACT OR GRANT NO.
Nonr ?168(00) t. -. -»JECTNO. Task 2.3
7a. TOTAL NO. OF PACES 'ff 7b. NO. OF REFS 15
«a. ORIGINATOR'S REPORT NUMBERISI
1769
*l>. OTHER REPORT NOISt (Any othet number» ami nw be aetlgned Ihla report)
10. DISTRIBUTION STATEMENT
II. SUPPLEMENTARY NOTES 12. SPONSORING MILITARY ACTIVITY
Acoustics Branch, Code 468 Office of Naval Research
13. ABSTRACT ^Measurements of frequency spectra of pressure along a wind- tunnel wall have been made by single microphones and by a longitudinal array of four flush 0.8-inch circular microphones connected with alter- nating and with common phase. The alternating-phase array was designed to suppress by its wavenumber filtering the background acoustic duct noise at frequencies near 3 kHz. The measured levels set upper limits o: loTr-wavenumber boundary-layer pressure. Analysis indicates that the high-wavenumber (convective) contribution in this frequency range was probably negligible, but it could not be definitely established whether background noise dominated the spectra or whether the upper bound set on low-wavenumber boundary-layer noise is a close one. On assumption of wavenumber independence in most of the pertinent low-wavenumber domain, an uDper bound is given for the wavenumber spectral density of boundary- layer pressure, and its generalization ^y assumption of 6«j-indeoendence- is discussed. At lower frequencies, in identifiable domains where single-microphone and array spectra are dominated by the convective wave< number component of boundary-layer pressure, satisfactory agreement is found with theoretical predictions based on current knowledge of the spectral density in the convective-wavenumber domain and on a measured facial sensitivity distribution for the microphone. In general, salient features of the array spectra correlate well with expectation, and the array technique is demonstrated to be a useful one for the subject purposes.
DD FORM I NOV »« 1473 Unclassified
Security Classification

1 ■ ~ »■ . ITS'
Security Ctaaalncatlo i«.
KtY WOMOS ROLI WT
LINK •
HOL«
LINK C
KOLI
Turbulent boundary-layer pressure
Wavenumber-frequency spectrum of pressur|s
Arrays of microphones
Wave-vector filter
Unclassified Security Classification
:;f »mm