Olivine composition determination with small … purpose of this study was to develop a routine,...
12
730 Olivine composition determination with small-diameter X-ray powder cameras 1 By J. L. JAMBOR and CHARLES H. SMITH Geological Survey of Canada, Ottawa [Read 30 January 1964] Summary. Olivine composition can be rapidly and accurately obtained by using standard (Straumanis-mounting) 57.3 mm X-ray powder cameras. A determinative curve based on analysed natural olivines has been constructed by plotting the mol. % Fo against the spacing of back-reflection line 174. The regression equation for the composition range FOl0 0 to Fo3o i8 FO (too1. %) = 4151"46--3976'45 dl~ 4 using Fe-Kal radiation. The fayalite end (F%o to Foo) of the determinative curve shows a relatively sharp break from a straight-line relationship of d-spacing versus composition. Practical applications of the determinative curve are briefly presented. A LARGE number of determinations of olivine composition are required to outline in detail the cooling history of an ultramafic intrusion. The determinative methods in use have not lent themselves to the production of precise determinations in large numbers, and as a result a great deal remains to be learned about the olivine variations within single intrusions, and between the intrusions of different petro- graphic or tectonic provinces. The International Upper Mantle Project provides an immediate incentive to obtain more data on olivine com- positions as an indirect means of learning more of the parent mantle and the chemical variations within it. The purpose of this study was to develop a routine, precise method of olivine composition determination. The X-ray method presented has the advantages over optical methods of being generally more precise, faster, and adaptable to routine determinations by a technician. The film provides a permanent record for checking purposes. In addition, the method is applicable to the olivines in serpentinized rocks that, because of the low olivine content, could not be determined easily by chemical, optical, or diffractometer techniques. The use of X-ray powder diffraction methods for establishing the com- position of olivine in the forsterite-fayalite series is a relatively new but 1 Canadian Contribution No. 3 to the International Upper Mantle Project.
Transcript of Olivine composition determination with small … purpose of this study was to develop a routine,...

730
Olivine composition determination with small-diameter X-ray powder cameras 1
By J. L. JAMBOR and CHARLES H. SMITH
Geological Survey of Canada, Ottawa
[Read 30 January 1964]
Summary. Olivine composition can be rapidly and accurately obtained by using standard (Straumanis-mounting) 57.3 mm X-ray powder cameras. A determinative curve based on analysed natural olivines has been constructed by plotting the mol. % Fo against the spacing of back-reflection line 174. The regression equation for the composition range FOl0 0 to Fo3o i8
FO (too1. %) = 4151"46--3976'45 dl~ 4 using Fe-Kal radiation. The fayalite end (F%o to Foo) of the determinative curve shows a relatively sharp break from a straight-line relationship of d-spacing versus composition. Practical applications of the determinative curve are briefly presented.
A LARGE number of determinations of olivine composition are required to outline in detail the cooling history of an ultramafic
intrusion. The determinative methods in use have not lent themselves to the production of precise determinations in large numbers, and as a result a great deal remains to be learned about the olivine variations within single intrusions, and between the intrusions of different petro- graphic or tectonic provinces. The Internat ional Upper Mantle Project provides an immediate incentive to obtain more data on olivine com- positions as an indirect means of learning more of the parent mantle and the chemical variations within it.
The purpose of this s tudy was to develop a routine, precise method of olivine composition determination. The X-ray method presented has the advantages over optical methods of being generally more precise, faster, and adaptable to routine determinations by a technician. The film provides a permanent record for checking purposes. In addition, the method is applicable to the olivines in serpentinized rocks that , because of the low olivine content, could not be determined easily by chemical, optical, or diffractometer techniques.
The use of X-ray powder diffraction methods for establishing the com- position of olivine in the forsteri te-fayali te series is a relatively new but
1 Canadian Contribution No. 3 to the International Upper Mantle Project.
DETERMINATION OF OLIVINE COMPOSITION 731
well-established technique. Yoder and Sahama (1957) published a deter- minative curve based upon accurate measurement of the 20 angle of the 130 reflection by diffractometer. Jackson (1960) used the same apparatus and the 602 spacing to construct a more precise curve for the composition range Fo 80 to 90.
A small diameter camera (66 ram) was used by Eliseev (1957) to show the variations in the X-ray powder patterns of the olivine series, but no determinative curve was constructed. Heckroodt (1958) used a 57-3 mm camera and correlated chemical composition with the spacings of the 174 (indexed by Heckroodt as 0.10.0) and 226 reflections. This study is an extension of the method outlined by Heckroodt, using the 174 reflection.
The principal advantage of the X-ray powder camera method over the diffractometer technique is that very little material is required. This reduces the time required for sample preparation, and extends the method to altered ultramafic rocks containing only a few grains of olivine. The accuracy of olivine determinations using the powder camera tech- nique and the 174 line is comparable to diffractometer determinations based on low 20 reflections.
The 174 spacing meets the principal requirements for an X-ray determinative curve. The reflection is relatively intense and uniform throughout the forsterite-fayalite series. Moreover, the 174 reflection changes about 7 ~ 20 between forsterite and fayalite and the spacing is thus sufficiently affected by small compositional changes for accurate determinations to be made using a camera with a small effective radius. As the normal method of preparing X-ray spindles is to remove the olivine from thin section, there is no masking of the 174 reflection by pyroxene or plagioclase. Serpentine, which is commonly and unavoidably incorporated into the X-ray mounts and in some eases may be the pre- dominant mineral, does not interfere in the X-ray pattern.
Description of samples The determinative curve was prepared using twenty-two natural and
four synthetic olivines. A number were available in analysed form, and data has been published elsewhere on their chemical composition and geologic occurrences (Yoder and Sahama, 1957; Heckroodt, 1958; Wager, 1960).
The samples analysed at the Geological Survey of Canada (Table l) were prepared by crushing to --150+200 mesh size and purifying with the Frantz Isodynamic Separator and heavy liquids. One to two grams of the concentrate were hand picked until the impurities were negligible.

732
c/2
d
4 ~9
�9
,T. L. J A M B O R A N D C. ~ . S M I T H ON
o~
.~ t ~ o ~ ~ ,.~ .~
0 ~'~ ~ ' ~ !
~ o -
~ o~
.~ ~ ...~ .~ ~
~ .~ ~. ~ . ~
O O ~
�9 ~ .~ ~ r~
@ @
~2
6
OD
or)
aD
, ~ 6 6 ~ - - 6 6 6 < 5 6
- ~ � 9 1 6 9 1 6 9 1 6 9 1 6 9 1 6 9 1 6 9

DETERMINATION OF OLIVINE COMPOSITION 733
The Mg~SiO 4 content, Fo, was calculated according to the method given by Stevens 1 and used by Yoder and Sahama (1957).
X-ray procedure The preparation of X-ray powder spindles from nomlal samples is
well known, and only the method used for small grains in uncovered thin sections need be mentioned here. A fine needle held in a suitable holder is used to break the grain from its matrix under the microscope. The grain is transferred to a small mortar, preferably not more than an inch in diameter, containing alcohol or a similar volatile ]iquid. When sufficient olivine has been accmnulated (with practice the number of grains required can be reduced considerably), a slight swirling or circular motion of the mortar will concentrate the particles in the centre. The excess liquid is evaporated or drawn off with a tissue and the sample ground while still wet. The absence of excess moisture enables the pow- der to be further concentrated so that most of it can be made to adhere to the pestle. The X-ray spindle is made by dipping the glass fibre portion into vaseline, which serves as a binding agent. The coated fibre is roiled in the powder and fashioned into a symmetrical spindle, which can be run immediately on the X-ray unit as no drying time is required. Absorption errors are minimized, as the outer diameter of such spindles is generally less than 0-2 ram. The mount can be re-used by cleaning the fibre with soft tissues. I t is essential that the olivine fragments be ground into a powder, as dabbing the fibre directly into the broken olivine grains will invariably give poor, spotty patterns. Moreover, grinding the fragments has the effect of relatively increasing the amount of material available.
Another method for obtaining X-ray powder patterns from small amounts of material has been used by Hiemstra. 2
I t was originally intended in our study of ultramafic rocks that the 171 reflection and the determinative curve given by Heckroodt (1958) be used. Heckroodt's graph, although it incorporated six natural olivines, consisted essentially of a straight line joining the calculated b dimensions given by Yoder and Sahama for synthetic olivines (Heek- roodt gives do.10.0 1.0191A (Fo) to 1.0476 (Fa)'; Yoder and Sahama give b 10.195 3~ (Fo) to 10.477 (Fa)). In attempting to use Iteckroodt's determinative curve it was found that a specimen of natural fayalite from Rockport, Massachusetts, gave results that did not agree with
i R. E. Stevens, Bull. U.S. Geol. Surv., 1946, no. 950, p. 101. S. A. Hiemstra, Amer. Min., 1956, vol. 41, p. 519o
734 J . L . JAMBOR AND C. H. SMITH ON
Heckroodt 's end point for synthetic fayalite. A similar discrepancy between measured and fictive d130 values of fayali te had been reported and discussed by Yoder and Sahama. The present curve was therefore constructed mainly on the measured spacings obtained from natural olivines.
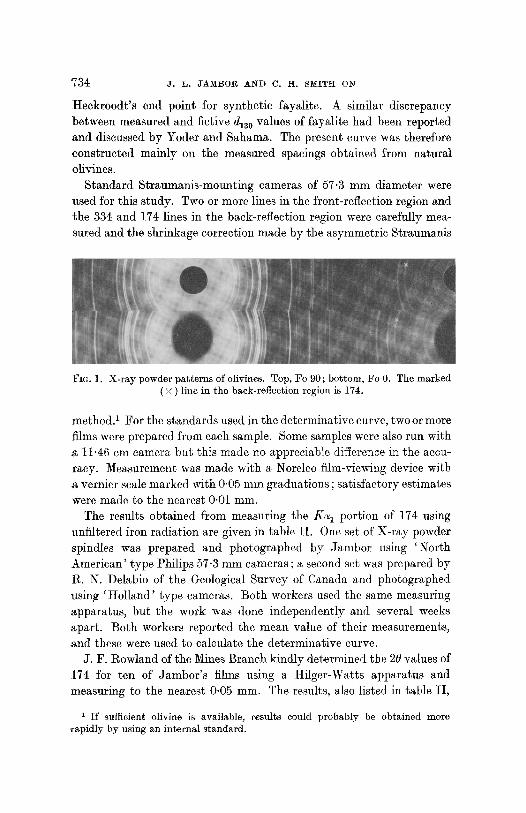
Standard Straumanis-mounting cameras of 57"3 mm diameter were used for this study. Two or more lines in the front-reflection region and the 33~: and 174 lines in the back-reflection region were carefully mea- sured and the shrinkage correction made by the asymmetric Straumanis
Fin. 1. X-ray powder pat terns of olivines. Top, Fo 90 ; bottom, Fo 0. The marked ( • ) line in the back-reflection region is 174.
method. 1 For the standards used in the determinative curve, two or more films were prepared from each sample. Some samples were also run with
11.46 cm camera but this made no appreciable difference in the accu- racy. Measurement was made with a Noreleo fihn-viewing device with a vernier scale marked with 0'05 mm graduations ; satisfactory estimates were made to the nearest 0.01 mm.
The results obtained from measuring the K a 1 portion of 174 using unfiltered iron radiation are given in table II . One set of X-ray powder spindles was prepared and photographed by Jambor using 'Nor th American ' type Philips 57"3 mm cameras ; a second set was prepared by R. N. Delabio of the Geological Survey of Canada and photographed using 'Hol land ' type cameras. Both workers used the same measuring apparatus, but the work was done independently and several weeks apart . Both workers reported the mean value of their measurements, and these were used to calculate the determinative curve.
J. F. ReMand of the Mines Branch kindly determined the 20 values of 174 for ten of Jambor ' s films using a Hilger-Watts apparatus and measuring to the nearest 0.05 mm. The results, also listed in table II ,
1 I f sufficient olivine is available, results could probably be obtained more rapidly by using an internal s tandard.
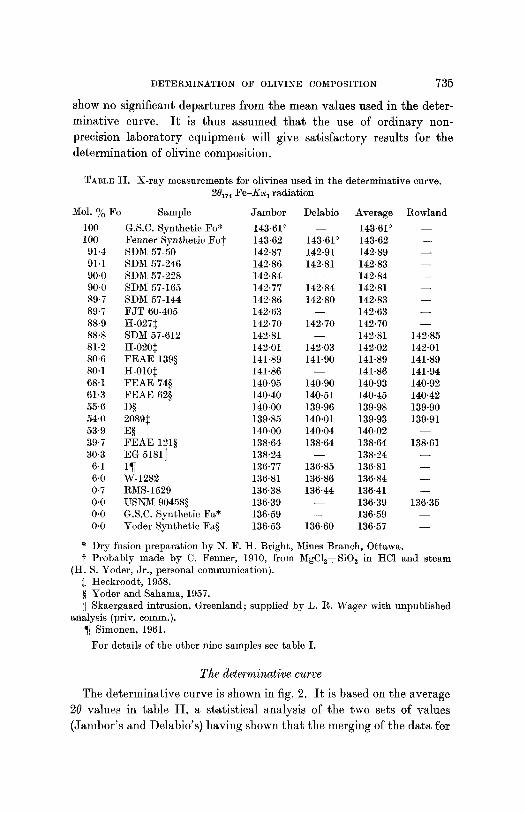
DETERMINATION OF OLIVINE COMPOSITION 735
s h o w no s ign i f ican t d e p a r t u r e s f r o m t h e m e a n va l u e s u s e d in t h e de te r -
m i n a t i v e curve . I t is t h u s a s s u m e d t h a t t h e use of o r d i n a r y n o n -
p rec i s ion l a b o r a t o r y e q u i p m e n t will g ive s a t i s f a c t o r y r e su l t s for t h e
d e t e r m i n a t i o n of ol ivine c o m p o s i t i o n .
TABLE :[I. X-ray measurements for olivines used in the determinative curve. 28174 Fe-K% radiation
Mol. % Fo Sample Jambor Delabio Average Rowland
100 G.S.C. Synthetic Fo* 143.61 ~ - - 143.61 ~ - - 100 Fenner Synthetic Fo~" 143"62 143"61 ~ 143"62 - - 91'4 SDM 57-50 142'87 142'91 142'89 - - 91'1 SDM 57-246 142"86 1 4 2 " 8 1 142"83 - - 90.0 SDM 57-228 142"84 - - 142'84 - - 90.0 SDM 57-165 142"77 1 4 2 " 8 4 142"81 - - 89"7 SDM 57-144 142"86 142'80 142-83 - - 89'7 FJT 60-405 142"63 - - 142"63 - - 88"9 tt-0275 142'70 1 4 2 " 7 0 142'70 - - 88"8 SDM 57-612 142'81 - - 142"81 142"85 81-2 H-0205 142"01 1 4 2 " 0 3 1 4 2 " 0 2 142'01 80'6 FEAE 139w 141"89 141-90 1 4 1 " 8 9 141"89 80"1 H-010:~ 141-86 - - 141"86 141"94 68'1 FEAE 74w 140"95 1 4 0 " 9 0 1 4 0 " 9 3 140-92 61"3 FEAE 62w 140"40 1 4 0 " 5 1 140'45 140'42 55"6 Dw 140"00 139'96 1 3 9 " 9 8 139-90 54"0 2089:~ 139"85 1 4 0 " 0 1 1 3 9 " 9 3 139"91 53"9 Ew 140"00 1 4 0 " 0 4 140'02 - - 39"7 FEAE 121w 138.64 138.64 138.64 138.61 30.3 EG 5181]] 138"24 - - 138.24 - -
6.1 1�82 136.77 136.85 136.81 - - 6'0 W-1282 136.81 136.86 136.84 - - 0.7 RMS-1529 136.38 136.44 136.41 - - 0'0 USNM 90458w 136.39 - - 136.39 136.35 0"0 G.S.C. Synthetic Fa* 136.59 - - 136'59 - - 0.0 Yoder Synthetic Faw 136.53 136.60 136.57 - -
* Dry fusion preparation by N. F. H. Bright, M:ines Branch, Ottawa. Probably made by C. Fenner, 1910, from MgC12+SiO 2 in tIC1 and steam
(H. S. Yoder, Jr., personal communication). :~ Heckroodt, 1958. w Yoder and Sahama, 1957. N Skaergaard intrusion, Greenland; supplied by L. R. Wager with unpublished
analysis (priv. comm.). �82 Simonen, 1961.
For details of the other nine samples see table I.
The determinative curve
The d e t e r m i n a t i v e cu rve is s h o w n in fig. 2. I t is b a s e d on t h e a v e r a g e
20 va lue s in t ab l e I I , a s t a t i s t i ca l ana lys i s of t h e t w o sets of va lue s
( J a m b o r ' s a n d De lab io ' s ) h a v i n g s h o w n t h a t t h e m e r g i n g of t h e d a t a fo r
736 J . L . J A M B O R A N D C. H . S M I T H O N
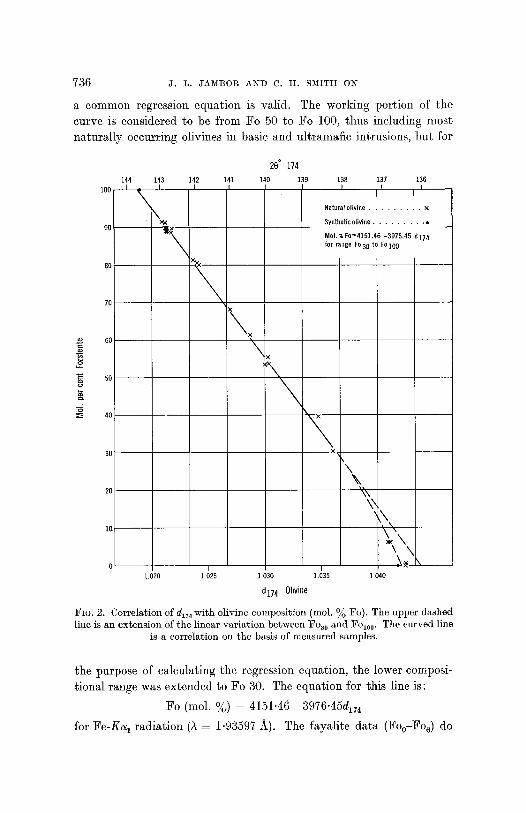
a common regression equation is valid. The working portion of the curve is considered to be from Fo 50 to Fo 100, thus including most naturally occurring olivines in basic and ultramafie intrusions, but for
100
90
.~ 6O
"~ 50
~_ 40
144 143 ,,. \
\
o 20 174
142 141 140 139
\
1.020 1.025
138 137 136
I I I
Natural olivine x
, Synthetic olivine . . . . . . . . . �9
Mol. % Fo = 4151.46 -3976.45 d 174 for ra,lge Fo30 to FOlo 0
I
x
\x
1.030 1.035
di7 4 Olivine
\ x
\ \
\
\.k~\ 1.040
Fie. 2. Correlation of di~4with olivine composition (mol. ~o Fo). The upper dashed line is an extension of the linear variation between F%0 and F%00. The curved line
is a correlation on the basis of measured samples.
the purpose of calculating the regression equation, the lower composi-
tional range was extended to Fo 30. The equation for this line is:
Fo (reel. %) = 4151-46--3976"45d1~ 4
for Fe-Ka 1 radiation (~ = 1"93597 ~_). The fayalite data (Fo0-F%) do

DETERMINATION OF OLIVINE COMPOSITION 737
not fit the straight line graph calculated between Foa0 and Folo o. The departure of these points from the calculated fit is significant and is dis- cussed further in a later section.
The dla 0 data of Yoder and Sahama (1957) can also be t reated in a similar manner, deleting the fayalite samples from the calculation of the regression equation. A bet ter fit is obtained for the data between F%o and Fol0o, and the regression equation changes from:
Fo (tool. %) = 4233.91--1494.59dla 0
to Fo (tool. %) = 4043.35--1426.08dla o.
The difference reported between their measured and fictive dis o for fayali te is accounted for, since the lat ter is a hypothetical end-point derived from a straight line fit using the complete set of data.
The determinative curve presented by Heckroodt (1958) is also based on an assumed straight line variat ion from forsterite to fayalite. In addition, however, some of our measured 20 values (table II) are in poor agreement with his determinations on the same samples (Sample Nos. H2010 and 2089). Our measurements agree with the single crystal values reported by Heckroodt for H-010, but our measurements for 2089 do not agree with those reported by him and the reasons for the discrepancy are not known.
The small differences between the measured d-spacings of natural and synthetic fayali tc are undoubtedly due in par t to minor-eleInent content ; correction for manganese has the effect of shifting the d-values for natural fayali te toward those of the synthetic product.
Est imat ion o f errors in the determinative curve
The 95 ~o confidence limits I for the 174 determinative curve are:
Fo 100 tool. % 80 60 40 d 1.0189 1.0239 1.0289 1.0340 95 % conf. lim. • % Fo ~0.57 % ~0.72 % ~1.16 %
The 130 data of Yoder and Sahama, when t rea ted in the same manner over the range from Fo o to F%0o, have confidence limits ranging from • to • % Fo. These values are, however, based on an assumed straight line, whereas the 130 data also show a break near the fayali te
>./l /k< 1 1 Calculated using the formula iS . to .gn . (n- -2 n-l+(d--d) 2 di--~)~ .

738 J .L . JAMBOI~ AND C. It. SMITtI Olq
end. The confidence limits of the recalculated dla o equation for the range from Fo20 to Fol00 given above are :
Fo 100 mol. % 80 60 40 d 2.7654 2.7792 2.7931 2.8070 95 % conf. lim. :]_0.69 % Fo • • % • %
All the above data indicate that more accurate results are obtained if a linear relationship of d-spacing versus composition is assumed only for the composition range F%0 to FOl00.
In the restricted range of Fos0 to F%0 , Jackson (1960) gives an error of 4-0,43 % for 95 % confidence limits. This represents an ideal case where the composition range is limited and the samples are from a single intrusion. The accuracy of fit is bound to decrease as olivines from different geological environments are included.
In conclusion, it would appear that optimum accuracy can be ob- tained by measuring a high-angle reflection by diffractometer provided that suificient material and facilities are available for such work. The powder camera method, on the other hand, will yield accurate results on minute amounts of olivine.
Identification of 174 line The reflection used for the determinative curve is indexed as 0.10.0
by Heckroodt (1958) and by the U.S. National Bureau of Standards. 1 However, the calculation of b for fayalite using this '0.10.0' gives a con- siderably lower value (10,419 A) than the 10.477 A reported by Yoder and Sahama and others.
Since many lines in the X-ray powder patterns of the olivine series change in position and intensity with composition, the possibility arose that the line used for the determinative curve was not the same in the fayalite samples. This would provide a simple explanation for the different b values and possibly eliminate the 'break ' in the determinative curve. However, examination of a suite of 21 synthetic olivines pre- pared by N. F. H. Bright of the Mines Branch, ranging from forsterite to fayalite in stages of 5 mol. %, showed that the measured line remains prominent and readily traceable throughout the entire series.
The discrepancy in calculated b values can be eliminated by indexing the line as 174. In the A.S.T.M. powder pattern for synthetic forsterite, both do.10.o and dl~ 4 give b equal to 10.201 •. In fayalite, however, only
1 H.E. Swanson and :Eleanor Tatge, U.S. Nat. Bur. Stand., 1953, Circ. 539, no. 1, p. 83 ; A.S.T.M. X-ray powder data file, cards 4-0768, 4-0769.

D E T E R M I N A T I O N O F O L I V I N E C O M P O S I T I O N 739
d174 gives good agreement with the calculated da ta ; using a = 4.82, b = 10-48, c = 6.09 A, which are close to Yoder and Sahama's para- meters for synthetic fayalite, dc~lc is 1-0422�9 This is in good agreement with dmeas 1.0419 for synthetic fayalite.
"E
100 - -X
90 : " |
":.v, 80 �9 "b.
70 ,.
60
5O
4 0 - -
3 0 - -
2O
10
0 I 4.75 4.80
a from 400
X I I I
�9 : ' ~ �9
. ' i " " " : : .�9
x' I I I 6.00 6.05 6.10~
c f rom 004
FIG�9 3. Correlation of a and c with olivine composition. • represents synthetic samples and open circles the single-crystal back-reflection data of Heckroodt (1958).
Variation in olivine parameters
The correlation of a and c with olivine composition is shown in fig. 3. The parameters were calculated from d40 o and d004 measured on several standards plus addit ional samples whose chemical composition was de- rived from the determinative curve�9 Only the best films in which the 400 and 004 lines were clearly resolved were used, and for this reason values are not recorded for all the olivine standards�9 I t is apparent tha t our measurements are not sufficiently precise to indicate whether a and
740 a . L . JAMBOR AND C. lt. SMITIt ON
c vary uniformly with composition. The results suggest, however, that the curvature of the 174 and 130 determinative curves may largely be due to the non-uniform variation of b. The curvature in the determina- tive data is probably related at least in part to ordered substitution of the larger-sized Fe 2+ atom for Mg 2+, the latter occupying two non- equivalent positions in forsterite. From a structural study of forsterite, R. J. Davis reports (personal communication) that sharing between octahedra whose centres are crystallographically non-equivalent occurs on average in the b direction ; this sharing brings cations closer together than average, close enough to allow magnetic interactions between ferrous ions similar to that found between ferrous and ferric ions in magnetite. Such interaction is likely to be attractive rather than repul- sive and lead to a shortening of b. This shortening, which can only begin to occur when the second site becomes appreciably filled, could lead to a break of the type observed in the determinative curves.
Practical applications in petrology
Brief mention can be made of two current uses of the determinative curve in our studies of ultramafic intrusions:
Olivines in the Muskox Intrusion, Northwest Territories, show a large range in composition (F%2 to F%s ). A zonal arrangement in the intru- sion is evident, compositions more magnesian than F%0 being confined to the core of the intrusion and more iron-rich divines occurring toward the top, sides, and in the feeder (Smith and Kapp)3 The Muskox intrusion provides a unique opportunity to study the relationship of olivine composition to the cooling history of a basaltic magma, and a large number of determinations are necessary to fill in the detail between layers. Since the dunite layers are highly serpentinized and olivine remnants scarce, the X-ray powder camera method is especially helpful.
Olivine compositions reflect the chemical composition of their parent magma and may, in places, be useful for distinguishing basaltic (strati- form) and ultramafic (alpine) intrusions. The serpentinites of the Canadian Shield have been commonly considered as alpine-types because of their tectonic setting. In many of these bodies, rare olivine remnants provide the only clue to their original composition. X-ray determinations on these grains to date indicate that they tend to be more iron-rich than those of normal alpine-type intrusions and are more characteristic of the
1 C. H. Smith and H. E. Kapp, Min. Soc. Amer., 1963, Special Paper 1, p. 30.
DETERMINATION OF OLIVINE COMPOSITION 741
basaltic dif[erentiates. I Work is proceeding to compile more data on
Precambrian olivines as samples become available, with a view to
obtaining a clearer picture of the original composition of Precambrian
ultramafic intrusions.
Acknowledgements. Assistance with this study was received in many forms and the writers are extremely grateful. Analysed olivines were provided by H. S. Yoder, Jr., L. R. Wager, J. Willemse, and A. Simonen. Other olivine samples were pro- vided by N. F. H. Bright, i~. M. Thompson, and E. P. Wheeler If. A number of the olivine concentrates were prepared at the Geological Survey for studies made by I. D. MacGregor and D. C. Findlay, and were analysed under the direction of J. A. Maxwelh H. S. Yoder, Jr., and i~. O. Heckroodt kindly provided additional comments on the relation of this study to their investigations. I~. N. Delabio and J. F. Rowland made the film measurements previously mentioned in the text. The statistical analyses were made by :K. Shimizu and F. P. Agterberg. The assistance of these and many others is very much appreciated.
J~efr [ETIsEEv (E. N.)] EaHceeB (E. H.), 1957. 3am Bcecom~. MHH. O6~. (Mem.
All-Union Min. Soc.), vol. 86, p. 657 [M.A. 14-137]. HEGXI~OODT (R. 0.), 1958. Trans. Geol. Soc. South Africa, vol. 61, p. 377 [M.A.
14-351]. JACKSOn- (E. D.), 1960. U.S. Geol. Survey, Prof. Paper 400B, p. 432 [M.A. 15-219]. PE~FIEL]) (S. L.) and FORBES (E. H.), 1896. Amer. Journ. Sci., ser. 4, vol. 1, p. 129. S~O~E~- (A.), 1961. Bull. Comm. g6ol. Finlande, vol. 196, p. 371 [M.A. 15-467]. WAGER (L. R.), 1960. Journ. Petrology, vol. 1, p. 364 [M.A. 15-316]. WHEELER (E. P., 2nd), 1960. Bull. Geol. Soc. Amer., vol. 71, p. 1755 [M.A. 15-314]. YO])ER (H. S., Jr.) and SAHAMA (Th. G.), 1957. Amer. Min., vol. 42, p. 475 [IV[.A.
14-196].
1 C. H. Smith, 1961, Canada Geophys. Bull., vol. 14. p. 157.
3e