Oliver Tant, Chief Financial Officer
25
Discipline Oliver Tant, Chief Financial Officer
Transcript of Oliver Tant, Chief Financial Officer

Discipline
Oliver Tant, Chief Financial Officer
2 |
Disclaimer
Certain statements in this presentation
constitute or may constitute forward-looking
statements. Any statement in this
presentation that is not a statement of
historical fact including, without limitation,
those regarding the Company’s future
expectations, operations, financial
performance, financial condition and
business is or may be a forward-looking
statement. Such forward-looking statements
are subject to risks and uncertainties that
may cause actual results to differ materially
from those projected or implied in any
forward-looking statement. These risks and
uncertainties include, among other factors,
changing economic, financial, business or
other market conditions. These and other
factors could adversely affect the outcome
and financial effects of the plans and events
described in this presentation. As a result,
you are cautioned not to place any reliance
on such forward-looking statements. The
forward-looking statements reflect knowledge
and information available at the date of this
presentation and the Company undertakes no
obligation to update its view of such risks and
uncertainties or to update the forward-looking
statements contained herein. Nothing in this
presentation should be construed as a profit
forecast or profit estimate and no statement
in this presentation should be interpreted to
mean that the future earnings per share of
the Company for current or future financial
years will necessarily match or exceed the
historical or published earnings per share of
the Company. This presentation has been
prepared for, and only for the members of the
Company, as a body, and no other persons.
The Company, its directors, employees,
agents or advisers do not accept or assume
responsibility to any other person to whom
this presentation is shown or into whose
hands it may come and any such
responsibility or liability is expressly
disclaimed. The material in this presentation
is not provided for tobacco product
advertising or promotional purposes. This
material does not constitute and should not
be construed as constituting an offer to sell,
or a solicitation of an offer to buy, any
tobacco products. The Company’s products
are sold only in compliance with the laws of
the particular jurisdictions in which they are
sold.
Imperial Brands Investor Day | June 2016

3 |
Quality, Agility, Discipline
Sustainability
Driving revenue, margins, cash and dividend growth
Quality Agility Discipline
Brand, product and
market choices
Simplification and
continuous
improvement
Resource, cost
and cash
optimisation
Imperial Brands Investor Day | June 2016
Consistent themes
4 |
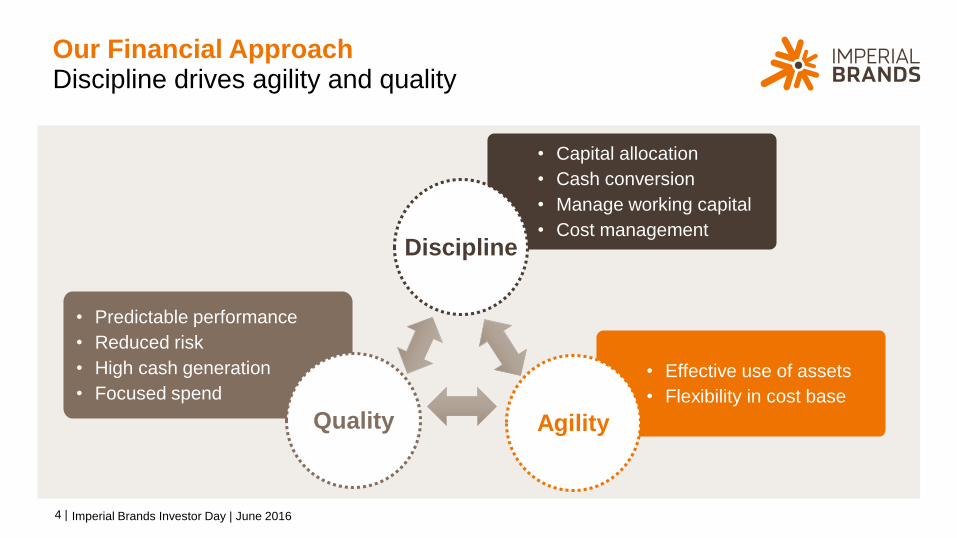
Our Financial Approach
Imperial Brands Investor Day | June 2016
Discipline drives agility and quality
• Capital allocation
• Cash conversion
• Manage working capital
• Cost management
• Effective use of assets
• Flexibility in cost base
• Predictable performance
• Reduced risk
• High cash generation
• Focused spend
Discipline
Quality Agility

5 |
Cash flow from
operations
Dividend growth of
at least 10% pa
Reduction of net debt
Investment in strongest
brands and key markets
Uses of CashSources of Cash
Clearly
defined
prioritiesWorking capital
efficiency
Effective asset
management
Capital Allocation
Imperial Brands Investor Day | June 2016
Focused use of cash

6 |
Average2011-13
2013 2014 2015 HY16 Target
82%
86%
91%
97%
105%
95%
Cash Conversion
• Key KPI
• ‘Incremental’ £850m cash
FY13–FY15 versus
previous average
Imperial Brands Investor Day | June 2016
Consistent improvement
7 |
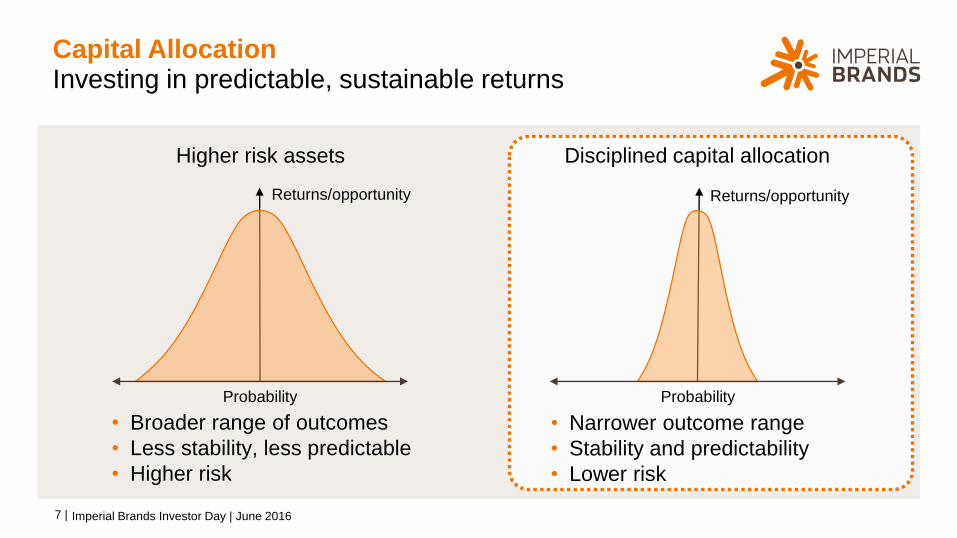
Capital Allocation
Higher risk assets
Imperial Brands Investor Day | June 2016
Investing in predictable, sustainable returns
Disciplined capital allocation
Returns/opportunity
Probability Probability
Returns/opportunity
• Narrower outcome range
• Stability and predictability
• Lower risk
• Broader range of outcomes
• Less stability, less predictable
• Higher risk

8 |
Net Debt
Imperial Brands Investor Day | June 2016
Capital discipline supports de-leverage
£2.1bn reduction
in like-for-like
debt since FY13
Closing adj.net debt
FY13
Like-for-likereduction
Closing adj.net debt
FY14
Like-for-likereduction
Adj. net debtpre-acquisition
cost
USAacquisition
cost
Closing adj.net debt
FY15
£9.1bn £8.1bn £7.0bn £11.6bn
£1.0bn£1.1bn
£4.6bn
9 |
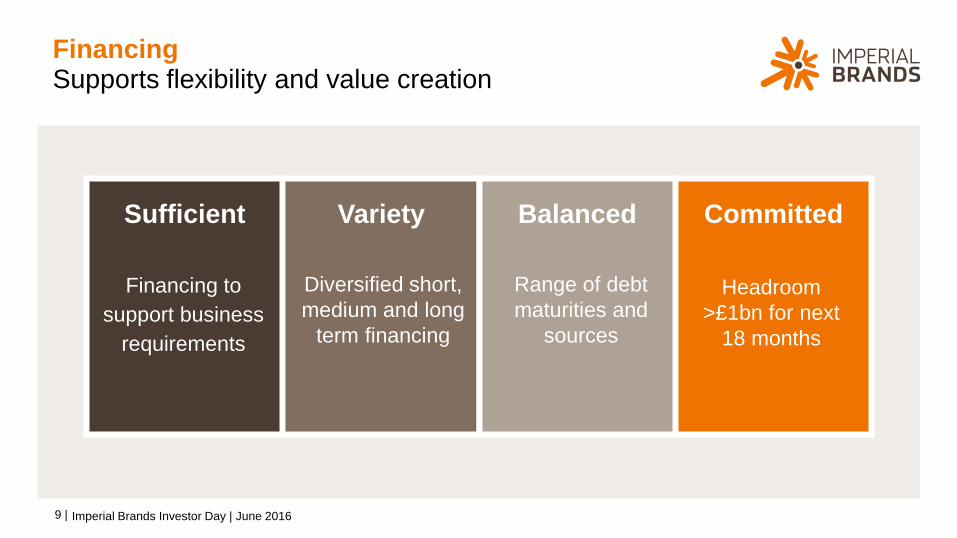
Financing
Imperial Brands Investor Day | June 2016
Supports flexibility and value creation
Sufficient Variety Balanced Committed
Financing to
support business
requirements
Diversified short,
medium and long
term financing
Range of debt
maturities and
sources
Headroom
>£1bn for next
18 months

10 |
Financing Structure
• Maturity spread to manage refinancing risk and cash profile
• No financing requirement over the next 18 months
• ECP has diversified short term financing reducing reliance on bank debt
Imperial Brands Investor Day | June 2016
Matched to the needs of the business
68%
32%
0
500
1,000
1,500
2,000
2,500
3,000
2016 2017 2018 2019 2020 2021 2022 2023 2024 2025 2026 2027 2028 2029 2030 2031 2032
£m
Bond issues Bank debt
Interest split
Fixed
≈
2032
c.£2.0bn
ECP
Bank c.£4.5bn
c.£11.1bnBond
Diversified funding sources
Bank debt £1bn term loan & £3.5bn RCF (undrawn) Floating

11 |
Credit Ratings
• Committed to investment grade
status
• ‘Efficient’ rating with stable outlooks
• A- (S&P, Fitch) and A3 (Moody’s)
generate only c.30bps benefit in
finance costs
• Recent Moody’s outlook stabilised
Imperial Brands Investor Day | June 2016
Stable grading with all agencies
Non investment
grade
Non investment
grade
Non investment
grade
Stable Outlook
A+
A
A-
BBB+
BBB
BBB-
Stable Outlook
S&P Fitch Moody’s
A1
A2
A3
Baa1
Baa2
Baa3 Stable Outlook

12 |
Managing Working Capital
Imperial Brands Investor Day | June 2016
Supports better cash generation
Stock CreditorsDebtors
FY14 FY15
• Supplier days on renegotiated
‘indirects’ improved by c.50%
• 10% reduction in debtor days
over past 2 years
FY13 FY15FY13 FY15
• 22% reduction in leaf stock
versus 10% volume decline

13 |
Managing Costs
Imperial Brands Investor Day | June 2016
Significant annual savings
• Changes ensure more efficient cost base
• Delivering £300m annual savings
FY13: £30m
£300m
FY14: £60m
FY15: £85m
£55m
£70m
To date FY16 To go By FY18
Manufacturing & supply chain
Sales & Marketing
Global procurement
Back office
Other
• Savings across all parts of business
• Reduced product cost, operating cost &
overheads

14 |
Shared Services
Imperial Brands Investor Day | June 2016
Simplify process, increase focus, better performance
• Leverage scale to harmonise process
• Increased cost base flexibility
• More effective service culture & customer focus
• Performance focus and continuous improvement
• Rolling out shared services for finance, HR and IS
• Centres in Poland, Philippines, Hungary & Czech Republic
15 |
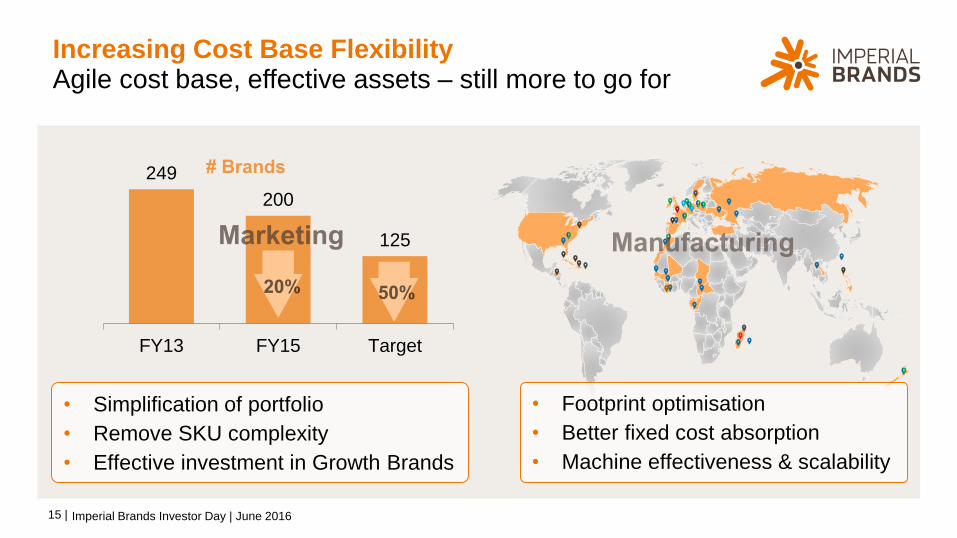
Increasing Cost Base Flexibility
Imperial Brands Investor Day | June 2016
Agile cost base, effective assets – still more to go for
• Footprint optimisation
• Better fixed cost absorption
• Machine effectiveness & scalability
249
200
125
FY13 FY15 Target
• Simplification of portfolio
• Remove SKU complexity
• Effective investment in Growth Brands

16 |
Global Procurement
• Launched 2½ years ago for ‘indirect’ spend
• Leverages economies of scale via multi-
country sourcing
• Rightsizing supplier base
• Introduced e-procurement tools
Imperial Brands Investor Day | June 2016
Lower risk, lower cost, better performance
Contract
Management
Strategic
Sourcing
Procurement
Process
Optimisation
Value

17 |
FY11 FY12 FY13 FY14 FY15 FY16
24.3%
21.6%
20.5%
Taxation
• Strong track record
• Enhances earnings
• Creates value for shareholders
Imperial Brands Investor Day | June 2016
Efficient management creates value
23.0%
21.1%
20.0%
*
* As per HY16 results guidance
Adjusted Group tax rate

18 |
What this means for
investors
Imperial brands investor day | june 2016
19 |
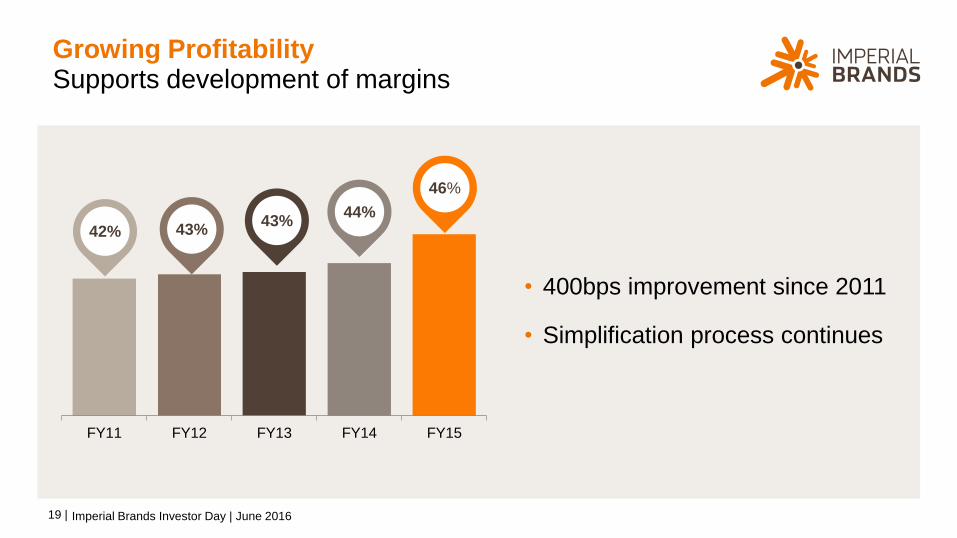
FY11 FY12 FY13 FY14 FY15
42%43%
46%
Growing Profitability
• 400bps improvement since 2011
• Simplification process continues
Imperial Brands Investor Day | June 2016
Supports development of margins
43%44%

20 |
Growing Cash Conversion
Imperial Brands Investor Day | June 2016
Strong cash performance
100% 100%97% 97%
94% 93% 92%89%
Imp
eria
l
PM
I
AB
I InB
ev
Re
ckitt
SA
B
Dia
ge
o
Un
ilever
BA
T
He
ineke
n
107%Cash conversion FY15*
* Based on FY15 disclosures for all companies. Percentage calculated on consistent basis across peers - equals net cash from operations pre tax and finance costs post capex, divided by
adjusted operating profit. Imperial percentage 107% adjusted for consistency (excludes restructuring cash costs & pension funding shortfall). FY15 disclosed cash conversion 97%

21 |
63
73
84
95
105
116
128
141
2008 2009 2010 2011 2012 2013 2014 2015
Dividend pence per share
Growing Dividend
• 8th year of >10% growth
• 12% CAGR since 2008
• £8bn in declared dividends
Consistent growth over time – up more than 120%
Imperial Brands Investor Day | June 2016

22 |
Growing DividendGrowing ahead of peers and FTSE
10%9%
8% 7% 7%
6%
5%4%
1%
4%
ImperialBrands
Diageo PMI SAB Altria RAI BAT Unilever Reckitt FTSE
Dividend growth over past 4 years
% growth is CAGR over last 4 years of dividends up to FY15. FTSE
total dividend payments 2015 £62.7bn versus £55.2bn in 2012.Imperial Brands Investor Day | June 2016
23 |
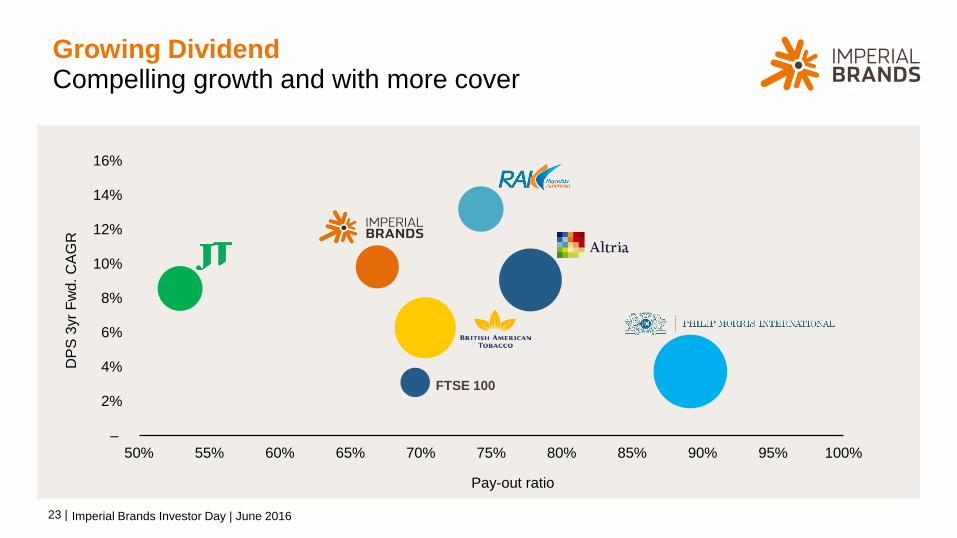
Growing DividendCompelling growth and with more cover
–
2%
4%
6%
8%
10%
12%
14%
16%
50% 55% 60% 65% 70% 75% 80% 85% 90% 95% 100%
FTSE 100
Pay-out ratio
DP
S 3
yr
Fw
d.
CA
GR
Imperial Brands Investor Day | June 2016

24 |
Our Financial ApproachQuality growth, sustainable returns
Efficiencies drive effectiveness and support
investment
Capital discipline supports consistent cash
generation
Investment improves quality of growth
Stronger balance sheet supports deleveraging
and dividend
Imperial Brands Investor Day | June 2016