
OLIVE OIL RESIDUE TREATMENT PLANTS HASBAIYA MUNICIPALITIES CAZA OF
232
ENVIRONMENTAL I MPACT ASSESSMENT OLIVE OIL RESIDUE TREATMENT PLANTS HASBAIYA MUNICIPALITIES CAZA OF HASBAIYA Prepared by EARTH LINK AND ADVANCED RESOURCES DEVELOPMENT (ELARD) Submitted to: MERCY CORPS INTERNATIONAL (MCI) September 2004
Transcript of OLIVE OIL RESIDUE TREATMENT PLANTS HASBAIYA MUNICIPALITIES CAZA OF

ENVIRONMENTAL IMPACT ASSESSMENT
OLIVE OIL RESIDUE TREATMENT PLANTS HASBAIYA MUNICIPALITIES
CAZA OF HASBAIYA
Prepared by
EARTH LINK AND ADVANCED RESOURCES DEVELOPMENT (ELARD)
Submitted to:
MERCY CORPS INTERNATIONAL (MCI)
September 2004

Environmental Impact Assessment ELARD
Olive Oil Residue Treatment Plant – Caza of Hasbaiya ii
TABLE OF CONTENTS
TABLE OF CONTENTS ........................................................................................................ II
LIST OF TABLES ...............................................................................................................VIII
LIST OF FIGURES ................................................................................................................XI
LIST OF FIGURES ................................................................................................................XI
LIST OF PHOTOGRAPHS ..................................................................................................XII
LIST OF PHOTOGRAPHS ..................................................................................................XII
LIST OF ABBREVIATIONS .............................................................................................XIII
LIST OF ABBREVIATIONS .............................................................................................XIII
NON-TECHNICAL SUMMARY....................................................................................... XVI
INTRODUCTION ...................................................................................................................... XVI
LEGAL AND INSTITUTIONAL FRAMEWORKS ........................................................................... XVI
PUBLIC INVOLVEMENT........................................................................................................... XVI
DESCRIPTION OF THE PROJECT .............................................................................................. XVII
DESCRIPTION OF THE ENVIRONMENT .....................................................................................XIX
IMPACT ASSESSMENT .............................................................................................................XX
ENVIRONMENTAL MANAGEMENT PLAN .................................................................................XX
1. INTRODUCTION............................................................................................................ 1
1.1. THE OVERALL CONTEXT ................................................................................................ 1
1.2. BACKGROUND AND RATIONALE ..................................................................................... 1
1.3. THE PROJECT .................................................................................................................. 5
1.4. THE PROJECT LOCATION................................................................................................. 6
1.5. THE STUDY AND THE EIA REPORT ................................................................................. 8

Environmental Impact Assessment ELARD
Olive Oil Residue Treatment Plant – Caza of Hasbaiya iii
2. LEGISLATIVE AND INSTITUTIONAL FRAMEWORKS ...................................... 9
2.1. LEGISLATIVE FRAMEWORK............................................................................................. 9
2.2. INSTITUTIONAL FRAMEWORK ....................................................................................... 13
3. BACKGROUND INFORMATION ............................................................................. 14
3.1. PROJECTS INITIATION ................................................................................................... 14
3.2. IMPORTANCE OF THE PROJECT ...................................................................................... 14
3.3. OBJECTIVES OF THE PROJECT ........................................................................................ 15
3.4. THE EXECUTING OFFICE............................................................................................... 16
4. OLIVE MILL WASTE GENERATION AND MANAGEMENT ............................ 17
4.1. OLIVE OIL SECTOR ....................................................................................................... 17
4.1.1 Olive Oil Production .............................................................................................. 17
4.1.2 Olive Oil Sector Productivity................................................................................. 19
4.1.3 Olive Tree Density ................................................................................................. 19
4.2. OLIVE MILLS ................................................................................................................ 20
4.2.1 General Description of Olive oil Extraction Processes......................................... 20
4.2.1.1 Reception.....................................................................................................................................................20 4.2.1.2 Milling and Extraction ..............................................................................................................................21
4.2.2 Types of Olive Mills ............................................................................................... 21
4.2.2.1 Traditional...................................................................................................................................................21 4.2.2.2 Continuous Three-phase System.............................................................................................................22 4.2.2.3 Continuous Two-phase System...............................................................................................................22 4.2.2.4 Comparison of Olive Mill Extraction Systems .....................................................................................23
4.3. OLIVE MILL RESIDUAL WASTE .................................................................................... 24
4.3.1 Kinds of By-Products ............................................................................................. 24
4.3.1.1 Olive Cake ...................................................................................................................................................24 4.3.1.2 Olive Pulp....................................................................................................................................................24 4.3.1.3 Vegetable Water.........................................................................................................................................24 4.3.1.4 Leaves ..........................................................................................................................................................24
4.3.2 Residual Waste Characteristics ............................................................................. 25 4.3.2.1 Olive Mill Wastewater or Vegetable Water..........................................................................................25 4.3.2.2 Spent Olives or Olive Pomace.................................................................................................................27
4.3.3 Treatment Methods ................................................................................................ 29
4.3.3.1 Olive Mill Wastewater..............................................................................................................................29 4.3.3.2 Spent Olive Pomace ..................................................................................................................................31

Environmental Impact Assessment ELARD
Olive Oil Residue Treatment Plant – Caza of Hasbaiya iv
5. DESCRIPTION OF THE PROJECT .......................................................................... 33
5.1. DESCRIPTION OF THE INFLUENT WASTEWATER ............................................................ 33
5.2. GENERAL DESCRIPTION OF THE PLANT......................................................................... 35
5.3. PROCESS THEORY......................................................................................................... 36
5.3.1 Anaerobic Biological Treatment Processes........................................................... 38 5.3.1.1 Anaerobic Reactor Types .........................................................................................................................39 5.3.1.2 High Rate Suspended Growth Anaerobic Reactors .............................................................................40
5.3.2 Aerobic Biological Treatment Processes............................................................... 42 5.3.2.1 Aerobic Reactor Types .............................................................................................................................43 5.3.2.2 Activated Sludge (Suspended Growth) Aerobic Reactors..................................................................45
5.4. ANALYSIS OF ALTERNATIVES ....................................................................................... 46
5.4.1 Process Selection ................................................................................................... 46
5.4.2 Site Selection .......................................................................................................... 55
5.4.3 Regional Treatment Plant ...................................................................................... 56
5.5. DETAILED PROCESS DESCRIPTION ................................................................................ 56
5.6. EFFLUENTS CHARACTERIZATION AND MANAGEMENT.................................................. 59
5.6.1 Liquid Effluent........................................................................................................ 59
5.6.1.1 Liquid Effluent Characteristics................................................................................................................59 5.6.1.2 Liquid Effluent Management...................................................................................................................59
5.6.2 Sludge Effluent ....................................................................................................... 60
5.6.2.1 Sludge Characteristics...............................................................................................................................60 5.6.2.2 Sludge Management..................................................................................................................................62
5.6.3 Biogas Production.................................................................................................. 63
5.6.3.1 Biogas Characteristics...............................................................................................................................63 5.6.3.2 Biogas Management..................................................................................................................................63
5.6.4 Miscellaneous Wastes ............................................................................................ 64
5.7. PLANT CONSTRUCTION ................................................................................................. 64
6. DESCRIPTION OF THE ENVIRONMENT.............................................................. 67
6.1. GENERAL SETTING........................................................................................................ 67
6.2. METEOROLOGICAL SETTING......................................................................................... 70
6.2.1 Precipitation........................................................................................................... 71
6.2.2 Temperatures ......................................................................................................... 72
Environmental Impact Assessment ELARD
Olive Oil Residue Treatment Plant – Caza of Hasbaiya v
6.2.3 Winds...................................................................................................................... 74
6.3. SITE SETTING................................................................................................................ 75
6.3.1 Ain Jarfa Site.......................................................................................................... 75
6.3.2 Ain Qenia Site ........................................................................................................ 76
6.3.3 Kaoukaba Site........................................................................................................ 77
6.3.4 Kfeir and Khalouat Site ......................................................................................... 78
6.3.5 Mimes Site.............................................................................................................. 80
6.3.6 Rachaiya el Foukhar Site....................................................................................... 80
6.4. TECTONIC SETTING AND SEISMICITY............................................................................ 82
6.5. GEOLOGICAL SETTING.................................................................................................. 82
6.5.1 Stratigraphy ........................................................................................................... 83 6.5.1.1 Jurassic Formations...................................................................................................................................83 6.5.1.2 Cretaceous Formations..............................................................................................................................84 6.5.1.3 Tertiary Formations...................................................................................................................................85 6.5.1.4 Quaternary Deposits..................................................................................................................................86
6.5.2 Structure................................................................................................................. 86
6.5.3 Hydrogeological Setting ........................................................................................ 87
6.5.3.1 Aquifers .......................................................................................................................................................87 6.5.3.2 Aquicludes ..................................................................................................................................................89 6.5.3.3 Well Survey ................................................................................................................................................90 6.5.3.4 Springs Survey ...........................................................................................................................................90
6.5.4 Hydrological Setting .............................................................................................. 94
6.6. WATER QUALITY.......................................................................................................... 95
6.6.1 Spring Analysis ...................................................................................................... 95
6.6.2 Hasbani River Analysis .......................................................................................... 96
6.7. ECOLOGICAL CONTEXT (BIODIVERSITY) ...................................................................... 97
6.8. INFRASTRUCTURE STATUS............................................................................................ 99
6.9. SOCIO-ECONOMIC STATUS ......................................................................................... 100
7. IMPACT IDENTIFICATION AND ANALYSIS ..................................................... 102
7.1. IMPACTS ON WATER RESOURCES ............................................................................... 102
7.1.1 Impacts during Construction ............................................................................... 102
7.1.2 Impacts during Operation .................................................................................... 104

Environmental Impact Assessment ELARD
Olive Oil Residue Treatment Plant – Caza of Hasbaiya vi
7.2. IMPACTS ON SOIL........................................................................................................ 105
7.2.1 Impacts during Construction ............................................................................... 105
7.2.2 Impacts during Operation .................................................................................... 105
7.3. IMPACTS ON HUMAN AMENITY................................................................................... 105
7.3.1 Impacts during Construction ............................................................................... 106
7.3.2 Impacts during Operation .................................................................................... 106
7.4. IMPACTS ON PUBLIC AND OCCUPATIONAL SAFETY..................................................... 106
7.4.1 Impacts during Construction ............................................................................... 106
7.4.2 Impacts during Operation .................................................................................... 107
7.5. IMPACTS ON BIODIVERSITY ........................................................................................ 107
7.5.1 Impacts during Construction ............................................................................... 107
7.5.2 Impacts during Operation .................................................................................... 108
7.6. IMPACTS ON HUMAN HEALTH AND SANITATION ........................................................ 108
7.7. SOCIOECONOMIC IMPACTS.......................................................................................... 109
7.8. IMPACTS ON ARCHAEOLOGICAL, TOURISTIC AND CULTURAL SITES ........................... 109
8. ENVIRONMENTAL MANAGEMENT PLAN ........................................................ 110
8.1. OBJECTIVES OF THE ENVIRONMENTAL MANAGEMENT PLAN...................................... 110
8.2. MITIGATION MEASURES ............................................................................................. 110
8.2.1 Defining Mitigation.............................................................................................. 110
8.2.2 Mitigating Adverse Project Impacts.................................................................... 110 8.2.2.1 Mitigating Degradation of Receiving Water Quality ........................................................................111 8.2.2.2 Mitigating Dust Emissions.....................................................................................................................112 8.2.2.3 Mitigating Noise Pollution.....................................................................................................................113 8.2.2.4 Mitigating Obnoxious Odors .................................................................................................................113 8.2.2.5 Mitigating Aerosol Emissions...............................................................................................................115 8.2.2.6 Mitigating Impact on Biodiversity........................................................................................................115 8.2.2.7 Mitigating Impacts from Residual Storage, Handling, Transport, and Reuse/Disposal..............117 8.2.2.8 Mitigating Adverse Aesthetic Impacts .................................................................................................119 8.2.2.9 Mitigating Public and Occupational Health Hazards ........................................................................119
8.3. MONITORING PLAN..................................................................................................... 125
8.3.1 Compliance Monitoring ....................................................................................... 125
8.3.2 Impact Detection Monitoring............................................................................... 132

Environmental Impact Assessment ELARD
Olive Oil Residue Treatment Plant – Caza of Hasbaiya vii
8.4. RECORD KEEPING AND REPORTING ............................................................................ 134
8.5. COST OF ENVIRONMENTAL MANAGEMENT PLAN ....................................................... 134
8.6. CONTINGENCY PLAN .................................................................................................. 136
8.7. EMERGENCY RESPONSE PLAN .................................................................................... 137
8.8. CAPACITY BUILDING .................................................................................................. 138
8.9. INSTITUTIONAL ARRANGEMENTS................................................................................ 138
9. PUBLIC INVOLVEMENT AND PARTICIPATION.............................................. 140
10. REFERENCES............................................................................................................. 141
APPENDIX A TECTONIC MAP OF LEBANON; GEOLOGICAL MAP OF STUDY
AREA; CROSS SECTION.......................................................................................... 144
APPENDIX B TOPOGRAPHIC MAP INDICATING SAMPLING LOCATIONS;
LABORATORY ANALYTICAL RESULTS – SPRINGS WATER –HASBAIYA
RIVER........................................................................................................................... 145
APPENDIX C ARCHITECTURAL DRAWINGS ............................................................ 146
APPENDIX D PLANTS SITE LOCATION ON PARCEL MAP.................................... 147
APPENDIX E SLUDGE AND EFFLUENT MANAGEMENT........................................ 148
APPENDIX F WASTEWATER TREATMENT AND USE IN AGRICULTURE - FAO
IRRIGATION AND DRAINAGE PAPER 47. (SECTION 5) ................................ 164
APPENDIX G EMP COMPLIANCE FORMS AND OFFICIAL NOTICES ................ 203
APPENDIX H COST OF THE PROPOSED MONITORING PLAN............................. 204
Environmental Impact Assessment ELARD
Olive Oil Residue Treatment Plant – Caza of Hasbaiya viii
LIST OF TABLES
TABLE PAGE
?1.1. Property Location, Available Acreage and Land Ownership of the Proposed OORTPs in Hasbaya ....................................................................................................................................... 7
?2.1. Categories of Legislation in Lebanon............................................................................... 10
?2.2. Summary of Selected Legislation Related to Wastewater Management .......................... 11
?2.3. Code of Environment and EIA Decree ............................................................................. 12
?2.4. Selected Standards for Discharge into Surface Waters..................................................... 12
?2.5. Responsibilities and Authorities of Key Institutions in Lebanon..................................... 13
?4.1. Production, Imports and Exports of Olive Oil of the non-EU Countries of the Mediterranean Basin (1998-1999) (RAC/CP) .......................................................................... 18
?4.2. Olive Production Estimates in Lebanon ........................................................................... 18
?4.3. Number of Olive Mills and Olive Oil Production in Some Mediterranean Basin Countries (RAC/CP).................................................................................................................................. 19
?4.4. Density of Olive Oil Producing Trees in Some Mediterranean Countries (FAO 1983, FAO 1997, Abdel Sattar 1969) ................................................................................................. 20
?4.5. Oil Mill Distribution in Lebanon according to Mohafaza (FAO Moln 1999) .................. 20
?4.6. Input-Output Analysis of Material and Energy in the Three Extraction Systems for Production of Olive Oil............................................................................................................. 23
?4.7. Characteristics of Vegetable Water or Olive Mill Wastewater (RAC/CP, 2000)............. 26
?4.8. Spent Olives/Pomace Characteristics in a Continuous Mill (Paredes et al. 1999; MoE 2002) ......................................................................................................................................... 27
?4.9. Major Characteristics of Olive Mill Wastewater (MoE, 2002) ........................................ 28
?5.1. Contribution from Villages Mills to the Total Inflow of Raw Olive Mill Wastewater to each OORTP ............................................................................................................................. 33
?5.2. Characterization of Domestic Raw Wastewater ............................................................... 34
?5.3. Olive Mill Wastewater Characterization (MoE, 2002) ..................................................... 35
?5.4. Consistency of Measured and Reported Values of OMW Chemical Composition (MoE, 2002) ......................................................................................................................................... 35
?5.5. Description of Vegetable Water Treatment Stages........................................................... 37
?5.6. Inhibition Concentrations of Various Ions........................................................................ 39

Environmental Impact Assessment ELARD
Olive Oil Residue Treatment Plant – Caza of Hasbaiya ix
?5.7. Summary of Anaerobic Reactor Types ............................................................................. 40
?5.8. Comparison of Aerobic Suspended Growth and Attached Growth Reactors ................... 44
?5.9. Comparison of the Waste Products of Aerobic Reactors.................................................. 44
?5.10. Analysis of Different Scenarios of Olive Oil Residue Treatment Schemes ................... 47
?5.11. Analysis of the Waste Products of Different Olive Oil Residue Treatment Schemes .... 48
?5.12. Comparison of Anaerobic, Aerobic and Combined Anaerobic-Aerobic Biodegradation of Olive Mill Wastewater.......................................................................................................... 51
?5.13. Alternative Selection for the Six Olive Oil Residue Treatment Plants in Hasbaya ........ 54
?5.14 Summary of the Liquid Effluent Management Practices for the Six OORTPs in the Hasbaya Caza ............................................................................................................................ 61
?5.15. Typical Ranges for Chemical Composition of Activated Sludge ................................... 62
?5.16. Typical Metal Content in Wastewater Sludge ................................................................ 62
?5.17. Hasbaya Olive Oil Residue Treatment Plants’ Construction Details and Characteristics................................................................................................................................................... 66
?6.1. Characteristics of Surveyed Wells .................................................................................... 91
?6.2. Results of surveyed springs .............................................................................................. 93
?6.3. Laboratory Analytical Results of Springs in Hasbaya Villages (Samples Collected on 04/05/2004) ............................................................................................................................... 96
?6.4. Laboratory Analytical Results of three samples collected from random locations over the Hasbani River (Results as population count per 100 ml) ........................................................ 97
?6.5. Chemical Grading for Rivers and Canals. (Thames river-Standards 2000) .................... 97
?6.6. Socio-Economic Information (as given by Municipalities) ............................................ 101
?7.1. Impact Identification Matrix ........................................................................................... 103
?7.2. Potential Negative Impacts on Biodiversity ................................................................... 108
?8.1. Suggested minimum buffer distances from treatment units ........................................... 114
?8.2. Additional Mitigation of Impacts on Biodiversity Specific to the Location .................. 116
?8.3. Mitigation Measures, Monitoring, and Estimated Costs for Actions Affecting Environmental Resources and Human Amenity..................................................................... 121
?8.4. Process Control Parameters for the UASB-EAAS System............................................. 127
?8.5. Process Performance Parameters for the Combined UASB-EAAS System................... 129

Environmental Impact Assessment ELARD
Olive Oil Residue Treatment Plant – Caza of Hasbaiya x
?8.6. Process Performance Parameters Suggested in a Draft Decision set by the MoE.......... 130
?8.7. Sludge Quality Monitoring Parameters .......................................................................... 132
?8.8. Monthly Monitoring Cost for Process Performance Parameters per Plant ..................... 135

Environmental Impact Assessment ELARD
Olive Oil Residue Treatment Plant – Caza of Hasbaiya xi
LIST OF FIGURES
FIGURE PAGE
?1.1. Constraints Hindering Infrastructure Development in Rural Communities in Lebanon.... 5
?5.1. Schematic Diagram of a UASB Reactor........................................................................... 41
?5.2. Schematic Diagram of an ACR......................................................................................... 42
?5.3. Comparison between Aerobic and Anaerobic Biological Treatment (Journey, W.K.) .... 43
?5.4. Flow Diagram for the Complete-Mix Activated Sludge Process ..................................... 46
?5.5. Flow Diagram of UASB/EAAS Treatment Plant with Tertiary Treatment...................... 58
?6.1. Topographic Map of Lebanon........................................................................................... 67
?6.2. Distribution of Target Municipalities and Villages in Hasbaya ....................................... 68
?6.3. Detailed topographic map showing the road network connecting the different villages of the area ...................................................................................................................................... 69
?6.4. Land Use Map of Hasbaiya Region (MoE, January 2004)............................................... 70
?6.5. Pluviometric Map of the Hasbaiya Area and Surroundings (scale 1: 200 000) (Service Météorologique du Liban, 1977) .............................................................................................. 72
?6.6. Precipitation Data from AUB (34 m), Hasbaiya (770 m) and Marjayoun (760 m) Stations (Elevations are from mean sea level). ....................................................................................... 72
?6.7. Average Monthly Temperature Data from AUB (34 m), Rachaiya ( 1235 m) and Marjayoun (760 m) Stations (Elevations are from mean sea level).......................................... 73
?6.8. Average Monthly Frequency Data of Wind Speed Ranges 2-5, 6-10, 11-15, and above 16 m /s at Marjayoun Station (1956-1968) (Elevation from mean sea level is 760m). ................. 74
?6.9. Wind Direction for Marjayoun Station (Service Météorologique du Liban, 1977) ......... 75
?6.10. Hydrograph of Hasbani Spring (1945 –1969) ................................................................ 95
?8.1. Proposed Institutional Setting ......................................................................................... 139

Environmental Impact Assessment ELARD
Olive Oil Residue Treatment Plant – Caza of Hasbaiya xii
LIST OF PHOTOGRAPHS
PHOTOGRAPH PAGE
?3.1. Discharge of Wastewater in Winter Channels .................................................................. 15
?6.1. General View of the Proposed Site for the OORTP Site Located Towards the Southern Outskirts of the Village of Ain Jarfa ......................................................................................... 76
?6.2. General View the Proposed Site for the OORTP in Ain Qenia ........................................ 77
?6.3. General View the Proposed Site for the OORTP site Located Towards the Southern Outskirts of the Village of Kaoukaba ....................................................................................... 78
?6.4. Perennial River (Hasbani River)on the Southern Edge of the Kaoukaba Site.................. 78
?6.5. View of Main Road Leading to the Proposed Site in Kfeir .............................................. 79
?6.6. General View Surrounding the OORTP in Kfeir.............................................................. 79
?6.7. View of Agricultural Road Leading to the Proposed Site in Mimes ................................ 80
?6.8. Overview of the Rachaiya el Foukhar OORTP Site ......................................................... 81
?6.9. General View of the Proposed OORTP Site in Rachaiya el Foukhar............................... 81
?6.10. Intermittent Stream on the Edge of the Rachaiya el Foukhar OORTP Site.................... 82
?6.11. Haddatha spring in Mimes Village ................................................................................. 91
?6.12. Ain Kaoukaba in Kaoukaba village ................................................................................ 92
?6.13. Pine Tree and Shrub Community around the Site in Ain Qenia ..................................... 98
?6.14. Quercus spp. Community Around the Site in Mimes ..................................................... 99
?6.15. Spartium spp. at the Edge of the Kaoukaba Site............................................................. 99

Environmental Impact Assessment ELARD
Olive Oil Residue Treatment Plant – Caza of Hasbaiya xiii
LIST OF ABBREVIATIONS
ELARD Earth Link and Advanced Resources Development
ACDI Agricultural Cooperatives Development International
As Arsenic
AUB American University of Beirut
BIA Beirut International Airport
BOD5 5-day Biochemical Oxygen Demand
C Composite Sample
C3 Hammana Formation
C2b Mdairej Formation
C4 Sannine Formation
Cd Cadmium
CDR Council for Development and Reconstruction
Co Cobalt
COD Chemical Oxygen Demand
Cr Chromium
Cu Copper
DMR Discharge Monitoring Report
E East
EAAS Extended Aeration Activated Sludge
EIA Environmental Impact Assessment
ELV Environmental Limit Values
EMP Environmental Management Plan
ES Environmental Statement
Fe Iron
G Grab Sample
GAS General Awareness Seminar
GBA Greater Beirut Area
GDP Gross Domestic Product
Hg Mercury
HL Hydraulic Loading
ISWMP Integrated Solid Waste Management Plan
M Monthly
MCI Mercy Corps International

Environmental Impact Assessment ELARD
Olive Oil Residue Treatment Plant – Caza of Hasbaiya xiv
METAP Mediterranean Environmental Technical Assistance Program
MLSS Mixed Liquor Suspended Solids
MLVSS Mixed Liquor Volatile Suspended Solids
Mn Manganese
Mo Molybdenum
MoA Ministry of Agriculture
MoE Ministry of Environment
MoIM Ministry of Interior and Municipalities
MoI Ministry of Industry
MoPH Ministry of Public Health
MoPWT Ministry of Public Works and Transport
MSW Municipal Solid Waste
NGO Non-Governmental Organization
NWMP National Wastewater Management Plan
NH3 Ammonia
Ni Nickel
NNE North Northeast
OORTP Olive Oil Residue Treatment Plant
ON Organic Nitrogen
Pb Lead
PC Process Control
PCB Polychlorinated Biphenyls
PP Process Performance
Se Selenium
Sn Tin
SLWWE South Lebanon Water and Wastewater Establishment
SOP Standard Operating Protocol
SPASI Strengthening the Permitting and Auditing System for Industries
SRI Stanford Research Institute
SRT Solids Retention Time
SSW South Southwest
STW Specialized Training Workshop
SWEMP Solid Waste Environmental Management Plan
SWTP Solid Waste Treatment Plant
TSS Total Suspended Solids
UNDP United Nations Development Program

Environmental Impact Assessment ELARD
Olive Oil Residue Treatment Plant – Caza of Hasbaiya xv
UPP Unit of Planning and Programming
VOCA Volunteers in Overseas Cooperative Assistance (VOCA)
VSS Volatile Suspended Solids
W West
WB World Bank
WWTP Waste Water Treatment Plant
Zn Zinc 0 C Degrees centigrade
cm Centimeter
hr Hour
km Kilometer
m Meter
m3 Cubic meters
m3/day Cubic meters per day
m3/s Cubic meter per second
mg/L Milligrams per liter
mL Milliliter
mm/year millimeters per year
ppm Parts per million

Environmental Impact Assessment ELARD
Olive Oil Residue Treatment Plant – Caza of Hasbaiya xvi
NON-TECHNICAL SUMMARY
INTRODUCTION
This Environmental Impact Assessment (EIA) has been prepared to address the potential
environmental impacts that could arise from the construction and operation of six Olive Oil
Residue Treatment Plants (OORTPs). The intended plants will be located in and will serve the
inhabitants of the villages of Ain Jarfa, Ain Qenia, Kaoukaba, Kfeir and Khalouat, Mimes and
Rachaiya el Foukhar. All villages are located in the Caza of Hasbaiya, South Lebanon. While
the EIA evaluates primarily the individual impacts from each plant focusing on alternative
sites and technologies, some efforts were made to assess the overall impacts of the program in
a more strategic fashion.
The purpose of the project is to alleviate the severe impacts of uncontrolled olive oil
wastewater discharges into the environment. Proper design/selection, construction, and
management of the olive oil residue treatment plants would mitigate such negative impacts.
The main sections of the EIA include definition of the legal and institutional frameworks,
description of olive mill residual waste generation and management, description of the project
and the environment, impacts assessment, and presentation of an environmental management
plan (EMP).
LEGAL AND INSTITUTIONAL FRAMEWORKS
In the legal framework, the draft EIA decree has been revised by the Unit of Planning
and Programming (UPP) at the Ministry of Environment (MoE), and is awaiting for legislative
approval. This draft decree sets the procedures and guidelines for the proponent of every
proposed project that could have significant impacts on the environment, to prepare its own
EIA or Environmental Statement (ES). The MoE is the main institution responsible for the
revision and approval of the EIA. Institutionally, the project mainly involves the
municipalities of each village (except for Ain Jarfa where a community-based committee is in
charge of the plant), the Ministry of Interior and Municipalities (MoIM) and the MoE, in
addition to MCI.
PUBLIC INVOLVEMENT
The project is the foremost issue being requested by the concerned municipalities.
During this study, the consultant and MCI, working hand in hand, met frequently with

Environmental Impact Assessment ELARD
Olive Oil Residue Treatment Plant – Caza of Hasbaiya xvii
representatives of the municipalities and with technology providers. In compliance with EIA
guidelines, a notice was posted at the concerned Municipality offices in early May 2004
informing the public of the EIA study, the proposed olive oil residue treatment plants, and
soliciting comments. The period of 18 days during which the notice was publicized and the 7
days following its removal was dedicated to answering remarks and offering clarifications for
all interested parties.
DESCRIPTION OF THE PROJECT
Currently, untreated olive mill liquid and solid residue generated within the area of
Hasbaiya is directly being disposed of in the environment, usually into streams and other
water bodies or directly onto soil. This situation is exposing the public to the associated
negative health impacts and is possibly leading to the deterioration of water and soil quality in
the area. Proper conveyance and treatment of olive oil residue is of utmost importance to
avoid such impacts, and will be addressed by the construction of six Olive Oil Residue
Treatment Plants (OORTPs) to serve this area. It is essential to note that potable water is
being contaminated by the ingress of vegetable water or liquid residue from olive mills as well
as domestic sewage into the potable water springs and rivers distributed down gradient to the
villages. Vegetable water is being discharged directly into run-off ditches and storm water
galleries. The evaluated wastewater treatment plants for the Hasbaiya region typically employ
modified secondary biological wastewater treatment schemes. Geological and hydro-
geological studies concluded that advanced levels of treatment in the village of Ain Jarfa, Ain
Qenia, Kfeir and Khalouat, Mimes and Rachaiya el Foukhar are necessary. Table A shows the
flow levels for all OORTPs.
Table A. Total Inflow of Raw Olive Oil Wastewater for the Six OORTPs in Hasbaiya
Municipality Total Inflow of Raw Olive Wastewater
(m3/day)
Ain Jarfa 12.00
Ain Qenia 6.80
Kaoukaba 30.33
Kfeir Khalouat 5.33
Mimes 7.00
Rachaiya el Foukhar 9.53

Environmental Impact Assessment ELARD
Olive Oil Residue Treatment Plant – Caza of Hasbaiya xviii
In the context of analysis, the following six alternative olive oil residue treatment
schemes were screened: (1) Preliminary treatment, (2) Primary treatment alone, (3) Secondary
aerobic biological treatment through suspended growth process, (4) Secondary anaerobic
biological treatment through suspended growth process, (5) Combined anaerobic and aerobic
biological treatment, and (6) Combined anaerobic and aerobic biological treatment with
additional tertiary treatment through filtration and disinfection. The “Do Nothing” scenario is
not considered as a legitimate option, since olive oil residues are currently being discharged
without treatment into the environment. With the protection of the environment being the
main issue, the treatment system shall include at a minimum a secondary treatment. Table B
presents the main relevant effluent standards.
The most appropriate alternative for the OORTPs in the villages of Ain Jarfa, Ain Qenia,
Kfeir and Khalouat, Mimes and Rachaiya el Foukhar was found to be Alternative 6. The
upstream location of those OORTP sites and the fact that the perennial Hasbani River is not at
proximity makes advanced treatment levels unavoidable for the treatment of olive wastewater
to minimize the potential impacts on water resources.
As for the village of Kaoukaba, Alternative 5 was selected as the most appropriate one.
The olive wastewater will reach secondary treatment levels. The geological and
hydrogeological settings of the area have shown that the olive oil residue treatment plant will
be located on an impermeable formation (Chekka formation), which would act as a protective
seal for the secondary treated water. Advanced (tertiary treatment) levels are therefore not
required and this would minimize costs and expenses for the plant. Besides, the effluent will
be directly discharged on the Hasbani River.Sludge will be used in landscaping activities or
landfilled in an approved site by the MoE. Biogas, a by-product of anaerobic treatment, will
be collected in tanks to undergo flaring as the most appropriate treatment option. Other debris
and solid wastes, such as leaves or twigs, produced from the plant will be landfilled in an
appropriate site.
Other wastes include oil collected from the grease trap; this residual oil can be added to
the olive pomace generated by the three olive mills to be used as fuel for heating in individual
households. Saturated media filter and activated carbon will be returned to the supplier.

Environmental Impact Assessment ELARD
Olive Oil Residue Treatment Plant – Caza of Hasbaiya xix
Table B. Effluent Standards of Treated Wastewater*
Parameter Effluent Standards
pH 6 – 9
BOD5 25
COD 125
Suspended Solids 60
Ammonia-Nitrogen as N 10
Nitrate 90
Total Phosphorus 10
* All units in mg/L except for pH (unit less)
DESCRIPTION OF THE ENVIRONMENT
The study area is located in the Nabatiyeh Governorate, the southeastern section of the
Hasbaiya Caza, with land elevations ranging between less than 800 m and 1200 m above sea
level. A generally good road network connects the village to neighboring villages. Yet, road
access to proposed olive oil residue treatment plants sites needs to be improved.
The total annual precipitation in the area is approximately 900 mm. Temperature ranges
from a minimum of 8 ºC in winter to a maximum of 23 ºC. Dominant winds are
southwesterly. Continental east and southeasterly winds are also frequent.
Geological formations in the study area range from the Jurassic Period to some
Quaternary deposits outcropping in the study area. Jurassic formations were found mainly
underneath the sites of Ain Jarfa, Ain Qenia and Rachaiya el Foukhar. In Kfeir, Mimes and
Rachaiya el Foukhar, five formations belonging to the Cretaceous Period were identified
(Shouf Sandstone, Abeih, Mdairej, Hammana and Sannine). As for the Tertiary Period
formations, there were mainly found in Kaoukaba, along with quaternary deposits (due to its
proximity to the Hasbani River alluvial). The major aquifers existing in the study area are
divided on one hand between the karstic, very permeable aquifers such as the Sannine karstic
Aquifer in Mimes and the Mdairej karstic aquifer in Kfeir, and on the other hand, the
impermeable formations acting as protective seals, such as in Kaoukaba and Rachaiya el
Foukhar (Chekka formation and Hammana formations). Moreover, the Shouf Sandstone
formation present in Ain Jarfa and Ain Qenia acts as seepage zones, allowing water to
percolate into groundwater zones.

Environmental Impact Assessment ELARD
Olive Oil Residue Treatment Plant – Caza of Hasbaiya xx
Developed infrastructure within the villages mainly consists of road networks,
telephone, electricity, and water supply. A local solid waste management system does not
exist; most Hasbaiya villages rely on private solid waste management companies. The main
supplier of potable water in the area is from Chebaa village.
Local habitants are mainly members of the active population (between 18 and 50 years
old). The economy in most municipalities of the Hasbaiya region is driven by agriculture,
trade and services and money sent by expatriates. Average household income amounts to less
than six million Lebanese pounds annually.
IMPACT ASSESSMENT
Negative impacts are likely to occur on groundwater resources whenever uncontrolled
tank leakages take place or more importantly, in the case of plant malfunction or insufficient
treatment. Risks of groundwater contamination are increased whenever the geological
formation is considered relatively permeable, leading to possible wastewater percolation
though channels and fissures (such as in Mimes, Kfeir, Ain jarfa and Ain Qenia). On the other
hand, if well operated, the OORTP is expected to improve the quality of the downstream water
resources, notably the Hasbani River. The assessment of impacts indicated that negative
impacts should not be significant as long as process performance is continuously controlled.
Other positive impacts include improved public health and living standards, these are
considered as a direct consequence and key goals of the project implementation.
Note that in the worst case scenario, the statu-quo situation will prevail. The problem
posed by domestic wastewater treatment, whereby the sewage network leads to the creation of
a point source of pollution in the case of plant poor operation does not stand in this case since
no network is built. Vegetable wastewater is conveyed by tankers and stored prior to
treatment.
ENVIRONMENTAL MANAGEMENT PLAN
In order to ensure the proper operation of the six OORTPs, a management system must
be implemented. This management scheme shall assure mitigating potential impacts,
monitoring of effluent quality, proper staff training, organized record keeping, the provision of
effective contingency measures, and finally an emergency response plan. Mitigation measures
to reduce the likelihood and magnitude of the above-described impacts induced by the
construction and operation of the proposed OORTP are described in Table C.

Environmental Impact Assessment ELARD
Olive Oil Residue Treatment Plant – Caza of Hasbaiya xxi
Table C. Summary of Main Mitigation Measures
Impact Mitigation Measures
Dust Emissions ♦ Dust emissions from piles of soil or from any other material during earthwork, excavation, and transportation should be controlled by wetting surfaces, using temporary wind breaks, and covering truck loads
♦ Piles and heaps of soil should not be left over by contractors after construction is completed. Also excavated sites should be covered with suitable solid material and vegetation growth induced
Noise Generation ♦ Temporary noise pollution due to construction works should be controlled by proper maintenance of equipment and vehicles, and tuning of engines and mufflers. Construction works should be completed in as short a period as possible by assigning qualified engineers and foremen
♦ Noise pollution during operation would be generated by mechanical equipment, namely transfer pumps, air blowers, and sludge dewatering units. Noise problems should be reduced to normally acceptable levels by incorporating low-noise equipment in the design and/or locating such mechanical equipment in properly acoustically lined buildings or enclosures
Odor Generation ♦ Store produced residuals in closed containers and transport them in enclosed container trucks
♦ Keep always an optimum aeration rate at the aeration tanks
♦ Collect biogas in leak-proof biogas tank
♦ Use corrosion resistant material in the UASB reactor components to avoid leakage.
♦ If possible, proper landscape around the facility may serve as a natural windbreaker and minimize potential odor dispersions, if present
Soil and Water Pollution ♦ Properly dispose of effluents; monitoring of effluents quality is essential to avoid misuse of the latter; re-use of effluents (sludge or treated wastewater) shall be performed as per appendix E
It is noteworthy to mention that in the case of Mimes and Ain Jarfa, a protective seal is
required underneath each OORTPs to be constructed in order to protect the groundwater
resources. In addition, and in order to maximize the plant’s efficiencies, especially that
temperature fluctuations could have negative impacts on anaerobic bacteria performance in the
UASB, the following measures will be implemented by MCI, based on the EIA
recommendations:
q Tanks will be insulated and placed underground to improve heat retention;
q Solar panels will be used as a source of energy to increase temperatures to the minimum temperature required for sustained anaerobic bacterial activity;
q If needed and economically feasible, biogas will be also recovered as a source of heat.

Environmental Impact Assessment ELARD
Olive Oil Residue Treatment Plant – Caza of Hasbaiya xxii
In order to overcome problems with plant start-up, the vegetable wastewater will be stored and recycled in the initial period of plant performance each year, until sufficient levels of treatment are attained.
The aim of the monitoring plan is to allow identification of probable causes in case of
unlikely process deficiencies. Except during plant start-up, when a thorough monitoring
schedule is recommended, monitoring efforts can be limited to regular checks during its
operational period (weekly or bi-weekly, as needed) of effluent quality for the following
parameters:
• pH and temperature
• BOD5 and COD
• Suspended solids
• Total Nitrogen
• Total Phosphorus
• Ammonia-nitrogen
• Nitrate–nitrogen
• Phosphate
If it is decided to reuse the effluent, fecal coliforms and chlorine residual should also be
checked regularly. On-site monitoring of temperature, pH, and flow measurements would be
continuous. Sludge monitoring becomes essential if it is re-used as soil fertilizer. If a more
detailed monitoring scheme is judged necessary by the regulatory authorities, then a
sustainable financial mechanism must be put in place to secure the necessary funds.
Impact detection monitoring shall be performed for the various OORTP plants. It is
recommended to perform quarterly monitoring (every three months) of the following springs
for detecting the positive impacts of theOORTPs:
- Ain el Marj
- Ain el Ghabra

Environmental Impact Assessment ELARD
Olive Oil Residue Treatment Plant – Caza of Hasbaiya xxiii
- Ain Khoury
- Ain Mitri
- S1 spring
- Ain el Ram
- Rachaiya el Foukhar Spring
The following parameters should be monitored:
- Fecal coliforms
- BOD5
At the level of rivers where the OORTP effluent is discharged during the operational
periods, impact detection monitoring for the OORTP should be performed twice annually
(during early winter/late fall (December) and late winter (February)). Sampling should be
performed directly before the OORTP discharge, 100 meters after the plant discharge, and at
the following three key locations of the Hasbani River:
Location 1: In Kaoukaba village close to the potential location of the Kaoukaba Plant.
Location 2: Underneath the bridge, at the connection between the intermittent river in
Chebaa Valley and the Hasbani River
Location 3: In the village of Mari close to the potential location of the Mari Plant.
The following parameters should be monitored:
- pH
- BOD5
- Total Suspended Solids
- Total Phosphorus
- Total Nitrogen

Environmental Impact Assessment ELARD
Olive Oil Residue Treatment Plant – Caza of Hasbaiya xxiv
As for the responsibility of the different plant personnel, Table D describes the tasks and
duties of the main staff that will be in charge of the proper operation of each plant.
Table D. Main Responsibilities of Plant’s Personnel
Title Main Tasks
Plant Manager (can be for more than one plant)
♦ Schedule sampling events and keep records of sampling results for compliance monitoring
♦ Prepare a report of plant’s performance (accidents, compliance of effluent to standards, sludge quality, etc…) on a monthly basis during the first year, and annually the following years
♦ Ascertain that mitigation measures are adhered to
Assistant plant manager ♦ Conduct sampling and follow-up with the off-site chemical laboratory for results
♦ Supervise the plant’s performance on a daily basis
Mechanical Engineer (part-time)
♦ Ascertain the proper functioning of electro-mechanical equipment at the plant
Electrical Engineer (part-time)
♦ Ascertain the proper functioning of electro-mechanical equipment at the plant
Laborer ♦ Responsible for the day-to-day operation and maintenance of the plant; reports problems to management
Monitoring efforts would be in vain in the absence of an organized record keeping
practice. It is the responsibility of the treatment plant management and the municipality to
ensure the development of a database that includes a systematic tabulation of process
indicators, performed computations, maintenance schedules and logbook, and process control
and performance monitoring outcomes. Such a historical database benefits both the plant
operator and design engineers in order to predict any adjustments needed to be performed
ahead of time for any variation in hydraulic loading, temperature and even biological loadings.
In addition, in accordance with the requirements of the regulatory authority, the treatment
plant should submit a periodic Discharge Monitoring Report (DMR) to the assigned authority.
The institutional setup for the project is proposed in Figure I.
The cost of the environmental management plan depends mainly on the monitoring
scheme (sampling) and the cost of workshops for capacity building. On the other hand, the
cost of the mitigation measures described to alleviate the negative environmental impacts is
included in a general manner in the design and regular plant operation and management
expenses.

Environmental Impact Assessment ELARD
Olive Oil Residue Treatment Plant – Caza of Hasbaiya xxv
As for the contingency plan, it includes several measures to be incorporated in the plants
design in order to minimize the likelihood of failures and plant break-down. Those measures
include: the addition of an equalization tank to be used for the start-up phase of the plant, the
addition of insulating material and energy sources to avoid temperature fluctuation that could
impair the plant operation, and redundancy in design for backup in case of malfunctioning of
certain elements.
The main supervising authority for each plant would be the municipality, except for Ain
Jarfa where a community-base committee will be in charge of the plant. The concerned
municipality along with MCI and the selected contractor would supervise all the activities at
the plant, starting from the design and construction phases, and continuing at the operation
phase where it will be mandatory for the contractor to provide constant and regular technical
checkups. The corresponding municipalities, however, would perform operation and day-to-
day management. The MoE would have a regulatory role. The MoIM would have an
enforcement role. Each plant’s manager reports directly to the municipality as in the
following illustration of the institutional arrangement that could be followed to ascertain the
proper operation of the plant, and assist the implementation of the EMP. The coordination
with the South Lebanon Water and Wastewater Establishment is also important since they are
responsible for wastewater monitoring in their new mandate. As an emergency response
measure, in case of any plant deficiency and discharge of untreated wastewater, the plant
operator should immediately inform the water authority and take measures to remedy the
cause of deficiency.

Environmental Impact Assessment ELARD
Olive Oil Residue Treatment Plant – Caza of Hasbaiya xxvi
MoIM / Mohafez MoE \ SLWWE
Enforcing Authority
Coordination Coordination
Regulatory \ Monitoring Authorities
Village/ Municipality
Supervision / Management
Coordination
Plant’s Management Support
Operation and Maintenance Need
Certified Laboratory
Sampling Reporting
External Consultants
Laboratory Analysis Monitoring and Expert Advice
Figure I. Proposed Institutional Setting

Environmental Impact Assessment ELARD
Olive Oil Residue Treatment Plant – Caza of Hasbaiya 1
1. INTRODUCTION
1.1. THE OVERALL CONTEXT
Lebanon has recently made significant progress towards sustainable development, and
has paid more attention to environmental matters and the need to reduce the burden on the
environment. In the last ten years, the Ministry of Environment (MoE) has been successful in
considerably improving its capabilities to fulfill its main role of protecting the environment
from the various sources of pollution. Financed by international organizations, several
working units within the MoE are setting new environmental standards, building an
informational database for the country, and providing the framework to prevent and control
the spread of pollution in Lebanon.
In particular, the Unit of Planning and Programming (UPP) has revised and further
developed the draft Decree for Environmental Impact Assessment (EIA) that is currently being
considered for ratification by the Government. The draft decree states that any planned
project that could cause significant environmental impacts should be subject to the preparation
of an EIA that would anticipate these impacts and allow provision of mitigation measures to
minimize the significance of these impacts, or even eliminate their likelihood. The draft
decree also states that projects that could have some impacts on the environment should
undergo an initial impact assessment.
1.2. BACKGROUND AND RATIONALE
Recent government initiatives in the fields of solid waste and wastewater management in
Lebanon have primarily covered major cities and urban areas in the country. The Integrated
Solid Waste Management Plan (ISWMP) that serves the Greater Beirut Area (GBA) and the
National Wastewater Management Plan (NWMP) illustrates this challenge, for example.
Limited achievements have been experienced so far in rural areas except for the community-
based initiatives financed primarily by international donors.
The environmental pressure experienced in Lebanese rural areas can be illustrated by the
fact that approximately 700,000 tons of municipal solid waste (MSW) and over 100 Mm3 of
raw municipal sewage are directly disposed off in the environment every year (MoE/Ecodit,

Environmental Impact Assessment ELARD
Olive Oil Residue Treatment Plant – Caza of Hasbaiya 2
2002). A wide range of environmental, public health and socio-economic impacts result from
the current situation, some of which are listed below:
♦ Contamination of water resources: Lebanon's groundwater resources are mainly of karstic
nature (over 75 percent of the resources), which offer limited possibility for natural
attenuation of pollutants before reaching water resources; recent surveys and studies have
shown that over 90 percent of the water resources below 600 meters of altitude are
contaminated (Jurdi, 2000); surface water streams are also affected by the direct discharge
of untreated wastewater. As water becomes polluted, expensive treatment to make it fit for
use will inevitably lead to the increase in the price consumers will have to pay when
privatization of water services occur and mechanisms such as full-cost accounting are
adopted to set water prices.
♦ Increased health problems among the population: inadequate disposal of solid waste and
wastewater lead to the release of numerous organic and non-organic contaminants that can
eventually reach human beings through diverse pathways including direct ingestion of
contaminated water, ingestion of crops contaminated with polluted irrigation water and
inhalation of polluted air (from open waste burning activities); for example, it is estimated
that 260 children die every year in Lebanon from diarrhea diseases due to poor sanitary
conditions leading to the consumption of polluted water (MoH, 1996; CBS/Unicef, 2001).
♦ Negative impact on local economic activities: uncontrolled spread of solid waste and
wastewater in valleys, water courses and along roads negatively affects economic activities
such as those related to tourism development or eco-tourism by reducing the attractiveness
of these areas; similarly, irrigated areas can be at risk if the source of irrigation water is
polluted due to poor waste management practices, thus potentially affecting the agriculture
sector in some areas; additional economic impacts are attributed to poor health conditions
that can affect human productivity in addition to increasing social costs. It has been
recently estimated that the cost of inadequate potable water quality, sanitation and
hygiene (largely due to inadequate waste management) could exceed 1 percent of national
Gross Domestic Product (GDP), or as much as 170 million USD per year (World
Bank/METAP, 2003).
Overall development constraints and obstacles in Lebanon do not favor government
assistance to rural areas. Political turmoil, regional instability, and huge public debt are

Environmental Impact Assessment ELARD
Olive Oil Residue Treatment Plant – Caza of Hasbaiya 3
affecting the smooth progress of planned projects in the country, most of which are stagnant
with little achievement being made. This has lead for instance to the removal of the Solid
Waste Environmental Management Plan (SWEMP) financed by the World Bank (WB), which
has experienced limited progress since its inception in the late 1990s.
There are potential risks associated with poor waste management practices in rural areas,
aggravated by the limited level of assistance from the central government. The result is that
most of the rural areas in Lebanon are deprived of adequate sanitary infrastructure. A more
consistent response with USAID strategic objectives would be to look for individual or cluster
solutions.
A recent survey on waste management practices in 111 villages outside GBA (El-Fadel
and Khoury, 2001) highlighted the following major challenges, in decreasing order of
importance, budget deficit, lack of technical know-how, lack of equipment, lack of employees,
negligence, mismanagement, lack of land and lack of public participation. These can be
summarized in two major categories: 1) limited resources (financial and human) and 2) limited
technical skills (technical know-how, management, and environmental awareness).
Another important issue highlighted by the survey was the high level of co-disposal of
hazardous and special waste stream (over 75 percent). This significantly increases the health
risk associated with poor MSW disposal. Rural areas do not have the needed infrastructure to
deal with special wastes such as those generated by olive press mills, hospitals, or
slaughterhouses. An additional challenge posed by these types of wastes is the low volume-
generated which do not attract private sector investment for their treatment and/or
valorization.
Financial support from international sources have assisted in supplying infrastructure
and equipment to rural areas for solid waste and wastewater management, yet, additional
challenges have been disclosed and lessons can be extracted from these experiences:
♦ Limited financial resources in municipalities can lead to poor operation of solid waste and
wastewater technologies when funding is over;
♦ Insufficient training, know-how and/or commitment from municipalities can also lead to
poor operation of technologies;

Environmental Impact Assessment ELARD
Olive Oil Residue Treatment Plant – Caza of Hasbaiya 4
♦ Poor quality of compost, particularly due to the presence of inert materials, leads to
significant problems in marketing the product to farmers; insufficient or no public
participation in source separation activities contributed to this problem;
♦ Limited number of recycling factories in the country and the long distances usually
existing between treatment facilities and these factories lead to very high and unaffordable
transportation costs. Recyclable materials are poorly marketed to the consumers;
♦ Lack of public participation and public awareness or consensus can delay or even stop the
execution of such infrastructure projects.
Another important challenge that rural cluster development programs may experience, is
the need to obtain approval from the government. The government has demonstrated
skepticism towards decentralized projects, fearing that these could be a short-term solution
leading to long-term problems. Both the Ministry of Interior and Municipalities (MoIM) and
the Ministry of Environment (MoE) have shown their reservations with respect to such
initiatives, fearing that they could become out of their control due to difficulties in monitoring
the performance of scattered projects across the country.
Implementing sustainable infrastructure projects in Lebanese rural areas requires a
multi-disciplinary and clearly oriented approach with a long-sighted vision in order to
overcome all the constraints presented above. Figure 1.1 summarizes the overall situation of
rural areas with respect to such infrastructure projects.

Environmental Impact Assessment ELARD
Olive Oil Residue Treatment Plant – Caza of Hasbaiya 5
Government's Master Plans (solid waste
and wastewater)
Rural Areas
Covered
Rural Areas not Covered
Limited
progress
Private
Rural Initiatives
Limited Knowledge, technical skills and human resources
Lack of Infrastructure and equipment
Limited
achievements
Financial Limitations
Lack of Public Participation
Figure 1.1. Constraints Hindering Infrastructure Development in Rural Communities in Lebanon
1.3. THE PROJECT
The project proposes six Olive Oil Residue Treatment Plants to serve seven villages in
the eastern Nabatiyeh Governorate, Hasbaiya Caza, Lebanon as part of Mercy Corps
International (MCI) Improved Environmental Practices and Policies Program. Funded by the
USAID, MCI is providing a comprehensive olive mill wastewater management solution with
♦ Political turmoil ♦ Regional Instability ♦ Public dept

Environmental Impact Assessment ELARD
Olive Oil Residue Treatment Plant – Caza of Hasbaiya 6
the purpose of alleviating the severe impacts of uncontrolled olive mill liquid effluent
discharge in the Hasbaya villages.
This EIA has been prepared to address the potential environmental impacts that could
arise from the construction and operation of Olive Oil Residue Treatment Plants (OORTPs)
planned for the Hasbaya villages. Proper design selection, construction, and management of
the olive oil residue treatment plant would mitigate such negative impacts.
Additionally, the EIA evaluates various alternative treatment technologies and presents
technical criteria on which to base the selection of the most suitable one. The Hasbaya
villages planned to be served by the OORTP encompass seven (7) different villages: Ain Jarfa,
Ain Qenia, Kaoukaba, Kfeir, Khalouat, Mimes and Rachaiya el Foukhar. The seven villages
are located on the Eastern slopes of the South Lebanon, where the lowest elevations coincide
with the Hasbani River. Land elevations in the Hasbaiya area range on average between 800
m and 1300 m above sea level. Olive Oil residue Treatment Plants (OORTP) are to be located
in six of these, namely, Ain Jarfa, Ain Qenia, Kaoukaba, Kfeir, Mimes and Rachaiya el
Foukhar.
1.4. THE PROJECT LOCATION
The Olive Oil Residue Treatment Plants (OORTPs) are to be located within the Hasbaya Caza. The municipalities are located approximately 110 kilometers southeast of Beirut. The proposed locations of the plants are presented on the Geological Maps, included as Appendix A and Topographic Maps presented in Appendix B of this report. The surface areas of the selected parcels varies between 1000 and 1500 m2 required by the OORTPs.
Table 1.1 presents geographical coordinates, available land area and land ownership of the proposed site of each of the Hasbaya villages OORTPs. The exact plant locations are shown in Appendix D.

Environmental Impact Assessment ELARD
Olive Oil Residue Treatment Plant – Caza of Hasbaiya 7
Table 1.1. Property Location, Available Acreage and Land Ownership of the Proposed OORTPs in Hasbaya
Village Served Property Location* Available Land area (m2)
Land Ownership
Ain Jarfa Longitude: X1=144,857km,
X2=145,275km
Latitude: Y1=160,543km,
Y2=160,913km
1000-1500 Community
Ain Qenia Longitude: X1=147,000km,
X2=149,000km
Latitude: Y1=162,000km,
Y2=164,000km
1000-1500 Municipality
Kaoukaba Longitude: X1=140,000km,
X2=142,000km
Latitude: Y1=161,000km,
Y2=163,000km
1000-1500 Municipality
Kfeir-Khalouat Longitude: X1=156,000km,
X2=158,000km
Latitude: Y1=141,000km,
Y2=143,000km
1000-1500 Municipality of Kfeir
Mimes Longitude: X1=146,000km,
X2=151,000km
Latitude: Y1=165,000km,
Y2=166,000km
1000-1500 Municipality
Rachaiya el Foukhar
Longitude: X1=156,000km,
X2=158,000km
Latitude: Y1=141,000km,
Y2=143,000km
1000-1500 Municipality
*Geographical Coordinates

Environmental Impact Assessment ELARD
Olive Oil Residue Treatment Plant – Caza of Hasbaiya 8
1.5. THE STUDY AND THE EIA REPORT
This study was prepared in close collaboration with Mercy Corps International (MCI)
and the seven villages municipalities/communities who contributed significantly to the overall
quality of the study, the identification of the most feasible treatment systems and
environmental management practices. The report was prepared through continuous and
harmonious coordination with the municipality officials. It provides MCI, USAID and other
stakeholders including the local community a thorough discussion of the significant
environmental effects of the proposed interventions. The purpose of this EIA study is to
ensure that the potential impacts from the installation and operation of the Olive Oil Residue
Treatment Plants are identified early enough in the projects lifetime. As a result, their
significance is assessed, and appropriate mitigation measures are proposed to minimize or
eliminate such impacts. Additionally, the EIA has been a catalyst for MCI and the
municipality to review alternative technologies and other vendors thus selecting the most
appropriate design for deployment.
The remainder of this EIA report is structured in eight main sections. Section 2 provides
the legislative and institutional framework. Section 3 presents background information to the
six OORTPs projects. Section 4 describes the olive oil sector and olive mill residual waste.
Section 5 describes the different projects and associated elements. Section 6 describes the
environmental setting in Hasbaya. Section 7 assesses the impacts. Moreover, section 8
presents an environmental management plan (EMP) that includes a mitigation plan, a
monitoring plan, capacity building and institutional arrangements to allow for a smooth
implementation of the EMP for all six OORTPs, as well as a contingency and emergency
response plan. Section 9 presents the public participation program implemented to allow
direct involvement of the concerned communities in the implementation of the project.

Environmental Impact Assessment ELARD
Olive Oil Residue Treatment Plant – Caza of Hasbaiya 9
2. LEGISLATIVE AND INSTITUTIONAL FRAMEWORKS
2.1. LEGISLATIVE FRAMEWORK
The MoE was created by Law 216 of 2 April 1993 marking a significant step forward in
the management of environmental affairs in Lebanon. Article 2 of Law No. 216 stipulate that
the MoE should formulate a general environmental policy and propose measures for its
implementation in coordination with the various concerned public administrations. It also
indicates that the MoE should protect the natural and man-made environment in the interests
of public health and welfare and fight pollution from whatever source by taking preventative
and remedial action. Specifically, the MoE is charged with developing, among others, the
following aspects of environmental management:
♦ A strategy for solid waste and wastewater disposal treatment, through participation
in appropriate committees, conducting studies prepared for this purpose, and
commissioning appropriate infrastructure works;
♦ Permitting conditions for new industry, agriculture, quarrying and mining, and the
enforcement of appropriate remedial measures for installations existing before
promulgation of this law;
♦ Conditions and regulations for the use of public land, marine and riverine resources,
in such a way as to protect the environment;
♦ Encouragement of private and collective initiatives which improve environmental
conditions; and
♦ Classification of natural sites, landscapes and setting decisions and decrees
concerning their protection.
Furthermore, new emission standards for discharge into surface water and air have been
established by the MoE (ministerial decision no. 8/1/2001), through the assistance of the
SPASI (Strengthening the Permitting & Auditing System for Industry) unit at the MoE, to
update the previous standards set by Law 52/1. These standards will be used as a basis to
control pollution loads in the country.

Environmental Impact Assessment ELARD
Olive Oil Residue Treatment Plant – Caza of Hasbaiya 10
Table 2.1 describes the main categories of legislation in Lebanon. In terms of
environmental legislation, Table 2.2 presents the existing and proposed legislation pertinent to
wastewater treatment plants.
Table 2.1. Categories of Legislation in Lebanon
Laws Laws are passed by the Lebanese parliament. The council of ministers or deputies can propose a project of law that should pass through the appropriate parliamentary committee. In the case of environmental legislation, this committee is generally the Agriculture, Tourism, Environment and Municipalities Committee, the Public Works, Transport, Electric and Hydraulic Resources Committee, or the Planning and Development Committee. The committee reviews, assesses, and presents the law, with the amendments it introduces, for final approval by the parliament.
Decree laws The parliament has empowered the council of ministers to issue decree-laws without the prior approval or supervision of the parliament. Decree laws have the same legal standing and powers as laws.
Decrees The council of ministers issues decrees that have the power of law provided they do not contravene existing laws. The council of state should be consulted before the issuing of a decree.
Resolutions Ministers issue resolutions without the pre-approval of the council of ministers. Resolutions have the power of law provided they do not contravene existing laws. The council of state should be consulted before the issuing of a resolution.

Environmental Impact Assessment ELARD
Olive Oil Residue Treatment Plant – Caza of Hasbaiya 11
Table 2.2. Summary of Selected Legislation Related to Wastewater Management
Legislation Year Brief Description
Decree No. 7975 5/5/1931 Related to the cleanliness of residences and their extensions, and wiping out of mosquitoes and flies, and discharges of substances and wastewater.
Decree No. 2761 19/12/1933 Directions related to discharge of wastewater and dirty substances. Law No. 216 2/4/1993 The Creation of the MoE Decree 8735 1974 It is forbidden to allow infiltration of sewage waters from cesspools or
to leave them partially exposed, or to irrigate vegetables or fruits with their waters (Article 4) It reserves places assigned by each municipality for the treatment of wastes and agricultural and industrial residues (Article 13), empty sewage waters by tankers in special locations by decision of provincial or district governor until drainage canals are built (Article 15) It is forbidden to drill wells to undefined depth with the aim of disposing of sewage water (Article 3)
Ministerial Decision No. 52/1
29/7/1996 Environmental Quality Standards & Criteria for Air, Water and Soil
Law No. 667 29/12/1997 Amendment to Law No. 216, Organization of the MoE Draft Decree 1998 All agglomerations have to be provided with collecting systems for
urban wastewater at the latest by 31 December 2010 for those with a population equivalent of more than 15,000 and 31 December 2015 for those between 2,000 and 15,000 (Article 3) All urban wastewater entering collection systems shall be subject to secondary treatment or an equivalent treatment before discharge. This deadline for achieving this goal is 31 December 2010 for all discharges from agglomerations of more than 15,000 people and 31 December 2015 for those between 2,000 and 15,000 people (Article 4) It should be ensured that urban wastewater treatment plants are designed, constructed, operated and maintained to ensure sufficient performance under all normal local climatic conditions
Ministerial Decision No. 8/1
30/1/2001 Characteristics and standards related to air pollutants and liquid waste emitted from classified establishment and wastewater treatment plants.
Project Decree 7/2000- Environmental Impact Assessment Law 444 29/7/2002 Law of the protection of the environment; sets the framework for
environmental protection in Lebanon.
Table 2.3 summarizes the two main documents that would complement the existing
environmental legislation, namely the Law on the protection of the environment (Law 444
dated 2002) and the draft EIA decree. Table 2.4 presents selected standards for discharge into
surface waters (taken from the National Standards for Environmental Quality) that this study
has accounted for.

Environmental Impact Assessment ELARD
Olive Oil Residue Treatment Plant – Caza of Hasbaiya 12
Table 2.3. Code of Environment and EIA Decree
Law 444
The environmental legislation will be administered by the MoE.
Permitting of new facilities with potential environmental impacts will be approved by the MoE in addition to other relevant agencies depending on the type of the project.
The application of environmental legislation will be supervised by the MoE; however, the modalities of the supervision exercised by the MoE are not set.
Enforcement of legislation is not addressed. It is clear that the MoE will have no enforcement role. The Ministry of Interior will continue to be responsible for the legislation enforcement.
A new fund, the National Environment Fund, will be created. The fund covers expenses that should be included in the budget of the MoE. It seems that the establishment of such a fund aims at collecting donations that are specifically targeted to finance environmental projects. Moreover, the fund would also be sustained by the fines and taxes established in the Code.
Environmental tax incentives are mentioned for the first time in Lebanese legislation.
The draft EIA decree (2000)
The MoE decides upon the conditions to be met and information to be provided by a project to receive a permit.
The MoE must supervise the projects that are undergoing an EIA.
The EIA should contain at least the following sections: institutional framework, description of the project, description of the environment, impact assessment, mitigation measures, and EMP.
The EIA is to be presented to the institution in charge of granting a permit to the project depending on the type of the project. A copy of the EIA is sent by this institution to the MoE for consultative and revision purposes.
Table 2.4. Selected Standards for Discharge into Surface Waters
Parameter Effluent Concentration *
pH 6 – 9
BOD5** 25
COD*** 125
Suspended Solids 60
Ammonia-Nitrogen 10
Nitrate 90
Total Phosphorus 10
*Concentrations in mg/L except for pH (unit less)
** Biochemical Oxygen Demand *** Chemical Oxygen Demand

Environmental Impact Assessment ELARD
Olive Oil Residue Treatment Plant – Caza of Hasbaiya 13
2.2. INSTITUTIONAL FRAMEWORK
In addition to the MoE, other organizations play a role in environmental protection and
management, in particular the Ministries of Public Health (MoPH), Interior and Municipalities
(MoIM), Public Works and Transport (MoPWT), Agriculture (MoA), Industry and Petroleum
(MoIP), Ministry of Energy and Water (MoEW) and South Lebanon Water and Wastewater
Establishment (SLWWE). At a regional level, the Mohafaza and each local Municipality
have direct responsibilities relating to the environment. The Council for Development and
Reconstruction (CDR) is leading the reconstruction and recovery program and has taken over
certain responsibility from line ministries in areas with direct environmental implications.
Table 2.5 summarizes the main responsibilities and authorities of key institutions in the
country.
Table 2.5. Responsibilities and Authorities of Key Institutions in Lebanon
Institution Water
Resources
Urban Planning/ Zoning
Standards and
Legislation Enforcement Biodiversity
Waste Water
Discharge
Council for Development and Reconstruction √ √ √
Council for the Displaced √ √
Ministry of Agriculture √ √ √
Ministry of Environment √ √ √ √ √
Ministry of Housing and Cooperatives
√ √
Ministry of Energy and Water √ √ √ √ √
Ministry of Industry and Petroleum
√ √ √ √
Ministry of Interior and Municipalities
√
Ministry of Public Health √ √ √ √
Ministry of Public Works and Transport √
√ √ √
Ministry of Tourism √ √ √
South Lebanon Water and Wastewater Establishment √ √
Union of Municipalities √ √ √ √ √
Municipality √ √ √ √ √
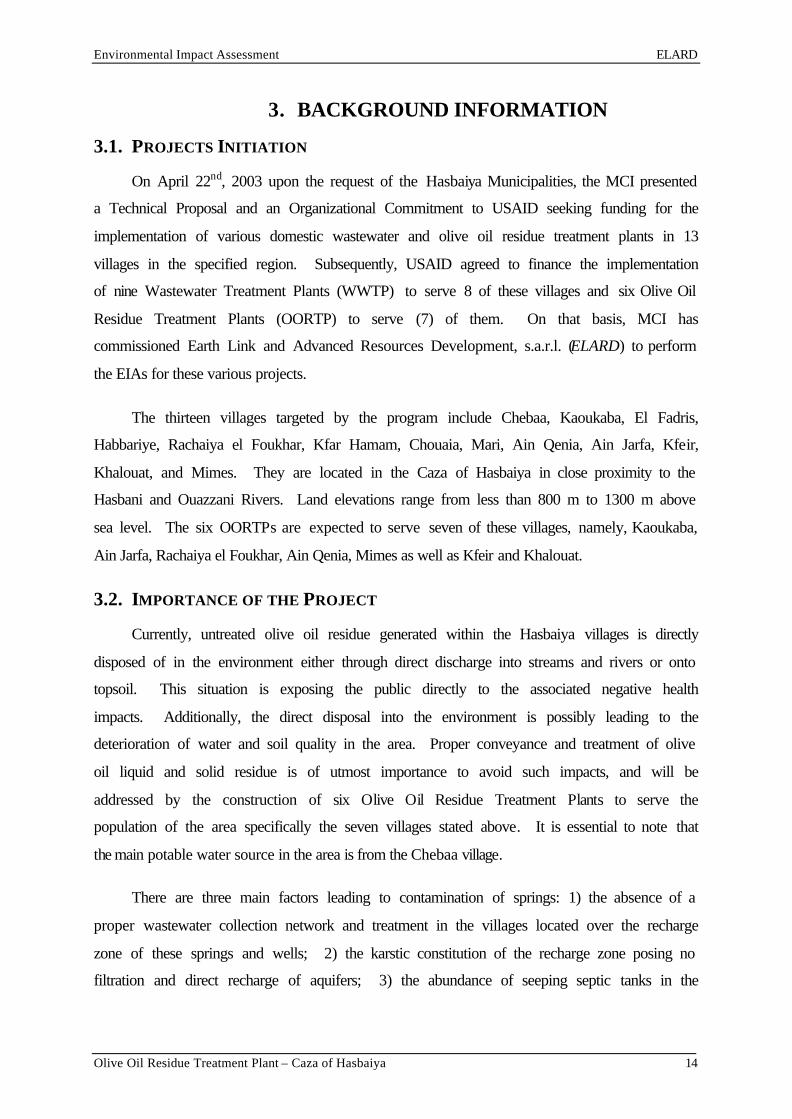
Environmental Impact Assessment ELARD
Olive Oil Residue Treatment Plant – Caza of Hasbaiya 14
3. BACKGROUND INFORMATION
3.1. PROJECTS INITIATION
On April 22nd, 2003 upon the request of the Hasbaiya Municipalities, the MCI presented
a Technical Proposal and an Organizational Commitment to USAID seeking funding for the
implementation of various domestic wastewater and olive oil residue treatment plants in 13
villages in the specified region. Subsequently, USAID agreed to finance the implementation
of nine Wastewater Treatment Plants (WWTP) to serve 8 of these villages and six Olive Oil
Residue Treatment Plants (OORTP) to serve (7) of them. On that basis, MCI has
commissioned Earth Link and Advanced Resources Development, s.a.r.l. (ELARD) to perform
the EIAs for these various projects.
The thirteen villages targeted by the program include Chebaa, Kaoukaba, El Fadris,
Habbariye, Rachaiya el Foukhar, Kfar Hamam, Chouaia, Mari, Ain Qenia, Ain Jarfa, Kfeir,
Khalouat, and Mimes. They are located in the Caza of Hasbaiya in close proximity to the
Hasbani and Ouazzani Rivers. Land elevations range from less than 800 m to 1300 m above
sea level. The six OORTPs are expected to serve seven of these villages, namely, Kaoukaba,
Ain Jarfa, Rachaiya el Foukhar, Ain Qenia, Mimes as well as Kfeir and Khalouat.
3.2. IMPORTANCE OF THE PROJECT
Currently, untreated olive oil residue generated within the Hasbaiya villages is directly
disposed of in the environment either through direct discharge into streams and rivers or onto
topsoil. This situation is exposing the public directly to the associated negative health
impacts. Additionally, the direct disposal into the environment is possibly leading to the
deterioration of water and soil quality in the area. Proper conveyance and treatment of olive
oil liquid and solid residue is of utmost importance to avoid such impacts, and will be
addressed by the construction of six Olive Oil Residue Treatment Plants to serve the
population of the area specifically the seven villages stated above. It is essential to note that
the main potable water source in the area is from the Chebaa village.
There are three main factors leading to contamination of springs: 1) the absence of a
proper wastewater collection network and treatment in the villages located over the recharge
zone of these springs and wells; 2) the karstic constitution of the recharge zone posing no
filtration and direct recharge of aquifers; 3) the abundance of seeping septic tanks in the

Environmental Impact Assessment ELARD
Olive Oil Residue Treatment Plant – Caza of Hasbaiya 15
overlaying area. This third factor leads to the mixing of wastewater and springs water within
the various Karstic aquifers. Appendix B includes reports of laboratory analysis on spring
water samples confirming the presence of sewerage related contamination within some
investigated springs in the Hasbaiya area.
In addition, olive mill liquid residue of vegetable water is being discharged directly
from the mills into run-off ditches and storm water galleries, which in turn conveys the
vegetable water into open land, agricultural fields, and surface water bodies. This situation is
evident in most of the villages in the Hasbaiya area where raw vegetable water is discharged
into winter channels subjecting the neighboring orchards and agricultural fields to potential
hazards; diseases to farmers and the consumers as well (Photograph 3.1).
Photograph 3.1. Discharge of Wastewater in Winter Channels
3.3. OBJECTIVES OF THE PROJECT
The main objective of the project is to provide the necessary means to treat olive oil
residue generated at the villages of Ain Jarfa, Ain Qenia, Kaoukaba, Kfeir and Khalouat,
Mimes and Rachaiya el Foukhar, and halt the current practices of uncontrolled disposal of raw
olive mill waste in the environment. These practices are posing risk to the public health and
the environment, mainly through the contamination of potable water and associated springs as
well as affecting agricultural production. An additional objective is to reduce disease vectors
and halt the nuisance associated with open disposal of raw olive oil residue onto waterways
and open trenches resulting in the generation of odors, mosquitoes and other insect

Environmental Impact Assessment ELARD
Olive Oil Residue Treatment Plant – Caza of Hasbaiya 16
populations. The concern of the municipality for the health of the public, the protection of the
environment and their drive for developing local tourism is the driving force behind this
project.
3.4. THE EXECUTING OFFICE
The concerned municipalities/communities all along with MCI are the responsible
authorities with respect to the proper construction and operation of the plants. They will
oversee the works and ensure its execution and operation according to specifications.

Environmental Impact Assessment ELARD
Olive Oil Residue Treatment Plant – Caza of Hasbaiya 17
4. OLIVE MILL WASTE GENERATION AND MANAGEMENT
4.1. OLIVE OIL SECTOR
The cultivation of olives for obtaining olive oil is particularly intense in the countries of
the Mediterranean basin. In an olive oil mill, the process of oil extraction generates a large
quantity of highly concentrated by-products and residues, such as spent olives and vegetable
waters, which require specific management with objectives of minimization or reduction of
their potential negative environmental impacts.
Olive oil is a major Lebanese agricultural export. Olive oil accounted for a 0.16 percent
of the total country exports in 1999 to 3 percent of the exports in 2000, consequently bringing
a total of 2,051 Million L.L. into the Lebanese economy. The area for olive cultivation in
Lebanon increased from 14,472 ha in 1961 to 55,000 ha in 2001. It is mostly clustered in the
Cazas of Koura, Zgharta, and Akkar, in the North, Sour, and Marjayoun in the South as well
as the Chouf Caza in Mount Lebanon. Nonetheless, the oleiculture industry in Lebanon has
been facing problems despite the recent years of effort that have been made by the Lebanese
government, often with the support of the Food and Agriculture Organization of the United
Nations (FAO), to modernize the industry and make it internationally more competitive.
Additionally, olive cultivation has an important social aspect to it. It employs abundant
local labor and involves many small producers, who are commonly farmers. However, since
production is seasonal, it has implications on job availability and conditions, as well as on
waste production.
4.1.1 Olive Oil Production
During the annual period of 1998 - 1999, worldwide production of olive oil reached
2,307,500 tons, during which the Mediterranean, EU countries produced 2.83 times (70% of
world production) more oil than non-EU countries (24.7 % of world production). Table 4.1
presents production, import and export values of tons of olive oil in non-EU Mediterranean
basin countries during that period.

Environmental Impact Assessment ELARD
Olive Oil Residue Treatment Plant – Caza of Hasbaiya 18
Table 4.1. Production, Imports and Exports of Olive Oil of the non-EU Countries of the Mediterranean Basin (1998-1999) (RAC/CP)
Country Production (tons) Imports (tons) Export (tons)
Tunisia 150,000 - 95,000
Turkey 170,000 - 60,000
Syria 115,000 - 5,000
Morocco 65,000 - 20,000
Algeria 23,000 - -
Jordan 18,000 2,000 -
Libya 8,000 500 -
Lebanon 7,000 3,500 500
Israel1 4,000 3,000 -
Palestine2 3,500 1,000
Croatia 3,000 - -
Cyprus 1,500 500 -
Yugoslavia 1.0 - -
TOTAL 568,001 9,500 181,500
EU Total3 1,615,000 150,000 230,000
1 Occupied Palestinian Territory 2 Remaining territory of the Palestinian Authority 3 Total of 15 EU Countries
However, the reported production of olives in Lebanon varies amongst different
sources. The total production of olives was estimated to be around 68,000 tons in 1968 of
which 60,000 were pressed for oil with the remaining 8,000 used for consumption (Abdel
Sattar, 1968). FAO estimates for the years 1996 through 1999 ranged from 30,300 to 85,000
tons per year, while those of Medaware reported around 96,500 tons of olives produced
during 1995. Table 4.2 presents a summary of olive production estimates in Lebanon in tons
of olives per year for five production years between 1968 and 1999.
Table 4.2. Olive Production Estimates in Lebanon
Year Production (tons) Source
1968 68,000 Abdel Sattar, 1968
1995/96 96,475 Medaware, 1995
1996/97 85,000 FAO, 1997
1997/98 30,300 FAO, 1998
1998/99 66,400 FAO, 1999

Environmental Impact Assessment ELARD
Olive Oil Residue Treatment Plant – Caza of Hasbaiya 19
4.1.2 Olive Oil Sector Productivity
For comparison purposes, Table 4.3 presents a selection of olive oil producing
Mediterranean basin countries, the number of oil mills, production per year “efficiency” or
production per mill in each country. From the presented data, it can be observed that Spain,
which is one of the world’s largest exporters, has the highest ratio of 339 tons of oil per mill,
while Lebanon has the lowest ratio in this group of 11 tons/mill. Cyprus, a neighboring
country to Lebanon, produces 3,500 tons of olive oil with 32 mills, compared to Lebanon that
produces 7,000 tons with an estimated 650 mills. This difference can be attributed to many
factors; namely the relatively smaller size and capacity of mills in Lebanon, more traditional
ways of operation, private and individual ownership, lack of mass cultivation and mass oil
production as well as more geographically dispersed mills.
Table 4.3. Number of Olive Mills and Olive Oil Production in Some Mediterranean Basin Countries (RAC/CP)
Country Number of Olive Mills
(2000) Olive Oil Production
(tons) Production per
Mill
Albania 27 7,000 260
Cyprus 32 2,500 78
Greece 2,800 281,000 100
Italy 7,500 462,000 62
Lebanon 650 7,000 11
Spain 1,920 650,000 339
Turkey 1,141 75,000 66
Tunisia 1,209 168,750 140
TOTAL 15,279 1,653,250 1056
AVERAGE 1,910 206,656 132
4.1.3 Olive Tree Density
Olive tree plantations are characterized by spaciousness, plentiful sunlight, and little
water requirements. The density of olive trees per area varies according to individual
practices in different countries. Table 4.4 depicts the density of olive trees in several
Mediterranean basin countries, including Lebanon. From these data, it can be seen that the
density of olive oil producing trees in Lebanon has not changed in almost 30 years, from 1968
to 1997.

Environmental Impact Assessment ELARD
Olive Oil Residue Treatment Plant – Caza of Hasbaiya 20
Table 4.4. Density of Olive Oil Producing Trees in Some Mediterranean Countries (FAO 1983, FAO 1997, Abdel Sattar 1969)
Country Area
(1000 ha)
Olive Trees1
(1000 trees)
Density
(trees/ha) Year
France 30 3,800 130 1983
Egypt 2 100 50 1983
Greece 420 79,000 190 1983
Spain 2,300 180,000 78 1983
Turkey 1,200 59,000 49 1983
Tunisia 600 37,000 62 1983
Lebanon 26.5 5,300 200 1968
Lebanon 35 7,000 200 1997
1 Olive trees counted are those used only for oil production purposes 4.2. OLIVE MILLS
A total of 485 olive-oil mills were reported by FAO-MoIn (1999) in Lebanon. Table
4.5 shows the distribution of these mills across the Mohafazas and their percent of the total. It
must be noted that the number of mills in the North Mohafaza could have been overestimated
as a study done in the same year by the Regional Administration of the North reported only
180 mills.
Table 4.5. Oil Mill Distribution in Lebanon according to Mohafaza (FAO Moln 1999)
Mohafaza Number of Mills Percent of Total
Mount Lebanon 103 21.2
North 243 50.1
Bekaa 71 2.5
South 56 14.6
Nabatiyeh 12 11.6
Total 485 100.0
4.2.1 General Description of Olive oil Extraction Processes
4.2.1.1 Reception
This process is common to all mill types and consists of the preparation of olives for
milling. It can be done with the use of labor or machinery alike and mainly consists of:

Environmental Impact Assessment ELARD
Olive Oil Residue Treatment Plant – Caza of Hasbaiya 21
Cleaning and rinsing
Quality control of incoming olives with respect to weight, acidity, fat yield or others
Storage
4.2.1.2 Milling and Extraction
Olive milling or olive oil extraction involves three steps common to all mill types:
- Olives Milling: The milling process involves the grinding or physical crushing of
previously prepared olives. It is carried out with the use of stone mills
in a traditional mill type, or by means of hammers or disks in modern
installations. Additional passing through a mill-homogenizer with
blades or teeth can be performed.
- Beating: The milled olives are beaten to a paste or even mass at a suitable
temperature, until they are ready for extraction. During this process,
the milled paste is prepared to favour the separation of the oil.
- Extraction or Separation: The three phases of fat or oil, solid or pomace, and
vegetable or vegetation water divided. This process of extraction has
been enhanced throughout the years in order to reduce vegetable water
production.
4.2.2 Types of Olive Mills
4.2.2.1 Traditional
This method is based on extraction by pressure and is the oldest known. The olives are
milled in a stone mill after being cleaned, rinsed, and stored. The remaining material of solid
waste can be laid out on disks of filtering material, either fabric or plastic fibre, called
pressing mats. The mats are usually piled on top of each other in a wagon and rotated by a
central axis. This combination of wagon, mats, and needle axis is called the charge. This
charge is pressed by a hydraulic press generated by hydraulic pumps housed in a pump-box.

Environmental Impact Assessment ELARD
Olive Oil Residue Treatment Plant – Caza of Hasbaiya 22
4.2.2.2 Continuous Three-phase System
This system was introduced in the 70s, and replaced traditional pressing with horizontal
centrifuges, called “decanters,” which considerably improved the performance and
productivity of the oil mills. This new method presented several advantages over the previous
traditional press, by:
Simplifying mechanical procedures
Eliminating the need for mats
Decreasing labor requirements
Allowing continuous production
Decreasing the land surface area of the mill
This method of continuous extraction requires prior milling just as the traditional one.
After the milling is done with hammers or disks, the remaining paste is sent by pumps of
variable speed to a horizontal centrifuge where three phases are separated: the spent olives
also called three-phase spent olives, the oil and the vegetable water. Spent olives can be
further processed at olive-kernel plants to extract the remaining oil and obtain the olive-kernel
oil. The consumption of water in this system is notably higher than in other techniques and
can reach up to 130 liters of water per 100 kg of olives. This is one of the two major
disadvantages of this method, the second being the generation of a large amount of waste.
4.2.2.3 Continuous Two-phase System
The two disadvantages of the three-phase system led to the development of the two-
phase method, also called the “Ecologic” system. This method produces almost no vegetable
water, since it eliminates the addition of hot water to the “decanter.” Therefore as advantages,
it offers:
Saving water and energy
Reducing environmental impact
For the success of this process, modifications in the decanter are necessary to generate
two currents in the process: one containing oil and the other containing the majority of solids

Environmental Impact Assessment ELARD
Olive Oil Residue Treatment Plant – Caza of Hasbaiya 23
and all constituting water. Therefore, the second component is termed as moist spent olives
or two-phase spent olives. Further cleaning of the oil is required by an energetic process of
vertical centrifugation.
4.2.2.4 Comparison of Olive Mill Extraction Systems
Traditional extraction is considered a discontinuous system in comparison to the other
two. However, the continuous three-phase extraction system introduced the major
disadvantage of producing large quantities of vegetable water. The continuous two–phase
extraction system is a variant of the three-phase system, which generates relatively low
amouts of vegetable water. Table 4.6 presents the input and ouput of the materials and energy
in the three various systems presented herein (RAC/CP Regional Activity Center for Cleaner
Production).
Table 4.6. Input-Output Analysis of Material and Energy in the Three Extraction Systems for Production of Olive Oil
SYSTEM IN Quantity OUT Quantity
Olive 1Ton
Rinsing Water 100-200 Liters
Tra
ditio
nal
Ext
ract
ion
Energy 40-60 kWh
Oil
Spent Olives
Vegetable water
200 Kg
400-600 Kg
400-600 Liters
Olive 1Ton
Rinsing Water 100-120Liters
Water Added 700-1000Liters
Thr
ee-p
hase
Ext
ract
ion
Energy 90-117 kWh
Oil
Spent Olives
Vegetable Water
200 Kg
500-600 Kg
1000-1200 Liters
Olive 1 Ton
Rinsing water 100-120 Liters
Tw
o-ph
ase
Ext
ract
ion
Energy <90-117kWh
Oil
Spent Olives
Vegetable water
200 Kg
800 Kg
100-150 Liters

Environmental Impact Assessment ELARD
Olive Oil Residue Treatment Plant – Caza of Hasbaiya 24
4.3. OLIVE MILL RESIDUAL WASTE
Apart from the valuable olive oil to be further processed and marketed, the oil deriving
procedure yields several kinds of by-products:
4.3.1 Kinds of By-Products
4.3.1.1 Olive Cake
Olive cake can be also named as spent olives or pomace. It can be of three kinds
depending on the extraction process:
Crude olive cake; this is the residue of the first extraction of oil from whole olives by
pressure. It typically has a high water content of about 24% and oil content of 9%, which
causes it to degrade rapidly upon exposure to air.
Exhausted olive cake; this residue is generated after further oil extraction from the
crude olive cake. This procedure is usually done using a solvent such as hexane.
Partly de-stoned olive cake; this is the result of screening for pulp and stone
separation, and can be done before or after the second oil extraction. In the former case, it is
termed as “fatty” while in the latter as “de-fatted” or “exhausted.”
4.3.1.2 Olive Pulp
Olive pulp is obtained after the removal of the stones by screening and has a high water
content of 60%, which renders it very difficult to store.
4.3.1.3 Vegetable Water
Vegetable water or olive mill wastewater is the liquid residue, which has been separated
from the oil after pressing.
4.3.1.4 Leaves
These are obtained after the reception operations of cleaning and rinsing. This quantity
can reach up to 5% of the total weight of incoming raw olives.

Environmental Impact Assessment ELARD
Olive Oil Residue Treatment Plant – Caza of Hasbaiya 25
4.3.2 Residual Waste Characteristics
4.3.2.1 Olive Mill Wastewater or Vegetable Water
Olive mill wastewater or vegetable water is obtained from the water found in the olives
themselves as well as from the water used in washing and processing. Vegetable water
composition can vary, and mainly depends on the type of olives and the type of oil production
process. Typical olive mill wastewater is composed from about: 80 % water, 18 % organic
matter and 2 % mineral matter (Fiestas and Borja, 1990). The rather complex composition of
the organic portion of the wastewater contains greases, different proteins, carbohydrates,
organic acids, polyalcohols, pectines, tannins, glucosides, and polyphenols. The mineral
matter however, is made of carbonates, phosphates, sodium, and potassium as the major ions
(Moreno-Castilla et al., 2001). If compared with other organic wastes, olive mill wastewater
has similar organic matter content, but a high potassium concentration and notable levels of
nitrogen, phosphorus, calcium, magnesium, and iron (Paredes et al., 1999). Table 4.7
summarizes the main components found in vegetable waters.

Environmental Impact Assessment ELARD
Olive Oil Residue Treatment Plant – Caza of Hasbaiya 26
Table 4.7. Characteristics of Vegetable Water or Olive Mill Wastewater (RAC/CP, 2000)
Component Minimum Maximum
Suspended Solids 0.1 0.9
Total Solids 60 120
Mineral Solids 0.4 1.5
Organic Solids 2.6 12
Total Sugars 0.1 8
Organic Nitrogen 0.06 1.7
Organic Acids 0.2 1.0
Polyalcohols 0.3 1.8
Pectins, mucilages and tannins 0.2 1.3
Polyphenols 0.3 2.4
Polymers 0.5 1.5
Fat* 1.0 2.3
Phosphorus 100 1100
Potassium 1200 7200
Calcium 120 700
Manganese 50 400
Sodium 45 900
Iron 16 70
Carbonate 1000 3700
Sulfate 150 400
Chloride 100 300
Silicate 20 50
Zinc 200 430
Copper 68 110
* Latter values are in ppm, while former ones (inclusive) are in percent
Typically, the COD level varies from 80,000 to 200,000 mg/l (Robles, 2000), while
typical sewage water has a COD value of 400 mg/l (Lyberatos et al., 1997). Olive mill
wastewater also has high total solids (TS) content, which are a combination of TSS and TDS.
The TS content of a continuous system is almost twice that in the traditional system due to the
utilization of cloth bags during the pressing process (Tchobanoglous and Bortan, 1991). The
wastewater is characterized by its black-brownish color with the major components in the
colored fraction being substances of polymeric nature derived from several low molecular

Environmental Impact Assessment ELARD
Olive Oil Residue Treatment Plant – Caza of Hasbaiya 27
weights phenolic compounds, chemically related to lignin and humic acids (Saez et al., 1992).
Table 4.9 presents some characteristics of olive mill wastewater analyzed in various studies
(MoE, 2002).
4.3.2.2 Spent Olives or Olive Pomace
The solid waste portion generated during the operation of olive oil mills consists
primarily of conventional spent olives or pomace, originating from the pressing or continuous
three-phase systems and moist spent olives, coming from the two-phase system. The main
part of the solid residue also contains about 5% of residual oil, which is not possible to extract
physically. The composition of the olive mill solid residue depends on the mill pressing
system adopted. Usually, the pomace generated by a traditional pressing system has a higher
fat yield than the one generated by continuous or three-phase system, which is mainly due to
the efficiency of extraction of the former system. It is important to note that spent olives
resulting from the continuous two-phase system have the highest humidity amongst other
systems, and thus are the most difficult to treat or dispose of (RAC/CP, 2000). The major
characteristics of spent olive pomace are presented in Table 4.8.
Table 4.8. Spent Olives/Pomace Characteristics in a Continuous Mill (Paredes et al. 1999; MoE 2002)
Parameter Value
Dry matter 14.23-94.69
pH 4.85-5.87
Electric conductivity 1.53-9.03
Total organic compounds 31.08-63.21
Total nitrogen 0.60-2.73
Phosphorus 0.06-0.30
Potassium 0.78-3.10
Sodium 0.02-0.13
Calcium 0.51-10.22
Magnesium 0.09-0.67
Iron 394-12096
Copper 14-203
Manganese 19-288
Zinc 18-55

Environmental Impact Assessment ELARD
Olive Oil Residue Treatment Plant – Caza of Hasbaiya 28
Table 4.9. Major Characteristics of Olive Mill Wastewater (MoE, 2002)
Mill type Continuous Traditional
Value Range Minimum Maximum Typical Minimum Maximum Typical
pH 4 a 6.7 a 5.05 4 a 6.7 a 4.7
Total solids(TS) 600 a 1200 a 61.6 600 a 1200 a 44.4
Total suspended solids(TSS) 1 a 9 a 20.7 1 a 9 a 18
Volatile solids(VS) 34.5 b 77.9c 48.3 21.3 c 45.9 c 33.6
Volatile Suspended Solid (VSS)
10 b 29.5c 17.25 1.4 c 3.6 c 2.5
Chemical Oxygen Demand (COD)
45 a 170 a 78.85 45 a 170 a 127.5
Dissolved COD 52.5 b 52.5 b 52.5 NR NR NR
Biological Oxygen demand (BOD)
35 a 110 a NR 35 a 110 a NR
Total Organic Carbon (TOC) 436.1 d 534.51 d 500 NR NR NR
Carbohydrates 33.7 1 d 329.11 d NR NR NR NR
Lipids -1.1 c 113.71 d 6.0 6.3 c 26 c 10
Total Phenolic compounds 0.75 b 39.91 d 2.5 2.5 c 2.5 c 2.5
Total Phosphorus 0.6 d 3.2 d 1.9 d 0.045e 1.1 a 0.07
Total Nitrogen 0.02 c 11.3 d NR 0.01c 0.18f 0.04
a (Gonzales, 1994)/ b(Borja, 1995)/ c(Aktas, 2001)/ d(Paredes, 1999)/ e(Erguder, 2000)/ f(Ubay & Ozturk, 1997)/
NR Not Reported

Environmental Impact Assessment ELARD
Olive Oil Residue Treatment Plant – Caza of Hasbaiya 29
4.3.3 Treatment Methods
4.3.3.1 Olive Mill Wastewater
The wastewater produced during the oil production processes can be treated using
different individual methods, or more often a combination of two or more treatment
technologies. The subsequent sections provide a description of different treatment processes
(MoE, 2002).
4.3.3.1.1 Anaerobic Treatment
This treatment process involves anaerobic digestion by means of bacterial fermentation
processes. Substances such as proteins, fats, and carbohydrates are transformed into acids and
alcohols, which are intermediate products. This process can be carried out at 35°C, or
mesophilic conditions, or at 55°C or thermophilic conditions. The energy requirements for
each process differ due to heating conditions. Anaerobic degradation is compromised by the
high BOD load of olive mill wastewater; the presence of aromatic compounds particularly
phenols, a low pH and a high carbon to nitrogen or C/N ratio. Usually dilution with either
sewage or plain water is carried out. Anaerobic digestion produces valuable methane gas,
which can be extracted and used for energy recovery.
4.3.3.1.2 Aerobic Treatment
This process involves biological degradation by means of aerobic or oxygen consuming
microorganisms, which can be fixed or suspended. The process itself can be continuous or
discontinuous. This renders at least four different types of aerobic treatment systems.
Clarification of the treated water is carried out afterwards in order to further clean the
effluent. Resulting sludge is usually used in land enrichment and agricultural practices.
4.3.3.1.3 Evaporation
This process involves the heating up of the olive mill wastewater to evaporate all the
water present in it, and the subsequent treatment of the remaining sludge through thermal and
biological processes. The BOD removal rate for this process ranges from 30 to 50 percent.
However, the high investment costs involved, in addition to atmospheric emissions and
filtering requirements have been discouraging for the use of this process.

Environmental Impact Assessment ELARD
Olive Oil Residue Treatment Plant – Caza of Hasbaiya 30
4.3.3.1.4 Composting
Composting is a controlled bio-oxidative process carried out by the action of
microorganisms, which generates carbon dioxide, water, minerals and a stabilized organic
matter as by-products. This will permit the return of organic nutrients to their natural cycle in
the olive orchard ecosystems and will improve the quality of olieculture land.
4.3.3.1.5 Irrigation
The high organic content of the olive mill wastewater makes it attractive for
consideration as a source for agricultural irrigation. However, this usage poses the risk of soil
salinization and toxicity due to phenolic compounds.
4.3.3.1.6 Centrifugation & Filtration
This process involves the filtration of the wastewater through its own solid residues that
settle down, and in turn provide a medium for biodegradation of nutrients. Biofiltration plants
eliminate about 100 percent of solids and 70 to 80 percent of dissolved organic compounds.
4.3.3.1.7 Lime Treatment
In this process, lime serves to remove a large portion of the fatty compounds present in
the wastewater, which can facilitate further evaporation or treatment. Additionally, lime
removes the highly phytotoxic compounds from the wastewater, thus making the wastewater
favorable for irrigation.
4.3.3.1.8 Damp Oxidation
This treatment process involves the oxidation of organic compounds in a liquid phase
with the use of an oxidizing agent (typically oxygen or hydrogen peroxide) into carbon
dioxide and water products. This treatment requires little space and provides good removal
efficiency rendering the effluent dischargeable into streams and rivers without additional
treatment.
4.3.3.1.9 Membrane Treatment
Membrane treatment involves processes such as ultra-filtering and reverse osmosis. It
allows the elimination of pollutants from water by generating two currents: clean water that
can be discharged directly into streams, and a high-concentration current of pollutants.

Environmental Impact Assessment ELARD
Olive Oil Residue Treatment Plant – Caza of Hasbaiya 31
4.3.3.2 Spent Olive Pomace
The spent olives or pomace is usually regarded as a valuable product with multi-uses
rather than a waste that needs treatment. Various ways in which pomace can be utilized or
treated are presented below (MoE, 2002).
4.3.3.2.1 Oil Extraction
Pomace has a residual oil content ranging between 4 and 8 percent with a typical value
of 5%. Oil is characteristically extracted through the use of solvents such as hexane, similarly
to the extraction of seed oil. Any left over fibrous material from secondary extraction is
commercially valued as fuel for pottery kilns owing to its steady burning properties and high
heat output or can be disposed of by burning or composting.
4.3.3.2.2 Usage as Fuel
The calorific values of olive mill pomace depends on the oil and moisture content and
ranges 2,800 and 3,500 kcal per kilogram. It requires drying in large central facilities prior to
its usage as fuel. It produces a high amount of gases that need to be regulated and usually
needs to be of a large size; that is enough to justify its capital costs. This process results in
solid residues made up inert of ashes and slags, which can be used in the manufacture of
cement.
4.3.3.2.3 Usage for Water Treatment
There is a potential for the use of processed pomace to treat drinking water containing
several heavy metals in trace concentration. However, this usage is still in an experimental
stage and indicates a promising cost reducing method for heavy metal (specifically lead and
zinc) removal.
4.3.3.2.4 Usage as Foodstuff
Spent olives possess a high nutritional value, which allows them to be used as foodstuff
for cattle. However, they are known to rapidly degrade by fermentation and to possess an
unattractive taste. In this respect, ensilage techniques have been carried out in piles with fresh
spent olives, not more than 7 days old, covered by plastic sheets. The absence of molds,
color, smell, and bacteria has been proven.

Environmental Impact Assessment ELARD
Olive Oil Residue Treatment Plant – Caza of Hasbaiya 32
4.3.3.2.5 Composting
Composting is a very efficient method of dealing with spent olive pomace. It is a
controlled bio-oxidative process carried out by the action of microorganisms, which generates
carbon dioxide, water, minerals and a stabilized organic matter as by-products. The compost
is known to be of excellent quality since it is free from phytotoxic and pathogenic compounds
and rich in humus. The addition of vegetable and earthy residues coming from olive
cleansing is also recommended.

Environmental Impact Assessment ELARD
Olive Oil Residue Treatment Plant – Caza of Hasbaiya 33
5. DESCRIPTION OF THE PROJECT
5.1. DESCRIPTION OF THE INFLUENT WASTEWATER
The six Olive Oil Residue Treatment Plants (OORTPs) in the Hasbaya Caza are to be
located at the outskirts of each of the seven villages which are planned to be served, namely;
Ain Jarfa, Ain Qenia, Kaoukaba, Kfeir and Khalouat, Mimes and Rachaiya el Foukhar. It is
noteworthy to mention that the villages of Kfeir and Khalouat will have a common OORTP.
Table 5.1 presents the number of olive mills generating the influent wastewater and the total
amount of wastewater to be treated for each village.
Table 5.1. Contribution from Villages Mills to the Total Inflow of Raw Olive Mill Wastewater to each OORTP
Municipality
Number of Mills Available and Average Olive Wastewater Generation per Mill
(m3/day)
Total Inflow of Raw Olive
Wastewater
(m3/day)
Ain Jarfa Draibi Mill
6.67
Ain Jarfa Mill
5.33 12.00
Ain Qenia Hadaifi S Mill
3.33
Hdaifi A Mill
2.13
Bou Rafeh Mill
1.33 6.80
Kaoukaba Zweihed Mill
13.33
Obeid Mill
2.00
Matta Mill
15.00 30.33
Kfeir Khalouat Two olive mills 5.33
Mimes Two olive mills 7.00
Rachaiya el Foukhar Zweihed Mill
2.67
Maalouf Mill
4.20
Esper Mill
2.67 9.53
Domestic raw wastewater can be described in general as weak, medium or strong
according to contaminant loads. This wastewater characterization, which is depicted in Table
5.2, readily affects the type and efficiency of treatment processes. Olive mill wastewater, on
the other hand, differs in chemical characteristics from domestic sewage. It is generally
characterized by a much higher BOD load, lower pH levels, high oil content (which is a major
explanation for high BOD load), high C/N ratio, high phenol content and lower SS levels.

Environmental Impact Assessment ELARD
Olive Oil Residue Treatment Plant – Caza of Hasbaiya 34
Therefore, compared to the raw domestic wastewater, olive mill wastewater is categorized as
strong.
Table 5.2. Characterization of Domestic Raw Wastewater
Parameter Weak Medium Strong
BOD5 (mg/l) 110 220 400
TSS (mg/l) 100 200 350
Ntotal (mg/l) 20 40 85
P (mg/l) 4 8 15
Source: Journey, W.K.
The chemical characteristics of olive mill wastewater can be obtained from actual
sampling and chemical analysis done by Team International for the Ministry of Environment
(Final Draft Report for Olive Pressing, 2002). Samples were collected from olive mill
wastewater storage tanks or directly from wastewater flow before discharge into the
environment. Due to the chemical variability of OMW, these samples were collected from
four typical olive mills and analyzed for physio-chemical features as summarized in
Table 5.3.
Table 5.4 provides a comparison of the measured chemical parameter values to those
reported in literature. The comparison shows a consistency of the measurements with
reported values. The expected pH range is acceptable and varies between a minimum of 4.96
and maximum of 5.17. The highest measured BOD was found to be around 51,000 mg/L,
which amounts to less than half the highest reported BOD value or 110,000 mg/L. This is a
positive indication that the removal efficiency of BOD may well exceed the expected values,
especially that all OORTPs in the Hasbaya area are designed for a higher load of 100,000
mg/L BOD.

Environmental Impact Assessment ELARD
Olive Oil Residue Treatment Plant – Caza of Hasbaiya 35
Table 5.3. Olive Mill Wastewater Characterization (MoE, 2002)
Parameter Mill 1 Mill 2 Mill 3 Mill 4
pH1 4.96 5.08 5.18 5.17
Conductivity (mS)1 6.92 10.32 11.67 7.65
Total Suspended Solids (g/l)2 49 1.8 32 14.4
Total Dissolved Solids (g/l)1 3.42 5.13 5.88 3.84
Total Volatile Suspended Solids (g/l)3 48 1.8 29.3 14.2
Biological Oxygen Demand (mg/l)1 41,236 45,829 51,052 NR
Chemical Oxygen Demand (mg/l)1 71,850 67,838 148,450 110,000
1 Analyzed by Electrometry 2 Analyzed by Colorimetry 3 Analyzed by pre-weighing and evaporation NR Not reported due to delays in analysis or uncertainty due to high dilution
Table 5.4. Consistency of Measured and Reported Values of OMW Chemical Composition (MoE, 2002)
Reported Values Measured Values
Parameter Minimum Maximum Minimum Maximum
pH 4 6.7 4.96 5.18
Conductivity (mS) 4 16 6.92 11.67
Total Suspended Solids (g/l) 1 102.5 1.8 49
Total Dissolved Solids (g/l) 16.98 80.35 3.42 5.88
Total Volatile Suspended Solids (g/l) 7.2 81.6 1.8 48
Biological Oxygen Demand (mg/l) 35,000 110,000 41,236 51,052
Chemical Oxygen Demand (mg/l) 45,000 170,000 67,838 148,450
5.2. GENERAL DESCRIPTION OF THE PLANT
In general, the proposed OORTPs in the Hasbaiya area employ typical secondary
biological wastewater treatment schemes. However, five of the planned OORTP have special
considerations and corresponding effluent treatment require advanced levels; the Kaoukaba
OORTP is presented as the only site that does not require tertiary treatment levels.
For vegetable water, the major objective of biological treatment is to reduce the high
BOD (Biochemical Oxygen Demand), increase the low pH, decrease the phenol compounds,
coagulate “non-settleable” colloidal solids, and stabilize organic matter. The six OORTPs
Environmental Impact Assessment ELARD
Olive Oil Residue Treatment Plant – Caza of Hasbaiya 36
employ both aerobic and anaerobic suspended growth biological treatment processes by using
the Upflow Anaerobic Sludge Blanket (UASB) technology followed by aerobic Extended
Aeration Activated Sludge (EAAS) technology. Tertiary treatment (required for all OORTPs
except Kaoukaba), in the form of dual media filtration additional disinfection and use of
activated carbon, will further reduce the BOD load and suspended solids level.
5.3. PROCESS THEORY
The treatment of olive oil liquid residue depends on natural processes such as gravity to
clarify an effluent or microorganisms to digest the biodegradable organic content. Pathogens
are removed through natural die-off and competition, through providing adequate detention
time and temperature, or through chlorination. Basic mechanisms include preliminary and
primary treatment through screening, sedimentation, and filtration. Secondary treatment
relies on the digestion of the biodegradable organic content of vegetable water (80% of
BOD5) by aerobic and anaerobic microorganisms. Advanced tertiary treatment includes
further treatment of the effluent in the case of sensitive receiving waters and high-risk
environmental damage. It includes advanced processes such as advanced disinfection,
activated carbon adsorption, and media filtration. The level of treatment of influent also
depends on its nature. Table 5.5 summarizes the uses and characteristics of the stages of
vegetable water treatment.

Environmental Impact Assessment ELARD
Olive Oil Residue Treatment Plant – Caza of Hasbaiya 37
Table 5.5. Description of Vegetable Water Treatment Stages
Preliminary treatment
Primary treatment
Secondary treatment: Aerobic Suspended Growth
Secondary treatment: Anaerobic Suspended Growth
Tertiary treatment (Filtration+ disinfection)
Unit operations & processes involved
Screening
Grit removal
Grease removal
Primary clarifier
Storage/equalization tank
Suspended growth aerobic biological reactor: Conventional or extended aeration activated sludge system
Final clarifier
Suspended growth anaerobic biological reactor: UASB reactors Final clarifier
UASB+ Extended Aeration Activated Sludge
Filter media Contact tanks
Principal application Removal of large objects
Removal of heavy objects: sand, leaves, twigs, gravel, cinder, etc.
Removal of settleable solids and BOD
Removal of fine non-settleable solids, considerable BOD, some NH3 & total phosphorus
Removal of fine non-settleable solids, BOD, little NH3 & total phosphorus
Further removal of suspended solids when necessary BOD removal
Land requirements Minimum Moderate Moderate Moderate Moderate
Adverse climatic conditions - - Decreased microbial activity
Freezing of piping and valves
Low temperatures (<20ºC) reduce microbial activity
Freezing of piping and valves
-
Ability to handle flow variations
Good Fair Good Good Good
Ability to handle influent quality variation
Good Good Good Fair Poor
Industrial pollutants affecting process
Minimum Minimum Moderate Moderate Moderate
Ease of O&M Fair Good Moderate Good Moderate
Reliability of the process Good Good Good Good Fair

Environmental Impact Assessment ELARD
Olive Oil Residue Treatment Plant – Caza of Hasbaiya 38
5.3.1 Anaerobic Biological Treatment Processes
Anaerobic treatment is the use of biological organisms to degrade or stabilize organic
(carbonaceous) material in the absence of oxygen into methane gas (CH4) and inorganic
products such as carbon dioxide (CO2), orthophosphate (ortho-PO4-3), hydrogen sulfide gas
(H2S), nitrogen gas (N2), and ammonia (NH3). This process also produces an anaerobic
biomass as is demonstrated by sludge formation.
Initially, anaerobic treatment was used for the treatment of sludge produced by aerobic
treatment as well as meatpacking wastes. Today however, it is being used by high strength
organic wastes because of its potential for producing energy (methane gas) and lower sludge
growth rate.
Anaerobic treatment tends to remove a major portion of the BOD from liquid waste, but
considerable nitrogenous oxygen demand remains. Although some anaerobic processes may
require mechanical mixing, relatively simple technologies exist making them suitable for
regions with limited resources. Depending on the characteristics of the liquid to be treated,
anaerobic secondary treatment can achieve 65-85% removal of BOD5 at 20ºC, and 60-80%
removal of SS (Journey, W.K.). With anaerobic treatment of vegetable water, the reduction
of BOD is relatively lower, but energy input and sludge production is considerably lower.
Hence, anaerobic treatment is preferred in developing countries with limited resources when
the conditions suitable for anaerobic activity are present.
Optimum anaerobic activity takes place at a pH range of 7-8 (Corbit, 1998), while the
optimum nutrient ratio for anaerobic activity is a COD:P:N of 100:1:0.2. This ratio
demonstrates the lower requirement of anaerobic microorganisms for nitrogen. Anaerobic
digestion also requires the presence of other nutrients such as sulfur, iron, calcium,
magnesium, sodium, potassium. Higher levels of these nutrients however may lead to toxicity
and therefore hinder the treatment process (Table 5.6). As for temperature requirements,
generally, the higher the reactor temperature, the higher the rate of substrate removal and cell
decay. Usually, anaerobic reactors should be operated at a mesophyllic range: 25 – 40�C or
thermophyllic range: 50-70�C.

Environmental Impact Assessment ELARD
Olive Oil Residue Treatment Plant – Caza of Hasbaiya 39
Table 5.6. Inhibition Concentrations of Various Ions
Species Stimulatory (mg/L)
Moderate (mg/L)
Strongly Inhibitory (mg/L)
Sodium 200 – 100 5500 - 3500 8000
Potassium 400 – 200 4500 – 2500 12000
Calcium 200 – 100 4500 – 2500 8000
Magnesium 150 – 75 1500 – 1000 3000
Ammonia - 3000 – 1500 3000
Hydrogen sulfide - - 300 - 200
Source: Corbitt, 1998
5.3.1.1 Anaerobic Reactor Types
Anaerobic reactors may be classified as “suspended growth” when the bacteria are
suspended in the reactor, or “attached film” when the bacteria are attached as dense films to
solid media inside the reactor. Both types may also be categorized according to the rate of
anaerobic activity into high rate or low rate reactors (Table 5.7). Low rate reactors, such as
septic tanks, are used for single households or small groups of houses where no wastewater
collection system exists. High rate suspended growth reactors are used to treat industrial
(food industries) wastewater or mixtures of industrial wastewater and domestic. Examples
include the Anaerobic Contact Reactor (ACR) and the Upflow Anaerobic Sludge Blanket
(UASB). High rate attached film reactors use a granular solid medium as a carrier. Though
this type of reactor has more efficient COD removal rates, it has not been proven that its use
with municipal wastes is as effective as the high rate suspended growth reactor type. As
Table 5.7 indicates, the high rate suspended growth anaerobic treatment reactor would be the
most appropriate to use in the given situation.

Environmental Impact Assessment ELARD
Olive Oil Residue Treatment Plant – Caza of Hasbaiya 40
Table 5.7. Summary of Anaerobic Reactor Types
Anaerobic Reactor
Type Description Removal Efficiency
Operation & Maintenance
Requirements Usage Ex.
Low Rate Reactor
Low rate of anaerobic digestion
High SS: 90 – 98 % Low BOD: 40 – 60 % Retention Time: few days
Low
- In the absence of wastewater collection network used with single households or a group of few houses.
Septic Tank
High Rate Suspended Growth
High rate of anaerobic digestion Microorganisms are suspended in reactor fluid
High SS (>90%) High BOD5 removal Moderate
- Food Processing Industry wastewater - Combined food processing industry wastewater with municipal sewage - Sustainable - Appropriate for areas with limited resources
UASB ACR
High Rate Attached Growth
High rate of anaerobic digestion Microorganisms grow attached to a solid media in reactor
High SS Highest BOD5 removal
High: Requires sophisticated feed inlets, high rates of effluent recycle,
- Not appropriate to treat municipal sewage of areas with limited resources
Expanded Fluidized
5.3.1.2 High Rate Suspended Growth Anaerobic Reactors
This section will describe the two types of high rate suspended anaerobic reactors: the
Upflow Anaerobic Sludge Blanket (UASB) and the Anaerobic Contact Reactor (ACR).
The UASB process is a high-rate anaerobic suspended growth biological treatment
process. Since this treatment process is biological, it is based on the metabolic reactions of
microorganisms, which in the absence of oxygen; convert the suspended and dissolved
organic load into methane gas and carbon dioxide. The organic matter in the vegetable water
remains in suspension due to the upward flow of influent into the reactor. However, these
“flocs” of suspended organisms tend to settle the moderate upflow velocities forming the
sludge. The organic load is trapped under a “sludge blanket” where it is slowly digested. The
liquid fraction of the influent passes through the suspended “sludge blanket” at a higher rate
and is collected in gutters at the tope of the reactor (Figure 5.1).

Environmental Impact Assessment ELARD
Olive Oil Residue Treatment Plant – Caza of Hasbaiya 41
Figure 5.1. Schematic Diagram of a UASB Reactor
The ACR is the anaerobic analogue of the aerobic activated sludge process. It is widely
used with industrial wastewater especially that of the food processing industry with high
suspended solids load, rather than with municipal wastewater due to the relatively low organic
content of such wastewater. Lower BODs necessitate a larger volume for the reactor to
satisfy the necessary solids retention time. Similar to the activated sludge process, the reactor
utilizes mechanical mixing of the substrate to maintain the microorganisms’ suspended state
as well as recycling of the recovered sludge into the reactor (Figure 5.2). Therefore, ACRs
have higher requirements for energy input.

Environmental Impact Assessment ELARD
Olive Oil Residue Treatment Plant – Caza of Hasbaiya 42
Figure 5.2. Schematic Diagram of an ACR
To compare, UASB reactors can be used with high strength and medium/low strength
wastewater from industries such as distilleries, food processing units, tanneries, as well as
municipal sewage. On the other hand, ACRs are more commonly used with food industry
wastewater rather than domestic wastes. Additionally, using UASB reactors reduces the
electric power consumption of a plant when compared to ACRs. In addition, UASB reactors
are easier to operate and maintain. Therefore, in regions with limited economic resources,
UASB reactors constitute a more viable option.
5.3.2 Aerobic Biological Treatment Processes
The aerobic biological treatment process relies on the activity of microorganisms to
digest the biodegradable organic content of vegetable water in the presence of oxygen to
release carbon monoxide and gas. Similar to anaerobic treatment aerobic treatment may be
classified as suspended growth type (activated sludge, aerobic ponds, rotating biologic
contractors) or as fixed growth type (trickling filters).
Unlike anaerobic treatment, aerobic treatment of liquid waste typically requires energy
for aeration and produces a higher sludge growth rate. However, aerobic digestion reduces
the COD content of the effluent (Figure 5.3).

Environmental Impact Assessment ELARD
Olive Oil Residue Treatment Plant – Caza of Hasbaiya 43
Figure 5.3. Comparison between Aerobic and Anaerobic Biological Treatment (Journey, W.K.)
5.3.2.1 Aerobic Reactor Types
Similar to anaerobic treatment, the secondary treatment of liquid olive oil residue by
aerobic processes may be classified according to the type of reactor used: suspended growth
reactors or attached growth reactors. Table 5.8 and Table 5.9 give a detailed comparison of
both types of aerobic reactors.

Environmental Impact Assessment ELARD
Olive Oil Residue Treatment Plant – Caza of Hasbaiya 44
Table 5.8. Comparison of Aerobic Suspended Growth and Attached Growth Reactors
Aerobic Suspended Growth
Aerobic Attached Growth
Unit operations & processes involved
Suspended growth aerobic biological reactor: Conventional or extended aeration activated sludge system Final clarifier
Attached growth aerobic biological reactor: high-rate trickling filters
Final clarifier
Principal application Removal of fine non-settleable solids, BOD, some NH3 & total phosphorus
Removal of fine non-settleable solids, BOD, some NH3 & total phosphorus
Land requirements Moderate Maximum
Adverse climatic conditions Decreased microbial activity
Freezing of piping and valves
Decreased microbial activity
Freezing of piping and valves
Ability to handle flow variations
Good Good
Ability to handle influent quality variation
Good Fair
Industrial pollutants affecting process
Moderate Moderate
Ease of O&M Good Good
Reliability of the process Good Good
Table 5.9. Comparison of the Waste Products of Aerobic Reactors
Aerobic Suspended Growth
Aerobic Attached Growth
Waste products Sludge (biomass) for conventional; Stabilized and reduced sludge (biomass) for EAAS
Sludge (biomass)
BOD5 80-85 (conventional); 80-95 (EAAS)
60-80
COD 80-85 (conventional); 80-90 (EAAS)
60-80
TSS 80-90 (conventional); 70-90 (EAAS)
60-85
TP 10-25 (conventional); 10-15 (EAAS)
8-12
Typ
ical
rem
oval
eff
icie
ncie
s (%
)
ON 60-85 (conventional); 75-85 (EAAS)
60-80

Environmental Impact Assessment ELARD
Olive Oil Residue Treatment Plant – Caza of Hasbaiya 45
5.3.2.2 Activated Sludge (Suspended Growth) Aerobic Reactors
The activated sludge process is an aerobic, suspended growth, biological treatment
method. Suspended growth processes aim at maintaining an adequate biological mass in
suspension within a reactor, by employing either natural or mechanical mixing. The process
is based on the metabolic reactions of microorganisms to produce a high quality effluent by
converting and removing soluble organic matter that exerts an oxygen demand. A clear
effluent, low in suspended solids, is produced due to the flocculent nature of the biomass. A
critical requirement in activated sludge systems is the need of oxygen to stabilize the waste.
Four factors are common to all activated sludge systems: (1) a flocculent slurry of
microorganisms, also termed Mixed Liquor Suspended Solids (MLSS), in the bioreactor; (2)
quiescent settling in the clarifier; (3) activated sludge recycling from the clarifier back to the
bioreactor; and (4) excess sludge wasting to control the Solids Retention Time (SRT). The
activated sludge process is by far the most widely used biological treatment process for
reducing the concentration of dissolved and colloidal carbonaceous organic matter in
wastewater.
The extended aeration activated sludge (EAAS) process is a variation of the
conventional activated sludge process. It is a completely mixed process operating at a long
hydraulic detention time (18-36 hrs) and a long SRT (20-30 days). Long SRT offers two
benefits: remarkably reduced production of stabilized sludge, and greater process stability.
However, oxygen requirements are higher for extended aeration activated sludge systems.
The system is very robust, stable, and simple to operate, thus rendering it extremely suitable
for smaller communities. Note that, while in this case, the influent originates from an
industrial process which theoretically does not present bacteriological risks, as opposed to
domestic wastewater, it is recommended to have a disinfection system following the extended
aeration treatment in order to remove excess bacteria which also exert some BOD load.
Figure 5.4 depicts a flow diagram for the complete-mix modification of the activated sludge
process.

Environmental Impact Assessment ELARD
Olive Oil Residue Treatment Plant – Caza of Hasbaiya 46
Figure 5.4. Flow Diagram for the Complete-Mix Activated Sludge Process
5.4. ANALYSIS OF ALTERNATIVES
5.4.1 Process Selection
Selection of the most appropriate solution to meet a certain long-term objective is not a
simple and straightforward task. Several factors must be taken into consideration, including
technical criteria, environmental considerations, and economic observations. The aim of this
section is to weigh the potential of all relevant alternatives concerning the treatment process,
the system selection, and the site location for each OORTP. As a result, a sustainable solution
can be implemented to treat the olive oil residue problem in the Hasbaya area. Since the
current situation in all Hasbaya villages is not desirable, the “Do Nothing” scenario is not
considered a legitimate option. In the context of analysis of alternatives, six alternative olive
oil residue treatment schemes were screened. Table 5.10 provides a comparison of the
different scenarios. The process alternatives are:
Alternative 1: Preliminary treatment
Alternative 2: Primary treatment alone
Alternative 3: Secondary aerobic biological treatment through suspended growth
process (EAAS)
Alternative 4: Secondary anaerobic biological treatment through suspended growth
process (UASB)
Alternative 5: Secondary biological treatment through combined aerobic suspended
and anaerobic suspended growth processes (UASB + EAAS)
Alternative 6: Alternative 5 with additional tertiary treatment (UASB + EAAS +
disinfection + filtration + activated carbon)

Environmental Impact Assessment ELARD
Olive Oil Residue Treatment Plant – Caza of Hasbaiya 47
Table 5.10. Analysis of Different Scenarios of Olive Oil Residue Treatment Schemes
Preliminary treatment
1
Primary treatment
2
Secondary Aerobic Suspended
Growth 3
Secondary Anaerobic Suspended
Growth 4
Secondary Combined Anaerobic and
Aerobic Suspended Growth
5
Combined Secondary with Tertiary
(filtration disinfection)
6
Unit operations & processes involved
Screening
Grit removal Primary clarifier
EAAS+ Final clarifier UASB
+ Final clarifier
UASB + EAAS + Final clarifier
UASB+ EAAS+ Final Clarifier+ Filter media + Contact tanks
Principal application Removal of large objects
Removal of heavy objects: sand, gravel, cinder, etc.
Removal of settleable solids and little BOD
Removal of fine non-settleable solids, BOD, some NH3 & total phosphorus
Removal of fine non-settleable solids,BOD, with lower sludge production
Removal of fine non-settleable solids, BOD, with lower sludge production followed by NH3 & total phosphorus removal. Further removal of suspended solids
Removal of fine non-settleable solids, BOD, with lower sludge production followed by NH3 & total phosphorus removal. Further removal of suspended solids and harmful pathogens
Land requirements Minimum Moderate Moderate / High Moderate Moderate Moderate
Adverse climatic conditions
- - Decreased microbial activity Freezing of piping and valves
Considerable reduction in anaerobic activity
Considerable reduction in microbial (esp. anaerobic) activity Freezing of piping and valves
Decreased microbial activity in UASB Freezing of piping and valves
Ability to handle flow variations
Good Fair Fair / Good Good Good Good
Ability to handle influent quality variation
Good Good Good Fair Good Fair
Industrial pollutants affecting process
Minimum Minimum Moderate Moderate Moderate Moderate
Ease of O&M Fair Good Good / Fair Good Moderate Fair
Reliability of the process Good Good Good Good (>20ºC) High High

Environmental Impact Assessment ELARD
Olive Oil Residue Treatment Plant – Caza of Hasbaiya 48
Table 5.11. Analysis of the Waste Products of Different Olive Oil Residue Treatment Schemes Alternative
1 Alternative
2 Alternative
3 Alternative
4 Alternative
5 Alternative
6
Waste products Screenings and grit
Sludge (organic & inorganic)
Sludge (biomass) for activated sludge; Stabilized and reduced sludge (biomass) for EAAS
Reduced / Stabilized Sludge (biomass) Methane Gas (can be used as energy)
Reduced Sludge, CH4 (UASB), Sludge (EAAS) Filter backwash waste
Reduced Sludge and CH4 (UASB), Sludge (conv) Filter backwash waste
BOD5 Small 30-40 80-95 (EAAS) 75-85 @ 25-30 ºC 75-85 @ 25-30 ºC (UASB)
80-95 (EAAS)
75-85 @ 25-30 ºC (UASB)
80-95 (EAAS) 20-60 (tertiary)
COD Small 30-40 80-90 (EAAS) 60-70 @ 25-30 ºC 60-70 @ 25-30 ºC (UASB) 80-90 (EAAS)
60-70 @ 25-30 ºC (UASB) 80-90 (EAAS) 0-50 (tertiary)
TSS Small 50-65 70-90 (EAAS) 60 - 85 60-85 (UASB) 70-90 (EAAS)
60-85 (UASB)
70-90 (EAAS) 60-80 (tertiary)
TP Small 10-20 10-15 (EAAS) low 10-15 (EAAS) 10-15 (EAAS) 20-50 (tertiary)
ON Small 20-40 75-85 (EAAS) 75 – 90 reduced to NH4
+ 75-85 (EAAS) 75-85 (EAAS)
50-70 (tertiary)
Typ
ical
rem
oval
eff
icie
ncie
s (%
)
NH3-N Small 0 High removals depending on operational criteria (DO, BOD/TKN, temperature, alkalinity and pH, MLSS / MLVSS, return sludge rate, sludge wasting). 85-95 (EAAS)
low High removals in aeration following anaerobic reduction of ON into NH3 No additional removal by filtration
High removal in aerobic following anaerobic reduction of ON into NH3 with minimal removal by filtration.

Environmental Impact Assessment ELARD
Olive Oil Residue Treatment Plant – Caza of Hasbaiya 49
The disadvantage of a system with only preliminary and/or primary treatment options is
that contaminant removal, in particularly organic, is relatively limited. When protection of
the environment is an issue, a treatment system should include at a minimum secondary
treatment. Therefore, both alternatives 1 and 2 would not be sufficient to treat the olive mill
wastewater of the villages in Hasbaya to acceptable water quality levels. Tertiary treatment
can be considered as an additional option; however, its inclusion has to be operationally and
financially or even environmentally justifiable as in the case of eachplant.
In general, as long as effluents are properly managed, a secondary treatment based on
suspended growth activated sludge is a reliable process that produces acceptable levels of
wastewater treatment. Alternative 3 consists of utilizing secondary treatment through aerobic
suspended growth. Although both conventional and extended activated sludge processes
could be used, the extended aeration activate sludge treatment was selected for the following
reasons:
♦ Simpler design and operation;
♦ Provision of equalization to absorb sudden/temporary shock loads (hydraulic and
Biological);
♦ High quality and well nitrified effluent meeting secondary effluent guidelines;
♦ Lowest sludge production of any activated-sludge process;
♦ Organically stable waste sludge;
♦ Exists in flexible pre-engineered package plants for small communities;
♦ Favorable reliability with sufficient operator attention;
♦ Nitrification likely at wastewater temperatures of more than 15oC with addition of
chemicals;
♦ Relatively minimal land requirements and low initial costs;
♦ No need for primary clarification of wastewater.
♦ Simple filtration and disinfection processes to reach tertiary treatment.

Environmental Impact Assessment ELARD
Olive Oil Residue Treatment Plant – Caza of Hasbaiya 50
Alternative 3 consists of establishing aerobic secondary treatment (EAAS). When
compared with alternative 4 (anaerobic secondary suspended growth), both processes seem to
have drawbacks and benefits.
The use of UASB reactors (Alternative 4), has several advantages over the utilizing
EAAS (Alternative 3):
♦ UASB reactors are simpler to build, operate, and have lower capital and operating
costs.
♦ In UASBs, digestion is passive and needs little to no energy input.
♦ Anaerobic systems (UASB) can withstand load variations better than aerobic
systems.
♦ Large diurnal flows and even temporary shutdown would not affect anaerobic
processes (UASBs) to the same extent as aerobic.
♦ UASBs produce lower amounts of residual sludge in a stabilized state that is easy
to dewater.
♦ Anaerobic reactors, like UASBs, can be operated by less skilled employees than
aerated activated sludge systems.
On the other hand, secondary treatment of wastewater through aerobic activated sludge
(Alternative 3) is free of the limitations of UASB reactors (Alternative 4). UASB reactors,
like all aerobic treatment function best at temperatures above 25º C. Areas with average
temperature below 20º C would not benefit from such a technology:
♦ UASB reactors would require a longer start-up time when compared to activated
sludge reactors, due to the slow growth rate of anaerobic microorganisms.
♦ UASB reactors can cause more odor problems than activated sludge treatment
mainly due to the reduction of sulfur compounds to H2S
♦ Anaerobic digestion in UASBs is more sensitive to high concentrations of metals.
♦ UASB reactors and piping of anaerobic treatment should be built with corrosion
resistant material (plastics and masonry coating).

Environmental Impact Assessment ELARD
Olive Oil Residue Treatment Plant – Caza of Hasbaiya 51
A normal functioning UASB reactor can remove an average of 65% COD, 80% BOD5
and 75% SS (Table 5.11). Although Alternative 4 seems ideal in that it is used for wastewater
and is easily operated, temperature restrictions might hinder the total effectiveness of this
system. However, combining Alternatives 3 and 4 (Alternative 5) would minimize the
drawbacks of both alternatives and maximize their benefits.
A study aiming at investigating the potential for biological treatment of green olive
wastewater evaluated the performance of a separate anaerobic, aerobic and a combined
anaerobic-aerobic process. The aerobic process was found to be more efficient in removing
organic matter (up to 76%) and to have almost no effect on phenolic compounds, while the
anaerobic process had the opposite effect, thus reducing polyphenols by 12% and organic
matter by almost 50% (Table 5.12). The combination of both processes in series, starting
with anaerobic and then aerobic, was found to have a significant effect on the removal
efficiency of both polyphenols and organic matter, which reached 28% and 83.5%
respectively.
Table 5.12. Comparison of Anaerobic, Aerobic and Combined Anaerobic-Aerobic Biodegradation of Olive Mill Wastewater
Parameters Anaerobic Aerobic Combination
Organic Matter Removal 49 % 71.6-75.9 % 83.5 %
Polyphenolic Compound Removal 12 % Negligible 28 %
pH Correction Limited Required None
Sludge Production Medium High Low
Source: Aggelis, 2002
Aerobic treatment of anaerobically treated wastewater (Alternative 5) stabilizes the
residual oxygen demand in the highly reduced effluent while removing significant amounts of
nutrients. To illustrate this, UASB reactors convert 75 – 90 % of organic nitrogen in the
influent to ammonium ion (NH4+). This readily oxidizable oxygen demand in the effluent
may be dealt with by supplementing the treatment process with an additional aerobic
treatment step. This second step would improve the effluent quality in the following
parameters:
♦ Reducing residual organic material (COD, BOD5) through the additional
degradation of aerobic microorganisms in the extended activated sludge reactor

Environmental Impact Assessment ELARD
Olive Oil Residue Treatment Plant – Caza of Hasbaiya 52
♦ Reducing oxygen demand from the reduced forms of N and S by oxidation
(nitrification, denitrification, etc.) in the extended activated sludge reactor. The
anaerobic sludge could be introduced to provide a carbon source to support
denitrification
♦ Reducing residual suspended solids (TSS)
♦ Minimizing the amount of sludge formed by extended activated sludge reactors by
pre-treating the wastewater in the UASB system
♦ Facilitating sludge handling by producing a more stable residual sludge that is more
readily dewatered
♦ Reducing the volume of the anaerobic/aerobic treatment plant to half the volume of
an activated sludge plant (Journey, W.K.)
♦ Reducing the capital costs of plant construction due to the reduction in plant volume
♦ Reducing higher operation costs (energy, maintenance) of activated sludge systems
by pre-treating the wastewater in the UASB system. The electrical demand
decreases by 50% with the UASB- activated sludge system (Journey, W.K.)
In brief, the establishment of an anaerobic UASB reactor followed by EAAS reactor
(alternative 5) would reduce the capital and operational costs of the OORTPs inHasbaya,
while at the same time producing a higher quality effluent.
Tertiary treatment (alternative 6) with filtration and disinfection (chlorination in contact
tank) should be deployed in the case of sensitive discharge sites. This alternative would have
the highest BOD5, COD5, DO, SS and ON removal rates and the lowest pathogenic count.
However, it is more expensive to build and maintain. Additionally, tertiary filtration requires
the replacement of the filter periodically as specified by the manufacturer, which is a
problematic process in terms of higher plant expenditures and administrative costs, as well as
limited disposal options.
The process for each Hasbaya site treatment alternative selection was based on three
different criteria: 1) the OORTP proximity to the Hasbani River (whether the site is located
upstream or downstream the river); 2) the geological and hydrogeological formations; 3) the

Environmental Impact Assessment ELARD
Olive Oil Residue Treatment Plant – Caza of Hasbaiya 53
presence, at close proximity to the OORTP site, of a domestic wastewater treatment plant
(WWTP) serving the corresponding village.
Table 5.13 presents the six OORTP locations in the Hasbaya area, the different criteria
for alternative selection and the most appropriate alternative selected for each site. The most
appropriate alternative for the OORTPs in the villages of Ain Jarfa, Ain Qenia, Kfeir and
Khalouat, Mimes and Rachaiya el Foukhar is Alternative 6. The upstream location of those
OORTP sites and the fact that the perennial Hasbani River is not at proximity makes
advanced treatment levels unavoidable for the treatment of olive wastewater to minimize the
potential impacts on water resources. In the case of Ain Jarfa and Ain Qenia, the presence of
an intermittent stream which looses most of its water and percolates into the highly permeable
underlying formation (the Chouf Sandstone formation) constitutes potential risks to
groundwater contamination, and thus a valuable reason for the choice of treating further the
effluent with advanced disinfection and filtration.
As for the OORTPs in the villages of Kfeir and Khalouat, advanced treatment levels are
required due to the presence underneath the site of a karstic aquifer (the Mdairej formation)
causing water to flow through fractures and channels, posing a risk to groundwater
contamination. The same applies for the village of Mimes, where the Sannine karstic aquifer
would allow the liquid effluent percolate into groundwater sources. Concerning the OORTP
site in Rachaiya el Foukhar, the site is considered a recharge zone for the surface watershed
area that connects the Hasbani River. It is noteworthy to mention that a domestic wastewater
treatment plant (WWTP) will also be built by MCI at the same site, and the plant will include
the same tertiary treatment. Therefore, the effluent from the secondary treatment of the
OORTP will be connected to the tertiary treatment of the WWTP, thus minimizing
construction and operation costs.
As for the village of Kaoukaba, Alternative 5 was selected as the most appropriate one.
The olive wastewater will reach secondary treatment levels. The geological and
hydrogeological settings of the area have shown that the olive oil residue treatment plant will
be located on an impermeable formation (Chekka formation), which would act as a protective
seal for the secondary treated water. Advanced (tertiary treatment) levels are therefore not
required and this would minimize costs and expenses for the plant. Besides, the effluent will
be directly discharged on the Hasbani River.

Environmental Impact Assessment ELARD
Olive Oil Residue Treatment Plant – Caza of Hasbaiya 54
Table 5.13. Alternative Selection for the Six Olive Oil Residue Treatment Plants in Hasbaya
Formation OORTP Location
Name Lithology
Presence of a nearby WWTP
Possibility of Discharge in
Hasbani River
Alternative Selection Corresponding Treatment Scheme
Ain Jarfa Shouf Sandstone Fm.
Sandstone Absent No Alternative 6 UASB + EAAS + Tertiary
Ain Qenia Shouf Sandstone Fm.
Sandstone Absent No Alternative 6 UASB + EAAS + Tertiary
Kaoukaba Chekka Fm. Marl One planned WWTP at close proximity to the site
Yes Alternative 5 UASB + EAAS
Kfeir-Khalouat Mdairej Fm. Dolomitic limestone
Existing but not functional
No Alternative 6 UASB + EAAS + Tertiary
Mimes Sannine Fm. Dolomitic limestone, marly limestone and marl
Existing but not functional
No Alternative 6 UASB + EAAS + Tertiary
Rachaiya el Foukhar
Hammana Fm. Marly limestone, dolomitic limestone, interbeds of marl
One planned WWTP at close proximity to the site
No Alternative 6 UASB + EAAS + Tertiary Treatment (undergone in the WWTP)

Environmental Impact Assessment ELARD
Olive Oil Residue Treatment Plant – Caza of Hasbaiya 55
5.4.2 Site Selection
In general, the most practical and economical locations for the six OORTPs was found
to be at the outskirts of the corresponding village. Locations were selected while taking into
account distances form sensitive receptors such as residences and institutions. In addition, a
seasonal river, which is connected downstream to the Hasbani River, usually delineates each
site which makes it more practical for effluent discharge. Other significant criteria in the
selection of a location are the sites’ hydrological and geological settings.
The OORTP site in Ain Jarfa is delineated by a seasonal river in the Djage Valley,
whereas the Ain Qenia site is located near the El Aatme Valley. The intermittent river is
connected further downstream to the perennial Hasbani River. The presence on-site of a
highly permeable karstic formation is a contributing factor to taking necessary measures for
proper effluent treatment and management. The same applies for the Ain Qenia OORTP.
The olive oil treatment plant serving both Kfeir and Khalouat villages as well as the
plant serving the village of Mimes are located nearby a seasonal river in the Mjaidel Valley, a
tributary to another river in the Fater Valley, leading to the Hasbani river, makes it easier for
effluent discharge, since the three served villages are located upstream.Note that for the
above-mentioned OORTP sites, limited options for alternative sites were available, and site
selection was significantly hindered by many constraints. The most important constraint is
the presence of sensitive geological formations, which are of karstic nature in the case of
Kfeir and Khalouat OORTP as well as the Mimes OORTP, and highly permeable, such as in
Ain Jarfa and Ain Qenia. Moreover, the Rachaiya el Foukhar OORTP is to be located on a
very sensitive hydrological recharge zone. Nevertheless the consultants have adopted the
necessary mitigation measures to accommodate the constraints of the sites.
On the other hand, the selected site in Kaoukaba is delineated by the perennial Hasbani
River at a distance of around 300 meters, making the river as the preferred discharge location
for the secondary treated effluent. It is noteworthy to mention that the Hasbani River
maintains a flow of more than 0.1 m3/s, providing proper dilution factor for the contributing
effluent, according to the Environmental Limit Values (ELV) for wastewater discharged into
surface waters set by MoE Decision 8/1/2001. Note that limited opportunity for assessing
alternatives sites was present. In any case, the proposed site by the municipality was found to

Environmental Impact Assessment ELARD
Olive Oil Residue Treatment Plant – Caza of Hasbaiya 56
be suitable by the consultants, especially given its location on a rather impermeable
formation.
5.4.3 Regional Treatment Plant
The consultants have assessed the possibility of building a regional plant to serve the Hasbaya villages rather than individual plants. Building a regional plant, not necessarily based on UASB and EAAS, but eventually being based on thermal evaporation, would allow for economies of scale to be achieved (in particular at the level of operation and maintenance) while maximizing environmental protection by concentrating all efforts and mitigation measures in one location rather than being dispersed in several ones.
Nevertheless, this option would require the identification of a land to accommodate the central plant, and more importantly, a municipality to accept to receive others wastes, therefore facing the Nimby syndrome. This option, although preferable on a environmental point of view, would necessitate significant efforts to make it acceptable and identify a location. To date, Lebanon has not been very successful in establishing central facilities. Resistance was observed when trying to establish a national medical waste treatment facility or when the government proposed to have solid waste treatment facilities at the Mohafaza level. In general, there is a tendency in the local population to avoid having to treat other people’s wastes. Based on MCI’s experience in Hasbaiya, where the institution has been working for many years, the feasibility of the central facility was found to be difficult.
5.5. DETAILED PROCESS DESCRIPTION
In the combined Upflow Anaerobic Sludge Blanket / Extended Aeration Activated
Sludge treatment system, raw wastewater flows in to a grit trap where it is screened for
floatables and litter, and suspended solids can settle. Settled sludge is conveyed to the sludge
drying beds to be treated. The grit trap liquid effluent then flows into a grease trap from
which the effluent enters the UASB reactor. In the UASB reactor, the influent flows upwards
through a blanket of anaerobic sludge. This blanket remains suspended by the upflow, and
traps suspended solids that are traveling upwards. Anaerobic digestion occurs within the
sludge blanket generating biogases and relatively small amounts of new sludge. Rising gas
bubbles help mix the rising substrate with the anaerobic blanket biomass. The biogas, the
liquid effluent and the residual sludge are separated in the gas/liquid/solid (GLS) phase
separator consisting of a gas collector dome and a separate quiescent settling zone. Free of
the mixing effect of the release of biogas bubbles, the quiescent settling zone allows solid

Environmental Impact Assessment ELARD
Olive Oil Residue Treatment Plant – Caza of Hasbaiya 57
particles to settle back into the reactor while the clarified effluent is collected in gutters and
removed from the reactor. The sludge generated by the UASB is treated in the sludge drying
beds. Organic loadings of up to 15 Kg COD/m3 can be applied to the UASB reactor for most
types of effluents. The removal efficiency of the UASB process may vary between 60-70 %
COD, 75-80 % BOD5 at influent temperatures of 25-30 ºC (Journey, W.K.) and 80% TSS.
The presence of the trickling filter will help in reducing polyphenols, ammonia and the high
BOD and COD loads. In the UASB, approximately 3 Kg of COD would produce 1m3 of
biogas, while 5-10 % of the total COD is converted into stabilized sludge. Hydraulic
retention time (HRT) ranges from 5-12 hours. Nitrogen or phosphorous are also removed to a
certain extent. About 75 to 90 % of N will be converted to ammonium ion (NH4+). Sulfur
compounds are almost completely converted to hydrogen sulfide. Removal of low
concentrations of pathogenic helminth ova is almost complete, while that of bacteria and
viruses reaches 50%. The anaerobically treated vegetable water then flows into the EAAS
where it is aerobically digested by suspended microorganisms while air is mechanically
introduced in the reactor. In the EAAS reactor, the previously treated vegetable water flows
into aeration basin(s) in which microorganisms are mixed thoroughly with organics so that
they can flocculate and stabilize organic matter. Aeration is accomplished by supplying
oxygen via blowers or aerators. The mixture of microbial flocs and vegetable water then
flows into a final settlement tank (clarifier) where the activated sludge is settled. A portion of
the settled sludge is recycled back into the aeration basin and the grit trap to maintain the
proper food to microorganism ratio needed for the rapid breakdown of organic matter. The
waste sludge is conveyed to sludge-drying beds for proper treatment and disposal. Effluents
produced from EAAS systems are of high quality and well nitrified. Typical removal
efficiencies for BOD5, COD, and TSS are 90-95, 80-85, and 70-95, respectively, as reported
in published literature. Finally, the effluent from the final settlement tank, except for the
Kaoukaba OORTP, flows into a chlorine contact tank for disinfection, and is conveyed into
filtering units. Note that tertiary treatment for the Rachaiya el Foukhar OORTP will be
undergone in the nearby Wastewater Treatment Plant (WWTP) to be constructed by MCI as
part of the same program. Figure 5.5 shows a typical flow diagram describing the process for
the treatment of olive oil residues in the villages of Ain Jarfa, Ain Qenia, Kfeir and Khalouat
and Mimes. As mentioned earlier, in Rachaiya el Foukhar, tertiary treatment is part of the
WWTP and Kaoukaba OORTP does not include advanced treatments.

Environmental Impact Assessment ELARD
Olive Oil Residue Treatment Plant – Caza of Hasbaiya 58
Incoming Raw Vegetable Water Delivered by vehicular transport
⇓
Equalization Tank Start up
⇓
Preliminary Treatment
pH Adjustment Feed System pH adjustment
⇓
Grit Trap Removal of inert inorganic solids SS settlement
⇓
Primary Treatment
Grease Trap Removal of olive oil
⇓
UASB Reactor
Removal of Phenols BOD5 removal = 75-85% COD removal = 60-70% TSS removal = 60-85%
⇓
Secondary Treatment
EASS Reactor BOD5 removal = 90-95% COD removal = 80-85% TSS removal = 70-95%
⇓
Clarification
Final Clarifier
Removal of Suspended Solids Settling of activated sludge Recycling sludge into grit trap and aeration reactor
⇓
Chlorine Contact Tank Chlorination of effluent from final clarifier/Disinfection
⇓ Tertiary treatment
Dual Media Filter and Activated Carbon
Further BOD load reduction and SS removal
⇓
Discharge Treated Effluent (Discharge) BOD5 removal = 85-95% COD removal = 80-85% TSS removal = 70-95%
⇓
Sludge Collection Sludge / Grease
Pumping of sludge from grit & grease traps, UASB, EAAS, clarifier into sludge drying bed
⇓
Sludge Treatment Sludge Drying Beds Sludge is stored in beds to dry. The drying filtrate is re-introduced into the grit trap
⇓
Biogas Collection Biogas Tank Collection / Management of biogas
Figure 5.5. Flow Diagram of UASB/EAAS Treatment Plant with Tertiary Treatment

Environmental Impact Assessment ELARD
Olive Oil Residue Treatment Plant – Caza of Hasbaiya 59
5.6. EFFLUENTS CHARACTERIZATION AND MANAGEMENT
Combined UASB-EAAS treatment plants typically generate three main types of
byproducts: treated liquid effluent, waste sludge and biogas. Other miscellaneous effluents
will include biogases and “bulk” solids removed during the preliminary treatment, namely,
grit and grease traps in addition to saturated media and activated carbon used in the tertiary
treatment, if undergone.
5.6.1 Liquid Effluent
5.6.1.1 Liquid Effluent Characteristics
The quantity of liquid effluents that will be generated daily is equivalent to the quantity
of olive mill wastewater received by each plant. This quantity will only be generated during a
four-month period of the entire year, and the estimated daily values are for that specific
period. The average daily volume of generated treated effluent from the olive oil residue
treatment plant can be estimated from the olive mill vegetable water generation. It should be
noted that daily quantities of generated liquid effluents would be flowing seasonally for four
months only (mid-October through mid-February).
The expected quality of the liquid effluents varies with the type of adopted treatment
technology. However, a combination of Upflow Anaerobic Sludge Blanket, Extended
Aeration Activated Sludge, and advanced treatment to further reduce BOD loads and
suspended solids would allow the expected effluent quality to meet very stringent values of
effluent quality.
5.6.1.2 Liquid Effluent Management
Nearby Hasbani River tributaries were selected as discharge sites for the OORTPs
effluents in all villages except Kaoukaba where the effluent is directly discharged in the river.
However, since the seasonal streams do not sustain a minimum flow of 0.1 m3/sec, the liquid
effluent will undergo advanced treatment levels (filtration and disinfection) prior to discharge
in order to meet very stringent quality standards. The treated effluent could then be
discharged safely into the seasonal streams, avoiding the risk of contaminating the underlying
aquifers. The quality of treated liquid effluent should have, then, lower values than the
Environmental Limit Values (ELV) for wastewater discharged into surface waters.

Environmental Impact Assessment ELARD
Olive Oil Residue Treatment Plant – Caza of Hasbaiya 60
Moreover, in all cases if feasible and needed, the treated effluent could be used for
irrigation purposes for the various types of orchards present in the area only after
dechlorination has taken place. Appendices E and F provide EPA guidelines for wastewater
re-use in the biological environment. Table 5.14 summarizes the effluent management
practices for each OORTP in Hasbaya.
5.6.2 Sludge Effluent
5.6.2.1 Sludge Characteristics
The estimated volume of generated sludge varies with the type of adopted treatment
technology. For the UASB / EAAS systems, the sludge generation rate is reported as
negligible since anaerobic secondary treatment processes are used. The UASB / EAAS
system relies on anaerobic treatment to a greater extent. Therefore, the residual sludge quality
and quantity improve (reduced, more dense and easier to treat). Sludge generated by UASB /
EAAS systems only requires drying in beds as opposed to storing and dewatering. Typical
sludge generation rate for an EAAS system is published to be 6.4-9.1 Lit/m3 of wastewater
treated. Typical quality of sludge generated after EAAS treatment compared to the standards
set in the MoE’s Compost Ordinance is depicted in Table 5.15 and Table 5.16.

Environmental Impact Assessment ELARD
Olive Oil Residue Treatment Plant – Caza of Hasbaiya 61
Table 5.14 Summary of the Liquid Effluent Management Practices for the Six OORTPs in the Hasbaya Caza
Liquid Effluent Management OORTP Location Surface Cover
Geological Formation Effluent Treatment
Level Location of Effluent
Discharge Down Gradient
Receptors Remarks
Ain Jarfa None Shouf Sandstone Fm.
Tertiary treatment Intermittent river at the eastern banks of Djage
Valley
- Groundwater
- Vegetation
Ain Qenia None Shouf Sandstone Fm.
Tertiary treatment Seasonal flow
El Aatme Valley
- Groundwater
- Vegetation
- Groundwater will be encountered in the karstic
limestone of the Kesrouane Fm. under the Shouf
Sandstone Fm.
Kaoukaba Few meters of white soil
Chekka Fm. Secondary treatment Hasbani River - Vegetation
- Hasbani River
- Formation acts as a protective seal
- A pipe of 500 meters would be required to carry the
secondary treated OORTP effluent to the Hasbani River.
- Water can be conveyed through gravity
Kfeir- Khalouat Less than 2 meters of red/brown clay soil
Mdairej Fm. Tertiary treatment Seasonal flow
Mjaidel/Hassoun Valley
- Groundwater
- Vegetation - Well (in progress) < 50 m
Existing WWTP is not functional
Mimes Less than 2 meters of red/brown clay soil
Sannine Fm. Tertiary treatment Seasonal flow
Mjaidel/Hassoun Valley - Groundwater - Vegetation
Existing WWTP is not functional
Rachaiya el Foukhar
Less than 1 meter of reddish brown soil,
patchy
Hammana Fm. Tertiary treatment (in the nearby WWTP)
Fardis Valey Seasonal flow
- Small seepage zone 200 m from
site - Vegetation
Site located on a hydrological recharge zone

Environmental Impact Assessment ELARD
Olive Oil Residue Treatment Plant – Caza of Hasbaiya 62
Table 5.15. Typical Ranges for Chemical Composition of Activated Sludge
Parameter Typical Range
Total dry solids (%) 0.83-1.16
Nitrogen (N, % of TS) 2.4-5.0
Phosphorus (P2O5, % of TS) 2.8-11.0
pH 6.5-8.0
Organic acids (mg/L or ppm as acetic acid) 1,100-1,700
Table 5.16. Typical Metal Content in Wastewater Sludge
Metal Dry Sludge (mg/Kg or ppm)
Range Median MoE’s Ordinance (grade A)
As* 1.1-230 10 -
Cd* 1-3,410 10 <1.5
Cr 10-99,000 500 <100**
Co 11.3-2,490 30 -
Cu* 84-17,000 800 <100**
Fe 1,000-154,000 17,000 -
Pb* 13-26,000 500 <150**
Mn 32-9,870 260 -
Hg* 0.6-56 6 -
Mo 0.1-214 4 -
Ni* 2-5,300 80 -
Se* 1.7-17.2 5 -
Sn 2.6-329 14 -
Zn* 101-49,000 1,700 <400**
* Metals that are regulated for land application of wastewater sludge **Values exceeded
5.6.2.2 Sludge Management
Once the plants are operational, detailed sludge characterization and monitoring will be
necessary to assess the best disposal option for it. Based on the Table 5.16 and publications
on the combined UASB/EAAS process, the best disposal route for the generated sludge would

Environmental Impact Assessment ELARD
Olive Oil Residue Treatment Plant – Caza of Hasbaiya 63
be to use it as a fertilizer or soil cover in landscapes, in silviculture (woodland exploitation) or
in reforestation. The sludge should not be used for agricultural purposes if high levels of
heavy metals are expected or obtained in monitoring results. However, given the origin of the
sludge (vegetable wastewater), the sources of heavy metals in the sludge are practically
inexistent. Appendix E presents a summary of EPA guidelines that need to be followed to
ensure that sludge is applied on soils in ways to minimize adverse impacts on soil quality and
vegetation. The agricultural use option is also highly dependent on the demand of such a
product in the market and the level of acceptance from the farmers. The landfilling option is
always valid as long as the sludge is disposed of in an authorized landfill by the MoE. Again,
given the origin of the sludge, it is highly applicable and safe to re-use it.
5.6.3 Biogas Production
5.6.3.1 Biogas Characteristics
In addition to sludge formation, biogas is a major byproduct of anaerobic processes.
The gases produced include methane (CH4), carbon dioxide (CO2), nitrogen (N2), and
hydrogen sulfide (H2S). The relative proportions of these gases produced by the UASB
treatment plant in Bucaramange, Columbia, were 80% CH4, 10% CO2, 10 N2, and 0.1% H2S
(Journey, W.K.). However, both quantity and type of gas production varies with influent
characteristics, yet it is typically 220-250 L/kg of influent COD, excluding the gas that
remains dissolved in the effluent. For an influent COD of concentration of 300 mg/L, gas
production would be around 60 – 75 L/m3 of treated wastewater (Journey, W.K.). Moreover,
gas production is the parameter that indicates the proper functioning of a UASB reactor.
Lower production of biogas indicates problems such as the inhibition of biological processes
or sludge loss.
5.6.3.2 Biogas Management
The gases released from anaerobic activity contain many offensive odors, and are
therefore collected by the gas collection system. Concrete gas collectors should be lined to
reduce corrosion. Although biogas byproducts may be used as an energy source, most are to
be disposed of by flaring. However, if found to be feasible, biogas may be recovered to be
used as a source of energy to further enhance the anaerobic process in the UASB reactor.

Environmental Impact Assessment ELARD
Olive Oil Residue Treatment Plant – Caza of Hasbaiya 64
5.6.4 Miscellaneous Wastes
Other debris and solid wastes produced from the plants, which are usually composed of
olive tree leaves, twigs and olive parts, will be managed similarly to the management of the
produced sludge waste. Despite having a high Carbon to Nitrogen ratio, and being well suited
for composting if mixed with other organic material, given the absence of such a plant, it is
proposed to landfill these wastes in a site approved by the MoE. Saturated media and
activated carbon will be returned to the supplier. Other wastes include oil collected from the
grease trap; this residual oil can be added to the olive pomace generated by the three olive
mills to be used as fuel for heating in individual households. This is highly applicable since
the addition of oil to the pomace would increase its calorific value.
5.7. PLANT CONSTRUCTION
The size of a plant varies according to the location and the olive oil residue volume that
it treats. Table 5.17 provides information on the resources needed to build the OORTPs in all
six Hasbaya villages; namely the surface area required, the total volume of excavation, and
the volume of reinforced concrete, the hydraulic loading (flow from the operating mills), the
UASB reactor size, the EAAS reactor and clarifier volumes, the sludge recycling flow, and
the daily power consumption.
It should be noted that for all plants the total volume of excavation will be
approximately 3500 m3 (case specific) at a cost of $3/m3. Also, it is expected that 18 truck-
trips/day will be necessary to finalize the excavation works in a period of 2 weeks. The
excavated material will be sent either to quarries where it can be re-utilized (preferred option)
or for final disposal in the nearest landfill.
For each plant, a total volume of 200 m3 of reinforced concrete will be used for
construction. Concrete will either be delivered as ready-mix concrete, which will require 25
trucks (8 m3 each), or be prepared on site. The latter option will require 10 trucks for gravel,
5 trucks for sand, and 2 trucks for cement. Twenty tons of reinforced steel will be needed,
requiring two additional trucks.

Environmental Impact Assessment ELARD
Olive Oil Residue Treatment Plant – Caza of Hasbaiya 65
For reasons of cost and availability, reinforced concrete should be exclusively utilized in the
tank and the internal parts of the UASB reactor (columns, beams, and GLS separator). The
concrete should be of superior quality, well compacted and cast in smooth forms. When
exposed to corrosive atmospheres the concrete should be lined or coated with a corrosion
resistant material such as epoxy. Internal components of the UASB reactor can be made of
polyester or polyethylene if these materials are price competitive. Inlet pipes should be made
of PE or PVC. Use of metal should be avoided and stainless steel should be used only when
necessary. Construction work will be phased over 6-8 months, which account for the time
necessary to procure electro-mechanical equipment. After completion of concrete works and
installation of all electro-mechanical equipment, piping, and fixtures, a testing and start-up
period of 2 - 3 months will be provided to ensure that plant is working according to
specifications. Refer to Appendix C for architectural drawings of each plant and Appendix D
for plants locations map.

Environmental Impact Assessment ELARD
Olive Oil Residue Treatment Plant – Caza of Hasbaiya 66
Table 5.17. Hasbaya Olive Oil Residue Treatment Plants’ Construction Details and Characteristics
OORTP
Area Utilized
m2
Total Volume of Excavation
m3
Total Volume of Reinforced
Concrete
m3
Hydraulic Loading (From Mills) m3/day
UASB Reactor Dimensions
EAAS Reactor and Clarifier Volumes
Sludge recycling
Flow m3/hr
Daily Power Consumption1
kW-hr
Ain Jarfa 1000-1500 3500 200 6.80 vol 9 m3
(length 1.5 m x width 1.5 m x height
4.5 m)
Reactor: 242.69 m3 Clarifier: 8.99 m3 Air supply rate: 2.156 m3/day
1.35 89.73
Ain Qenia 1000-1500 3500 200 6.80 vol 5.10 m3 (length 1.13 m x width 1.13 m x height 4.5 m)
Reactor: 137.52 m3 Clarifier: 5.09 m3
Air supply rate: 1,304 m3/day
0.76 89.34
Kaoukaba 1000-1500 3500 200 30.33 vol 22.75 m3 (length 2.38 m x width 2.38 m x height 4.5 m)
Reactor: 613.46 m3
Clarifier: 22.71 m3 Air supply rate: 5.285 m3/day
3.41 118.08
Kfeir- Khalouat
1000-1500 3500 200 5.33 vol 4 m3
(length 1 m x width 1 m x height 4.5 m)
Reactor: 107.86 m3
Clarifier: 3.99 m3 Air supply rate: 1,006 m3/day
0.60 62.23
Mimes 1000-1500 3500 200 7 vol 5.25 m3 (length 1.15 m x width 1.15 m x height 4.5 m)
Reactor: 141.58 m3
Clarifier: 5.24 m3 Air supply rate: 1,320 m3/day
0.79 89.36
Rachaiya el Foukhar
1000-1500 3500 200 9.53 vol 7.15 m3 (length 1.34 m x width 1.34 m x height 4.5 m)
Reactor: 192.8 m3
Clarifier: 7.14 m3 Air supply rate: 1,798 m3/day
1.07 89.54
1 used to operate one air blower, one sludge pump, one sludge drying filtrate pump, and lighting

Environmental Impact Assessment ELARD
Olive Oil Residue Treatment Plant – Caza of Hasbaiya 67
6. DESCRIPTION OF THE ENVIRONMENT
6.1. GENERAL SETTING
Two parallel mountainous ranges, Mount Lebanon and Anti Lebanon, separated by the
Bekaa plain are the dominating topographic features of Lebanon (Figure 6.1). These
topographic features extend in a NNE-SSW direction. The study area is located on the
Eastern slopes of the South Lebanon, where the lowest elevations coincide with the Hasbani
River. Land elevations in the Hasbaiya area range on average between 800 m and 1300 m
above sea level.
Figure 6.1. Topographic Map of Lebanon
The seven villages under study (Ain Jarfa, Ain Qenia, Kaoukaba, Kfeir and Khalouat,
Mimes and Rachaiya el Foukhar) are located in the southern region of the Caza of Hasbaiya
to the Eastern side of the Hasbani River (Figure 6.2). A generally good road network exists
in the region (Figure 6.3) connecting the villages to each other.
However, in the case of all villages, the road that leads to the proposed site of the olive
oil residue treatment plant needs rehabilitation and/or lengthening. This road is essential for
connecting the site to the main road in order to reach the site easily during plant construction

Environmental Impact Assessment ELARD
Olive Oil Residue Treatment Plant – Caza of Hasbaiya 68
phases and perform the excavation and building machinery, as well as in order to transport
the olive mill wastewater in tankers to the treatment plant during plant operation.
Figure 6.2. Distribution of Target Municipalities and Villages in Hasbaya

Environmental Impact Assessment ELARD
Olive Oil Residue Treatment Plant – Caza of Hasbaiya 69
Figure 6.3. Detailed topographic map showing the road network connecting the different villages of the area
The general land use map of the Hasbaiya Region (MoE, January 2004) (Figure 6.4)
indicates that the OORTPs would be located in a region that predominantly consists of
scrubland, permanent crops, annual crops, and broad-leaved forests. Mimes village lies in a
region with abundant scrubland and permanent crops.

Environmental Impact Assessment ELARD
Olive Oil Residue Treatment Plant – Caza of Hasbaiya 70
Figure 6.4. Land Use Map of Hasbaiya Region (MoE, January 2004)
6.2. METEOROLOGICAL SETTING
The topographic features of Lebanon, in general, influence largely the climate of the
country. The climate of the Lebanese coast is of Mediterranean subtropical type, where
summers are hot and dry; and winters are mild and wet. On the other hand, snow covers the
mountains of the two ranges at times for several months per year. The two mountain ranges
tend to have a cool and wet climate in contrast to that of the coastal zone.
Meteorological information including primarily precipitation, ambient temperature, as
well as wind direction and speed, are essential data for adequately assessing environmental
impacts. Unfortunately, meteorological records are seldom available, except for few
locations in the country where stations were operating, in particular the Hasbaiya,
Marjayoun and Rachaiya stations of the the Service Meteorologique and the American
University of Beirut (AUB) stations. Recently, new stations have been installed across
different regions of the country, providing a better coverage of meteorological parameters.

Environmental Impact Assessment ELARD
Olive Oil Residue Treatment Plant – Caza of Hasbaiya 71
6.2.1 Precipitation
The two mountain ranges of Lebanon are perpendicular to the path of atmospheric
circulation. They intercept humidity and receive high rainfall compared to areas with
similar locations (Figure 6.5). Figure 6.6 depicts monthly rainfall distribution from data
collected at the AUB station (between 1996 - 1998 and between 1877 - 1970), at the
Hasbaiya station (between 1931 - 1960) and Marjayoun (between 1931 - 1960).
Precipitation data was obtained from BIA records, Service Météorologique du Liban (1977)
and from AUB records. The following observations can be made:
- The total annual precipitation is 985, 890, 660.3, and 887 mm at Hasbaiya (1931-1960),
Marjayoun (1931-1960), AUB (1996-1998), and AUB (1944-1977), respectively.
- Precipitation patterns show large seasonal variations with more than 80 percent of the
annual rainfall typically occurring between November and March.
- A marked decrease in precipitation levels is noticed at the AUB station, with
approximately 25 percent decrease between the two reported periods.
Based on the above observations, about 80 percent of precipitation that is 788 mm in
Hasbaiya and 712 mm in Marjayoun are probably distributed between November and
March. On the other hand, if the same pattern of precipitation levels decrease has occurred
in the mountains, similarly to the decrease noticed in the coastal area precipitation in
Hasbaiya and Marjayoun would be approximately 739 and 668 mm. This is however yet to
be confirmed by future data.

Environmental Impact Assessment ELARD
Olive Oil Residue Treatment Plant – Caza of Hasbaiya 72
Figure 6.5. Pluviometric Map of the Hasbaiya Area and Surroundings (scale 1: 200 000) (Service Météorologique du Liban, 1977)
0
50
100
150
200
250
300
Jan Feb Mar Apr May Jun Jul Aug Sep Oct Nov Dec
Hasbaya (1931-1960) Marjayoun (1931 - 1960) AUB (1996-1998) AUB (1877-1970)
Figure 6.6. Precipitation Data from AUB (34 m), Hasbaiya (770 m) and Marjayoun (760 m) Stations
(Elevations are from mean sea level).
6.2.2 Temperatures
The mean temperature along the coastal plains is 26.7° C in summer and 10° C in
winter. The temperature gradient is around 0.57 °C per 100-m altitude (Blanchet, 1976).
January is typically the coldest month with daily mean temperatures falling to -4 ºC in the

Environmental Impact Assessment ELARD
Olive Oil Residue Treatment Plant – Caza of Hasbaiya 73
mountains and 7 ºC in Saida, on the west coast. The warmest months are July and August,
when mean daily temperatures can rise to 28 ºC in the mountains and 33 ºC on the coast.
Figure 6.7 depicts monthly temperature distribution from data collected at AUB station
(between 1996 and 1998, and between 1931 and 1970), at Marjayoun station (between 1947
and 1963) and at Rachaiya (1965-1970). The following observations can be made:
- Average monthly temperatures in Marjayoun vary between 8.4 ºC in January and 23.3 ºC
in August.
- Average monthly temperatures in Rachaiya vary between 4.0 ºC in January and 22.2 ºC in
July.
- Temperature records did not change significantly at the AUB station between the two-
recorded periods.
The average annual temperature is 16.4 and 13.6 in Marjayoun and Rachaiya
respectively. Temperature in the study area does not vary much (Figure 6.7); variation is
probably in the order of 1 ºC as documented between Rachaiya and Marjayoun. However,
since temperature records did not change much between the two-recorded periods in the
AUB station the average yearly temperature in the study area would be approximately
13.6ºC.
0
5
10
15
20
25
30
Jan Feb Mar Apr May Jun Jul Aug Sep Oct Nov Dec
Rachaya (1965-1970) Marjayoun (1947 - 1963) AUB (1996-1998) AUB (1877-1970)
Figure 6.7. Average Monthly Temperature Data from AUB (34 m), Rachaiya ( 1235 m) and Marjayoun (760 m) Stations (Elevations are from mean sea level).

Environmental Impact Assessment ELARD
Olive Oil Residue Treatment Plant – Caza of Hasbaiya 74
6.2.3 Winds
Dominant wind directions in Lebanon are southwesterly; continental east and
southeasterly winds are also frequent. The two mountain ranges have a major impact on
wind direction, and contribute to reducing the incidence and strength of the southeasterly
and northwesterly winds on the mountain-backed shoreline and in the Bekaa valley.
Strongest winds are generally observed during the fall season. Wind data is available at
AUB and BIA stations, in Tyr, Tripoli, Cedars, Rayak, Ksara and Marjayoun.
Wind data close to the study area is available at the Marjayoun station. Dominant
wind direction is oriented in the W and NW (Service Météorologique du Liban, 1969).
Nevertheless, since the study area covers a wide range of settings from valleys to highs,
locals were consulted regarding the general wind directions in the proposed location.
Stronger winds (6-10 m/s and 11-15 m/s) are more frequent in the summer months. On the
other hand, relatively weaker winds are prevalent in the winter season.
Wind speed data from several stations in the country includes the daily wind speeds
and their relative frequency of occurrence per year on a four-category basis. Figure 6.8
depicts the frequency of occurrence of each wind speed category on an annual basis at the
Marjayoun station.
0
50
100
150
200
250
300
350
400
450
500
Jan Feb Mar Apr May Jun Jul Aug Sep Oct Nov Dec
Wind Speed 2-5 (m/s) Wind Speed 6-10 (m/s) Wind Speed 11-15 (m/s) Wind Speed above 16 (m/s)
Figure 6.8. Average Monthly Frequency Data of Wind Speed Ranges 2-5, 6-10, 11-15, and above 16 m /s at Marjayoun Station (1956-1968) (Elevation from mean sea level is 760m).

Environmental Impact Assessment ELARD
Olive Oil Residue Treatment Plant – Caza of Hasbaiya 75
Figure 6.9. Wind Direction for Marjayoun Station (Service Météorologique du Liban, 1977)
6.3. SITE SETTING
The data presented in this section was either collected through field visits, location
assessments, research, and/or in consultation with municipality officials or local citizens.
Climate data were mainly obtained from records from the Hasbaiya, Rachaiya, and
Marjayoun stations. Wind direction varies between orientations of W and NE (Service
Meteorologique du Liban, 1969). Appendix A presents the corresponding Geological Maps
and Topographic Maps of each OORTP location.
6.3.1 Ain Jarfa Site
An area of 1000 – 1500 m2 in the village of Ain Jarfa, which belongs to the
municipality, has been allocated for building the treatment plant on. The site is located
southwest of the village, down gradient to most of the populated area, (Photograph 6.1)
however the olive mill wastewater will be collected through vehicular transportation. The
average land elevation is approximately 900 m above sea level. The site is delineated by a
seasonal river on the southern side of the location and is surrounded by scattered pine trees
and eroded soil. The site is accessible through a degraded agricultural road that needs to be
rehabilitated in order to allow building equipment and machinery, as well as olive mill
wastewater transport vehicles to reach the site.
Precipitation in the area ranges between 900 and 1100 mm/year (Service
Meteorologique du Liban, 1977). Wind direction varies between orientations of ENE and E
(Service Meteorologique du Liban, 1969). Average annual temperature at Ain Jarfa is
approximately 15 oC (Service Meteorologique du Liban, 1977).

Environmental Impact Assessment ELARD
Olive Oil Residue Treatment Plant – Caza of Hasbaiya 76
Photograph 6.1. General View of the Proposed Site for the OORTP Site Located Towards the Southern Outskirts of the Village of Ain Jarfa
6.3.2 Ain Qenia Site
An area of 1000 – 1500 m2 in the village of Ain Qenia, which belongs to the
municipality, has been allocated for building the treatment plant on. The site is located
southwest of the village, down gradient to most of the populated area (Photograph 6.1)
however the olive mill wastewater will be collected through vehicular transportation. The
average land elevation is approximately 900 m above sea level. The site is delineated by a
seasonal river on the southern side of the location and is surrounded by scattered pine trees
and eroded soil. The site is accessible through a degraded agricultural road that needs to be
rehabilitated in order to allow building equipment and machinery, as well as olive mill
wastewater transport vehicles to reach the site.
Precipitation in the area ranges between 900 and 1100 mm/year (Service
Meteorologique du Liban, 1977). Wind direction varies between orientations of ENE and E
(Service Meteorologique du Liban, 1969). Average annual temperature at Ain Qenia is
approximately 15 oC (Service Meteorologique du Liban, 1977).

Environmental Impact Assessment ELARD
Olive Oil Residue Treatment Plant – Caza of Hasbaiya 77
Photograph 6.2. General View the Proposed Site for the OORTP in Ain Qenia
6.3.3 Kaoukaba Site
The site is located at the Southern outskirts of the village, down gradient to most of the
populated area (Photograph 6.1). The average land elevation is approximately 510 m above
sea level. The site is delineated by a perennial river called Hasbani on the southern side of
the location. The land is mainly flat with no slopes to be mentioned. The proposed site then
is located within a flat area close to the Hasbani River. The site is mainly covered by young
olive trees and is 300 meters northern to the Hasbani River (Photograph 6.7). The site is
accessible through an agricultural road that needs to be rehabilitated in order to allow
building equipment and machinery to reach the site. Precipitation in the area ranges
between 900 and 1100 mm/year (Service Meteorologique du Liban, 1977). Wind direction
varies between orientations of ENE and E (Service Meteorologique du Liban, 1969).
Average annual temperature at Kaoukaba is approximately 15 oC (Service Meteorologique
du Liban, 1977).

Environmental Impact Assessment ELARD
Olive Oil Residue Treatment Plant – Caza of Hasbaiya 78
Photograph 6.3. General View the Proposed Site for the OORTP site Located Towards the Southern Outskirts of the Village of Kaoukaba
Photograph 6.4. Perennial River (Hasbani River)on the Southern Edge of the Kaoukaba Site.
6.3.4 Kfeir and Khalouat Site
An area of 1000 – 1500 m2 in the village of Kfeir, which belongs to the municipality,
has been allocated for building the treatment plant. The site is located at the outskirts of the
village near an existing but not functional WWTP, down gradient to most of the populated
area, however the olive mill wastewater will be collected through vehicular transportation.
The average land elevation is approximately 810 m above sea level. Oak trees and

Environmental Impact Assessment ELARD
Olive Oil Residue Treatment Plant – Caza of Hasbaiya 79
scrubland surround the proposed site. The site is accessible through a main road that needs
little rehabilitation and allows building equipment and machinery, as well as olive mill
wastewater transport vehicles to reach the site (Photograph 6.7). Photograph 6.6 shows a
general view of the proposed site.
Photograph 6.5. View of Main Road Leading to the Proposed Site in Kfeir
Photograph 6.6. General View Surrounding the OORTP in Kfeir
Wind direction varies between orientations of W and NE (Service Meteorologique
du Liban, 1969). Average annual temperature at Kfeir and Khalouat is approximately 15oC
(Service Meteorologique du Liban, 1977). Precipitation in the area ranges between 900 and
1100 mm/year (Service Meteorologique du Liban, 1977).

Environmental Impact Assessment ELARD
Olive Oil Residue Treatment Plant – Caza of Hasbaiya 80
6.3.5 Mimes Site
An area of 1000 – 1500 m2 in the village of Mimes, which belongs to the
municipality, has been allocated for building the treatment plant. The site is located at the
outskirts of the village, down gradient to most of the populated area, however the olive mill
wastewater will be collected through vehicular transportation. The average land elevation is
approximately 640 m above sea level. The proposed site is surrounded by olive orchards
and uncultivated brushland. The site is accessible through an agricultural road that needs to
be rehabilitated in order to allow building equipment and machinery, as well as olive mill
wastewater transport vehicles to reach the site (Photograph 6.7). Precipitation in the area
ranges between 900 and 1100 mm/year (Service Meteorologique du Liban, 1977). Wind
direction varies between orientations of ENE and E (Service Meteorologique du Liban,
1969). The average annual temperature at Mimes is approximately 15oC (Service
Meteorologique du Liban, 1977).
Photograph 6.7. View of Agricultural Road Leading to the Proposed Site in Mimes
6.3.6 Rachaiya el Foukhar Site
An area of 1000 – 1500 m2 in the village of Rachaiya el Foukhar, which belongs to the
municipality, has been allocated for building the treatment plant on. The site is located at
the Southwestern outskirts of the village, down gradient to most of the populated area
(Photograph 6.8); however the olive mill wastewater will be collected through vehicular
transportation. The average land elevation is approximately 670 m above sea level. The site
is delineated by a seasonal river on the southern side of the location. The proposed site then

Environmental Impact Assessment ELARD
Olive Oil Residue Treatment Plant – Caza of Hasbaiya 81
is located surrounded by a dense oak forest from the Northern and Western sides, and has
the main village road on the Southern side and in close proximity to old olive orchard
towards the South (Photograph 6.9). The site is accessible through an agricultural road that
needs to be rehabilitated in order to allow building equipment and machinery, as well as
olive mill wastewater transport vehicles to reach the site.
Precipitation in the area ranges between 900 and 1100 mm/year (Service
Meteorologique du Liban, 1977). Wind direction varies between orientations of ENE and E
(Service Meteorologique du Liban, 1969). Average annual temperature at Rachaiya el
Foukhar is approximately 15 oC (Service Meteorologique du Liban, 1977).
Photograph 6.8. Overview of the Rachaiya el Foukhar OORTP Site
Photograph 6.9. General View of the Proposed OORTP Site in Rachaiya el Foukhar

Environmental Impact Assessment ELARD
Olive Oil Residue Treatment Plant – Caza of Hasbaiya 82
Photograph 6.10. Intermittent Stream on the Edge of the Rachaiya el Foukhar OORTP Site
6.4. TECTONIC SETTING AND SEISMICITY
Lebanon is located on the eastern coast of the Mediterranean Sea, along the Dead Sea
Transform fault system. The Dead Sea Transform fault system in Lebanon has several
surface expressions, represented in major faults (Yammouneh, Roum, Hasbaya, Rashaya
and Serghaya faults), in uplifts as high mountainous terrain (Mount Lebanon and Anti
Lebanon), and from the seismic activity record. Recent work has categorized the Lebanese
section of the Dead Sea Transform fault as being a strong seismic activity zone (Khair et al.,
2000). The studied area lies south east of the Yammouneh Fault and between Hasbaya and
Rachaya Faults. Appendix A presents a Tectonic Map of Lebanon to scale. Harajli et al.
(1994) proposed ground acceleration in this part of Lebanon, where the area of study is
allocated, to be approximately 0.20g.
6.5. GEOLOGICAL SETTING
The geology of the studied area, including subsurface stratigraphy and structure, is
developed based on: 1) review of available maps and literature, 2) analysis of aerial
photographs, and 3) geological surveys and site visits conducted by ELARD geologists. The
result was the generation of a geological map at a scale of 1:20,000 covering every area of

Environmental Impact Assessment ELARD
Olive Oil Residue Treatment Plant – Caza of Hasbaiya 83
study, reaching approximately 8 Km2 and lying within grid coordinates 165 000 and 166 000
Northing, and 146 000 and 151 000 Easting. The map is included in Appendix A.
Geological cross-sections (A-B) that illustrate the subsurface stratigraphy and structure
underneath the different proposed sites are presented on the map.
6.5.1 Stratigraphy
The geological formations that outcrop within the surveyed areas extend from the Jurassic Period to Upper Cretaceous in age, Quaternary deposits were also found in some of the sites. These formations are described hereafter in chronological order, from oldest to youngest.
6.5.1.1 Jurassic Formations
6.5.1.1.1 The Bikfaya and Kesrouane Formations (J4 – J5)
Bikfaya and Kesrouane Formations were identified in three sites: Ain Jarfa, Ain
Qenia, and Rashaiya el Foukhar. It was not possible to differentiate between these two
formations in those study areas because of their similarity and because of the unclear
definition of the Bhannes Formation (J5), which separates them. The Kesrouane and
Bikfaya Formations belong to the Jurassic Period. They outcrop are in the eastern parts of
the study area in Kfar Hamam village. The formation consists mainly of massive beds of
gray dolomitic limestone. The thickness of these two formations in Lebanon reaches in
excess of approximately 1100m. The upper boundary of these formations is the beginning
of the yellowish brown oolitic limestone of the Salima Formation, which is not outcropping
in the study area. The lower boundary of the Bikfaya-Kesrouane Formation is not
outcropping in the study area but from the cross-section, the thickness should be in excess of
400 m (Geological Map, Appendix A).
6.5.1.1.2 The Bhannes Formation (J5)
The Bhannes Formation is only present in the Rachaiya el Foukhar site. Patches of
volcanic rocks are present in the Bikfaya-Kesrouane Fromation. These mainly intrusive
volcanic rocks are considered most of the time to belong to the Bhannes Formation. The
color of these volcanic rocks is mainly pink to dark green. These can be clearly observed in
the valley underneath Kfar Hamam were the proposed location of the plant is present.

Environmental Impact Assessment ELARD
Olive Oil Residue Treatment Plant – Caza of Hasbaiya 84
6.5.1.2 Cretaceous Formations
6.5.1.2.1 Chouf Sandstone Formation (C1)
Chouf Sandstone Formation was identified in Ain Jarfa, Ain Qenia, Kfeir, Mimes, and
Rachaiya el Foukhar. This formation outcrops in the southern parts of the area between
Mimes and Khaloue villages. It is mainly composed of cross bedded, hematitic sandstone
and sands. Lenses of bluish gray clay and marl with peat are also found in this formation.
This formation reaches a thickness of 100 - 200m in the surrounding areas; however, its
lower boundary with the Jurassic Formations is not showing.
6.5.1.2.2 The Abeih Formation (C2a)
The Abeih Formation is present in Kfeir, Mimes and Rachaiya el Foukhar. This
formation is outcropping in the southern and central parts of the study area. This formation
consists in its upper part of yellowish and brownish fossiliferous limestone, while it consists
in its lower parts, of intercalations of blue and green marls, and yellowish limestone. This
formation reaches a thickness of 100 - 200m in the study area.
6.5.1.2.3 The Mdairej Formation (C2b)
The Mdairej Formation is present in Kfeir, Mimes and Rachaiya el Foukhar. This
formation consists in a cliff extended above the Abeih Formation south of El Kfeir village
and north of Mimes village. This cliff consists of hard grayish micritic massive limestone
rich in calcite veins. This formation is approximately 50m thick (Geological Map,
Appendix A).
6.5.1.2.4 The Hammana Formation (C3)
The Hammana Formation is present in Kfeir, Mimes and Rachaiya el Foukhar. This
formation outcrops mainly in Baitsaniye and Kfeir villages. It is characterized by creamish
to greenish marly limestone. Quartz geode can be found along ephemeral streambeds. This
formation is also highly fossileferous, as molded gastropods and fossilized oysters are
frequently found. This formation has a thickness of approximately 250 – 300 m in the
studied area.

Environmental Impact Assessment ELARD
Olive Oil Residue Treatment Plant – Caza of Hasbaiya 85
6.5.1.2.5 The Sannine Formation (C4)
The Sannine Formation is present in Kfeir, Mimes and Rachaiya el Foukhar. The
Sannine Formation outcrops in the northwestern, northern and northeastern parts of the
study area. This formation consists in its lower levels of marly limestone that grades into
thin beds of gray limestone especially along streambeds in the valleys. In its upper part, this
formation is composed of massive gray limestone. The thickness of this formation in the
studied area reaches approximately 600m. The upper boundary of this formation is not
outcropping in the study area (Geological Map, Appendix A). Massive limestones and
dolomites, above the green or grey marls of the Hammana Formation, characterize the lower
limit of the Sannine Formation.
6.5.1.2.6 The Chekka Formation (C6)
The Chekka Formation outcrops in the central parts of the study area, and was only
identified in the Kaoukaba site. The outcrops are present between the Hasbani River and
Kaoukaba village. This formation consists mainly of chalky limestone and marls with
extensive chert bands and nodules. The thickness of this formation was calculated to be
around 400 m.
6.5.1.3 Tertiary Formations
The three tertiary formations were only found in Kaoukaba and are described below.
6.5.1.3.1 Pliocene Formation
The Pliocene Formation outcrops north of Kaoukaba village. They are mainly
composed of chalks and marly limestone. The thickness of this formation is approximately
300m as represented on the cross section (Geological map Appendix A).
6.5.1.3.2 Eocene Formation
The Eocene Formation outcrops north of in the northwestern part of the study area.
They are mainly composed of dolomitic limestone and limestones with distinctive fossils of
the Eocene stage Nummulites. The upper boundary of this formation is not outcropping in
the study area.

Environmental Impact Assessment ELARD
Olive Oil Residue Treatment Plant – Caza of Hasbaiya 86
6.5.1.3.3 Pliocene Basalts
A patch of Pliocene volcanic rocks, mainly basalts, are present in the southeastern part
of the study area. They extend as an elongate patch along a ridge facing the Hasbani River.
These basalts are unconformably overlying the Sannine Formation. The thickness of these
basalts is approximately 10-20 m.
6.5.1.4 Quaternary Deposits
The two sites of Kaoukaba and Rachaiya el Foukhar were found to contain quaternary
deposits. In fact, these are mainly present along the flood plain of the Hasbani River. These
deposits are mainly alluvial deposits of conglomerates, sands and clays. The thickness of
these deposits is usually less than 5 m.
6.5.2 Structure
In Ain Jarfa, Ain Qenia and Rachaiya el Foukhar, the formations are gently dipping
towards the west at angles that range between 5º and 15º. The dip increases from east to
west. Structural disturbances mainly through faults have a slight influence on the bedding
attitude in the study area. The E-W fault is suspected in the northwestern parts Ain Jarfa,
Ain Qenia and Rachaiya el Foukhar. This fault is a possible strike slip fault with unclear
displacement values.
Formations in Kaoukaba are gently to moderately dipping generally towards the north
west at angles that range between 18º and 45º. The dip varies from the general trend, mainly
due to structural disturbances, in the western sections in the Sannine Formation outcrops.
Dips generally are steeper in the southeastern parts of the study area and generally decrease
gradually towards the northwestern parts. Moreover, one set of faults represented with three
faults are present in the northwestern part of Kaoukaba. The general trend of these faults is
NW-SE. These faults have both normal and strike slip type of movement both of which are
in the order of 100’s of meters.
As for Kfair and Mimes, formations are gently dipping generally towards the west at
angles that range between 15º and 35º. The dip increases progressively going toward the
west. The dip varies from the general trend, mainly due to structural disturbances, in the
western sections in the Sannine Formation outcrops. Two faults sets are present in Kfeir as

Environmental Impact Assessment ELARD
Olive Oil Residue Treatment Plant – Caza of Hasbaiya 87
well as Mimes. One set trending in the NW-SE direction and the other in the NE-SW
direction. The type of displacement of these faults was not clear.
6.5.3 Hydrogeological Setting
The hydrogeology of the surveyed areas was developed based on: 1) the review of
available maps and literature; 2) the hydrogeological surveys and site visits conducted by
ELARD specialists. The hydrogeology of the studied areas was studied based upon
geological maps, pluviometric and climatic data related to the studied areas, and field
surveys undergone by ELARD specialists.
In the sites of Ain Jarfa and Ain Qenia, there exists one main aquifer: the Bikfaya-
Kesrouane Aquiferous Formation overlain by the Chouf Sandstone Semi-Aquifer.
Two main aquifers exist in the study areas of Mimes and Kfeir. The Abeih Aquiclude
underlies the Mdairej Aquifer and overlies the Chouf Sandstone Aquiifer, and the Hammana
Aquiclude underlies the Sannine Aquiferous Formation.
In Rachaiya el Foukhar, three main aquifers are present. The Mdairej Aquifer
underlain by the Abeih Aquiclude, the Bikfaya- Kesrouane Aquiferous Formation overlain
by the Salima Aquiclude and the Chouf Sandstone Semi-Aquifer. Although the Sannine
Formation is considered as a major aquifer in Lebanon, due to its limited surface extent it is
not considered a major aquifer in Rachaiya el Foukhar.
Two main aquifers were identified in the study area of Kaoukaba: the Sannine and
Eocene Aquifers. The Pliocene and Chekka aquicludes underlies the Eocene aquiferous
Formation, and overly the Sannine aquiferous Formation.
The following paragraphs present a description of the major aquifers in the Hasbaya
region identified in the six different study areas.
6.5.3.1 Aquifers
6.5.3.1.1 Bikfaya-Kesrouane Aquifer (J4-6 Formation)
The Bikfaya-Kesrouane Formation constitutes the most important aquifer in the
Jurassic sequence. It is a karstic aquifer characterized by significant amount of groundwater
flowing in channels, faults, and fractures. The Sannine aquifer is composed of a recharge

Environmental Impact Assessment ELARD
Olive Oil Residue Treatment Plant – Caza of Hasbaiya 88
zone in the study area. According to the UNDP (1970) report, the infiltration coefficient of
this aquifer reaches 39%.
The Bikfaya-Kesrouane aquifer represents one of the main aquifers in Lebanon and is
the most productive aquifer in the Jurassic sequence. It is characterized by its high
secondary porosity causing ground water to flow mainly through fractures, joints and
channels, which is a typical occurrence in karstic aquifers.
The Bikfaya-Kesrouane aquifer acts as a source for several types of karstic springs.
The Bikfaya-Kesrouane aquifer is considered the major aquifer in the study area, covering
approximately 60 %. Surface and underground features reveal the advanced karstic nature
of this aquifer. These features include solution joint, solution pits, lapiaz, grooves, and
sinkholes. Cavities in the rock are often filled with calcite and cave deposits. The thickness
of the topsoil on this formation ranges from few centimeters up to few meters.
6.5.3.1.2 Chouf Sandstone Semi-Aquifer (C1)
The nature Chouf Sandstone Formation resulted in its ability to produce water in small
quantities makes it a semi-aquifer. The permeability of the sands and the presence of
relatively impermeable clay and marl lenses results in presence of springs with relatively
small discharges at different levels in this formation. The Abeih Formation above it acts as
a relatively impermeable horizon while it is not a far-fetched idea that seepage from this
formation through the Salima Formation and into the major Bikfaya-Kesrouane Formation
might occur.
6.5.3.1.3 Mdairej Aquifer (C2b)
Fifty meters of massive limestone cliff constitute the aquiferous member of the
Mdairej Formation. Being located between two aquicludes; namely the Abeih Formation at
the bottom, and the Hammana Formation at the top, the Mdairej Formation has a high
potential of water bearing capacity, which remains, however limited due to the relatively
small thickness. Its position between two aquitards improves its ability to maintain all water
infiltrating in the form of recharge.

Environmental Impact Assessment ELARD
Olive Oil Residue Treatment Plant – Caza of Hasbaiya 89
6.5.3.1.4 Sannine Aquifer (C4 Formation)
The Sannine Formation constitutes the most important aquifer in the Cretaceous
sequence. It is a karstic aquifer characterized by significant amount of groundwater flowing
in channels, faults, and fractures. The Sannine aquifer is composed of a recharge zone in the
study area. According to the UNDP (1970) report, the infiltration coefficient of this aquifer
reaches 40%.
The Sannine aquifer acts as a source for several types of karstic springs. The Sannine
aquifer is considered the major aquifer in the study area, covering approximately 60 % of
the area. Surface and underground features reveal the advanced karstic nature of this
aquifer. These features include solution joint, solution pits, lapiaz, grooves, and sinkholes.
Cavities in the rock are often filled with calcite and cave deposits. The thickness of the
topsoil on this formation ranges from few centimeters up to few meters.
6.5.3.1.5 Eocene Aquifer (e)
The Eocene Formation constitutes the most important aquifer in the Tertiary sequence.
It can attain a thickness of 900 m but in the study area less than 100m are present. It is a
karstic aquifer characterized by significant amount of groundwater flowing in channels,
faults, and fractures. However, its water capacity is limited due to the relatively small
thickness.
6.5.3.2 Aquicludes
6.5.3.2.1 Abeih and Hammana Aquicludes (C3 -C2b Formations)
The Hammana and Abeih Formations constitute aquicludes with poor hydraulic
properties because of the low porosity, consequently the low hydraulic conductivity for
argillaceous limestone, clays, and marls forming relatively impermeable boundaries for the
Sannine and Mdairej Aquifers that prohibit exchange of water between the different
hydrostratigraphical units. According to the UNDP (1970) report, the infiltration coefficient
of this aquifer does not exceed 10-15%.

Environmental Impact Assessment ELARD
Olive Oil Residue Treatment Plant – Caza of Hasbaiya 90
6.5.3.2.2 Chekka and Pliocene Aquicludes (C6 –P Formations)
The Chekka and Pliocene Formations constitute aquicludes with poor hydraulic
properties because of the low porosity, consequently the low hydraulic conductivity for
marls forming relatively impermeable boundaries for the Sannine and Eocene Aquifers that
prohibit exchange of water between the different hydrostratigraphical units. According to
the UNDP (1970) report, the infiltration coefficient of this aquifer does not exceed 10-15%.
6.5.3.3 Well Survey
A well survey was conducted as part of this EIA study. This survey revealed the presence of 4 private wells in Mimes and El Kfeir villages, 5 wells in Kaoukaba area, one well in Rachaiya el Foukhar and a total of 4 public abandoned wells (due to collapse) in both Ain Jarfa and Ain Qenia. Note that in Kaoukaba, all the wells have poor yields of less than 1 liter/sec, and are generally used for domestic and irrigation purposes. Note also that the wells in Kaoukaba that are tapping the Chekka and Pliocene Formations, down to a depth of 100m; have mainly sulfuric water. As it is noticeable, the number of wells present in the studied area is limited; this is because abundant sources of water are available and the domestic water supply is available from Chebaa village. All surveyed wells and their characteristics (owner, discharge, and usage) are listed in Table 6.1. The locations of identified wells are presented on the Geological Map in Appendix A.
6.5.3.4 Springs Survey
For the purpose of the hydrogeological study of the area, a springs survey was
conducted by ELARD team in the six villages under study. S1 spring is located in the Kfeir
village issuing from the Abeih Formation. Haddatha spring (Photograph 6.11) is located in
Mimes villages and issues from an area close to the boundary between the Sannine and
Hammana Formations. Ain el Sifla is also located in Mimes village and issues from the
Mdairej formation. Its discharge was measured to be 5 L/min on April 21, 2004. Other
small seepages are present especially in the Hammana and Abeih Formations. The
discharge of these springs decreases significantly in the summer time and both dry out. All
of these springs are used locally by surrounding houses for domestic and irrigation purposes.

Environmental Impact Assessment ELARD
Olive Oil Residue Treatment Plant – Caza of Hasbaiya 91
Table 6.1. Characteristics of Surveyed Wells
Well’s name
Area Owner X
Coordinate
Y Coordin
ate Z(m)
Discharge l/sec
Tapping aquifer
Usage
1 El Kfeir Private 165250 150050 810 - C1 Ab
2 El Kfeir - 166050 149050 840 Pump problem
C3-C2b Ab
3 Mimes - 165600 147390 650 - C3-C2b Not equipped
4 Mimes - 165900 147650 675 - C3-C2b Not operational
5 Rachaiya el Foukhar
Public 157300 141300 650 - C3-C4 Ab
6 Kaoukaba Public 140300 161455 634 e-P Ab
7 Kaoukaba - 141550 162200 546 C6 Ab
8 Kaoukaba - 141600 162100 545 C6 Ab
4 Kaoukaba Private 141600 161530 520 C6 Ab
5 Kaoukaba Private 141950 162700 550 C6 Irr. Ab.: Abandoned Irr: Irrigation
Photograph 6.11. Haddatha spring in Mimes Village
Another spring survey was performed in Ain Jarfa and Chouaiya villa. This survey
revealed the presence of five springs. They are located in the Chouf Sandstone Formations.

Environmental Impact Assessment ELARD
Olive Oil Residue Treatment Plant – Caza of Hasbaiya 92
These springs are relatively small and are considered as seepage zones. The main use of
those springs is for irrigation and sometimes for domestic usage when the water supply from
Chebaa village is not available. Other small seepages are present especially in the Chouf
Sandstone Formations. The discharge of these springs decreases significantly in the summer
time and most of them dry out.
The spring survey in the village of Kaoukaba revealed the presence of 6 major springs.
The springs do not have a significant discharge and most are discharging from the Chekka
and Pliocene-Eocene boundary. Most of the springs are small and almost dry out during the
summer season. Photograph 6.12 shows Kaoukaba spring being measured by ELARD
geologist. Most springs with low yields are used locally by surrounding houses for domestic
purposes, whereas some other springs are not used at all for domestic or drinking purposes
but are still used for irrigation. Most of the springs are located above the site and northwest
of it.
Photograph 6.12. Ain Kaoukaba in Kaoukaba village

Environmental Impact Assessment ELARD
Olive Oil Residue Treatment Plant – Caza of Hasbaiya 93
In the Rachaiya el Foukhar and Kfar Hamam villages, the spring survey revealed the
presence of seven springs. These springs are relatively small and are considered as seepage
zones. The S1 spring is located down gradient from the proposed site. The main use of
those springs is for irrigation. The location of these springs is present on the geological
map. Other small seepages are present. The discharge of these springs decreases
significantly in the summer time and both dry out. Table 6.2 shows a summary of the
surveyed springs.
Table 6.2. Results of surveyed springs
Spring name Aquifer X coordinate Y coordinate Z (m) Discharge (l/sec)
Ain el Marj C1 156400 143000 772 <0.1
Ain el Ghabra C1 156400 143650 760 <0.1
Ain Khoury C3 156300 142500 560 <0.1
Ain Mitri C3 156900 142200 547 <0.1
S1 spring C3 157400 142600 600 0.05
Ain el Ram C3 157390 142700 600 Seepage zone
Rachaiya el Foukhar Spring
C3 157700 143200 753 0.3
Ain Jarfa Spring C1 162900 147085 930 0.25
Ain el Hara C1 162400 147400 1010 0.25-
Ain El Daya C1 162130 147780 1050 1
Ain el Mecheye C1 162000 148300 960 0.0.2
S1 Spring C1 162400 148400 920 <0.02
Ain Aarab e 140400 161450 625 <0.1
Nabaa el Quraqat C6 140500 161800 650 -
Ain el Reshaha Boundary e-P
141000 162300 660 0.25
Kaoukaba Spring Boundary e-P
141150 162400 640 0.25
Ain el Ajrame Boundary e-P
141750 163050 660 4
S1 Spring C6 142450 162700 550 Seepage zone

Environmental Impact Assessment ELARD
Olive Oil Residue Treatment Plant – Caza of Hasbaiya 94
6.5.4 Hydrological Setting
Both Ain Jarfa and Ain Qenia OORTPs sites are located on the eastern banks of El
Aatme valley, which hosts an intermittent river that originates from Ain Jarfa village in the
Chouf Sandstone Formation. This intermittent river discharges in the Hasbani River further
few kilometers down stream towards the west. The river dries out most of the summer
season. Because of the nature of the Kesrouane-Bikfaya Formation in which most of the
valley exits in, the river looses most of its water to the underground water through channels,
fractures, and fissure. Visual observation during site visits in April 2004 revealed that the
valley is dry.
As for Kaoukaba, one major perennial river the Hasbani River passes through the
study area. The site is located on the northern banks of this river.
The Hasbani River is fed primarily by the Hasbani spring that is situated several
kilometers north of the study area. Flow measurements previously conducted at that spring
indicate that its flow varies between 0.5 and 1 m3/s, at dry and wet seasons, respectively
(Edgell, 1997). This range could be representative of the flow of the surface water close to
the source of the river. Further, down stream from the Hasbani Spring, along the Hasbaya
section, a gauging station is present where records of discharge rate are presented in (Figure
6.10). This range could be representative of the flow of the surface water close to the source
of the river. Further, down stream from the Hasbani River, along the Sreid section, a
gauging station was positioned where records of discharge rate are presented below. The
largest discharge is approximately 2.98 m3/s and the lowest is approximately almost zero.
Just before it leaves the Lebanese boarder and at the mouth of the Wazzani spring the
gauging station is positioned and the hydrograph is presented. The largest discharge is
12.75 m3/s and the lowest is 1.19 m3/s.
The Mimes and Kfeir sites are located on the southern banks of the seasonal river in
the Mjaidel Valley. This seasonal river is a tributary to the river in the Fater valley which is
in turn a tributary to the Hasbani River.
The Rachaiya el Foukhar site is located on the southern banks of Ras En Nimer valley,
which hosts an intermittent river that originates from Kfar Hamam village. This intermittent
river discharges in the Hasbani River further few kilometers down stream towards the west.
The river dries out most of the summer season. Because of the nature of the Kesrouane-
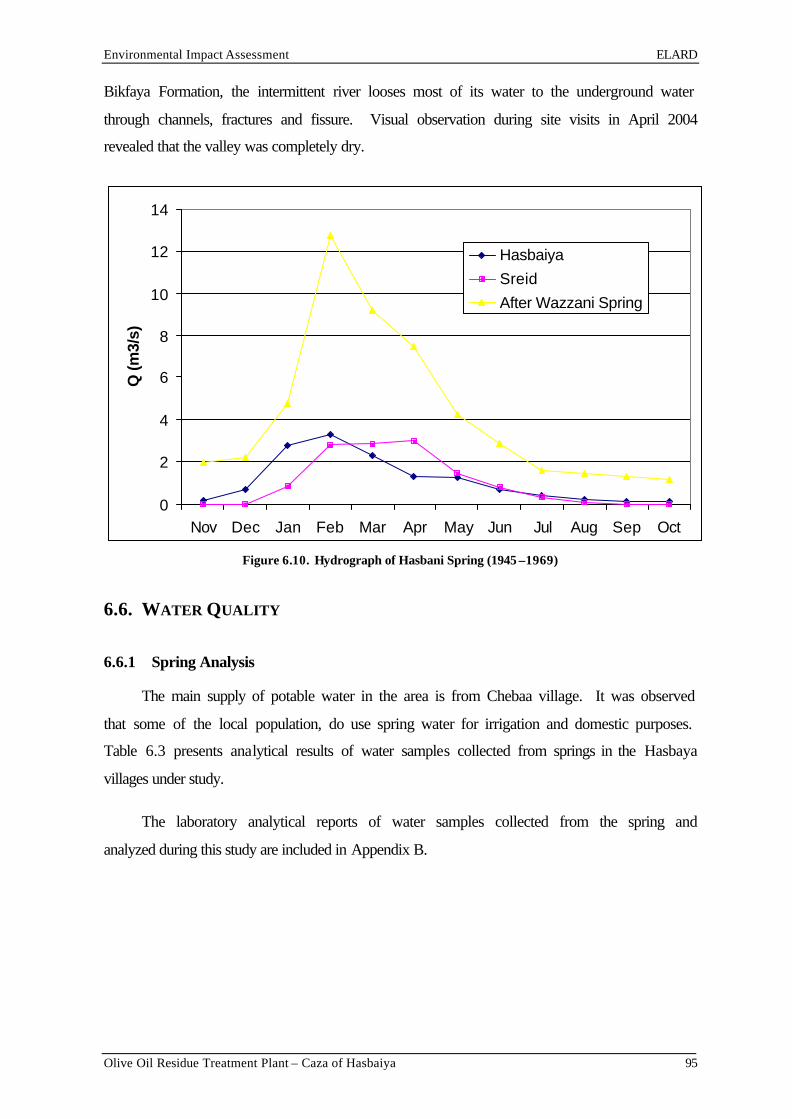
Environmental Impact Assessment ELARD
Olive Oil Residue Treatment Plant – Caza of Hasbaiya 95
Bikfaya Formation, the intermittent river looses most of its water to the underground water
through channels, fractures and fissure. Visual observation during site visits in April 2004
revealed that the valley was completely dry.
0
2
4
6
8
10
12
14
Nov Dec Jan Feb Mar Apr May Jun Jul Aug Sep Oct
Q (m
3/s)
Hasbaiya
Sreid
After Wazzani Spring
Figure 6.10. Hydrograph of Hasbani Spring (1945 –1969)
6.6. WATER QUALITY
6.6.1 Spring Analysis
The main supply of potable water in the area is from Chebaa village. It was observed
that some of the local population, do use spring water for irrigation and domestic purposes.
Table 6.3 presents analytical results of water samples collected from springs in the Hasbaya
villages under study.
The laboratory analytical reports of water samples collected from the spring and
analyzed during this study are included in Appendix B.

Environmental Impact Assessment ELARD
Olive Oil Residue Treatment Plant – Caza of Hasbaiya 96
Table 6.3. Laboratory Analytical Results of Springs in Hasbaya Villages (Samples Collected on 04/05/2004)
Sample ID
Spring name / location ph (pH unit) Biochemical Oxygen Demand (mg/l)
Faecal Coliform (CFU/100
ml)
Total Coliform (CFU/100
ml)
1 Nabaa El Haddatha / Mimes
6.95 <2 12 12
2 Kaoukaba Spring/ Kaoukaba village
7.18 <2 250 >1000
3 S1 Spring/ Rachaiya el Foukhar village
6.92 <2 0 0
4 S2 Spring/Rachaiya el Foukhar village
6.95 <2 0 4
5 Ain Qenia Spring/ Ain Qenia village
7.27 <2 >1000 >1000
6 Ain Jarfa Spring/ Ain Jarfa village
7.27 <2 >1000 >1000
Maximum Allowable Levels ∗
6 to 9 5 0 0
* Drinking Water Standards per Ministerial Decision 52/1
6.6.2 Hasbani River Analysis
The Hasbani River, which originates from the Hasbani Spring, flows in the southward
direction and leaves the Lebanese territories near the Wezzani Spring. The river was
sampled at 3 random locations in order to measure the level of contamination or pollution
due to the uncontrolled raw sewage and olive oil residue discharges into that river.
Table 6.4 presents analytical results of water samples collected from the Hasbani River. The
samples were collected at three different locations along the study area (Topographic Map
Appendix B):
Location 1: In Kaoukaba village close to the potential location of the Kaoukaba Plant.
Location 2: Underneath the bridge, at the connection between the intermittent river in
Chebaa Valley and the Hasbani River
Location 3: In El Mari Village close to the potential location of the El Mari Plant
According to a general quality assessment of rivers and canals presented in Table 6.5,
the concerned river could be classified as of a grade A. Therefore, water quality in the

Environmental Impact Assessment ELARD
Olive Oil Residue Treatment Plant – Caza of Hasbaiya 97
Hasbani River is considered good, since there is no major industrial wastewater discharge in
the area. However, this type of chemical grading does not take into consideration the
bacteriological criteria of the water. It is then conclusive that the main cause of Hasbani
river degradation is the uncontrolled raw sewage discharged and olive oil residue upstream
of the sample collection locations.
Table 6.4. Laboratory Analytical Results of three samples collected from random locations over the Hasbani River (Results as population count per 100 ml)
Sample Location
pH
(pH Unit)
Conductivity(µSiemens/cm
at 25ºC)
Nitrates (mg/L NO3)
Ammonia
(mg N/l)
Biochemical Oxygen Demand
(mg/l)
Chemical Oxygen Demand
(mg/l)
Faecal Coliform
(CFU/100ml)
Total Coliform
(CFU/100ml)
Location 1
7.89 445 2.4 0.07 <2 <2 >500 >500
Location 2
7.98 442 2.4 0.06 <2 <2 >500 >500
Location 3
8.08 358 2.2 0.02 <2 <2 170 >1000
Table 6.5. Chemical Grading for Rivers and Canals. (Thames river-Standards 2000)
Water Quality Grade Dissolved Oxygen
(% saturation)
Biochemical Oxygen
Demand (mg/l)
Ammonia
(mg N/l)
A 80 2.5 0.25 Good
B 70 4 0.6
C 60 6 1.3 Fair
D 50 8 2.5
Poor E 20 15 9.0
Bad F*
*Quality which does not meet the requirements of grade E in respect of one or more determinates
6.7. ECOLOGICAL CONTEXT (BIODIVERSITY)
Ecologically, all proposed locations are not in an areas of special concern, such as
areas designated as having national or international importance (e.g. world heritages,
wetlands, biosphere reserve, wildlife refuge, or protected areas). In all cases, the project will
not lead to the extinction of endangered and endemic species, critical ecosystems, and
habitats.

Environmental Impact Assessment ELARD
Olive Oil Residue Treatment Plant – Caza of Hasbaiya 98
The six project areas are situated in the Eu-mediterranean zone. In Mimes and Kfeir,
where olives tree orchards dominate the hills above and around the proposed sites along
with some old vine trees. The Kaoukaba and Rachaiya el Foukhar sites are dominated by
oak trees (Quercus spp). In Ain Jarfa and Ain Qenia, the project area is situated in the
dominating Pine tree and shrub covering the mountain above and around the proposed site
along with some spinosa flowering plants. Also a variety of shrubs and grasses grow within
such as Spartium spp, identified in Mimes and Kfeir. However, in a general manner, the
sites for OORTPs are proposed on either relatively less dense area (such as in Kaoukaba), on
a very ecologically degraded parcel of land (such as in Ain Jarfa), or at the outskirt of
uncultivated land and old terraces used for agricultural activity (such as in Mimes).
Photograph 6.13. Pine Tree and Shrub Community around the Site in Ain Qenia

Environmental Impact Assessment ELARD
Olive Oil Residue Treatment Plant – Caza of Hasbaiya 99
Photograph 6.14. Quercus spp. Community Around the Site in Mimes
Photograph 6.15. Spartium spp. at the Edge of the Kaoukaba Site
6.8. INFRASTRUCTURE STATUS
In general, no internal network infrastructure is present for olive mill wastewater in all
villages under study. However, in Kaoukaba and Rachaiya el Foukhar, a network for
sewage discharge reaches the selected area and is expected to be used for the predicted
WWTP. The expected main sewage network can serve as an effluent discharge for the
OORTP. The OORTP effluent line can thus be connected to the WWTP to be located
adjacent to it and which will be connected to an intermittent stream falling into the Hasbani

Environmental Impact Assessment ELARD
Olive Oil Residue Treatment Plant – Caza of Hasbaiya 100
River in the case of Rachaiya el Foukhar; or directly into the Hasbani River in the case of
Kaoukaba.
Infrastructure within the towns is mainly limited to road network, telephone,
electricity, and water supply. The supply of water was elaborated on in the hydrological
section (Section 6.5.4). Wastewater treatment facilities are currently not available.
Domestic sewage is generally disposed of into “unregulated” septic tanks or discharged
directly onto open grounds.
6.9. SOCIO-ECONOMIC STATUS
Socio-economic information about the villages was obtained during informal meetings
with Mayor and municipal members during the field visits. Table 6.6 presents some socio-
economic information relevant to this study.
Local inhabitants are mainly members of the active population (between 20 and 50
years old); the average age all over the surveyed villages is around 40 years. The economy
in most municipalities of the area is mainly driven by public and private sector
employments. Trade and services are also prevalent. Money sent by expatriates (people
from the towns living abroad) is a main driver of the local economies as well. Tourism is
very limited, and industry is mainly absent.
Average household income amounts to less than six million Lebanese pounds annually
(or around 500,000 Lebanese pounds monthly).

Environmental Impact Assessment ELARD
Olive Oil Residue Treatment Plant – Caza of Hasbaiya 101
Table 6.6. Socio-Economic Information (as given by Municipalities)
Municipality Population
Year-round/ Seasonal
Priority for the Community
Economy Driver Health & Educational
Services
Farms & Farming
Industry
Mimes 2000/ 4500
Olive mill and domestic wastewater treatment
Agriculture (90%), services and employment (10%)
1 clinic Olives, fruit, and vegetables
Olive Oil Mills
Ain Jarfa 1900/ 2000
Domestic and olive mill wastewater treatment
Agriculture (85%), services and employment (15%)
1 clinic Fruit, vegetables, and olives
Olive Oil Mills
Ain Qenia 1900/ 2000
Domestic and olive mill wastewater treatment
Agriculture (85%), services and employment (15%)
1 clinic Fruit, vegetables, and olives
Olive Oil Mills
Rachaiya el
Foukhar
1500/ 4000
Domestic and olive mill wastewater treatment
Agriculture (90%), services and employment (10%)
1 clinic Fruit, vegetables, and olives
Olive Oil Mills
Kaoukaba 800/ 3000
Domestic and olive mill wastewater treatment
Agriculture (90%), Industry (5%), services and employment (5%)
One gas station Fruit, vegetables, and olives
Olive Oil Mills
Kfeir
Khalouat
2000/ 4500
Olive mill and domestic wastewater treatmen
Agriculture (90%), Industry (5%) and employment (5%)
1 school 1 clinic
Olives, fruit, and vegetables
Olive Oil Mills

Environmental Impact Assessment ELARD
Olive Oil Residue Treatment Plant – Caza of Hasbaiya 102
7. IMPACT IDENTIFICATION AND ANALYSIS
On-site and off-site impacts can be induced during the construction of the plants, and
later on during their operation. On-site impacts result from construction activities carried out
within the construction site. The impacts of off-site work result from activities carried out
outside the construction site yet are directly related to the project. In the case of Olive Oil
Residue Treatment Plants, the main potential receptors are soil, surface, and ground water
bodies. Identification of potential impacts is facilitated by the use of a matrix that shows the
main activities at the wastewater treatment plant, the major perturbation factors, and the
environmental media affected (Table 7.1). The extent of impacts depends primarily on the
effluents management practices that would be adopted during plant operation.
7.1. IMPACTS ON WATER RESOURCES
7.1.1 Impacts during Construction
No major on-site impacts on water resources are anticipated during the construction
phase of the plants nevertheless, some potential impacts have been identified and are
described below.
First, handling of the different equipments on-site presents a risk of contaminating the
underlying water resources due to possible frequent spillage of fuel and oil. Thus, measures
should be taken to avoid leakage of such material to the ground. In addition, dumping of
excavated debris and construction material nearby the seasonal stream would disturb the river
flow downstream and, in turn the water quantity reaching the Hasbani River. Special sites for
dumping construction material should be assigned, or the wastes could be transported to a
nearby landfill. Surface water quality can be altered due to possible dust deposition and
sediment accumulation into both perennial and seasonal streams.
Off-site impacts on water resources may occur from the reckless disposal of domestic as
well as industrial wastes, typically liquid and solid, generated form the residential units,
offices, and equipment and vehicles maintenance units at the contractor’s constructions site.
Where proper waste segregation and disposal is practiced, the likelihood of these impacts to
occur will be negligible, if not nil.

Environmental Impact Assessment ELARD
Olive Oil Residue Treatment Plant – Caza of Hasbaiya 103
Table 7.1. Impact Identification Matrix
Perturbation factor Wastewater Gas Emission Solid waste Odors Heavy metals Chemicals Noise Dust
Phase Activities
Earth moving √ √
Excavation √ √
Truck movement √ √
Con
stru
ctio
n
Erection √
Preliminary Treatment √ √ √
Secondary Treatment √ √
Sedimentation √
Sludge holding √ √
Sludge return √
Sludge dewatering √
Disinfection √
Effluent disposal √ √
Sludge disposal √ √ √ √
Ope
ratio
n
Spent Olives Disposal √ √ √ √
River √ √
Ground water √ √ √ √
Agricultural soil √ √ √ √ √
Nuisance √ √ √ √ √
Air quality √ √ Env
iron
men
tal
Med
ia
Biodiversity √ √ √ √ √ √

Environmental Impact Assessment ELARD
Olive Oil Residue Treatment Plant – Caza of Hasbaiya 104
7.1.2 Impacts during Operation
Impacts during the operation of the Olive Oil Residue Treatment Plants arise mainly
from the effluent management practices. The main water resources identified that could be
possibly affected by the operation of the plant are the site’s nearby seasonal river (except for
Kaoukaba), the Hasbani River, and groundwater. Possible negative impacts may be
generated by flooding or leakage from the treatment basins that can threaten groundwater
resources. The high amounts of phenolic compounds contained in the vegetable oil (olive oil
wastewater) can contaminate water sources due to their toxic nature. Leakage from the tanks
should thus be avoided by adopting proper engineering codes and adequate preventive
measures.
The effluent quality is expected to improve as the advanced treatment level has been
incorporated in the olive wastewater treatment for all plants except the Kaoukaba plant. At
first, preliminary and secondary treatment, obtained through coupling of up-flow anaerobic
sludge blanket and extended aeration activated sludge, would contribute to reducing
significantly the organic load and amount of suspended solids. Although the wastewater is
not of domestic origin, and therefore is not expected to contain Fecal Coliforms, it could hold
Total Coliforms that typically form on plant debris such as olive twigs, leaves or branches.
Thus, advanced treatment will allow bacterial population to be significantly suppressed. The
treated effluent could thus meet the Environmental Limit Values (ELV) for wastewater
discharged into surface waters, as specified by Ministerial Decision 8/1/2001. In addition, if
the option of dechlorinated effluent reuse in agriculture is held, this would lead to significant
positive impacts on improving the sector and reducing water shortages in the area. It is
noteworthy to mention that in the case of Kaoukaba, the secondary treated effluent will join
directly the flow of the Hasbani River, the flow reaches more than 0.1m3/sec according to
ELV standards. Therefore, since a proper dilution factor is provided, the effluent will not
have significant impacts on the overall Hasbani River quality.As for the sludge, screenings
and grit, generated from the olive wastewater treatment process, those wastes can have
significant negative impacts on water resources if not properly disposed or managed.
However, in the case of an olive oil residue treatment plant, sludge quantity is expected to
improve (thanks to the combined UASB/EAAS system), and there are practically very low
amounts of heavy metals in sludge originating from treating olive oil vegetable water.
Therefore, the dried sludge can be used safely for soil application (quarry rehabilitation,
landscaping) without causing environmental harm to the soil or water resources.

Environmental Impact Assessment ELARD
Olive Oil Residue Treatment Plant – Caza of Hasbaiya 105
In the worst case scenario, i.e. the treatment plant is not operating properly for example
due to malfunction of the anaerobic treatment component, the impacts would be similar to the
current situation (no treatment or status quo). The advantage of vegetative oil treatment is
that, as opposed to domestic wastewater, collection networks are not built, and therefore a
point source of pollution is not created in the case of plant malfunction.
7.2. IMPACTS ON SOIL
7.2.1 Impacts during Construction
The total volume of soil and rock that would be excavated during all plants construction
is relatively small and thus should not lead to major erosion problems and impacts on soils.
Soil pollution from on-site as well as off-site works may occur by the intentional or
accidental leakage of used chemicals, fuel, or oil products (from equipment and vehicles) on
construction sites. Such practices should be strictly avoided and utmost precautions and
workmanship performance should be adopted for the disposal of such hazardous products.
7.2.2 Impacts during Operation
The main concern during operation of the plants is related to soil quality rather than soil
quantity, and is primarily attributed to generated sludge management. Generated sludge from
treatment plants as well as pomace, are usually used as soil fertilizer due to its relatively high
nutrients content (whether used on site or off-site). However, if sludge or pomace application
is not properly conducted, it can cause damage to soil fertility by breaking the C/N ratios
and/or creating an imbalance in nutrient or pH levels, possibly pollute the soil, and eventually
reach the groundwater. Proper soil application depends not only on the sludge and pomace
quality, but also on the soil physical and chemical properties, which would dictate whether
the soil is suitable for receiving such material. In addition, even if the soil is suitable, sludge
application should not exceed a certain maximum application rate. This application rate is
not so limited for pomace. These measures are further elaborated in Appendix E.
7.3. IMPACTS ON HUMAN AMENITY
Human amenity is defined inhere as general comfort of persons that could eventually
be disturbed by factors such as dust, noise, and odors.

Environmental Impact Assessment ELARD
Olive Oil Residue Treatment Plant – Caza of Hasbaiya 106
7.3.1 Impacts during Construction
The main impacts on human amenity during plant construction are related to dust and
noise generation. An increase in ambient particulate matter may be observed primarily
during the excavation activities. However, given the fact that excavation will last for a
limited period, the impacts from potential dust generation will probably not be significant.
On the other hand, appreciable increases in noise levels may be expected during excavation
and erection of the plant. The noise impacts from excavation and associated truck
movements are however limited to construction phase.
7.3.2 Impacts during Operation
The main amenity impacts during plant operation are related to noise and odors. Noise
may be generated mainly from the blowers and generator operation. However, if adequate
noise reduction/suppression measures are undertaken, the generated noise should not
significantly affect human amenity.
Odors emitted at a wastewater treatment works may easily reach the local inhabitants;
especially if prevalent wind direction is towards the residential areas. Inlet works, grit
channels, screening and grit handling, aeration tanks, and sludge holding and dewatering
units are the main sources of odor at the OORTP facilities. However, in many instances,
odors can be reduced or prevented through normal housekeeping and improved operation and
maintenance design procedures. Odors may be primarily produced from storage of sludge
and spent olive paste on-site; therefore, sludge and pomace management (proper storage,
handling and off-site transportation and disposal) should be properly handled. Proper
management (through flaring) of the biogas generated from the anaerobic stage of the system
will also minimize the likelihood of odor generation from that source. Proper handling
procedures are presented in Section 8.2 and should be abided by in order to ensure an
extended life span for the plant and it sustainability.
7.4. IMPACTS ON PUBLIC AND OCCUPATIONAL SAFETY
7.4.1 Impacts during Construction
In any civil works, public as well as construction staff safety risks can arise from
various constructions activities such as deep excavations, operation, and movement of heavy
equipment and vehicles, storage of hazardous materials, disturbance of traffic, and exposure
of workers to running sewers. Because of the short duration and non-complexity of the

Environmental Impact Assessment ELARD
Olive Oil Residue Treatment Plant – Caza of Hasbaiya 107
construction phase, such activities are controlled and consequently the associated risks are
minimal. Proper supervision, high workmanship performance, and provision of adequate
safety measures will suppress the likelihood of such impacts on public and occupational
safety.
7.4.2 Impacts during Operation
During the operational phase of the plants, occupational safety is at a higher risk than
public safety. Fortunately, various mitigation measures can be easily adopted to minimize
occupational hazards. Such measures are detailed in section 8.2 and should be stringently
considered.
7.5. IMPACTS ON BIODIVERSITY
7.5.1 Impacts during Construction
The proposed sites are either right next to and overlapping olive orchards (e.g.
Kaoukaba)_ or at close proximity to oak trees or pine forests (Rachaiya el Foukhar, Ain
Qenia) therefore the proposed project will lead to some negative impacts on biodiversity. In
addition, throughout construction efforts should be taken to conserve present trees, around the
site. Potential negative impacts affecting biodiversity during project construction are
summarized in Table 7.2. The main construction activities having negative results on the
biodiversity are earth-moving activities, erection of the plant, and construction waste material
and effluent discharges. However, the potential negative impacts are not considered very
significant since the project does not affect any trees in the ecosystem.

Environmental Impact Assessment ELARD
Olive Oil Residue Treatment Plant – Caza of Hasbaiya 108
Table 7.2. Potential Negative Impacts on Biodiversity
Impact Cause
Habitat loss or destruction Construction works
Altered abiotic/site factors Soil compaction, erosion
Mortality of individual plant species Destruction of vegetation
Loss of individuals through emigration Following disturbance or loss of habitat
Habitat fragmentation Habitat removal and/or introduction of barriers like roads
Disturbance Due to construction noise, traffic, or presence of people
Altered species composition Changes in abiotic conditions, habitats…
Vegetation loss Soil contamination due to disposal of oils and hazardous material
7.5.2 Impacts during Operation
With proper management of effluent material, negative impacts on biodiversity during
operation of the plants should be minimal. On the contrary, the projects could lead to
positive environmental impacts on the biodiversity level if plans are developed to protect
surrounding areas. Inclusion of original species in the proposed landscape plan could be
adopted to alleviate visual impacts and compensate loss of communities. The surrounding
trees should be preserved in order to act as a windbreak and eventually reduce the dispersion
of odors around the plant.
7.6. IMPACTS ON HUMAN HEALTH AND SANITATION
The current lack of proper solid and liquid waste management is surely having a
negative impact on human health and the environment. Current and historical dumping of
wastes, whether in open dumps or in sinkholes, is directly polluting the environment and
water resources of the area, and is furnishing breeding habitats for rodents and diseases to
flourish. Such impacts will be mitigated by the deployment of a proper collection system and
by the treatment of the collected olive oil residual waste.
As a whole, the projects would lead to POSITIVE impacts with respect to human
health. Improvements in health conditions are likely to occur as the result of improvements
in surface, groundwater, and spring water quality as well as sanitation conditions.

Environmental Impact Assessment ELARD
Olive Oil Residue Treatment Plant – Caza of Hasbaiya 109
7.7. SOCIOECONOMIC IMPACTS
Additional POSITIVE impacts would be observed at the socioeconomic and agriculture
levels. The proposed projects will create certain job opportunities for skilled and unskilled
labor. Moreover, if the treated effluent is to be reused for irrigation, the projects may have
long-term positive impacts on agriculture, especially that at some locations farmers are
currently using raw sewage for irrigation. Moreover, the stabilized sludge and pomace can be
used as well in agricultural, municipal landscape or silviculture (as portrayed before)
fertilization practices, therefore alleviating organic or synthetic fertilizer costs on farmers.
With careful monitoring of pomace or sludge quality, these components would be of a benefit
and ensure a quick acceptance of this byproduct in the market or would be used in the
rehabilitation process of quarries.
7.8. IMPACTS ON ARCHAEOLOGICAL, TOURISTIC AND CULTURAL SITES
Impacts of the proposed OORTPs on archaeological, touristic, and cultural sites are not
significant since such activities are not existent within all sites’ surroundings.

Environmental Impact Assessment ELARD
Olive Oil Residue Treatment Plant – Caza of Hasbaiya 110
8. ENVIRONMENTAL MANAGEMENT PLAN
The proper implementation of a comprehensive environmental management plan
(EMP) will ensure that the proposed Olive Oil Residue Treatment Plants (OORTP) meet
regulatory and operational performance (technical) criteria.
8.1. OBJECTIVES OF THE ENVIRONMENTAL MANAGEMENT PLAN
Environmental management is essential for ensuring that identified impacts are
mitigated at an early stage, are maintained within the allowable levels, are properly
monitored, and that the expected project benefits are realized. Thus, the aim of an EMP is to
assist in the systematic and prompt recognition of problems and the effective actions to
correct them, and ultimately good environmental performance is achieved. A good
understanding of environmental priorities and policies, proper management of the plants (at
the municipality level), knowledge of regulatory requirements and keeping up-to-date
operational information are basic to good environmental performance.
8.2. MITIGATION MEASURES
8.2.1 Defining Mitigation
As part of the EMP, mitigation refers to the set of measures taken to eliminate, reduce,
or remedy potential undesirable effects resulting from the proposed action, here the olive oil
residue treatment plant. Mitigation should be typically considered in all the developmental
stages of the facilites, namely, the sites’ selection process, as well as the design, construction,
and operation phases. Once set, tender documents should clearly describe mitigation
measures and workmanship to be adopted by the contractors or operators.
8.2.2 Mitigating Adverse Project Impacts
As identified earlier, potential adverse impacts of the proposed OORTPs may include
dust emissions, odor and aerosol generation, noise generation, degradation of natural
resources, production of residuals, public health hazards, and adverse aesthetic impacts.
Proposed mitigation measures for the above-mentioned adverse impacts are discussed in the
following paragraphs.

Environmental Impact Assessment ELARD
Olive Oil Residue Treatment Plant – Caza of Hasbaiya 111
Table 8.3 summarizes such mitigation measures, their monitoring for actions affecting
environmental resources and human amenity. Such measures should be set as primary
conditions on the contractors, the supervising engineers, the OORTP administrations, and
operating staff in order to assure a proper management of each plant as well as the
implementation of the Environmental Management Plan (EMP).
8.2.2.1 Mitigating Degradation of Receiving Water Quality
In general, secondary olive mill wastewater treatment, and specifically the extended
aeration activated sludge treatment system following pre-treatment and coupled with
anaerobic upflow sludge blanket treatment, produce a highly treated and well-nitrified
effluent that meets secondary effluent quality standards. Disinfection will further suppress
total coliform bacterial population in the discharged effluent. Thus, the proposed facilities’
discharge effluent quality is expected to meet the Environmental Limit Values (ELV) for
wastewater discharged into surface waters, as specified in the National Standards for
Environmental Quality. When secondary effluent guidelines are met, the effluent can be
safely used for irrigation (Appendix F).
It is essential that discharge points be downstream of vital springs however, in the case
of all sites except Kaoukaba, namely Ain Jarfa, Ain Qenia, Kfeir-Khalouat, Mimes and
Rachaiya el Foukhar, since discharge point will be unwillingly located upstream therefore a
tertiary level with bacterial disinfection and filtration was recommended. In the absence of
nearby perennial streams, the geological setting of the area was thoroughly considered and
studied before considering the discharge of the effluent on land or in the available
intermittent stream. Generally,, tributaries to the Hasbani River will collect the effluent and
further convey the water downstream to the main river flow. Moreover, in the case of
Mimes, the main aquifer in the study area is the Sannine aquifer, which is characterized by a
high secondary porosity causing groundwater to flow through fractures and channels, thus
constituting potential risks to groundwater contamination. In order to protect the karstic
Sannine Aquifer from any leak, malfunction or disaster, a protective seal is required
underneath the plant with a proper containment system. The mitigation measure should be
implemented at the OORTP site in Ain Jarfa, where the underlying Kesrouane Formation
could constitute a potential risk for groundwater contamination

Environmental Impact Assessment ELARD
Olive Oil Residue Treatment Plant – Caza of Hasbaiya 112
To attain the expected safe effluent discharge, a skilled and trained operator is
necessary for proper process loading, optimization, control, and thus performance.
Operational upsets due to ambient temperature variations should be overcome by the
provision of adequate preventive measures such as proper covers and thermal accessories.
The implementation of training recommendations, maintenance plans, and process and
effluent monitoring programs should be mandatory. Sufficient instrumentation and standby
equipment (blowers, pumps, and electric generators) should be provided to ensure an
uninterrupted and controlled operation, thus avoid inefficient process performance. Drains
and bypasses should be designed for emergency cases.
Alterations or drops in temperature are likely to occur during the operational period of
mid-October to mid-February, and can affect the efficiency of the UASB, which requires
minimal temperatures of 20ºC for proper functioning and wastewater treatment. Therefore,
as a mitigation measure, the UASB is going to be both insulated and equipped with an
underground tank to conserve and maintain a minimum temperature of 20ºC. In addition,
solar panels will be installed to provide the extra power supply for the necessary heat for the
UASB reactor. All three preventive measures, underground tank, solar panels, and
insulation, will contribute to the maintenance of a steady and adequate environment for the
necessary anaerobic microorganism growth. Finally, as a last resort to alleviate the negative
effects of any possible temperature dropouts, methane gas from the anaerobic processes can
be recovered and used for heating up the UASB reactor and returning its temperature to an
acceptable level.
8.2.2.2 Mitigating Dust Emissions
Dust emissions from piles of soil or from any other material during earthwork,
excavation, and transportation should be controlled by wetting surfaces, using temporary
windbreaks, and covering truckloads. Piles and heaps of soil should not be left over by
contractors after construction is completed. In addition, excavated sites should be covered
with suitable solid material and vegetation growth induced after construction completion, no
soil surface should be kept bare subject to erosion. It is the responsibility of the Supervision
Engineer to monitor for the mitigation of such impacts.

Environmental Impact Assessment ELARD
Olive Oil Residue Treatment Plant – Caza of Hasbaiya 113
8.2.2.3 Mitigating Noise Pollution
Temporary noise pollution due to construction works should be controlled by proper
maintenance of equipment and vehicles, and tuning of engines and mufflers. Construction
works should be completed in as short a period as possible by assigning qualified engineers
and supervisors. It is the responsibility of the Supervision Engineer to monitor for the
mitigation of such impacts.
Noise pollution during operation would be generated by mechanical equipment, namely
pumps, air blowers, and sludge dewatering units. Noise problems should be reduced to
normally acceptable levels by incorporating low-noise equipment in the design and/or
locating such mechanical equipment in properly acoustically lined buildings or enclosures.
Moreover, a silencer can be installed on the electricity generator to comply with the national
standards for noise pollution. In the presence of adequate buffer zones between the facility
and residential areas, the need for noise control measures is minimized. Furthermore,
dispersion of noise can be reduced by preserving the surrounding Quercus spp. trees that will
act as a wind and sound break.
8.2.2.4 Mitigating Obnoxious Odors
Odors emitted by the olive oil residue treatment works may be potential nuisance to the
public. Inlet works, grit channels, screening and grit handling, aeration tanks, and sludge
holding and dewatering units are the main sources of odor at the olive oil residue treatment
facility. However, in many instances, odors can be reduced or prevented through normal
housekeeping, improved operation, and maintenance design procedures. When kept clean,
sludge transfer systems, such as conveyors, screw pumps, and conduits, will not generate
odors.
In general, the primary mitigation measure for odor control remains the proper siting of
the facility. The plant should be located at a site where prevailing winds mostly blow away
from nearby residential areas. In addition, adequate buffers from treatment units should be
considered. As a guide, suggested minimum buffer distances from some treatment units are
presented in Table 8.1.

Environmental Impact Assessment ELARD
Olive Oil Residue Treatment Plant – Caza of Hasbaiya 114
Table 8.1. Suggested minimum buffer distances from treatment units
Operation unit/process Buffer distance (m)
Sedimentation tank 120
Aerated tank 150
Aerated lagoon 300
Sludge holding tank 300
Sludge thickening tank 300
Sludge drying beds (open) 150
Sludge drying beds (covered) 120
Sludge digester 150
Gases released from anaerobic activity in the UASB reactors could be a source of
obnoxious odor and therefore should be collected by the gas collection system. Proper
construction and maintenance of the reactor is critical to avoid leakages. Concrete gas
collectors should be lined to reduce corrosion. As for the biogas byproduct, it should not be
released into the atmosphere but rather be used as an energy source, disposed of by flaring.
Activated sludge tanks do not normally emit an objectionable odor when a dissolved
oxygen level of ≥ 2 mg/L is maintained in the mixed liquor. Thus, it is essential to execute a
regular program of maintenance to prevent the clogging of diffuser plates to maintain
adequate dissolved oxygen levels in the aeration tanks, which in turn minimizes the chances
for the production of odorous compounds. Regular cleaning of aeration tank walls and floors,
washing weirs, and removing scum regularly, also helps in odor reduction.
Where odor emissions could lead to complaints, the provision of covers to the odor
sources should be considered, especially for sludge holding tanks and sludge dewatering
systems. To reduce odors from final settlement tanks and sludge holding tanks, logical
operational solutions include increasing the pumping rate of the thickened sludge, monitoring
a low sludge blanket level, and increasing the influent flow rate to the sludge-holding tank
without losing thickening. Tank mixing during off-shifts will also minimize the release of
trapped gas during the day. Occasional tank draining and filling it with chlorinated water
further reduces odor problems. To reduce odors from dewatering units, pH adjustment or
introduction of chemicals may be employed. The odorous air from enclosed unit operations,
such as belt presses, may be collected at a central area and relevant odor treatment processes

Environmental Impact Assessment ELARD
Olive Oil Residue Treatment Plant – Caza of Hasbaiya 115
applied. An affordable measure to reduce partly odor problems can be storing produced
residuals in closed containers and transporting them in enclosed container trucks. Flow
regulating chambers, drainage valves, standby pumps, as well as electric standby generators
should be provided to reduce the possibility of wastewater flooding within the wastewater
treatment plant site, which results in possible generation of obnoxious smell. The presence of
multiple aeration basins in the plant also reduces overflowing problems.
Proper landscaping around the different facilities along with the existing landscape may
serve as a natural windbreaker and minimize potential odor dispersions. When odor becomes
an evident public nuisance, synthetic windbreakers (e.g. walls) should be employed to
maintain odor nuisance within each site.
8.2.2.5 Mitigating Aerosol Emissions
The process of aeration may result in the emission of sprays or aerosols. To limit such
emissions, adequate feedboards should be considered, or suppression hoods, splash plates or
deflectors be incorporated on the rotors, if employed. Moreover, the edge of the aeration
basin can be raised 50-60 cm above water level to reduce aerosol emission.
8.2.2.6 Mitigating Impact on Biodiversity
Recommended mitigation measures to minimize or eliminate the impacts on the
biodiversity at proposed locations, include:
• Minimize deforestation activities: plan the building sites and roads on areas with
minimum trees.
• Design a landscape plan that enhances the landscape esthetic value using local and native
population flora.
• When detected, sensitive species or habitats should be conserved.
• All waste resulting from construction works, land reclamation, or any other activity
should be collected and disposed properly in an allocated disposal site. Littering in the
project area and surrounding areas should be prevented.
Table 8.2 presents additional mitigation measures specific to locations.
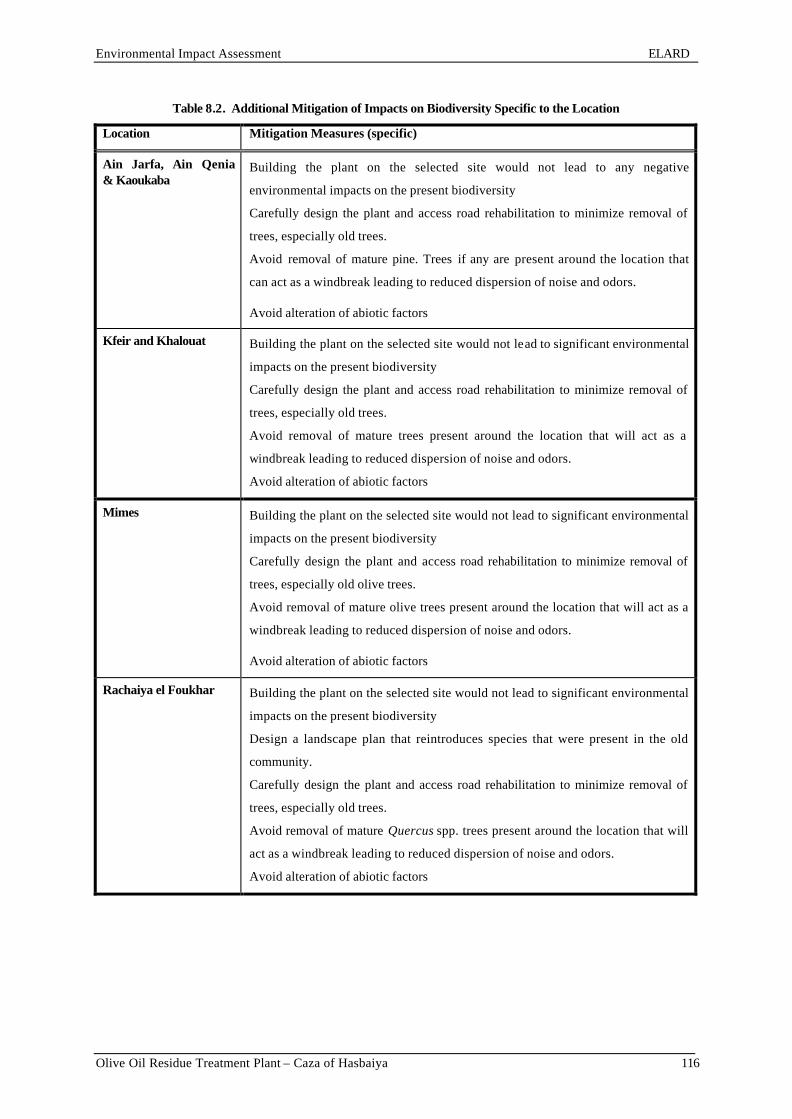
Environmental Impact Assessment ELARD
Olive Oil Residue Treatment Plant – Caza of Hasbaiya 116
Table 8.2. Additional Mitigation of Impacts on Biodiversity Specific to the Location
Location Mitigation Measures (specific)
Ain Jarfa, Ain Qenia & Kaoukaba
Building the plant on the selected site would not lead to any negative
environmental impacts on the present biodiversity
Carefully design the plant and access road rehabilitation to minimize removal of
trees, especially old trees.
Avoid removal of mature pine. Trees if any are present around the location that
can act as a windbreak leading to reduced dispersion of noise and odors.
Avoid alteration of abiotic factors
Kfeir and Khalouat Building the plant on the selected site would not lead to significant environmental
impacts on the present biodiversity
Carefully design the plant and access road rehabilitation to minimize removal of
trees, especially old trees.
Avoid removal of mature trees present around the location that will act as a
windbreak leading to reduced dispersion of noise and odors.
Avoid alteration of abiotic factors
Mimes Building the plant on the selected site would not lead to significant environmental
impacts on the present biodiversity
Carefully design the plant and access road rehabilitation to minimize removal of
trees, especially old olive trees.
Avoid removal of mature olive trees present around the location that will act as a
windbreak leading to reduced dispersion of noise and odors.
Avoid alteration of abiotic factors
Rachaiya el Foukhar Building the plant on the selected site would not lead to significant environmental
impacts on the present biodiversity
Design a landscape plan that reintroduces species that were present in the old
community.
Carefully design the plant and access road rehabilitation to minimize removal of
trees, especially old trees.
Avoid removal of mature Quercus spp. trees present around the location that will
act as a windbreak leading to reduced dispersion of noise and odors.
Avoid alteration of abiotic factors

Environmental Impact Assessment ELARD
Olive Oil Residue Treatment Plant – Caza of Hasbaiya 117
8.2.2.7 Mitigating Impacts from Residual Storage, Handling, Transport, and Reuse/Disposal
The residuals resulting from extended aeration activated sludge treatment systems
include screenings, grit, scum, stabilized pomace, and sludge. To reduce potential impacts of
such residuals, proper handling, storage, transport, and disposal/reuse strategies should be
adopted.
Screenings: When the plants are equipped with screens, these are to be cleaned
regularly and screenings drained on a platform. Drained screenings should be collected in
open containers for ultimate transport and disposal at a nearby municipal solid waste disposal
site, selected and approved by MoE. Hauling of screenings is to be carried by closed-top
trucks.
Grit: In case of Grit removal device presence: Grit usually consists of sand and gravel,
from properly designed and operated gravity grit separators, is generally inert in nature, low
in organic content, and relatively innocuous. However, in this case, the grit will also contain
organic constituents such as small and heavy olive tree or olive fruit parts. The proper design
and operation of grit chamber serves as the primary mitigation measure. Grit is to be washed
daily and separated such that large organic constituents that are trapped with the grit will be
recycled back into the flow stream. This will maintain a small amount of mainly inorganic
odorless clean grit in open storage. The washed grit could then be disposed on a nearby
rubble land, if available.
Scum: Adequate scum collection and removal facilities are to be provided in the final
settlement tanks of the extended aeration activated sludge system to prevent floating material
and scum to be carried with the effluent and deteriorate its quality. Collected scum can be
treated with the sludge or pomace.
Oil and grease could pose a serious problem since their discharge into the wastewater
treatment plant can hinder high purification efficiency and hinder operational upsets.
Therefore, the incorporation of an interceptor tank to trap grease will reduce the chances of
encountering troublesome grease persistence in the system. The trapped oil can serve as an
excellent addition to the pomace thus making it a more efficient and valuable fuel. Sludge:
Due to the long solids retention time (SRT) and the prevailing aerobic conditions in the

Environmental Impact Assessment ELARD
Olive Oil Residue Treatment Plant – Caza of Hasbaiya 118
trickling filter and extended aeration activated sludge systems, the production of wasted
sludge is somewhat reduced and the waste sludge is organically more stable. Thus, toxic and
obnoxious gases are less expected to emanate. The proper design and operation of proposed
sludge handling and treatment units will mitigate sludge-induced impacts. The dewatered
sludge storage area should be bounded to contain any surplus liquids, which should be
returned to the inlet works. Adequate storage capacities are to be provided on-site. Transport
of sludge should be by top-covered trucks. Truck drivers should be instructed not to have the
truck wheels come in contact with the sludge when loading, and not to overload to avoid
spillage along travel roads. It is recommended to use the produced sludge for agricultural
landscape fertilization programs, land reclamation etc; thus, agreements are to be set up with
proper authorities or private individuals for sludge reuse. Since the residual wastewater
discharged into the plants is basically of agricultural olive origin, the concentration of heavy
toxic metals in the sludge is expected to be very low.
Nitrification and denitrification are expected to occur in an extended aeration system,
thus the impact of excess nitrates on the soil will also be partially overcome. Appropriate
methods and proper management at the agricultural sites also have to be implemented to
minimize adverse impacts due to sludge or olive pomace reuse. Farmers should not spread
the sludge onto land by hand as to avoid health risks as well as proper and specific guidelines
should be implemented, incorporating the sludge or compost into the soil by mixing and
adequately covering with soil. Protective clothing should also be worn for sludge
application. The sludge should not be applied to wet or frozen soils. Farmers should be well
trained and informed to accept the issue of using sludge as organic fertilizer.
In the absence of adequate markets for sludge reuse, alternative environmentally sound
sludge management strategies should be considered. This may be proper landfilling,
incineration, or use for land and quarries rehabilitation.
Olive Mill Pomace: This by-product of olive mill processes can be kept at the mills and
commercially sold as fuel, or olive pomace charcoal, to local inhabitants who are already
using it for that purpose. A discussed earlier, pomace is also an excellent ingredient for
composting processes. Thus, it should not pose any environmental problems or
complications and will generate income for the mill owners.

Environmental Impact Assessment ELARD
Olive Oil Residue Treatment Plant – Caza of Hasbaiya 119
8.2.2.8 Mitigating Adverse Aesthetic Impacts
To avoid possible visual impacts resulting from the existence of olive oil residue
treatment facilities, the following steps are to be implemented:
q Maintaining cleanliness within each treatment plant (preventing spillovers, cleaning
roads and ground, etc.).
q Appropriate landscaping of the plant grounds with planting of suitable trees, grass,
and flowers, the reforested area should reach a minimum of 10 % of the area of the
construction site (according to MoE environmental criteria for the construction and
establishment of small-scale wastewater treatment plant)
q Fencing and screening the site with appropriate trees to obstruct the plant
components from onlookers and area inhabitants. (All along with some noise
reduction).
q Preserve the surrounding forest that will provide appropriate visual cover of the
facility.
8.2.2.9 Mitigating Public and Occupational Health Hazards
The likelihood of impacts on public and occupational safety can be significantly
suppressed by the following mitigation measures:
q Restricting unattended public access to the olive oil residue treatment plants by
proper fencing and guarding.
q Surrounding excavated locations with proper safety barriers and signs.
q Controlling movement of equipment and vehicles to and from the site, especially in
the construction phase.
q Properly labeling and storing chemicals (Chlorine gas or powder), oils, and fuel to
be used on-sites.
q Emphasizing safety education and training for system staff. Enforcing adherence to
safety procedures.
q Providing appropriate safety equipment, fire protection measures, and monitoring
instruments.
q Providing hand railing around all open treatment units, except where sidewalls
extend ≥1.1 meters above ground level.

Environmental Impact Assessment ELARD
Olive Oil Residue Treatment Plant – Caza of Hasbaiya 120
q Properly rating electrical installations and equipment and, where applicable,
protecting them for use in flammable atmosphere.
q Providing sufficient lighting that should comply with zoning requirements.
As a conclusion, proper supervision, high workmanship performance, and provision of
adequate safety measures will alleviate public and occupational risks.

Environmental Impact Assessment ELARD
Olive Oil Residue Treatment Plant – Caza of Hasbaiya 121
Table 8.3. Mitigation Measures, Monitoring, and Estimated Costs for Actions Affecting Environmental Resources and Human Amenity
Action Potential impact Mitigation measures Monitoring of mitigation measures /
responsibility
Estimated cost of mitigation
(USD)
A. During Construction
• Dust emission • Wetting excavated surfaces
• Using temporary windbreaks
• Covering truck loads
Supervision engineers Required in tender/ Included within
contract
• Noise generation • Restriction of working hours to daytime
• Employing low noise equipment
• Proper maintenance of equipment and vehicles, and tuning of engines and mufflers
Supervision engineers Priced within contract
• Erosion • Proper resurfacing of exposed areas
• Inducing vegetation growth
Supervision engineers ditto
Excavation and earth movement
• Disturbance to biodiversity • Conservation of present trees and used as wind brakes and esthetic cover for the facility.
• Inducing vegetation growth
Supervision engineers ditto
Dumping of excavated and construction material into nearby watercourses
• Surface and groundwater pollution
• Prohibition of uncontrolled dumping. Disposal at appropriate locations
• Education of workers on environmental protection
Supervision engineers ditto
Discharge of wastes (chemicals, oils, lubricants, etc.) on-site
• Soil and water pollution • Prohibition of uncontrolled discharge. Proper disposal of hazardous products
• Education of workers on environmental protection
Supervision engineers ditto
Storage of hazardous material, traffic deviation, deep excavation, movement of heavy vehicles, exposure to running sewers, etc.
• Hazards to public and occupational safety
• Proper supervision for high workmanship performance
• Provision of adequate safety measures, and implementation of health and safety standards
Supervision engineers ditto

Environmental Impact Assessment ELARD
Olive Oil Residue Treatment Plant – Caza of Hasbaiya 122
B. During Design & Operation
• Improving operation and maintenance design procedures
• Provision of covers where possible
• Landscaping a proper natural windbreaker around the facility
• Preservation of the Quercus spp trees around the plant site act as windbreaks.
• Proper treatment and management of biogas
• Proper sealing of anaerobic reactor
Design engineers • Generation of obnoxious odors
• Maintaining proper cleanliness and housekeeping
• Transportation of odorous byproducts in enclosed container trucks
• Diluting, masking or treatment of odorous emissions
OORTP administration and operating staff
ditto
• Impaired aesthetics • Maintaining cleanliness around and within the plant
• Proper fencing and landscaping
• Preservation of the Quercus spp trees around the plant site.
OORTP administration and operating staff
ditto
• Aerosol emissions • Allowing adequate feedboards for aeration basins
• Employing suppression hoods or splash deflectors on rotors
Design engineers ditto
Inadequate process design and control
• Noise generation • Incorporating low-noise equipment
• Locating mechanical equipment in proper acoustically-lined enclosures
• Preservation of the Quercus spp trees around the plant site
Design engineers ditto

Environmental Impact Assessment ELARD
Olive Oil Residue Treatment Plant – Caza of Hasbaiya 123
• Public & occupational hazards • Restricting unattended public access
• Providing adequate safety measures and monitoring equipment
• Emphasizing safety education and training for system staff
• Implementing health and safety standards
OORTP administration and operating staff
ditto
• Pollution of effluent receiving water bodies
• Monitoring of influent/effluent quality at each stage: UASB and EAAS
• Monitoring of effluent quality for surface water, groundwater, or marine discharge
• Effluent discharge in accordance with MoE’s ELV
• Provision in the design of a protective seal underneath the plant to protect the underlying karstic Sannine aquifer
• Insulation of UASB reactor, construction of an underground tank and installation of solar panels for UASB temperature preservation and stability
• Biogas recovcery for heat generation in the UASB reactor in case of temperature drop-outs or decrease below temperature requirements
MoE or MoEW N/A Inappropriate effluent management practices
• Contamination of crops and vegetables irrigated with effluent
• Monitoring the suitability of effluent for crop irrigation
• Training farmers for the proper handling of effluent
MoE or MoA N/A
Inappropriate screenings and grit management practices
• Soil and groundwater pollution at storage and disposal sites
• Proper washing, draining, and separating of screenings and grit
• Hauling in closed-top trucks and disposal at an allocated municipal solid waste disposal site.
OORTP administration and operational staff
Operation and maintenance

Environmental Impact Assessment ELARD
Olive Oil Residue Treatment Plant – Caza of Hasbaiya 124
Inappropriate sludge or treated olive pomace management practices
• Soil and groundwater pollution at sludge storage, disposal, or reuse sites
• Proper design and operation of sludge handling and treatment units
• Provision of adequate storage areas and capacities on-site
• Proper sludge transport by top-covered trucks
• Monitoring of sludge quality prior to disposal or reuse
• Training farmers for the proper handling and use of sludge at the agricultural sites
Design engineers and operational staff
Design engineers OORTP administration and operation staff
OORTP administration and operation staff
Ministry of Agriculture or private comp anies
Operation and maintenance

Environmental Impact Assessment ELARD
Olive Oil Residue Treatment Plant – Caza of Hasbaiya 125
8.3. MONITORING PLAN
Two monitoring activities have to be initiated for the proposed Olive Oil Residue
Treatment Plants (OORTPs) to ensure the environmental soundness of the projects. The first
is compliance monitoring, and the second is impact detection monitoring. Compliance
monitoring provides for the control of olive oil residue treatment operational activities, while
impact detection monitoring relates to detecting the impact of the operation on the
environment. Together, the objective is to improve the quality and availability of data on the
effectiveness of operation, equipment, and design measures and eventually on the protection
of the environment.
8.3.1 Compliance Monitoring
In this context, compliance to the regulations set by the Ministry of Environment to
limit air, water, and soil pollution shall be observed. Compliance monitoring requirements
include process control testing, process performance testing, and occupational health
monitoring. Compliance monitoring shall be the responsibility of the treatment plant
administration (municipality), thus monitoring activities shall be budgeted for accordingly.
For effective compliance monitoring, the following shall be assured:
q Trained staff (plant operators, laboratory staff, maintenance teams, etc.) and defined
responsibilities
q Adequate analytical facility (ies), equipment, and materials, if possible.
q Authorized Standard Operating Protocols (SOPs) for representative sampling,
laboratory analysis, and data analysis.
q Maintenance and calibration of monitoring equipment.
q Provision of safe storage and retention of records.
In the proposed olive oil residue treatment facilities, qualified plant operators and
laboratory staff should carry out process control and performance testing. The technical staff
that would run the plants shall attend training programs to improve their qualifications and
update their information. Both Contractors and Consultants would be involved in knowledge

Environmental Impact Assessment ELARD
Olive Oil Residue Treatment Plant – Caza of Hasbaiya 126
transfer to operators and management through regular assistance and specialized technical
workshops.
For the combined upflow anaerobic sludge blanket and extended aeration activated
sludge system; a comprehensive list of process control parameters is presented in Table 8.4.
It is noteworthy to mention that the olive oil residue treatment plant proprietor or operator
should cooperate with the technology provider for a better approach in process control. This
course of action is needed since a precise and adapted process control strategy translates into a
better process performance, and thus compliance. Accurate process control is even more
essential at the start-up phase of the activated sludge system to ensure a subsequent uniform
operational phase.

Environmental Impact Assessment ELARD
Olive Oil Residue Treatment Plant – Caza of Hasbaiya 127
Table 8.4. Process Control Parameters for the UASB-EAAS System
Sample Sampling Location Analytical Parameter
Type 1 Frequency2
Flow In situ D
pH In situ D
Plant influent 3
Total Suspended Solids C 1/W
UASB Compartment Ambient Temperature In situ D
Flow In situ D
pH In situ D
Temperature In situ D
UASB Influent
Total Suspended Soldis C 1/W
UASB reactor Temperature In situ D
Flow In situ D
pH In situ D
Temperature In situ D
Total Suspended solids C 1/W
EAAS Influent / UASB Effluent
Dissolved Oxygen In situ D
Dissolved oxygen In situ D
pH In situ D
Temperature In situ D
Total Suspended Solids C 1/W
Mixed liquor
Volatile Suspended Solids C 1/W
Flow In situ D Return activated sludge line
Total Suspended Solids C 1/M
Flow In situ D Waste activated sludge line
Total Suspended Solids C 1/M
Final settlement tank effluent Depth of blanket at mid tank G D
Post-chlorination Residual chlorine G D
pH G D
Temperature G D
Dissolved oxygen G D
Sludge holding tank contents (if applicable)
Alkalinity G 1/W
Volatile acids G 1/W Settled sludge in holding tank (if applicable) pH G D
Sludge supernatant Biochemical Oxygen Demand 5 C 1/W
1 G: grab sample; C: composite sample (usually 24-hr composite grab samples every 8 hours, or 24-hr
automatic sampler) 2 D: daily, 1/W: once per week, 1/M: once per month Frequency may be adjusted as needed. 3 Metals and organic compounds are less often determined, usually until a problem arises.

Environmental Impact Assessment ELARD
Olive Oil Residue Treatment Plant – Caza of Hasbaiya 128
As for process performance monitoring, the list of recommended parameters is
exhaustive; however, abidance is highly recommended especially during the first months of
plant operation. Once a preliminary database is built, less frequent analysis can be performed,
especially for the relatively invariable parameters. Table 8.5 summarizes the recommended
process performance parameters for the combined UASB-EAAS system. Note that sampling
frequencies are reduced at later stages of the operational phase. The plant operators may
adjust the schedule of sampling in accordance to the operational characteristics of the system,
and previous monitoring experience; however, utmost responsibility should be taken for
uninterrupted compliance. Table 8.6 presents the recommended process performance
parameters suggested in a draft decision by the MoE.

Environmental Impact Assessment ELARD
Olive Oil Residue Treatment Plant – Caza of Hasbaiya 129
Table 8.5. Process Performance Parameters for the Combined UASB-EAAS System
Sampling Location Analytical Parameter Sample Type 1
Sampling Frequency2
Early Operational
Phase
Advanced Operational
Phase
Minimums sampling
Biochemical Oxygen Demand 5 C 1/M 1/2M 1/3M
Total Suspended Solids C 1/M 1/2M 1/3M
Total Nitrogen G M 4 1/2M 4 1/3M
Plant Influent 3 or UASB Influent
Ammonia G M 4 1/2M 4 1/3M
Biochemical Oxygen Demand 5 C 1/W 1/2W M
Total Nitrogen G 1/2W 4 M 4 1/2M
Ammonia G 1/W M 1/2M
UASB Effluent / EAAS Influent
Total solids C 1/W 1/2W M
Final settlement tank effluent
Biochemical Oxygen Demand 5 C 1/W 1/2W M
Total Suspended Solids C 1/W 1/2W M
pH In Situ
D D D
Total Nitrogen G 1/2W 4 M 4 1/2M
Ammonia G 1/2W 4 M 4 1/2M
Nitrates G 1/2W 4 M 4 1/2M
Nitrites G 1/2W 4 M 4 1/2M
Post-chlorination Fecal coliforms G 1/W 1/2W M
Nitrates G 1/W M 1/2M
Ammonia G 1/W M 1/2M
Total solids C 1/W 1/2W M
Sludge holding tank contents (if applicable)
Volatile solids C 1/2W M M
Nitrates G 1/W M 1/2M
Ammonia G 1/W M 1/2M
Total solids C 1/W 1/2W M
Settled sludge in holding tank (if applicable)
Volatile solids C 1/2W M M
1 G: grab sample; C: composite sample (usually 24-hr composite grab samples every 8 hours, or 24-hr automatic
sampler) 2 D: daily, 1/W: once per week, 1/2W: once per two weeks, M: monthly, 1/2M: once per two months, Frequency could
be reduced if compliance violations are infrequent. 3 Metals and organic compounds are less often determined, usually until a problem arises. 4 Total nitrogen, ammonia, nitrates, and nitrites analyses can be excluded if influent concentrations for these
parameters are within set standards, or if nitrogen removal is not within the capabilities of the employed wastewater treatment scheme.
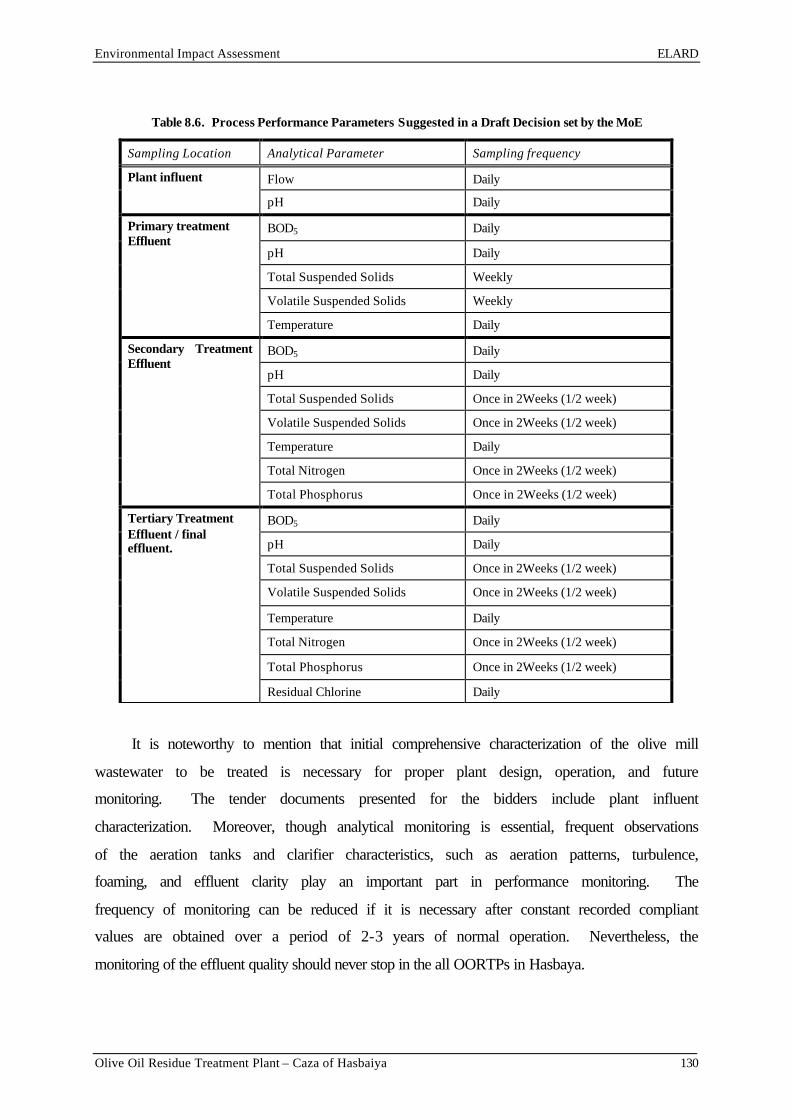
Environmental Impact Assessment ELARD
Olive Oil Residue Treatment Plant – Caza of Hasbaiya 130
Table 8.6. Process Performance Parameters Suggested in a Draft Decision set by the MoE
Sampling Location Analytical Parameter Sampling frequency
Flow Daily Plant influent
pH Daily
BOD5 Daily
pH Daily
Total Suspended Solids Weekly
Volatile Suspended Solids Weekly
Primary treatment Effluent
Temperature Daily
BOD5 Daily
pH Daily
Total Suspended Solids Once in 2Weeks (1/2 week)
Volatile Suspended Solids Once in 2Weeks (1/2 week)
Temperature Daily
Total Nitrogen Once in 2Weeks (1/2 week)
Secondary Treatment Effluent
Total Phosphorus Once in 2Weeks (1/2 week)
BOD5 Daily
pH Daily
Total Suspended Solids Once in 2Weeks (1/2 week)
Volatile Suspended Solids Once in 2Weeks (1/2 week)
Temperature Daily
Total Nitrogen Once in 2Weeks (1/2 week)
Total Phosphorus Once in 2Weeks (1/2 week)
Tertiary Treatment Effluent / final effluent.
Residual Chlorine Daily
It is noteworthy to mention that initial comprehensive characterization of the olive mill
wastewater to be treated is necessary for proper plant design, operation, and future
monitoring. The tender documents presented for the bidders include plant influent
characterization. Moreover, though analytical monitoring is essential, frequent observations
of the aeration tanks and clarifier characteristics, such as aeration patterns, turbulence,
foaming, and effluent clarity play an important part in performance monitoring. The
frequency of monitoring can be reduced if it is necessary after constant recorded compliant
values are obtained over a period of 2-3 years of normal operation. Nevertheless, the
monitoring of the effluent quality should never stop in the all OORTPs in Hasbaya.

Environmental Impact Assessment ELARD
Olive Oil Residue Treatment Plant – Caza of Hasbaiya 131
In order to achieve a successful start-up for the UASB reactor, a recent study has
recommended that the reactor be started up at a low loading rate of between 4 and 8 kg
COD/m3·d and the COD removal efficiency must be monitored carefully. Once the COD
removal efficiencies are above 90% and remain there, then the loading rate can be increased.
To ensure low loading rates, must be planned such that the flow rate of the effluent
stream be increased gradually, or sufficient effluent storage must be incorporated in the
design to accommodate this. Attention must also be paid to the temperature, and high loading
rates should not be applied until the temperature in the reactor has reached the recommended
34 to 36°C.
After plant start-up, when a thorough monitoring schedule is recommended, monitoring
efforts can be limited to regular checks (weekly or bi-weekly, as needed) of effluent quality
for the following parameters:
• pH and temperature
• BOD5 and COD
• Suspended Solids
• Total Nitrogen
• Total Phosphorus
• Ammonia-nitrogen
• Nitrate–nitrogen
• Phosphate
However, in case of any sudden change in the trend of any parameter, it is imperative to
reapply the advanced operational phase frequency in order to depict the anomaly.
The quality of dewatered sludge should also be checked before its disposal or reuse as
soil fertilizer. Typically, analysis of wastewater treatment plant sludge is performed on
composite samples for the parameters set forth in Table 8.7. Since the olive mill wastewater
discharged into the plant is mainly of agricultural origin, the presence of compounds such
pesticides is expected. High levels of metals are not expected to be present. However, it is
advisable to test the generated sludge for metal content and toxic organic compounds on a 6-

Environmental Impact Assessment ELARD
Olive Oil Residue Treatment Plant – Caza of Hasbaiya 132
month or annual basis. Moreover, bacterial and nutrient levels (NPK value) in the olive mill
wastewater sludge should be determined regularly.
Table 8.7. Sludge Quality Monitoring Parameters
Total Solids Copper
pH Lead
Total Nitrogen Mercury
Ammonia-Nitrogen Molybdenum
Nitrate-Nitrogen Nickel
Phosphorus Selenium
Potassium Zinc
Arsenic Polychlorinated Biphenyls
Cadmium Pathogens
It is necessary to install in-line analytical meters and measuring devices, especially for
regular daily measurements, to ensure sampling reproducibility. Automatic samplers may
also be useful at specific locations. The on-site presences of analytical components facilitate
process control and performance monitoring and subsequently ensure compliance.
8.3.2 Impact Detection Monitoring
As mentioned earlier, impact detection monitoring relates to detecting the impact of the
operation of the OORTPs on the environment. Such monitoring shall be the responsibility of
the municipal authorities. An independent monitoring organization shall be set up and
financed by the concerned municipalities, or monitoring activities will be contracted to a
specialized private organization. Impact monitoring includes periodic sampling from
downstream wells, springs, and surface waters, and analyzing samples by preset biological as
well as chemical quality control tests. The tests performed over the various springs, wells and
rivers in this study, prior to the implementation of the various treatment plants, should be used
as a basis in order to assess the expected positive effects or impacts of wastewater
management over the various receiving water bodies in the area subsequently over the
environment. It is recommended to perform quarterly monitoring (every three months) of the
following springs for detecting the positive impacts of theOORTPs:
- Ain el Marj
- Ain el Ghabra

Environmental Impact Assessment ELARD
Olive Oil Residue Treatment Plant – Caza of Hasbaiya 133
- Ain Khoury
- Ain Mitri
- S1 spring
- Ain el Ram
- Rachaiya el Foukhar Spring
The following parameters should be monitored:
- Fecal coliforms
- BOD5
Additionally, at the level of rivers where the OORTP effluent is discharged during the
operational periods, impact detection monitoring for the OORTP should be performed twice
annually (during early winter/late fall (December) and late winter (February)) directly before
the OORTP discharge, 100 meters after the plant discharge, and at the following three key
locations of the Hasbani River:
Location 1: In Kaoukaba village close to the potential location of the Kaoukaba Plant.
Location 2: Underneath the bridge, at the connection between the intermittent river in
Chebaa Valley and the Hasbani River
Location 3: In the village of Mari close to the potential location of the Mari Plant.
The following parameters should be monitored:
- pH
- BOD5
- Total Suspended Solids
- Total Phosphorus
- Total Nitrogen

Environmental Impact Assessment ELARD
Olive Oil Residue Treatment Plant – Caza of Hasbaiya 134
8.4. RECORD KEEPING AND REPORTING
Monitoring efforts would be in vain in the absence of an organized record keeping
practice. It is the responsibility of each treatment plant administration, set as the municipality,
except for Ain Jarfa, where a community based committee is in charge of the plant to ensure
the development of a database that includes a systematic tabulation of process indicators,
performed computations, maintenance schedules and logbook, and process control and
performance monitoring outcomes. Such a historical database benefits both the plant operator
and design engineers. The treatment plant should submit a periodic Discharge Monitoring
Report (DMR) to the assigned regional authority, namely the Mohafaza and subsequently to
the MoE. Such record keeping shall be requested and assured by the municipality.
8.5. COST OF ENVIRONMENTAL MANAGEMENT PLAN
As mentioned earlier, monitoring activities for the six OORTP are under the
reponsibility of the municipal authorities. In order to determine the budget to be allocated for
the monitoring plan, the costs of tests suggested in accordance to the draft decision by the
Ministry of Environment have been tabulated along with the sampling frequency. Table 8.8
presents sampling costs and the total cost for monitoring per month and per plant. Appendix
H shows detailed costs on a monthly basis for process performance parameters in early,
advanced and minimal sampling phases, as recommended earlier in the monitoring plan.

Environmental Impact Assessment ELARD
Olive Oil Residue Treatment Plant – Caza of Hasbaiya 135
Table 8.8. Monthly Monitoring Cost for Process Performance Parameters per Plant
Sampling Location
Analytical Parameter Sampling frequency2
Unit price (L.L.) Total/month (L.L.)
Flow D Plant influent
pH D 0
BOD5 D 30,000.00 900,000.00
pH D 0
Total Suspended Solids W 22,500.00 90,000.00
Volatile Suspended Solids W 22,500.00 90,000.00
Primary treatment Effluent
Temperature D 0
BOD5 D 30,000.00 900,000.00
pH D 0
Total Suspended Solids 1/2W 22,500.00 45,000.00
Volatile Suspended Solids 1/2W 22,500.00 45,000.00
Temperature D 0
Total Nitrogen3 1/2W 181,000.00 362,000.00
Secondary Treatment Effluent
Total Phosphorus 1/2W 73,000.00 146,000.00
BOD5 D 30,000.00 900,000.00
pH D 0
Total Suspended Solids 1/2W 22,500.00 45,000.00
Volatile Suspended Solids 1/2W 22,500.00 45,000.00
Temperature D 0
Total Nitrogen 1/2W 181,000.00 362,000.00
Total Phosphorus 1/2 W 73,000.00 146,000.00
Tertiary Treatment Effluent / final effluent.
Residual Chlorine D 22,500.00 675,000.00
subtotal 4,751,000.00
2 D: daily, 1/W: once per week, 1/2W: once per two weeks, M: monthly, 1/2M: once per two months 3 Carbon, Hydrogen, Nitrogen and Sulfur are sampled together using Elemental Analyzer method

Environmental Impact Assessment ELARD
Olive Oil Residue Treatment Plant – Caza of Hasbaiya 136
The unit cost for temperature as well as pH measurement is 8,000 L.L. This cost was
not included in the above price list as it is highly recommended that the OORTP facility
would acquire the necessary equipment for both pH and temperature daily sampling. The cost
of good quality pH meters and thermometers revolve around 600,000 L.L. per unit.
Another suggestion is the establishement of a common laboratory for all Hasbaya
villages for sampling and analysis for the six OORTP and eight WWTP to be constructed.
This laboratory would serve in developing databases, managing records and thus ensure better
compliance in monitoring. More capital cost is required for laboratory equipment, and later
for the permanent staff and expenses. However, this suggested on-site monitoring center
laboratory would increase the overall effectiveness and ensure autonomy, and thus reduce the
overall costs of monitoring in the long-run.
8.6. CONTINGENCY PLAN
Several measures have been incorporated in the design of the plants in order to
minimize the likelihood of failures and plant break-down:
- Addition of an equalization tank that will be used at the start-up phase of the
plant, especially for the anaerobic treatment system; the anaerobic tank will be
inoculated using sludge and wastewater from the domestic wastewater treatment
plant to enhance bacteriological activity; meanwhile the equalization tank will
be used as storage until treatment efficiency of the anaerobic tank becomes
satisfactory;
- Addition of sources of energy to the anaerobic tank to increase surrounding
temperatures and minimize temperature fluctuation, hence improving operation
efficiency (solar panels); UASB tanks will be underground and insulated to
improve heat retention;
- Backup of electromechanical equipment is provided, especially in the
aeration tank to ensure continuous operation of the plant.
The contingency plan in case of emergency was tackled in the design consideration of
the plant by building a large equalization tank in order to balance the variations in the
hydraulic loads of the plant that can eventually occur between days.
Environmental Impact Assessment ELARD
Olive Oil Residue Treatment Plant – Caza of Hasbaiya 137
Extra blowers will be on stand-by to operate replacing any defective blower within the
aeration tank along with the ability to increase aeration time in case of increased biological
loads.
Another important precautionary measure, is the fact that the entire system of UASB-
EAAS is designed in such a way as to accommodate for the maximum wastewater flow and
maximum organic load of 100,000 mg/l BOD without the presence of the UASB.
Therefore, even if the UASB malfunctions, does not perform according to expectations, or
becomes inefficient due to insufficient temperature, the system will still be able to deliver
the required effluent standards and treat the incoming wastewater flow.
As for temperature requirements for proper UASB performance, contingency
measures include the addition of tanks for vegetable water storage during the months of
November until March; wastewater would be later treated when ambient air temperature
reaches acceptable levels (more than 20°C).
According to the requirements set in the tender document, the awarded contractor
will have to perform regular and frequent maintenance check ups of the plant since he will
be responsible for the operation of the plant during the first year and eventually convey
technical expertise to the appointed future plant operators. These preventive measures and
design considerations will ensure a continuous and uninterrupted operation the plant.
8.7. EMERGENCY RESPONSE PLAN
The emergency response plan includes urgent measures and/or actions to follow when
accidental failure occurs in the plant leading to severe impacts on the environment. These
measures are described as follows:
- If water quantities exceed the capacity of the plant (equalization tank), cistern
trucks should be available to be able to transport extra water to other nearby plants
- In case of accidental leakages, spills, or dumping of untreated wastewater into
the seasonal river, it should be the responsibility of the operating staff
(municipality) to inform downstream village inhabitants and the different
stakeholders so that appropriate measures, such as discontinuation of water supply
and use, could be taken.

Environmental Impact Assessment ELARD
Olive Oil Residue Treatment Plant – Caza of Hasbaiya 138
8.8. CAPACITY BUILDING
One year training to municipalities staff that will operate the plants will be provided by
the contractor, supporting then the overall sustainability of the project and eventually convey
technical expertise to the appointed future plant operators.
8.9. INSTITUTIONAL ARRANGEMENTS
No matter how meticulously an environmental management scheme has been prepared,
it will fail in the absence of predefined responsibilities and strong technical bodies.
Compliance monitoring shall be the responsibility of the treatment plant administrations
(municipalities or a contracted operator) and thus its activities shall be budgeted for
accordingly. However, in accordance with the requirements of the regulatory authority
(MoE), the treatment plant should submit a periodic Discharge Monitoring Report (DMR) to
the assigned enforcement authority (Mohafaza/MoIM). The assigned authority will be
responsible for drawing conclusions based on the monitoring data, and deciding on specific
actions to alleviate pollution impacts. The coordination with the South Water and Wastewater
Establishment is also important since they are responsible for wastewater monitoring in their
new mandate. On the other hand, impact detection monitoring shall be the responsibility of
the municipal authorities. Ideally, an independent monitoring organization is set up and
financed by the concerned municipalities, or monitoring activities are contracted to a
specialized private organization. Figure 8.1 is an illustration of such institutional
arrangements.

Environmental Impact Assessment ELARD
Olive Oil Residue Treatment Plant – Caza of Hasbaiya 139
MoIM / Mohafez MoE \ SLWWE
Enforcing Authority
Coordination Coordination Regulatory \
Monitoring Authorities Village
Municipality
Supervision / Management
Coordination
Plant’s Management Support
Operation and Maintenance Need
Certified Laboratory
Sampling Reporting
External Consultants
Laboratory Analysis Monitoring and Expert Advice
Figure 8.1. Proposed Institutional Setting

Environmental Impact Assessment ELARD
Olive Oil Residue Treatment Plant – Caza of Hasbaiya 140
9. PUBLIC INVOLVEMENT AND PARTICIPATION
During this EIA study, the consultant met numerous times with the municipality
officials of the villages of Hasbaiya Caza and specifically with the officials in all seven
villages, along with the assistance of MCI representatives. The consultant suggested their
findings regarding many aspects concerning the site location, network distribution, springs
assessments, most appropriate technologies, and many other aspects required to finalize this
study. Additional meetings were also set between ELARD and MCI to set the Specifications,
Requirements and Standards requested for compliance of contractors in the bidding process.
In conformity with EIA guidelines, a notice was posted for duration of at least 18 days
at the concerned municipality informing the public about the EIA study that is being
conducted and the proposed olive oil residue treatment plant, and soliciting comments. A
copy of the notice for every village is included in Appendix G along with the EMP
compliance form signed by the concerned municipality. No verbal or written comments
from the local community were received regarding the OORTP projects.

Environmental Impact Assessment ELARD
Olive Oil Residue Treatment Plant – Caza of Hasbaiya 141
10. REFERENCES
1. Aggelis G.G., Gavala H.N., and Lyberatos G., SE – Structures and Environment: Combined and Separate Aerobic and Anaerobic Biotreatment of Green Olive Debittering Wastewater, Journal of Agricultural Engineering, Volume 80, Issue 3, November 2001, pages 283-292
2. Aktas E.S., Imre S., and Ersoy L., Characterization and Lime Treatment of Olive Mill
Wastewater, Water Research, Volume 35, Issue 9, June 2001, Pages 2336-2340 3. Beccari M., Majone M., and Torrisi L., Two-reactor System with Partial Phase Separation
for Anaerobic Treatment of Olive Oil Mill Effluents, Water Science and Technology, Volume 38, Issue 4-5, 1998, Pages 53-60
4. Becker P., Koster D., Popov M.N., Markossian S., Antranikian G., and Markl H, The
Biodegradation of Olive Oil and the Treatment of Lipid-rich Wool Scouring Wastewater under Aerobic Thermophillic Conditions, Water Research, Volume 33, Issue 3, February 1999, Pages 653-660
5. Blanchet, G. 1976, Les temps au Liban: approche d’une climatologie synoptique, PhD
dissertation, Université de Lyon II, Lyon, France 6. Corbit, R. A., Standard Handbook of Environmental Engineering, Second Edition,
McGraw-Hill, USA, 1998
7. Ecodit Presentation and Workshop, Lebanese American University (LAU), August 2003 8. Edgell, H. S., Karst and Hydrogeology of Lebanon, Carbonates and Evaporites, Vol. 12
(2), pp. 220-235, 1997
9. El-Fadel, M., Zeinati, M., Abou-Ibrahim, A., Massoud, M., and Ayoub, G., An Environmental Impact Assessment Training Workshop on Wastewater. Organized by the Unit of Planning and Programming, Ministry of Environment. Sponsored by World Bank, METAP, 2001
10. Fadil K., Chahlaoui A., Oauhbi A., Zaid A., and Borja R., Aerobic Biodegradation and
Detoxification of Wastewaters from the Olive Oil Industry, International Biodeterioration & Biodegradation, Volume 51, Issue 1, January 2003, Pages 37-41
11. Fuller, W., and Warrik, A. Soils in waste treatment and utilization. CRC Press, Inc. USA.,
1988
12. Garcia-Gomez A., Roig A., and Bernal M.P., Composting of the Solid Fraction of Olive Mill Wastewater with Olive Leaves: Organic Matter Degradation and Biological Activity, Bioresource Technology, Volume 86, Issue 1, January 2003, Pages 59-64

Environmental Impact Assessment ELARD
Olive Oil Residue Treatment Plant – Caza of Hasbaiya 142
13. Grady, L., Daigger, G., and Lim H., Biological wastewater treatment. Marcel Dekker, Inc., New York, 1999
14. Harajli, M., Tabet, C., Sadek, S., Mabsout, M., Moukaddam, S., and Abdo, M., Seismic Hazard Assessment of Lebanon: Zonation Maps and Structural Seismic Design, Design Regulations. Technical Report submitted to the Directorate of Urbanism, Ministry of Public Works, Beirut, Lebanon, 1994
15. Journey, W.K., McNiven, S.C., Anaerobic Enhanced Treatment of Wastewater and
Options for Further Treatment. United States Agency for International Development (USAID), Agricultural Cooperative Development International (ACDI), Volunteers in Overseas Cooperative Assistance (VOCA)
16. Khair, K., Karakaisis, G., and Papadimitriou, E., Seismic Zonation of the Dead Sea Transform Fault Area. Anali di Geofisica, Vol. 43 (1), pp. 61- 79, 2000
17. M.B.Pescod Wastewater treatment and use in agriculture - FAO irrigation and drainage
paper 47, 1992
18. McGhee, T., Water supply and sewerage, McGraw-Hill, Inc., New York, 1991
19. Qasim, S. A., Wastewater treatment plants: planning, design, and operation. Technomic Publishing Co., Inc., Lancaster, PA, 1999
20. Service Météorologique du Liban, Atlas Climatique du Liban, Volume III. Lebanese Republic, Ministry of Public Works, General Directorate of Civil Aviation, Meteorological Service, 1969
21. Service Météorologique du Liban, Atlas Climatique du Liban, Volume I. Lebanese Republic, Ministry of Public Works, General Directorate of Civil Aviation, Meteorological Service, 1977
22. Shell International Exploration and Petroleum, EP 95-0371. Social Impact Assessment, Shell International Petroleum Company Ltd, 1996
23. Stanley E. Manahan, Environmental Science and Technology Lewis Publishers 1997
24. Tchobanoglous, G., and Burton, F., and Metcalf & Eddy, Inc., Wastewater engineering: treatment, disposal, and reuse. McGraw-Hill, New York, 1991
25. Thames River-Standards 2000. River Water Quality Standards 2000
26. Treweek, J. Ecological impacts assessment. Blackwell Science. U.K., 1999

Environmental Impact Assessment ELARD
Olive Oil Residue Treatment Plant – Caza of Hasbaiya 143
27. United Nations Development Program. Etude des Eaux Souterraines, Liban, New York, 1970 (in French)
28. US Environmental Protection Agency, Wastewater treatment and disposal for small communities. EPA/625/R-92/005, Office of Water, Washington, D. C., 1992
29. US Environmental Protection Agency, Guidelines for Water Reuse. Manual. Office of Research and Development. Washington, D.C., 1992
30. US Environmental Protection Agency. Land application of biosolids. Process design manual. Office of Research and Development. Washington, D.C., 1995
31. Water Environment Federation, Basic activated sludge process control, Alexandria, VA, 1994
32. Water Environment Federation, Operation of municipal wastewater treatment plants. Manual of Practice-11, vol. 2: Liquid processes, Alexandria, VA, 1996
33. World Bank, Environmental Assessment Sourcebook. Volume I. Policies, Procedures, and Cross-Sectoral Issues. Technical paper number 139. Environmental Department. The World Bank, Washington, D.C., 1998
34. World Bank, Environmental Assessment Sourcebook. Volume II. Sectoral Guidelines. Technical paper number 140. Environmental Department. The World Bank, Washington, D.C., 1998

Environmental Impact Assessment ELARD
Olive Oil Residue Treatment Plant – Caza of Hasbaiya Appendices
APPENDIX A TECTONIC MAP OF LEBANON; GEOLOGICAL MAP OF STUDY AREA; CROSS SECTION

Environmental Impact Assessment ELARD
Olive Oil Residue Treatment Plant – Caza of Hasbaiya Appendices
APPENDIX B TOPOGRAPHIC MAP INDICATING SAMPLING LOCATIONS; LABORATORY ANALYTICAL RESULTS – SPRINGS WATER –HASBAIYA RIVER.

Environmental Impact Assessment ELARD
Olive Oil Residue Treatment Plant – Caza of Hasbaiya Appendices
APPENDIX C ARCHITECTURAL DRAWINGS

Environmental Impact Assessment ELARD
Olive Oil Residue Treatment Plant – Caza of Hasbaiya Appendices
APPENDIX D PLANTS SITE LOCATION ON PARCEL MAP

Environmental Impact Assessment ELARD
Olive Oil Residue Treatment Plant – Caza of Hasbaiya Appendices
APPENDIX E SLUDGE AND EFFLUENT MANAGEMENT
INTRODUCTION
Sludge and effluent disposal by surface application is performed in an environmentally safe manner according to different restrictions and considerations. The US EPA formulated 40 CFR Part 503 to regulate the use or disposal of sludge in order to protect public health and the environment. In specific, subpart B of the part 503 rule prohibits the land application of sewage sludge that exceeds specified limits. Those standards should be followed as they represent the most comprehensive international standards developed according to risk analysis.
Effluent cannot be directly disposed to land unless it complies with the wastewater quality standards (guidelines for water re-use or disposal suggested by the EPA). Furthermore, sludge cannot be frequently disposed on the same soil. if land application is to be performed, sludge should be collected and stored, and then applied according to an application rate, which depends on the site characteristics, and on the sludge quality (level of pollutants) (according to sludge disposal guidelines suggested by the EPA).
The present appendix presents the restrictions preventing land application of the proposed effluent and provides the standards and considerations that should be achieved if land application was to be the sludge disposal method. The difference between sludge disposal and effluent disposal should be considered: effluent disposal is performed according to the wastewater quality standards, and sludge disposal according to sewage sludge standards, and with different application rates.
LAND TREATMENT
Land treatment is characterized as spreading the waste (effluent or sludge) on the soil surface or incorporating it into the upper few centimeters by mechanical manipulation. The method of application depends on the physical, chemical, and toxic nature of the waste and the rate of biodegradation desired. Sprinkler, flood, or drip-type application could be used to apply liquids. Because of their fluid nature, they penetrate the soil and thus, do not require mechanical soil incorporation unless they carry significant amounts of solids. The single purpose of land treatment as opposed to land utilization is final disposal of the waste with little or no demand of the waste to function as a resource.

Environmental Impact Assessment ELARD
Olive Oil Residue Treatment Plant – Caza of Hasbaiya Appendices
Destruction of the soil for vegetative growth is not a part of land treatment. Land treatment must provide sound, environmentally safe disposal of waste residuals through biological, chemical, and physical interactions occurring in soils. The inorganic metal components are expected to biodegrade through the activity of the indigenous soil microorganisms. The inorganic metal components are expected to attenuate (or immobilize) primarily through physical-chemical interactions with the soil (Fuller, 1988).
Table E.1 and Table E.2, present the general requirement for sludge disposal and effluent disposal on forestlands. Detailed analysis and considerations will be presented in the report.
Table E.1. Summary of typical characteristics of sewage sludge land application practices (EPA, 1992)
Characteristics Forest land application
Application rates Varies: normal range in dry weight of 10 to 220 t/ha/yr. (4 to 100 T/ac/yr.) depending on soil, tree species, sludge quality, etc. typical rate is about 18 t/ha/yr. (8 T/ac/yr.)
Application frequency Usually applied annually or at 3 to 5-year intervals
Useful life of application site(s)
Usually limited by accumulated metal loading in total sewage sludge applied. With most sewage sludge a useful life of 20 to 55 years or more is typical.
Sewage sludge scheduling
Scheduling affected by climate and maturity of trees.
Application constraints
Limited by part 503 agronomic rate management practice requirement.
Table E.2. EPA guidelines for water reuse in wildlife habitats (EPA, 1992)
Factor Requirement
Treatment Secondary and disinfection
Effluent quality BOD< 30 mg/l
SS<30 mg/l
Fecal coliform <200 fecalcoli/100ml (The number of fecal coliform organisms should not exceed 800/100 ml in any sample)
Effluent monitoring BOD – weekly
SS - daily
Coliform - daily
Cl2 residual – continuous
Other considerations Ground water monitoring
Temperature
pH

Environmental Impact Assessment ELARD
Olive Oil Residue Treatment Plant – Caza of Hasbaiya Appendices
SLUDGE DISPOSAL
EPA REQUIREMENTS FOR SLUDGE DISPOSAL
EPA developed the federal part 503 rule (40 CFR Part 503) that establishes requirements for land application of sewage sludge. Subpart B of the part 503 rule prohibits the land application of sludge that exceeds pollutant limits termed “ceiling concentration limits” for 10 metals and places restrictions on sludge exceeding additional pollutant limits which are the cumulative pollutant loading rate limits and the annual pollutant loading rate limits. The requirements for land disposal are presented in Table E.3, and further explained in the following sections.
Table E.3. Part 503 land application pollutant limits for sewage sludge (EPA, 1995)
Pollutant Ceiling concentration limits (mg/kg)
Cumulative pollutant loading rate limits (kg/ha)
Annual pollutant loading rate limits (kg/ha per 365-day period)
Arsenic 75 41 2.0
Cadmium 85 39 1.9
Chromium 3,000 3,000 150
Copper 4,300 1,500 75
Lead 840 300 15
Mercury 57 17 0.85
Molybdenum 75 -- --
Nickel 420 420 21
Selenium 100 100 5.0
Zinc 7,500 2,800 140
Ceiling concentration limits (EPA, 1995)
All sewage sludge applied to land must meet part 503 ceiling concentration limits for 10 regulated pollutants. Ceiling concentration limits are the maximum allowable concentration of a pollutant in sewage sludge to be land applied. If the ceiling concentration of any one of the regulated pollutants is exceeded, the sewage sludge cannot be land applied.

Environmental Impact Assessment ELARD
Olive Oil Residue Treatment Plant – Caza of Hasbaiya Appendices
Cumulative pollutant loading rates (CPLRs)
A CPLR is the maximum amount of pollutant that can be applied to a site by all sludge applications. When the CPLR is reached at the application site for any one of the 10 metals no additional sludge can be applied.
Annual pollutant loading rates (APLRs)
APLR is the maximum amount of a pollutant that can be applied to a site within a 12-month period from sludge. The pollutant concentration in sludge multiplied by the “whole annual sludge application rate” must not cause any of the APLR to be exceeded.
Pathogen requirements (EPA, 1995)
The density of fecal coliform in the sewage sludge must be less than 1,000 most probable number (MPN) per gram total solids (dry-weight basis) or the density of Salmonella sp. bacteria in the sewage sludge must be less than 3 MPN per 4 grams of total solids (dry-weight basis).
Vector Attraction Reduction Requirements (EPA, 1995)
Subpart D in Part 503 establishes 10 options for demonstrating that sludge that is land applied meets requirements for vector attraction reduction (Table E.4). The options can be divided into two general approaches for controlling the spread of disease via vectors (such as insects, rodents, and birds):
• Reducing the attractiveness of the sewage sludge to vectors (Options 1 to 8). • Preventing vectors from coming into contact with the sewage sludge (Options 9 and 10).
Compliance with the vector attraction reduction requirements using one of the options described below must be demonstrated separately from compliance with requirements for reducing pathogens in sewage sludge. Thus, demonstration of adequate vector attraction reduction does not demonstrate achievement of adequate pathogen reduction. Part 503 vector attraction reduction requirements are summarized below:
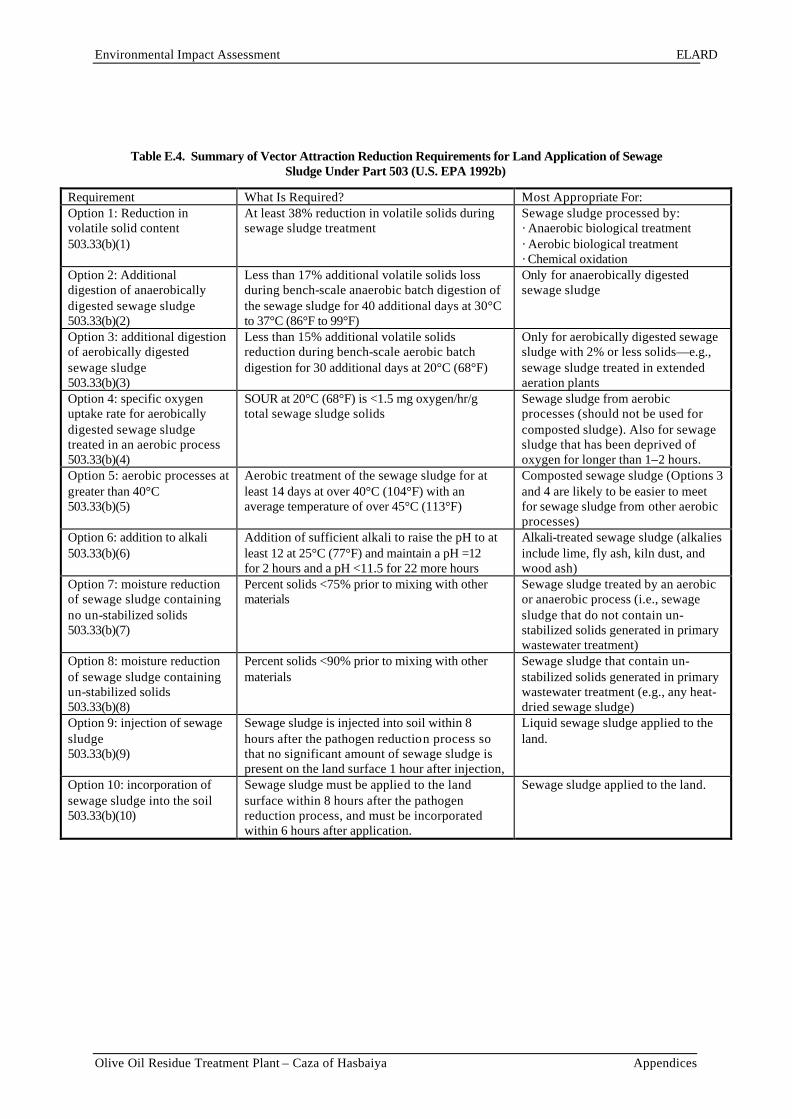
Environmental Impact Assessment ELARD
Olive Oil Residue Treatment Plant – Caza of Hasbaiya Appendices
Table E.4. Summary of Vector Attraction Reduction Requirements for Land Application of Sewage Sludge Under Part 503 (U.S. EPA 1992b)
Requirement What Is Required? Most Appropriate For: Option 1: Reduction in volatile solid content 503.33(b)(1)
At least 38% reduction in volatile solids during sewage sludge treatment
Sewage sludge processed by: · Anaerobic biological treatment · Aerobic biological treatment · Chemical oxidation
Option 2: Additional digestion of anaerobically digested sewage sludge 503.33(b)(2)
Less than 17% additional volatile solids loss during bench-scale anaerobic batch digestion of the sewage sludge for 40 additional days at 30°C to 37°C (86°F to 99°F)
Only for anaerobically digested sewage sludge
Option 3: additional digestion of aerobically digested sewage sludge 503.33(b)(3)
Less than 15% additional volatile solids reduction during bench-scale aerobic batch digestion for 30 additional days at 20°C (68°F)
Only for aerobically digested sewage sludge with 2% or less solids—e.g., sewage sludge treated in extended aeration plants
Option 4: specific oxygen uptake rate for aerobically digested sewage sludge treated in an aerobic process 503.33(b)(4)
SOUR at 20°C (68°F) is <1.5 mg oxygen/hr/g total sewage sludge solids
Sewage sludge from aerobic processes (should not be used for composted sludge). Also for sewage sludge that has been deprived of oxygen for longer than 1–2 hours.
Option 5: aerobic processes at greater than 40°C 503.33(b)(5)
Aerobic treatment of the sewage sludge for at least 14 days at over 40°C (104°F) with an average temperature of over 45°C (113°F)
Composted sewage sludge (Options 3 and 4 are likely to be easier to meet for sewage sludge from other aerobic processes)
Option 6: addition to alkali 503.33(b)(6)
Addition of sufficient alkali to raise the pH to at least 12 at 25°C (77°F) and maintain a pH =12 for 2 hours and a pH <11.5 for 22 more hours
Alkali-treated sewage sludge (alkalies include lime, fly ash, kiln dust, and wood ash)
Option 7: moisture reduction of sewage sludge containing no un-stabilized solids 503.33(b)(7)
Percent solids <75% prior to mixing with other materials
Sewage sludge treated by an aerobic or anaerobic process (i.e., sewage sludge that do not contain un-stabilized solids generated in primary wastewater treatment)
Option 8: moisture reduction of sewage sludge containing un-stabilized solids 503.33(b)(8)
Percent solids <90% prior to mixing with other materials
Sewage sludge that contain un-stabilized solids generated in primary wastewater treatment (e.g., any heat-dried sewage sludge)
Option 9: injection of sewage sludge 503.33(b)(9)
Sewage sludge is injected into soil within 8 hours after the pathogen reduction process so that no significant amount of sewage sludge is present on the land surface 1 hour after injection,
Liquid sewage sludge applied to the land.
Option 10: incorporation of sewage sludge into the soil 503.33(b)(10)
Sewage sludge must be applied to the land surface within 8 hours after the pathogen reduction process, and must be incorporated within 6 hours after application.
Sewage sludge applied to the land.

Environmental Impact Assessment ELARD
Olive Oil Residue Treatment Plant – Caza of Hasbaiya Appendices
PHYSICAL CHARACTERISTICS OF POTENTIAL LAND APPLICATION SITES (EPA, 1995)
The physical characteristics of concern are:
• Topography (Table E.5) • Soil permeability, infiltration, and drainage patterns • Depth to ground water • Proximity to surface water
Potentially unsuitable areas for sewage sludge application:
• Areas bordered by ponds, lakes, rivers, and streams without appropriate buffer areas. • Wetlands and marshes • Steep areas with sharp relief. • Undesirable geology (karst, fractured bedrock) (if not covered by a sufficiently thick soil column). • Undesirable soil conditions (rocky, shallow). • Areas of historical or archeological significance. • Other environmentally sensitive areas such as floodplains or intermittent streams, ponds, etc., as specified in the Part 503 regulation.
Table E.5. Recommended Slope Limitations for Land Application of Sludge
Slope Comment
0-3% Ideal; no concern for runoff or erosion of liquid or dewatered sludge.
3-6% Acceptable for surface application of liquid or dewatered sludge; slight risk of erosion.
6-12% Injection of liquid sludge required in most cases, except in closed drainage basin and/or areas with extensive runoff control. Surface application of dewatered sludge is usually acceptable.
12-15% No liquid sludge application without effective runoff control; surface application of dewatered sludge is acceptable, but immediate incorporation is recommended.
Over 15% Slopes greater than 15% are only suitable for sites with good permeability (e.g., forests), where the steep slope length is short (e.g., mine sites with a buffer zone downslope), and/or the steep slope is a minor part of the total application area.
Soil Permeability and Infiltration
Permeability (a property determined by soil pore space, size, shape, and distribution) refers to the ease with which water and air are transmitted through soil. Fine-textured soils

Environmental Impact Assessment ELARD
Olive Oil Residue Treatment Plant – Caza of Hasbaiya Appendices
generally possess slow or very slow permeability, while the permeability of coarse-textured soils ranges from moderately rapid to very rapid. A medium textured soil, such as a loam, tends to have moderate to slow permeability.
Soil Drainage
Soils classified as (1) very poorly drained, (2) poorly drained, or (3) somewhat poorly drained may be suitable for sewage sludge application if runoff control is provided. Soils classified as (1) moderately well drained, (2) well drained, or (3) somewhat excessively drained are generally suitable for sewage sludge application. Typically, a well-drained soil is at least moderately permeable.
Surface Hydrology, Including Floodplains and Wetlands
The number, size and nature of surface water bodies on or near a potential sludge land application site are significant factors in site selection due to potential contamination from site runoff. Areas subject to high runoff have severe limitations for sludge application.
Ground Water
For preliminary screening of potential sites, it is recommended that the following ground water information for the land application area be considered:
• Depth to ground water (including historical highs and lows).
• An estimate of ground water flow patterns.
The greater the depth to the water table, the more desirable a site is for sludge application. Sludge should not be placed where there is potential for direct contact with the ground-water table. The actual thickness of unconsolidated material above a permanent water table constitutes the effective soil depth. The desired soil depth may vary according to sludge characteristics, soil texture, soil pH, method of sludge application, and sludge application rate. Recommended Depth to Ground Water:
• Drinking Water Aquifer: 2 m
• Excluded Aquifer (not used as potable water supplies): 0.7 m
The type and condition of consolidated material above the water table is also of major importance for sites where high application rates of sewage sludge are desirable. Fractured rock may allow leachate to move rapidly. Unfractured bedrock at shallow depths will restrict
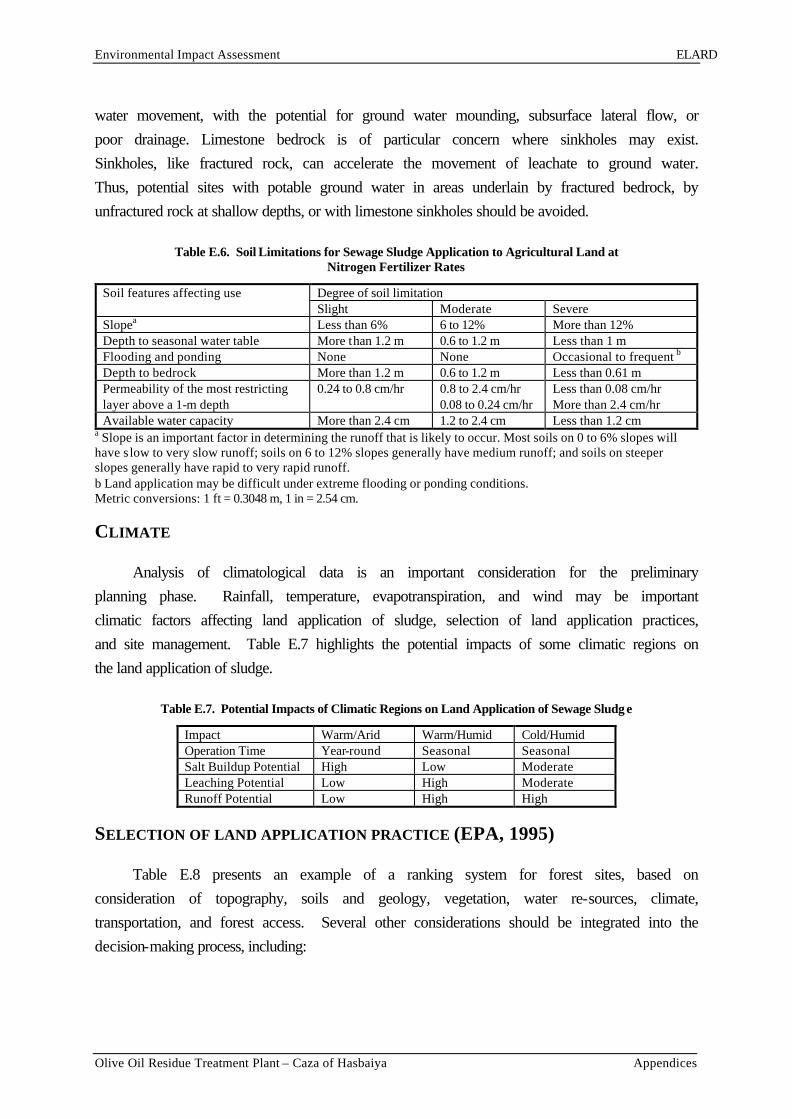
Environmental Impact Assessment ELARD
Olive Oil Residue Treatment Plant – Caza of Hasbaiya Appendices
water movement, with the potential for ground water mounding, subsurface lateral flow, or poor drainage. Limestone bedrock is of particular concern where sinkholes may exist. Sinkholes, like fractured rock, can accelerate the movement of leachate to ground water. Thus, potential sites with potable ground water in areas underlain by fractured bedrock, by unfractured rock at shallow depths, or with limestone sinkholes should be avoided.
Table E.6. Soil Limitations for Sewage Sludge Application to Agricultural Land at Nitrogen Fertilizer Rates
Degree of soil limitation Soil features affecting use Slight Moderate Severe
Slopea Less than 6% 6 to 12% More than 12% Depth to seasonal water table More than 1.2 m 0.6 to 1.2 m Less than 1 m Flooding and ponding None None Occasional to frequent b Depth to bedrock More than 1.2 m 0.6 to 1.2 m Less than 0.61 m Permeability of the most restricting layer above a 1-m depth
0.24 to 0.8 cm/hr 0.8 to 2.4 cm/hr 0.08 to 0.24 cm/hr
Less than 0.08 cm/hr More than 2.4 cm/hr
Available water capacity More than 2.4 cm 1.2 to 2.4 cm Less than 1.2 cm a Slope is an important factor in determining the runoff that is likely to occur. Most soils on 0 to 6% slopes will have s low to very slow runoff; soils on 6 to 12% slopes generally have medium runoff; and soils on steeper slopes generally have rapid to very rapid runoff. b Land application may be difficult under extreme flooding or ponding conditions. Metric conversions: 1 ft = 0.3048 m, 1 in = 2.54 cm.
CLIMATE
Analysis of climatological data is an important consideration for the preliminary planning phase. Rainfall, temperature, evapotranspiration, and wind may be important climatic factors affecting land application of sludge, selection of land application practices, and site management. Table E.7 highlights the potential impacts of some climatic regions on the land application of sludge.
Table E.7. Potential Impacts of Climatic Regions on Land Application of Sewage Sludg e
Impact Warm/Arid Warm/Humid Cold/Humid Operation Time Year-round Seasonal Seasonal Salt Buildup Potential High Low Moderate Leaching Potential Low High Moderate Runoff Potential Low High High
SELECTION OF LAND APPLICATION PRACTICE (EPA, 1995)
Table E.8 presents an example of a ranking system for forest sites, based on consideration of topography, soils and geology, vegetation, water re-sources, climate, transportation, and forest access. Several other considerations should be integrated into the decision-making process, including:

Environmental Impact Assessment ELARD
Olive Oil Residue Treatment Plant – Caza of Hasbaiya Appendices
• Compatibility of sewage sludge quantity and quality with the specific land application practice selected.
• Public acceptance of both the practice(s) and site(s) selected.
• Anticipated design life, based on assumed application rate, land availability (capacity), projected heavy metal loading rates (if Part 503 cumulative pollutant loading rates are being met), and soil properties.

Environmental Impact Assessment ELARD
Olive Oil Residue Treatment Plant – Caza of Hasbaiya Appendices
Table E.8. Relative Ranking for Forest Sites for Sewage Sludge Application
Factor Relative Rank
Topography
Slope
Less than 10% High
10-20% Acceptable
20-30% Low
Over 30% Low
Site continuity (somewhat subjective)
No draws, streams, etc., to buffer High
1 or 2 requiring buffers Acceptable
Numerous discontinuities Low
Forest System
Percent of forest system in place Low-High
Erosion hazard
Little (good soils, little slope) High
Great Low-Acceptable
Soil and Geology
Soil type
Sandy gravel (outwash, Soil Class I) High
Sandy (alluvial, Soil Class II) High
Well graded loam (ablation till, Soil Class IV) Acceptable
Silty (residual, Soil Class V) Acceptable
Clayey (lacustrine, Soil Class IV) Low
Organic (bogs) Low
Depth of soil
Deeper than 10 ft High
3-10 ft High
1-3 ft Acceptable
Less than 1 ft Low
Geology (subjective, dependent upon aquifer)
Sedimentary bedrock Acceptable-High
Andesitic basalt Acceptable-High
Basal tills Low-Acceptable
Lacustrine Low

Environmental Impact Assessment ELARD
Olive Oil Residue Treatment Plant – Caza of Hasbaiya Appendices
Vegetation (sensitive-rare) Low-high
SOIL SAMPLING AND ANALYSIS TO DETERMINE AGRONOMIC RATES (EPA, 1995)
Designing the agronomic rate for land application of sewage sludge is one of the key elements in the Part 503 rule for ensuring that land application does not degrade ground water quality through nitrate contamination. The Part 503 rule defines agronomic rate as: the whole sludge application rate (dry weight basis) designed: (1) to provide the amount of nitrogen needed by the vegetation on the land and (2) to minimize the amount of nitrogen in the sludge that leach beyond the root zone of the vegetation grown on the land to the ground water (40 CFR 503.11(b).
Designing the agronomic rate for a particular area requires knowledge of (1) soil fertility, especially available N and P; and (2) characteristics of the sludge, especially amount and forms of N (organic N, NH4, and NO3). The complex interactions between these factors and climatic variability (which affects soil-moisture related N transformations) make precise prediction of crop N requirements difficult.
Major constituents that may need to be tested in soils include:
• NO3-N as an indicator of plant-available N in the soil. Where applicable, these tests should be made for calculating initial sludge application rates, and can possibly be used in subsequent years.
• C/N ratio, which provides an indication of the potential for immobilization of N in sludge as a result of decomposition of plant residues in the soil and at the soil surface. This is especially relevant for forestland application sites as well as for agricultural purposes.
DETERMINING SEWAGE SLUDGE APPLICATION RATES FOR FOREST SITES (EPA, 1995)
Sewage sludge application rates at forest sites usually are based on tree N requirements.
Nitrogen dynamics of forest systems are somewhat complex because of recycling of nutrients in decaying litter, twigs and branches, and the immobilization of the NH4
+ contained in sludge as a result of decomposition of these materials.
Concentrations of trace elements (metals) in sludge may limit the cumulative amount of sewage sludge that can be placed on a particular area.

Environmental Impact Assessment ELARD
Olive Oil Residue Treatment Plant – Caza of Hasbaiya Appendices
Nitrogen applications cannot exceed the ability of the forest plants to utilize the N applied, with appropriate adjustments for losses.
Cumulative metal loading limits cannot exceed the cumulative pollutant loading rates (CPLRs) in the Part 503 rule.
Nitrogen Uptake and Dynamics in Forests
In general, uptake and storage of nutrients by forests can be large if the system is correctly managed and species respond to sludge. The trees and understory utilize the available N from sludge, resulting in an increase in growth. There is a significant difference between tree species in their uptake of available N. In addition, there is a large difference between the N uptake by seedlings, vigorously growing trees, and mature trees. Finally, the amount of vegetative understory on the forest floor will affect the uptake of N; dense understory vegetation markedly increases N uptake.
Calculation of sludge application rates requires considerations of nitrogen transformations in addition to N mineralization and ammonia volatilization from the sewage sludge: (1) denitrification, (2) uptake by under-story, and (3) soil immobilization for enhancement of forest soil organic-N (ON) pools.
Nitrogen Leaching
Typically, N is the limiting constituent for land applications of sludge because when excess N is applied, it often results in nitrate leaching. The N available from sludge addition can be microbially transformed into NO3 - through a process known as nitrification. Because NO3 - is negatively charged, it easily leaches to the ground water with percolating rainfall.
EQUIPMENT FOR SEWAGE SLUDGE APPLICATION AT FOREST SITES (EPA, 1995)
There are four general types of methods for applying sewage sludge to forests: (1) direct spreading; (2) spray irrigation with either a set system or a traveling gun; (3) spray application by an application vehicle with spray cannon; and (4) application by a manure-type spreader.
The main criterion used in choosing a system is the liquid content of the sewage sludge. Methods 1, 2, and 3 are effective for liquid sewage sludge (2% to 8% solids); Methods 1 and 2 can be used for semi-solid sewage sludge (8% to 18% solids); and only Method 4 is acceptable for solid sewage sludge (20% to 40% solids).

Environmental Impact Assessment ELARD
Olive Oil Residue Treatment Plant – Caza of Hasbaiya Appendices
SCHEDULING (EPA, 1995)
Sludge applications to forest sites can be made either annually or once every several years. Annual applications are designed to provide N only for the annual uptake requirements of the trees, considering volatilization and denitrification losses and mineralization from current and prior years. An application one-year followed by a number of years when no applications are made utilizes soil storage (immobilization) of nitrogen to temporarily tie up excess nitrogen that will become available in later years.
In a multiple-year (e.g., every 3 to 5 years) application system, the forest floor, vegetation, and soil have a prolonged period to return to normal conditions, and the public can use the site for recreation in the non-applied years. Application rates, however, are not simply an annual rate multiplied by the number of years before reapplication, but rather need to be calculated so that no NO3 - leaching occurs.
Scheduling sludge application also requires a consideration of climatic conditions and the age of the forest. High rainfall periods and/or freezing conditions can limit sewage sludge applications in almost all situations. The Part 503 regulation prohibits bulk sewage sludge from being applied to forestland that is flooded, frozen, or snow-covered so that the sewage sludge enters wetlands or other surface waters.
EFFLUENT DISPOSAL
CRITERIA DETERMINING EFFLUENT DISPOSAL (FULLER, 1988)
Effluent acceptable for disposal should meet certain criteria of quality. Superimposed on these are loading rates. The effluent should first meet the following requirements before the loading rate is determined:
• Capability of biodegradation of solids or soluble components
• No long-term toxicity to plants or microorganisms
• Each migration at practical rates of application to the ground water
• No adverse influence on the natural physical and chemical properties of the soil at reasonable rates of application
• No long-term limitation of land productivity
Further criteria and explanations will be provided in the following section.

Environmental Impact Assessment ELARD
Olive Oil Residue Treatment Plant – Caza of Hasbaiya Appendices
The criteria determining loading rates are:
1. Effluent quality: Organic matter, BOD, COD, total organic carbon, TOC, heavy metals, total dissolved solids (TDS), suspended solids (SS), nitrogen, phosphorus, sodium absorption ratio (SAR), boron, bacteriological composition, organic chemicals, organic solvents.
2. Soil quality: Texture, structure, permeability, infiltration, presence of confining soil barriers, depth to water table, drainage
3. Climate: Rainfall amount and intensity factor, temperature, wind velocity and direction, evapotranspiration.
4. Topography: Slope, soil and water erosion potential, flood hazard, topography of watershed
5. Geologic formation: Depth to bedrock, limestone
6. Groundwater: depth to ground water, direction, and rate of flow, perched water tables, and location, depth, and quality of wells.
EPA EFFLUENT RE-USE CRITERIA
The effluent should not alter the natural ecosystem present in the site, meaning that it should not lead to plant toxicity or underground water contamination. Effluents from tanneries are not usually disposed in forestlands, and this application is currently examined and studied. Until further advances and clarifications, the effluent should have the quality of reclaimed water for irrigation (which is developed to protect plant and human health) if it is to be disposed in forests. The following criteria and requirements should be achieved (Table E.9 and Table E.10).
Reclaimed water quality
The constituents in reclaimed water of concern are salinity, sodium, trace elements, excessive chlorine residual, and nutrients.
• Salinity: Salt accumulation can be especially detrimental during germination and when plants are young even at relatively low concentrations. Salinity may be reported as TDS. (TDS mg/l * 0.00156 = EC mmhos/cm). Salinity depends on the plant salt tolerance, and on the soil drainage and leaching characteristics (soils should be properly drained and adequately leached (leaching requirements) to prevent salt buildup). The extent of salt accumulation in

Environmental Impact Assessment ELARD
Olive Oil Residue Treatment Plant – Caza of Hasbaiya Appendices
the soil depends on the salt concentration in the water and the rate at which it is removed by leaching.
• Sodium: the potential influence sodium may have on soil properties is indicated by the sodium-adsorption-ratio (SAR = NA/{v [(Ca + Mg)/2]}). Sodium salts influence the exchangeable cation composition of the soil, which lowers the permeability, which impairs the infiltration of water into the soil.
• Trace elements of greatest concern at elevated levels are Cd, Co, Mb, Ni, and Zn.
• Chlorine residual: free chlorine residual at concentrations less than 1mg/l usually poses no problems to plants. However, some sensitive plants may be damaged at levels as low as 0.05 mg/l. some woody plants may accumulate chlorine in the tissue to toxic levels. Excessive chlorine has similar leaf-burning effect as sodium and chloride when sprayed directly on foliage. Chlorine at concentrations greater than 5 mg/l causes severe damage to most plants.
Table E.9. Recommended limits for constituents in reclaimed water for irrigation of plants (EPA, 1992)
Constituent Long-term use (mg/l)
Remark
Aluminum 5.0 Can cause non-productivity in acid soils, soils with pH 5.5-8 will precipitate the ion and eliminate toxicity
Arsenic 0.1 Toxicity to plants varies widely ranging from 12 mg/l to < 0.05 mg/l
Beryllium 0.1 Toxicity to plants varies widely ranging from 5 mg/l to < 0.5 mg/l Boron 0.75 Toxicity to many sensitive plants at 1 mg/l, most grasses relatively
tolerant at 2.0 to 10 mg/l Cadmium 0.01 Toxic to some plants at levels as low as 0.1 mg/l Chromium 0.1 Lack of knowledge on toxicity to plants Cobalt 0.05 Tends to be inactivated by neutral and alkaline soils Copper 0.2 Toxic to a number of plants at 0.1 to 1.0 mg/l Fluoride 1.0 Inactivated by neutral and alkaline soils Iron 5.0 Contributes to soil acidification and loss of essential P and
Molybdenum. Lead 5.0 Can inhibit plant cell growth at high concentrations Lithium 2.5 Mobile in soil, toxic to some plants at low doses (0.075mg/l) Manganese 0.2 Toxic to some plants at a few tenths to a few mg/l in acid soils Molybdenum 0.01 Nickel 0.2 Toxic to a number of plants at 0.5 to 1.0 mg/l; reduced toxicity at
neutral or alkaline pH Selenium 0.02 Toxic to plants at low concentrations Vanadium 0.1 Toxic to many plants Zinc 2.0 Reduced toxicity at increased pH (6 or above) and in fine textured
soils Other parameter Constituent Recommended
limit Remarks
pH 6.0 Indirect effects on plant growth TDS 500-2,000 mg/l Above 2,000 mg/l can be regularly used only if all plants are
tolerant and soils are permeable Free chlorine residual < 1 mg/l

Environmental Impact Assessment ELARD
Olive Oil Residue Treatment Plant – Caza of Hasbaiya Appendices
Table E.10. EPA suggested guidelines for water reuse in wildlife habitats
Factor Requirement
Treatment Secondary and disinfection
Effluent quality BOD< 30 mg/l, SS=30 mg/l
Fecal coliform =200 fecalcoli/100ml (The number of fecal coliform organisms should not exceed 800/100 ml in any sample)
Effluent monitoring BOD – weekly, SS – daily, Coliform – daily, Cl2 residual – continuous
Other considerations Ground water monitoring, Temperature, pH

Environmental Impact Assessment ELARD
Olive Oil Residue Treatment Plant – Caza of Hasbaiya Appendices
APPENDIX F WASTEWATER TREATMENT AND USE IN AGRICULTURE - FAO IRRIGATION AND DRAINAGE PAPER 47. (SECTION 5)
IRRIGATION WITH WASTEWATER
Conditions for successful irrigation Strategies for managing treated wastewater on the farm Crop selection Selection of irrigation methods Field management practices in wastewater irrigation Planning for wastewater irrigation CONDITIONS FOR SUCCESSFUL IRRIGATION
Amount of water to be applied Quality of water to be applied Scheduling of irrigation Irrigation methods Leaching Drainage
Irrigation may be defined as the application of water to soil for the purpose of supplying the moisture essential for plant growth. Irrigation plays a vital role in increasing crop yields and stabilizing production. In arid and semi-arid regions, irrigation is essential for economically viable agriculture, while in semi-humid and humid areas, it is often required on a supplementary basis.
At the farm level, the following basic conditions should be met to make irrigated farming a success:
- The required amount of water should be applied;
- The water should be of acceptable quality;
-Water application should be properly scheduled;
-Appropriate irrigation methods should be used;
- Salt accumulation in the root zone should be prevented by means of leaching;
-The rise of water table should be controlled by means of appropriate drainage;
-Plant nutrients should be managed in an optimal way.
The above requirements are equally applicable when the source of irrigation water is treated wastewater. Nutrients in municipal wastewater and treated effluents are a particular advantage of these sources over conventional irrigation water sources and supplemental

Environmental Impact Assessment ELARD
Olive Oil Residue Treatment Plant – Caza of Hasbaiya Appendices
fertilizers are sometimes not necessary. However, additional environmental and health requirements must be taken into account when treated wastewater is the source of irrigation water.
Amount of water to be applied
It is well known that more than 99 percent of the water absorbed by plants is lost by transpiration and evaporation from the plant surface. Thus, for all practical purposes, the water requirement of crops is equal to the evapotranspiration requirement; ETc. Crop evapotranspiration is mainly determined by climatic factors and hence can be estimated with reasonable accuracy using meteorological data. An extensive review of this subject and guidelines for estimating ETc, prepared by Doorenbos and Pruitt, are given in Irrigation and Drainage Paper 24 (FAO 1977). A computer program, called CROPWAT, is available in FAO to determine the water requirements of crops from climatic data. Table F-1presents the water requirements of some selected crops, reported by Doorenbos and Kassam (FAO 1979). It should be kept in mind that the actual amount of irrigation water to be applied will have to be adjusted for effective rainfall, leaching requirement, application losses, and other factors.
Quality of water to be applied
The guidelines presented are indicative in nature and will have to be adjusted depending on the local climate, soil conditions, and other factors. In addition, farm practices, such as the type of crop to be grown, irrigation method, and agronomic practices, will determine largely the quality suitability of irrigation water. Some of the important farm practices aimed at optimizing crop production when treated sewage effluent is used as irrigation water will be discussed in this chapter.
Table F 1: WATER REQUIREMENTS, SENSITIVITY TO WATER SUPPLY AND WATER UTILIZATION EFFICIENCY OF SOME SELECTED CROPS
Crop Water requirements (mm/growing period)
Sensitivity to water supply (ky)
Water utilization efficiency for harvested yield, Ey, kg/m3 (% moisture)
Alfalfa 800-1600 low to medium-high (0.7-1.1)
1.5-2.0 hay (10-15%)
Banana 1200-2200 high (1.2-1.35)
plant crop: 2.5-4 ratoon: 3.5-6 fruit (70%)
Bean 300-500 medium-high (1.15)
lush: 1.5-2.0 (80-90%) dry: 0.3-0.6 (10%)
Cabbage 380-500 medium-low (0.95)
12-20 head (90-95%)

Environmental Impact Assessment ELARD
Olive Oil Residue Treatment Plant – Caza of Hasbaiya Appendices
Citrus 900-1200 low to medium-high (0.8-1.1)
2-5 fruit (85%, lime: 70%)
Cotton 700-1300 medium-low (0.85)
0.4-0.6 seed cotton (10%)
Groundnut 500-700 low (0.7)
0.6-0.8 unshelled dry nut (15%)
Maize 500-800 high (1.25)
0.8-1.6 grain (10-13%)
Potato 500-700 medium-high (1.1)
4-7 fresh tuber (70-75%)
Rice 350-700 high 0.7-1.1 paddy (15-20%)
Safflower 600-1200 low (0.8)
0.2-0.5 seed (8-10%)
Sorghum 450-650 medium-low (0.9)
0.6-1.0 grain (12-15%)
Wheat 450-650 medium high (spring: 1.15; winter:
1.0)
0.8-1.0 grain (12-15%)
Source: FAO(1979)
Scheduling of Irrigation
To obtain maximum yields, water should be applied to crops before the soil moisture potential reaches a level at which the evapotranspiration rate is likely to be reduced below its potential. The relationship of actual and maximum yields to actual and potential evapotranspiration is illustrated in the following equation:
Where:
Ya = actual harvested yield Ym = maximum harvested yield ky = yield response factor ETa = actual evapotranspiration ETm = maximum evapotranspiration
Several methods are available to determine optimum irrigation scheduling. The factors that determine irrigation scheduling are: available water holding capacity of the soils, depth of

Environmental Impact Assessment ELARD
Olive Oil Residue Treatment Plant – Caza of Hasbaiya Appendices
root zone, evapotranspiration rate, and amount of water to be applied per irrigation, irrigation method and drainage conditions.
Irrigation methods
Many different methods are used by farmers to irrigate crops. They range from watering individual plants from a can of water to highly automated irrigation by a centre pivot system. However, from the point of wetting the soil, these methods can be grouped under five headings, namely:
i. Flood irrigation - water is applied over the entire field to infiltrate into the soil (e.g. wild flooding, contour flooding, borders, basins, etc.).
ii. Furrow irrigation - water is applied between ridges (e.g. level and graded furrows, contour furrows, corrugations, etc.). Water reaches the ridge, where the plant roots are concentrated, by capillary action.
iii. Sprinkler irrigation - water is applied in the form of a spray and reaches the soil very much like rain (e.g. portable and solid set sprinklers, travelling sprinklers, spray guns, centre-pivot systems, etc.). The rate of application is adjusted so that it does not create ponding of water on the surface.
iv. Sub-irrigation - water is applied beneath the root zone in such a manner that it wets the root zone by capillary rise (e.g. subsurface irrigation canals, buried pipes, etc.). Deep surface canals or buried pipes are used for this purpose.
v. Localized irrigation - water is applied around each plant or a group of plants so as to wet locally and the root zone only (e.g. drip irrigation, bubblers, micro-sprinklers, etc.). The application rate is adjusted to meet evapotranspiration needs so that percolation losses are minimized.
Table F 2 presents some basic features of selected irrigation systems as reported by Doneen and Westcot (FAO 1988).
Table F 2: BASIC FEATURES OF SOME SELECTED IRRIGATION SYSTEMS
Irrigation method
Topography Crops Remarks
Widely spaced borders
Land slopes capable of being graded to less than 1 % slope and preferably 0.2%
Alfalfa and other deep rooted close-growing crops and orchards
The most desirable surface method for irrigating close-growing crops where topographical conditions are favourable. Even grade in the direction of irrigation is required on flat land and is desirable but not essential on slopes of more than 0.5%. Grade changes should be slight and reverse grades must be avoided. Cross slops is permissible when confined to differences in elevation between border strips of 6-9 cm. Water application efficiency 45-60%.
Graded contour furrows
Variable land slopes of 2-25 % but preferable less
Row crops and fruit
Especially adapted to row crops on steep land, though hazardous due to possible erosion from heavy rainfall. Unsuitable for rodent-infested fields or soils that crack

Environmental Impact Assessment ELARD
Olive Oil Residue Treatment Plant – Caza of Hasbaiya Appendices
furrows less excessively. Actual grade in the direction of irrigation 0.5-1.5%. No grading required beyond filling gullies and removal of abrupt ridges. Water application efficiency 50-65%.
Rectangular checks (levees)
Land slopes capable of being graded so single or multiple tree basins will be levelled within 6 cm
Orchard Especially adapted to soils that have either a relatively high or low water intake rate. May require considerable grading. Water application efficiency 40-60%.
Sub-irrigation Smooth-flat Shallow rooted crops such as potatoes or grass
Requires a water table, very permeable subsoil conditions and precise levelling. Very few areas adapted to this method. Water application efficiency 50-70%.
Sprinkler Undulating 1->35% slope
All crops High operation and maintenance costs. Good for rough or very sandy lands in areas of high production and good markets. Good method where power costs are low. May be the only practical method in areas of steep or rough topography. Good for high rainfall areas where only a small supplementary water supply is needed. Water application efficiency 60-70 %.
Localized (drip, trickle, etc.)
Any topographic condition suitable for row crop farming
Row crops or fruit
Perforated pipe on the soil surface drips water at base of individual vegetable plants or around fruit trees. Has been successfully used in Israel with saline irrigation water. Still in development stage. Water application efficiency 75-85 %.
Source: FAO (1988) Leaching
Under irrigated agriculture, a certain amount of excess irrigation water is required to percolate through the root zone to remove the salts, which have accumulated as a result of evapotranspiration from the original irrigation water. This process of displacing the salts from the root zone is called leaching and that portion of the irrigation water that mobilizes the excess of salts is called the leaching fraction, LF.
Salinity control by effective leaching of the root zone becomes more important as irrigation water becomes more saline.
Drainage
Drainage is defined as the removal of excess water from the soil surface and below to permit optimum growth of plants. Removal of excess surface water is termed surface

Environmental Impact Assessment ELARD
Olive Oil Residue Treatment Plant – Caza of Hasbaiya Appendices
drainage while the removal of excess water from beneath the soil surface is termed sub-surface drainage. The importance of drainage for successful irrigated agriculture has been well demonstrated. It is particularly important in semi-arid and arid areas to prevent secondary salinization. In these areas, the water table will rise with irrigation when the natural internal drainage of the soil is not adequate. When the water table is within a few meters of the soil surface, capillary rise of saline groundwater will transport salts to the soil surface. At the surface, water evaporates, leaving the salts behind. If this process is not arrested, salt accumulation will continue, resulting in salinization of the soil. In such cases, sub-surface drainage can control the rise of the water table and hence prevent salinization.
STRATEGIES FOR MANAGING TREATED WASTEWATER ON THE FARM
To overcome salinity hazards To overcome toxicity hazards To prevent health hazards
Success in using treated wastewater for crop production will largely depend on adopting appropriate strategies aimed at optimizing crop yields and quality, maintaining soil productivity and safeguarding the environment. Several alternatives are available and a combination of these alternatives will offer an optimum solution for a given set of conditions. The user should have prior information on effluent supply and its quality, as indicated in Table F-3, to ensure the formulation and adoption of an appropriate on-farm management strategy.
The components of an on-farm strategy in using treated wastewater will consist of a combination of:
- Crop selection,
- selection of irrigation method, and
- adoption of appropriate management practices.
Furthermore, when the farmer has additional sources of water supply, such as a limited amount of normal irrigation water, he will then have an option to use both the effluent and the conventional source of water in two ways, namely:
- By blending conventional water with treated effluent, and
- using the two sources in rotation.
These are discussed briefly in the following sections.
Table F-3: INFORMATION REQUIRED ON EFFLUENT SUPPLY AND QUALITY

Environmental Impact Assessment ELARD
Olive Oil Residue Treatment Plant – Caza of Hasbaiya Appendices
Information Decision on irrigation management
Effluent supply
The total amount of effluent that would be made available during the crop growing season.
Total area that could be irrigated.
Effluent available throughout the year. Storage facility during non-crop growing period either at the farm or near wastewater treatment plant, and possible use for aquaculture.
The rate of delivery of effluent either as m3 per day or litres per second.
Area that could be irrigated at any given time, layout of fields and facilities and system of irrigation.
Type of delivery: continuous or intermittent, or on demand.
Layout of fields and facilities, irrigation system, and irrigation scheduling.
Mode of supply: supply at farm gate or effluent available in a storage reservoir to be pumped by the farmer.
The need to install pumps and pipes to transport effluent and irrigation system.
Effluent quality
Total salt concentration and/or electrical conductivity of the effluent.
Selection of crops, irrigation method, leaching and other management practices.
Concentrations of cations, such as Ca ++, Mg++ and Na+.
To assess sodium hazard and undertake appropriate measures.
Concentration of toxic ions, such as heavy metals, Boron and Cl-.
To assess toxicities that are likely to be caused by these elements and take appropriate measures.
Concentration of trace elements (particularly those which are suspected of being phyto-toxic).
To assess trace toxicities and take appropriate measures.
Concentration of nutrients, particularly nitrate-N. To adjust fertilizer levels, avoid over-fertilization and select crop.
Level of suspended sediments. To select appropriate irrigation system and measures to prevent clogging problems.
Levels of intestinal nematodes and faecal coliforms.
To select appropriate crops and irrigation systems.
CROP SELECTION
To overcome salinity hazards
Not all plants respond to salinity in a similar manner; some crops can produce acceptable yields at much higher soil salinity than others. This is because some crops are better able to make the needed osmotic adjustments, enabling them to extract more water from a saline soil. The ability of a crop to adjust to salinity is extremely useful. In areas where a

Environmental Impact Assessment ELARD
Olive Oil Residue Treatment Plant – Caza of Hasbaiya Appendices
build-up of soil salinity cannot be controlled at an acceptable concentration for the crop being grown, an alternative crop can be selected that is both more tolerant of the expected soil salinity and able to produce economic yields. There is an 8-10 fold range in the salt tolerance of agricultural crops. This wide range in tolerance allows for greater use of moderately saline water, much of which was previously thought to be unusable. It also greatly expands the acceptable range of water salinity (ECw) considered suitable for irrigation.
The relative salt tolerance of most agricultural crops is known well enough to give general salt tolerance guidelines. Table F-4 presents a list of crops classified according to their tolerance and sensitivity to salinity. Figure F-1 presents the relationship between relative crop yield and irrigation water salinity with regard to the four crop salinity classes. The following general conclusions can be drawn from these data:
i. full yield potential should be achievable with nearly all crops when using a water with salinity less than 0.7 dS/m,
ii. When using irrigation water of slight to moderate salinity (i.e. 0.7-3.0 dS/m), full yield potential is still possible, but care must be taken to achieve the required leaching fraction in order to maintain soil salinity within the tolerance of the crops. Treated sewage effluent will normally fall within this group,
iii. For higher salinity water (more than 3.0 dS/m) and sensitive crops, increasing leaching to satisfy a leaching requirement greater than 0.25 to 0.30 might not be practicable because of the excessive amount of water required. In such a case, consideration must be given to changing to a more tolerant crop that will require less leaching, to control salts within crop tolerance levels. As water salinity (ECw) increases within the slight to moderate range, production of more sensitive crops may be restricted due to the inability to achieve the high leaching fraction needed, especially when grown on heavier, more clayey soil types.

Environmental Impact Assessment ELARD
Olive Oil Residue Treatment Plant – Caza of Hasbaiya Appendices
Figure F-1: Divisions for relative salt tolerance ratings of agricultural crops (Maas 1984)
Table F-4: RELATIVE SALT TOLERANCE OF AGRICULTURAL CROPS
TOLERANT
Fibre, Seed and Sugar Crops
Barley Hordeum vulgare
Cotton Gossypium hirsutum
Jojoba Simmondsia chinensis
Sugarbeet Beta vulgaris
Grasses and Forage Crops
Alkali grass Puccinellia airoides
Alkali sacaton Sporobolus airoides

Environmental Impact Assessment ELARD
Olive Oil Residue Treatment Plant – Caza of Hasbaiya Appendices
Bermuda grass Cynodon dactylon
Kallar grass Diplachne fusca
Saltgrass, desert Distichlis stricta
Wheatgrass, fairway crested Agropyron cristatum
Wheatgrass, tall Agropyron elongatum
Wildrye, Altai Elymus angustus
Wildrye, Russian Elymus junceus
Vegetable Crops
Asparagus Asparagus officinalis
Fruit and Nut Crops
Date palm Phoenix dactylifera
MODERATELY TOLERANT
Fibre, Seed and Sugar Crops
Cowpea Vigna unguiculata
Oats Avena sativa
Rye Secale cereale
Safflower Carthamus tinctorius
Sorghum Sorghum bicolor
Soybean Glycine max
Triticale X Triticosecale
Wheat Triticum aestivum
Wheat, Durum Triticum turgidum
Grasses and Forage Crops
Barley (forage) Hordeum vulgare
Brome, mountain Bromus marginatus
Canary grass, reed Phalaris, arundinacea
Clover, Hubam Melilotus alba

Environmental Impact Assessment ELARD
Olive Oil Residue Treatment Plant – Caza of Hasbaiya Appendices
Clover, sweet Melilotus
Fescue, meadow Festuca pratensis
Fescue, tall Festuca elatior
Harding grass Phalaris tuberosa
Panic grass, blue Panicum antidotale
Rape Brassica napus
Rescue grass Bromus unioloides
Rhodes grass Chloris gayana
Grasses and Forage Crops
Ryegrass, Italian Lolium italicum multiflorum
Ryegrass, perennial Lolium perenne
Sudan grass Sorghum sudanense
Trefoil, narrowleaf birdsfoot Lotus corniculatus tenuifolium
Trefoil, broadleaf L. corniculatus arvenis
Wheat (forage) Triticum aestivum
Wheatgrass, standard crested Agropyron sibiricum
Wheatgrass, intermediate Agropyron intermedium
Wheatgrass, slender Agropyron trachycaulum
Wheatgrass, western Agropyron smithii
Wildrye, beardless Elymus triticoides
Wildrye, Canadian Elymus canadensis
Vegetable Crops
Artichoke Helianthus tuberosus
Beet, red Beta vulgaris
Squash, zucchini Cucurbita pepo melopepo
Fruit and Nut Crops
Fig Ficus carica

Environmental Impact Assessment ELARD
Olive Oil Residue Treatment Plant – Caza of Hasbaiya Appendices
Jujube Ziziphys jujuba
Olive Olea europaea
Papaya Carica papaya
Pineapple Ananas comosus
Pomegranate Punica granatum
MODERATELY SENSITIVE
Fibre, Seed and Sugar Crops
Broadbean Vicia faba
Castorbean Ricinus communis
Maize Zea mays
Flax Linum usitatissimum
Millet, foxtail Setaria italica
Groundnut/peanut Arachis hypogaea
Rice, paddy Oryza sativa
Sugarcane Saccarum officinarum
Sunflower Helianthus annuus palustris
Grasses and Forage Crops
Alfalfa Medicago sativa
Bentgrass Agrostisstoloniferapalustris
Bluestem, Angleton Dichanthium aristatum
Brome, smooth Bromus inermis
Buffelgrass Cenchrus ciliaris
Burnet Poterium sanguisorba
Clover, alsike Trifolium hydridum
Grasses and Forage Crops
Clover, Berseem Trifolium alexandrinum
Clover, ladino Trifolium repens

Environmental Impact Assessment ELARD
Olive Oil Residue Treatment Plant – Caza of Hasbaiya Appendices
Clover, red Trifolium pratense
Clover, strawberry Trifolium fragiferum
Clover, white Dutch Trifolium repens
Corn (forage) (maize) Zea mays
Cowpea (forage) Vigna unguiculata
Dallis grass Paspalum dilatatum
Foxtail, meadow Alopecurus pratensis
Grama, vlue Bouteloua gracilis
Lovegrass Eragrostis sp.
Milkvetch, Cicer Astragalus deer
Oatgrass, tall Arrhenatherum, Danthonia
Oats (forage) Avena saliva
Orchard grass Dactylis glomerata
Rye (forage) Secale cereale
Sesbania Sesbania exaltata
Siratro Macroptilium atropurpureum
Sphaerophysa Spaerophysa salsula
Timothy Phleum pratense
Vetch, common Vicia angustifolia
Vegetable Crops
Broccoli Brassica oleracea botrytis
Brussel sprouts B. oleracea gemmifera
Cabbage B. oleracea capitata
Cauliflower B. oleracea botrytis
Celery Apium graveolens
Corn, sweet Zea mays
Cucumber Cucumis sativus

Environmental Impact Assessment ELARD
Olive Oil Residue Treatment Plant – Caza of Hasbaiya Appendices
Eggplant Solanum melongena esculentum
Kale Brassica oleracea acephala
Kohlrabi B. oleracea gongylode
Lettuce Latuca sativa
Muskmelon Cucumis melon
Pepper Capsicum annum
Potato Solanum tuberosum
Pumpkin Cucurbita peop pepo
Radish Raphanus sativus
Spinach Spinacia oleracea
Squash, scallop C. pepo melopepo
Sweet potato Ipomoea batatas
Tomato Lycopersicon lycopersicum
Turnip Brassica rapa
Watermelon Citrullus lanatus
Fruit and Nut Crops
Grape Vitis sp.
SENSITIVE
Fibre, Seed and Sugar Crops
Bean Phaseolus vulgaris
Guayule Parthenium argentatum
Sesame Sesamum indicum
Vegetable Crops
Bean Phaseolus vulgaris
Carrot Daucus carota
Okra Abelmoschus esculentus
Onion Allium cepa

Environmental Impact Assessment ELARD
Olive Oil Residue Treatment Plant – Caza of Hasbaiya Appendices
Parsnip Pastinaca sativa
Fruit and Nut Crops
Almond Prunus dulcis
Apple Malus sylvestris
Apricot Prunus armeniaca
Avocado Persea americana
Blackberry Rubus sp.
Boysenberry Rubus ursinus
Cherimoya Annona cherimola
Cherry, sweet Prunus avium
Cherry, sand Prunus besseyi
Currant Ribes sp.
Gooseberry Ribes sp.
Grapefruit Citrus paradisi
Lemon Citrus limon
Lime Citrus aurantifolia
Loquat Eriobotrya japonica
Mango Mangifera indica
Orange Citrus sinensis
Passion fruit Passiflora edulis
Peach Prunus persica
Pear Pyrus communis
Persimmon Diospyros virginiana
Plum: Prune Prunus domestica
Pummelo Citrus maxima
Raspberry Rubus idaeus
Rose apple Syzgium jambos

Environmental Impact Assessment ELARD
Olive Oil Residue Treatment Plant – Caza of Hasbaiya Appendices
Sapote, white Casimiroa edulis
Strawberry Fragaria sp.
Tangerine Citrus reticulata
Source: FAO (1985)
iv. if the salinity of the applied water exceeds 3.0 dS/m, the water might still be usable but its
use may need to be restricted to more permeable soils and more salt-tolerant crops, where
high leaching fractions are more easily achieved. This is being practiced on a large scale in
the Arabian Gulf States, where drip irrigation systems are widely used.
If the exact cropping patterns or rotations are not known for a new area, the leaching requirement must be based on the least tolerant of the crops adapted to the area. In those instances, where soil salinity cannot be maintained within acceptable limits of preferred sensitive crops, changing to more tolerant crops will raise the area's production potential. If there is any doubt about the effect of wastewater salinity on crop production, a pilot study should be undertaken to demonstrate the feasibility of irrigation and the outlook for economic success.
To overcome toxicity hazards
A toxicity problem is different from a salinity problem in that it occurs within the plant itself and is not caused by water shortage. Toxicity normally results when certain ions are taken up by plants with the soil water and accumulate in the leaves during water transpiration to such an extent that the plant is damaged. The degree of damage depends upon time, concentration of toxic material, crop sensitivity, and crop water use and, if damage is severe enough, crop yield is reduced. Common toxic ions in irrigation water are chloride, sodium, and boron, all of which will be contained in sewage. Each can cause damage individually or in combination. Not all crops are equally sensitive to these toxic ions. Some guidance on the sensitivity of crops to sodium, chloride, and boron are given in Tables F-5, F-6, and F-7, respectively. However, toxicity symptoms can appear in almost any crop if concentrations of toxic materials are sufficiently high. Toxicity often accompanies or complicates a salinity or infiltration problem, although it may appear even when salinity is not a problem.
The toxic ions of sodium and chloride can also be absorbed directly into the plant through the leaves when moistened during sprinkler irrigation. This typically occurs during periods of high temperature and low humidity. Leaf absorption speeds up the rate of accumulation of a toxic ion and may be a primary source of the toxicity.

Environmental Impact Assessment ELARD
Olive Oil Residue Treatment Plant – Caza of Hasbaiya Appendices
In addition to sodium, chloride, and boron, many trace elements are toxic to plants at low concentrations, as indicated in Table 10 in Chapter 2. Fortunately, most irrigation supplies and sewage effluents contain very low concentrations of these trace elements and are generally not a problem.
However, urban wastewater may contain heavy metals at concentrations which will give rise to elevated levels in the soil and cause undesirable accumulations in plant tissue and crop growth reductions. Heavy metals are readily fixed and accumulate in soils with repeated irrigation by such wastewaters and may render them either non-productive or the product unusable. Surveys of wastewater use have shown that more than 85 % of the applied heavy metals are likely to accumulate in the soil, most at the surface. The levels at which heavy metals accumulation in the soil is likely to have a deleterious effect on crops are discussed in Chapter 5. Any wastewater use project should include monitoring of soil and plants for toxic materials.
To prevent health hazards
From the point of view of human consumption and potential health hazards, crops and cultivated plants may be classified into the following groups:
Table F-4: RELATIVE TOLERANCE OF SELECTED CROPS TO EXCHANGEABLE SODIUM
Sensitive Semi-tolerant Tolerant
Avocado Carrot Alfalfa
(Persea americana) (Daucus carota) (Medicago sativa)
Deciduous Fruits Clover, Ladino Barley
Nuts (Trifolium repens) (Hordeum vulgare)
Bean, green Dallisgrass Beet, garden
(Phaseolus vulgaris) (Paspalum dilatatum) (Beta vulgaris)
Cotton (at germination) Fescue, tall Beet, sugar
(Gossypium hirsutum) (Festuca arundinacea) (Beta vulgaris)
Maize Lettuce Bermuda grass
(Zea mays) (Lactuca sativa) (Cynodon dactylon)
Peas Bajara Cotton
(Pisum sativum) (Pennisetum typhoides) (Gossypium hirsutum)

Environmental Impact Assessment ELARD
Olive Oil Residue Treatment Plant – Caza of Hasbaiya Appendices
Grapefruit Sugarcane Paragrass
(Citrus paradisi) (Saccharum officinarum) (Brachiaria mutica)
Orange Berseem Rhodes grass
(Citrus sinensis) (Trifolium alexandrinum) (Chloris gayana)
Peach Benji Wheatgrass, crested
(Prunus persica) (Mililotus parviflora) (Agropyron cristatum)
Tangerine Raya Wheatgrass, fairway
(Citrus reticulata) (Brassica juncea) (agropyron cristatum)
Mung Oat Wheatgrass, tall
(Phaseolus aurus) (Avena sativa) (Agropyron elongatum)
Mash Onion Karnal grass
(Phaseolus mungo) (Allium cepa) (Diplachna fusca)
Lentil Radish
(Lens culinaris) (Raphanus sativus)
Groundnut (peanut) Rice
(Arachis hypogaea) (Oryza sativus)
Gram Rye
(Cicer arietinum) (Secale cereale)
Cowpeas Ryegrass, Italian
(Vigna sinensis) (Lolium multiflorum)
Sorghum
(Sorghum vulgare)
Spinach
(Spinacia oleracea)
Tomato
(Lycopersicon esculentum)
Vetch

Environmental Impact Assessment ELARD
Olive Oil Residue Treatment Plant – Caza of Hasbaiya Appendices
(Vicia sativa)
Wheat
(Triticum vulgare)
Source: Adapted from data of FAO-Unesco (1973); Pearson (1960); and Abrol (1982).
i. Food crops
- those eaten uncooked
- those eaten after cooking
ii. Forage and feed crops
- Direct access by animals
- those fed to animals after harvesting
Table F-5: CHLORIDE TOLERANCE OF SOME FRUIT CROP CULTIVARS AND ROOTSTOCKS
Maximum permissible Cl - without leaf injury1 Crop Rootstock or Cultivar
Root zone (Cle) (me/l) Irrigation water (Clw)2 3 (me/l)
Rootstocks
West Indian 7.5 5.0
Guatemalan 6.0 4.0
Avocado (Persea americana)
Mexican 5.0 3.3
Sunki Mandarin 25.0 16.6
Grapefruit
Cleopatra mandarin
Rangpur lime
Sampson tangelo 15.0 10.0
Rough lemon
Sour orange
Ponkan mandarin
Citrus (Citrus spp.)
Citrumelo 4475 10.0 6.7

Environmental Impact Assessment ELARD
Olive Oil Residue Treatment Plant – Caza of Hasbaiya Appendices
Trifoliate orange
Cuban shaddock
Calamondin
Sweet orange
Savage citrange
Rusk citrange
Troyer citrange
Salt Creek, 1613-3 40.0 27.0 Grape(Vitis spp.)
Dog Ridge 30.0 20.0
Marianna 25.0 17.0
Lovell, Shalil 10.0 6.7
Stone Fruits (Prunus spp.)
Yunnan 7.5 5.0
Cultivars
Boysenberry 10.0 6.7
Olallie clackberry 10.0 6.7
Indian SUmmer 5.0 3.3
Berries (Rubus spp.)
Raspberry
Thompson seedless 20.0 13.3
Perlette 20.0 13.3
Cardinal 10.0 6.7
Grape(Vitis spp.)
Black Rose 10.0 6.7
Lassen 7.5 5.0 Strawberry (Fragaria spp.)
Shasta 5.0 3.3
1 For some crops, the concentration given may exceed the overall salinity tolerance of that crop and cause some reduction in yield in addition to that caused by chloride ion toxicities. 2 Values given are for the maximum concentration in the irrigation water. The values were derived from saturation extract data (ECe) assuming a 15-20 percent leaching fraction and ECd = 1.5 ECw.
3 The maximum permissible values apply only to surface irrigated crops. Sprinkler irrigation may cause excessive leaf bum at values far below these.
Source: Adapted from Maas (1984).
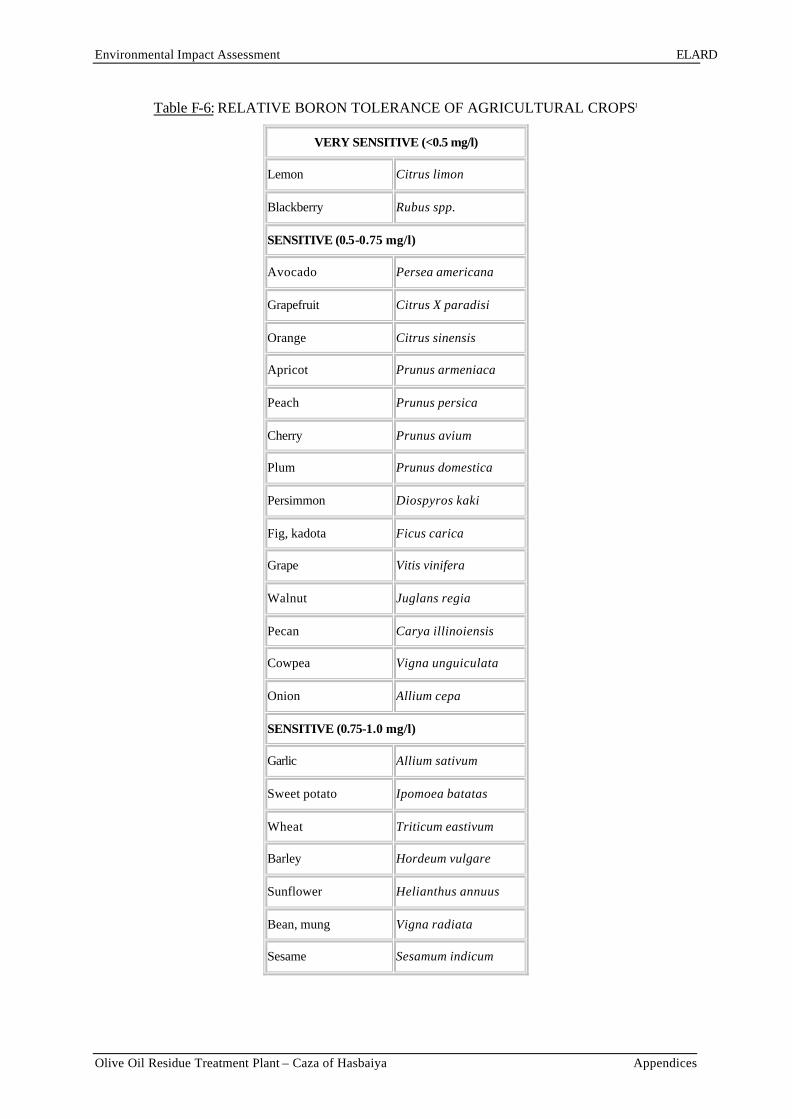
Environmental Impact Assessment ELARD
Olive Oil Residue Treatment Plant – Caza of Hasbaiya Appendices
Table F-6: RELATIVE BORON TOLERANCE OF AGRICULTURAL CROPS1
VERY SENSITIVE (<0.5 mg/l)
Lemon Citrus limon
Blackberry Rubus spp.
SENSITIVE (0.5-0.75 mg/l)
Avocado Persea americana
Grapefruit Citrus X paradisi
Orange Citrus sinensis
Apricot Prunus armeniaca
Peach Prunus persica
Cherry Prunus avium
Plum Prunus domestica
Persimmon Diospyros kaki
Fig, kadota Ficus carica
Grape Vitis vinifera
Walnut Juglans regia
Pecan Carya illinoiensis
Cowpea Vigna unguiculata
Onion Allium cepa
SENSITIVE (0.75-1.0 mg/l)
Garlic Allium sativum
Sweet potato Ipomoea batatas
Wheat Triticum eastivum
Barley Hordeum vulgare
Sunflower Helianthus annuus
Bean, mung Vigna radiata
Sesame Sesamum indicum

Environmental Impact Assessment ELARD
Olive Oil Residue Treatment Plant – Caza of Hasbaiya Appendices
Lupine Lupinus hartwegii
Strawberry Fragaria spp.
Artichoke, Jerusalem Helianthus tuberosus
Bean, kidney Phaseolus vulgaris
Bean, lima Phaseolus lunatus
Groundnut/Peanut Arachis hypogaea
MODERATELY SENSITIVE (1.0-2.0 mg/l)
Pepper, red Capsicum annuum
Pea Pisum sativa
Carrot Daucus carota
Radish Raphanus sativus
Potato Solanum tuberosum
Cucumber Cucumis sativus
MODERATELY TOLERANT (2.0-4.0 mg/l)
Lettuce Lactuca sativa
Cabbage B. oleracea capitata
Celery Apium graveolens
Turnip Brassica rapa
Bluegrass, Kentucky Poa pratensis
Oats Avena sativa
Maize Zea mays
Artichoke Cynara scolymus
Tobacco Nicotiana tabacum
Mustard Brassica juncea
Clover, sweet Melilotus indica
Squash Cucurbita pepo
Muskmelon Cucumis melo

Environmental Impact Assessment ELARD
Olive Oil Residue Treatment Plant – Caza of Hasbaiya Appendices
TOLERANT (4.0-6.0 mg/l)
Sorghum Sorghum bicolor
Tomato L. lycopersicum
Alfalfa Medicago sativa
Vetch, purple Vicia benghalensis
Parsley Petroselinum crispum
Beet, red Beta vulgaris
Sugarbeet Beta vulgaris
VERY TOLERANT (6.0-15.0 mg/l)
Cotton Gossypium hirsutum
Asparagus Asparagus officinalis
1 Maximum concentrations tolerated in soil water without yield or vegetative growth reductions. Boron tolerances vary depending upon climate, soil conditions and crop varieties. Maximum concentrations in the irrigation water are approximately equal to these values or slightly less.
Source: Maas (1984)
iii. Landscaping plants:
- Unprotected areas with public access
- semi-protected areas
iv. Afforestation plants:
- commercial (fruit, timber, fuel and charcoal)
- environmental protection (including sand stabilization)
In terms of health hazards, treated effluent with a high microbiological quality is necessary for the irrigation of certain crops, especially vegetable crops eaten raw, but a lower quality is acceptable for other selected crops, where there is no exposure to the public (see Table 8 in Chapter 2). The WHO (1989) Technical Report No. 778 suggested a categorization of crops according to the exposed group and the degree to which health protection measures are required, as shown in Example 4.

Environmental Impact Assessment ELARD
Olive Oil Residue Treatment Plant – Caza of Hasbaiya Appendices
EXAMPLE 4 - CATEGORIZATION OF CROPS IN RELATION TO EXPOSED GROUP AND HEALTH CONTROL MEASURES
Category A:
- Protection required for consumers, agricultural workers, and the general public,
- Includes crops likely to be eaten uncooked, spray-irrigated fruits and grass (sports fields, public parks and lawns);
Category B:
- Protection required for agricultural workers only,
- Includes cereal crops, industrial crops (such as cotton and sisal), food crops for canning, fodder crops, pasture and trees,
- In certain circumstances some vegetable crops might be considered as belonging to Category B if they are not eaten raw (potatoes, for instance) or if they grow well above ground (for example, chillies), in such cases it is necessary to ensure that the crop is not contaminated by sprinkler irrigation or by falling on to the ground, and that contamination of kitchens by such crops, before cooking, does not give rise to a health risk.
SELECTION OF IRRIGATION METHODS
The different types of irrigation methods have been introduced earlier. Under normal conditions, the type of irrigation method selected will depend on water supply conditions, climate, soil, crops to be grown, cost of irrigation method and the ability of the farmer to manage the system. However, when using wastewater as the source of irrigation other factors, such as contamination of plants and harvested product, farm workers, and the environment, and salinity and toxicity hazards, will need to be considered. There is considerable scope for reducing the undesirable effects of wastewater use in irrigation through selection of appropriate irrigation methods.
The choice of irrigation method in using wastewater is governed by the following technical factors:
- the choice of crops,
- the wetting of foliage, fruits and aerial parts,
- the distribution of water, salts and contaminants in the soil,
- the ease with which high soil water potential could be maintained,
- the efficiency of application, and
- the potential to contaminate farm workers and the environment.
Table F-7 presents an analysis of these factors in relation to four widely practiced irrigation methods, namely border, furrow, sprinkler, and drip irrigation.
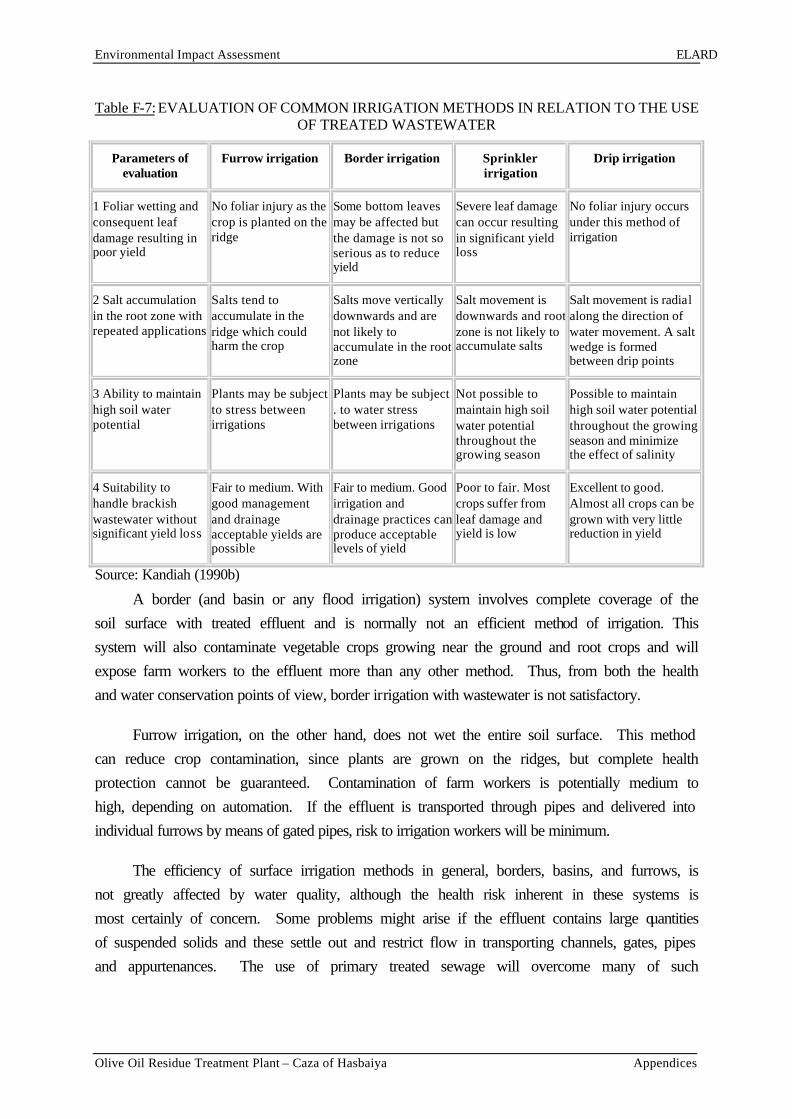
Environmental Impact Assessment ELARD
Olive Oil Residue Treatment Plant – Caza of Hasbaiya Appendices
Table F-7: EVALUATION OF COMMON IRRIGATION METHODS IN RELATION TO THE USE OF TREATED WASTEWATER
Parameters of evaluation
Furrow irrigation Border irrigation Sprinkler irrigation
Drip irrigation
1 Foliar wetting and consequent leaf damage resulting in poor yield
No foliar injury as the crop is planted on the ridge
Some bottom leaves may be affected but the damage is not so serious as to reduce yield
Severe leaf damage can occur resulting in significant yield loss
No foliar injury occurs under this method of irrigation
2 Salt accumulation in the root zone with repeated applications
Salts tend to accumulate in the ridge which could harm the crop
Salts move vertically downwards and are not likely to accumulate in the root zone
Salt movement is downwards and root zone is not likely to accumulate salts
Salt movement is radial along the direction of water movement. A salt wedge is formed between drip points
3 Ability to maintain high soil water potential
Plants may be subject to stress between irrigations
Plants may be subject . to water stress between irrigations
Not possible to maintain high soil water potential throughout the growing season
Possible to maintain high soil water potential throughout the growing season and minimize the effect of salinity
4 Suitability to handle brackish wastewater without significant yield loss
Fair to medium. With good management and drainage acceptable yields are possible
Fair to medium. Good irrigation and drainage practices can produce acceptable levels of yield
Poor to fair. Most crops suffer from leaf damage and yield is low
Excellent to good. Almost all crops can be grown with very little reduction in yield
Source: Kandiah (1990b)
A border (and basin or any flood irrigation) system involves complete coverage of the soil surface with treated effluent and is normally not an efficient method of irrigation. This system will also contaminate vegetable crops growing near the ground and root crops and will expose farm workers to the effluent more than any other method. Thus, from both the health and water conservation points of view, border irrigation with wastewater is not satisfactory.
Furrow irrigation, on the other hand, does not wet the entire soil surface. This method can reduce crop contamination, since plants are grown on the ridges, but complete health protection cannot be guaranteed. Contamination of farm workers is potentially medium to high, depending on automation. If the effluent is transported through pipes and delivered into individual furrows by means of gated pipes, risk to irrigation workers will be minimum.
The efficiency of surface irrigation methods in general, borders, basins, and furrows, is not greatly affected by water quality, although the health risk inherent in these systems is most certainly of concern. Some problems might arise if the effluent contains large quantities of suspended solids and these settle out and restrict flow in transporting channels, gates, pipes and appurtenances. The use of primary treated sewage will overcome many of such

Environmental Impact Assessment ELARD
Olive Oil Residue Treatment Plant – Caza of Hasbaiya Appendices
problems. To avoid surface ponding of stagnant effluent, land levelling should be carried out carefully and appropriate land gradients should be provided.
Sprinkler, or spray, irrigation methods are generally more efficient in terms of water use since greater uniformity of application can be achieved. However, these overhead irrigation methods may contaminate ground crops, fruit trees and farm workers. In addition, pathogens contained in aerosolized effluent may be transported downwind and create a health risk to nearby residents. Generally, mechanized or automated systems have relatively high capital costs and low labour costs compared with manually-moved sprinkler systems. Rough land levelling is necessary for sprinkler systems, to prevent excessive head losses and achieve uniformity of wetting. Sprinkler systems are more affected by water quality than surface irrigation systems, primarily as a result of the clogging of orifices in sprinkler heads, potential leaf burns and phytotoxicity when water is saline and contains excessive toxic elements, and sediment accumulation in pipes, valves and distribution systems. Secondary wastewater treatment has generally been found to produce an effluent suitable for distribution through sprinklers, provided that the effluent is not too saline. Further precautionary measures, such as treatment with granular filters or micro-strainers and enlargement of nozzle orifice diameters to not less than 5 mm, are often adopted.
Localized irrigation, particularly when the soil surface is covered with plastic sheeting or other mulch, uses effluent more efficiently, can often produce higher crop yields and certainly provides the greatest degree of health protection for farm workers and consumers. Trickle and drip irrigation systems are expensive, however, and require a high quality of effluent to prevent clogging of the emitters through which water is slowly released into the soil. Table F-8 presents water quality requirements to prevent clogging in localized irrigation systems. Solids in the effluent or biological growth at the emitters will create problems but gravel filtration of secondary treated effluent and regular flushing of lines have been found to be effective in preventing such problems in Cyprus (Papadopoulos and Stylianou 1988). Bubbler irrigation, a technique developed for the localized irrigation of tree crops avoids the need for small emitter orifices but careful setting is required for its successful application (Hillel 1987).

Environmental Impact Assessment ELARD
Olive Oil Residue Treatment Plant – Caza of Hasbaiya Appendices
Table F-8: WATER QUALITY AND CLOGGING POTENTIAL IN DRIP IRRIGATION SYSTEMS
Degree of Restriction on Use Potential Problem Units
None Slight to Moderate Severe
Physical
Suspended Solids mg/l < 50 50- 100 > 100
Chemical
pH < 7.0 7.0 - 8.0 > 8.0
Dissolved Solids mg/l < 500 500-2000 > 2000
Manganese mg/l < 0.1 0.1 - 1.5 > 1.5
Iron mg/l < 0.1 0.1 - 1.5 > 1.5
Hydrogen Sulphide mg/l < 0.5 0.5 - 2.0 > 2.0
Biological maximum
Bacterial populations number/ml < 10000 10 000 - 50 000 > 50000
Source: Adapted from Nakayama (1982)
When compared with other systems, the main advantages of trickle irrigation seem to be:
i. increased crop growth and yield achieved by optimizing the water, nutrients and air regimes
in the root zone,
ii. High irrigation efficiency - no canopy interception, wind drift or conveyance losses and
minimal drainage losses,
iii. Minimal contact between farm workers and effluent,
iv. Low energy requirements - the trickle system requires a water pressure of only 100-300 k Pa (1-3 bar),
v. low labour requirements - the trickle system can easily be automated, even to allow combined irrigation and fertilization (sometimes terms fertigation).
Apart from the high capital costs of trickle irrigation systems, another limiting factor in their use is that they are only suited to the irrigation of row crops. Relocation of subsurface systems can be prohibitively expensive.

Environmental Impact Assessment ELARD
Olive Oil Residue Treatment Plant – Caza of Hasbaiya Appendices
Clearly, the decision on irrigation system selection will be mainly a financial one but it is essential that the health risks associated with the different methods will be taken into account. As pointed out in Section 2.1, the method of effluent application is one of the health control measures possible, along with crop selection, wastewater treatment, and human exposure control. Each measure will interact with the others and thus a decision on irrigation system selection will have an influence on wastewater treatment requirements, human exposure control and crop selection (for example, row crops are dictated by trickle irrigation). At the same time the irrigation techniques feasible will depend on crop selection and the choice of irrigation system might be limited if wastewater treatment has already been decided before effluent use is considered.
FIELD MANAGEMENT PRACTICES IN WASTEWATER IRRIGATION
Water management Land and soil management Crop management and cultural practices
Management of water, soil, crop, and operational procedures, including precautions to protect farm workers, play an important role in the successful use of sewage effluent for irrigation.
Water management
Most treated wastewaters are not very saline, salinity levels usually ranging between 500 and 200 mg/l (ECw = 0.7 to 3.0 dS/m). However, there may be instances where the salinity concentration exceeds the 2000 mg/l level. In any case, appropriate water management practices will have to be followed to prevent salinization, irrespective of whether the salt content in the wastewater is high or low. It is interesting to note that even the application of a non-saline wastewater, such as one containing 200 to 500 mg/l, when applied at a rate of 20,000 m3 per hectare, a fairly typical irrigation rate, will add between 2 and 5 tones of salt annually to the soil. If this is not flushed out of the root zone by leaching and removed from the soil by effective drainage, salinity problems can build up rapidly. Leaching and drainage are thus two important water management practices to avoid salinization of soils.
Leaching
The concept of leaching has already been discussed. The question that arises is how much water should be used for leaching, i.e. what is the leaching requirement? To estimate the leaching requirement, both the salinity of the irrigation water (ECw) and the crop

Environmental Impact Assessment ELARD
Olive Oil Residue Treatment Plant – Caza of Hasbaiya Appendices
tolerance to soil salinity (ECe) must be known. The necessary leaching requirement (LR) can be estimated from Figure 14 for general crop rotations reported by Ayers and Westcot (FAO 1985). A more exact estimate of the leaching requirement for a particular crop can be obtained using the following equation:
(14)
Where:
LR = minimum leaching requirement needed to control salts within the tolerance (ECe) of the crop with ordinary surface methods of irrigation ECw = salinity of the applied irrigation water in dS/m
ECe = average soil salinity tolerated by the crop as measured on a soil saturation extract. It is recommended that the ECe value that can be expected to result in at least a 90% or greater yield be used in the calculation.
Figure F-2 was developed using ECe values for the 90% yield potential. For water in the moderate to high salinity range (>1.5 dS/m), it might be better to use the ECe value for maximum yield potential (100%) since salinity control is critical in obtaining good yields. Further information on this is contained in Irrigation and Drainage Paper 29, Rev. 1 (FAO 1985).

Environmental Impact Assessment ELARD
Olive Oil Residue Treatment Plant – Caza of Hasbaiya Appendices
Figure F-2: Relationship between applied water salinity and soil water salinity at different leaching fractions (FAO 1985)
Where water is scarce and expensive, leaching practices should be designed to maximize crop production per unit volume of water applied, to meet both the consumptive use and leaching requirements. Depending on the salinity status, leaching can be carried out at each irrigation, each alternative irrigation or less frequently, such as seasonally or at even longer intervals, as necessary to keep the salinity in the soil below the threshold above which yield might be affected to an unacceptable level. With good quality irrigation water, the irrigation application level will usually apply sufficient extra water to accomplish leaching. With high salinity irrigation water, meeting the leaching requirement is difficult and requires large amounts of water. Rainfall must be considered in estimating the leaching requirement and in choosing the leaching method.
The following practices are suggested for increasing the efficiency of leaching and reducing the amount of water needed:

Environmental Impact Assessment ELARD
Olive Oil Residue Treatment Plant – Caza of Hasbaiya Appendices
i. leach during cool seasons instead of during warm periods, to increase the efficiency and
ease of leaching, since the total annual crop water demand (ET, mm/year) losses are lower,
ii. Use more salt-tolerant crops that require a lower leaching requirement (LR) and thus have a
lower water demand,
iii. use tillage to slow overland water flow and reduce the number of surface cracks which
bypass flow through large pores and decrease leaching efficiency,
iv. Use sprinkler irrigation at an application rate below the soil infiltration rate as this favours
unsaturated flow, which is significantly more efficient for leaching than saturated flow. More
irrigation time but less water is required than for continuous ponding,
v. use alternate ponding and drying instead of continuous ponding as this is more efficient for
leaching and uses less water, although the time required to leach is greater. This may have
drawbacks in areas having a high water table, which allows secondary salinization between
pondings,
vi. Where possible, schedule leaching at periods of low crop water use or postpone leaching
until after the cropping season,
vii. Avoid fallow periods, particularly during hot summers, when rapid secondary soil
salinization from high water tables can occur,
viii. If infiltration rates are low, consider pre-planting irrigations or off-season leaching to
avoid excessive water applications during the crop season, and
ix. Use one irrigation before the start of the rainy season if total rainfall is normally expected
to be insufficient for a complete leaching. Rainfall is often the most efficient leaching method
because it provides high quality water at relatively low rates of application.
Drainage
Salinity problems in many irrigation projects in arid and semi-arid areas are associated with the presence of a shallow water table. The role of drainage in this context is to lower the water table to a desirable level, at which it does not contribute to the transport of salts to the root zone and the soil surface by capillarity. What is important is to maintain a downward movement of water through soils. Van Schilfgaard (1984) reported that drainage criteria are frequently expressed in terms of critical water table depths; although this is a useful concept, prevention of salinization depends on the establishment, averaged over a period, of a downward flux of water. Another important element of the total drainage system is its ability to transport the desired amount of drained water out of the irrigation scheme and dispose of it safely. Such disposal can pose a serious problem, particularly when the source of irrigation water is treated wastewater, depending on the composition of the drainage effluent.

Environmental Impact Assessment ELARD
Olive Oil Residue Treatment Plant – Caza of Hasbaiya Appendices
Timing of irrigation
The timing of irrigation, including irrigation frequency, pre-planting irrigation and irrigation prior to a winter rainy season can reduce the salinity hazard and avoid water stress between irrigations. Some of these practices are readily applicable to wastewater irrigation.
In terms of meeting the water needs of crops, increasing the frequency of irrigation will be desirable as it eliminates water stress between irrigations. However, from the point of view of overall water management, this may not always produce the desired results. For example, with border, basin and other flood irrigation methods, frequent irrigations may result in an unacceptable increase in the quantity of water applied, decrease in water use efficiency and larger amounts of water to be drained. However, with sprinklers and localized irrigation methods, frequent applications with smaller amounts may not result in decrease in water use efficiency and, indeed, could help to overcome the salinity problem associated with saline irrigation water.
Pre-planting irrigation is practiced in many irrigation schemes for two reasons, namely: (i) to leach salts from the soil surface which may have accumulated during the previous cropping period and to provide a salt-free environment to germinating seeds (it should be noted that for most crops, the seed germination and seedling stages are most sensitive to salinity); and (ii) to provide adequate moisture to germinating seeds and young seedlings. A common practice among growers of lettuce, tomatoes and other vegetable crops is to pre-irrigate the field before planting, since irrigation soon after planting could create local water stagnation and wet spots that are not desirable. Treated wastewater is a good source for pre-irrigation as it is normally not saline and the health hazards are practically nil.
Blending of wastewater with other water supplies
One of the options that may be available to farmers is the blending of treated sewage with conventional sources of water, canal water, or ground water, if multiple sources are available. It is possible that a farmer may have saline ground water and, if he has non-saline treated wastewater, could blend the two sources to obtain a blended water of acceptable salinity level. Further, by blending, the microbial quality of the resulting mixture could be superior to that of the unblended wastewater.
Alternating treated wastewater with other water sources
Another strategy is to use the treated wastewater alternately with the canal water or groundwater, instead of blending. From the point of view of salinity control, alternate

Environmental Impact Assessment ELARD
Olive Oil Residue Treatment Plant – Caza of Hasbaiya Appendices
applications of the two sources will be superior to blending. However, an alternating application strategy will require duel conveyance systems and availability of the effluent dictated by the alternate schedule of application.
Land and soil management
Several land and soil management practices can be adopted at the field level to overcome salinity, sodicity, toxicity, and health hazards that might be associated with the use of treated wastewater.
Land development
During the early stages of on-farm land development, steps can be taken to minimize potential hazards that may result from the use of wastewater. These will have to be well planned, designed and executed since they are expensive and, often, one time operations. Their goal is to improve permanently existing land and soil conditions in order to make irrigation with wastewater easier. Typical activities include levelling of land to a given grade, establishing adequate drainage (both open and sub-surface systems), deep ploughing and leaching to reduce soil salinity.
Land grading
Land grading is important to achieve good uniformity of application from surface irrigation methods and acceptable irrigation efficiencies in general. If the wastewater is saline, it is very important that the irrigated land be appropriately graded. Salts accumulate in the high spots that have too little water infiltration and leaching, while in the low spots water accumulates, causing water logging and soil crusting.
Land grading is well accepted as an important farm practice in irrigated agriculture. Several methods are available to grade land to a desired slope. The slope required will vary with the irrigation system, length of run of water flow, soil type, and the design of the field. Recently, laser techniques have been applied to level land precisely to obtain high irrigation efficiencies and prevent salinization.
Deep cultivation
In certain areas, the soil is stratified, and such soils are difficult to irrigate. Layers of clay, sand, or hardpan in stratified soils frequently impede or prevent free movement of water through and beyond the root zone. This will not only lead to saturation of the root zone but also to accumulation of salts in the root zone. Irrigation efficiency as well as water movement in the soil can be greatly enhanced by sub-soiling and chiselling of the land. The effects of sub-soiling and chiselling remain for about 1 to 5 years but, if long term effects are required,

Environmental Impact Assessment ELARD
Olive Oil Residue Treatment Plant – Caza of Hasbaiya Appendices
the land should be deep, and slip ploughed. Deep or slip ploughing is costly and usually requires the growing of annual crops soon after to allow the settling of the land. Following a couple of grain crops, grading will be required to re-establish a proper grade to the land.
Crop management and cultural practices
Several cultural and crop management practices that are valid under saline water use will be valid under wastewater use. These practices are aimed at preventing damage to crops caused by salt accumulation surrounding the plants and in the root zone and adjusting fertilizer and agrochemical applications to suit the quality of the wastewater and the crop.
Placement of seed
In most crops, seed germination is more seriously affected by soil salinity than other stages of development of a crop. The effects are pronounced in furrow-irrigated crops, where the water is fairly to highly saline. This is because water moves upwards by capillarity in the ridges, carrying salts with it. When water is either absorbed by roots or evaporated, salts are deposited in the ridges. Typically, the highest salt concentration occurs in the centre of the ridge, whereas the lowest concentration of salt is found along the shoulders of the ridges. An efficient means of overcoming this problem is to ensure that the soil around the germinating seeds is sufficiently low in salinity. Appropriate planting methods, ridge shapes, and irrigation management can significantly decrease damage to germinating seeds. Some specific practices include:
i. Planting on the shoulder of the ridge in the case of single row planting or on both shoulders
in double row planting,
ii. Using sloping beds with seeds planted on the sloping side, but above the water line,
iii. Irrigating alternate rows so that the salts can be moved beyond the single seed row.
Figure F-3 presents schematic representations of salt accumulation, planting positions, ridge shapes and watering patterns.

Environmental Impact Assessment ELARD
Olive Oil Residue Treatment Plant – Caza of Hasbaiya Appendices
Figure F-3: Schematic representations of salt accumulation and planting methods in ridge and furrow irrigation (Bernstein and Fireman 1957)
PLANNING FOR WASTEWATER IRRIGATION
Central planning
Desirable site characteristics
Crop selection issues
Central planning
Government policy on effluent use in agriculture will have a deciding effect on what control measures can be achieved through careful selection of site and crops to be irrigated with treated effluent. A decision to make treated effluent available to farmers for unrestricted irrigation or to irrigate public parks and urban green areas with effluent will remove the possibility of taking advantage of careful selection of sites, irrigation techniques, and crops in limiting the health risks and minimizing environmental impacts. However, if a Government decides that effluent irrigation will only be applied in specific controlled areas, even if crop selection is not limited (that is, unrestricted irrigation is allowed within these areas), public

Environmental Impact Assessment ELARD
Olive Oil Residue Treatment Plant – Caza of Hasbaiya Appendices
access to the irrigated areas will be prevented and some of the control measures described in Chapter 2 can be applied. Without doubt, the greatest security against health risk and adverse environmental impact will be achieved by limiting effluent use to restricted irrigation on controlled areas to which the public has no access but even imposing restrictions on effluent irrigation by farmers, if properly enforced, can achieve a degree of control.
Cobham and Johnson (1988) have suggested that the procedures involved in preparing plans for effluent irrigation schemes are similar to those used in most forms of resource planning and summarized the main physical, social, and economic dimensions as in Figure F-4. They also indicated that a number of key issues or tasks were likely to have a significant effect on the ultimate success of effluent irrigation, as follows:
i. organizational and managerial provisions made to administer the resource, to select the
effluent use plan and to implement it,
ii. The importance attached to public health considerations and the levels of risk taken,
iii. The choice of single-use or multiple-use strategies,
iv. The criteria adopted in evaluating alternative reuse proposals,
v. The level of appreciation of the scope for establishing a forest resource.
Adopting a mix of effluent use strategies is normally advantageous in respect of allowing greater flexibility, increased financial security and more efficient use of the wastewater throughout the year, whereas a single-use strategy will give rise to seasonal surpluses of effluent for unproductive disposal. Therefore, in site and crop selection the desirability of providing areas for different crops and forestry so as to utilize the effluent at maximum efficiency over the whole yearly cycle of seasons must be kept in mind.

Environmental Impact Assessment ELARD
Olive Oil Residue Treatment Plant – Caza of Hasbaiya Appendices
Figure F-4: Main components of general planning guidelines for wastewater reuse (Cobham and Johnson 1988)
Desirable site characteristics
The features which are critical in deciding the viability of a land disposal project are the location of available land and public attitudes. Land which is far distant from the sewage treatment plant will incur high costs for transporting treated effluent to site and will generally not be suitable. Hence, the availability of land for effluent irrigation should be considered when sewerage is being planned and sewage treatment plants should be strategically located in relation to suitable agricultural sites. Ideally, these sites should not be close to residential areas but even remote land might not be acceptable to the public if the social, cultural, or religious attitudes are opposed to the practice of wastewater irrigation. The potential health hazards associated with effluent irrigation can make this a very sensitive issue and public concern will only be mollified by the application of strict control measures. In arid areas, the importance of agricultural use of treated effluent makes it advisable to be as systematic as possible in planning, developing and managing effluent irrigation projects and the public must be kept informed at all stages.

Environmental Impact Assessment ELARD
Olive Oil Residue Treatment Plant – Caza of Hasbaiya Appendices
The ideal objective in site selection is to find a suitable area where long-term application of treated effluent will be feasible without adverse environmental or public health impacts. It might be possible in a particular instance to identify several potential sites within reasonable distance of the sewered community and the problem will be to select the most suitable area or areas, considering all relevant factors. The following basic information on an area under consideration will be of value, if available:
- A topographic map,
- Agricultural soils surveys,
- Aerial photographs,
- Geological maps and reports,
- Groundwater reports and well logs,
- Boring logs and soil test results,
- Other soil and peizometric data.
At this preliminary stage of investigation, it should be possible to assess the potential impact of treated effluent application on any usable aquifer in the area(s) concerned. The first ranking of sites should take into account other factors, such as the cost and location of the land, its present use, and availability, and social factors, in addition to soil and groundwater conditions.
The characteristics of the soil profile underlying a particular site are very important in deciding on its suitability for effluent irrigation and the methods of application to be employed. Among the soil properties important from the point of view of wastewater, application and agricultural production are physical parameters (such as texture, grading, liquid, and plastic limits, etc.), permeability, water-holding capacity, pH, salinity, and chemical composition. Preliminary observation of sites, which could include shallow hand-auger borings and identification of vegetation, will often allow the elimination of clearly unsatisfactory sites. After elimination of marginal sites, each site under serious consideration must be investigated by on-site borings to ascertain the soil profile, soil characteristics, and location of the water table. Peizometers should be located in each borehole and these can be used for subsequent groundwater sampling. A procedure for such site assessment has been described by Hall and Thompson (1981) and, if applied, should not only allow the most suitable site among several possible to be selected but permit the impact of effluent irrigation at the chosen site to be modeled. When a site is developed, a long-term groundwater-monitoring programme should be an essential feature of its management.

Environmental Impact Assessment ELARD
Olive Oil Residue Treatment Plant – Caza of Hasbaiya Appendices
Crop selection issues
Normally, in choosing crops, a farmer is influenced by economics, climate, soil and water characteristics, management skill, labour and equipment available and tradition. The degree to which the use of treated effluent influences crop selection will depend on Government policy on effluent irrigation, the goals of the user and the effluent quality. Government policy will have the objectives of minimizing the health risk and influencing the type of productivity associated with effluent irrigation. Regulations must be realistic and achievable in the context of national and local environmental conditions and traditions. At the same time, planners of effluent irrigation schemes must attempt to achieve maximum productivity and water conservation through the choice of crops and effluent application systems.
A multiple-use strategy approach will require the evaluation of viable combinations of the cropping options possible on the land available. This will entail a considerable amount of survey and resource budgeting work, in addition to the necessary soil and water quality assessments. The annual, monthly, and daily water demands of the crops, using the most appropriate irrigation techniques, have to be determined. Domestic consumption, local production, and imports of the various crops must be assessed so that the economic potential of effluent irrigation of the various crop combinations can be estimated. Finally, the crop irrigation demands must be matched with the available effluent to achieve optimum physical and financial utilization throughout the year. This process of assessment is reviewed by Cobham and Johnson (1988) for the case of effluent use in Kuwait, where afforestation for commercial purposes was found to offer significant potential in multiple-use effluent irrigation.

Environmental Impact Assessment ELARD
Olive Oil Residue Treatment Plant – Caza of Hasbaiya Appendices
APPENDIX G EMP COMPLIANCE FORMS AND OFFICIAL NOTICES

Environmental Impact Assessment ELARD
Olive Oil Residue Treatment Plant – Caza of Hasbaiya Appendices
APPENDIX H COST OF THE PROPOSED MONITORING PLAN
Table H-1: MONTHLY COST OF PERFORMANCE MONITORING FOR THE UASB-EAAS SYSTEM DURING THE EARLY OPERATIONAL PHASE
Sampling Location Analytical Parameter Early Operational Phase Sampling Frequency4
Cost per sample in L.L.
Cost/month in L.L.
Biochemical Oxygen Demand 5
1/M 30,000.00 30,000.00
Total Suspended Solids 1/M 22,500.00 22,500.00
Total Nitrogen5 1/M 181,000.00 181,000.00
Plant Influent or UASB Influent
Ammonia- nitrogen M 12,000.00 12,000.00
BOD5 1/W 30,000.00 120,000.00
Total Nitrogen 1/2W 181,000.00 362,000.00
Ammonia-nitrogen 1/W 12,000.00 48,000.00
UASB Effluent / EAAS Influent
Total solids 1/W 35,000.00 140,000.00
BOD5 1/W 30,000.00 120,000.00
Total Suspended Solids 1/W 22,500.00 90,000.00
pH D
Total Nitrogen 1/2W 181,000.00 362,000.00
Ammonia- nitrogen 1/2W 12,000.00 24,000.00
Nitrates 1/2W 13,500.00 27,000.00
Final settlement tank effluent
Nitrites 1/2W 13,500.00 27,000.00
Post-chlorination Total & Fecal coliforms 1/W 24,000.00 96,000.00
Nitrates 1/W 13,500.00 54,000.00
Ammonia- nitrogen 1/W 12,000.00 48,000.00
Total solids 1/W 35,000.00 140,000.00
Sludge holding tank contents (if applicable)
Volatile solids 1/2W 22,500.00 45,000.00
Nitrates 1/W 13,500.00 54,000.00
Ammonia 1/W 12,000.00 48,000.00
Total solids6 1/W 35,000.00 140,000.00
Settled sludge in holding tank
Volatile solids 1/2W 22,500.00 45,000.00
subtotal/month 2,235,500.00
4 D: daily, 1/W: once per week, 1/2W: once per two weeks, M: monthly, 1/2M: once per two months 5 Carbon, Hydrogen, Nitrogen and Sulfur are sampled together using Elemental Analyzer method 6 Sum of Total Suspended Solids and Total Dissolved Solids

Environmental Impact Assessment ELARD
Olive Oil Residue Treatment Plant – Caza of Hasbaiya Appendices
Table H-2: MONTHLY COST OF PERFORMANCE MONITORING FOR THE UASB-EAAS SYSTEM DURING THE ADVANCED OPERATIONAL PHASE
Sampling Location Analytical Parameter Advanced Operational Phase Sampling Frequency7
Cost per sample in L.L.
Cost/month in L.L.
Biochemical Oxygen Demand 5
1/2M 30,000.00 15,000.00
Total Suspended Solids 1/2M 22,500.00 11,250.00
Total Nitrogen8 1/2M 181,000.00 100,000.00
Plant Influent or UASB Influent
Ammonia- nitrogen 1/2M 12,000.00 6,000.00
BOD5 1/2W 30,000.00 60,000.00
Total Nitrogen M 181,000.00 181,000.00
Ammonia-nitrogen M 12,000.00 12,000.00
UASB Effluent / EAAS Influent
Total solids 1/2W 35,000.00 70,000.00
BOD5 1/2W 30,000.00 60,000.00
Total Suspended Solids 1/2W 22,500.00 90,000.00
pH D 8,000.00
Total Nitrogen M 181,000.00 181,000.00
Ammonia- nitrogen M 12,000.00 12,000.00
Nitrates M 13,500.00 13,500.00
Final settlement tank effluent
Nitrites M 13,500.00 13,500.00
Post-chlorination Total & Fecal coliforms 1/2W 24,000.00 48,000.00
Nitrates M 13,500.00 13,500.00
Ammonia- nitrogen M 12,000.00 12,000.00
Total solids9 1/2W 35,000.00 70,000.00
Sludge holding tank contents (if applicable)
Volatile solids M 22,500.00 22,500.00
Nitrates M 13,500.00 13,500.00
Ammonia M 12,000.00 12,000.00
Total solids 1/2W 35,000.00 70,000.00 Settled sludge in holding tank
Volatile solids M 22,500.00 22,500.00
subtotal/month 1,109,250.00
7 D: daily, 1/W: once per week, 1/2W: once per two weeks, M: monthly, 1/2M: once per two months 8 Carbon, Hydrogen, Nitrogen and Sulfur are sampled together using Elemental Analyzer method 9 Sum of Total Suspended Solids and Total Dissolved Solids

Environmental Impact Assessment ELARD
Olive Oil Residue Treatment Plant – Caza of Hasbaiya Appendices
Table H-3: MONTHLY COST OF PERFORMANCE MONITORING FOR THE UASB-EAAS SYSTEM FOR MINIMAL SAMPLING
Sampling Location Analytical Parameter Minimum sampling10 Cost per sample in L.L.
Cost/month in L.L.
Biochemical Oxygen Demand 5
1/3M 30,000.00 10,000.00
Total Suspended Solids 1/3M 22,500.00 7,500.00
Total Nitrogen11 1/3M 181,000.00 60,333.33
Plant Influent or UASB Influent
Ammonia- nitrogen 1/3M 12,000.00 4,000.00
BOD5 M 30,000.00 30,000.00
Total Nitrogen 1/2M 181,000.00 90,500.00
Ammonia-nitrogen 1/2M 12,000.00 6,000.00 UASB Effluent / EAAS Influent
Total solids M 35,000.00 35,000.00
BOD5 M 30,000.00 30,000.00
Total Suspended Solids M 22,500.00 22,500.00
pH D 8,000.00
Total Nitrogen 1/2M 181,000.00 90,500.00
Ammonia- nitrogen 1/2M 12,000.00 6,000.00
Nitrates 1/2M 13,500.00 6,750.00
Final settlement tank effluent
Nitrites 1/2M 13,500.00 6,750.00
Post-chlorination Total & Fecal coliforms M 24,000.00 24,000.00
Nitrates 1/2M 13,500.00 6,750.00 Ammonia- nitrogen 1/2M 12,000.00 6,000.00
Total solids12 M 35,000.00 35,000.00
Sludge holding tank contents (if applicable)
Volatile solids M 22,500.00 22,500.00
Nitrates 1/2M 13,500.00 6,750.00
Ammonia 1/2M 12,000.00 6,000.00
Total solids M 35,000.00 35,000.00
Settled sludge in holding tank
Volatile solids M 22,500.00 22,500.00
subtotal/month 570,333.33
10 D: daily, 1/W: once per week, 1/2W: once per two weeks, M: monthly, 1/2M: once per two months, 1/3M once per three months 11 Carbon, Hydrogen, Nitrogen and Sulfur are sampled together using Elemental Analyzer method 12 Sum of Total Suspended Solids and Total Dissolved Solids