Old-Fashioned Deposit Runs - Federal Reserve System · Old-Fashioned Deposit Runs Jonathan D ......
42
Finance and Economics Discussion Series Divisions of Research & Statistics and Monetary Affairs Federal Reserve Board, Washington, D.C. Old-Fashioned Deposit Runs Jonathan D. Rose 2015-111 Please cite this paper as: Rose, Jonathan D. (2015). “Old-Fashioned Deposit Runs,” Finance and Economics Dis- cussion Series 2015-111. Washington: Board of Governors of the Federal Reserve System, http://dx.doi.org/10.17016/FEDS.2015.111. NOTE: Staff working papers in the Finance and Economics Discussion Series (FEDS) are preliminary materials circulated to stimulate discussion and critical comment. The analysis and conclusions set forth are those of the authors and do not indicate concurrence by other members of the research staff or the Board of Governors. References in publications to the Finance and Economics Discussion Series (other than acknowledgement) should be cleared with the author(s) to protect the tentative character of these papers.
Transcript of Old-Fashioned Deposit Runs - Federal Reserve System · Old-Fashioned Deposit Runs Jonathan D ......
Finance and Economics Discussion SeriesDivisions of Research & Statistics and Monetary Affairs
Federal Reserve Board, Washington, D.C.
Old-Fashioned Deposit Runs
Jonathan D. Rose
2015-111
Please cite this paper as:Rose, Jonathan D. (2015). “Old-Fashioned Deposit Runs,” Finance and Economics Dis-cussion Series 2015-111. Washington: Board of Governors of the Federal Reserve System,http://dx.doi.org/10.17016/FEDS.2015.111.
NOTE: Staff working papers in the Finance and Economics Discussion Series (FEDS) are preliminarymaterials circulated to stimulate discussion and critical comment. The analysis and conclusions set forthare those of the authors and do not indicate concurrence by other members of the research staff or theBoard of Governors. References in publications to the Finance and Economics Discussion Series (other thanacknowledgement) should be cleared with the author(s) to protect the tentative character of these papers.

1
Old-Fashioned Deposit Runs
Jonathan D. Rose†
November 18, 2015
Abstract
This paper characterizes the deposit runs that occurred in the commercial banking system during 2008 and compares them with deposit runs during the 1930s. The importance of withdrawals by large depositors is a strong source of continuity across the two eras and reflects the longstanding concentration of deposit holdings. Runs occurred during 2008 despite the presence of national deposit insurance, which does not fully cover large accounts and therefore has limited impact on the incentives of those account holders. Large depositors continue to represent a source of both market discipline and financial instability.
† Federal Reserve Board, [email protected]. The views presented in this paper are solely those of the author and do not necessarily represent those of the Federal Reserve Board or its staff. I am grateful to Mark Carlson, Matthew Jaremski, and Kris Mitchener for their comments, as well as numerous seminar participants at the Federal Reserve Board, University of Michigan, and the 50th Bank Structure Conference.

2
1. Introduction
Deposit runs at commercial banks have occurred at various points in American financial
history, but economists commonly have perceived them as obsolete due to the presence of
deposit insurance.1 Nevertheless, commercial bank runs have re-emerged.2 At a variety of
institutions, depositors withdrew significant amounts of money in just days or weeks during the
third quarter of 2008. Most notably, Wachovia and Washington Mutual, the fourth and sixth
largest depository institutions in the country at the time, experienced heavy deposit outflows and
other important liquidity pressures that led to the rapid sale of each to other institutions.
Depositors at Washington Mutual withdrew 9 percent of its deposits in just 9 days, and
supervisors envisioned stress scenarios in which certain institutions could lose 1.5-2.0 percent of
deposits a day. Confidential daily deposit data from individual institutions indicate that large
outflows of deposits characterized about 10 to 15 percent of banks and thrifts at the most
widespread points during late 2008, in the days following the failures of IndyMac on July 11,
Lehman Brothers on September 15, and Washington Mutual on September 26.3
The 2008 runs were comprised to a great extent by outflows from large depositors, such
as corporations with payroll or other transaction accounts. This role for large depositors is
actually a fairly old-fashioned feature. Though small depositors famously lined up outside banks
during the early 1930s, Krost (1938) demonstrates that outflows in that era were also to a great
extent from large accounts, even disproportionately because large depositors were more capable
of writing checks and storing money in non-deposit forms. The incentives of large depositors
1 For example, Mankiw (2011) states “Today, bank runs are not a major problem for the U.S. banking system or the Fed. The federal government now guarantees the safety of deposits at most banks, primarily through the Federal Deposit Insurance Corporation (FDIC)” (p. 636). Bernanke (2010) states that “…commercial banks and thrift institutions had been exposed to runs prior to the creation of deposit insurance.” Solow (2013) states “Obviously, given these protections, there will be no runs on banks.” 2 Whether deposit insurance has ended “banking panics” is another matter that depends on the breadth of the definition of a banking panic. One much cited definition comes from Calomoris and Gorton (1991), who suggest that a banking panic “occurs when bank debt holders at all or many banks in the banking system suddenly demand that banks convert their debt claims (at par) to such an extent that banks suspend the convertibility of their debt into cash, or in the case of the United States, act collectively to avoid suspension of convertibility by issuing clearing-house loan certificates.” There is a case to be made that such moves were made during 2008 by depositors at “many” banks, though certainly not all. In a related matter, monetarist theories hold that there is a key distinction between bank runs that lead to a general conversion of deposits into currency, versus those that do not. However, this paper implicitly takes as given nonmonetarist theories of financial crises and credit crunches that would consider the type of bank runs recorded in 2008 as costly, even if they did not lead to a general conversion of deposits into currency. 3 This statement, as will be detailed below in section 2.3, is based on the behavior of savings and transaction deposits, with a large outflow somewhat arbitrarily defined as a 5 percent reduction over 20 business days, sustained for 4 consecutive days.

3
were largely the same in 2008, despite the existence of national deposit insurance, since many
large accounts are exceedingly far above deposit insurance limits, rendering insurance essentially
a non factor. For example, at Washington Mutual, accounts in excess of $500 million each were
reportedly responsible for one-quarter of the deposit outflows, at a time when the deposit
insurance limit was $100 thousand. The importance of withdrawals by large depositors goes
hand in hand with concentration of deposits in small numbers of accounts, which has been a
longstanding feature of the US banking system. In 1933, the largest 0.15 percent of accounts held
about 45 percent of deposits. In mid-2008, the closest comparable data show that the largest 1.5
percent of accounts at commercial banks held 53 percent of deposits, and only about one-quarter
of the deposits in those accounts were covered by insurance.4
The continued susceptibility of large uninsured accounts to outflows is a limiting factor
in the ability of national deposit insurance to explain the long “quiet period” in US banking after
the 1930s. In fact, public officials who designed the national insurance program in the 1930s
anticipated that deposit movements by large depositors would continue. Legislators left large
depositors uninsured in order to maintain some market discipline on bank managers, and also
viewed large depositors as better informed and therefore not in need of the insurance protection
proposed for smaller depositors. However, market discipline has tension with financial stability,
as large depositors can and do create deposit runs.
My analysis comes with a few caveats. First, I focus on deposit runs as an important part
of liquidity pressure in 2008, but other liquidity problems certainly existed as well, at banks and
at other institutions. For example, Gorton and Metrick (2012) describe the run on the repo
market and Covitz, Liang, and Suarez (2013) describe the run in the asset-backed commercial
paper market. Second, my focus on the relatively low importance of deposit insurance for large
depositors is not a denial that insurance likely does stabilize small deposits. It is possible that
uninsured small depositors could be the source of serious deposit outflows if the FDIC did not
exist; however, the concentration of deposits compels a particular focus on large depositors.
Third, large depositors are more common at larger banks, and therefore the analysis in this paper
is somewhat more pertinent for thinking about those banks.
Methodologically, establishing these basic facts about deposit runs requires detailed
institution-level work using a variety of unconventional data sources. This resembles the work
4 This is a statement about domestic deposits only. This breakdown is not available for foreign deposits.
4
of Shin (2009), who reviews the September 2007 run by short-term creditors at a single
institution, the British bank Northern Rock. Research that uses data at a quarterly frequency,
such as Acharaya and Mora (2012), tend to capture lower frequency deposit outflows, and cannot
record outflows at banks that fail before quarter-end.
This paper relates to ideas that have been discussed in a few different economics
literatures. Among the research on the Great Depression, Rockoff (2003) and Fuller (2012) both
stress the importance of large interregional deposit movements during the banking crisis of 1933,
and together they provide a wide array of anecdotal evidence pointing toward large corporate and
interbank deposits. In contrast, research that has examined the behavior of individual depositors
during runs has tended to focus on small depositors (See Ó Gráda and White (2003), Iyer and
Puri (2012), and Brown, Guin, and Morkoetter (2013)). There is also a longstanding literature
on market discipline by depositors. Berger and Turk-Ariss (2012) provide an overview of that
literature. Some of those papers investigate questions such as whether uninsured or possibly
insured depositors discipline banks, and in what circumstances. Finally, this paper also relates to
another literature regarding the history of national deposit insurance in the US. Several papers
touch on how small and large depositors were viewed by legislators and interest groups during
the formative period for national deposit insurance in the early and mid-1930s, including
Golembe (1960), Flood (1991), Calomiris and White (1994), White (1998), and Bradley (2000).
Many of the ideas expressed in this paper have antecedents in those works.
2. Deposit outflows during 2008
2.1 Outflows at the largest institutions
Table 1 summarizes the significant deposit outflows that took place during 2008 at five
large depository institutions: Wachovia, Washington Mutual, National City, Sovereign, and
IndyMac. The outflows at Wachovia and Washington Mutual were particularly important events
insofar as those institutions were the fourth and sixth largest depository institutions in the
country at the time, respectively.
Washington Mutual experienced two key periods of deposit outflows. The first followed
the seizure of IndyMac on July 11, 2008. The second began on September 8, 2008, when
Washington Mutual’s regulator publicly issued an enforcement action. It then accelerated on
September 15, 2008 after the failure of Lehman Brothers. Both of these outflows were quite

5
significant, with losses equaling about 5 and 10 percent of deposits, respectively. If converted to
a monthly rate (for purposes of comparison with other outflows described below), the latter
outflow would amount to a 19 percent loss over 31 days. Figure 1 charts daily data of consumer
and small business deposits at Washington Mutual from July 14 to September 26, when it was
seized by the FDIC. (These daily data are not available before July 14.) According to these data,
in just 9 days from September 15 to September 24, Washington Mutual lost 9 percent of its
consumer and small business deposits, with total losses of these deposits from September 8 to
September 24 reaching about 11 percent.
Wachovia’s outflows also fell into two key periods, with the first occurring after negative
publicity from a quarterly loss announced on April 14, 2008, and the second commencing with
Lehman’s failure on September 15, 2008 and then accelerating after Washington Mutual’s
failure on September 26. The second outflow was ultimately halted by news of an agreement by
Wells Fargo to purchase the bank, on October 3. These runs can be seen in Figure 2, which
reproduces four charts showing Wachovia’s daily level of core deposits from January to
September, 2008, as well as three subsets of core deposits, including commercial money market
accounts, consumer time deposits, and savings deposits.5 Overall, the first outflow in deposits
after April 14 totaled roughly $15 billion over a period of two weeks, a 3.6 percent outflow, or
7.8 percent on a monthly basis. The second outflow totaled $18.3 billion over a period of 19
days, a 4.4 percent outflow or 9.0 percent on a monthly basis. Compositionally, the drops were
most steep in savings and money market deposits. In contrast, time deposits trended down
relatively slowly and then increased when a new CD campaign raised additional funds after June
2008, partially offsetting outflows in other types of deposits.
These deposit runs had serious consequences. The runs contributed to Wachovia’s sale to
Wells Fargo and Washington Mutual’s sale to JP Morgan Chase after its seizure by the FDIC.
Liquidity pressure appears to have been the proximate factor in both sales. In the case of
Washington Mutual, the thrift was still well capitalized at the time it was placed in receivership
by the FDIC, and its regulator noted that funding deterioration rather than asset deterioration was
the immediate cause of the seizure, stating “WaMu was unable to raise capital to keep pace with
5 Core deposits as a concept typically include transaction, savings, and small time deposits but exclude brokered deposits.

6
depositor withdrawals, prompting OTS to close the institution on September 25, 2008.”6 Of
course, other liquidity factors were certainly also at play beside deposit outflows, such as new
limitations on Washington Mutual’s ability to borrow from the Federal Home Loan Bank of San
Francisco. Wachovia experienced a more multi-faceted liquidity crisis than Washington Mutual,
certainly involving deposit outflows but also including pressures on commercial paper,
repurchase agreements, demand notes, and other sources of funding. Even before the September
deposit outflows, Wachovia had been under a memorandum of understanding with its
supervisors since August 19 to develop a liquidity plan in 30 days. Nevertheless, deposits
became a key issue in September. A memo to the FDIC Board on September 29, 2008, preparing
for the possible failure of Wachovia, assumed a 1.5 percent daily deposit run-off in an extreme
stress scenario could be part of a liquidity crisis (FDIC, 2008). A post mortem case study by
Wachovia’s supervisors at the Federal Reserve, dated November 12, 2008, focused solely on
liquidity issues and portrayed deposit outflows as one important factor. One of the “lessons
learned” in that case study was that an institution should “understand [its] funding risk,
particularly deposits,” and that “It’s not clear [Wachovia] was prepared for, understood, or tried
to prevent the exodus of commercial deposits that accelerated through September” (Federal
Reserve Board, 2008).
Table 1 also describes the outflows that occurred at three other large depository
institutions: National City, Sovereign, and IndyMac. National City was roughly the tenth largest
depository institution in the country at the time, and Sovereign was among the twenty largest,
while IndyMac was a bit smaller.
At IndyMac, deposit outflows in the two weeks before its failure totaled about 8.4 percent
of its total deposit base as of March 31, 2008, an 18 percent outflow on a monthly basis. Reports
by supervisors and news media generally attributed the run (in a proximate sense) to a public
statement in late June by a US senator, Charles Schumer, who outlined concerns about the safety
and soundness of the institution. Of course, Schumer’s letter was an endogenous event in itself.
Indeed, on June 20, 2008 before the run, IndyMac’s supervisors notified it confidentially that it
had been given the worst possible supervisory “CAMELS” rating. Supervisors also sent a public
6 See page 3 of Offices of Inspector General (2010). This line of reasoning was nearly identical in an internal memorandum by the Office of Thrift Supervision (2008). That memo, dated to the day of the seizure on September 25, stated “With unsufficient [sic] liquidity to meet its obligations, WMB was in an unsafe and unsound condition to transact business. OTS placed WMB into receivership on September 25, 2008.”

7
“troubled bank letter” on July 1st. Nevertheless, regulators had not yet issued a prompt corrective
action order to IndyMac before its failure (or to Washington Mutual), which is conventionally
the last step before seizure by the FDIC. The lack of that action strongly suggests that the deposit
outflows forced the FDIC to speed up the seizure.7
IndyMac’s failure was further notable as it appears to have been responsible for
contagion to other depository institutions, including Washington Mutual, National City, and
Sovereign, listed in Table 1, and also including some of the institutions listed in Table 2 and
discussed briefly below.8 This was one of a few key episodes of apparent contagion, as
Washington Mutual’s failure also appears to have caused outflows at other institutions. The
failure of Lehman Brothers, though not a commercial bank, caused a general financial turmoil
that is well known, and was a key event prior to several major deposit outflows.
At Sovereign Bank, aside from a moderate outflow after the failure of IndyMac, officials
noted a 6.2 percent deposit outflow over the month of September, with a bit more than one-third
of those outflows occurring in just two days, September 29 and September 30, after the failure of
Washington Mutual.9 At National City, core deposits fell 5.1 percent in just two days after
March 15, 2008 after the collapse of Bear Stearns, an early run that its directors called
“meaningful” in an SEC filing. As shown in Table 1, National City had two more episodes of
about the same size, after the failures of IndyMac and Lehman, though over longer time periods.
National City officials described these outflows as “significant” but nevertheless insisted their
deposits were stable. Despite the reassurances from National City officials and from Sovereign
officials, both soon merged into other institutions. National City was purchased by PNC on
October 24, 2008 and Sovereign by Banco Santander on October 13, 2008.
Not listed in Table 1 is Citigroup, which reportedly had an incipient deposit run that
never turned reached the debilitating magnitude recorded at the institutions just discussed. A
report by SIGTARP (the oversight body governing the Troubled Asset Relief Program, TARP)
described much concern by federal regulators that Citigroup’s deposits were at imminent risk of
7 Department of Treasury, Office of Inspector General (2009) lists these supervisory actions in a timeline of events. 8 Sovereign Bank indicated that during the third quarter of 2008 the “majority of the decline in deposits occurred early in the quarter driven by intense deposit competition as well as general safety and soundness concerns following the failure of IndyMac.” Source: SEC filing: 16 December 2008 F-4/A filing, p. 40 (http://1.usa.gov/MeGLZ8). National City officials stated “we did see some net deposit outflows in the days following the publicity around the IndyMac failures” and third-party reports noted the outflows as well, such as Moody’s (2008). 9 These outflows were mentioned in the SEC filing, ibid.

8
outflows during November 2008, and described “significant” withdrawals on Friday, November
21, 2008. Similar descriptions can be found in Bair (2012), et al. During that weekend, known as
“Citi Weekend” to some, Citigroup was declared a systemic risk and the institution agreed to a
capital infusion and asset guarantee deal with Treasury, apparently ending the deposit run. I can
find no public information that quantifies the actual run that occurred the Friday before Citi
Weekend, although the expectations for the following week were explicitly stated and dire. A
memo to the FDIC Board written during Citi Weekend stated that Citibank “will be unable to
pay obligations or meet expected deposit outflows next week” as a further “7.2 percent deposit
run off will result in no cash surplus.” The memo also stated a stress scenario assumed a runoff
of 2 percent of deposits per day, even steeper than the 1.5 percent stress scenario assumed for
Wachovia (FDIC, 2008b).
2.2 Outflows at smaller institutions
Table 2 lists a number of smaller institutions with deposit outflows during 2008 and
2009. Of particular interest is the contagion resulting from the failure of Indymac, located in
Pasadena, California, to three other institutions also located in the greater Los Angeles area.
These institutions were Downey S&L (located in Newport Beach), Vineyard Bank (located in
Rancho Cucamonga), and 1st Centennial bank (located in Redlands). The largest of these
institutions was Downey S&L, which lost 5 percent of its deposits in the period after IndyMac’s
failure. Likewise, Vineyard’s management described “significant deposit withdrawals” and
blamed them on both IndyMac’s failure as well as negative publicity from a proxy contest at
Vineyard. 1st Centennial management reported that “depositors withdrew over $130 million,” or
about 25 percent of its $435 million in deposits at the end of June, 2008. This southern
California effect also apparently extended to Washington Mutual. With corporate headquarters in
Seattle, Washington Mutual had a general west coast presence, and a supervisory document
noted that its deposit losses post-Indy Mac’s failure “were heavily concentrated in Southern
California which was hardest hit” (United States Senate, 2011, footnote exhibits p. 296).
The other institutions listed in Table 2 were all generally of the size that would be termed
“community banks.” Aside from the runs clustered around IndyMac, the runs are spaced out
through 2008 and 2009, and were generally due to negative publicity specific to those
institutions.

9
Importantly, for all of the deposit runs listed in Table 1 and Table 2, the primary sources
authoritatively state that the outflows were due primarily to depositors pulling their funds rather
than due to banks permitting a run off of deposits, or due to restrictions on brokered deposits
imposed by supervisors on faltering institutions. Restrictions on brokered deposits led to
important deposit declines in many banks, but I do not include those banks in this paper. A
separate discussion of these restrictions would be interesting, but for my purposes here they
represent a very different type of outflow than active deposit withdrawals.
2.3 Aggregate statistics on deposit outflows
Up to this point, I have focused on a limited number of deposit outflows whose existence
I have directly confirmed from publicly available sources. This conservative approach likely
understates the number of institutions with outflows. For example, institutions whose outflows
led to merger (rather than seizure by the FDIC) do not have the information-rich post-failure
reviews written by their supervisors that disclose facts such as deposit outflows that otherwise
tend to remain confidential. In addition, smaller institutions are less likely to be covered in the
other primary sources underlying Tables 1 and 2, as developments at such institutions are
generally less notable.
This section gives a more general picture of the number of institutions with large deposit
declines, with the use of daily institution level data. Depository institutions are required by
federal law to submit these data to the Federal Reserve System, on a confidential basis, if their
deposit liabilities exceed a certain dollar threshold (indexed annually). Here, I use the reports of
the roughly 2,000 commercial banks and thrifts that submitted data during 2008. Each of the
2,000 reporters gives a simple breakdown of deposits into savings, transaction, and time
deposits. There is no information on insurance coverage or holdings by different types of
depositors such as businesses or households.
I use the data to calculate, over time, the aggregate share of institutions experiencing
large deposit outflows. I define such an outflow as a 5 percent decrease in deposits over a period
of 20 business days (usually equivalent to 4 weeks), and also require that this be true for 4
consecutive days. Both the time frame of 20 days and the 4 day sustainment are motivated by the
fact that daily deposit data are generally volatile, as it is not unusual for an institution to record a

10
large change that is quickly reversed. The 5 percent threshold is somewhat arbitrary, but different
percent thresholds generally do not change the time series pattern described below.
Using this definition, Figure 3 displays, over the course of a year, the percent of
institutions with large outflows of savings and transaction deposits (therefore excluding time
deposits).10 The solid black line shows this percent during 2008, while the dashed brown line
displays the average percent for the five years from 2003 to 2007 for comparison. The top panel
covers the largest 100 institutions (defined by total deposits), while the bottom panel covers all
other institutions in the sample. Savings and transaction deposits are the focus here because they
are the categories of deposits most susceptible to short-run outflows, as time deposits are by their
nature committed for longer periods. Time deposits (e.g. certificates of deposits) will be
examined separately, below.
Figure 3 indicates that unusual numbers of institutions experienced large outflows of
savings and transaction deposits after the failure of Lehman Brothers in September, 2008, and
also after the failure of IndyMac in July 2008. This is particularly true among the largest 100
institutions.11 The magnitudes are not large, however, as at no time on these charts did more than
15 percent of either institution group experience such outflows. Nevertheless, since the loss of 5
percent of deposits is a major outflow, even 10-15 percent of institutions recording such outflows
is unusual and a cause for serious concern, especially since the largest institutions were slightly
more likely to experience outflows.
Turning to time deposits, Figure 4 indicates that, after the collapse of Lehman in mid-
September 2008, and through most of October, outsized numbers of institutions recorded large
inflows of time deposits. More than one-third of the largest 100 institutions recorded large
inflows of time deposits and nearly one-fourth of smaller institutions did as well. As a result,
some institutions with outflows of savings and transaction deposits may have been able to offset
those outflows with new time deposits. Taking the case of Wachovia as an example, Figure 2
indeed shows that consumer time deposits increased briskly starting in mid-summer 2008, but
10 It is customary with these data to combine savings and transaction deposits. Since some institutions sweep deposits between these two categories periodically, examining each category individually would erroneously identify deposit outflows that are netted out when combined. 11 There are two other periods in which elevated numbers of institutions experienced outflows of these deposits during 2008: late January into early February, and late April into early May. However, the figure suggests these are seasonal patterns, perhaps due to expenditures related to Christmas and taxes.

11
this was clearly not enough to fully offset declines in other deposits, and their effort to attract
new deposits appears to have stopped by the fall.
Several factors likely contributed to this inflow of time deposits. As noted by Acharaya
and Mora (2012), some troubled banks and thrifts responded to deposit outflows by raising
interest rates, particularly on time deposits, and others followed suit out of competitive pressure.
These actions were well known and commented on at the time, and represented a scramble for
liquidity that interrupted the general decline in deposit interest rates that had begun in late 2007.
In addition, some of the money fleeing money market mutual funds likely ended up in these
depository institutions. Government actions changed the playing field as well, though. The
Emergency Economic Stabilization Act (EESA), signed on October 3, 2008, established an
increase in the FDIC insurance limit from $100 thousand to $250 thousand.12 The EESA also
created the authority to recapitalize banks. Both of these acts likely shored up the confidence of
depositors, though the increased insurance limit likely had little impact on large depositors. Of
greater importance for large depositors was the availability of unlimited insurance on certain
types of transaction accounts beginning in late October at institutions participating in the FDIC
program, discussed below.
3. The importance of uninsured deposits
At this point, it is clear that several major depository institutions experienced serious
deposit outflows during 2008 and 2009, in many cases leading to the failure or merger of the
institutions. These outflows occurred despite the presence of deposit insurance.
While deposit insurance gives holders of insured deposits little incentive to withdraw
those deposits from a faltering institution, it does not cover all deposits. The FDIC system of
deposit insurance, established in 1934, leaves some deposits uninsured. As of year-end 2007, at
all FDIC insured institutions, 51 percent of deposits at were covered by FDIC insurance.
Excluding foreign deposits, which are not covered by insurance, coverage of domestic deposits
was moderately higher, at 62 percent (see Figure 5). This left a significant amount of deposits
held by those who had an incentive to withdraw from a faltering institution during 2008.13
12 The insurance limit had been increased to $250,000 for retirement accounts a few years earlier. However, retirement account deposits constitute only about 4 percent of commercial bank deposits. 13 These numbers are taken from the FDIC’s “Quarterly Banking Profiles” and cover all insured depository institutions, including both commercial banks and thrifts.
12
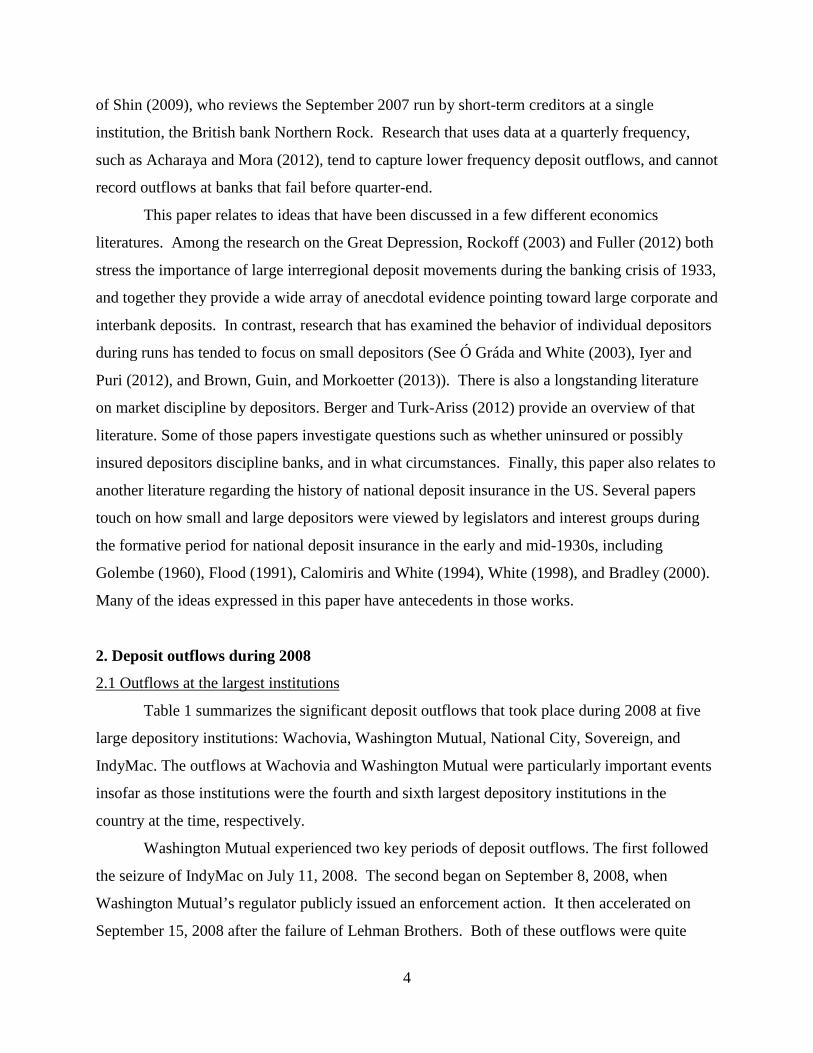
Uninsured deposits accounted for the bulk of withdrawals during the runs described in
the previous section, according to reports by banks and their supervisors. For example, in the
case of the July run at Washington Mutual (following IndyMac’s failure), the bank lost 13
percent of its uninsured deposits, while losing only 2 percent of its insured deposits. Computed
another way, about 70 percent of the outflow came from uninsured deposits. In fact, 25 percent
of the outflow reportedly came just from accounts with more than $500 million each, which are
enormous by the standards of deposit insurance and far above the $8,700 average account size at
Washington Mutual. Large withdrawals from just a handful of such accounts can lead to large
aggregate losses even if all other accounts do not change.14
Deposits are heavily concentrated in a small number of accounts. Table 3 details the
insurance coverage of deposits at the large depository institutions with outflows discussed
earlier. Aat Washington Mutual, 98.8 percent of accounts were fully insured at the end of 2007,
but the remaining 1.2 percent of accounts held 39 percent of all deposits. These 1.2 percent of
accounts had some partially insurance on their balances up to $100 thousand, so that overall 26
percent of Washington Mutual’s deposits were uninsured. Statistics at Wachovia were similar,
as only 2.0 percent of its accounts were not fully insured but those accounts held 47 percent of
deposits. Figures in these ranges were typical of large institutions at the time.
Uninsured deposits are held by a variety of depositors. Corporations are one especially
important group, as they maintain large accounts for payroll and other transactional purposes. At
Wachovia, for example, descriptions of that institution’s run during September 2008 focus on
withdrawals by large corporations. The institution’s supervisors noted that about half of its
uninsured deposits were “comprised of corporate, non-time deposits that are considered highly
sensitive,” and estimated that about 16 percent of these deposits would be withdrawn. These
predictions proved accurate, as the American Banker reported that Wachovia’s “corporate
customers began to pull uninsured deposits” the day after the failure of WaMu.15
14 One source, (Office of Thrift Supervision 2008, p. 13) estimates that uninsured accounts were responsible for 69 percent of the runoff. Another source (United States Senate Permanent Committee on Investigations, Footnote Exhibit Franklin_Benjamin-00035756_033, entry for 8/8/08) gives a number of 71 percent and also reveals the information about $500 million accounts. The aggregate insurance figures and average account size are reported in call reports from 2007Q4. At that date, Washington Mutual had $186.7 billion in total deposits across its two federal S&L charters, with $138.3 billion insured (74 percent). At the retail level, withdrawals were reportedly typically in $50,000 increments, as described in the same Senate document, in the entry for 9/11/2008. 15 See Federal Deposit Insurance Corporation (2008).
13
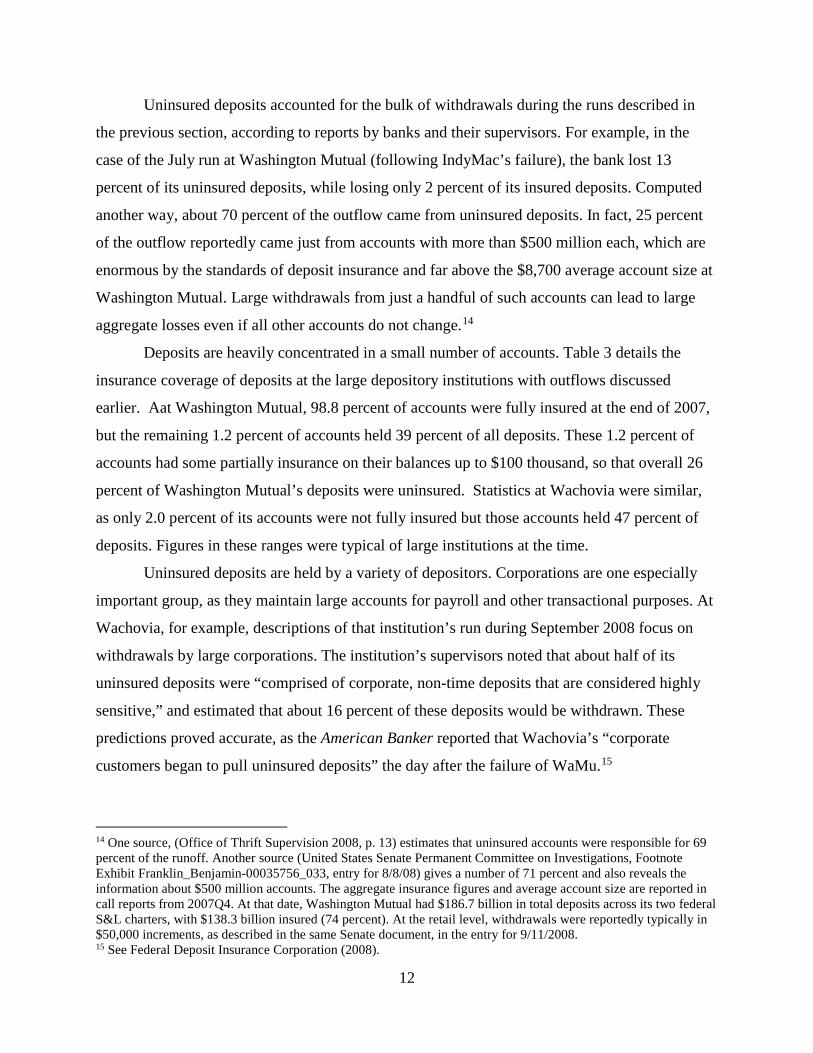
Washington Mutual’s deposits appear to have included significant funds of small
businesses. A post-failure report by supervisors stated that Washington Mutual lost
“approximately $9.1 billion in retail and small business deposits” after the failure of IndyMac,
with the term retail referring to households. As of September 11, 2008, the FDIC’s most severe
stress scenario for Washington Mutual anticipated an additional 10 percent runoff in “retail”
deposits and $5 billion in commercial deposits.16
Business deposit outflows underlay the deposit runs at other institutions as well. National
City reported that deposits declined “particularly in business transaction accounts and other
accounts in excess of the FDIC insurance limit.”17 The Boston Globe also reported withdrawals
by businesses at Sovereign, confirmed by an SEC filing.18 The short-lived outflows at Citigroup
in November, 2008, mentioned above, were also described as “corporate withdrawals (i.e. a
run)” (SIGTARP 2011). Additionally, Citigroup is unusual as it has a larger foreign deposit base
than most US-based banks, totaling roughly $500 billion at the time, all of which are uninsured.
Bair (2012) describes foreign depositors as having an important role in the incipient run at
Citigroup (pp. 121-125).
In October 2008 the FDIC initiated a new program, the Transaction Account Guarantee
(TAG) Program, a part of the Temporary Liquidity Guarantee Program. Under TAG,
participating depository institutions could receive unlimited insurance for so-called noninterest-
bearing transaction deposits. The FDIC described these accounts as “mainly payment-processing
accounts, such as payroll accounts used by businesses.”19 An FDIC official stated that “We're
trying to address the problems that we've seen with, you know, these noninterest-bearing
transaction accounts, these corporate accounts leaving banks.”20 Another FDIC official, likely
16 See Office of Thrift Supervision (2008). 17 Source: 11/10/2008 S-4 filing with the SEC (http://1.usa.gov/LxhiLZ) p. 36. 18 Sources: “Cautionary tale in Sovereign’s Sudden Decline.” Boston Globe, 15 October 2008, p. A1; SEC filing: 16 December 2008 F-4/A filing, p. 40 (http://1.usa.gov/MeGLZ8). At Sovereign Bank, a reporter at the Boston Globe also discovered that the state of Massachusetts had withdrawn $300 million of its total $575 million deposits at Sovereign at 3pm on September 29, 2008, leaving $275 million that were protected by collateralization. 19 See http://www.fdic.gov/news/news/press/2008/pr08100a.html. 20 See http://www.fdic.gov/regulations/resources/TLGP/101608.html. In a separate exchange, FDIC officials were specifically asked whether these types of accounts underlay the runs at Wachovia and Washington Mutual, but did not give a specific answer to the question:
QUESTION: So I guess the question that I wanted to ask is, can you speak to the extent to which the deposits that were pulled out of Washington Mutual, out of Wachovia were in this category of deposits? To what extent does this address the runs that we have actually seen?
14
referring to Washington Mutual, stated that “the guarantee for these transaction accounts, we
think will help with some of the liquidity pressures that we've seen on what in many cases are
healthy and certainly viable institutions. The withdrawal of these accounts have put severe and,
in some cases, liquidity pressures on otherwise healthy institutions and forced some resolution
process there.”21 This program adds to the evidence that large corporate deposit accounts were
important sources of deposit outflows in late 2008.22
In checking the accuracy of my synthesis of these narrative accounts, one useful test
could be whether there are sources that describe these runs without noting the importance of
uninsured depositors, or large corporate depositors. In fact, it is not unusual to find descriptions
of deposit runs that focus on withdrawals by insured depositors with small holdings. For
example, in describing the episodes at Washington Mutual, Grind (2012) paints a picture of
Washington Mutual officials as focused on small depositors. Grind reports that Washington
Mutual executives appealed to federal officials more than once for an increase in the deposit
insurance limit from $100,000 to $200,000, believing that such a move “would calm down
customers who were pulling out their money” by “sending a message that the government did
not tolerate bank runs. It would be symbolic more than anything else” (p. 276). The thought
process here is a bit murky: it is not clear what symbolism large depositors would take solace in,
particularly those with accounts in the range of $500 million that supervisors later cited as
prominent sources of withdrawals.23 As noted above, since insured deposits accounted for about
30 percent of the deposit withdrawals at Washington Mutual, officials certainly had some reason
MODERATOR MURTON: That's a good question. I think the guarantee on the non interest bearing transaction accounts is designed to address some of the liquidity problems that we have seen at certain institutions that are probably perhaps -- well, are viable and perhaps even healthy franchises that can be subject to some of these liquidity pressures. (See http://www.fdic.gov/regulations/resources/TLGP/101408_am.html)
21 See http://www.fdic.gov/regulations/resources/TLGP/101408_pm.html 22 As a side note, it is interesting to observe that the creation of the Transaction Account Guarantee Program appears to have occurred under a different intellectual framework than the creation of deposit insurance in the 1930s. FDIC officials expressed reluctance in 2008 to insure savings or investment accounts, which carried nonzero rates of return, for fear of upsetting the “competitive equity” of those accounts relative to accounts at money market mutual funds. This basis for defining the extent of insurance coverage has no real precedent (of which I’m aware) in the discussion that took place during the 1930s or in the following decades. 23 Later, Grind describes WaMu officials as still concerned by the action of small insured depositors. “At least half of the customers who pulled out their money were covered up to $100,000; this defied the Break the Bank scenario that WaMu's treasury department had put together over the summer. ‘We thought, by then, that people knew about deposit insurance,’ said one of Mueller's coworkers. ‘It turns out they still didn't.’ Or they did know but didn't care.” This quote is not necessarily inconsistent with the fact stated above that 70 percent of the deposits lost were uninsured, since the larger depositors likely withdrew larger amounts.

15
for concern, but it seems unlikely that a slightly higher insurance limit would have had strong
effects.
Fundamentally, simple arithmetic compels a focus on large depositors. Of course, if
small insured depositors were responsible for a larger portion of withdrawals than indicated by
the sources cited above, then the stabilizing role of deposit insurance is even more limited than
believed, and there are some serious questions regarding what motivated insured depositors to
withdraw.24 If large depositors were responsible for the majority of withdrawals, then the
contribution of deposit insurance to financial stability is limited.
4. Are 2008 deposit runs different from “old-fashioned” bank runs?
In describing modern deposit runs, reporters and academics are understandably drawn to
comparisons with historical runs, such as those in the early 1930s. The descriptions of historical
runs often invoke the image of small retail depositors massing together to demand in-person
withdrawals. For example, in a discussion of the September, 2007 deposit run at Northern Rock,
a British bank, Shin (2009) begins by drawing a contrast with an old-fashioned bank run:
In September 2007, television viewers and newspaper readers around the world saw pictures of what looked like an old-fashioned bank run—that is, depositors waiting in line outside the branch offices of a United Kingdom bank called Northern Rock to withdraw their money... The Northern Rock depositor run, although dramatic on television, was an event in the aftermath of the liquidity crisis at Northern Rock, rather than the event that triggered its liquidity crisis. In this sense, the Northern Rock episode was not an old-fashioned bank run of the sort we see in movies like It’s a Wonderful Life or Mary Poppins.25
24 In this regard, it is informative to refer to Davenport and McDill (2006), who use administrative FDIC data to study the egress of deposits at a failed bank with about $2 billion in assets as of 1998, a small or moderate size. Davenport and McDill find that uninsured deposits decreased by about 50 percent, but still find nontrivial 25 percent outflows in insured deposits. The generalizability of this study is limited, however. The bank was not representative of the banking industry at large or of large banks in particular, as it had only small amounts of uninsured deposits. In addition, the results are not strictly comparable to the 2008 runs as the outflows measured by Davenport and McDill took place over a period of eight months. 25 References to both It’s a Wonderful Life and Mary Poppins are ubiquitous by the news media and in academic studies in discussions of deposit runs. Two prominent examples include Carmen Reinhardt and Ken Rogoff’s This Time is Different (2009, p. xl), and Gregory Mankiw’s Principals of Macroeconomics (2011, p. 636). Neither movie is of much value, in my opinion, in describing the nature of an old-fashioned bank run. The bank run in Mary Poppins is good comedy but is clearly a farce and does not capture any meaningful economic history. It’s a Wonderful Life was a story about a building and loan association (the Bailey Bros. Building and Loan), rather than a commercial bank. This is significant insofar as Bill Bailey (portrayed by Jimmy Stewart) was able to stem the withdrawal requests in that movie by negotiating with investors in a way that would likely not have been available to commercial banks. This is an important plot point, too as the Bailey Bros. B&L was never forced to close due to withdrawal demands. In general, B&Ls (the predecessors of modern savings and loan associations) did not offer demand deposits at that time and were also generally not required to pay withdrawals of their share investments on
16
This comparison with old-fashioned runs bears directly on the question of whether national
deposit insurance has changed the nature of banking stability since 1934. In this section, I
present evidence from a number of sources that indicate a strong degree of continuity between
modern runs and old-fashioned runs, based on two facts. First, commercial bank deposits have
long been concentrated in small numbers of very large accounts. Second, deposit runs at these
banks during the 1930-1933 period were substantially the work of large depositors. Therefore,
modern withdrawals by large depositors described in the previous section have much in common
with old-fashioned runs. This continuity can be overlooked if too much attention is given to
smaller depositors when considering historical episodes.
4.1 Concentration of deposits over the 20th century
This section presents data that measure deposit concentration at different points over the
twentieth century. They all indicate that a long-standing and stable feature of the commercial
banking system is a high concentration of deposit holdings by small fractions of accounts.
The extent of deposit insurance coverage at the beginning of 2008, with about 62 percent
of domestic deposits insured, was not unusual compared to the extent of coverage since 1934
(see Figure 5). Initially the system covered only around 40-50 percent of deposits. This amount
has changed over the years, as the nominal insurance coverage has been periodically increased
by Congress after erosion in real terms by inflation. As of the latest data from December 2012,
coverage was near the all-time high established during the early 1990s, due to an increase in
coverage to $250,000 per account (from $100,000 in place until October, 2008) and unlimited
insurance of noninterest-bearing transaction accounts, which expired after 2012.
demand. In the movie, Bill Bailey tells his investors they need to wait sixty days. The investors then threaten to go to the bank and sell their shares to Potter, the banker, at 50 cents on the dollar, leading Bailey to negotiate with them over how much they “really need.” Bailey was negotiating from a point of legal strength and could have refused withdrawals at any time if cash reserves were insufficient without being forced into receivership. B&L investments were largely equity shares, many of which required monthly payments, in an arrangement of regulated thrift for small savers. B&Ls in some states offered savings deposits or instruments similar to certificates of deposits by the 1920s, but those were still not transaction accounts. Fundamentally, typical large depositors such as nonfinancial or financial corporations and wealthy individuals would have had little use for B&L accounts.
The result is that while small savers were central to the finances of B&Ls like the Bailey Bros. B&L depicted in It’s a Wonderful Life, it is not clear that such an institution could ever have had true a deposit run, and therefore it is not necessarily straightforward to carry over the lessons of the movie into the commercial banking sphere, and somewhat ironic that this movie has become an iconic example of a bank run. B&Ls during the 1930s generally did not fail or close but rather froze for extended periods of time, even years, by refusing to pay out withdrawal request. Frank Capra directed another movie, American Madness, about a deposit run at a genuine commercial bank.

17
Data measuring deposit concentration tend to measure the percent of accounts that exceed
some dollar threshold, and the percent of deposits held in such accounts. Historically, the
thresholds used in such measurements range from levels equivalent to modern deposit insurance
limits, to levels far above those limits.
The first data I know of on this subject date to 1918, when the regulator of nationally
chartered banks (the Office of the Comptroller of the Currency) asked all national banks to report
the number of accounts below and above $5,000 (roughly $76,000 in 2012 CPI-adjusted
dollars).26 The data showed that only 2.2 percent of the roughly 16 million accounts in the
country exceeded that threshold, and that these accounts held 55 percent of all deposits.
Higher thresholds were used in a number of other studies periodically conducted from
1933 to 1983. The thresholds used in these studies were typically well above the deposit
insurance limits (first applicable in 1934), and as a result the data yield information on very large
accounts for which deposit insurance is a very limited factor. Table 4 lists a limited number of
statistics from these studies. The first line in Table 4 is from May 1933, and records the
concentration of deposits in accounts over $50,000—well above the $2,500 insurance limit that
went into effect in January 1934 and the $5,000 limit in place from late 1934 until 1950.
Deposits were highly concentrated, as only the largest 0.15 percent of accounts was above the
$50,000 threshold, and such accounts held 45 percent of all deposits.27
Later observations, from the late 1930s until the early 1950s, record the holdings of
accounts above $25,000, which was still several times the deposit insurance limit, but lower than
the $50,000 threshold used in the 1933 measurement (especially once inflation is taken into
account as shown in the last column of Table 4). Even with the lower threshold, only around 0.3
to 0.5 percent of accounts exceeded $25,000, and they generally held about 50 percent of all
deposits. The pattern continues to hold in the 1960s and 1970s when a higher threshold of
$100,000 was used. The last data date from the early 1980s.
As far as I know, no efforts have been made to collect data of this kind since the 1980s.
However, some additional data have become available since 2008. Unlimited insurance has been
available for noninterest-bearing transaction deposits under the TAG program described above,
26 Secretary of the Treasury (1918), p. 161. 27 This particular survey was technically of all member banks which had been licensed to reopen after the bank holiday. Member banks are those that are members of the Federal Reserve System. This includes all nationally chartered banks, as well as state-chartered banks that elect to be members.

18
from October 2008 to the end of 2012 (with a small gap in the middle). As a result, supervisors
have collected data on the number of accounts covered by this insurance—i.e. those exceeding
the $250,000 coverage cap that otherwise would have applied—as well as the amount of deposits
in such accounts. At the end of 2012Q2, only about 745,000 accounts in this category at
commercial banks exceeded the conventional deposit threshold, or about 0.15 percent of the
roughly 500 million deposit accounts (i.e., not limited to noninterest-bearing transaction
accounts). Yet this small number of accounts held $1.7 trillion, 22 percent of all deposits.
Who owns these large deposit accounts? Data on the ownership of deposits is available
for broad categories of depositors. For this purpose, it is useful to separate out the deposits of
households and businesses from others, such as government deposits and interbank deposits.
Today, according to call report filings, deposits held by households and corporations combined
account for over 90 percent of all bank deposits. Historically, these accounts have similarly
accounted for a very large majority of deposits, although interbank deposits once had greater
importance due to correspondent relationships. Figure 6 shows the relative holdings of
nonfinancial firms, financial firms, and households. For decades, nonfinancial businesses have
held between 50-60 percent of these deposits. These collection efforts ceased in 1990,
unfortunately. In more recent data, a limited amount of information regarding corporate
depositors is available from a survey of senior financial officers at commercial banks, conducted
by the Federal Reserve in 1998. Respondents to that survey indicated that individuals accounted
for 27 percent of demand deposits, on average, while businesses accounted for 59 percent,
leaving 14 percent for all other categories.28
Recently, banks have again been required to report the share of household and business
deposits that were not primarily for household use. These data began in 2014 and cover only
large banks.29 These data show that about 80 percent of transaction deposits held by depositors
that had before been grouped as “individuals partnerships and corporations” are actually held for
business purposes. This is roughly consistent with the data discussed in the previous paragraph,
but does seem to indicate a slightly larger share held for business purposes than in that earlier
data.30
28 The survey results are reported here: http://www.federalreserve.gov/econresdata/snfinsurvey.htm. See Q9.1. 29 Large banks are defined here as having more than $1 billion in assets. 30 Quarterly call report filings require commercial banks to separate depositors into six categories: (1) individuals, partnerships and corporations, (2) US government, (3) states and political subdivisions in the US, (4) US

19
Limited data are available historically on the concentration of deposits within household
and business accounts. The first data on this subject are from 1938, and show that the largest
0.40 percent of such accounts held 61 percent of all household and business deposits. Similar
statistics continued to characterize household and business accounts in 5 additional
measurements taken by the FDIC periodically from 1941 to 1964. In turn, it appears that
business deposits are responsible for the bulk of this concentration, as three special data
collection efforts in 1943, 1957, and 1959 all indicate that business deposits are significantly
more concentrated than household deposits. For example, in 1957, the largest 2.0 percent of
business deposit accounts (exceeding $100,000 each) held 57 percent of all business deposits,
while less than 0.5 percent of household deposits exceeded the same size threshold, and held
only 6 percent of all deposits. Altogether, it is clear that the concentration of deposits is a feature
that is robust to the exclusion of non-household and non-business deposits, and that business
deposits by themselves can account for large amounts of observed concentration.
4.2 The role of large depositors from 1929-1933
Large depositors were a key force behind bank withdrawals during the 1929-1933 period.
This fact is most convincingly established by Krost (1938), lead author of a Federal Reserve
Board study that examined the withdrawal records of depositors at a sample of 67 banks that
suspended between 1930 and 1933. The Krost study does not describe deposit runs per se but
rather the outflow of funds during the several months before bank suspensions. Deposit outflows
in these data are substantial, averaging 37 percent.31
commercial banks and other depository institutions, (5) banks in foreign countries, and (6) foreign governments and official institutions. The first category is very broad as it lumps together households and businesses. Even for this broad group there is no separate information on the insurance coverage. Quarterly reports for thrift institutions in 2008 did not break down deposits in this fashion at all. More data are available from the mid 1930s. In December 1936, 34.2 percent of demand deposits were owed to nonfinancial businesses, 21.6 percent to nonbank financial businesses, 16.8 percent to public bodies, leaving only 27.3 percent that were owed to individuals, non-profit organizations, and other unclassified entities such as unincorporated businesses.31 The share held by the latter group (including individuals) in December 1933, which is likely somewhat skewed given the great exodus of deposits during the preceding two years, was still only 25.7 percent. 31 In terms of the sample used by Krost, it is described as “representative of suspensions [in the early 1930s] involving banks with total deposits of between $1,000,000 and $25,000,000, located in urban areas” (p. 4). It is a 5% sample of such banks, by amount of deposits. Under-represented therefore are smaller banks in agricultural areas. Nevertheless, the focus on larger banks is actually beneficial for the purposes of making a connection with modern experience, as such banks held a disproportionately large share of deposits, and also because of the general increase in average bank size since the 1930s given consolidation.

20
The Krost study found that 48 percent of deposits in these banks were held in accounts
larger than $5,000, which was the insurance limit from 1934 to 1950, similar to the figures found
in sector-wide studies summarized before in Table 5. Large deposits take on additional
importance in the Krost study, though, because withdrawal rates were higher for the large
accounts. As a result, large accounts were responsible for a disproportionate amount of the
outflows. For example, demand deposit accounts in excess of $5,000 were responsible for 67
percent of demand deposit outflows (see Table 5). Accounts in excess of $25,000 alone were
responsible for 43 percent of the outflow, despite holding only 28 percent of the deposits. This
disproportionately arises from higher withdrawal rates, such as a 58 percent withdrawal rate from
accounts larger than $25,000, compared to a 28 percent withdrawal rate for accounts less than
$5,000.32 These facts remain true for business accounts examined separately, and for household
accounts examined separately.
The disproportionality is somewhat surprising but ultimately reveals important
characteristics of large depositors and “old-fashioned” deposit runs. Conceptions of old-
fashioned deposit runs typically highlight images of small depositors forming long lines to
withdraw money from banks en masse. Those depositors are “visible” or perhaps “noisy.”33 This
leads to a distinction with modern runs, which are conceived of as more “invisible” or “silent” by
the fact that in-person withdrawals are not as necessary today, given ATMs and online banking.
However, large depositors in the 1930s were not constrained by the need to stand in line.
Withdrawals in the 1930s were more invisible than the famous black and white pictures of
depositor hordes would suggest. Large depositors were more likely to hold checking accounts
(e.g. business payroll accounts) rather than savings accounts, and therefore could write checks to
other banks and withdraw money without standing in line. Large depositors were also more
likely to hold multiple bank accounts, giving them an alternative location to safely park funds if
withdrawn from a particular bank. Likewise, large depositors were more likely to be willing to
hold other forms of wealth, such as securities. Smaller depositors, in contrast, being less likely to
have other bank accounts and less accustomed to forms of wealth besides bank deposits, were the 32 This Krost study was seemingly once quite influential among Federal Reserve Board staff, and cited at various points in the following years. Today is not very well known, probably partly because it was never published widely (though it can now be downloaded from the St Louis Federal Reserve’s FRASER website). 33 Between 1938 and 2008, somehow the phrase “invisible run” was abandoned in favor of “silent run.” That latter phrase was used frequently to describe the runs by large depositors at institutions such as Wachovia and Washington Mutual, but visibility seems to be the key attribute rather than noisiness, if we take this metaphor perhaps too seriously.
21
ones who were forced to stand in line, but as we have seen, their deposits were in fact more
stable than deposits held by larger depositors and therefore should not be overemphasized.
Altogether, Krost challenges the conventional wisdom that apparently had already crystallized at
the time of his writing in 1938:
The long lines of depositors waiting at tellers’ windows were the most spectacular visible fact connected with the bank suspensions of the depression, and the dramatic character of such scenes has perhaps led to a general impression that many bank suspensions were attributable to visible runs of this type. This impression is not borne out by the figures in the following pages showing that the bulk of deposit losses occurred in accounts of depositors who were able to create invisible runs. (p. 14) Several pieces of evidence on specific episodes during the 1930-1933 complement the
Krost study. The Detroit banking crisis of 1933 famously involved a special role for one large
depositor, Henry Ford (and company). Due to his outsized position as a holder of $7 million in
deposits at one bank, Union Guardian Trust, Ford was at the center of negotiations over aid from
the Reconstruction Finance Corporation for that bank, and greatly complicated those negotiations
by refusing subordination and also threatening withdrawal of another $20 million he held at a
different bank, First National Bank (Butkiewicz 1999). Chrysler and General Motors also held
large deposits and participated in the negotiations. Kennedy (1973) gives Ford a lynchpin role,
stating that “Only Ford’s agreement to leave his deposits untouched could influence other large
depositors to do the same and insure sufficient reserves to meet demands of smaller depositors”
(p. 87). Though it does not appear that the Ford interests actually withdrew more than $100,000
from Union Guardian (Edsel Ford, Henry Ford’s son, withdrew that amount), the larger point
here is that the presence of deposit insurance with a cap such as $2,500 would have not altered
the financial instability resulting from the presence of Ford as one very large depositor. When the
negotiations failed, the governor of Michigan declared a bank holiday on February 14th.
Data on deposit withdrawals from the Union Guardian are available from the Stock
Exchange Practices Hearings, also known as the Pecora hearings, in January 1934. The Pecora
Hearings documents show that depositors at Union Guardian withdrew 12 percent of the bank’s
non-trust deposits in the 42 days before February 11, 1933, and list the account owner and
amount for each withdrawal. The 12 percent figure includes a very large withdrawal from
another bank in the same banking group, which if excluded would make the other withdrawals
22
total 8 percent of deposits.34 Figure 7 shows the cumulative distribution function of the
withdrawals. The withdrawals are ordered on the horizontal axis from smallest to largest, with 51
withdrawals in total. The largest 6 withdrawals—by General Motors Truck Co., The Children’s
Fund of Michigan, Edsel Ford, Campbell Ewald Company, Pacific Steel Boiler Corp, and the
Guardian National Bank of Commerce—were responsible for two-thirds of total dollars
withdrawn.35
Leonard Ayres, the vice president of the Cleveland Trust Company, described the fallout
from the Detroit banking crisis on the rest of the country, pointing to the “treasurers of great
corporations” (Ayres 1933). Corporations without access to their accounts at Detroit banks
proceeded to draw on their accounts in other nearby cities, including Cleveland, Chicago, and
Toledo. As facilities in those cities froze up, bankers and corporations drew on their lines in
other cities, stretching to Pittsburgh, Akron, Milwaukee, and Indianapolis.
This description is consistent with arguments in Rockoff (2003), which casts the 1933
banking crisis as a regional balance of payments story, with large corporations holding a key role
in transferring money among regions. Indeed, the Federal Reserve Board stated in its 1933
annual report that “Large depositors with wide connections transferred accounts from bank to
bank and from city to city” although it offers no direct evidence for that statement (p. 6).
Scattered reports from elsewhere in the country tell similar stories of withdrawals from
large corporate accounts. At the Bank of United States, the failure of which is famous for
initiating one of the first phases of Depression-era bank instability in December 1930,
withdrawals in “commercial accounts” were described as heavier than deposits in “thrift”
accounts, and the city of New York alone held $1.5 million in the Bank of United States.36 A
less well known bank crisis in Toledo, Ohio during 1931 also featured central roles for large
depositors, who withdrew vast amounts of money according to Messer-Kruse (2004, pp. 67-85).
The troubles in Toledo started at one bank, the Security-Home Bank. Messer-Kruse notes that
34 It is not clear that this withdrawal should be excluded from consideration, since such delinking even among affiliates is a destabilizing feature of periods of financial stress. When asked, Clifford Longley, the Union Guardian president, stated during the Pecora hearings that “they just withdrew it to cut down on their deposit in the [Union Guardian] Trust Co., and whether because they needed the money I don’t know” (United States Senate Committee on Banking and Currency, 1934, p. 4542). It seems likely that the withdrawals was a move for liquidity by the other bank’s management that may not have been well coordinated at the banking group level. 35 This is a gross withdrawal figure. There were a moderate amount of inflows, so that overall non-trust deposits were down 9.6% over the 42 days. 36 See New York Times, “Deposits of Bank Put at $161,000,000,” 18 December 1930, p. 11.
23
withdrawals at Security-Home by “a few working class Toledoans... didn't amount to much. The
real trouble came when a few major corporations, tipped off by bank insiders, decided to pull the
plug.” After Security-Home ceased operating, a run on the other banks commenced, with each
bank losing around 10-20 percent of deposits in a sixty day period. Several large corporations
reportedly withdrew hundreds of thousands of dollars each from Toledo banks. In the south,
Hoover and Ratchford (1951) describe large insurance and railroad companies as moving funds
from smaller to larger banks (cited in Rockoff 2003).
Witnesses testifying before Congress in the 1930s—as the deposit insurance legislation
was being debated—noted the importance of large depositors, on several occasions. The Texas
Banking Commissioner told Congress that “it is the ten- and twenty-thousand-dollar depositor
who closes the small bank out in the country, and the others follow him” and that in his state
“The large automobile concerns and large depositors are withdrawing one hundred and two
hundred thousand dollars at a time” (United States Congress 1934, p. 125). Senator Gore
asserted at one point that small depositors were the cause of bank runs, only to be contradicted
by the witness, the president of the giant Chemical Bank, who said such claims were “not true:”
The smart fellow gets out first, and he is the big depositor. What we call the national money, the big chain stores and tobacco companies and that type of people, they get out first, long before the little fellow ever hears of it… You see the [small depositor] walk in the door to get his money. You do not see the large depositor that checks his out that goes through the clearing house. (US Congress 1932, p. 166).
Similarly, a banker and former Representative told Congress that “Your big trouble is in
the big withdrawals that come in through the exchanges, rather than the small withdrawals... The
bank holidays in many states were forced largely by large deposits that were drawn through the
exchanges and not the withdrawal of small deposits at the window” (United States Congress
1935, p. 817). Preston (1935) noted that “Large deposits are maintained by firms... Until recently
it was assumed that they were much less subject to alarm than the mass of depositors. In the
banking crisis in March the withdrawals and transfers by corporation treasurers was a leading
cause of embarrassment to banks” (p. 599).
4.3 The design of deposit insurance
24
There is a large literature describing the origins of federal deposit insurance in the United
States. For the purposes of this paper, what is relevant is how large depositors were thought of by
those who designed the FDIC.
Since the inception of the FDIC, incomplete coverage of large depositors has been
motivated by the desire to preserve some market discipline by those depositors (Flood 1961, pp.
61-62). Large depositors were seen as being able to exercise such discipline because they had
access to more and better information regarding bank condition in comparison to small
depositors. For example, the first head of the FDIC, Leo Crowley, stated in testimony to
Congress that “A person that has $25,000 to invest is quite able to analyze the bank situation and
to take care of himself” (United States Congress 1950, pp. 12-13; note that $25,000 was five
times the insurance limit being debated at the time).37 Likewise, Preston (1935) noted that
“Large deposits are maintained by firms which are frequently heavy borrowers. It is these
depositors who are able to exercise the right of offset in the case of bank failure; they are better
able to get the facts concerning their bank’s condition” (p. 599).38 In contrast, small depositors
were viewed as unable to adequately monitor their banks. Jacob Viner noted that “The common
run of small depositors has neither the information necessary to appraise the status of a bank nor
the competence to interpret the information if it was available to him” (1936, p. 110).
The desire for market discipline by large depositors has always been at tension with
financial stability. I am by no means the first to note that deposit runs are still possible given the
incomplete coverage of large depositors. For example, Goldenweiser (1951), a one-time director
of the Research and Statistics division at the Federal Reserve Board, stated that the FDIC
... protects the savers of the country from uneasiness about the validity of their deposits and no doubt is sufficient to prevent bank failures caused by withdrawals of savings or other small or medium-sized deposits. It does not, however, protect the banking system from the consequences of withdrawals of large depositors or of transfers of funds from one bank to another, or from one group of banks to another... (p. 172)
37 These sentiments were echoed elsewhere in Congressional testimony. For example, Senator McAdoo, a one-time Treasury Secretary, noted that in the early 1930s “big depositors usually had some knowledge of what might happen and they pulled their deposits out when they got scared, which weakened the condition of the bank more than the withdrawals of a large number of small deposits” (US Congress, 1935b). J.F.T. O’Connor, the Comptroller of the Currency, likewise described depositors holding more than the insurance position as “in a better position to know” (US Congress 1935, p. 155). 38 The right of offset refers to the act of applying deposit balances to outstanding loans in the event of a bank’s closure.

25
Similar sentiments were expressed in testimony to Congress in 1934 (United States Congress
1934, p. 111), and by Mortimer Fox (1936, p. 106), a one-time head of the Research and
Statistics Division at the FDIC, to cite just a few examples. In this way, the limitations of deposit
insurance were recognized by at least some policymakers from the beginning of the national
system. Such tensions with financial stability led many to predict that, when push came to shove,
large depositors would find themselves with 100 percent coverage, especially if they were
depositors at one of the largest banks. For example, staff at the Federal Reserve Board in 1950,
citing the earlier Federal Reserve Board study led by Krost (1938) noted above, stated that “It is
extremely unlikely, however, that the large banks holding the bulk of large deposits would be
permitted to close, in view of the experience of the mid-1930s. In effect, then, large depositors in
these banks enjoy 100 per cent protection...” (p. 160). Similar statements were made by many
others in the 1930s, 1940s, and 1950s, such as by Jones (1938, p. 701) and Fox (1936, p. 107).39
These longstanding fears, that deposit insurance would become unlimited at the height of a crisis,
were realized in a way during 2008 when the FDIC created a program to fully insure noninterest-
bearing transaction accounts.40
5. Conclusion
An open question is whether large depositors would help create deposit runs in the event
of another financial crisis at US depository institutions. Large depositors, by virtue of being
uninsured and owning substantial amounts of deposits, have long represented a source of
potential market discipline on depository institutions, but also a potential contributor to financial
instability. In 2008, this tension was temporarily resolved in favor of reducing financial
39 Jones wrote “In light of past experience the Government will probably not in the future permit failure of the very large banks—the banks which hold the bulk of the uninsured deposits. If this is true, the depositors in these banks have what is in effect 100 per cent insurance at the present time.” Fox wrote “If the corporation is to maintain confidence during times of depression and thus remove the necessity for cumulative liquidation, it may be necessary that large as well as small depositors be protected.” 40 In this vein, Silber (2009) posits that the March, 1933 banking holiday was successful because of de facto 100 percent insurance for deposits at banks that re-opened after the holiday. This argument centers on the Emergency Banking Act of 1933, which did not insure deposits but did grant the Federal Reserve the ability to issue emergency currency, a change that Silber suggests was taken implicitly as a means to provide banks with whatever currency would be needed to meet depositor demands. The thesis is interesting, and if compelling then those events would parallel closely the creation of unlimited transaction deposit insurance put in place by the FDIC in 2008. The fact that Silber proposes the thesis reflects continued puzzlement over how the banking panic restored confidence among bank depositors. The evidence provided by Silber—that cash was redeposited after the holiday, and that stock prices increased—strongly indicate a return of confidence, but more evidence is needed to show that the de facto 100 percent insurance was the mechanism underlying the return of confidence.
26
instability, as the FDIC responded by implementing the Transaction Account Guarantee program
which gave unlimited insurance to large transaction deposit accounts. The Dodd-Frank Act
temporarily extended that unlimited insurance until the end of 2012. Under current law, the
FDIC no longer has the authority to create such a program on its own. However, the FDIC has
broad powers under its new Orderly Liquidation Authority to be used in the case of an insolvent
and systemically important firm. The practical implementation of this authority is unclear at this
point, but it will have paramount relevance for how large depositors view the safety of their
holdings and their incentive to run.
The deposit runs at banks in 2008 help mark the end of a “quiet period” in US banking,
as described by Gorton and Metrick (2012). In looking back on the long period of stability in the
banking sector that began in the mid 1930s, this paper suggests that other factors besides deposit
insurance may deserve more attention. Some reforms to the commercial banking system during
the 1930s have been widely noted and debated. Those reforms include the separation of
commercial and investment banking, or the centralization of power within the Federal Reserve
System at the Board of Governors, or changes to Federal Reserve discount window policy. Other
reforms have received less attention. Mitchener and Richardson (2012) study the reorientation of
risk management practices away from contingent liability and toward regulatory capital
standards, as well as changes in federal regulation and supervision practices. Additional changes
during the 1930s included strengthening of bank loss reserve requirements, and alterations to the
asset valuation methods used by supervisors (see Federal Reserve Board 1950, p. 158). These
and other changes put in place during the 1930s deserve further study.
27
References Acharaya, Viral V. and Nada Mora. (2012) “Are Banks Passive Liquidity Backstops? Deposit
Rates and Flows During the 2007-2009 Crisis.” NBER Working Paper 17838. Ayres, Leonard P. (1933) “The Recent Financial Storm – its Causes and its Lessons.” Trust
Companies, p. 297. Bair, Sheila. (2012) Bull by the Horns. New York: Free Press. Berger, Allen N. and Rima Turk-Ariss. (2012) “Do Depositors Discipline Banks and Did
Government Actions During the Recent Crisis Reduce This Discipline? An International Perspective.” Working paper. http://ssrn.com/abstract=1706901
Bernanke, Ben S. (2010) “Causes of the Recent Financial and Economic Crisis.” Testimony before the Financial Crisis Inquiry Commission. http://1.usa.gov/9XW4fi
Bradley, Christine. (2000) “A Historical Perspective on Deposit Insurance Coverage.” FDIC Banking Review, vol. 13, no. 2, pp. 1-25.
Brown, Martin, Benjamin Guin, and Stefan Morkoetter. (2013) “Switching Costs, Deposit Insurance and Deposit Withdrawals from Distressed Banks.” University of St. Gallen School of Finance, Working Papers on Finance No. 2013/19.
Butkiewicz, James L. (1999) “The Reconstruction Finance Corporation, the Gold Standard, and the Banking Panic of 1933.” Southern Economic Journal, vol. 66 no. 2, pp. 271-293.
Calomiris, Charles W. and Eugene N. White. (1993) “The Origins of Federal Deposit Insurance” in The Regulated Economy: A Historical Approach to Political Economy, eds. Claudia Goldin and Gary D. Libecap. Chicago: University of Chicago Press.
Covitz, Daniel M., Nellie Liang, and Gustavo A. Suarez. (2013) “The Evolution of a Financial Crisis: Collapse of the Asset-Backed Commercial Paper Market.” Journal of Finance, forthcoming.
Davenport, Andrew M. and Kathleen M. McDill. (2006) “The Depositor Behind the Discipline: A Micro-Level Case Study of Hamilton Bank.” Journal of Financial Services Research, vol. 30, pp. 93-109.
Department of Treasury, Office of Inspector General. (2009) “Material Loss Review of IndyMac Bank, FSB,” OIG-09-032, http://www.treasury.gov/about/organizational-structure/ig/Documents/oig09032.pdf.
Federal Deposit Insurance Corporation. (2008) “Memo to the FDIC Board of Directors, Re: Wachovia,” Financial Crisis Inquiry Commission document 140, http://www.fcic.gov/documents/view/140
-------- (2008b) “Memo to FDIC Board of Directors, Re: Citigroup” Financial Crisis Inquiry Commission document 1019, http://www.fcic.gov/documents/view/1019
-------- (various years) Annual Report of the Federal Deposit Insurance Corporation. Federal Reserve Board. (1950) “Staff Study on Assessments and Coverage for Deposit
Insurance.” Federal Reserve Bulletin, vol. 36, no. 2, pp. 151-165. -------- (2009) “Wachovia Case Study,” Financial Crisis Inquiry Commission document 994,
http://www.fcic.gov/documents/view/994.

28
Flood, Mark D. (1992) “The Great Deposit Insurance Debate.” Federal Reserve Bank of St Louis Review, vol. 74 no. 4, p. 51-77.
Fox, Mortimer J, Jr. (1936) “Deposit Insurance as an Influence for Stabilizing the Banking Structure.” Journal of the American Statistical Association, vol. 31 no. 193, pp. 103-112.
Fuller, Robert Lynn. (2012) Phantom of Fear: the Banking Panic of 1933. Jefferson, North Carolina: McFarland and Co.
Golembe, Carter H. (1933) “The Deposit Insurance Legislation of 1933: An Examination of its Antecedents and its Purposes.” Political Science Quarterly, vol. 75 no.2, pp. 181-200.
Gorton, Gary and Andrew Metrick. (2012) “Securitized Banking and the Run on Repo.” Journal of Financial Economics, vol. 104, pp. 425-451.
Grind, Kirsten. (2009) “WaMu’s Final Days.” Puget Sound Business Journal, September 27, 2009, http://www.bizjournals.com/seattle/stories/2009/09/28/story1.html.
-------- (2012) The Lost Bank. New York: Simon & Schuster. Jones, Homer. (1938) “Insurance of Bank Deposits in the United States of America.” The
Economic Journal, vol. 48 no. 192, pp. 695-706. Kennedy, Susan E. (1973) The Banking Crisis of 1933. Kentucky: Kentucky University Press. Krost, Martin. (1938) “A Sample Study of the Records of Suspended Banks.” Federal Reserve
Board study, http://fraser.stlouisfed.org/docs/historical/eccles/073_09_0001.pdf Iyer, Rajkamal and Manju Puri. (2012) “Understanding Bank Runs: The Importance of
Depositor-Bank Relationships and Networks.” American Economic Review, vol. 102 no. 4, pp. 1414-1445.
Mankiw, Gregory. (2011) Principles of Economics. Mason, OH: South-Western Cengage Learning.
Mitchener and Richardson. (2012) “Skin in the Game? Leverage, Liability, and the Long-Run Consequences of New Deal Financial Legislation.” Mimeo.
Moody’s. (2008) Earnings Commentary – Third Quarter 2008, National City Bank. Ó Gráda, Cormac and Eugene N. White. (2003) “The Panics of 1854 and 1857: A View from the
Emigrant Industrial Savings Bank.” Journal of Economic History, vol. 63 no. 1, pp. 213-240.
Offices of Inspector General, Department of Treasury and Federal Deposit Insurance Corporation. (2010) “Evaluation of Federal Regulatory Oversight of Washington Mutual Bank,” Report No. EVAL-10-002, http://fdicoig.gov/reports10%5C10-002EV.pdf.
Office of Thrift Supervision. (2008) “WaMu Ratings,” Financial Crisis Inquiry Commission document 861, http://www.fcic.gov/documents/view/861
Preston, Howard H. (1933) “The Banking Act of 1933.” The American Economic Review, vol. 23, no. 4, pp. 585-607.
Rockoff, Hugh. (2003) “Deflation, Silent Runs, and Bank Holidays, in the Great Contraction.” NBER Working Paper 9522.
Secretary of the Treasury. (1918) Annual Report of the Secretary of the Treasury.
29
Shin, Hyun Song. (2009) “Reflections on Northern Rock: The Bank Run that Heralded the Global Financial Crisis.” Journal of Economic Perspectives, Vol. 23 No. 1, pp. 101-119.
Silber, William L. (2009) “Why did FDR’s Bank Holiday Succeed?” FRBNY Economic Policy Review, vol. 15, no. 1, pp. 19-30.
Solow, Robert M. (2013) “How to Save American Finance from Itself: Has financialization gone too far?” New Republic, April 8, http://on.tnr.com/14kYvjX.
Special Inspector General for the Troubled Asset Relief Program (2011). “Extraordinary Financial Assistance Provided to Citigroup, Inc.” http://bit.ly/M8v0Ek.
United States Congress. (1932). Senate Committee on Banking and Currency. Operation of the National and Federal Reserve Banking System. 72d Cong. Washington: Government Printing Office.
------------ (1934) Senate Committee on Banking and Currency. Stock Exchange Practices, parts 8 and 9. 72d and 73d Cong. Washington: Government Printing Office.
------------ (1934b) House Committee on Banking and Currency. Extension of the Temporary Plan for Deposit Insurance. 73d Cong. Washington: Government Printing Office
------------ (1935) Senate Committee on Banking and Currency. Banking Act of 1935. 74th Cong. Washington: Government Printing Office
------------ (1935b) House Committee on Banking and Currency. Banking Act of 1935. 74th Cong. Washington: Government Printing Office
------------ (1950). Amendments to the Deposit Insurance Act. 81st Congress, second session. Washington: Government Printing Office.
United States Senate, Permanent Committee on Investigations. (2011) Wall Street and the Financial Collapse: Anatomy of a Financial Collapse.
White, Eugene. (1998) “The Legacy of Deposit Insurance” in The Defining Moment: The Great Depression and the American Economy in the Twentieth Century, eds. Michael D. Bordo, Claudia Goldin, and Eugene N. White. Chicago: University of Chicago Press.
Viner, Jacob. (1936) “Recent Legislation and the Banking Situation.” American Economic Review, Papers and Proceedings of the Forty-eighth Annual Meeting of the American Economic Association, pp. 106-119.

30
Table 1: Deposit outflows at large institutions
Institution Start of outflow
Duration of
outflow Size of outflow
Deposit base
Percent outflow
Monthly rate (hypothetical)
Wachovia 4/15/2008 2 weeks $15b $414b 3.6% 7.8%
9/15/2008 (Lehman) 5 days $8.3b
2.0% 11.8%
9/26/2008 (WaMu) 8 days $10b
2.4% 9.0%
Washington Mutual 7/11/2008 (IndyMac) 23 days $9.1b $186b 4.9% 6.5%
9/8/2008 16 days $18.7b
10.1% 18.6%
National City 3/15/2008 (Bear Stearns) 2 days $5b $98b 5.1% 55.6%
7/11/2008 (IndyMac) 5 days $4.5b
4.6% 25.3%
9/15/2008 (Lehman) 25 days $4.5b
4.6% 5.7%
Sovereign 7/11/2008 (IndyMac) ? $0.74b $47b 1.6%
9/1/2008 1 month $2.9b
6.2% 6.2%
IndyMac 6/27/2008 2 weeks $1.55b $18.5b 8.4% 17.6% Notes: The deposit base is the total deposits according to the 6/30/2008 call report figures except for Wachovia and
IndyMac, where I use 3/31/2008 figures. I combine multiple banks or thrifts within a holding company where appropriate.
Sources: - The Wachovia 4/15 and 9/26 events are described in Federal Reserve Board (2009), Federal Deposit Insurance
Corporation (2008); testimony by Federal Reserve Board General Counsel Scott Alvarez (http://1.usa.gov/aMS81t); Rick Rothacker “$5 billion withdrawn in one day in silent run,” Charlotte Observer, 11 October 2008; Jeff Horwitz “Wachovia’s End,” American Banker, 13 October 2009; and in the 2008Q3 earnings call (http://bit.ly/JWnJv9).
- The Wachovia 9/15 event is described by the testimony of John Corston of the FDIC to the FCIC (http://1.usa.gov/JJRSs7) in addition to Federal Reserve Board (2009) document.
- The WaMu 7/11 event is described by an OTS document ("Letter to the FDIC Re: WaMu ratings") released by the FCIC, and discussed on p. 306 of its report (http://www.fcic.gov/documents/view/861).
- The WaMu 9/8 event is described on p. 50 and p. 66 of the bankruptcy examiner report (http://www.mckennalong.com/publications-advisories-2411.html); p. 13 of Offices of Inspector General (2010); Grind (2009); and a 2008 “Fact Sheet” by the OTS (http://www.fcic.gov/documents/view/905).
- The National City events are described in a 11/10/2008 S-4 filing with the SEC (http://1.usa.gov/LxhiLZ) pp. 35-42, by bank officials during the second and third quarter earnings teleconferences (http://bit.ly/LnR900 and http://bit.ly/LnRcZz), and in Moody's (2008). Daily data on core deposits are charted in National City’s 2008Q3 earnings presentation (available from the author) and so the deposit figures listed here are estimates from that chart. This is the only data that refer to the subset core deposits rather than all deposits in this table.
- The Sovereign events are described in a 12/16/2008 F-4/A filing with the SEC (http://1.usa.gov/MeGLZ8), pp. 40-42, and in its third quarter earnings release (available from the author).
- The IndyMac event is described on p. 3 of its Material Loss Review (http://1.usa.gov/gnuLAi).

31
Table 2: Deposit outflows at other institutions
Institution Start of outflow Size of outflow
Deposit Base (June 30, 2008
$ million) Percent outflow
PFF 4/30/2008 $249.1 million $2,613.6 8.10% Silver State 7/11/2008 (IndyMac) $4 million per day $1,610.4 Downey 7/11/2008 (IndyMac) 507 million $9,824.4 5.0% 1st Centennial 7/11/2008 (IndyMac) 130 million $435.1 29.9% Vineyard 7/11/2008 (IndyMac) "significant" $1,854.8 Columbian 8/12/2008 $497.4 Barnes 12/15/2008 100 million $621.5 14% New Frontier 1/30/2009 $1,582.9 Cape Fear 4/1/2009 $379.7 United Commercial 9/9/2009 $7,839.2 Solutions 10/27/2009 $309.6 County 3/18/2008 $52 million $1,330.7 3.9% 11/18/2008 $72 million 5.4% 1/30/2009
Sources: - PFF: Material Loss Review (www.fdicoig.gov/reports10/10-022.pdf), p. 49 - Silver State: Material Loss Review (www.fdicoig.gov/reports09/09-008-508.shtml), p. 23; “ ‘Trust us,’ ad said
before bank failed,” Las Vegas Review-Journal, 9 September 2008; “McCain’s son sat on troubled bank’s board,” Wall Street Journal, 15 August 2008.
- Downey: SEC 10-Q filing for the quarter ending June 30, 2008, and an August 15, 2008 news release, available from the author.
- 1st Centennial: Material Loss Review (www.fdicoig.gov/reports09/09-019-508.shtml), p. 12 - Vineyard: Material Loss Review (http://1.usa.gov/M5bOat), p. 11 - Columbian: Statement by regulator in “Area sees a second bank fail this year,” Kansas City Star, 23 August
2008. - Barnes Material Loss Review (http://1.usa.gov/Ljb45H), p. 14 - New Frontier: Material Loss Review (www.fdicoig.gov/reports10/10-003.pdf), p. 9 - Cape Fear: Material Loss Review (www.fdicoig.gov/reports10/10-002.pdf), p. 3 - United Commercial: Material Loss Review (http://www.fdicoig.gov/reports10/10-043-508.shtml), p.14 - Solutions: Material Loss Review (http://1.usa.gov/JJJZUc), p. 2 - County: Material Loss Review (http://www.federalreserve.gov/oig/MLR_county_bank.htm), p. 12

32
Table 3: Insurance Coverage at Selected Large Institutions
Institution
Percent of domestic deposits insured
Percent of domestic
accounts fully insured
Selected large institutions Wachovia 61.3 98.0
Washington Mutual 74.2 98.8 National City 81.2 98.4 Sovereign 70.7 98.5 Indymac 83.3 88.9
All commercial banks and thrifts 62.3 98.5
Notes: Estimated from call reports, 6/30/2008.

33
Table 4: Deposit Concentration Studies
Insurance limit at the
time
Percent of accounts over
threshold
Percent of deposits held by accounts over
threshold
Threshold in 1933 dollars Date
Highest threshold: $50,000 May 1933* N/A 0.15 44.6 $50,000
Oct 1933 N/A 0.15 48.2 $50,000
Highest threshold: $25,000 Sep 1938 $5,000 0.28 49.4 $23,000
Sep 1941 $5,000 0.36 56.9 $22,100 Oct 1945 $5,000 0.53 50.7 $18,100 Sep 1949 $5,000 0.56 48.1 $13,700 Sep 1951 $10,000 0.60 50.6 $12,500
Highest threshold: $100,000 Sep 1955 $10,000 0.15 36.9 $48,500
Nov 1964 $10,000 0.17 37.2 $41,900 Jun 1966 $15,000 0.16 37.9
Jun 1968 $15,000 0.18 36.4 $37,400 Jun 1970 $20,000 0.18 35.6 $33,500 Jun 1972 $20,000 0.21 38.0 $31,100 Jun 1980 $100,000 0.32 35.5
Highest threshold: $250,000
Jan 1983 $100,000 not given 29.2 $32,630
* Only covers members of the Federal Reserve System
Sources: Federal Reserve Bulletin (July 1933, p. 414, and May, 1935, p. 316), and FDIC Annual Report (various years)

34
Table 5: Deposit outflows by account size in Krost (1938) sample
Demand deposit classification
Percent of
initial deposits
Percent decline
Percent of overall deposit
decline
Government deposits 13.0 -17.8 5.6 Certificates of deposit 0.6 -54 0.8
Other accounts, smaller than $5,000 35.3 -27.7 26.1 Under $1,000 17.2 -15.3 8.9 $1,000 to $5,000 18.1 -39.4 17.2
Other accounts, larger than $5,000 48.0 -57.5 67.0 $5,000 to $25,000 20.4 -48.9 24.3 $25,000 and up 27.6 -63.8 42.7
Other (inactive or unknown size) 3.1 -6.8 0.5
Total 100.0 -40.2 100.0

35
Figure 1: Washington Mutual deposit levels during 2008
Notes: Consumer and small business deposits. Source: Declaration of Thomas Blake to the United States
Bankruptcy Court, District of Delaware, Chapter 11 Case No. 08-12229 (MFW).

36
Figure 2: Wachovia deposit levels
Notes: These charts are reproduced from an internal Federal Reserve Board document, “Wachovia Case Study”, released to the public by the Financial Crisis Inquiry Commission (FCIC) and cited on p. 304 of the FCIC report (http://www.fcic.gov/documents/view/994). NOW stands for negotiable order of withdrawal, which are similar to checking deposits. The document does not give a definition of “core” deposits, but that terminology typically includes transaction, savings, and small time deposits and excludes brokered deposits. Therefore, the other three charts are subsets of the top left chart but do not form a cover of the set of core deposits. Finally, in the upper left chart, AG Edwards was a broker-dealer acquired by Wachovia in 2007, but whose money market accounts were kept in a separate part of the Wachovia bank holding company and not integrated into the commercial bank. The “sweeps” from AG Edwards accounts likely refers to money market funds transferred from the AG Edwards subsidiary, perhaps intended to be temporary.

37
Figure 3: Percent of institutions with large outflows of savings and transaction deposits
Notes: A large outflow is defined as one exceeding five percent over 20 business days, sustained for 4 days in a row.
The largest 100 institutions are defined by their total deposits as of June 30, 2008.

38
Figure 4: Percent of institutions with large inflows of time deposits
Notes: A large inflow is defined as one exceeding five percent over 20 business days, sustained for 4 days in a row.
The largest 100 institutions are defined by their total deposits as of June 30, 2008.

39
Figure 5: Coverage of domestic deposits by FDIC Insurance
Notes: The vertical lines mark changes in the level of deposit insurance coverage. TAG refers to the transaction account guarantee program, created by the Dodd-Frank act and effective from December 31, 2010 to December 31, 2012, which has provided insurance in unlimited amounts for noninterest-bearing transaction deposits. Prior to that, similar insurance was available for participating institutions starting in the fourth quarter of 2008 via the Temporary Liquidity Guarantee Program, but that coverage is not included in this chart. The data are annual year-end and taken from the FDIC annual reports, relating to domestic deposits only. Foreign deposits are all uninsured and not included in the denominator. Up to 2005, the bank insurance fund data are available separately, but after 2005 the bank and savings association insurance funds are only available combined. The year-end 2008 figure is lower than it should be, as the increase in coverage to $250,000 was temporary at first, but the data were still collected on the basis of the permanent $100,000 limit. The higher coverage was made permanent after 2008 and so the 2009-2011 figures do not suffer from this problem. This is a replication and extension of a similar chart in White (1998).

40
Figure 6: Composition of demand deposits held by households and businesses
Notes: Percent of deposits held by each group. These data include only household and business deposits, and
therefore exclude interbank and government deposits.
Sources: From 1943-1955, 1957-1961, and 1970-1990, the data are from surveys taken by the Federal Reserve System, first known as "Ownership of Demand Deposits," then "Survey of Demand Deposit Ownership," then
"Gross demand deposits of individuals, partnerships and corporations." The 1998 observation is from the Senior Financial Officer Opinion Survey, conducted by the Federal Reserve. The pre-1943 data are from two Federal
Reserve Bulletin articles: “Distribution of demand deposits by economic classes of depositors,” October 1939, pp. 871-874, and “Ownership of Bank Deposits” pp. 917-922.
0.0%
10.0%
20.0%
30.0%
40.0%
50.0%
60.0%
70.0%
1930 1940 1950 1960 1970 1980 1990 2000
Nonfinancial Business Nonfinancial Business (excl. farm) Consumer Financial Business

41
Figure 7: Cumulative withdrawals by large depositors at Union Guardian Trust in 42 days before February 11, 1933
Source: United States Congress (1934), pp. 4840-4841 and 5056.