Oklahoma State University Oklahoma City Complete DOCUMENT... · Annual Assessment Report ... the...
27
1 2011-2012 Annual Assessment Report (EXECUTIVE SUMMARY) Submitted to the Oklahoma State Regents for Higher Education Oklahoma State University – Oklahoma City January 22, 2013
Transcript of Oklahoma State University Oklahoma City Complete DOCUMENT... · Annual Assessment Report ... the...

1
2011-2012
Annual Assessment Report
(EXECUTIVE SUMMARY)
Submitted to the
Oklahoma State Regents for
Higher Education
Oklahoma State University –
Oklahoma City
January 22, 2013

2
Oklahoma State University—Oklahoma City Annual Assessment Report of 2011-2013 Activity
Executive Summary
Oklahoma State University - Oklahoma City (OSU-OKC) is committed to delivering
quality educational programs preparing students to live and work in an increasingly
technological and global community. Accordingly, OSU-OKC faculty and staff embrace
student assessment activities as a means by which to ensure the quality and effectiveness
of academic programs offered. The contents of this document report the institution’s
2011-2012 assessment activities, as prescribed by the Oklahoma State Regents for Higher
Education (OSRHE).
SECTION I – ENTRY-LEVEL ASSESSMENT
OSRHE policy mandates that all students must demonstrate proficiency on standard tests
or be required to remediate in the discipline area. OSU-OKC utilizes several entry level
assessment methods to analyze the academic proficiency of incoming students and place
students into courses that are appropriate to their skill level. Examples of entry level
assessment tools used by OSU-OKC are the ACT test, academic transcripts, and the
COMPASS exam.
During the one-year period between June 2011 and July 2012, the OSU – OKC Testing
and Assessment Center administered over 8,861 COMPASS exams. Of the 3,352
students completing the reading portion of the COMPASS exam, 50.69% tested at
college level reading proficiency. Of the 2,622 writing assessments, 40.08% of students
were placed in ENGL 0123 Basic Composition while 31.69% were placed in Freshman
Composition I. Of the 2,866 math assessments, 58.75% were placed in a Pre-Algebra
course.
In effort to increase student retention within developmental courses while encouraging
swift, successful progression into credit bearing courses, the following course
modifications have been implemented:
The addition of a more robust lecture component to the on-campus computer
based math courses providing a greater level of instructor/student interaction and
rapport.
Moving a number of courses to later in the day as opposed to early starts to
encourage better participation.
Working to help students become more comfortable with the MyMathLab course
software that offers tutoring assistance and tips to support student success.
Creating more eight week courses to accelerate a student’s progression through
the developmental course sequence.

3
Continuing the implementation and evaluation of a peer mentoring program to
encourage a greater connection between the student and the campus.
Coordinating classroom visits with student support personnel to promote
awareness of student support services such as workshops teaching effective study
habits and time management skills.
SECTION II – MID-LEVEL/GENERAL EDUCATION
The CAAP assessment provides useful information regarding the general education skills
attainment of OSU-OKC students as they reach the midpoint of their academic careers.
For the fall 2011 term, 74 students completed the writing assessment and 80 students
completed the critical thinking portions of the CAAP. In the spring 2012 term, 81
students completed the math assessment and 70 students completed the reading
assessment. The testing groups were decidedly different as there was no control over the
group membership, other than attendance of the targeted classes. The following is a
summary of the results:
African American students scored lower in most subjects tested. Hispanic
students did not provide a reportable measure due to low representation.
The Native American scores reflected a downward trend.
Generally more females than males are administered the assessment.
Reports indicate that males score higher in math and females score higher
in writing. Critical thinking and reading scores were reported as more
evenly distributed between males and females.
Writing and critical thinking tended to improve with age and education
level while math tracked the opposite.
As a general matter, math scores appear to exceed the national average by
1.3 points.
In other subject areas, the scores appear to be a mix from year to year with
the OSU-OKC average never exceeding or falling below a difference of
1.4 points.
SECTION III – PROGRAM OUTCOMES
Oklahoma State University requires that all academic programs conduct a formal
program outcome assessment to comply with the assessment mandates of the Oklahoma
State Regents for Higher Education, and the Higher Learning Commission. Each
academic unit submits an assessment plan that is followed up with an annual assessment
report to the Office of Academic Affairs. The assessment plan defines and describes
expected student learning outcomes for each degree program, and the methods used to
evaluate the identified outcomes. The report allows academic units to describe its
assessment activity from the previous year. OSU – OKC is committed to using this data
for continuous program and institutional improvement.

4
The Office of Academic Affairs works closely with the campus Assessment of Student
Learning Committee and the Coordinator of Assessment and Accreditation Compliance
to gather data on program outcomes assessment. The result of this work is that each
degree and certificate program has 1) a set of individualized program outcome objectives
that reflects the skills and knowledge that faculty believe each program graduate should
possess, 2) an identified set of methods to assess these objectives such as examinations,
capstone courses, portfolios, etc. and 3) an annual data report that provides faculty with
an opportunity to report and analyze the data obtained from assessment conducted in their
respective departments. Results from the analysis of program outcomes are reported to
the HLC Assessment Academy, OSU-OKC Assessment of Student Learning Committee,
the OSU-OKC Vice President for Academic Affairs, and the Oklahoma State Regents
office.
Fall 2012, OSU – OKC will complete its final year of participation in the Assessment
Academy sponsored by the Higher Learning Commission. The OSU-OKC Assessment
Academy work group is composed of campus faculty, division administrators and the
Coordinator of Assessment and Accreditation Compliance. Specific faculty and staff
development training sessions were scheduled and completed during the fall 2011,spring
2012 semesters, and summer 2012 term. During this time, faculty members were asked
to review existing program outcomes and re-evaluate the selected assessment methods to
ensure they remained relevant and appropriate. The assessment academy team continues
to work with program administration and faculty to ensure that program outcomes reflect
the general education competencies that all OSU – OKC graduates should possess. The
continued implementation of the addition of these components to the list of identified
program outcomes will fulfill the project goal of the Academy team that is to integrate
mid-level outcomes assessment with program outcomes.
SECTION IV – STUDENT SATISFACTION
Over the past several years, OSU-OKC has developed a multi-tiered approach to measure
student satisfaction. OSU-Oklahoma City conducts general institution Student
Satisfaction Surveys biennially with the most recent survey conducted during the spring
2010 term. The survey is a product of ACT and was administered to 240 students on
campus. Due to ACT discontinuing sponsorship of the Student Satisfaction Survey,
OSU-OKC did not administer a general institutional student satisfaction survey and is
currently looking for an alternative type of student satisfaction assessment. Also
administered to students are individual course satisfaction surveys. This assessment
provides insight into students’ satisfaction level of course content, delivery and
instruction.
The Student Satisfaction Survey administered in the spring 2010 term provided useful
data regarding student perception and satisfaction. Some of the more pertinent ratings
follow:
Parking received a 2.84 rating in 2010, down from a 2006 rating of 3.74. Making
it the lowest rated service in each survey.

5
Veterans Services increased from a 3.85 rating in 2006 to 4.89 in 2010.
Areas receiving the highest rating in each section were:
Academics: Attitude of faculty towards students or class size
Admissions: College catalog
Rules and policies: Personal security or rules governing conduct
Facilities: General condition
Registration: Academic calendar
General: College in general
New administration is carefully analyzing prior results and increased assessment methods
with the intent to better the campus. Prior assessments have already begun to be used in
this manner. For example, in response to the parking issue identified in the student
satisfaction survey, and other information, parking is being addressed through the
construction of a parking garage due to be completed fall 2013.
Other methods used to measure student satisfaction include the Graduating Student
Survey and the Post-Graduation Survey. Regarding the deployment of each, the
Graduating Student Survey is used to assess students as they complete the application for
graduation. This survey was developed internally and is scored in a manner similar to
that of the Student Satisfaction Survey. The Post-Graduation Survey is administered
several months after a student graduates from OSU-OKC and is designed to assess the
student’s perception regarding the overall institutional effectiveness of OSU-Oklahoma
City. Similar to the Student Satisfaction Survey, the Graduating Student Survey was
developed internally and is scored in a similar manner. Each of these surveys affords the
institution the opportunity to measure student satisfaction at different points in the
student’s progression through the campus environment and beyond.

6
2011-2012
Annual Assessment Report
Submitted to the
Oklahoma State Regents for
Higher Education
Oklahoma State University –
Oklahoma City
January 22, 2013
Oklahoma State University—Oklahoma City Annual Assessment Report of 2011-2012 Activity

7
STUDENT ASSESSMENT ACTIVITY
Oklahoma State University – Oklahoma City (OSU-OKC) is committed to delivering
quality educational programs preparing students to live and work in an increasingly
technological and global community. Accordingly, OSU-OKC faculty and staff embrace
student assessment activities as a means by which to ensure the quality and effectiveness
of academic programs and co-curricular services offered. The contents of this document
report the institution’s 2011-2012 assessment activities, as prescribed by the Oklahoma
State Regents for Higher Education (OSRHE). The institution’s response to narrative
questions I-V adheres to the format implied in the report instructions.
Section I – Entry Level
Administering Assessment
OSRHE policy mandates that all students must demonstrate proficiency on standard tests
or be required to remediate in the discipline area. OSU-OKC utilizes several entry level
assessment methods to analyze the academic proficiency of incoming students and place
students into courses that are appropriate to their skill level. Examples of entry level
assessment tools used by OSU-OKC are the ACT test, academic transcripts, and the
COMPASS exam. ACT scores, if provided, are referenced by academic advisors to
identify a student’s tested proficiency in core subject areas. An official transcript from an
institution is also an acceptable form of assessment as the document provides advisors
with insights regarding a student’s demonstrated proficiency in college-level courses. A
student applying to OSU-OKC who has neither an ACT score nor an official transcript is
required to take the COMPASS exam. The COMPASS exam is a product of ACT and
consists of a battery of computer-administered skills assessments.
During the one-year period between June 2011 and July 2012, the OSU – OKC Testing
and Assessment Center administered over 8,861 subject area COMPASS exams.
Students who are not satisfied with their results have the opportunity to re-test, and have
access to the same study guides and tutoring options available to those testing for the first
time. The number of COMPASS exams administered during the current reporting cycle
includes the number of students taking advantage of the re-testing option.
OSU-OKC utilizes several entry level assessment methods to analyze the academic
proficiency of incoming students. The assessments are utilized in order to ensure the
proper placement of students into courses that are appropriate to their skill level. In order
to track the continued performance of students throughout their tenure at OSU-OKC, a
campus-wide master report is generated each semester to monitor student performance by
course outcome. This report is also designed to identify the rate of student persistence to
the next course in the developmental sequence.

8
Analysis and Findings
The following information represents the 8,861 students completing the web-based
version of the COMPASS exam, separated by subject area. Out of 3,352 reading
assessments, 50.69% tested at college level reading proficiency ready to enroll in credit
bearing courses. The remaining 49.31% were enrolled in developmental reading courses.
Of the 2,622 writing assessments 40.08% of students were placed in ENGL 0123 Basic
Composition while 31.69% were placed in Freshman Composition I. Of the 2,866 math
assessments, 58.75% were placed in a Pre-Algebra course.
Developmental students are also assessed via a pre and post-test. In the developmental
reading courses, results from the pre-test and post-test comparison suggests that the
accuracy of student response increases when questions pertain to concrete rather than
abstract information. In particular, questions pertaining to charts, graphs, and other
quantitative visual analysis are more often answered incorrectly. Since reading
comprehension is vital to success in both the developmental reading courses and
students’ overall academic achievement, further research is required to explore the extent
to which a student’s inability to comprehend and infer information impacts their ability to
successfully complete general education courses. To address the above findings, faculty
members responsible for leading developmental programs have developed plans to
modify the pre-tests and post-tests for both levels of developmental reading, and to
refocus course curriculum to address student needs.
The findings identified in the above analysis have a direct influence on other
developmental courses, and general education courses across campus. Students with low
level reading skills may not perform well in writing, math, or in technology-based
courses. This issue reinforces the need for an aggressive schedule of student assessment
to ensure the proper alignment of campus support services to address the identified needs
of students. This need is further reinforced when reviewing the general expectations of
course materials that require a student to read and follow directions, navigate websites, or
utilize the online classroom platform.
In reference to COMPASS results in the English subject area, a pattern emerges
regarding the types of questions that students answer incorrectly. Specifically, an
analysis of COMPASS test results reveals that students have issues pertaining to the
ability to identify sentence fragments, run-ons, comma splices, and subject-verb
agreement. According to institutional data, it appears that students in both levels of
developmental courses struggle with these objectives.
Students testing low in the COMPASS math subject area test may be placed in one of
several developmental math courses. In pre-algebra, an analysis of data reveals that
students initially struggle with operations involving positive and negative numbers and
the mastery of numbers through the process of cross multiplication. However, many
students are reported to have obtained these skills by the end of the course. In the course
sequence, Introduction to Algebra follows Pre-Algebra. In Introduction to Algebra, an
analysis of data reveals that students struggle with general algebraic equations. As

9
instructors have identified these areas that are barriers to student success, courses have
been modified to focus more time on the development and mastery of these skills.
In the subject of Intermediate Algebra, an analysis of data reveals that a student’s ability
to interpret graphs is a significant challenge. Plotting numbers on graphs and thinking in
abstract terms are barriers to course success. The lead instructor for Intermediate Algebra
indicates that the course text was changed in the spring 2009 term to more appropriately
address the course objectives and better prepare students for college algebra.
A pilot study was deployed during the spring 2010 semester. The Pre-Algebra course
was taught in an on-line format and required a student to demonstrate mastery of one
lesson prior to advancing to the next in the sequence. Once fully compiled, the results of
this approach were compared to the results of a more traditionally taught on-line course
led by the same instructor. No significant differences in course outcomes were found for
students who completed the mastery model on-line class versus the traditionally taught
on-line class. With no difference discovered, faculty chose to adopt the mastery model
for both Pre-Algebra and Introductory Algebra.
Educational outcomes were also aggregated by each course. For instance, all of the
separate sections offered for MATH 0103 (Pre-Algebra) were consolidated into one
master file. This practice was also performed for the six other developmental math
courses offered on campus. Trending by term was examined to determine if there was
an upward trend or a downward trend in student success rates. Examination of trends
from fall 2007 through spring 2012 indicates a general decline in successful outcomes.
Note: Successful outcomes were defined as an end grade of ‘A’, ‘B,’ or ’C.’
In addition, information was extracted from a data set which separated the outcomes by
delivery type (lecture format vs. computer-taught format). This analysis indicated that
the computer- taught formats consistently underperformed in terms of student success
49 50 53
51 49
42
47 46
50
40
30
40
50
60
Fall 2007
Spring 2008
Fall 2008
Spring 2009
Fall 2009
Spring 2010
Fall 2010
Spring 2011
Fall 2011
Spring 2012
Succ
ess
ful O
utc
om
e P
erc
en
tage
Term
Successful Outcome Percentage by Term Math 0103
Successful Outcome Percentage

10
outcomes. Further research will identify the most appropriate method for addressing this
trend. Modifications to the course that have already been implemented include:
The addition of a more robust lecture component to the on-campus computer
based math courses providing a greater level of instructor/student interaction and
rapport;
Moving a number of course sections to later in the day as opposed to early
morning to encourage better participation; and
Working to help students become more comfortable with the MyMathLab course
software that offers tutoring assistance and tips to support student success.
During the summer 2012 term, a study was conducted to determine the possible value of
students retaking the COMPASS exam when scoring just a few points below the passing
grade. Campus faculty and administration wondered if students would score better if
they had the option to retake and pass the COMPASS exam thus shortening the amount
of time spent in developmental course work and increasing retention probabilities. Of the
244 students with developmental course recommendations, 168 students chose not to
retest citing comfort with their placements and time considerations. Of students who
retested, the majority of the scores did not improve. Students over all seemed quite
comfortable with their initial entry level assessment and placement process.
Other Assessment Plans
A demographic component has been added to the reporting mechanism that tracks the
performance of developmental students. The purpose of adding the demographic
component is to provide a more robust profile of developmental and entry-level students.
The enhanced student profile will allow student support services to customize initiatives
designed to better identify student needs, and develop programs to address the identified
needs. For example, a peer mentoring program was launched in the fall 2011 term based
on research into development program success and student persistence. As assessment
analysis provides greater insights to the influences that may impact student success,
continued efforts will be made to respond to those influences. Examples of this process
include:
In developmental English, the developmental studies department head is piloting
a study to determine whether or not a student’s performance improves when the
technology component is removed from the course. This test is based on
anecdotal evidence that students do not persist due to a lack of technology-based
skills; and
In response to the low student retention rates in the developmental reading course,
the department head has identified the campus need for a developmental reading
instructor. The department head believes that retention may increase with greater
emphasis placed on student literacy.

11
Other implemented changes include:
Testing the addition of more eight-week courses to accelerate a student’s
progression through the developmental course sequence;
Continuing the implementation and evaluation of a peer mentoring program to
encourage a greater connection between the student and the campus; and
Coordinating classroom visits with student support personnel to promote
awareness of student support services such as workshops that teach effective
study habits and time management skills.
As OSU-OKC gleans greater insights from its data analysis efforts, the institution
continues to improve the process of developing and aligning support services to address
the needs of students.
A strong academic foundation is crucial to students’ academic success. Supporting
campus efforts in providing services that engage our student body in learning
opportunities within the developmental areas is crucial to student persistence, retention
and ultimate completion. With this in mind, OSU-OKC leadership determined that
transitioning the developmental studies department into a full academic division would
better serve students enrolled in developmental courses. Thus, the Initial College Studies
academic division was created and the first division head was hired on August 20, 2012.
With roughly 25 percent of OSU-OKC students taking at least one developmental class
and the documented importance of these courses being completed swiftly and
competently, supporting a dedicated academic division for developmental studies
demonstrates the continued dedication to student success at OSU-OKC.
Section II – Mid-Level/General Education
Administering Assessment
In the 2011-2012 academic year, the OSU-OKC Assessment of Student Learning
Committee (ASLC) used ACT’s Collegiate Assessment of Academic Proficiency
(CAAP) instrument for mid-level assessment. The ASLC reviewed various methods of
assessing mid-level general education and chose to administer for the first time, the ACT
CAAP writing and critical thinking assessment in the fall of 2007. It was determined that
the math and reading portion was to be administered for the first time in the spring 2008
term. Given the interest in assessing the skill level of students, it was decided that the
student population to be tested would have completed the respective general education
prerequisite. In response, division administrators approached appropriate faculty
members and asked that they participate in the assessment activity. Because of the time
difference between assessments, it was unlikely that a single student would have been
exposed to all four assessments. Therefore, each subject area should be viewed
independently as the student population for each assessment was different. The CAAP
has been annually administered and analyzed following the same institutional process
since 2007.

12
Analyses and Finding
The CAAP assessment provides useful information regarding the general education skills
attainment of OSU-OKC students as they reach the midpoint of their academic careers.
Fall 2011, 74 students completed the writing assessment and 80 students completed the
critical thinking portions of the CAAP. Spring 2012, 81 students completed the math
assessment and 70 students completed the reading assessment. The testing groups were
decidedly different as there was no control over the group membership, other than
attendance of the targeted classes. The following is a summary of the results:
African American students scored lower in most subjects tested. Hispanic
students did not provide a reportable measure due to low representation.
The Native American scores reflected a downward trend;
Generally more females than males are administered the assessment.
Reports indicate that males score higher in math and females score higher
in writing. Critical thinking and reading scores were reported as more
evenly distributed between males and females;
Writing and critical thinking tended to improve with age and education
level while math tracked the opposite;
As a general matter, math scores appear to exceed the national average by
1.3 points; and
In other subject areas, the scores appear to be a mix from year-to-year with
the OSU-OKC average never exceeding or falling below a difference of
1.4 points.
Recommendation
The CAAP assessment provides useful information regarding the general education skill
attainment of OSU-OKC students as they reach the midpoint of their academic careers.
The results of the 2008-2009 assessment indicate that OSU-OKC students score within
national averages. Adding the 2011-2012 results to the trending report indicates mild
fluctuations in scores, generally within one percentage point of the national norm.
In the future, strategies will be implemented to ensure that the assessment population
better represents the diversity of the campus. Efforts will specifically relate to the
identification and inclusion of Hispanic students to ensure the presence of a population
that is measurable. The ASLC believes the CAAP is a good general assessment tool.
However, faculty members responsible for teaching general education courses have
expressed an interest in obtaining information regarding how test objectives interrelate
with defined course objectives. OSU – OKC is considering the development of a skill
diagnostic assessment that would satisfy this interest. There may also be a need for future
exploration into the development of other diagnostic assessments.

13
Other Assessment
OSU – OKC administers an internally-developed instrument known as the Teaching and
Reinforcement Survey. The survey is used to assess the degree by which certain skills
pertaining to reading, writing, math, and critical thinking are taught or reinforced in
courses across campus. The results of the Teaching and Reinforcement Survey are
shared with all faculty members in order to enhance course curriculum to address the
deficiencies revealed in the results of student assessments. The survey results also
provide the campus with valuable information that can be referenced to ensure that the
CAAP is administered to the appropriate student population. The most recent
administration of the survey was completed in May 2010 and there was no deployment of
the survey in 2011 or 2012.
A finding that was unique to the Teaching and Reinforcement Survey was that different
instructors of the same course had different views regarding the competencies that were
taught or reinforced in class. These results were distributed to the academic divisions
with a request for feedback. Other findings related specifically to the structure and form
of the survey instrument. Feedback from faculty members completing the survey noted
that competencies emphasized in the survey were not clearly defined. The lack of
semantic clarity is likely to have influenced the campus response. Based on the above
feedback, a modified survey design is being developed and will be tested prior to full
deployment.
In the fall of 2007, OSU – OKC was accepted into the Assessment Academy sponsored
by the Higher Learning Commission of the North Central Association. The expected
outcomes of our participation included:
Assessment becomes a valued and used process across campus to improve student
learning.
Data about our student learning is the primary consideration in all of our campus
decision making.
Assessment processes that are used on campus are appropriate to the instructional
delivery.
As part of the Assessment Academy Project, OSU-OKC worked to increase the quality,
type, and analysis of data captured in order to better understand the barriers to student
success in general education courses. From this project, the campus has adopted a
holistic approach to student assessment that is a product of measuring general education
outcomes combined with programmatic outcomes. It is important to note that two-year
degree seeking students taking their general education courses are simultaneously
engaged in their program specific coursework. This creates a situation whereby the mid-
level assessment of general education outcomes occurs at the same time as the program
outcomes assessment. As part of the Assessment Academy Project, the team worked to
create a cooperative alliance between general education faulty and program faculty to
ensure the proper assessment of general education competencies. Fall 2012, the campus
will complete the Assessment Academy Project and the team continues to sponsor several

14
faculty and staff development workshops to encourage dialogue between general
education and program faculty.
Section III – Program Outcomes
Administering Assessment
The following table outlines the reported outcome assessments for the 2011-2012
academic year. Assessments are listed by program.
Program Assessment Number Measured
HRT - CERT Final Exam 37
Turfgrass Mgmt Practical lab Final 11
Vet Tech Lab final practical Exam 39
Public Service Mediation Exercise 13
Technical Spanish Translation Exercise 8
Business Technology Business communication final 100
Health Care Administration
Internship Portfolio 50
Management Principles of Management final 189
Computer Information Systems
Class programming project 14
Information Technology Server operation system installation project
30
Technical Communications Final video project 13
Echo cardiology SON 2323 final exam 9
Nursing Clinical evaluation 128
Crime Victim Survivor Services
Occupational Proficiency Final Exam
7
Early Care Education Proficiency Project 19
Emergency Management Research project and presentation
18
Emergency Medical Services
Practical Exam 26
Municipal Fire Protection Firefighter I live burn 11
Police Science Role play scenario 74
The wide range of submitted program assessment reports convinced the OSU-OKC
Assessment of Student Learning Committee to review the 2010-2011 program
assessment of student learning report form as well as the curriculum used within the
series of assessment workshops provided to program department heads and lead faculty.
As a result, both process and forms were modified during the spring 2012 term. As a
result of the modifications, select 2011-2012 program student learning outcomes reports
were collected.
Analysis and Findings

15
Oklahoma State University requires that all academic programs conduct a formal
program outcome assessment to comply with the assessment mandates of the Oklahoma
State Regents for Higher Education, and the Higher Learning Commission. Each
academic unit files an assessment plan with the OSU-OKC Office of Academic Affairs.
The assessment plan defines and describes expected student learning outcomes for each
degree program, and the methods used to evaluate identified outcomes. Academic units
file an annual report with the Office of Academic Affairs describing its assessment
activity from the previous year. OSU – OKC is committed to using this data for
continuous program and institutional improvement.
Several examples of modifications as a result of annual assessment program reports
include:
Intensive curriculum and assessment strategies revisions within the nursing
program;
Realignment of police science curriculum with CLEET criteria; and
Adding a general education pre-requisite to a core course within the crime victim
and survivor services program.
The Office of Academic Affairs works closely with the campus assessment of student
learning committee and the Coordinator Assessment and Accreditation Compliance to
gather data on program outcomes assessment. From this work, each degree and
certificate program has 1) a set of individualized program outcome objectives that reflects
the skills and knowledge that faculty believe each program graduate should possess, 2) an
identified set of methods to assess these objectives such as examinations, capstone
courses and portfolios, and 3) an annual data report that provides faculty with an
opportunity to report and analyze the data obtained from assessment conducted in their
respective departments. Analyses of program outcomes are reported to the HLC
Assessment Academy, Assessment of Student Learning Committee, the Vice President
for Academic Affairs, and the Oklahoma State Regents of Higher Education.
Fall 2012, OSU – OKC will complete its final year of participation in the Assessment
Academy sponsored by the Higher Learning Commission. The Assessment Academy
work group is composed of campus faculty, division administrators and the Coordinator
of Assessment and Accreditation Compliance. Specific faculty and staff development
training sessions were scheduled and completed during the fall 2011 and spring 2012
semesters and summer 2012 term. During training sessions, faculty members were asked
to review existing program outcomes and re-evaluate the selected assessment methods to
ensure they remained relevant and appropriate. The Assessment Academy Team
continued to work with program administration and faculty to ensure that program
outcomes reflect the general education competencies that all OSU – OKC graduates
should possess. The continued implementation of the additional components to the list of
identified program outcomes will fulfill the project goal of the Academy team to integrate
mid-level outcomes assessment with program outcomes.

16
Each division has submitted its modified learning outcomes to the Assessment of Student
Learning Committee and has received constructive feedback. The committee evaluated
the divisional submissions according to how each identified and addressed measurable
learning outcomes.
Based on 2011 findings a number of process changes were made and implemented during
summer 2012 for the coming academic year; changes included:
A multi-day intensive training retreat moderated by outside statewide assessment
experts;
A clearly defined institutional statement was developed and shared illustrating the
importance of assessment to all campus decisions from academic to co-curricular
and operational functions;
Clarified timeline was communicated to administration and faculty of degree
programs that included assessment components from outcomes to measurement
tools culminating into a full assessment plan;
A series of training and development opportunities were provided to faculty that
focused on assessment that supported the new timeline expectations; and
Program Assessment Plan and Report templates were redesigned.
Section IV – Student Satisfaction
Administering Assessment
Over the past several years, OSU-OKC has developed a multi-tiered approach to measure
student satisfaction. OSU-OKC conducts Student Satisfaction surveys biennially with
the most recent survey conducted during the spring 2010 term. The survey is a product
of ACT and was administered to 240 students on campus. The selection of the student
sample was identified by division administrators contacting faculty members to
administer the survey via their classes. Each academic division was represented in
survey results. Within the survey, students were questioned regarding the quality of
services offered by OSU-OKC with responses rated from one to five, or very dissatisfied
to very satisfied. A rating of three indicated a neutral feeling. The results were then
scored by ACT and returned to campus. A secondary method utilized to measure student
satisfaction is the Graduating Student Survey. Regarding the timing of this survey,
students are assessed as they complete the application for graduation. This survey was
developed internally and is scored in a manner similar to that of the Student Satisfaction
Survey. A third survey instituted within the past several years is known as the post-
graduation survey. This survey is administered several months after a student graduates
from OSU-OKC and is designed to assess the student’s perception regarding the overall
institutional effectiveness of OSU-OKC. Similar to the satisfaction survey, the
graduation survey was developed internally and is scored in a similar manner. Each of
these surveys affords the institution the opportunity to measure student satisfaction at
different points in the student’s progression through the campus environment and beyond.

17
Analysis and Findings
The Student Satisfaction Survey administered in the spring 2010 term provided useful
data regarding student perception and satisfaction. Some of the more pertinent ratings
follow:
Parking received a 2.84 rating in 2010, down from a 2006 rating of 3.74. Making
it the lowest rated service in each survey. (Note: In response to the parking issue
identified in the student satisfaction survey, and other information, parking is currently
being addressed through the construction of a parking garage due to be complete by fall
2013.)
Veterans Services increased from a 3.85 rating in 2006 to 4.89 in 2010.
Areas receiving the highest rating in each section were:
Academics: Attitude of faculty towards students or class size
Admissions: College catalog
Rules and policies: Personal security or rules governing conduct
Facilities: General condition
Registration: Academic calendar
General: College in general
The next step in the process of measuring student satisfaction is to create a visual aid to
reflect trending from year-to-year that will for properly depict the results from each
annual administration of the survey. This trending can, over time, readily identify the
service areas of campus that are in need of improvement. The Student Satisfaction
survey was not deployed during the spring 2012 academic term as originally scheduled.
ACT no longer supports this specific form of student satisfaction assessment. OSU-OKC
is currently exploring other options to measure student satisfaction.
In reference to the Graduating Student Survey (GSS), data is captured and analyzed by
the Office of Institutional Grants and Research. The GSS was developed internally and is
scored in a manner similar to the Student Satisfaction Survey. The response scale is
based on values of one through four with one representing extreme dissatisfaction and
four representing extreme satisfaction. A neutral rating was not included. The GSS, a
method by which the campus can better assess overall effectiveness, is administered
several months following a student’s graduation. A question within the survey solicits a
response regarding how well students feel that OSU-OKC has prepared them for their
current employment. Preliminary results indicate a general satisfaction of students with
their educational experience.
Within the GSS, students are asked to provide the name and address of their employer so
that an employer survey can be sent for completion. Employers responding to the survey
indicate a satisfaction with their OSU- OKC educated employees. The employer survey
provides beneficial information to the institution regarding external perceptions of the
quality of OSU-OKC’s educational programming.

18
Ten years’ worth of data has been compiled and analyzed. Responses reflect general
satisfaction with instruction and services offered by OSU-OKC. Students have
consistently indicated a level of satisfaction with the level of instruction received, the
level of service provided by student support offices on campus, and a general level of
satisfaction with their experience at OSU-OKC. While the campus enjoys a positive level
of student satisfaction in most areas, campus parking has experienced a lower level of
student satisfaction as was reflected on the results of the Student Satisfaction Survey.
Usage of Results and Recommendations
New administration is carefully analyzing prior results and increased assessment methods
with the intent to better the campus. Prior assessments have already begun to be used.
For example, in response to the parking issue identified in the Student Satisfaction
Survey, and other information, parking has been addressed through the initiation of
construction a parking garage that is due to be completed by fall 2013.
The data will be continually and regularly reported to appropriate campus leaders. These
reports will give the individual department heads information as they evaluate provided
services and what changes should or could be made.
A note regarding the construction of internally developed surveys involves a finding that
not all of the surveys are scored the same. For instance, a ‘3’ value in the student
satisfaction survey is assigned a ‘neutral’ rating where it is assigned a ‘satisfied’ rating in
the graduating student survey. Issues with the construction of the surveys must be
considered when reviewing and attempting to compare the numeric responses.
One final point of analysis is the process of evaluating faculty through instructional
surveys. At least three classes taught by full time faculty are evaluated by students each
academic term. All classes of first time faculty, whether full time or adjunct, are
evaluated and at least one class taught by an adjunct faculty member is evaluated each
term. In addition, first time faculty members are evaluated at the mid-point of their first
term of teaching. This recently initiated evaluation is intended to give instructors more
‘real-time’ feedback as to what techniques are working for them and what areas may need
improvement. Numerical ratings are used with 1 being the lowest rating and 5 the
highest. The results from these surveys are shared with the appropriate lead instructors,
department heads, division heads and the Vice President for Academic Affairs and are
used, along with classroom observation, as a means to review faculty performance.
Divisional trending reports are assembled by the Coordinator of Assessment and
Accreditation Compliance. The reports are useful in determining whether or not any on-
going trends occur. Reports are shared on a term-by-term basis with academic division
leadership.
An example trending chart follows:
Institution-Wide Mean Ratings Spring Terms
Spring 2008
Spring 2009
Spring 2010
Spring 2011
Spring 2012

19
Q1 (implications and relevance)
4.58 4.56 4.53 4.55 4.56
Q2 (presents challenging material
well)
4.48 4.45 4.42 4.44 4.43
Q3 (encourages student
involvement)
4.69 4.66 4.63 4.66 4.64
Q4 (willing to help)
4.66 4.58 4.59 4.61 4.61
Q5 (interested in subject of
course)
4.77 4.70 4.68 4.69 4.69
Q6 (grade for instructor)
4.63 4.61 4.56 4.58 4.52
Q7 (student’s expected grade)
4.27 4.16 4.28 4.29 4.26
Similar charts exist at the academic division level. If negative trending on a specific
question is discovered, the data can be disaggregated all the way to the course and section
level with access to qualitative survey responses as well. Such trending and in-depth
study can have implications not just for student academic success and understanding, but
also for recruitment, retention, student support and student engagement initiatives.
Section V – Graduate Student Assessment
This section is not applicable to OSU-OKC.
3.00
3.50
4.00
4.50
5.00
Spring 2008 Spring 2009 Spring 2010 Spring 2011 Spring 2012
Me
an R
atin
g
Term/Year
Institution-Wide Mean Ratings Spring Terms
Q1
Q2
Q3
Q4
Q5
Q6
Q7

20
APPENDICES
21
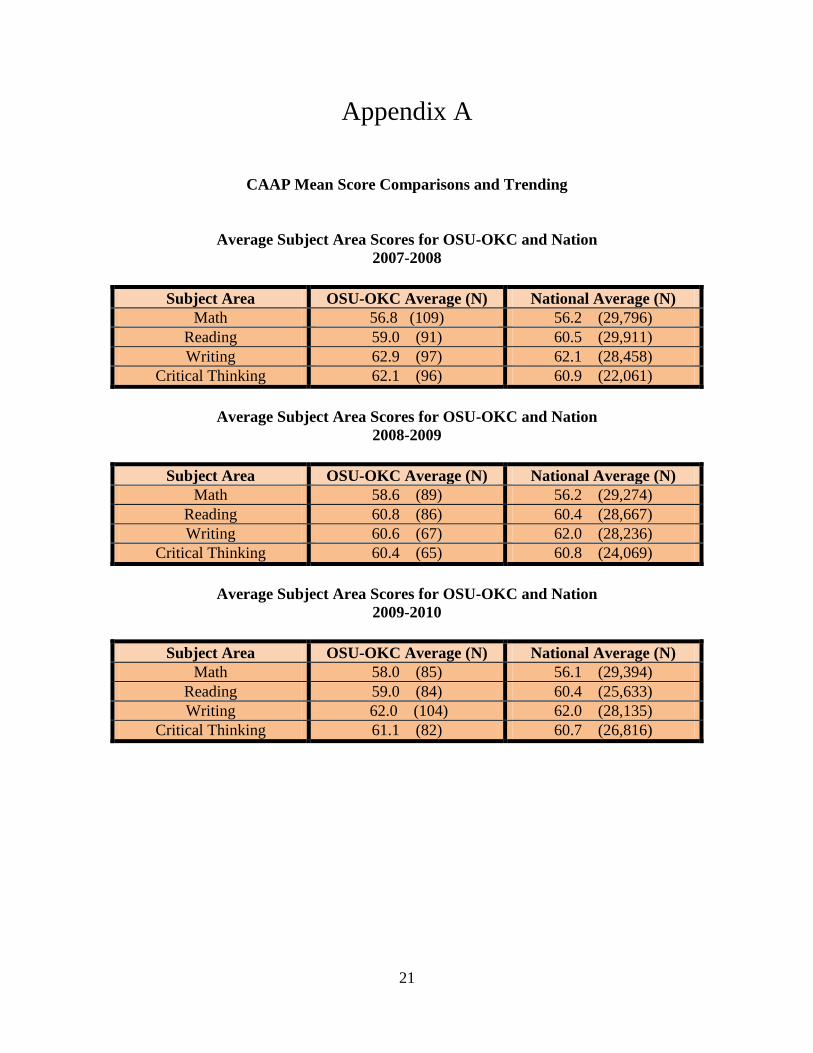
Appendix A
CAAP Mean Score Comparisons and Trending
Average Subject Area Scores for OSU-OKC and Nation
2007-2008
Subject Area OSU-OKC Average (N) National Average (N)
Math 56.8 (109) 56.2 (29,796)
Reading 59.0 (91) 60.5 (29,911)
Writing 62.9 (97) 62.1 (28,458)
Critical Thinking 62.1 (96) 60.9 (22,061)
Average Subject Area Scores for OSU-OKC and Nation
2008-2009
Subject Area OSU-OKC Average (N) National Average (N)
Math 58.6 (89) 56.2 (29,274)
Reading 60.8 (86) 60.4 (28,667)
Writing 60.6 (67) 62.0 (28,236)
Critical Thinking 60.4 (65) 60.8 (24,069)
Average Subject Area Scores for OSU-OKC and Nation
2009-2010
Subject Area OSU-OKC Average (N) National Average (N)
Math 58.0 (85) 56.1 (29,394)
Reading 59.0 (84) 60.4 (25,633)
Writing 62.0 (104) 62.0 (28,135)
Critical Thinking 61.1 (82) 60.7 (26,816)

22
Average Subject Area Scores for OSU-OKC and Nation
2010-2011
Subject Area OSU-OKC Average (N) National Average (N)
Math 58.2 (77) 56.1 (26,973)
Reading 59.7 (54) 60.3 (22,436)
Writing 60.4 (76) 61.8 (25,721)
Critical Thinking 60.3 (91) 60.7 (26,264)
Average Subject Area Scores for OSU-OKC and Nation
2011-2012
Subject Area OSU-OKC Average (N) National Average (N)
Math 58.4 (81) 56.2 (28,323)
Reading 59.7 (70) 60.2 (20,391)
Writing 60.8 (74) 61.6 (26,248)
Critical Thinking 59.3 (80) 60.6 (26,430)
Comparison Graphs
The following are four line graphs, one for each subject area, which map and
compare the trend of OSU-Oklahoma City scores as compared to the national norms.
60.6
62.0
60.4 60.8
61.8
55.0
57.0
59.0
61.0
63.0
65.0
2008-2009 2009-2010 2010-2011 2011-2012 2012-2013
Me
an S
core
s
Academic Year
CAAP Writing Scoring Trend Fall Terms 2008-2012
OSU-OKC vs. National Means
OSU-OKC
National

23
60.4
61.1
60.3
59.3 60.0
55.0
57.0
59.0
61.0
63.0
65.0
2008-2009 2009-2010 2010-2011 2011-2012 2012-2013
Me
an S
core
s
Academic Year
CAAP Critical Thinking Scoring Trend Fall Terms 2008-2012
OSU-OKC vs. National Means
OSU-OKC
National
58.6 58.0 58.2 58.4
56.2 56.1 56.1 56.2 55.0
57.0
59.0
61.0
63.0
65.0
2008-2009 2009-2010 2010-2011 2011-2012
Me
an S
core
Academic Year
CAAP Math Scoring Trend Fall Terms 2008-2012
OSU-OKC vs. National Means
OSU-OKC
National

24
.
59.0
60.8
59.0 59.7 59.7
60.5
60.4
60.4 60.3 60.2
55
57
59
61
63
65
2007-2008 2008-2009 2009-2010 2010-2011 2011-2012
Me
an S
core
Academic Year
CAAP Reading Scoring Trend Fall Terms 2008-2012
OSU-OKC vs. National Means
OSU-OKC
National

25
Appendix B
COMPASS RESULTS JUNE 2011 – JUNE 2012
Student enrollment based on web-based COMPASS results
READING Placements
ICSR 0033-Reading College Prep I 683
ICSR 0133-Reading College Prep II 970
No Developmental Courses Needed 1699
WRITING
ICSW 0033-Developmental Writing 740
ICSW 0123-Basic Composition 1051
ENGL 1113-English Composition 831
MATHEMATICS
ICSM 0103-Pre-Algebra 1684
ICSM 0123-Introductory Algebra 857
ICSM 0213-Intermediate Algebra 259
MATH 1513-College Algebra 29
MATH 1613-Trigonometry 37
Total placements 8840

26
Appendix C
Example Trending Chart for OSU-OKC From Graduate Student Survey Report
OSU-OKC Services part II
2006-2007
2007-2008
2008-2009
2009-2010
2010-2011
2011-2012
Library 3.56 3.48 3.62 4.30 4.29 4.17
Student activities 3.48 3.31 3.55 4.23 4.29 4.17
Student Parking 3.03 2.93 3.24 3.23 3.16 3.66
The Learning Center
3.54 3.39 3.44 4.25 4.21 4.25
Wellness Center 3.62 3.41 3.60 4.34 4.22 4.47
Note: Scale is from 1-5 with 1 most negative and 5 most positive.
2
2.5
3
3.5
4
4.5
5
Library
Student activities
Student Parking
The Learning Center
Wellness Center

27
Appendix D
Sample charts from Post-Graduate and Employer Survey Report
64
87
71 73
21 19
38
23
0 0
10 12
2006-2007 N=85 2007-2008 N=106 2008-2009 N=119 2009-2010 N= 108
Is Employment Related to Degree Program Yes No N/A
24
29
13
27
0 0 0 0
2006-2007 N=26 2007-2008 N=29 2008-2009 N=13 2009-2010 N=27
Would Employer Hire More OSU-OKC Grads?
Yes No