
Oklahoma State University © Copyright 2003 by Gregory H. Watson. All rights reserved. 1 Quality...
63
1 Oklahoma State University © Copyright 2003 by Gregory H. Watson. All rights reserved. Quality Function Deployment as a Strategic Tool tructor: Gregory H. Watson roduction to Strategy, Technology and Integration 5111 – Summer 2003 sion 3 – Part 3
-
Upload
jonas-nicholson -
Category
Documents
-
view
213 -
download
0
Transcript of Oklahoma State University © Copyright 2003 by Gregory H. Watson. All rights reserved. 1 Quality...
1
Oklahoma State University© Copyright 2003 by Gregory H. Watson. All rights reserved.
Quality Function Deployment as a Strategic Tool
Instructor: Gregory H. WatsonIntroduction to Strategy, Technology and IntegrationETM 5111 – Summer 2003Session 3 – Part 3

2
Oklahoma State University© Copyright 2003 by Gregory H. Watson. All rights reserved.
What is QFD?
Quality Function Deployment (QFD) – a detailed system to translate the needs of customers into product design requirements. QFD also translates design requirements into component parts and processes for producing them.
QFD provides a systematic way to record agreements on the means to satisfy high priority customer requirements through the design of the core product, its extended product and the production process. It is a powerful design and documentation tool for recording product-level decisions about customer needs, design rules, competitive positioning, requirements for quality for suppliers as well as requirements of the production process. QFD enables product design teams to prioritize these competing needs, develop innovative responses, and orchestrate successful cross-functional efforts to meet these needs.
Quality Function Deployment

3
Oklahoma State University© Copyright 2003 by Gregory H. Watson. All rights reserved.
QFD Records Customer-Related Data:
QFD records data from all customer segments in the design process and shows how it translates into product design, part production and final assembly.
Quality Function Deployment
Cu
stom
er
Req
uir
em
en
ts(W
HA
T’s
)
Functional Requirements(HOW’s)
Houseof
Quality# 1
Fun
ctio
nal R
eq
uir
em
en
ts(W
HA
T’s
)
Part Characteristics(HOW’s)
Houseof
Quality# 2
Part
Ch
ara
cteri
stic
s(W
HA
T’s
)
Manufacturing Processes(HOW’s)
Houseof
Quality# 3
Key P
roce
sses
(WH
AT’s
)
Process Variables(HOW’s)
Houseof
Quality# 4
Key Design
ParametersKey
Production
Processes
KeyProcess
VariablesDesignData
Key Market
Requirements
MarketData
ProcessData
PartData
Connecting the “voice of the customer” with the “voice ofthe process”.

4
Oklahoma State University© Copyright 2003 by Gregory H. Watson. All rights reserved.
Good Design Tracks Customer Issues:Define how the company’s product line addresses market requirements.
Technical or Business Process Requirements
Mar
ket
Seg
men
t
Cu
sto
mer
Cat
ego
ry
Cu
sto
mer
Iden
tifi
cati
on
Vo
ice
of
the
Cu
sto
mer
Kan
o F
eatu
re D
esig
nat
or
Business Requirements(Voice of the Shareholder)
Cu
stom
er Co
mp
laints
Cu
stom
er Satisfactio
n
Cu
stom
er Imp
ortan
ce
Co
mp
etitive Featu
re An
alysis
Alignment MatrixCustomer-to-Business
RequirementsNeed -- Do
Relationships
Relationship Strong Moderate WeakWeight 9 3 1
Symbol

5
Oklahoma State University© Copyright 2003 by Gregory H. Watson. All rights reserved.
QFD supports product line management:
Customer
Input
Supplier
Output
LevelA
LevelB
LevelC
Product Life CycleOperating
System

6
Oklahoma State University© Copyright 2003 by Gregory H. Watson. All rights reserved.
Customer-focused approach to design:
• What is the best way to integrate these ideas and develop a balanced design that satisfies these, often conflicting, requirements?
The Kano model of customer requirements for delivery of quality
Quality Function Deployment (QFD) as a tool for program management and documentation of progress
7
Oklahoma State University© Copyright 2003 by Gregory H. Watson. All rights reserved.
QFD listens to the “voice of the customer”:
• Prioritize important from mundane product requirements.• Divide generic features from special features (functions).• Differentiate the value of various product features.• Establish target values for product functions.• Identify the critical part parameters for process control.• Plan the process characteristics for production of parts.• Set supplier requirements for manufacturing.• Link with work instructions and operating specifications.• Determine the training requirements for workers.

8
Oklahoma State University© Copyright 2003 by Gregory H. Watson. All rights reserved.
Voice of the Customer -- Input for QFD
All customer segments are represented: all of the major, targeted consumer and distribution segments, as well as internal customers of the design (e.g., product marketing and design engineering).
Customer product preference survey results. Customer satisfaction survey results. Customer complaints, suggestions, and concerns. Customer warranty information from field service. Customer focus group findings. Competitive product analysis. Product teardown analysis. Product pricing study results.
9
Oklahoma State University© Copyright 2003 by Gregory H. Watson. All rights reserved.
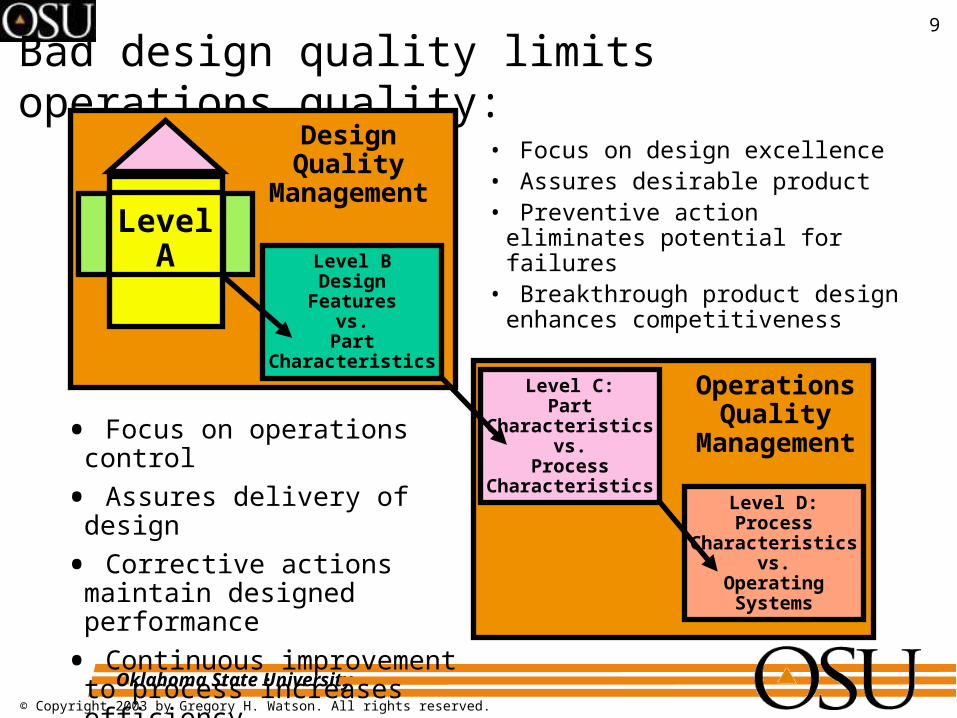
Bad design quality limits operations quality:
• Focus on design excellence• Assures desirable product• Preventive action eliminates
potential for failures• Breakthrough product design
enhances competitiveness
• Focus on operations control
• Assures delivery of design
• Corrective actions maintain designed performance
• Continuous improvement to process increases efficiency
Level BDesign
Featuresvs.
PartCharacteristics
Level C:Part
Characteristicsvs.
ProcessCharacteristics
Level D:Process
Characteristicsvs.
OperatingSystems
LevelA
OperationsQuality
Management
DesignQuality
Management
10
Oklahoma State University© Copyright 2003 by Gregory H. Watson. All rights reserved.
Design quality management:
• Goal is to gain market share in targeted profitable segments• Assures desirable product delivered to the market place• Management sets target date for product launch• Excellent measurement capability essential to results• People monitor critical parameters to assure robust design• Emphasis on time-to-market for sales opportunity window• Standard for outcome evaluation: profitable market share• Improvement delivers better features or more reliable design• Responsibility for execution excellence pushed to suppliers• Tools of operations quality management:
Value Engineering Project Management
Reliability Engineering Six Sigma Statistical Tools

11
Oklahoma State University© Copyright 2003 by Gregory H. Watson. All rights reserved.
Operations quality management:
• Goal is delivery consistency of excellent outcomes• Assures delivery of “designed-in” quality performance• Management sets targets to define “operational excellence”• Excellent measurement capability essential to results• People monitor processes to assure conformance to targets• Emphasis on rapid turnaround for problem correction• Standard for outcome evaluation: customer perception• Improvement focuses on cost reduction or process stability• Responsibility for execution pushed to the lowest level• Tools of operations quality management:
Problem Solving Process Meeting Management
Process Management Inspection and Testing

12
Oklahoma State University© Copyright 2003 by Gregory H. Watson. All rights reserved.
Satisfying customer needs through design:
Product planning and value engineering must go hand-in-handin order to deliver customer requirements at a reasonable cost.
QFD translates thevoice of customersinto the languages of processes and products.
ProductPlanning
ProductDesign
ProcessDesign
ProductionProcess
ReliabilityEngineering
ValueEngineering
TechnologyReadiness
QFD
CustomerFocus
13
Oklahoma State University© Copyright 2003 by Gregory H. Watson. All rights reserved.
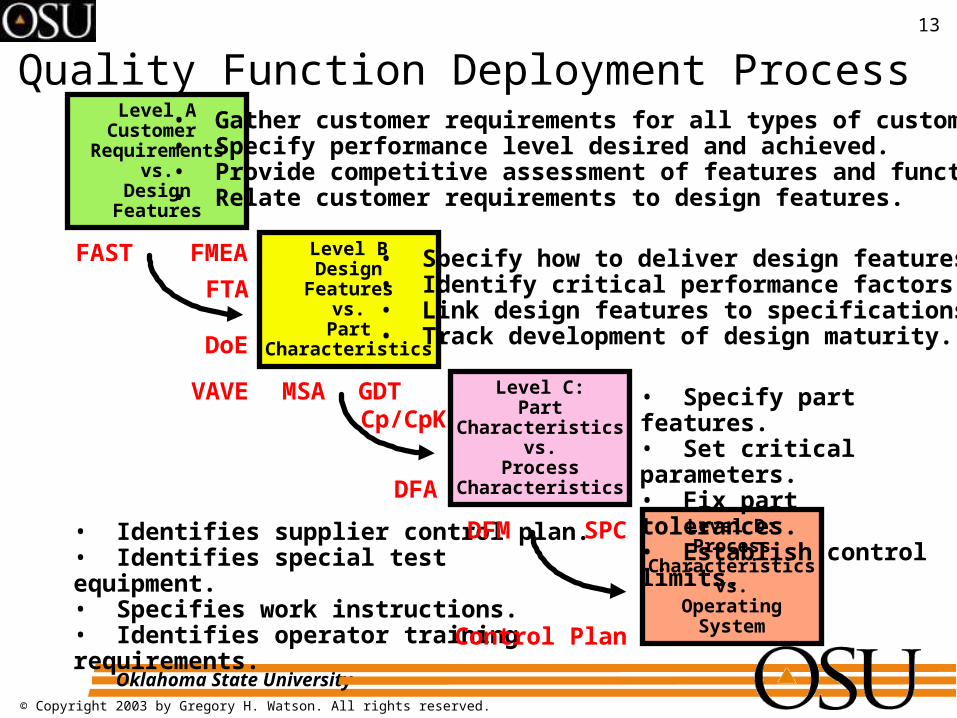
Quality Function Deployment ProcessLevel A
Customer Requirements
vs.Design
Features
Level BDesign
Featuresvs.
PartCharacteristics
Level C:Part
Characteristicsvs.
ProcessCharacteristics
Level D:Process
Characteristicsvs.
OperatingSystem
• Gather customer requirements for all types of customers.• Specify performance level desired and achieved.• Provide competitive assessment of features and functions.• Relate customer requirements to design features.
• Specify how to deliver design features.• Identify critical performance factors.• Link design features to specifications.• Track development of design maturity.
• Specify part features.• Set critical parameters.• Fix part tolerances.• Establish control limits.
• Identifies supplier control plan.• Identifies special test equipment.• Specifies work instructions.• Identifies operator training requirements.
SPC
DoE
Cp/CpKVAVE
FMEAFAST
FTA
GDT
DFM
DFA
MSA
Control Plan

14
Oklahoma State University© Copyright 2003 by Gregory H. Watson. All rights reserved.
Methods associated with QFD:
• FAST - Function Analysis System Technique• FMEA - Failure Mode Effects Analysis• FTA - Fault Tree Analysis• DoE - Design of Experiments• VAVE - Value Analysis/Value Engineering• MCA - Measurement Capability Analysis• GDT - Geometric Dimensioning and Tolerancing• CpK - Process Capability Study• DFA - Design for Assembly• DFM - Design for Manufacturing• SPC - Statistical Process Control• CPR - Cost Price Ratio• CPM - Customer Process Matrix

15
Oklahoma State University© Copyright 2003 by Gregory H. Watson. All rights reserved.
QFD and related product documentation:Level A
Customer Requirements
vs.Design
Features
Level BDesign
Featuresvs.
PartCharacteristics
Level C:Part
Characteristicsvs.
ProcessCharacteristics
Level D:Process
Characteristicsvs.
OperatingSystem
• Market launch plan.• Product advertising literature and customer fact sheets.• Customer satisfaction survey questionnaire.• Product level quality plan.
• Product design specification.• Part design drawings.• Receiving inspection plans.• Product and part level test plans.
• Component quality plan.• Process control plan.• Work instructions.• Training schedule.
• Process control equipment specifications.• Test equipment specifications.• Information system requirements.• Production maintenance requirements.

16
Oklahoma State University© Copyright 2003 by Gregory H. Watson. All rights reserved.
Voice of the process: QFD output
• Critical part parameters.• Measurement capability requirements.• Part characteristics testing requirements.• Material testing requirements.• Process control requirements.• Test equipment requirements.• Operator training requirements.
Most engineers would provide this information as part oftheir product development process. QFD assures that itis linked to the customer requirements that identify a needfor performance and makes explicit any trade-offs that arerequired in potential areas of conflict between customerneeds and design implementation.
Critical design question: what do we need to know? Afew of the answers include:

17
Oklahoma State University© Copyright 2003 by Gregory H. Watson. All rights reserved.
QFD provides:
• Identification of product features and source of the stated requirements.• Comparison of features with competitive products.• Rating of the importance of the features to customers.• Comparison of the projected performance levels to current performance.• Comparison of customer requirements with product features.• Specification of the technological limits of product features.• Identification of interactions among design components.• Factorial analysis of product elements of a designed experiment.• Specification of critical parameters for testing.• Support for process capability studies and statistical control parameters.• Linkage of product requirements to manufacturing control methods.• Linkage to supplier control plans and testing procedures.• Identification of design elements on the project critical path.• Linkage to specification documents and product bill of materials.• Means for recording the progress of the program’s design.

18
Oklahoma State University© Copyright 2003 by Gregory H. Watson. All rights reserved.
QFD level “A” matrix
1. Customer needs organized by targeted market segments.
2. Customer importance rankings.
3. Design features that address the identified customer requirements.
4. Interactions among design issues and requirements.
5. Technical requirements for each design requirement.
6. Product features analysis.
7. Product requirements analysis.

19
Oklahoma State University© Copyright 2003 by Gregory H. Watson. All rights reserved.
Customer needs by market segment:
• Customer requirements are statements of need that are recorded in the “voice (actual words) of the customer.”
• Requirements should be grouped by the source of the customer information (typically by major customer segment) as well as the criteria used to choose the product in a competitive procurement.
• Customer identification should include the market segment targeted (such as distribution channel, internal functional organization) and the level of the person who is providing the comment (such as decision-maker, buyer, user, or internal positions like product design engineer, product marketing engineer, etc.).
QFD Level “A” Matrix
WHAT?

20
Oklahoma State University© Copyright 2003 by Gregory H. Watson. All rights reserved.
Customer importance ratings:
• In the column next to customer requirements the importance ratings by the customer are recorded.
• Customers evaluate the importance of each product requirement using a scale - where 1 is low and 10 is high - to indicate the relative importance of each feature that they specify.
• These importance ratings are usually done during a customer focus group or taken from a product preference survey which also solicits “needs.”
• Customer importance ratings are also paired with competitive comparisons that are reported in section 6.
QFD Level “A” Matrix
WHY?

21
Oklahoma State University© Copyright 2003 by Gregory H. Watson. All rights reserved.
Customer needs and importance ratings:
• Customer needs answer the basic question: “What does this specific customer want?”• Customer needs alsohumanize the technological emphasis of designers by personalizing the voiceof the customer for each of the different categories or types of customers.• Generic buying criteria are used to group all data from market segments to more clearly identify why customers want each of their requests and what specifically will satisfy this request.
Purchase Criteria Customer Exact Customer ImportanceGeneral Specific Mkt Type Comments Rating
How canI use theproduct?
ProductAvailability
ProductReliability
ServiceQuality
Support Quality
Innovation
Cost

22
Oklahoma State University© Copyright 2003 by Gregory H. Watson. All rights reserved.
Design features and functionality:
• In order to meet a customer need -- whether it is spoken by an external or internal customer -- the team must initiate a product requirement which will become a feature of the design.
• Design features should be grouped according to functional concept in order to identify sets of functions that will become a sub-assembly or module with related functionality.
• Design features imply functionality in the final product. Using the FAST methodology, a team can determine the specific functional requirements of each feature as well as logical relationships among design features.
QFD Level “A” Matrix
HOW?

23
Oklahoma State University© Copyright 2003 by Gregory H. Watson. All rights reserved.
Interactions among design features:• In many products, functions of some design
features may interact to some degree with other features. This interaction may cause problems in the design and implementation of the product or offer opportunities for more efficient designs by integrating these features. It is always helpful to identify what features have positive or negative inter-relationships.
• An arbitrary scale is used to rate the degree of relationship between the specified features:
+ 9 = strong positive,
+ 3 = weak positive,
0 = no apparent relationship
- 3 = weak negative, and
- 9 = strong negative.• A way to develop suspicions for hypotheses.
QFD Level “A” Matrix
WHY NOT?

24
Oklahoma State University© Copyright 2003 by Gregory H. Watson. All rights reserved.
Design features and functional interactions:
• Relationships among features and functions are shown in the top graph diagram and the strength of each pair of relationships is also indicated.
Feature
A
Feature
B
Feature
C
Feature
D
Feature
E
Feature
F
Feature
H
Feature
I
Function 1 Function 2 Function 3ProductFunctions
DesignFeatures
Feature
G
9
3
9
- 3- 9
- 3 9 3 9 9 3
33
- 3- 3
9
933
9
9
- 9
3

25
Oklahoma State University© Copyright 2003 by Gregory H. Watson. All rights reserved.
Technical requirements of design features:
• Defines “how much” -- or the magnitude of the design features. Specific rows will include the following information:
• Target values of design features
• Competitive comparison of values
• Trends in performance improvement
• Physical limits of performance
• Field service return information
• Special technical requirements
• Applicable government standards
• Applicable industry standards
• Applicable environmental standards
• Applicable safety standards
QFD Level “A” Matrix
HOW MUCH?

26
Oklahoma State University© Copyright 2003 by Gregory H. Watson. All rights reserved.
Technical product requirements:• Specified technical product
requirements include those characteristics like competitive performance, process control data, field failure data, performance limits due to physics, and information about standard levels of performance or product requirements.
• The relative importance of each design requirement is given by the sum of each column’s design feature-to-customer requirement indicators multiplied by its importance weight.
• Potential safety hazards and environmental effects are also flagged.
Importance WeightRelative ImportanceCurrent ValueTechnical Comparison
Best InternalCompetitor ACompetitor BCompetitor C
Performance Limit Improvement AvailableTarget Value for FeatureParameter Control MethodProcess Control PointService Information
Field Failure RateProduct Returns Complaints
Special Technical DataGovernment StandardsIndustry StandardsCompany StandardsPotential Safety HazardsEnvironmental Impact

27
Oklahoma State University© Copyright 2003 by Gregory H. Watson. All rights reserved.
Product features analysis:
• The competitive information contained in the competitive product analysis section of the QFD table is a compilation of data from sources like the marketing Strength-Weakness- Opportunity-Threat (SWOT) analysis and product teardown (reverse engineering). This answers the question who does this best?
• In addition to this SWOT analysis, one column is used to indicate the type of requirement that has been stated as the voice of the customer using the three levels of performance described by the Kano Model where:
2 = Leadership level,
1 = Competitive level, and
0 = Standard level of performance.
QFD Level “A” Matrix
WHO?

28
Oklahoma State University© Copyright 2003 by Gregory H. Watson. All rights reserved.
Competitive product analysis – 1:• A five point scale is used in this analysis
to indicate the perceived degree of competitive advantage for customer requirements differences of one point or less are not usually discernable to customers; however, a difference of two or more points is noticed by customers.
• Competitive products that have a two point or more advantage in requirements judged by external customers as very important, can make a recognized sales claim in their product advertising which customers will acknowledge as valid.
• Assessments against the top three competitive products are presented in a head-to-head analysis for each critical customer requirement (also a technical analysis comparing the relative feature performance for competing products is presented in section 5 QFD A matrix).
Degree of Current Planned Sales GainImportance Level Level Point Ratio
Us A B C Us A B C

29
Oklahoma State University© Copyright 2003 by Gregory H. Watson. All rights reserved.
Competitive product analysis – 2:
Feature 1Feature 2Feature 3...Feature n
1 2 3 4 5CompetitiveFeatures
Own Company
Main Competitor
A one point rating difference is perceivable by customers. This means that whenever a one point difference is achieved, then that feature may be used to differentiate a product. This type of feature may become a ‘sales point’ if the value perceived by customers is significant.

30
Oklahoma State University© Copyright 2003 by Gregory H. Watson. All rights reserved.
Competitive product analysis – 3:• Competitive product analysis is an
ratio of the relative improvement in the new design feature over the best performance in a competitive product feature.
• The planned improvement ratio is own company planned level of performance divided by projected competitive performance gain.
• The Kano performance weight is assessed for one of 3 capability levels: Leadership = 2, Competitive = 1 and Standard = 0.
• The Relative Importance is the sum of the row’s customer requirements multiplied by the product of the Planned Improvement Ratio and Kano Performance Factor, normalized to 100%.
CompetitiveProductAnalysis
PlannedImprovement
Ratio
KanoPerformance
Weight
RelativeImportance

31
Oklahoma State University© Copyright 2003 by Gregory H. Watson. All rights reserved.
Product requirements analysis:• At the intersection of each and row (customer
requirements) and each column (design features) the cell is used to indicate the strength of the relationship between these factors.
• The strength of the relationship is indicated by a forced weighting scale where Strong = 9, Moderate = 3 and Weak = 1. A solid circle is often used to indicate a strong relationship, an open circle usually represents the moderate relationship and an open triangle indicates weak relationships.
• If more than 50% of the cells have some relationships, then the level of detail in customer requirements or in the design features is too great.
QFD Level “A” Matrix
WHAT vs. HOW

32
Oklahoma State University© Copyright 2003 by Gregory H. Watson. All rights reserved.
Policy Deployment & the Process of Management
Instructor: Gregory H. WatsonIntroduction to Strategy, Technology and IntegrationETM 5111 – Summer 2003Session 3 – Part 3

33
Oklahoma State University© Copyright 2003 by Gregory H. Watson. All rights reserved.
Competitive product line analysis:
Product A
Product D
Dimensions of product line competitiveness.
Relative market share and revenue ranking for leading head-to-head competitors.1
2
3
5
6
This ‘war map’ compares a company’s product line to the market share of the dominant participants in its market. Based on this analysis, the company can choose where it should best allocate its resources across the product lines to meet its top priority strategic objectives.
34
Oklahoma State University© Copyright 2003 by Gregory H. Watson. All rights reserved.
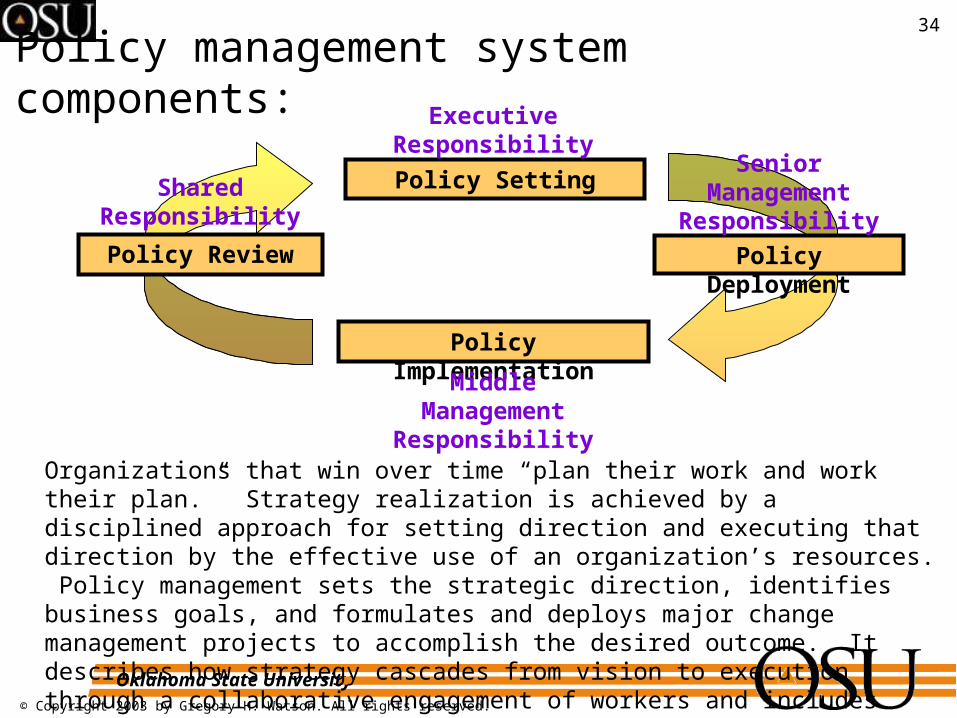
Policy management system components:
Policy Setting
Policy Deployment
Policy Implementation
Policy Review
ExecutiveResponsibility
SeniorManagementResponsibility
SharedResponsibility
MiddleManagementResponsibility
Organizations that win over time “plan their work and work their plan.” Strategy realization is achieved by a disciplined approach for setting direction and executing that direction by the effective use of an organization’s resources. Policy management sets the strategic direction, identifies business goals, and formulates and deploys major change management projects to accomplish the desired outcome. It describes how strategy cascades from vision to execution through a collaborative engagement of workers and includes feedback communication details such as performance self-assessment and management review.

35
Oklahoma State University© Copyright 2003 by Gregory H. Watson. All rights reserved.
Measurement linkage aligns action on policy:
Objectives cascade & performance targeting negotiation process:
Strategic Plan
Annual Plan
Business Fundamentals
Implementation Plan
Measurem
ent
Line of Sight
BusinessMeasurement
System
Policy Deployment includes:
Targets Means to achieve targets Measures of performance
36
Oklahoma State University© Copyright 2003 by Gregory H. Watson. All rights reserved.
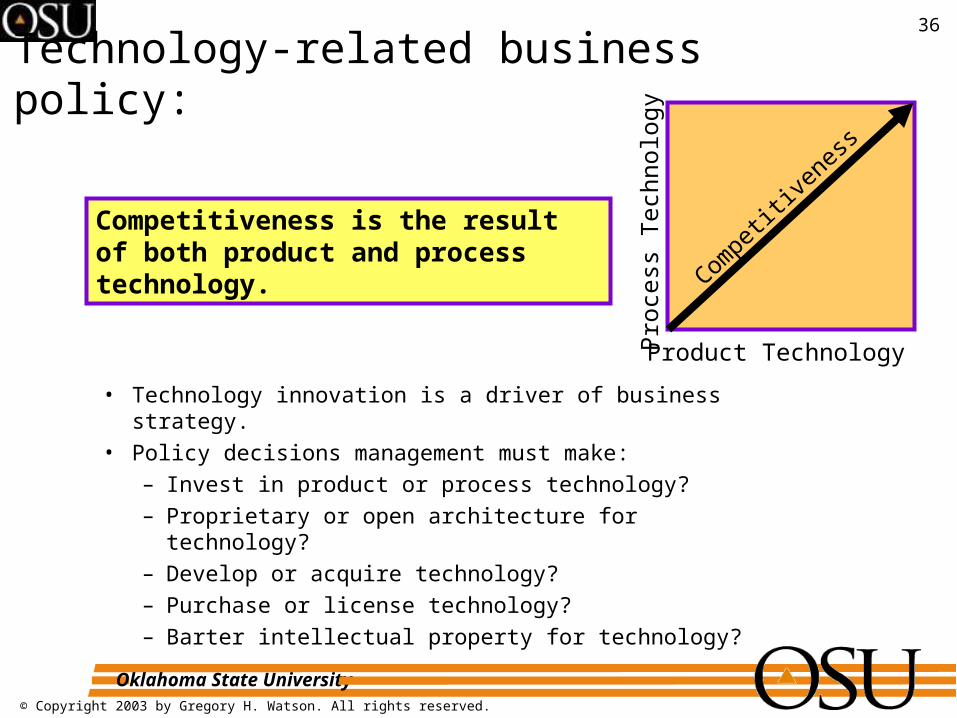
Technology-related business policy:
• Technology innovation is a driver of business strategy.• Policy decisions management must make:
– Invest in product or process technology?– Proprietary or open architecture for technology?– Develop or acquire technology?– Purchase or license technology?– Barter intellectual property for technology?
Compe
titive
ness
Product Technology
Pro
cess
Tec
hnol
ogy
Competitiveness is the result of both product and process technology.

37
Oklahoma State University© Copyright 2003 by Gregory H. Watson. All rights reserved.
Technology implementation mapping:
Technology 1Technology 2Technology 3
.
.
.Technology n
Product A Product B Product C … Product I
Time-Phased
Technology 1Technology 2Technology 3
.
.
.Technology n
Process A Process B Process C … Process I
Time-Phased
To maximize competitiveness balance product and process technology investments.
What is the best sequence in which to introduce new product and process technology?

38
Oklahoma State University© Copyright 2003 by Gregory H. Watson. All rights reserved.
Managing the product concept trade-offs:
• Good engineering is the result of smart trade-offs.• Smart trade-offs require accurate evaluation of priorities and value.• Smart trade-offs are not about either/or but about how much should
be invested in time, cost, functions/features and performance• Major conflicting factors not only conflict among themselves, but
within a major conflicting factor, sub-factors may also conflict (i.e., speed and heat).
• Each potential conflict should not be specified as a point but as a window with a target and a threshold amount.
• Value of a factor increases once its window “threshold” is crossed.• No value is accrued until the window “threshold” is crossed.• Failure to cross one of the major factor “thresholds” usually means
a failed product.• Remember the golden rule of trading: Everything costs something!

39
Oklahoma State University© Copyright 2003 by Gregory H. Watson. All rights reserved.
Business impact of technology strategy:
CorporateKnowledge
ExploratoryResearch
ResearchFunding
Allocation
TechnologyPortfolioAnalysis
BusinessCase
NewVenture
New Field (Expanded
Market)
TechnologyStrategy
TechnologyForecast
NEW
PROJECTS“All change happens one project at a time and in no other way.”
~ Dr. Joseph M. Juran

40
Oklahoma State University© Copyright 2003 by Gregory H. Watson. All rights reserved.
Technology portfolio analysis:
Relative Technology Market Advantage
Imp
ort
an
ce o
f Tec
hno
logy
in M
ark
et High
Low Low High
Commit Resources
Milk theCash Cow
Develop ExitStrategy
Create StrategicTechnology
Alliances
Analysis of the corporate technology portfolio must assess the current state of technology knowledge, the development strategy for acquisition or pursuit of advanced technology, and the forecast of next technological advances and rank these according to their importance to the market and organization’s relative technology lead over its competitors to determine the appropriate strategy.

41
Oklahoma State University© Copyright 2003 by Gregory H. Watson. All rights reserved.
Relative product position and attractiveness:
Business Assessment Technical Assessment
Competitive Position
Bus
ines
s P
rofit
Pot
entia
l
High
Low Low High
Commit Resources
Milk theCash Cow
Develop ExitStrategy
Create StrategicTechnology
Alliances
Competitive Position
Impo
rtan
ce o
f T
echn
olog
y
High
Low Low High
DevelopTechnology
MaintainAdvantage
MinimizeTechnology
SourceTechnology
Two perspectives are necessary to see clearly:

42
Oklahoma State University© Copyright 2003 by Gregory H. Watson. All rights reserved.
Business dimensions to add technical value:Business Value-Adding Chain
Input Operations Output Sales Service
Technology Value-Adding Opportunities:
•Supplier Communication
•Material Handling Technology
•Storage Technology
•Testing Technology
•Information System Technology
•Manufacturing Technology•Materials Technology•Machine Tool Technology•Packaging Technology•Maintenance Technology•Testing Technology•Information System Technology
•Distribution System Communication
•Material Handling Technology
•Packaging Technology
•Testing Technology
•Information System Technology
•Media Technology
•Communication System Technology
•Sales Point Technology
•Information System Technology
•Service Notice Communication
•Diagnostic Testing Technology
•Information System Technology

43
Oklahoma State University© Copyright 2003 by Gregory H. Watson. All rights reserved.
Project criteria: Technology push or market pull?
Technology Alignment
Ma
rke
t Alig
nm
ent
High
Low Low High
“Star” Quality Project
TechnologyPush
Non-Competitive
MarketPull
Criteria for evaluating new product development projects should include both an assessment of market alignment (or how close is it to what the customer wants) and technology alignment (or how close to the leading technology edge is the new product in terms of customer-recognizable technology). Star projects win because they are strong in both market and technology dimensions.

44
Oklahoma State University© Copyright 2003 by Gregory H. Watson. All rights reserved.
Designing a revolution or an evolution?
Revolution – First of Class Products• Start-up markets • Start-up companies• Breakthrough technology
• The choice of type, amount and rate of technology transition and innovation introduced in each product is the critical responsibility of the R&D manager and may be incorporated into the product design rules.
• Need to take into consideration many factors presented in the following table and chart.
• Too little or too much, too fast or too slow at the wrong time can be devastating.
• The right choice can mean success!• Bottom line: “Do what’s Prudent”
Evolution – Variant Products•Established markets•Established companies•Established volume products

45
Oklahoma State University© Copyright 2003 by Gregory H. Watson. All rights reserved.
Making the right design choices: Revolution Evolution
Start-up Transition Matured
Innovation stimulated by:
Product function / performance
Product variations
Cost & quality improvement
Predominanttype of innovation
Major product changes Major processfor volume
Incrementalproduct,cost & quality
Product line Diverse / custom One product with volume
Standard products
Production Process
Flexible, easy change Controlled changes
Efficient butchange hard
Equipment General purposeskill labor
Semi-automated High- automation,minimum labor
Materials Industry available Specialized Specialized, vertical integration
Plant Small scale General purpose Large scale, product specific
Management Informal, entrepreneurial
Project / task groups
Formal, structure, rules
46
Oklahoma State University© Copyright 2003 by Gregory H. Watson. All rights reserved.
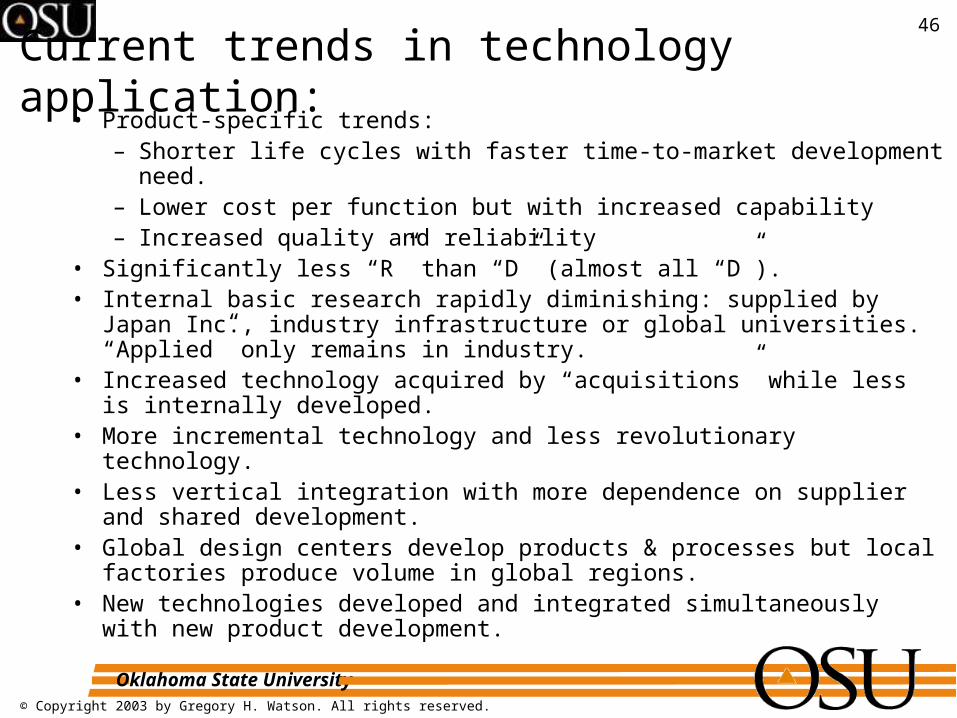
• Product-specific trends:– Shorter life cycles with faster time-to-market development need.– Lower cost per function but with increased capability– Increased quality and reliability
• Significantly less “R” than “D” (almost all “D”).• Internal basic research rapidly diminishing: supplied by Japan Inc.,
industry infrastructure or global universities. “Applied” only remains in industry.
• Increased technology acquired by “acquisitions” while less is internally developed.
• More incremental technology and less revolutionary technology.• Less vertical integration with more dependence on supplier and shared
development.• Global design centers develop products & processes but local factories
produce volume in global regions.• New technologies developed and integrated simultaneously with new
product development.
Current trends in technology application:

47
Oklahoma State University© Copyright 2003 by Gregory H. Watson. All rights reserved.
Where does technology come from?
InternalSources
Testing Labs
Consultants
Suppliers
Universities SpecializedCompanies
Research Consortiums
Acquisitions Joint Ventures
Licensing Minority Equity
Collaborators
Technology Sources:

48
Oklahoma State University© Copyright 2003 by Gregory H. Watson. All rights reserved.
How is technology access acquired?Typical Reasons:• Time, speed, and cost.• Lack of critical knowledge/expertise in the field.• Dilution of resources or engineering development focus.• Ease of availability & access outside.• Leverage available resources & share risk.
How to act in the acquisition process:• Be a customer – know what you want and who you are getting it from• Insure they know: What you want, what and when to deliver it and
how, when and what they will be paid.• Be prepared to accept the cost and schedule negotiated.• Manage, direct and review progress against the plan
Remember – While you are buying a deliverable, the quality of the product is your company’s responsibility!

49
Oklahoma State University© Copyright 2003 by Gregory H. Watson. All rights reserved.
Managing your technology acquisition policy:
• R&D manager’s responsibility is to provide the “right technology at the right time.”
• All sources of technology should be considered.• If it is available somewhere, its the job of the R&D manager to
find it, bring it home, and make it part of your portfolio.
The only threat from an outside source of technology is if your competitor has access and you don’t!
• Look at external sources of technology as your global R&D lab!• Be knowledgeable about the capabilities/technologies that exist.• Spend time & resources identifying potential sources before the
actual need.• Kill the not-invented-here or “NIH” attitude!

50
Oklahoma State University© Copyright 2003 by Gregory H. Watson. All rights reserved.
Relationship Major Advantages Major Disadvantages
Acquisition Control of technology.Rapid development & market entry.
Loss of key people or entrepreneurial culture.
Exclusive license Rapid access to technology. Reduces legal exposure.
Limited/no future help. Requires internal capability to develop.
Joint venture Utilize complementary skills. Shares risk/rewards.
Loss of control. Potential conflicts between parties.
Minority Interest Minimizes investment.Maintains entrepreneurial zeal.
Lack of control/direction.Potential loss to buyout.
Option for future license Modest up-front payment.Time to view progress.
Price escalates with progress. Shows lack of commitment.
Joint development Utilizes complementary technical resources. Shares risk/rewards. Maintains interest of both parties.
Loss of control.Potential conflict in direction and priorities, as well as future market
R&D contract Expands R&D capacity without Increase in headcount. Covers areas w/o inside expertise. No long term commitment.
Lack of strong incentive to complete on time & budget.Lack of day-to-day control & direction.
University research funding
Sow many seeds with small dollars. Focused activities.
Requires internal attention & resources to evaluate & assimilate
Relative merits of technology sources:

51
Oklahoma State University© Copyright 2003 by Gregory H. Watson. All rights reserved.
Management-induced sourcing problems:
• Sourcing is not viewed or managed as a strategic business process.• Failure to maintain consistency of purpose in building supplier base.• Unequal emphasis placed on various stages of the process.• People issues (ownership, capability, conflict of job responsibilities and
time allocation, NIH, etc.).• Inadequate planning, organization and internal support.• Underestimating routine management and transition to production task.• Failure to find the best source.• Failure to properly evaluate the source.• Failure of both parties to specify and communicate exact requirements
and expectations up front. • Failure to address alignment of business and legal relationships up
front.

52
Oklahoma State University© Copyright 2003 by Gregory H. Watson. All rights reserved.
Scheduling technology integration:• Begins with the technology strategy• Output of technology planning
Integrates • Technology forecast inputs• Technology road map inputs• Product road map inputs• Technology alignment process
To schedule technology you must:
• Start with the product ship date and
• Work backward to a development commencement date.

53
Oklahoma State University© Copyright 2003 by Gregory H. Watson. All rights reserved.
What happens if you delay product development?
• Weight each conflicting Target Factor (and sub-factor) in relative importance on a scale of 1-10 (10 = highest).Example:
• Relative weights are used to evaluate and make engineering trade-off decisions and determine their impact on schedule slippage or gains.
• CAUTION: Trade-offs which cause a threshold to be missed, even on a low weighted factor, are not acceptable (without marketing assessment and modification of the threshold) and should be considered only as a last resort.
• Good evaluation and trade-off of conflicting factors can be important in the technology smoothing process, as well as a vital tool in meeting the product marketing window requirements.
Time 10Cost 7Functions / Features 6Performance 8
Evaluate using: Analytical Hierarchy Method (AHP)
54
Oklahoma State University© Copyright 2003 by Gregory H. Watson. All rights reserved.
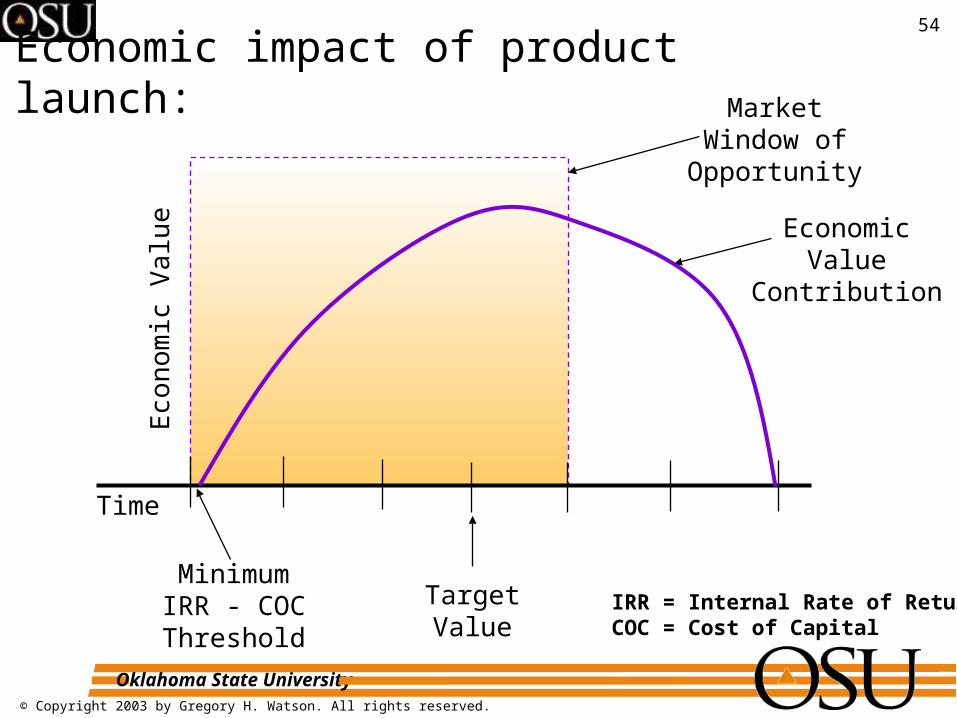
TargetValue
MinimumIRR - COCThreshold
EconomicValue
Contribution
MarketWindow ofOpportunity
Economic impact of product launch:
Time
Eco
no
mic
Va
lue
IRR = Internal Rate of ReturnCOC = Cost of Capital

55
Oklahoma State University© Copyright 2003 by Gregory H. Watson. All rights reserved.
Design leveraging – the need:
• Are based on proven designs with added important innovations.• Rediscovering the wheel, will at best, delay the design of the wagon
and often provides a bumpy ride – only redesign what must be unique.• Repeating failures waste time and effort and provides no added value
(also it makes you look silly when you redesign ‘failed’ features).• Less than 25% of new product is new. The rest has been done before.• Much of what you think is new is already being used and works well.• Much of what you believe is a better way, has been tried and failed.

56
Oklahoma State University© Copyright 2003 by Gregory H. Watson. All rights reserved.
Design leveraging – the practice:
• Search out what has been tried and what does and doesn’t work and adapt the best – don’t over-engineer the hammer!
• Concentrate time and effort on the really “new” stuff – only if there is time left over should you improve the “old” stuff.
• Design the product architecture with a plan for reuse and expansion by using defined modular blocks or partitioned designs.
• Provide an easily available knowledge and documentation database.
• Maintain a disciplined product design process with frequent reviews.
• Conduct frequent dialog between technology sources and users.
• Implement compatible design tools across the organization.
• Develop a “book of sins” and require all project managers to ‘confess.’
• Design leverage environment to make it easier to leverage than not to.

57
Oklahoma State University© Copyright 2003 by Gregory H. Watson. All rights reserved.
Personal reflection:Think about product lines that had severe technical competition in the market and failed to gain the advantage (e.g., Sony Betamax, RCA VHS and Sony DVD in video recording; or IBM, Apple and Compaq in compatible personal computers; or Kodak, Canon, Sony in cameras, etc.). What caused the losing company to forfeit their market advantage and the profitability that accompanies it? What management decisions could have been made (in hindsight) that could have prevented the loss of market share? How could a technology strategy contribute to an improved understanding of the underlying market forces? Do any of these companies show the type of technological and business flexibility that could make them long-term winners? How would you use the knowledge gained in this session to enlighten your management team about its options for technology integration with their business strategy?

58
Oklahoma State University© Copyright 2003 by Gregory H. Watson. All rights reserved.
Assignment #3:
Instructor: Gregory H. WatsonIntroduction to Strategy, Technology and IntegrationETM 5111 – Summer 2003

59
Oklahoma State University© Copyright 2003 by Gregory H. Watson. All rights reserved.
Assignment #3:Larry Bossidy and Ram Charan, Execution: The Discipline of Getting Things Done (Crown, 2002), ISBN 0-609-610-570.
Topic: Managing for achievement – making projects happen
Read Bossidy & Charan’s book and prepare an essay using information from today’s presentation, the concepts presented by Bossidy & Charan and your business experience [for details that define the essay topic see the next slide].
Grading:
A+ – Demonstrated original thinking applying course material to experience
A – Demonstrated integration of course material and personal experience
B – Demonstrated understanding of Bossidy & Charan and today’s lecture
C – Demonstrated knowledge of Bossidy & Charan and today’s lecture
Length: Your MS Word document must be no more than 1000 words, but it may include embedded PowerPoint or Excel graphics to illustrate points.
Due: Prior to Session 4 – Email using assignment submission process

60
Oklahoma State University© Copyright 2003 by Gregory H. Watson. All rights reserved.
Assignment #3 – essay instructions continued:Managing for Achievement – Making Projects Happen
Bossidy and Charan’s book Execution: The Discipline of Getting Things Done provides insight into one of the great business turnarounds of the 20 th century. While analysis and planning are significant as overtures to the main opus – real success comes from the discipline of action. Choose three points that are made in this book and compare them with the paper that I wrote on policy deployment. How can this policy deployment methodology be used as a link between the analysis and strategy setting process and these concepts that drive the discipline of execution? Define a clear management process and illustrate how Bossidy and Charan have influenced your thinking (of course flattery by referencing my paper will also help considerably!). Please footnote the points used from Bossidy and Charan for cross-reference and easy identification. Your paper should be single-spaced and the length between 3-5 pages.
61
Oklahoma State University© Copyright 2003 by Gregory H. Watson. All rights reserved.
Further reading:
• Want to learn more about this subject? Then read the following books:
1. Peter Schwartz, The Art of the Long View (New York: Doubleday, 1991).
2. Gregory H. Watson, Strategic Benchmarking (New York: John Wiley & Sons, 1993).

62
Oklahoma State University© Copyright 2003 by Gregory H. Watson. All rights reserved.
Next session:
• Read Bossidy & Charan book: Execution• Prepare Assignment #3
• Decide what to do about ‘extra credit’ project – it will be due at the same time as the final examination, but you will want to get started on it as soon as you can.

63
Oklahoma State University© Copyright 2003 by Gregory H. Watson. All rights reserved.
ETM – 5111:
End of Session 3
Instructor: Gregory H. WatsonSummer 2003Session 3 – End of Part 3