Oklahoma Health Care Authority - Medicaid Home | … I. EXECUTIVE SUMMARY Oklahoma’s single state...
33
3/4/2016 Oklahoma Health Care Authority §1115(a) SoonerCare Research and Demonstration Waiver Amendment Request Project Number: 11-W-00048/6 Submitted March 4, 2016
Transcript of Oklahoma Health Care Authority - Medicaid Home | … I. EXECUTIVE SUMMARY Oklahoma’s single state...

3/4/2016
Oklahoma Health Care
Authority
§1115(a) SoonerCare
Research and Demonstration Waiver
Amendment Request
Project Number: 11-W-00048/6
Submitted
March 4, 2016
1
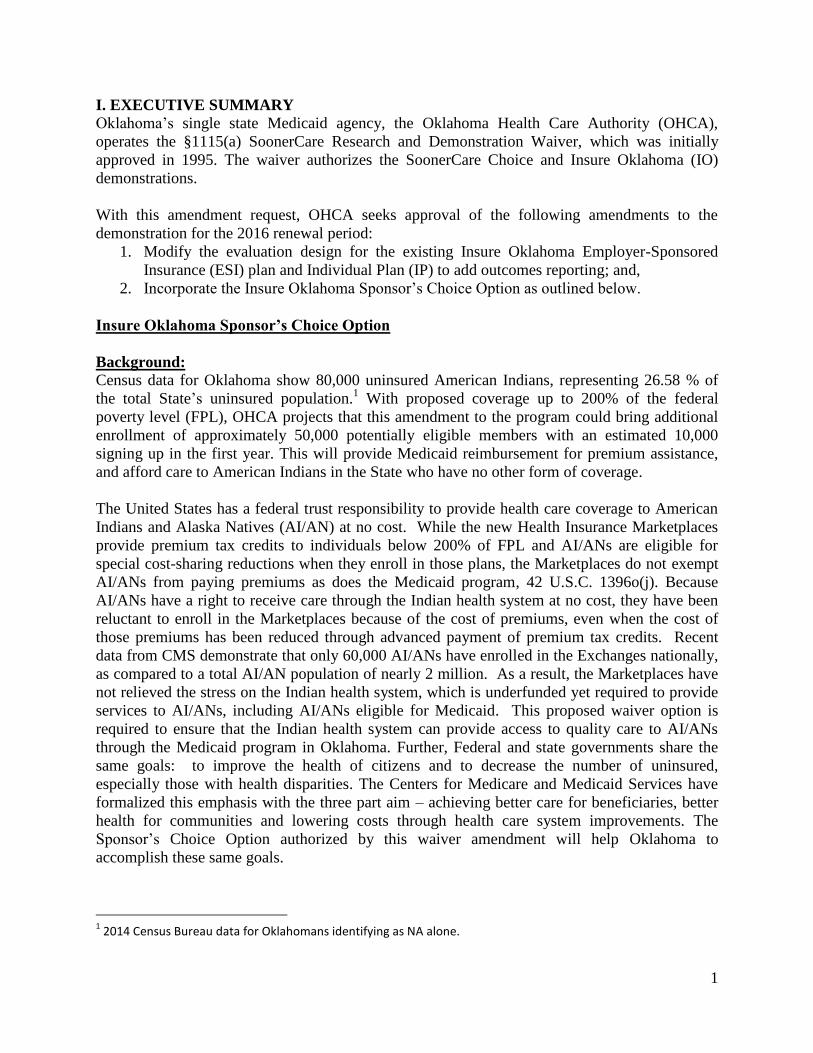
I. EXECUTIVE SUMMARY
Oklahoma’s single state Medicaid agency, the Oklahoma Health Care Authority (OHCA),
operates the §1115(a) SoonerCare Research and Demonstration Waiver, which was initially
approved in 1995. The waiver authorizes the SoonerCare Choice and Insure Oklahoma (IO)
demonstrations.
With this amendment request, OHCA seeks approval of the following amendments to the
demonstration for the 2016 renewal period:
1. Modify the evaluation design for the existing Insure Oklahoma Employer-Sponsored
Insurance (ESI) plan and Individual Plan (IP) to add outcomes reporting; and,
2. Incorporate the Insure Oklahoma Sponsor’s Choice Option as outlined below.
Insure Oklahoma Sponsor’s Choice Option
Background:
Census data for Oklahoma show 80,000 uninsured American Indians, representing 26.58 % of
the total State’s uninsured population.1 With proposed coverage up to 200% of the federal
poverty level (FPL), OHCA projects that this amendment to the program could bring additional
enrollment of approximately 50,000 potentially eligible members with an estimated 10,000
signing up in the first year. This will provide Medicaid reimbursement for premium assistance,
and afford care to American Indians in the State who have no other form of coverage.
The United States has a federal trust responsibility to provide health care coverage to American
Indians and Alaska Natives (AI/AN) at no cost. While the new Health Insurance Marketplaces
provide premium tax credits to individuals below 200% of FPL and AI/ANs are eligible for
special cost-sharing reductions when they enroll in those plans, the Marketplaces do not exempt
AI/ANs from paying premiums as does the Medicaid program, 42 U.S.C. 1396o(j). Because
AI/ANs have a right to receive care through the Indian health system at no cost, they have been
reluctant to enroll in the Marketplaces because of the cost of premiums, even when the cost of
those premiums has been reduced through advanced payment of premium tax credits. Recent
data from CMS demonstrate that only 60,000 AI/ANs have enrolled in the Exchanges nationally,
as compared to a total AI/AN population of nearly 2 million. As a result, the Marketplaces have
not relieved the stress on the Indian health system, which is underfunded yet required to provide
services to AI/ANs, including AI/ANs eligible for Medicaid. This proposed waiver option is
required to ensure that the Indian health system can provide access to quality care to AI/ANs
through the Medicaid program in Oklahoma. Further, Federal and state governments share the
same goals: to improve the health of citizens and to decrease the number of uninsured,
especially those with health disparities. The Centers for Medicare and Medicaid Services have
formalized this emphasis with the three part aim – achieving better care for beneficiaries, better
health for communities and lowering costs through health care system improvements. The
Sponsor’s Choice Option authorized by this waiver amendment will help Oklahoma to
accomplish these same goals.
1 2014 Census Bureau data for Oklahomans identifying as NA alone.

2
CMS’s State Medicaid Director’s Letter # 01-024 states, “As set forth in the Constitution of the
United States, treaties, statutes, Executive Orders, and court decisions, it has been long
recognized that the United States has a unique relationship with Tribal Governments. This
government-to-government relationship recognizes the right of Tribes to tribal sovereignty, self-
government and self-determination.”
Whereas Congress has declared “it is a major national goal of the United States to provide the
quantity and quality of health services which will permit the health status of Indians to be raised
to the highest possible level and to encourage the maximum participation of Indians in the
planning and management of those services” ( 25 U.S.C. §1601); 25 U.S.C. § 1642, grants tribes
new authority to purchase health care coverage using federal health care resources, as amounts
are made available under law. The State desires to comport with the intent of the federal
government to supply American Indians and Alaska Natives with access to quality health care. It
is the intent of the OHCA to add a new Sponsor’s Choice Option to the existing Insure
Oklahoma ESI program for citizens served through Indian Health Service, Tribal Facilities and
Urban Indian Clinics (I/T/U).
Proposed Effective Date:
OHCA recognizes that CMS requires amendment requests to be made at least 120 days in
advance of planned implementation and that there is no regulatory timeframe for amendment
approvals. Therefore, OHCA submits this amendment within specified requirements and
respectfully requests an amendment be approved by CMS no later than August 2, 2016.
Systems enhancements to convert Insure Oklahoma applications to the online eligibility process
and automate business functions are under way to meet strategic planning objectives. The intent
of the OHCA is to have actual implementation on or after January 1, 2017.
II. PROPOSED CHANGES for SPONSOR’S CHOICE OPTION
OHCA proposes the following changes to the approved Project Number: 11-W-00048/6
2016 Special Terms and Conditions (STC).
1. Amend the IO Demonstration STCs to add provisions for qualified sponsors for the Insure
Oklahoma Sponsor’s Choice option.
To qualify for participation, a sponsor must:
Be a tribally-operated health facility in Oklahoma; or
Be an Indian Health Service unit in Oklahoma; or
Be an Urban Indian Health Service unit in Oklahoma; and
Sponsor a qualified individual before they may enroll in the Insure Oklahoma Sponsor’s
Choice program.
2. Amend the Insure Oklahoma Demonstration Eligibility populations at STC #21 to add:
Individuals sponsored for enrollment in the Insure Oklahoma Sponsor’s Choice Option
To qualify for participation, a member must:
3
Be an uninsured individual not enrolled in any comprehensive health coverage or
Medicaid, Medicare, Tricare, Veterans Administration; and
Be sponsored by a qualified sponsor ; and
Meet income guidelines up to and including 200% of the FPL; and
Be an United States Citizen or qualified alien; and
Be an Oklahoma Resident; and
Be age 19 through 64.
Coverage is also available for dependent spouses and children. Dependent children may be
eligible in households with income between 186% through 200% of the FPL. Eligibility criteria
for dependent coverage are as follows:
Be a dependent of Sponsor’s Choice member; and
Be sponsored by a participating sponsor; and
Be an United States Citizen or qualified alien; and
Be an Oklahoma Resident; and
Be age 19 through 64 for dependent spouses.
3. Amend the Insure Oklahoma Premium Assistance and Cost Sharing STC Section VI to add
provisions that outline cost-sharing requirements for the Insure Oklahoma Sponsor’s Choice
Option as follows:
Zero Cost Sharing (enrollment fees, premium charges, deductibles, copayment, cost-
sharing or similar charges) for Indians in accordance with 42 CFR §447.56(a)(1) (x),
Section 5006(a) of the ARRA of 2009 and 25 U.S.C. § 1396o (1)
4. Amend the CMS Expenditure Authority to add the Sponsor’s Choice Population.
5. Amend the Insure Oklahoma STC Section VI, #29 to change the title to include Sponsor’s
Choice qualifying plans and to add criteria for Certification of Qualifying Health Plans for the
Insure Oklahoma Sponsor’s Choice Option. Criteria include:
Sponsor’s Choice Qualifying Health Plans must promptly pay the OMB Encounter Rate
to I/T/Us for services rendered to sponsored individuals whether or not the I/T/U is
enrolled as a participating provider in the Sponsor’s Choice Qualifying Health Plan as a
condition of certification as a Sponsor’s Choice Qualifying Health Plan.
Sponsor’s Choice Qualifying Health Plans must accept referrals and premium payments
from the I/T/U on a bundled basis on behalf of all of the individuals sponsored by the
Qualified Sponsor’s Choice sponsor.
III. MODIFICATION OF EVALUATION DESIGN
With the addition of the Insure Oklahoma Sponsor’s Choice Option, the OHCA will add these
hypotheses for the 2016 demonstration extension periods.
1. Determine the net increase in Medicaid payments made to qualifying Insure Oklahoma
Sponsor’s Choice sponsors between the baseline year and subsequent years.
2. Determine whether qualifying Insure Oklahoma Sponsor’s Choice sponsors are able to
maintain and/or increase their staffing due to participation in Sponsor’s Choice between
the baseline year and subsequent years.

4
3. The health outcomes of members served in the Insure Oklahoma Sponsor’s Choice
Option and served at an ITU will improve between the baseline year and subsequent
years. Specifically, measures defined by the National Quality Forum related to
commercial tobacco use, commercial tobacco cessation, obesity, diabetes, and
hypertension will be used to study program effectiveness. Measureable data will be
provided through the commercial insurer and their Health Information Exchange
partners.
IV. BUDGET NEUTRALITY
The OHCA provides to CMS updated budget neutrality for the Insure Oklahoma Sponsor’s
Choice Option. Please refer to the attached budget neutrality documents, which reflect increased
enrollment in Insure Oklahoma with the addition of this option, and corresponding expenditures.
The budget neutrality projections in this amendment take into account all previous CMS-
approved amendments and modifications to the demonstration.
V. PUBLIC NOTICE
In accordance with STC #16, Public Notice, Tribal Consultation and Consultation with
Interested Parties, Oklahoma has provided meaningful public notice to the Oklahoma American
Indian Tribes by providing a tribal consultation forum and comment period regarding this
proposed amendment.
The OHCA and the Oklahoma State Department of Health on February 4, 2015(Attachment 1)
hosted an ad hoc tribal consultation meeting to discuss the possibility of an Insure Oklahoma
tribal coverage option. Participants reviewed the current Insure Oklahoma employer-sponsored
insurance plan, which offers commercial insurance to enrollees. Improving access to care and
addressing uncompensated care at Indian health care facilities were identified as some of the
objectives this initiative could accomplish. Some 68 attendees, including representatives from
Indian Health Service, Urban Indian clinics, sovereign nations and the Inter-Tribal Health Board
were in attendance.
The discussion continued with formal Tribal Consultation on March 3, 2015(Attachment 2), also
at the OHCA. Copies of the email invitations to both of these meetings are attached.
At the March 3, 2015, meeting, discussion continued to be very favorable, and with momentum
building, the participants determined that an intensive work session to develop the actual waiver
request would be helpful. Interested parties and state representatives agreed to meet on March
16 and 17, 2015, to begin drafting documents for possible submission to CMS. Collaborative
work continued on the amendment draft in order to prepare a document for consideration at the
May 5, 2015, Tribal Consultation meeting.
A Resolution supporting the Insure Oklahoma Sponsor’s Choice Option was adopted by the
Inter-Tribal Council of the Five Civilized Tribes (Attachment 3) on April 10, 2015.
A summary of the proposed Insure Oklahoma Sponsor’s Choice Option was included in the
Tribal Consultation meeting on May 5, 2015 (Attachment 4). Comments were as follows:

5
Comment: How receptive is CMS to this waiver amendment?
Response: They have been very responsive. They have already seen a draft and sent us comments
informally. They want to help make it happen. I am very optimistic. I believe they are working
with us to help get an approvable document.
Comment: Can I have a copy of the latest draft?
Response: Yes, we will email them today. We are also going to post the draft, including the
resolution of support and the white paper, on the Tribal Consultation web page tomorrow. The
draft will be posted for 30 days of comment. After that, the Health Department and OHCA
leadership will review the document. We will also submit the final version to the Governor’s
office before sending to CMS.
Comment: When will we hear back on our draft?
Response: We will send CMS our rough draft today, to get more comments. We have a special
call about this draft proposal scheduled for May 21, 2015. We are trying to do the leg work early
to expedite approval.
Comment: Will you let us know if there is anything else we can do to help?
Response: Yes, thank you. As Dana indicated earlier, this has been a wonderful collaboration of
the state agencies and the tribal nations. Thank you for all your work in going through this
process.
Refer to the May 5, 2015 Tribal Consultation agenda (Attachment 5) and sign-in sheet
(Attachment 6) for verification of the discussion.
A draft of the waiver amendment and rules was posted to the OHCA web page for public
comment June 12, 2015 through July 31, 2015. In summary, the comments reflected…
Comment: The top leading causes of AI/AN death are heart disease, cancer, unintentional
injuries and diabetes Indian Health Service (IHS). Outside of I/T/U services, if an uninsured
Native American patient was found to need a level of care beyond primary care such as a health
center, they may face challenges or delay in accessing such specialty care. Many of these
chronic disease cases could be prevented with earlier health monitoring and intervention.
Oklahoma Primary Care Association (OKPCA) strongly supports efforts such as insurance
coverage to improve the health status of all Oklahomans including American Indians and Alaska
Natives.
Response: Thank you for your endorsement of the IO Sponsor's Choice draft Amendment. Please
know the Oklahoma Health Care Authority values and appreciates your input into our draft IO
Sponsor’s Choice amendment. Please be assured that all input will be considered before a final
amendment is submitted.
Oklahoma Health Care Authority
SOONERCARE
§1115(a) Research and Demonstration Waiver Demonstration Project No. 11-W-0048/6
Proposed Extension through December 31, 2018
Attachment B, BUDGET NEUTRALITY March 4, 2016
SoonerCare Budget Neutrality (2016-2018 Extension) – December 2015
1
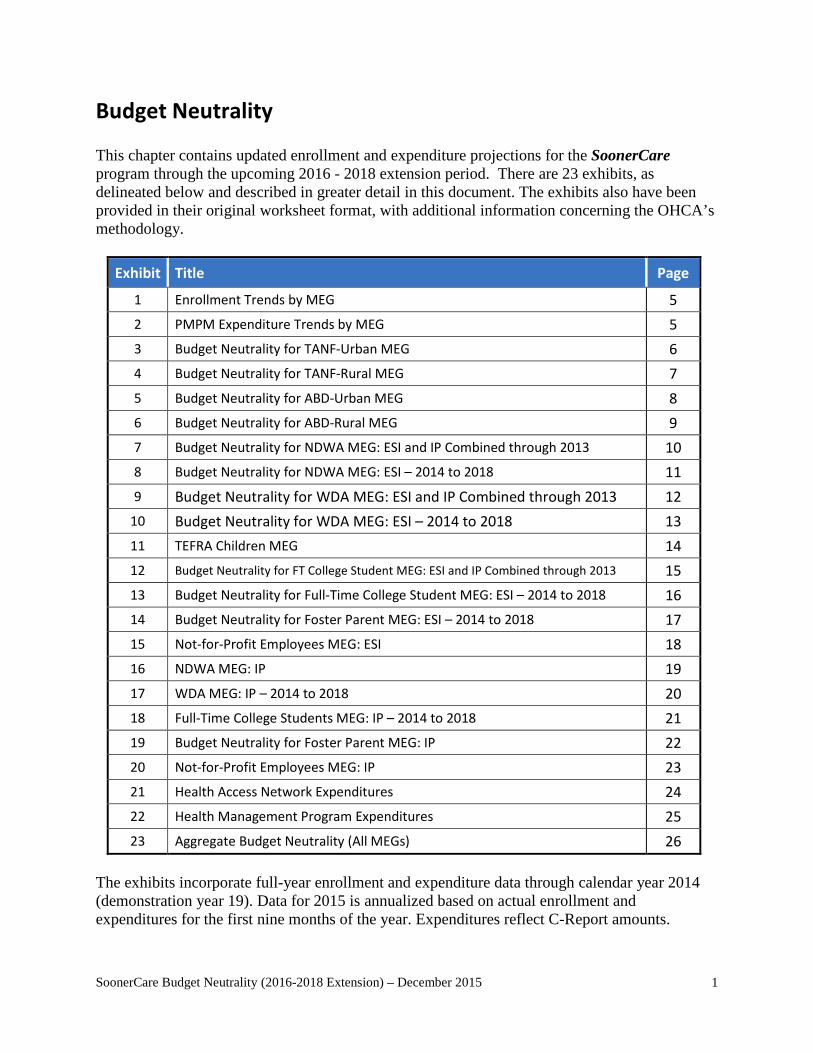
Budget Neutrality This chapter contains updated enrollment and expenditure projections for the SoonerCare program through the upcoming 2016 - 2018 extension period. There are 23 exhibits, as delineated below and described in greater detail in this document. The exhibits also have been provided in their original worksheet format, with additional information concerning the OHCA’s methodology.
Exhibit Title Page
1 Enrollment Trends by MEG 5 2 PMPM Expenditure Trends by MEG 5 3 Budget Neutrality for TANF-Urban MEG 6 4 Budget Neutrality for TANF-Rural MEG 7 5 Budget Neutrality for ABD-Urban MEG 8 6 Budget Neutrality for ABD-Rural MEG 9 7 Budget Neutrality for NDWA MEG: ESI and IP Combined through 2013 10 8 Budget Neutrality for NDWA MEG: ESI – 2014 to 2018 11 9 Budget Neutrality for WDA MEG: ESI and IP Combined through 2013 12
10 Budget Neutrality for WDA MEG: ESI – 2014 to 2018 13 11 TEFRA Children MEG 14 12 Budget Neutrality for FT College Student MEG: ESI and IP Combined through 2013 15 13 Budget Neutrality for Full-Time College Student MEG: ESI – 2014 to 2018 16 14 Budget Neutrality for Foster Parent MEG: ESI – 2014 to 2018 17 15 Not-for-Profit Employees MEG: ESI 18 16 NDWA MEG: IP 19 17 WDA MEG: IP – 2014 to 2018 20 18 Full-Time College Students MEG: IP – 2014 to 2018 21 19 Budget Neutrality for Foster Parent MEG: IP 22 20 Not-for-Profit Employees MEG: IP 23 21 Health Access Network Expenditures 24 22 Health Management Program Expenditures 25 23 Aggregate Budget Neutrality (All MEGs) 26
The exhibits incorporate full-year enrollment and expenditure data through calendar year 2014 (demonstration year 19). Data for 2015 is annualized based on actual enrollment and expenditures for the first nine months of the year. Expenditures reflect C-Report amounts.
SoonerCare Budget Neutrality (2016-2018 Extension) – December 2015
2
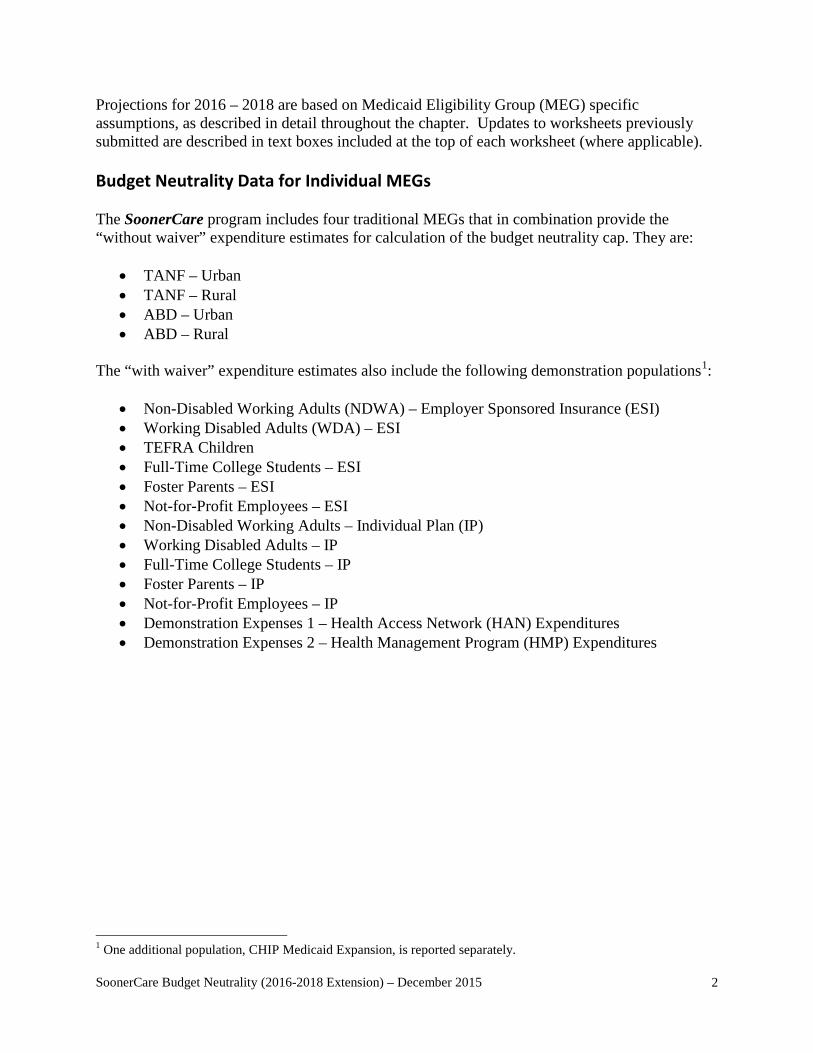
Projections for 2016 – 2018 are based on Medicaid Eligibility Group (MEG) specific assumptions, as described in detail throughout the chapter. Updates to worksheets previously submitted are described in text boxes included at the top of each worksheet (where applicable). Budget Neutrality Data for Individual MEGs The SoonerCare program includes four traditional MEGs that in combination provide the “without waiver” expenditure estimates for calculation of the budget neutrality cap. They are:
• TANF – Urban • TANF – Rural • ABD – Urban • ABD – Rural
The “with waiver” expenditure estimates also include the following demonstration populations1:
• Non-Disabled Working Adults (NDWA) – Employer Sponsored Insurance (ESI) • Working Disabled Adults (WDA) – ESI • TEFRA Children • Full-Time College Students – ESI • Foster Parents – ESI • Not-for-Profit Employees – ESI • Non-Disabled Working Adults – Individual Plan (IP) • Working Disabled Adults – IP • Full-Time College Students – IP • Foster Parents – IP • Not-for-Profit Employees – IP • Demonstration Expenses 1 – Health Access Network (HAN) Expenditures • Demonstration Expenses 2 – Health Management Program (HMP) Expenditures
1 One additional population, CHIP Medicaid Expansion, is reported separately.
SoonerCare Budget Neutrality (2016-2018 Extension) – December 2015
3
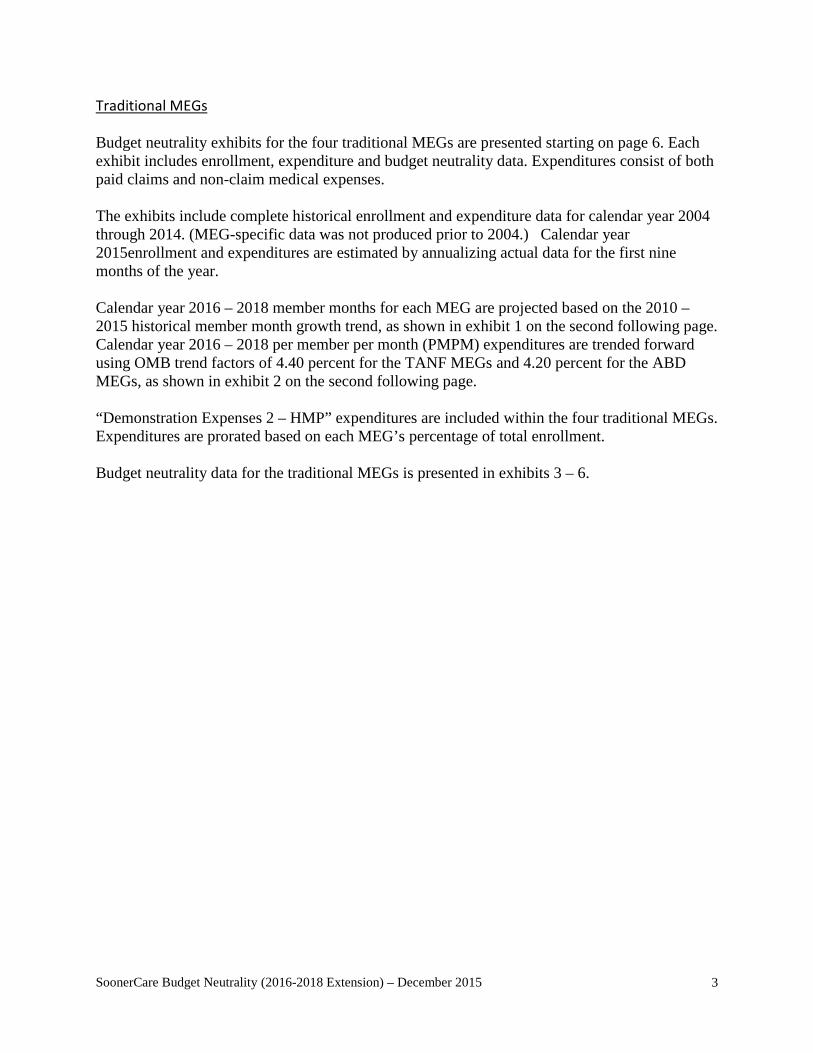
Traditional MEGs Budget neutrality exhibits for the four traditional MEGs are presented starting on page 6. Each exhibit includes enrollment, expenditure and budget neutrality data. Expenditures consist of both paid claims and non-claim medical expenses. The exhibits include complete historical enrollment and expenditure data for calendar year 2004 through 2014. (MEG-specific data was not produced prior to 2004.) Calendar year 2015enrollment and expenditures are estimated by annualizing actual data for the first nine months of the year. Calendar year 2016 – 2018 member months for each MEG are projected based on the 2010 – 2015 historical member month growth trend, as shown in exhibit 1 on the second following page. Calendar year 2016 – 2018 per member per month (PMPM) expenditures are trended forward using OMB trend factors of 4.40 percent for the TANF MEGs and 4.20 percent for the ABD MEGs, as shown in exhibit 2 on the second following page. “Demonstration Expenses 2 – HMP” expenditures are included within the four traditional MEGs. Expenditures are prorated based on each MEG’s percentage of total enrollment. Budget neutrality data for the traditional MEGs is presented in exhibits 3 – 6.
SoonerCare Budget Neutrality (2016-2018 Extension) – December 2015
4
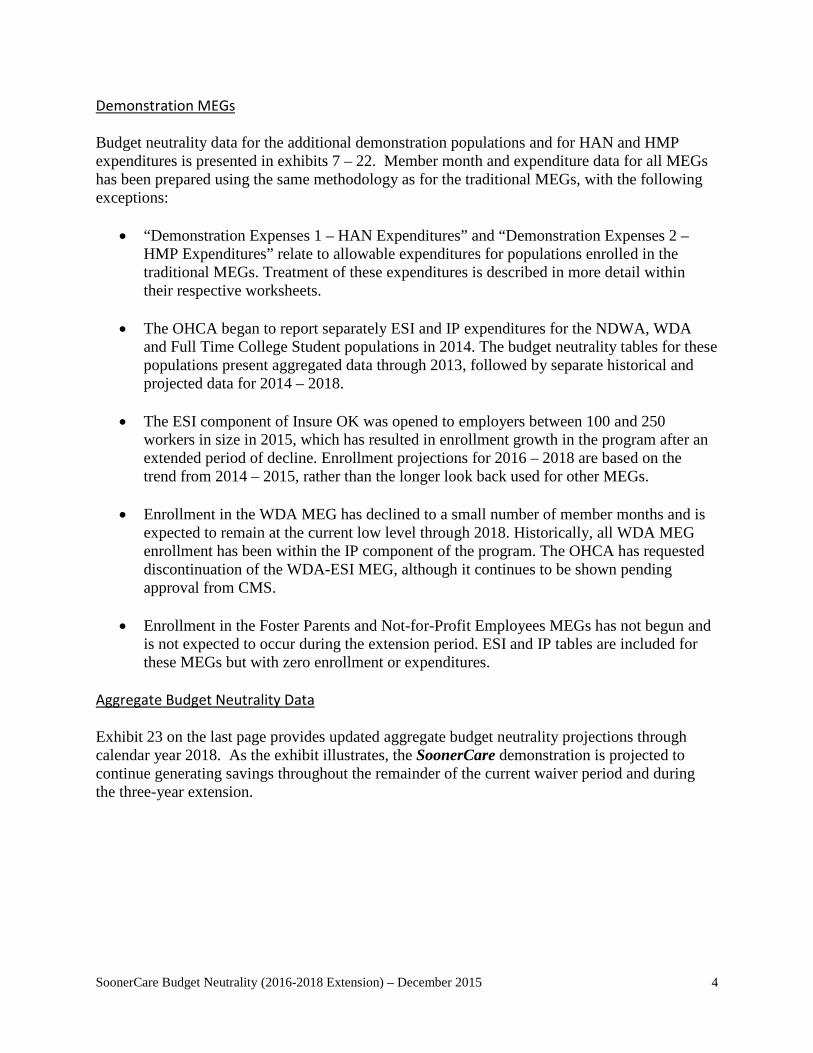
Demonstration MEGs Budget neutrality data for the additional demonstration populations and for HAN and HMP expenditures is presented in exhibits 7 – 22. Member month and expenditure data for all MEGs has been prepared using the same methodology as for the traditional MEGs, with the following exceptions:
• “Demonstration Expenses 1 – HAN Expenditures” and “Demonstration Expenses 2 – HMP Expenditures” relate to allowable expenditures for populations enrolled in the traditional MEGs. Treatment of these expenditures is described in more detail within their respective worksheets.
• The OHCA began to report separately ESI and IP expenditures for the NDWA, WDA
and Full Time College Student populations in 2014. The budget neutrality tables for these populations present aggregated data through 2013, followed by separate historical and projected data for 2014 – 2018.
• The ESI component of Insure OK was opened to employers between 100 and 250 workers in size in 2015, which has resulted in enrollment growth in the program after an extended period of decline. Enrollment projections for 2016 – 2018 are based on the trend from 2014 – 2015, rather than the longer look back used for other MEGs.
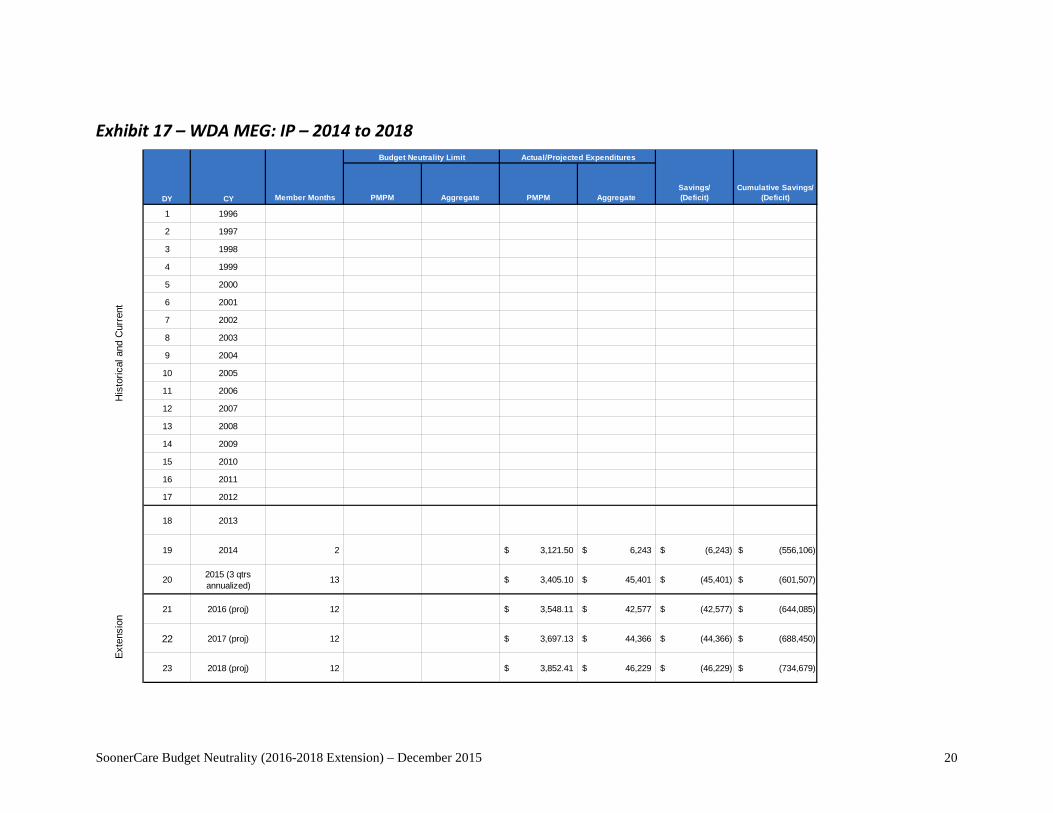
• Enrollment in the WDA MEG has declined to a small number of member months and is
expected to remain at the current low level through 2018. Historically, all WDA MEG enrollment has been within the IP component of the program. The OHCA has requested discontinuation of the WDA-ESI MEG, although it continues to be shown pending approval from CMS.
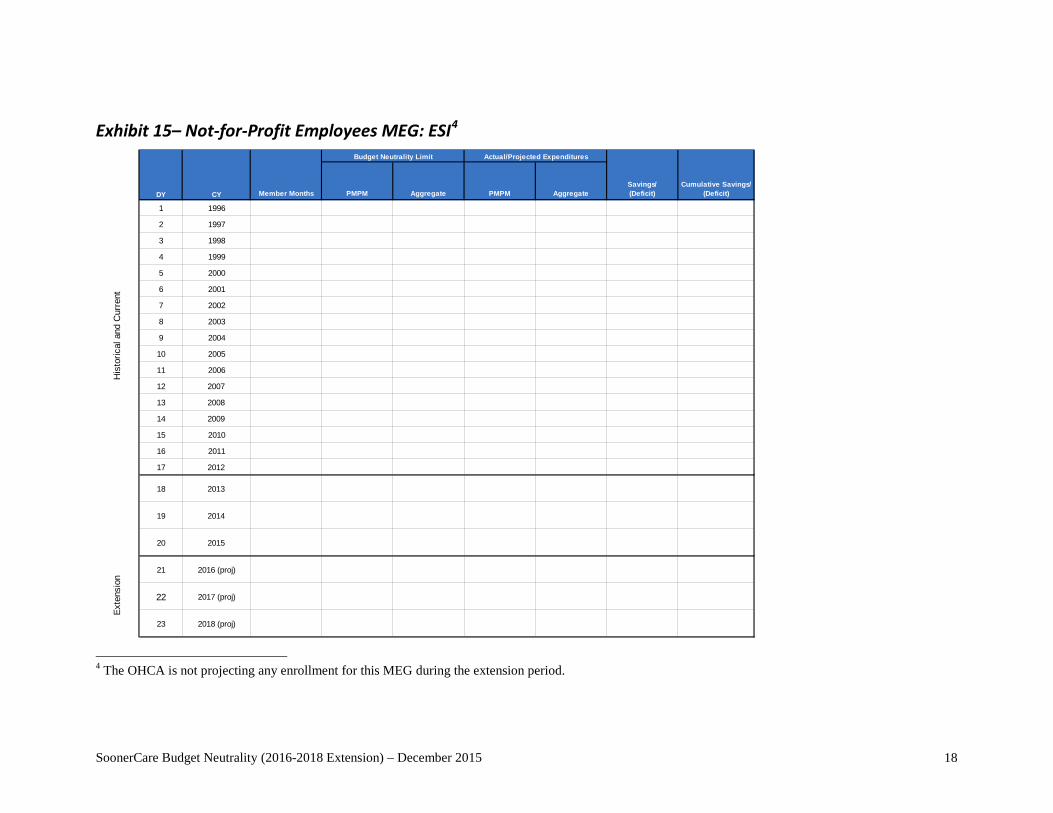
• Enrollment in the Foster Parents and Not-for-Profit Employees MEGs has not begun and
is not expected to occur during the extension period. ESI and IP tables are included for these MEGs but with zero enrollment or expenditures.
Aggregate Budget Neutrality Data Exhibit 23 on the last page provides updated aggregate budget neutrality projections through calendar year 2018. As the exhibit illustrates, the SoonerCare demonstration is projected to continue generating savings throughout the remainder of the current waiver period and during the three-year extension.

SoonerCare Budget Neutrality (2016-2018 Extension) – December 2015
5
Exhibit 1 – Enrollment Trends by MEG
Exhibit 2 – PMPM Expenditure Trends by MEG
Year TANF – Urban
TANF – Rural
ABD-Urban
ABD – Rural NDWA WDA TEFRA
College Students
2015 4.40% 4.40% 4.20% 4.20% 4.40% 4.20% 4.20% 4.40% 2016 4.40% 4.40% 4.20% 4.20% 4.40% 4.20% 4.20% 4.40% 2017 4.40% 4.40% 4.20% 4.20% 4.40% 4.20% 4.20% 4.40%
MEG 2010 2011 2012 2013 2014 2015 (Annualized) Annual Trend Trending
Years
TANF - Urban 3,333,170 3,357,000 3,620,263 3,741,817 4,001,208 4,123,944 4.35% 2010 - 2015
TANF - Rural 2,429,264 2,433,324 2,565,123 2,618,683 2,745,120 2,823,017 3.05% 2010 - 2015
ABD - Urban 327,267 344,575 348,935 360,205 365,630 362,284 2.05% 2010 - 2015
ABD - Rural 278,093 285,113 285,622 290,965 291,806 287,529 0.67% 2010 - 2015
NDWA - ESI 10.77% 2015
NDWA - IP -14.99% 2015
WDA 90 114 66 42 - - -100.00% 2010 - 2015
TEFRA 4,018 4,514 4,978 5,326 6,148 6,728 10.86% 2010 - 2015
College - ESI 11.88% 2015
College - IP 0.00% 2015
SoonerCare Budget Neutrality (2016-2018 Extension) – December 2015 6
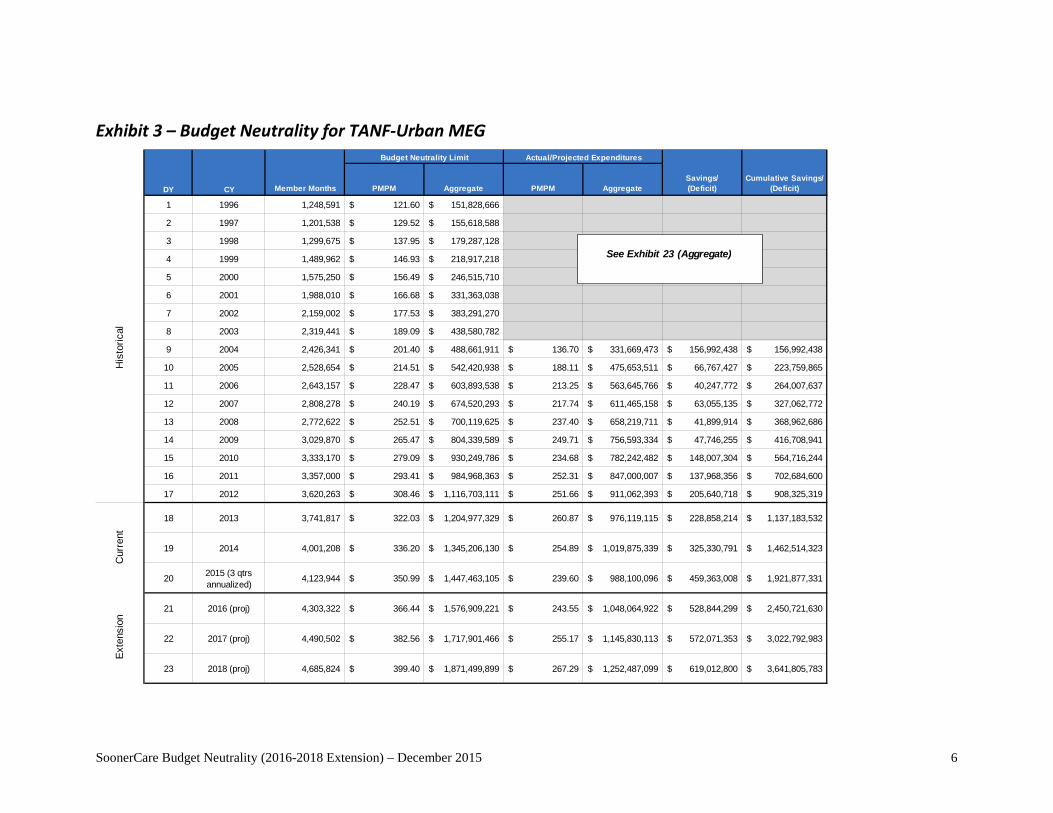
Exhibit 3 – Budget Neutrality for TANF-Urban MEG
DY CY Member Months PMPM Aggregate PMPM AggregateSavings/ (Deficit)
Cumulative Savings/ (Deficit)
1 1996 1,248,591 121.60$ 151,828,666$
2 1997 1,201,538 129.52$ 155,618,588$
3 1998 1,299,675 137.95$ 179,287,128$
4 1999 1,489,962 146.93$ 218,917,218$
5 2000 1,575,250 156.49$ 246,515,710$
6 2001 1,988,010 166.68$ 331,363,038$
7 2002 2,159,002 177.53$ 383,291,270$
8 2003 2,319,441 189.09$ 438,580,782$
9 2004 2,426,341 201.40$ 488,661,911$ 136.70$ 331,669,473$ 156,992,438$ 156,992,438$
10 2005 2,528,654 214.51$ 542,420,938$ 188.11$ 475,653,511$ 66,767,427$ 223,759,865$
11 2006 2,643,157 228.47$ 603,893,538$ 213.25$ 563,645,766$ 40,247,772$ 264,007,637$
12 2007 2,808,278 240.19$ 674,520,293$ 217.74$ 611,465,158$ 63,055,135$ 327,062,772$
13 2008 2,772,622 252.51$ 700,119,625$ 237.40$ 658,219,711$ 41,899,914$ 368,962,686$
14 2009 3,029,870 265.47$ 804,339,589$ 249.71$ 756,593,334$ 47,746,255$ 416,708,941$
15 2010 3,333,170 279.09$ 930,249,786$ 234.68$ 782,242,482$ 148,007,304$ 564,716,244$
16 2011 3,357,000 293.41$ 984,968,363$ 252.31$ 847,000,007$ 137,968,356$ 702,684,600$
17 2012 3,620,263 308.46$ 1,116,703,111$ 251.66$ 911,062,393$ 205,640,718$ 908,325,319$
18 2013 3,741,817 322.03$ 1,204,977,329$ 260.87$ 976,119,115$ 228,858,214$ 1,137,183,532$
19 2014 4,001,208 336.20$ 1,345,206,130$ 254.89$ 1,019,875,339$ 325,330,791$ 1,462,514,323$
20 2015 (3 qtrs annualized)
4,123,944 350.99$ 1,447,463,105$ 239.60$ 988,100,096$ 459,363,008$ 1,921,877,331$
21 2016 (proj) 4,303,322 366.44$ 1,576,909,221$ 243.55$ 1,048,064,922$ 528,844,299$ 2,450,721,630$
22 2017 (proj) 4,490,502 382.56$ 1,717,901,466$ 255.17$ 1,145,830,113$ 572,071,353$ 3,022,792,983$
23 2018 (proj) 4,685,824 399.40$ 1,871,499,899$ 267.29$ 1,252,487,099$ 619,012,800$ 3,641,805,783$
Exte
nsio
n
Actual/Projected ExpendituresBudget Neutrality Limit
His
toric
alC
urre
nt
See Exhibit 23 (Aggregate)
SoonerCare Budget Neutrality (2016-2018 Extension) – December 2015 7
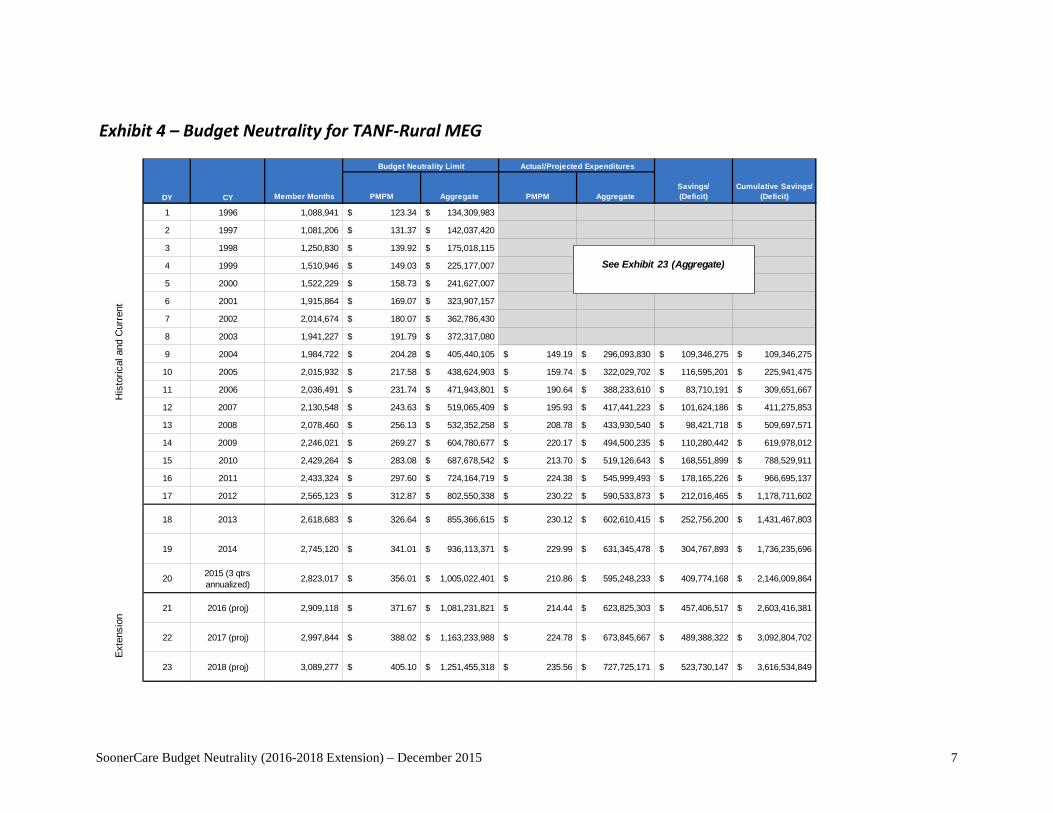
Exhibit 4 – Budget Neutrality for TANF-Rural MEG
DY CY Member Months PMPM Aggregate PMPM AggregateSavings/ (Deficit)
Cumulative Savings/ (Deficit)
1 1996 1,088,941 123.34$ 134,309,983$
2 1997 1,081,206 131.37$ 142,037,420$
3 1998 1,250,830 139.92$ 175,018,115$
4 1999 1,510,946 149.03$ 225,177,007$
5 2000 1,522,229 158.73$ 241,627,007$
6 2001 1,915,864 169.07$ 323,907,157$
7 2002 2,014,674 180.07$ 362,786,430$
8 2003 1,941,227 191.79$ 372,317,080$
9 2004 1,984,722 204.28$ 405,440,105$ 149.19$ 296,093,830$ 109,346,275$ 109,346,275$
10 2005 2,015,932 217.58$ 438,624,903$ 159.74$ 322,029,702$ 116,595,201$ 225,941,475$
11 2006 2,036,491 231.74$ 471,943,801$ 190.64$ 388,233,610$ 83,710,191$ 309,651,667$
12 2007 2,130,548 243.63$ 519,065,409$ 195.93$ 417,441,223$ 101,624,186$ 411,275,853$
13 2008 2,078,460 256.13$ 532,352,258$ 208.78$ 433,930,540$ 98,421,718$ 509,697,571$
14 2009 2,246,021 269.27$ 604,780,677$ 220.17$ 494,500,235$ 110,280,442$ 619,978,012$
15 2010 2,429,264 283.08$ 687,678,542$ 213.70$ 519,126,643$ 168,551,899$ 788,529,911$
16 2011 2,433,324 297.60$ 724,164,719$ 224.38$ 545,999,493$ 178,165,226$ 966,695,137$
17 2012 2,565,123 312.87$ 802,550,338$ 230.22$ 590,533,873$ 212,016,465$ 1,178,711,602$
18 2013 2,618,683 326.64$ 855,366,615$ 230.12$ 602,610,415$ 252,756,200$ 1,431,467,803$
19 2014 2,745,120 341.01$ 936,113,371$ 229.99$ 631,345,478$ 304,767,893$ 1,736,235,696$
20 2015 (3 qtrs annualized)
2,823,017 356.01$ 1,005,022,401$ 210.86$ 595,248,233$ 409,774,168$ 2,146,009,864$
21 2016 (proj) 2,909,118 371.67$ 1,081,231,821$ 214.44$ 623,825,303$ 457,406,517$ 2,603,416,381$
22 2017 (proj) 2,997,844 388.02$ 1,163,233,988$ 224.78$ 673,845,667$ 489,388,322$ 3,092,804,702$
23 2018 (proj) 3,089,277 405.10$ 1,251,455,318$ 235.56$ 727,725,171$ 523,730,147$ 3,616,534,849$
Exte
nsio
n
Actual/Projected ExpendituresBudget Neutrality Limit
His
toric
al a
nd C
urre
nt
See Exhibit 23 (Aggregate)

SoonerCare Budget Neutrality (2016-2018 Extension) – December 2015 8
Exhibit 5 – Budget Neutrality for ABD-Urban MEG
DY CY Member Months PMPM Aggregate PMPM AggregateSavings/ (Deficit)
Cumulative Savings/ (Deficit)
1 1996
2 1997
3 1998
4 1999 96,785 536.14$ 51,889,826$
5 2000 190,315 567.55$ 108,013,756$
6 2001 279,689 600.81$ 168,040,252$
7 2002 306,526 636.02$ 194,956,243$
8 2003 233,742 673.29$ 157,375,990$
9 2004 244,590 712.74$ 174,330,070$ 489.16$ 119,644,174$ 54,685,896$ 54,685,896$
10 2005 255,066 754.51$ 192,450,068$ 668.41$ 170,487,472$ 21,962,596$ 76,648,492$
11 2006 259,473 798.73$ 207,247,624$ 858.00$ 222,627,081$ (15,379,457)$ 61,269,036$
12 2007 268,332 840.26$ 225,468,646$ 894.55$ 240,036,203$ (14,567,557)$ 46,701,479$
13 2008 283,834 883.96$ 250,898,901$ 962.43$ 273,171,226$ (22,272,325)$ 24,429,154$
14 2009 301,034 929.92$ 279,937,423$ 1,003.30$ 302,026,587$ (22,089,164)$ 2,339,990$
15 2010 327,267 978.28$ 320,157,269$ 960.84$ 314,450,856$ 5,706,413$ 8,046,403$
16 2011 344,575 1,029.15$ 354,617,902$ 931.12$ 320,839,827$ 33,778,075$ 41,824,478$
17 2012 348,935 1,082.66$ 377,778,436$ 932.40$ 325,345,676$ 52,432,760$ 94,257,239$
18 2013 360,205 1,128.13$ 406,358,067$ 974.58$ 351,048,325$ 55,309,742$ 149,566,981$
19 2014 365,630 1,175.51$ 429,801,721$ 1,055.90$ 386,068,587$ 43,733,135$ 193,300,115$
20 2015 (3 qtrs annualized))
362,284 1,224.89$ 443,758,049$ 1,089.49$ 394,706,303$ 49,051,745$ 242,351,861$
21 2016 (proj) 369,725 1,276.34$ 471,894,507$ 1,102.10$ 407,475,263$ 64,419,244$ 306,771,104$
22 2017 (proj) 377,318$ 1,329.95$ 501,813,140$ 1,149.30$ 433,650,553$ 68,162,587$ 374,933,691$
23 2018 (proj) 385,068$ 1,385.80$ 533,628,646$ 1,198.46$ 461,490,257$ 72,138,390$ 447,072,081$
Exte
nsio
n
Actual/Projected ExpendituresBudget Neutrality Limit
His
toric
al a
nd C
urre
nt
See Exhibit 23 (Aggregate)
SoonerCare Budget Neutrality (2016-2018 Extension) – December 2015 9
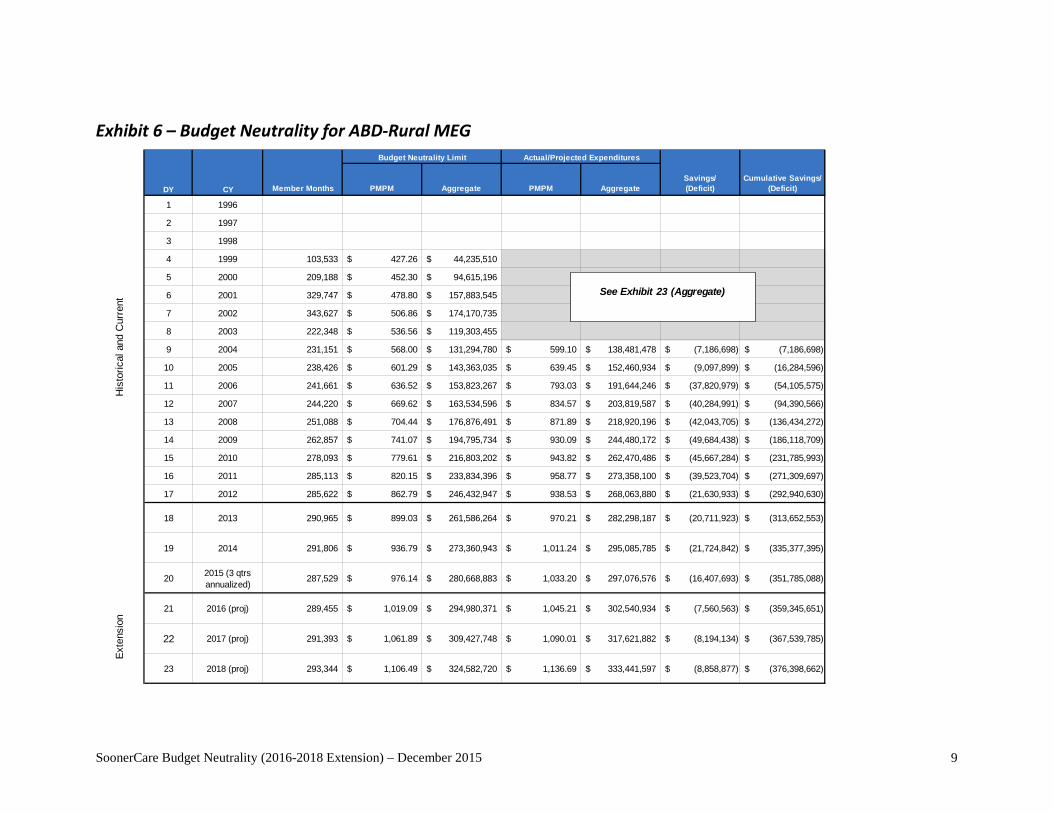
Exhibit 6 – Budget Neutrality for ABD-Rural MEG
DY CY Member Months PMPM Aggregate PMPM AggregateSavings/ (Deficit)
Cumulative Savings/ (Deficit)
1 1996
2 1997
3 1998
4 1999 103,533 427.26$ 44,235,510$
5 2000 209,188 452.30$ 94,615,196$
6 2001 329,747 478.80$ 157,883,545$
7 2002 343,627 506.86$ 174,170,735$
8 2003 222,348 536.56$ 119,303,455$
9 2004 231,151 568.00$ 131,294,780$ 599.10$ 138,481,478$ (7,186,698)$ (7,186,698)$
10 2005 238,426 601.29$ 143,363,035$ 639.45$ 152,460,934$ (9,097,899)$ (16,284,596)$
11 2006 241,661 636.52$ 153,823,267$ 793.03$ 191,644,246$ (37,820,979)$ (54,105,575)$
12 2007 244,220 669.62$ 163,534,596$ 834.57$ 203,819,587$ (40,284,991)$ (94,390,566)$
13 2008 251,088 704.44$ 176,876,491$ 871.89$ 218,920,196$ (42,043,705)$ (136,434,272)$
14 2009 262,857 741.07$ 194,795,734$ 930.09$ 244,480,172$ (49,684,438)$ (186,118,709)$
15 2010 278,093 779.61$ 216,803,202$ 943.82$ 262,470,486$ (45,667,284)$ (231,785,993)$
16 2011 285,113 820.15$ 233,834,396$ 958.77$ 273,358,100$ (39,523,704)$ (271,309,697)$
17 2012 285,622 862.79$ 246,432,947$ 938.53$ 268,063,880$ (21,630,933)$ (292,940,630)$
18 2013 290,965 899.03$ 261,586,264$ 970.21$ 282,298,187$ (20,711,923)$ (313,652,553)$
19 2014 291,806 936.79$ 273,360,943$ 1,011.24$ 295,085,785$ (21,724,842)$ (335,377,395)$
20 2015 (3 qtrs annualized)
287,529 976.14$ 280,668,883$ 1,033.20$ 297,076,576$ (16,407,693)$ (351,785,088)$
21 2016 (proj) 289,455 1,019.09$ 294,980,371$ 1,045.21$ 302,540,934$ (7,560,563)$ (359,345,651)$
22 2017 (proj) 291,393 1,061.89$ 309,427,748$ 1,090.01$ 317,621,882$ (8,194,134)$ (367,539,785)$
23 2018 (proj) 293,344 1,106.49$ 324,582,720$ 1,136.69$ 333,441,597$ (8,858,877)$ (376,398,662)$
Exte
nsio
n
Actual/Projected ExpendituresBudget Neutrality Limit
His
toric
al a
nd C
urre
nt
See Exhibit 23 (Aggregate)
SoonerCare Budget Neutrality (2016-2018 Extension) – December 2015 10
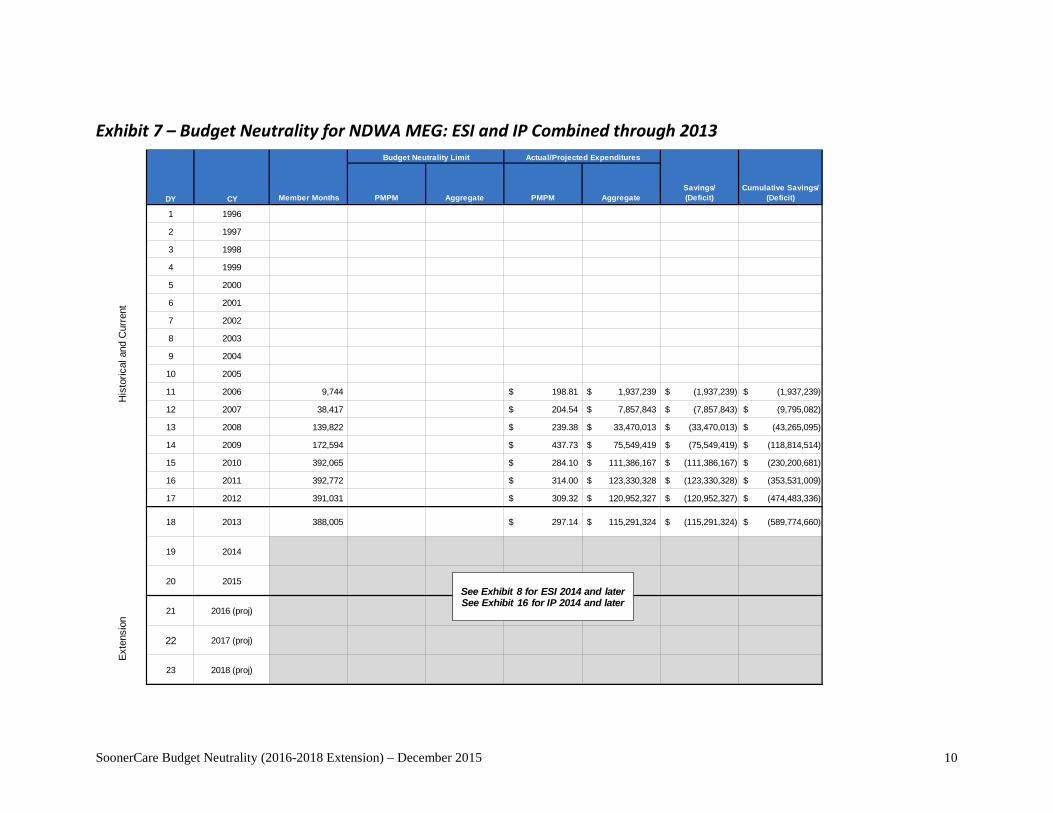
Exhibit 7 – Budget Neutrality for NDWA MEG: ESI and IP Combined through 2013
DY CY Member Months PMPM Aggregate PMPM AggregateSavings/ (Deficit)
Cumulative Savings/ (Deficit)
1 1996
2 1997
3 1998
4 1999
5 2000
6 2001
7 2002
8 2003
9 2004
10 2005
11 2006 9,744 198.81$ 1,937,239$ (1,937,239)$ (1,937,239)$
12 2007 38,417 204.54$ 7,857,843$ (7,857,843)$ (9,795,082)$
13 2008 139,822 239.38$ 33,470,013$ (33,470,013)$ (43,265,095)$
14 2009 172,594 437.73$ 75,549,419$ (75,549,419)$ (118,814,514)$
15 2010 392,065 284.10$ 111,386,167$ (111,386,167)$ (230,200,681)$
16 2011 392,772 314.00$ 123,330,328$ (123,330,328)$ (353,531,009)$
17 2012 391,031 309.32$ 120,952,327$ (120,952,327)$ (474,483,336)$
18 2013 388,005 297.14$ 115,291,324$ (115,291,324)$ (589,774,660)$
19 2014
20 2015
21 2016 (proj)
22 2017 (proj)
23 2018 (proj)
Exte
nsio
n
Actual/Projected ExpendituresBudget Neutrality Limit
His
toric
al a
nd C
urre
nt
See Exhibit 8 for ESI 2014 and laterSee Exhibit 16 for IP 2014 and later

SoonerCare Budget Neutrality (2016-2018 Extension) – December 2015 11
Exhibit 8 – Budget Neutrality for NDWA MEG: ESI – 2014 to 2018
DY CY Member Months PMPM Aggregate PMPM AggregateSavings/ (Deficit)
Cumulative Savings/ (Deficit)
1 1996
2 1997
3 1998
4 1999
5 2000
6 2001
7 2002
8 2003
9 2004
10 2005
11 2006
12 2007
13 2008
14 2009
15 2010
16 2011
17 2012
18 2013
19 2014 273,146 72.50$ 19,802,018$ (19,802,018)$ (375,706,118)$
20 2015 (3 qtrs annualized)
155,987 280.97$ 43,827,503$ (43,827,503)$ (419,533,620)$
21 2016 (proj) 172,788 293.33$ 50,684,409$ (50,684,409)$ (470,218,029)$
22 2017 (proj) 191,400 306.24$ 58,614,092$ (58,614,092)$ (528,832,121)$
23 2018 (proj) 212,016 319.71$ 67,784,392$ (67,784,392)$ (596,616,513)$
Budget Neutrality Limit Actual/Projected Expenditures
His
toric
al a
nd C
urre
ntEx
tens
ion
SoonerCare Budget Neutrality (2016-2018 Extension) – December 2015 12
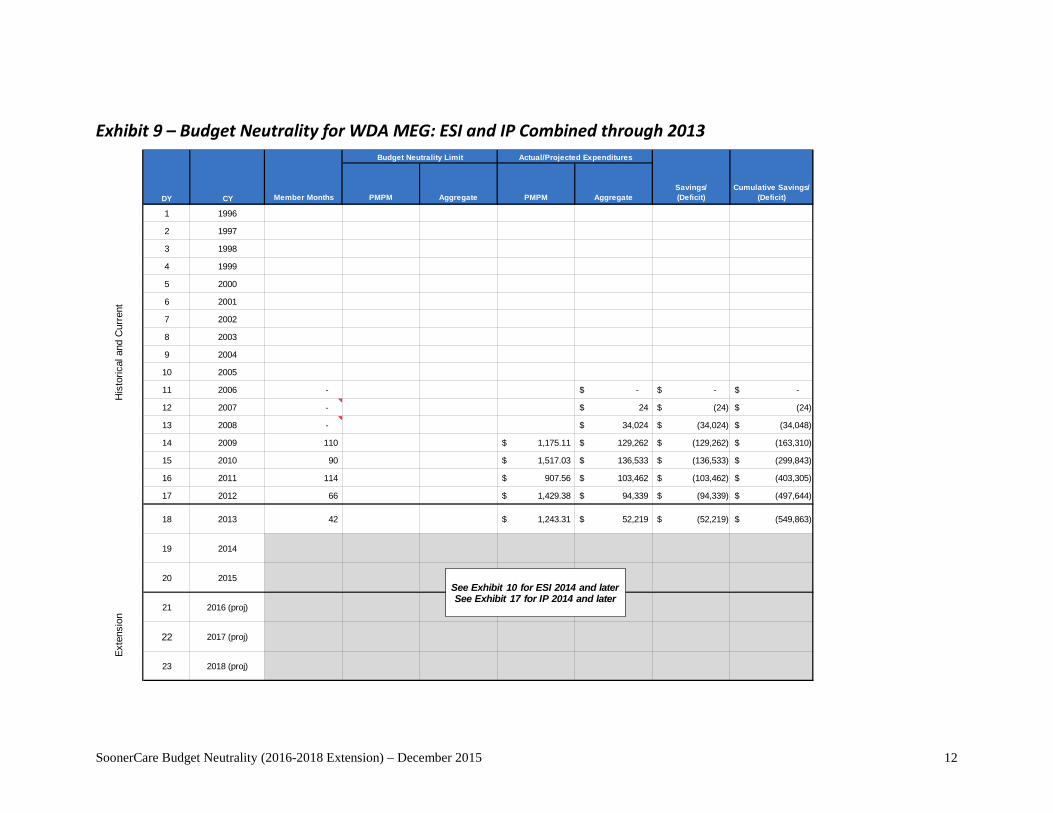
Exhibit 9 – Budget Neutrality for WDA MEG: ESI and IP Combined through 2013
DY CY Member Months PMPM Aggregate PMPM AggregateSavings/ (Deficit)
Cumulative Savings/ (Deficit)
1 1996
2 1997
3 1998
4 1999
5 2000
6 2001
7 2002
8 2003
9 2004
10 2005
11 2006 - -$ -$ -$
12 2007 - 24$ (24)$ (24)$
13 2008 - 34,024$ (34,024)$ (34,048)$
14 2009 110 1,175.11$ 129,262$ (129,262)$ (163,310)$
15 2010 90 1,517.03$ 136,533$ (136,533)$ (299,843)$
16 2011 114 907.56$ 103,462$ (103,462)$ (403,305)$
17 2012 66 1,429.38$ 94,339$ (94,339)$ (497,644)$
18 2013 42 1,243.31$ 52,219$ (52,219)$ (549,863)$
19 2014
20 2015
21 2016 (proj)
22 2017 (proj)
23 2018 (proj)
Exte
nsio
n
Actual/Projected ExpendituresBudget Neutrality Limit
His
toric
al a
nd C
urre
nt
See Exhibit 10 for ESI 2014 and laterSee Exhibit 17 for IP 2014 and later

SoonerCare Budget Neutrality (2016-2018 Extension) – December 2015 13
Exhibit 10 – Budget Neutrality for WDA MEG: ESI – 2014 to 20182
2 All WDA enrollment has occurred within the IP component of the program.
DY CY Member Months PMPM Aggregate PMPM AggregateSavings/ (Deficit)
Cumulative Savings/ (Deficit)
1 1996
2 1997
3 1998
4 1999
5 2000
6 2001
7 2002
8 2003
9 2004
10 2005
11 2006
12 2007
13 2008
14 2009
15 2010
16 2011
17 2012
18 2013
19 2014
20 2015 (3 qtrs annualized)
- -$ -$ -$ -$
21 2016 (proj) - -$ -$ -$ -$
22 2017 (proj) - -$ -$ -$ -$
23 2018 (proj) - -$ -$ -$ -$
Budget Neutrality Limit Actual/Projected Expenditures
His
toric
al a
nd C
urre
ntEx
tens
ion
SoonerCare Budget Neutrality (2016-2018 Extension) – December 2015 14
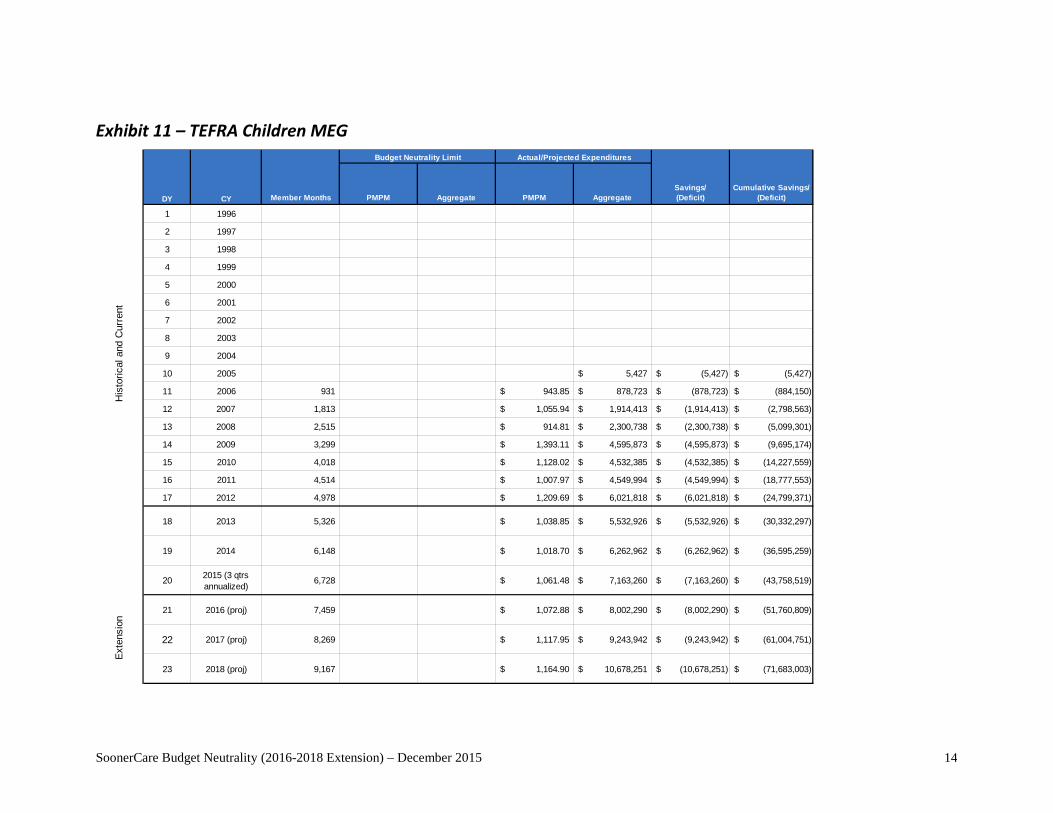
Exhibit 11 – TEFRA Children MEG
DY CY Member Months PMPM Aggregate PMPM AggregateSavings/ (Deficit)
Cumulative Savings/ (Deficit)
1 1996
2 1997
3 1998
4 1999
5 2000
6 2001
7 2002
8 2003
9 2004
10 2005 5,427$ (5,427)$ (5,427)$
11 2006 931 943.85$ 878,723$ (878,723)$ (884,150)$
12 2007 1,813 1,055.94$ 1,914,413$ (1,914,413)$ (2,798,563)$
13 2008 2,515 914.81$ 2,300,738$ (2,300,738)$ (5,099,301)$
14 2009 3,299 1,393.11$ 4,595,873$ (4,595,873)$ (9,695,174)$
15 2010 4,018 1,128.02$ 4,532,385$ (4,532,385)$ (14,227,559)$
16 2011 4,514 1,007.97$ 4,549,994$ (4,549,994)$ (18,777,553)$
17 2012 4,978 1,209.69$ 6,021,818$ (6,021,818)$ (24,799,371)$
18 2013 5,326 1,038.85$ 5,532,926$ (5,532,926)$ (30,332,297)$
19 2014 6,148 1,018.70$ 6,262,962$ (6,262,962)$ (36,595,259)$
20 2015 (3 qtrs annualized)
6,728 1,061.48$ 7,163,260$ (7,163,260)$ (43,758,519)$
21 2016 (proj) 7,459 1,072.88$ 8,002,290$ (8,002,290)$ (51,760,809)$
22 2017 (proj) 8,269 1,117.95$ 9,243,942$ (9,243,942)$ (61,004,751)$
23 2018 (proj) 9,167 1,164.90$ 10,678,251$ (10,678,251)$ (71,683,003)$
Exte
nsio
n
Actual/Projected ExpendituresBudget Neutrality Limit
His
toric
al a
nd C
urre
nt
SoonerCare Budget Neutrality (2016-2018 Extension) – December 2015 15
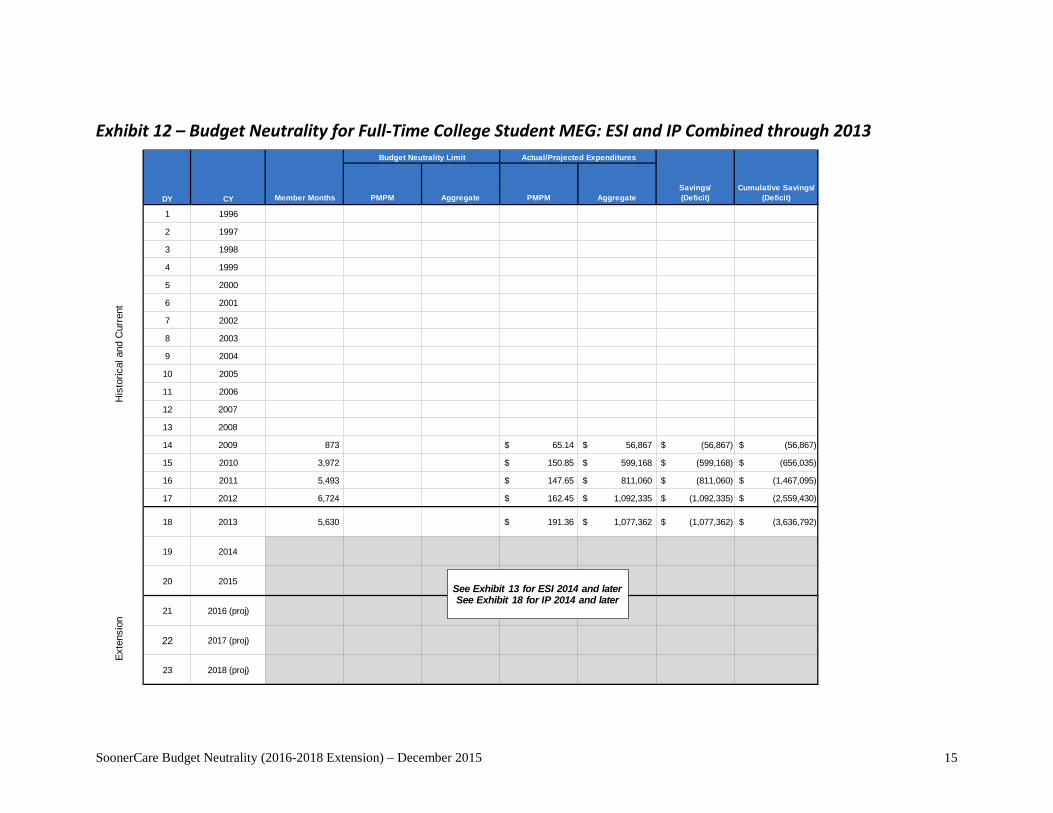
Exhibit 12 – Budget Neutrality for Full-Time College Student MEG: ESI and IP Combined through 2013
DY CY Member Months PMPM Aggregate PMPM AggregateSavings/ (Deficit)
Cumulative Savings/ (Deficit)
1 1996
2 1997
3 1998
4 1999
5 2000
6 2001
7 2002
8 2003
9 2004
10 2005
11 2006
12 2007
13 2008
14 2009 873 65.14$ 56,867$ (56,867)$ (56,867)$
15 2010 3,972 150.85$ 599,168$ (599,168)$ (656,035)$
16 2011 5,493 147.65$ 811,060$ (811,060)$ (1,467,095)$
17 2012 6,724 162.45$ 1,092,335$ (1,092,335)$ (2,559,430)$
18 2013 5,630 191.36$ 1,077,362$ (1,077,362)$ (3,636,792)$
19 2014
20 2015
21 2016 (proj)
22 2017 (proj)
23 2018 (proj)
Exte
nsio
n
Actual/Projected ExpendituresBudget Neutrality Limit
His
toric
al a
nd C
urre
nt
See Exhibit 13 for ESI 2014 and laterSee Exhibit 18 for IP 2014 and later

SoonerCare Budget Neutrality (2016-2018 Extension) – December 2015 16
Exhibit 13– Budget Neutrality for Full-Time College Student MEG: ESI – 2014 to 2018
DY CY Member Months PMPM Aggregate PMPM AggregateSavings/ (Deficit)
Cumulative Savings/ (Deficit)
1 1996
2 1997
3 1998
4 1999
5 2000
6 2001
7 2002
8 2003
9 2004
10 2005
11 2006
12 2007
13 2008
14 2009
15 2010
16 2011
17 2012
18 2013
19 2014 1,299 181.60$ 235,903$ (235,903)$ (1,832,266)$
20 2015 (3 qtrs annualized)
1,179 260.20$ 306,687$ (306,687)$ (2,138,953)$
21 2016 (proj) 1,319 271.65$ 358,222$ (358,222)$ (2,497,175)$
22 2017 (proj) 1,475 283.60$ 418,418$ (418,418)$ (2,915,593)$
23 2018 (proj) 1,651 296.08$ 488,728$ (488,728)$ (3,404,321)$
Budget Neutrality Limit Actual/Projected Expenditures
His
toric
al a
nd C
urre
ntEx
tens
ion

SoonerCare Budget Neutrality (2016-2018 Extension) – December 2015 17
Exhibit 14– Budget Neutrality for Foster Parent MEG: ESI3
3 The OHCA is not projecting any enrollment for this MEG during the extension period.
DY CY Member Months PMPM Aggregate PMPM AggregateSavings/ (Deficit)
Cumulative Savings/ (Deficit)
1 1996
2 1997
3 1998
4 1999
5 2000
6 2001
7 2002
8 2003
9 2004
10 2005
11 2006
12 2007
13 2008
14 2009
15 2010
16 2011
17 2012
18 2013
19 2014
20 2015
21 2016 (proj)
22 2017 (proj)
23 2018 (proj)
Budget Neutrality Limit Actual/Projected Expenditures
Exte
nsio
nH
isto
rical
and
Cur
rent
SoonerCare Budget Neutrality (2016-2018 Extension) – December 2015 18
Exhibit 15– Not-for-Profit Employees MEG: ESI4
4 The OHCA is not projecting any enrollment for this MEG during the extension period.
DY CY Member Months PMPM Aggregate PMPM AggregateSavings/ (Deficit)
Cumulative Savings/ (Deficit)
1 1996
2 1997
3 1998
4 1999
5 2000
6 2001
7 2002
8 2003
9 2004
10 2005
11 2006
12 2007
13 2008
14 2009
15 2010
16 2011
17 2012
18 2013
19 2014
20 2015
21 2016 (proj)
22 2017 (proj)
23 2018 (proj)
Budget Neutrality Limit Actual/Projected Expenditures
Exte
nsio
nH
isto
rical
and
Cur
rent

SoonerCare Budget Neutrality (2016-2018 Extension) – December 2015 19
Exhibit 16 – NDWA MEG: IP – 2014 to 2018
DY CY Member Months PMPM Aggregate PMPM AggregateSavings/ (Deficit)
Cumulative Savings/ (Deficit)
1 1996
2 1997
3 1998
4 1999
5 2000
6 2001
7 2002
8 2003
9 2004
10 2005
11 2006
12 2007
13 2008
14 2009
15 2010
16 2011
17 2012
18 2013
19 2014 12,712 4,478.15$ 56,926,254$ (56,926,254)$ (290,796,815)$
20 2015 (3 qtrs annualized)
49,305 584.11$ 28,799,788$ (28,799,788)$ (319,596,603)$
21 2016 (proj) 41,912 609.81$ 25,558,658$ (25,558,658)$ (345,155,260)$
22 2017 (proj) 35,628 636.64$ 22,682,285$ (22,682,285)$ (367,837,545)$
23 2018 (proj) 30,286 664.66$ 20,129,619$ (20,129,619)$ (387,967,164)$
Budget Neutrality Limit Actual/Projected Expenditures
Exte
nsio
nH
isto
rical
and
Cur
rent
SoonerCare Budget Neutrality (2016-2018 Extension) – December 2015 20
Exhibit 17 – WDA MEG: IP – 2014 to 2018
DY CY Member Months PMPM Aggregate PMPM AggregateSavings/ (Deficit)
Cumulative Savings/ (Deficit)
1 1996
2 1997
3 1998
4 1999
5 2000
6 2001
7 2002
8 2003
9 2004
10 2005
11 2006
12 2007
13 2008
14 2009
15 2010
16 2011
17 2012
18 2013
19 2014 2 3,121.50$ 6,243$ (6,243)$ (556,106)$
20 2015 (3 qtrs annualized)
13 3,405.10$ 45,401$ (45,401)$ (601,507)$
21 2016 (proj) 12 3,548.11$ 42,577$ (42,577)$ (644,085)$
22 2017 (proj) 12 3,697.13$ 44,366$ (44,366)$ (688,450)$
23 2018 (proj) 12 3,852.41$ 46,229$ (46,229)$ (734,679)$
Budget Neutrality Limit Actual/Projected Expenditures
His
toric
al a
nd C
urre
ntEx
tens
ion
SoonerCare Budget Neutrality (2016-2018 Extension) – December 2015 21
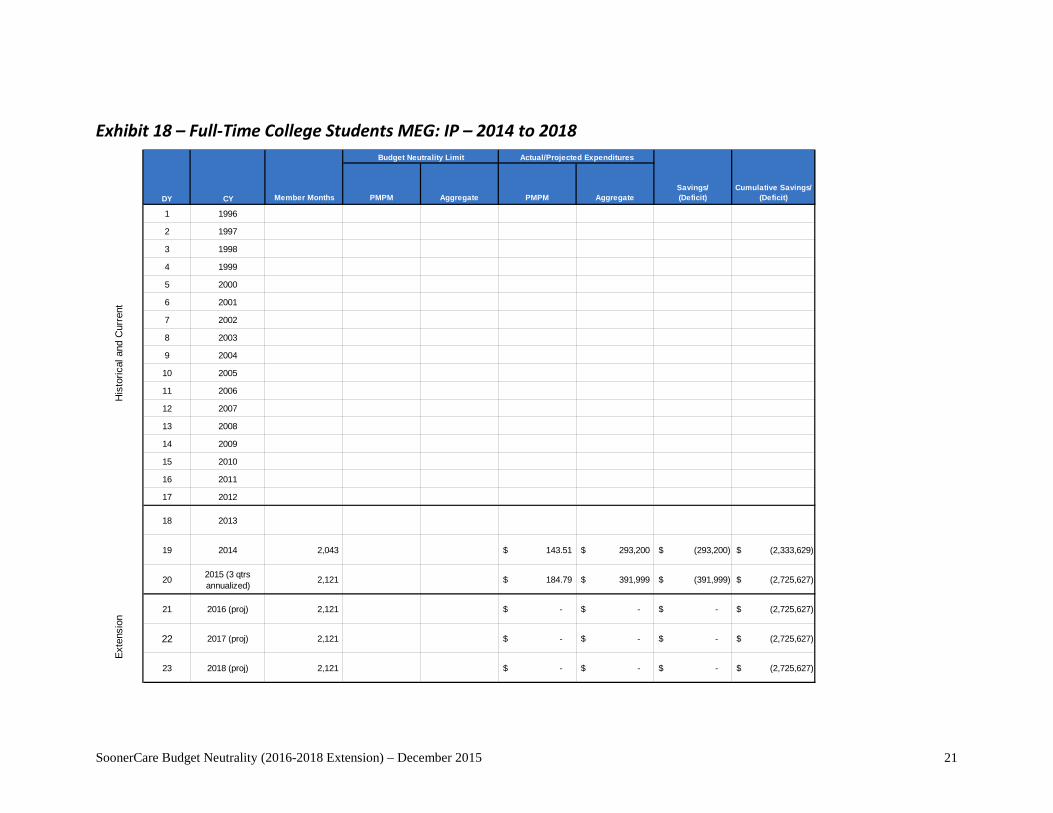
Exhibit 18 – Full-Time College Students MEG: IP – 2014 to 2018
DY CY Member Months PMPM Aggregate PMPM AggregateSavings/ (Deficit)
Cumulative Savings/ (Deficit)
1 1996
2 1997
3 1998
4 1999
5 2000
6 2001
7 2002
8 2003
9 2004
10 2005
11 2006
12 2007
13 2008
14 2009
15 2010
16 2011
17 2012
18 2013
19 2014 2,043 143.51$ 293,200$ (293,200)$ (2,333,629)$
20 2015 (3 qtrs annualized)
2,121 184.79$ 391,999$ (391,999)$ (2,725,627)$
21 2016 (proj) 2,121 -$ -$ -$ (2,725,627)$
22 2017 (proj) 2,121 -$ -$ -$ (2,725,627)$
23 2018 (proj) 2,121 -$ -$ -$ (2,725,627)$
Budget Neutrality Limit Actual/Projected Expenditures
His
toric
al a
nd C
urre
ntEx
tens
ion
SoonerCare Budget Neutrality (2016-2018 Extension) – December 2015 22
Exhibit 19 – Budget Neutrality for Foster Parent MEG: IP5
5 The OHCA is not projecting any enrollment for this MEG during the extension period.
DY CY Member Months PMPM Aggregate PMPM AggregateSavings/ (Deficit)
Cumulative Savings/ (Deficit)
1 1996
2 1997
3 1998
4 1999
5 2000
6 2001
7 2002
8 2003
9 2004
10 2005
11 2006
12 2007
13 2008
14 2009
15 2010
16 2011
17 2012
18 2013
19 2014
20 2015
21 2016 (proj)
22 2017 (proj)
23 2018 (proj)
Budget Neutrality Limit Actual/Projected Expenditures
His
toric
al a
nd C
urre
ntEx
tens
ion

SoonerCare Budget Neutrality (2016-2018 Extension) – December 2015 23
Exhibit 20 – Not-for-Profit Employees MEG: IP6
6 The OHCA is not projecting any enrollment for this MEG during the extension period.
DY CY Member Months PMPM Aggregate PMPM AggregateSavings/ (Deficit)
Cumulative Savings/ (Deficit)
1 1996
2 1997
3 1998
4 1999
5 2000
6 2001
7 2002
8 2003
9 2004
10 2005
11 2006
12 2007
13 2008
14 2009
15 2010
16 2011
17 2012
18 2013
19 2014
20 2015
21 2016 (proj)
22 2017 (proj)
23 2018 (proj)
Budget Neutrality Limit Actual/Projected Expenditures
His
toric
al a
nd C
urre
ntEx
tens
ion
SoonerCare Budget Neutrality (2016-2018 Extension) – December 2015 24
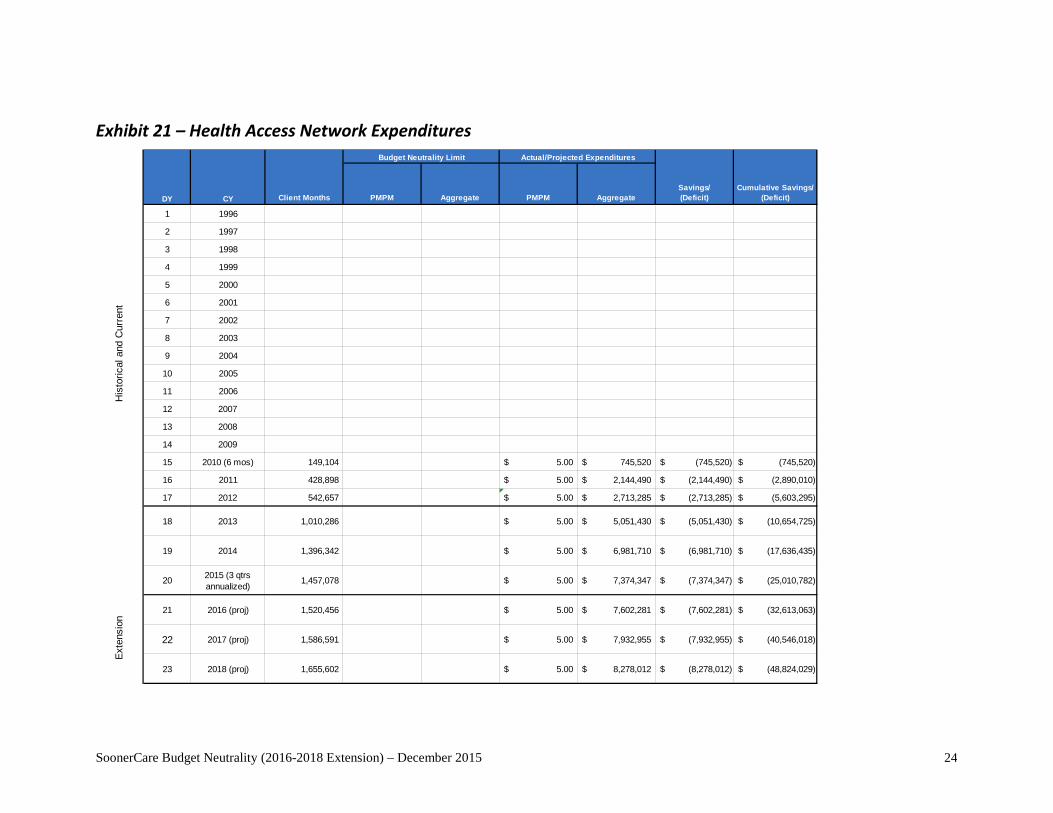
Exhibit 21 – Health Access Network Expenditures
DY CY Client Months PMPM Aggregate PMPM AggregateSavings/ (Deficit)
Cumulative Savings/ (Deficit)
1 1996
2 1997
3 1998
4 1999
5 2000
6 2001
7 2002
8 2003
9 2004
10 2005
11 2006
12 2007
13 2008
14 2009
15 2010 (6 mos) 149,104 5.00$ 745,520$ (745,520)$ (745,520)$
16 2011 428,898 5.00$ 2,144,490$ (2,144,490)$ (2,890,010)$
17 2012 542,657 5.00$ 2,713,285$ (2,713,285)$ (5,603,295)$
18 2013 1,010,286 5.00$ 5,051,430$ (5,051,430)$ (10,654,725)$
19 2014 1,396,342 5.00$ 6,981,710$ (6,981,710)$ (17,636,435)$
20 2015 (3 qtrs annualized)
1,457,078 5.00$ 7,374,347$ (7,374,347)$ (25,010,782)$
21 2016 (proj) 1,520,456 5.00$ 7,602,281$ (7,602,281)$ (32,613,063)$
22 2017 (proj) 1,586,591 5.00$ 7,932,955$ (7,932,955)$ (40,546,018)$
23 2018 (proj) 1,655,602 5.00$ 8,278,012$ (8,278,012)$ (48,824,029)$
Exte
nsio
n
Actual/Projected ExpendituresBudget Neutrality Limit
His
toric
al a
nd C
urre
nt

SoonerCare Budget Neutrality (2016-2018 Extension) – December 2015 25
Exhibit 22 – Health Management Program Expenditures7
7 Presented for informational purposes only. Expenditures are included within the four traditional MEG exhibits.
DY CY TANF-U TANF-R ABD-U ABD-RTotal Client
Months TANF-U TANF-R ABD-U ABD-RTotal
Expenditures
1 1996
2 1997
3 1998
4 1999
5 2000
6 2001
7 2002
8 2003
9 2004
10 2005
11 2006
12 2007
13 2008
14 2009
15 2010
16 2011
17 2012
18 2013 3,741,817 2,618,683 360,205 290,965 7,011,670 3,118,501$ 2,182,460$ 300,202$ 242,496$ 5,843,658$
19 2014 4,001,208 2,745,120 365,630 291,806 7,403,764 8,334,149$ 5,717,833$ 761,574$ 607,805$ 15,421,361$
20 2015 (3 qtrs annualized)
4,123,944 2,823,017 362,284 287,529 7,596,775 3,771,134$ 2,581,504$ 331,290$ 262,931$ 6,946,859$
21 2016 (proj) 4,303,322 2,909,118 369,725 289,455 7,871,619 3,911,699$ 2,644,374$ 336,078$ 263,113$ 7,155,264$
22 2017 (proj) 4,490,502 2,997,844 377,318 291,393 8,157,057 4,057,180$ 2,708,560$ 340,908$ 263,274$ 7,369,922$
23 2018 (proj) 4,685,824 3,089,277 385,068 293,344 8,453,513 4,207,740$ 2,774,085$ 345,780$ 263,415$ 7,591,020$
Traditional MEG Client Months HMP Expenditures (Prorated across MEGs based on Client Months)
Exte
nsio
nH
isto
rical
and
Cur
rent

SoonerCare Budget Neutrality (2016-2018 Extension) – December 2015 26
Exhibit 23 – Aggregate Budget Neutrality (All MEGs)
DY CY Member Months PMPM Aggregate PMPM AggregateSavings/ (Deficit)
Cumulative Savings/ (Deficit)
1 1996 2,337,532 122.41$ 286,138,649$ 170.69$ 398,999,423$ (112,860,774)$ (112,860,774)$
2 1997 2,282,744 130.39$ 297,656,008$ 134.54$ 307,126,525$ (9,470,517)$ (122,331,291)$
3 1998 2,550,505 138.92$ 354,305,243$ 106.62$ 271,927,279$ 82,377,964$ (39,953,328)$
4 1999 3,201,226 168.75$ 540,219,561$ 144.65$ 463,050,620$ 77,168,941$ 37,215,613$
5 2000 3,496,982 197.53$ 690,771,669$ 171.75$ 600,600,099$ 90,171,570$ 127,387,183$
6 2001 4,513,310 217.40$ 981,193,992$ 129.19$ 583,054,043$ 398,139,949$ 525,527,133$
7 2002 4,823,829 231.19$ 1,115,204,678$ 176.23$ 850,117,611$ 265,087,067$ 790,614,200$
8 2003 4,716,758 230.58$ 1,087,577,307$ 194.45$ 917,157,855$ 170,419,452$ 961,033,652$
9 2004 4,886,804 245.50$ 1,199,726,867$ 181.28$ 885,888,955$ 313,837,912$ 1,274,871,564$
10 2005 5,038,078 261.38$ 1,316,858,944$ 222.43$ 1,120,637,046$ 196,221,898$ 1,471,093,461$
11 2006 5,180,782 277.35$ 1,436,908,230$ 264.24$ 1,368,966,665$ 67,941,565$ 1,539,035,027$
12 2007 5,451,378 290.31$ 1,582,588,944$ 271.96$ 1,482,534,451$ 100,054,493$ 1,639,089,520$
13 2008 5,386,004 308.25$ 1,660,247,275$ 300.79$ 1,620,046,448$ 40,200,827$ 1,679,290,347$
14 2009 5,839,782 322.59$ 1,883,853,423$ 321.58$ 1,877,931,749$ 5,921,674$ 1,685,212,021$
15 2010 6,367,794 338.40$ 2,154,888,798$ 313.40$ 1,995,690,240$ 159,198,558$ 1,844,410,579$
16 2011 6,420,012 357.88$ 2,297,585,380$ 329.93$ 2,118,136,761$ 179,448,619$ 2,023,859,198$
17 2012 6,819,943 372.95$ 2,543,464,833$ 326.38$ 2,225,879,926$ 317,584,907$ 2,341,444,105$
18 2013 7,011,670 389.11$ 2,728,288,274$ 333.60$ 2,339,081,302$ 389,206,972$ 2,730,651,077$
19 2014 7,403,764 403.10$ 2,984,482,165$ 327.25$ 2,422,883,479$ 561,598,686$ 3,292,249,763$
20 2015 (3 qtrs annualized)
7,596,775 418.19$ 3,176,912,438$ 311.06$ 2,363,040,193$ 813,872,245$ 4,106,122,008$
21 2016 (proj) 7,871,619 435.11$ 3,425,015,919$ 314.31$ 2,474,154,860$ 950,861,059$ 5,056,983,067$
22 2017 (proj) 8,157,057 452.66$ 3,692,376,342$ 327.31$ 2,669,884,272$ 1,022,492,070$ 6,079,475,137$
23 2018 (proj) 8,453,513 470.95$ 3,981,166,583$ 340.99$ 2,882,549,354$ 1,098,617,229$ 7,178,092,366$
Exte
nsio
n
Actual/Projected ExpendituresBudget Neutrality Limit
His
toric
al a
nd C
urre
nt