OKEREKE / International Journal of Engineering Research ... · PDF fileOKEREKE / International...
10
OKEREKE / International Journal of Engineering Research and Applications (IJERA) ISSN: 2248-9622 www.ijera.com Vol. 2, Issue 3, May-Jun 2012, pp.1968-1977 1968 | P a g e Analysis Of Landsat And Aeromagnetic Data For Mapping Of Linear Structures: A Case Study Of Yola Area, Upper Benue Trough, Nigeria *OKEREKE, C. N., *ONU, N.N., *IBE,K.K.,*SELEMO,A.O.I.,*OPARA,A.I., *IKORO,D.O.,*IBENEME, S.I. & **OHA, I.A. *Geosciences Research Team, Department of Geosciences, Federal University of Technology, Owerri, Imo State, Nigeria. **Department of Geology, University of Nigeria, Nsukka, Enugu State, Nigeria. Abstract The study area is part of the Upper Benue Trough comprising of Yola and its adjoining areas and lies within latitudes 9 0 00 ́ - 10 0 00 ́ N and longitudes 11 0 30 ́ - 12 0 30 ́E. The objective of the study is to identify and delineate the structures associated with the area and also the trends/patterns of such structures and infer their relationship with basin formation and dynamics. And also to determine the thickness of the basement, the basement topography and the hydrocarbon potential and groundwater availability of the study area. The landsat imagery generated was processed using ILWIS 3.2 Academic and Erdas imaging softwares. The structural trend is predominantly in the NE-SW direction. The drainage pattern is dendritic which is indicative of lithological, structural and topographic differences and also indicative of alluvial rocks, which is typical of the geology of the area that consists mainly of sedimentary rocks. Areas of topographic heights averaging about 500m are potential region for groundwater assessment. These areas agree with areas in the lineament map where the lineament density is high. It was observed that these regions have a lot of lineaments crossing each other which is indicative of groundwater availability. Results of the magnetic data revealed two depths: a shallow layer of magnetization with depths ranging from 0.223km to 0.934km with an average depth of 0.546km while the deeper layer of magnetization has its depths ranging from 1.233km to 4.013km with an average depth of 2.788km. The depths show that the basin is good for mineral prospecting and not favourable for hydrocarbon prospecting. The dominant trend of the magnetic data is the NE-SW direction which agrees with the landsat data. Key words: Upper Benue Trough, lineament, drainage, landsat, aeromagnetic, basement depth. 1. Introduction The Benue Trough is a linear NE-SW trending rift system whose development was closely associated with the separation of Africa from South America and the opening of the South Atlantic Ocean during the Cretaceous. The origin and evolution of the Benue Trough are fairly well documented (Wright (1968), Burke et. al 1971, Nwachukwu 1972, Olade 1975, Benkhelil 1988, 1989). The Benue Trough is characterized by the occurrence of several minerals of economic importance ranging from Coal, Barytes, Lead and Zinc etc. The aeromagnetic data for this work were acquired from the Geological Survey of Nigeria. The present area of study is the Yola arm of the Upper Benue Trough. The determination of sediment thickness above the basement and the delineation of major structures are very essential for better understanding of the geology of the Yola arm of the Upper Benue Trough. This work presents the results of the analysis of aeromagnetic data over this area. The objectives of the study are to identify and delineate the structures associated with the area and also the trends/patterns of such structures and infer their relationship with groundwater assessment.
Transcript of OKEREKE / International Journal of Engineering Research ... · PDF fileOKEREKE / International...

OKEREKE / International Journal of Engineering Research and Applications (IJERA)
ISSN: 2248-9622 www.ijera.com
Vol. 2, Issue 3, May-Jun 2012, pp.1968-1977
1968 | P a g e
Analysis Of Landsat And Aeromagnetic Data For Mapping Of
Linear Structures: A Case Study Of Yola Area, Upper Benue
Trough, Nigeria
*OKEREKE, C. N., *ONU, N.N.,
*IBE,K.K.,*SELEMO,A.O.I.,*OPARA,A.I.,
*IKORO,D.O.,*IBENEME, S.I. & **OHA, I.A. *Geosciences Research Team,
Department of Geosciences,
Federal University of Technology,
Owerri, Imo State, Nigeria.
**Department of Geology,
University of Nigeria, Nsukka,
Enugu State, Nigeria.
Abstract The study area is part of the Upper Benue Trough comprising of Yola and its adjoining areas and lies within
latitudes 90
00 ́ - 100 00 ́N and longitudes 11
0 30 ́ - 12
0 30 ́E. The objective of the study is to identify and
delineate the structures associated with the area and also the trends/patterns of such structures and infer their
relationship with basin formation and dynamics. And also to determine the thickness of the basement, the
basement topography and the hydrocarbon potential and groundwater availability of the study area. The landsat
imagery generated was processed using ILWIS 3.2 Academic and Erdas imaging softwares. The structural trend
is predominantly in the NE-SW direction. The drainage pattern is dendritic which is indicative of lithological,
structural and topographic differences and also indicative of alluvial rocks, which is typical of the geology of the
area that consists mainly of sedimentary rocks. Areas of topographic heights averaging about 500m are potential
region for groundwater assessment. These areas agree with areas in the lineament map where the lineament
density is high. It was observed that these regions have a lot of lineaments crossing each other which is
indicative of groundwater availability. Results of the magnetic data revealed two depths: a shallow layer of
magnetization with depths ranging from 0.223km to 0.934km with an average depth of 0.546km while the
deeper layer of magnetization has its depths ranging from 1.233km to 4.013km with an average depth of
2.788km. The depths show that the basin is good for mineral prospecting and not favourable for hydrocarbon
prospecting. The dominant trend of the magnetic data is the NE-SW direction which agrees with the landsat
data.
Key words: Upper Benue Trough, lineament, drainage, landsat, aeromagnetic, basement depth.
1. Introduction The Benue Trough is a linear NE-SW trending rift system whose development was closely associated with
the separation of Africa from South America and the opening of the South Atlantic Ocean during the
Cretaceous. The origin and evolution of the Benue Trough are fairly well documented (Wright (1968),
Burke et. al 1971, Nwachukwu 1972, Olade 1975, Benkhelil 1988, 1989). The Benue Trough is
characterized by the occurrence of several minerals of economic importance ranging from Coal, Barytes,
Lead and Zinc etc. The aeromagnetic data for this work were acquired from the Geological Survey of
Nigeria. The present area of study is the Yola arm of the Upper Benue Trough. The determination of
sediment thickness above the basement and the delineation of major structures are very essential for
better understanding of the geology of the Yola arm of the Upper Benue Trough. This work presents
the results of the analysis of aeromagnetic data over this area.
The objectives of the study are to identify and delineate the structures associated with the area and also the
trends/patterns of such structures and infer their relationship with groundwater assessment.
OKEREKE / International Journal of Engineering Research and Applications (IJERA)
ISSN: 2248-9622 www.ijera.com
Vol. 2, Issue 3, May-Jun 2012, pp.1968-1977
1969 | P a g e
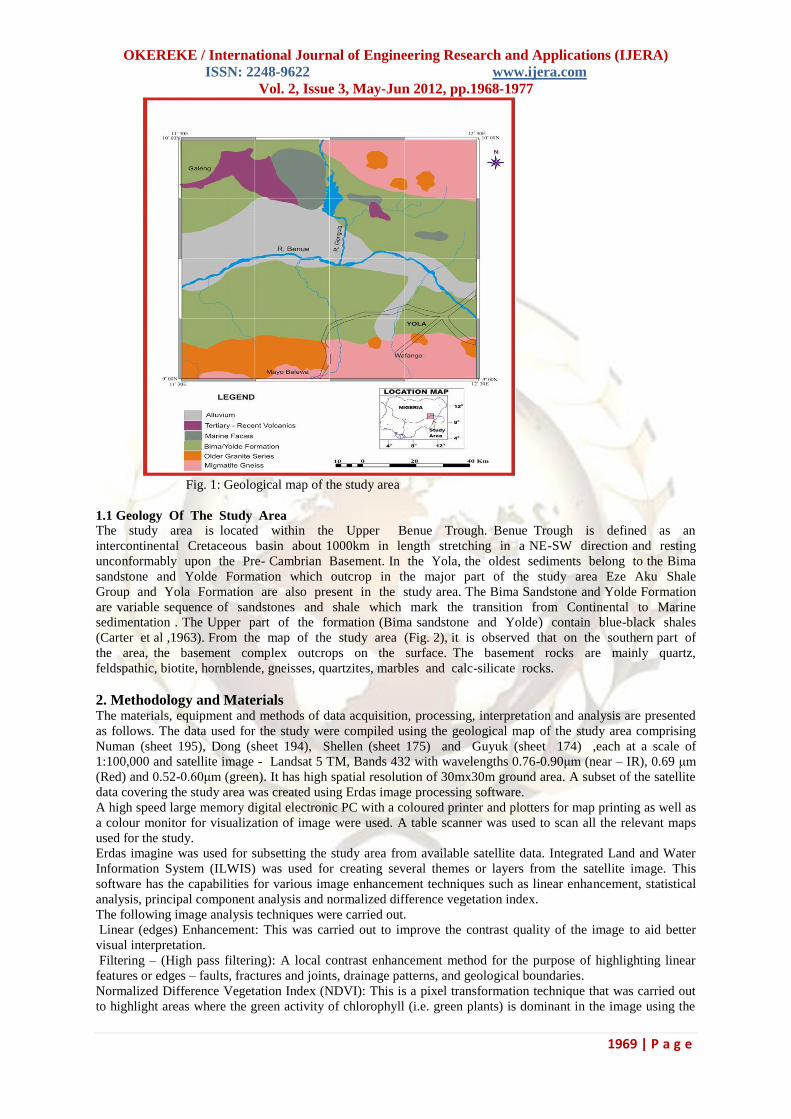
Fig. 1: Geological map of the study area
1.1 Geology Of The Study Area
The study area is located within the Upper Benue Trough. Benue Trough is defined as an
intercontinental Cretaceous basin about 1000km in length stretching in a NE-SW direction and resting
unconformably upon the Pre- Cambrian Basement. In the Yola, the oldest sediments belong to the Bima
sandstone and Yolde Formation which outcrop in the major part of the study area Eze Aku Shale
Group and Yola Formation are also present in the study area. The Bima Sandstone and Yolde Formation
are variable sequence of sandstones and shale which mark the transition from Continental to Marine
sedimentation . The Upper part of the formation (Bima sandstone and Yolde) contain blue-black shales
(Carter et al ,1963). From the map of the study area (Fig. 2), it is observed that on the southern part of
the area, the basement complex outcrops on the surface. The basement rocks are mainly quartz,
feldspathic, biotite, hornblende, gneisses, quartzites, marbles and calc-silicate rocks.
2. Methodology and Materials The materials, equipment and methods of data acquisition, processing, interpretation and analysis are presented
as follows. The data used for the study were compiled using the geological map of the study area comprising
Numan (sheet 195), Dong (sheet 194), Shellen (sheet 175) and Guyuk (sheet 174) ,each at a scale of
1:100,000 and satellite image - Landsat 5 TM, Bands 432 with wavelengths 0.76-0.90μm (near – IR), 0.69 μm
(Red) and 0.52-0.60μm (green). It has high spatial resolution of 30mx30m ground area. A subset of the satellite
data covering the study area was created using Erdas image processing software.
A high speed large memory digital electronic PC with a coloured printer and plotters for map printing as well as
a colour monitor for visualization of image were used. A table scanner was used to scan all the relevant maps
used for the study.
Erdas imagine was used for subsetting the study area from available satellite data. Integrated Land and Water
Information System (ILWIS) was used for creating several themes or layers from the satellite image. This
software has the capabilities for various image enhancement techniques such as linear enhancement, statistical
analysis, principal component analysis and normalized difference vegetation index.
The following image analysis techniques were carried out.
Linear (edges) Enhancement: This was carried out to improve the contrast quality of the image to aid better
visual interpretation.
Filtering – (High pass filtering): A local contrast enhancement method for the purpose of highlighting linear
features or edges – faults, fractures and joints, drainage patterns, and geological boundaries.
Normalized Difference Vegetation Index (NDVI): This is a pixel transformation technique that was carried out
to highlight areas where the green activity of chlorophyll (i.e. green plants) is dominant in the image using the
OKEREKE / International Journal of Engineering Research and Applications (IJERA)
ISSN: 2248-9622 www.ijera.com
Vol. 2, Issue 3, May-Jun 2012, pp.1968-1977
1970 | P a g e
NDVI Algorithm, which is given by NDVI landsat – TM3 – TM4/TM3-TM4. TM3 – Is the red region of the
wavelength band of the electromagnetic radiation.TM4 – Is the near infrared region of the wavelength band of
the electromagnetic radiation. Highlighting areas where green plants are dominant is a pointer to groundwater
occurrence.
Digital Data Base Creation: On –screen digitization was carried out on the Landsat image. Different layers or
themes were created. The following layers among others were created using ILWIS: -lineament and drainage
maps. Also from the existing topographic map, drainage pattern and linears are generated.
The aeromagnetic data were generated by digitizing the maps at grid-contour intercepts. These data were
processed with Surpher 8. Sixteen (16) spectral blocks were created as shown in Table 1below. The data were
modeled to get the basement depth contour map of the study area. Also the first to fourth degree regional
magnetic field as well as the first to fourth degree residual (polynomial) magnetic field map of the study area
were generated.
3. Interpretation of Results Various visual interpretation of the satellite image was carried out after the pictorial quality of the image was
improved through linear enhancement and filtering of the image.The drainage of the area is easily visible in the
landsat TM image. The drainage pattern was digitized on-screen as segment map using ILWIS. The drainage
linears of the area was also produced from existing topographic map Numan , Dong, Shellen and Guyuk. The
drainage pattern is dendritic which is indicative of lithological, structural, and topographic differences. It is
also indicative of alluvial rocks, which is typical of the geology of the area that consists mainly of sedimentary
rocks. The drainage texture of the area is variable (coarse to fine). It is characteristic of sedimentary rock and
variable permeable soil material, such as the alluvium and Bima/Yolde Formation. The direction of flow of
surface water can be seen on the image too. The flow directions are northwest and north south directions
controlled by topography and geological structures. This flow direction no doubt influences the hydrographic
network of groundwater in the area.
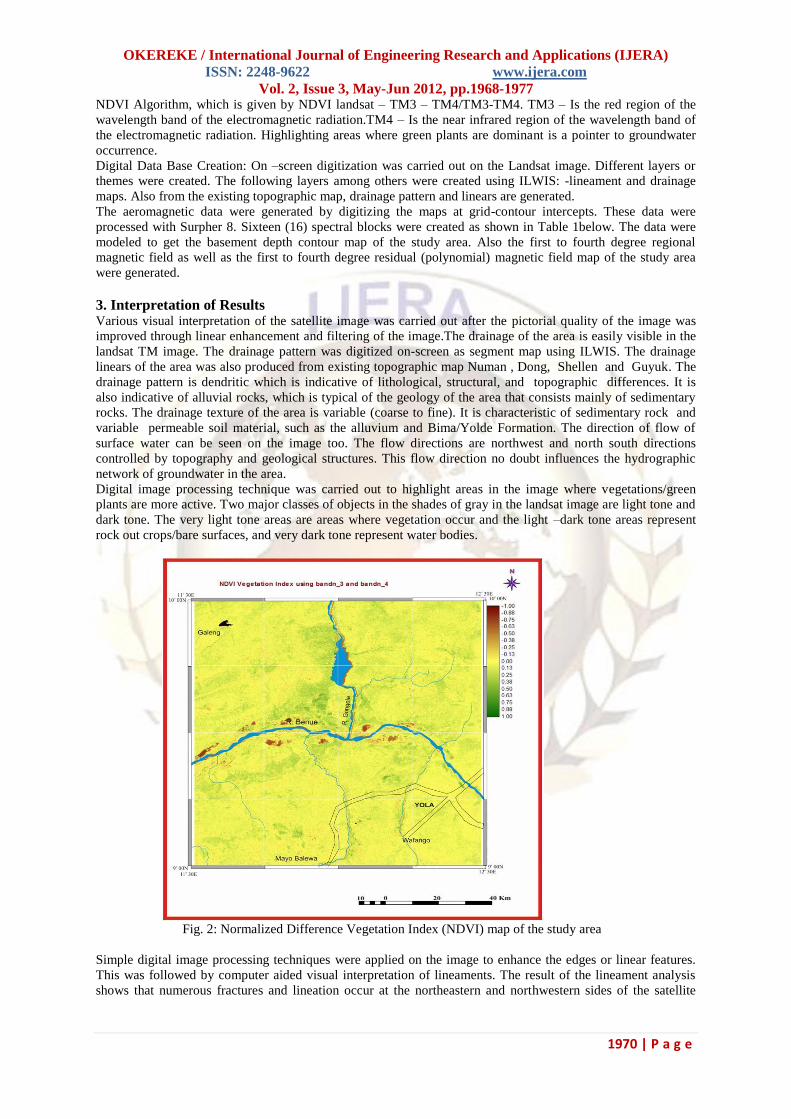
Digital image processing technique was carried out to highlight areas in the image where vegetations/green
plants are more active. Two major classes of objects in the shades of gray in the landsat image are light tone and
dark tone. The very light tone areas are areas where vegetation occur and the light –dark tone areas represent
rock out crops/bare surfaces, and very dark tone represent water bodies.
Fig. 2: Normalized Difference Vegetation Index (NDVI) map of the study area
Simple digital image processing techniques were applied on the image to enhance the edges or linear features.
This was followed by computer aided visual interpretation of lineaments. The result of the lineament analysis
shows that numerous fractures and lineation occur at the northeastern and northwestern sides of the satellite

OKEREKE / International Journal of Engineering Research and Applications (IJERA)
ISSN: 2248-9622 www.ijera.com
Vol. 2, Issue 3, May-Jun 2012, pp.1968-1977
1971 | P a g e
image. The common orientations of the lineaments are NE-SW and NW-SE. A dolerite dyke related to a major
NE-SW striking fracture occurs in NW of the study area.
The drainage linears was derived from the drainage pattern of existing topographic map and the satellite image.
This is to correlate the trends of drainage and structural orientation in the whole area to establish whether the
drainage is structurally controlled. The result of the statistical analysis of the drainage linear and visual
observation of it indicates that the drainage follow weak parts in the earth such as fractures and faults. Visual
interpretation of lineaments was complemented by some simple digital image processing techniques that
highlight linear features. A good technique that was used is the directional edge enhancement and convolution
filtering. These techniques will make conspicuous all linear features and boundaries seen on the image.
Apart from man-made structures, the result shows that the area has numerous linear features, which include
drainage channels, fractures and joints.
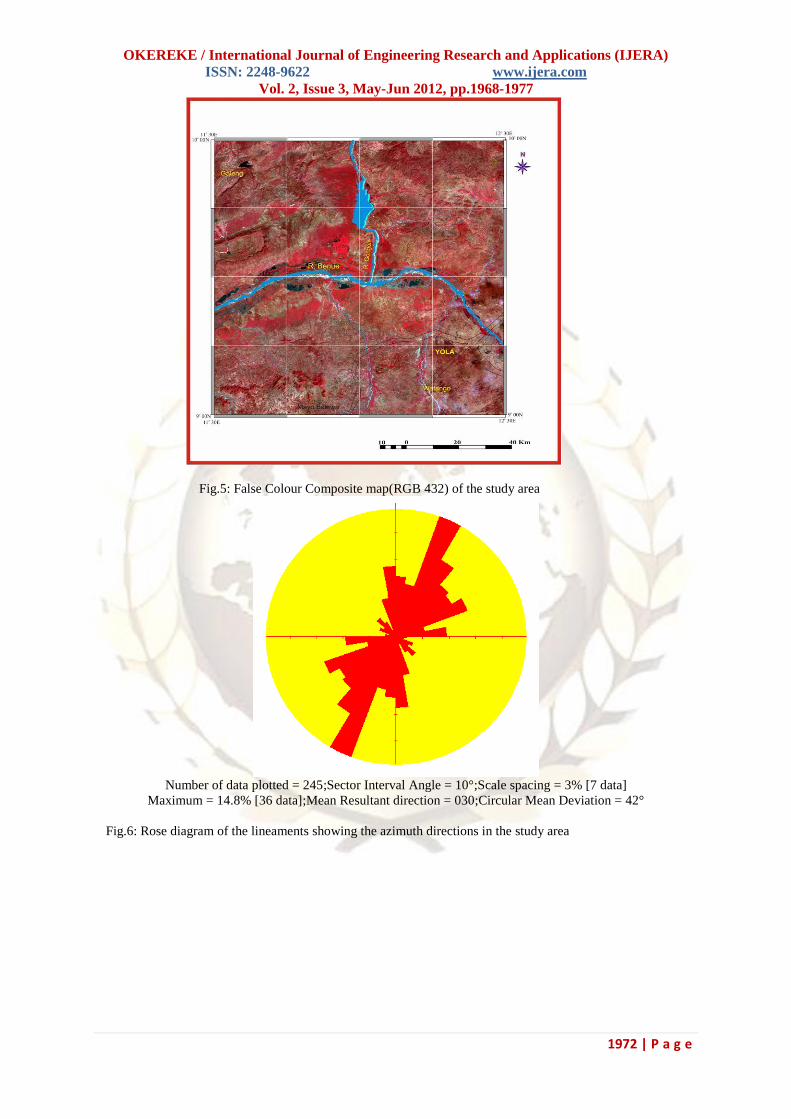
The Rose diagram (azimuth distribution diagram): The strikes and lengths of all lineaments were measured and
computed to obtain the rose diagram (Fig.6). The important structural trends are NE-SW, N-S and E-W.
Fig. 3: Lineament map of the study area
Fig.4: Digital Elevation Model (DEM) of the study area
OKEREKE / International Journal of Engineering Research and Applications (IJERA)
ISSN: 2248-9622 www.ijera.com
Vol. 2, Issue 3, May-Jun 2012, pp.1968-1977
1972 | P a g e
Fig.5: False Colour Composite map(RGB 432) of the study area
Number of data plotted = 245;Sector Interval Angle = 10°;Scale spacing = 3% [7 data]
Maximum = 14.8% [36 data];Mean Resultant direction = 030;Circular Mean Deviation = 42°
Fig.6: Rose diagram of the lineaments showing the azimuth directions in the study area

OKEREKE / International Journal of Engineering Research and Applications (IJERA)
ISSN: 2248-9622 www.ijera.com
Vol. 2, Issue 3, May-Jun 2012, pp.1968-1977
1973 | P a g e
Fig.7: Total field map of the study area showing magnetic susceptibility
Figure 7 shows the total field map of the study area. It will be observed that the dominant structural trend is in
the NE-SW direction. The first to fourth degree regional maps (Fig. 10) show NE-SW and NW-SE structural
trends. The NE-SW trend could indicate the Charcot fracture zone which is believed to be extending towards the
West African region. The first to fourth degree residual (polynomial) maps show small clusters which indicate
igneous intrusions, granitic rocks, mineral bodies, rhyolite, granodiorites etc, outcropping at the surface or near
the surface. The 3-D surface map of the study area reveals the magnetic basement morphology and relates
same with the undulating relief shown. Figure 12 shows the basement depth of the study area. From the map,
there are basement highs at the northwest and southeast of the area and a low at the southwest part. The
basement area will not be favourable for hydrocarbon prospecting because of the granitic instrusions and low
sedimentary piles. It should also be noted that trapped hydrocarbon will be baked as a result of contact
metamorphism at the point of intrusion.
Fig.8: Image map of the total field aeromagnetic map of the study area

OKEREKE / International Journal of Engineering Research and Applications (IJERA)
ISSN: 2248-9622 www.ijera.com
Vol. 2, Issue 3, May-Jun 2012, pp.1968-1977
1974 | P a g e
Fig.9: 3-D Surface map of the study area showing magnetic basement morphology
Fig.10: First to fourth degree regional magnetic field of the study area

OKEREKE / International Journal of Engineering Research and Applications (IJERA)
ISSN: 2248-9622 www.ijera.com
Vol. 2, Issue 3, May-Jun 2012, pp.1968-1977
1975 | P a g e
Fig.11: First to fourth degree residual (polynomial) magnetic field of the study area
Table 1: Showing spectral depth estimation of the aeromagnetic data in the study area
S/NO SPECTRAL
BLOCK
LATITUDE LONGITUDE DEPTH(KM)
Y1 Y2 X1 X2 D1 D2
1 Dong-01 9.25 9.50 11.50 11.75 0.292 3.098
2 Dong-02 9.25 9.50 11.75 12.00 0.756 1.233
3 Dong-03 9.00 9.25 11.50 11.75 0.234 3.546
4 Dong-04 9.00 9.25 11.75 12.00 0.434 3.456
5 Guyuk-01 9.75 10.00 11.50 11.75 0.533 4.013
6 Guyuk -02 9.75 10.00 11.75 12.00 0.486 2.688
7 Guyuk -03 9.50 9.75 11.50 11.75 0.888 2.746
8 Guyuk -04 9.50 9.75 11.75 12.00 0.934 2.987

OKEREKE / International Journal of Engineering Research and Applications (IJERA)
ISSN: 2248-9622 www.ijera.com
Vol. 2, Issue 3, May-Jun 2012, pp.1968-1977
1976 | P a g e
9 Neuman-01 9.25 9.50 12.00 12.25 0.775 3.420
10 Neuman-02 9.25 9.50 12.25 12.50 0.456 2.289
11 Neuman-03 9.00 9.25 12.00 12.25 0.887 2.245
12 Neuman-04 9.00 9.25 12.25 12.50 0.587 3.567
13 Shellem-01 9.75 10.00 12.00 12.25 0.387 3.223
14 Shellem -02 9.75 10.00 12.25 12.50 0.482 2.225
15 Shellem -03 9.50 9.75 12.0 12.25 0.223 2.120
16 Shellem-01 9.50 9.75 12.25 12.50 0.635 3.750
Average depth, d1 = 0.546km
Average depth, d2 =2.788km
Fig.12: Basement contour map of the study area
4. Conclusion The structural trend is predominantly in the NE-SW direction. The drainage pattern is dendritic which is
indicative of lithological, structural and topographic differences. It is also indicative of alluvial rocks, which is
typical of the geology of the area that consists mainly of sedimentary rocks. Areas with topographic heights
averaging about 500m are potential region for groundwater assessment. These areas agree with areas in the
lineament map where the lineament density is high. It was observed that these regions have a lot of lineaments
crossing each other which is indicative of groundwater availability.
From the magnetic data analysis, it is observed that the dominant structural trend is in the NE-SW direction
which is in agreement with the remote sensing data.
The remote sensing technique is a very useful tool in groundwater assessment, particularly, the mapping of the
lineaments. This gives a clear picture of regions where groundwater is available.
References Ananaba, S. E. 1991. Dam sites and crustal megalineaments in Nigeria. ITC Journal Vol. 1, pp.26-29.
Ananaba, S. E. and Ajakaiye, D. E. 1987. Evidence of Tectonic Control of Mineralization of Nigeria from
lineament density analysis: A landsat study. Int. Jour. Rem. Sensing,Vol. 1, No. 10, pp. 1445-1453.

OKEREKE / International Journal of Engineering Research and Applications (IJERA)
ISSN: 2248-9622 www.ijera.com
Vol. 2, Issue 3, May-Jun 2012, pp.1968-1977
1977 | P a g e
Benkhelil, J., (1988). Structure et evolution geodynamique du Basin intracontinental de la Benoue (Nigeria)
Bull. Centres Rech., Explor. Prod. Elf Aquitaine 1207, 29-128.
Benkhelil, J., (1989). The Origin and Evolution of the Cretaceous Benue Trough (Nigeria). Journal of African
Earth Sciences 8, 251-282.
Chukwu-Ike, I.M. 1997. Regional Photogeologic Interpretation of the Tectonic features of the Central
Nigerian Basement Complex.Unpublished Ph.D. Thesis, University of London.
Davis, F.W. and Simonett, D.S. 1991. GIS and Remote Sensing Principles,Vol. 1. D.J.Maguire, M.F.
Goodchild, and D.W.Rhind, eds.( New York. Longman Scientific and Technical Publishers), pp. 191-
213.
Ehlers, M.D. 1990. Remote Sensing and Geographic Information System Towards Integrated Spatial
Information Processing .IEEE Transactions on Geoscience and Remote Sensing, 28(4): 763-766.
Ehlers, M.D., Greenlee, T., Smith, and Star, J. 1991.Integration of Remote Sensing and GIS data and data
access. Photogrammetric Engineering and Remote Sensing, 57 (6): 669-675.
Evamy,B.D.,Harebourne, J., Kamerling, P., Knaap,W.A., Molloy, F.A., and Rowlands, P.H.,1978. Hydrocarbon
Habitat of the Tertiary Niger Delta., America Association of Petroleum Geologists Bulletin., Vol. 62, No.
1; pp. 1-39.
Ghazala, H.H., 1993. Geological and Structural Interpretation of Airborne Surveys and Its Significance for
Mineralization, South Eastern Desert, Egypt. Journal of African Earth Sciences, Vol. 16; No. 13; pp. 273-
285.
Guiraud, R., J.C. Doumnang, Mbaigane, S.O., S. Carretier and S.Dominguez, 2000. Evidence For a 600km
length NW-SE Striking lineament in Northern Africa: The Tibesti lineament . Journal of the Geological
Society, London; Vol. 157; pp.897-900.
Henkel, H. and Guzmann, M. 1997. Magnetic Features of the Fracture Zones. Geo- Exploration, Vol.15; pp.
173-181.
Hospers, J. 1965. Gravity Field and Structure of the Niger Delta Basin, Nigeria. Geological Society of American
Bulletin; Vol. 76, pp. 407-422.
Kangoko, R., Ojo, S.B. and Umego, M.N. 1997. Estimation of basement depths in the Middle Cross River
Basin by spectral analysis of the aeromagnetic field. Nig. Journ. Of Physics., Vol. 9; pp.30-36.
Olade, M.A. (1975). Evolution of Nigeria’s Benue Trough (aulacogen): A tectonic model. Geol. Mag. 112,
576-583.
Onyedim, G.C. 1996. An Investigation of Structural and Lithologic controls of drainage Patterns in parts of
Illesha area using remote sensing data. Journal of Mining and Geology. Vol.32; No. 1, pp. 53-58.