Ojas ISSN No: 2279-0373 Expanding -...
76
(Approved by All India Council for Technical Education) Jaipuria School of Business Indirapuram, Ghaziabad A Case on US Fast-Food workers Strike Across 100 Cities: A Signal of The Growing Clamor for Action on Income Equality Ms. Sonam Sachdeva, Ms. Roopam Sachdeva Export Promotion Councils in India (A Study of Engineering Export Promotion Council) Dr. Abhishek Maheshwari, Dr. Devesh Gupta, Dr. Geetika Shukla Pradhan Mantri Jan Dhan Yojana: An Economic Boost “Come, Join hands and give boost to Indian economy” Jyoti Kumari A comparative study of Talent Management Practices implemented by Information Technology Companies & Automobile Companies in Pune Prof. Shraddha Purandare Teachers and Computer Technology: Principal Views Dr. Neetu Sharma Business/ IT Alignment as a key Contributor for IT Implementation in Delhi NCR Region: A Study Dr. Deepika S. Joshi, Prof. Sanjive Saxena Understanding The Pattern of Usage of Social Networking Sites in India Dr. Tripti Barthwal, Dr. Akanksha Srivastava Corporate Training: A perspective and its link to Organizational Outcome Anshuman Das Ojas Expanding Knowledge Horizon ISSN No: 2279-0373 Online-ISSN No: 2321-726X An International Journal of Research in Management Volume 3 No.1 January-July 2014 110 Years of Excellence
Transcript of Ojas ISSN No: 2279-0373 Expanding -...

(Approved by All India Council for Technical Education)
Jaipuria School of BusinessIndirapuram, Ghaziabad
A Case on US Fast-Food workers Strike Across 100 Cities: A Signal of
The Growing Clamor for Action on Income Equality
Ms. Sonam Sachdeva, Ms. Roopam Sachdeva
Export Promotion Councils in India (A Study of Engineering Export Promotion Council)
Dr. Abhishek Maheshwari, Dr. Devesh Gupta, Dr. Geetika Shukla
Pradhan Mantri Jan Dhan Yojana: An Economic Boost
“Come, Join hands and give boost to Indian economy”
Jyoti Kumari
A comparative study of Talent Management Practices implemented by
Information Technology Companies & Automobile Companies in Pune
Prof. Shraddha Purandare
Teachers and Computer Technology: Principal Views
Dr. Neetu Sharma
Business/ IT Alignment as a key Contributor for IT Implementation
in Delhi NCR Region: A Study
Dr. Deepika S. Joshi, Prof. Sanjive Saxena
Understanding The Pattern of Usage of Social Networking Sites in India
Dr. Tripti Barthwal, Dr. Akanksha Srivastava
Corporate Training: A perspective and its link to Organizational Outcome
Anshuman Das
OjasExpanding Knowledge Horizon
ISSN No: 2279-0373Online-ISSN No: 2321-726X
An International Journal of Research in Management
Volume 3 No.1January-July 2014
110 Years of Excellence

OJAS: Expanding the Knowledge Horizon, an international Journal of research management (ISSN No: 2279-0373Online-ISSN No: 2321-726X)- A peer reviewed international journal of Jaipuria School of Business, Ghaziabad, invites original research papers, case studies, perspectives and book reviews on themes/issues of current concern in all areas of management including HR, Marketing, Finance, IB, IT, Retail, Hospitality, Travel & Tourism, Energy Management & Entrepreneurship.
The journal welcomes innovative research based papers, perspectives, case studies and book reviews in functional areas of management. All submissions are reviewed in terms of their contribution to literature, research, empirical evidence and appropriate methodology. For any further query, please contact
Managing Editor “OJAS” : [email protected]
OJASAN INTERNATIONAL JOURNAL OF RESEARCH IN MANAGEMENT
Expanding�Knowledge�Horizon
Chief Patron
Dr. Rajaram Jaipuria
President
Seth Anandram Jaipuria Educational Society
Patron
Mr. Shishir Jaipuria
Vice President
Seth Anandram Jaipuria Educational Society
Editor-In-Chief
Dr. S. Durgaaprosad
Director
Jaipuria School of Business,
Ghaziabad
Managing Editor
Dr. Deepika S. Joshi
Editorial Committee
Dr. V.K. Goyal
Dr. Rachna Sharma
Dr. Poorva Ranjan
Col. H. C. Sharma
Dr. Abhishek Maheshwari
Ms. Sumedha Tuteja
Mr. Yusuf Mehdi
MS. Priyanka
Editorial Advisory Board
Dr. Yu-Chen Hu
Professor of Computers
Providence University, Taiwan
Dr. D.K. Malhotra
Professor of Finance, Philadelphia University, U.S.
Dr. J.K. Sharma
Professor of Decision Sciences, Amity University, Dubai
Dr. Azhar Kazmi
Professor of Strategy, King Fahd University
Dhahran Saudi Arabia
Dr Khalid Iqbal Haider
College of Education, American University in the
Emirates Dubai, UAE
Dr. Usha Kiran
Professor of Marketing, Women Studies
Banaras Hindu University, Banaras
Dr. B. R. Londhe
Professor of Marketing & IB
Symbiosis Institute of Management Studies Pune
Dr. Raj Kamal
Professor of Marketing & HR
MJP Rohilkhand University, Bareilly
Dr. Durgesh Pant
Professor & Director: School of Computer Science & IT,
Uttarakhand Open University, Dehradun Campus, Uttarakhand
Dr. Ritvik Dubey
Prof. of Marketing & Officiating Director, Faculty of Management
Amrapali Group of Institutions, Haldwani, Uttarakhand
Send your feedback/Enquiry to:
The Editor-In-ChiefJaipuria School of BusinessShakti Khand IV, Indirapuram GhaziabadPhone: 0120-488 11 00, 08860852754Email: [email protected]

Contents
1. A Case on US Fast-Food workers Strike Across 100 Cities: A Signal of
The Growing Clamor for Action on Income Equality 01
Ms. Sonam Sachdeva, Ms. Roopam Sachdeva
2. Export Promotion Councils in India (A Study of Engineering Export Promotion Council) 05
Dr. Abhishek Maheshwari, Dr. Devesh Gupta, Dr. Geetika Shukla
3. Pradhan Mantri Jan Dhan Yojana: An Economic Boost
Come, Join hands and give boost to Indian economy 16
Jyoti Kumari
4. A comparative study of Talent Management Practices implemented by
Information Technology Companies & Automobile Companies in Pune 24
Prof. Shraddha Purandare
5. Teachers and Computer Technology: Principal Views 34
Dr. Neetu Sharma
6. Business/ IT Alignment as a key Contributor for IT Implementation
in Delhi NCR Region: A Study 40
Dr. Deepika S. Joshi, Prof. Sanjive Saxena
7. Understanding The Pattern of Usage of Social Networking Sites in India 48
Dr. Tripti Barthwal, Dr. Akanksha Srivastava
8. Corporate Training: A perspective and its link to Organizational Outcome 63
Anshuman Das
Volume 3, No. 1, January - July 2014
OJASAN INTERNATIONAL JOURNAL OF RESEARCH IN MANAGEMENT
Expanding�Knowledge�Horizon

From the Desk of the Chief Editor
I am proud to announce the publication of the second volume of OJAS, an international multidisciplinary Journal of Research in Management. Since inception, OJAS has responded to the growing research needs in management. We are publishing papers received from eminent scholars and researchers from India and abroad. The papers, which have been put through a double blind review process, cover different areas of management.
This issue covers different aspects of management research bearing upon numerous issues of social, economic and politico-economic nature. The papers included in this issue deal with a variety of research concerns including current problems related to stress in education sector particularly in the private institutions where an ever increasing amount of responsibilities are given to the teachers, issues of environmental sustainability practices of major retailers in India, organizational politics and the role of social influence in establishments, management of conflict in pharma channel sales, the issue of innovation management in organizations, Green Marketing and its significance in northern India, and the impact of sale of eco-friendly goods.
The OJAS team is determined to direct its vigor in digging the potential in borders of the different managerial disciplines. This necessitates horizontal thinking and challenging our own esteemed thoughts and views about challenges at hand. The current issue is a very modest endeavor at meeting the vast objective of flouting the fair knowledge systems demonstrated by different Researchers in India and abroad.
All the manuscripts included here are peer reviewed as well as expert reviewed. The success of any research journal is built primarily on four groups of people: the contributors, the reviewers, the associate editors, and the publication staff. My sincere thanks are due to the members of editorial and advisory boards, manuscript contributors and all others who have put in their might in compiling this issue. I would like to thank all of them and express my sincere appreciation for the support they have given to OJAS under my predecessors. I look forward to continuing this relationship and receiving your suggestions and ideas for making OJAS more valuable for our research community.
Prof. (Dr.) M. Ashraf RizviEditor-in-chiefOJAS: Expanding Knowledge Horizon
Volume 3, No. 1, January - July 2014
AN INTERNATIONAL JOURNAL OF RESEARCH IN MANAGEMENT
Expanding�Knowledge�Horizon
OJAS
From The Editor“Talent Management” is a matter of knowledge and has to be improved, challenged and increased consistently, or it vanishes - rightly said by the Management Guru “Peter Drucker.”
Of course very many researchers don’t endeavor in the quest for the journey to be genius The article A comparative study of Talent Management Practices…….. has brought out the genesis of impact on retention of the content …..Which would enable organization to control cost, and perform in a better manner.
In the spotlight, Teachers and Computer Technology would be very much interesting as it indicate that teachers need in - “service training in Computer – added Education.”
Also in the spotlight corporate training would spring a chane reaction in Employees across with direct link to outcome, one can surly make training and development more effective within the organization.
Informatic Article on Export Promotion Councils in India would be very much useful for those who are contending to be in International Business.
When the Fast-Food Workers struck there work in 100 cities in US the outcome had been challenging.Finally, Business/IT alignment has been a key contributor for IT implementation in Delhi and NCR region.
We’re tweaking the magazine as well the front and Back section have been redesigned,
We, look forward to hearing what you think.
Prof. (Dr.) S. DurgaaprosadEditor-in-chiefOJAS:Expanding Knowledge Horizon

A Case on US Fast-Food workers Strike Across100 Cities: A Signal of The Growing Clamor for Action on Income Equality Ms. Sonam Sachdeva*
Ms. Roopam Sachdeva**
Abstract
A Strike is a collective, organized, cessation or slowdown of work by employees, to force acceptance of their demands by the employer. It can also be regarded as a work stoppage undertaken in support of a bargaining position or in protest of some aspect of a previous agreement or proposed agreement between labor and management. This case showcases a real life example of the growing clamor for action on income equality faced by US fast food giants such as McDonalds, Taco Bell etc.
Keywords: Strike, Income Equality, Clamor, McDonalds, Taco Bell.
Objectives1. The purpose of the case is to make the students aware about the situation of human resource crisis in any organization and across
industry and nation.2. The issue involved in the case is about income inequality in fast food industry and across nation and how it hampers the image of the
company, industry and nation as a whole.3. The case analysis will help to enhance the analytical and decision making capability of the students which will help them in long run.
*Assistant Professor, Ad-Hoc Panel, Department of Commerce, Delhi University, New Delhi, India. E-mail id: [email protected]**Student, Bharti Vidyapeeth Institute of Management & Research, New Delhi, India. E-mail id: [email protected]
Introduction
For nearly a century, labor strikes have been an effective tool to
help unionized workers get higher wages, more benefits and
greater workplace protections. But as declining union
membership makes protracted strikes increasingly rare, a new
model of labor agitation is emerging, and it might involve the
cashier at local McDonald’s. This case focuses on the Fast-food
workers strike to protest low wages at McDonald’s, Taco Bell and
other fast-food chains from New York City to Seattle in December
2013.
Fast-food workers and other protest participants chanted and
marched through a Los Angeles McDonald's restaurant on 5th
December, 2013 morning as part of a nationwide strike involving
industry employees in about 100 cities.
The workers walked off the job on Thursday as part of the largest
effort yet in a push for higher pay for fast-food restaurant
employees. The actions are intended to build on a campaign that
began about a year ago to call attention to the difficulties of living
on the federal minimum wage of $7.25 an hour, or about $15,000
a year.
Description of statements by Attorney and Women's Right Activist
Sandra Fluke, Officials of California Restaurant Association and
few workers of different fast food chains have also been stated.
The Problem
Thousands of fast food and retail workers went on strike across
the US on Thursday in a signal of the growing clamor for action on
income equality.
The pre-Labor Day protests, which follow a series of strikes that
began in November, 2012 in New York City targeted fast-food
chains including McDonald's, Burger King, Wendy's and Yum
Brands, whose chains include KFC and Taco Bell. Workers are also
seeking the right to unionize.

A Case on US Fast-Food workers Strike Across 100 Cities: A Signal of The Growing Clamor for Action on Income Equality
OJAS - Volume 3, No. 1, January-July 2014
02
Strike organizers, a loose confederation of local community
groups and churches which has received some financial and
training support from the Service Employees International Union,
say restaurants in Milwaukee, Detroit and St. Louis had to close, at
least temporarily, because of employee walkouts
In Chicago, hundreds of protesters gathered outside a McDonalds
at 6.15am on 5th December, 2013.
As a large "Christmas Grinch" ambled about in freezing
temperatures, demonstrators chanted for the minimum wage to
be increased from $7.25 an hour to $15 per hour. It was the first of
nine strikes in Chicago, with employees at McDonalds, Wendy's,
Walgreens, Macy's and Sears also due to walk off shift. Low wage
workers were due to strike across 100 cities through the day,
including Boston, Detroit, New York City, Oakland, Los Angeles
and St Louis amongst 100 cities of US where strike happened.
A demonstration at a McDonald's on West Manchester Avenue in
Los Angeles began outside the restaurant at about 6 a.m. Some of
the workers were also part of an August strike. It was not
immediately clear what kind of impact the walk-out will have on
restaurant operations.
The on-duty manager at the McDonald's West Manchester
Avenue location stated that all scheduled employees arrived for
work on Thursday, 5th December, 2013. Some workers and other
rally participants later entered the store and, led by protesters
with megaphones, chanted in front of the restaurant counter as
customers continued to place their orders.
Attorney and women's right activist Sandra Fluke, famous radio
talk show in US - Rush Limbaugh and Pastor William Smart Jr. -
President of the Southern Christian Leadership Conference of
Southern California also joined the demonstration.
"This community is done with this kind of undignified treatment
for these workers," Fluke said through a megaphone as she stood
in front of protesters.
The protests are part of a movement by labor unions, Democrats
and other worker advocacy groups to raise pay in low-wage
sectors. In November, 2013, President Obama said he would back
a Senate measure to raise the federal minimum wage to $10.10,
and he reiterated his support on 4th December, 2013.
Protesters are calling for $15 an hour, although many see the
figure as a rallying point rather than a near-term possibility.
Restaurant association officials called the one-day strike a public
relations effort by organized labor. Doubling the minimum wage
"ignores the economics of running a restaurant," according to the
California Restaurant Association.
"As national labor organizers ramp up their assault against the
restaurant industry, it's important to recognize that the protestors
outside of restaurants are far more likely to be labor activists and
paid demonstrators than actual restaurant workers," said Jot
Condie, of the California Restaurant Association. "Restaurants of
all kinds provide millions of young Californians with their first job,
and the opportunity to acquire important skills they'll take with
them the rest of their lives. The weakened economy has created
an environment where more people are looking to our industry
for short-term and long-term work opportunities, and fortunately
restaurants have been able to provide thousands of new jobs."
As the movement struggles to find pressure points in its quest for
substantially higher wages for workers, organizers said strikes
were planned for the first time in cities like Charleston, S.C.;
Providence, R.I.; and Pittsburgh.
The protests have expanded greatly since November 2012, when
200 fast-food workers engaged in a one-day strike at more than 20
restaurants in New York City, the first such walkout in the history
of the nation’s fast-food industry. The fast-food effort is backed by
the Service Employees International Union and is also demanding
that restaurants allow workers to unionize without the threat of
retaliation.
Officials with the National Restaurant Association have said the
one-day strikes are publicity stunts. They warn that increasing pay
to $15 an hour when the federal minimum wage is $7.25 would
cause restaurants to rely more on automation and hire fewer
workers.

03
Simon Rojas, who earns $8.07 an hour working at a McDonald’s in
South Central Los Angeles, said, “It’s very difficult to live off $8.07
an hour,” noting that he is often assigned just 20 or 25 hours of
work a week. “I have to live with my parents. I would like to be able
to afford a car and an apartment.” Mr. Rojas said he had studied
for a pharmacy technician’s certificate, but he had been unable to
save the $100 needed to apply for a license.
"To put it in perspective, yesterday I got paid, today I have not a
dollar in my pocket," said Akilarose Thompson. She was on strike
from the McDonalds in Chicago's West Town – the scene of 5th
December, morning's protest that kicked off actions around the
city. Thompson has worked at Mc Donald’s for almost a year,
serving customers on the cash register or on the drive-thru
window. She got a pay rise in June and now earns $8.28 an hour –
three cents above Illinois's minimum wage of $8.25. Thompson
works a second job too, at Red Lobster, but still has to go to food
banks to support her and her 15-month-old daughter.
The rate is actually higher in Chicago, as Illinois has set its own
minimum rate of $8.25 per hour. But protesters say it is still far too
low. Backed by unions such as the SEIU nationally and smaller
coalitions in different cities – in Chicago, the Fight for 15 campaign
has been put together by the Workers Organizing Committee of
Chicago, made up of a series of smaller action groups such as Arise
Chicago and Lakeview Action Coalition – campaigners are calling
for the federal rate to be increased to $15 per hour.
As the movement struggles to find pressure points in its quest for
substantially higher wages for workers, organizers said strikes
were planned for the first time in cities like Charleston, S.C.;
Providence, R.I.; and Pittsburgh.
The protests have expanded greatly since November 2012, when
200 fast-food workers engaged in a one-day strike at more than 20
restaurants in New York City, the first such walkout in the history
of the nation’s fast-food industry.
“There’s been pretty huge growth in one year,” said Kendall Fells,
one of the movement’s main organizers. “People understand that
a one-day strike is not going to get them there. They understand
that this needs to continue to grow.”
The movement, which includes the groups Fast Food Forward and
Fight for 15, is part of a growing union-backed effort by low-paid
workers - including many Walmart workers and workers for
federal contractors - that seeks to focus attention on what the
groups say are inadequate wages.
Questions
1. Identify the problem in the case?
2. Do you think that organizing strikes is justified and the only
measure available to the worker to get their demand
fulfilled?
3. What do you suggest to the officials of the fast food chains in
order to resolve this problem? Should they agree to the
demands of the workers?
Teaching Notes
1. Divide the class into groups consisting of 4-5 members each.
2. Give the case for individual reading for 10 minutes.
3. Allow a time limit of 15 minutes for the discussion of the case
within groups.
4. Now invite each group one by one to present the analysis of
the case and answer the given questions.
5. At last give your inputs to the whole class. Discuss and
appreciate good points and do critical analysis.
Teaching Suggestions
The students should be well versed with the concepts and issues
of Industrial Relations and Compensation Management. They
should be clear about the various laws governing the industrial
relations, their rights as employees and the dispute settlement
machinery available.
A Case on US Fast-Food workers Strike Across 100 Cities: A Signal of The Growing Clamor for Action on Income Equality
OJAS - Volume 3, No. 1, January-July 2014

04
References
• http://www.usatoday.com/story/money/business/2013/
12/05/ fast-food-strike-wages/3877023/
• http://www.bbc.co.uk/news/world-us-canada-25239433
• http://www.ibtimes.com/fast-food-worker-strikes-these-
are-100-cities-where-fast-food-workers-will-walk-job-
today-map
• http://nation.time.com/2013/12/07/the-one-day-strike-
the-new-labor-weapon-of-last-resort/
A Case on US Fast-Food workers Strike Across 100 Cities: A Signal of The Growing Clamor for Action on Income Equality
OJAS - Volume 3, No. 1, January-July 2014

Export Promotion Councils in India(A Study of Engineering Export Promotion Council)
Dr. Abhishek Maheshwari*Dr. Devesh Gupta**
Dr. Geetika Shukla***
Abstract
Export Promotion Councils are the statutory bodies set up for the promotion of exports of specific products. The first EPC of India was set up in October, 1954: Cotton Textiles Export Promotion Council. At Present, there are 22 export promotion councils in India. Import objectives and functions of EPCs are: (i) To help the exporters in expanding overseas market of their products. (ii) To exchange trade delegates between the countries. (iii) To provide latest information of export trade. (iv) To give information relating to EXIM Policy and incentives available. (v) To give information on export performance, and (vi) To augment request for the release of Grants-in-aid.
The EEPC INDIA (Formerly Engineering Export Promotion Council of India) was set up in 1955 under the sponsorship of Ministry of Commerce and Industry, Govt. of India, for export promotion of engineering goods, projects and services from India. Initially started with a few hundreds of engineering units as a small outfit, with a passage of time it has grown to be the largest Export Promotion Council of India having a membership of nearly 12,000 from amongst large Corporate Houses, Star Trading Houses, Small & Medium Scale Units (SME), Trading Houses, etc. Out of the total membership of the Council, 60% constitutes the SMEs.
Present study covers a study of Engineering Export Promotion Council of India. Objectives of this Council have been studied and its working has been analyzed in the light of these objectives. How far these objectives been achieved and how far not, has been the main theme of study.
*Associate Professor, Jaipuria Institute of Management**Astt. Prof., J.P. Institute of Management. Email: [email protected]***Astt. Prof., Dewan Institute of Management Studies. Email: [email protected]
Introduction
The EPCs are non-profit organizations registered under the
Companies Act or the Societies Registration Act, as the case may
be. The EPCs are autonomous bodies and regulate their own
affairs. However, if the Central Government frames uniform by-
laws for the constitution and/or for the business of EPCs, they
shall adopt the same with such modifications as Central
Government may approve having regard to the special nature or
functioning of such EPC. The EPCs shall be required to obtain the
approval of the Central Government for participation in trade
fairs, exhibitions etc. and for sending sales delegations abroad.
The Ministry of Commerce and Industry/ Ministry of Textiles of
the Government of India, as the case may be, would interact with
the Managing Committee of the Council concerned, twice a year,
once for approving their annual plans and budget and again for a
mid-year appraisal and review of their performance.
The EPCs may be provided financial assistance by the Central
Government. The Export Promotion Councils perform both
advisory and executive functions. These Councils are also the
registration authorities under the Export Import Policy, 1997-
2002. These Councils have been assigned certain role and
functions under the said Policy.
An exporter may, on application, register and become a member
of an Export Promotion Council. On being admitted to
membership, the applicant shall be granted forthwith
Registration-cum-Membership Certificate (RCMC) of the EPC
concerned, subject to such terms and conditions as may be
specified in this respect.
Objectives of Export Promotion Councils
The basic objective of Export Promotion Councils is to promote
the exports of the country. Each Council is responsible for the
Export Promotion Councils in India (A Study of Engineering Export Promotion Council)
OJAS - Volume 3, No. 1, January-July 2014
06
promotion of a particular group of products, projects and
services. The main role of the EPCs is to project India’s image
abroad as a reliable supplier of high quality goods and services. In
particular, the EPCs shall encourage and monitor the observance
of international standards and specifications by exporters. The
EPCs shall keep abreast of the trends and opportunities in
international markets for goods and services and assist their
members in taking the advantage of such opportunities in order
to expand and diversify the exports.
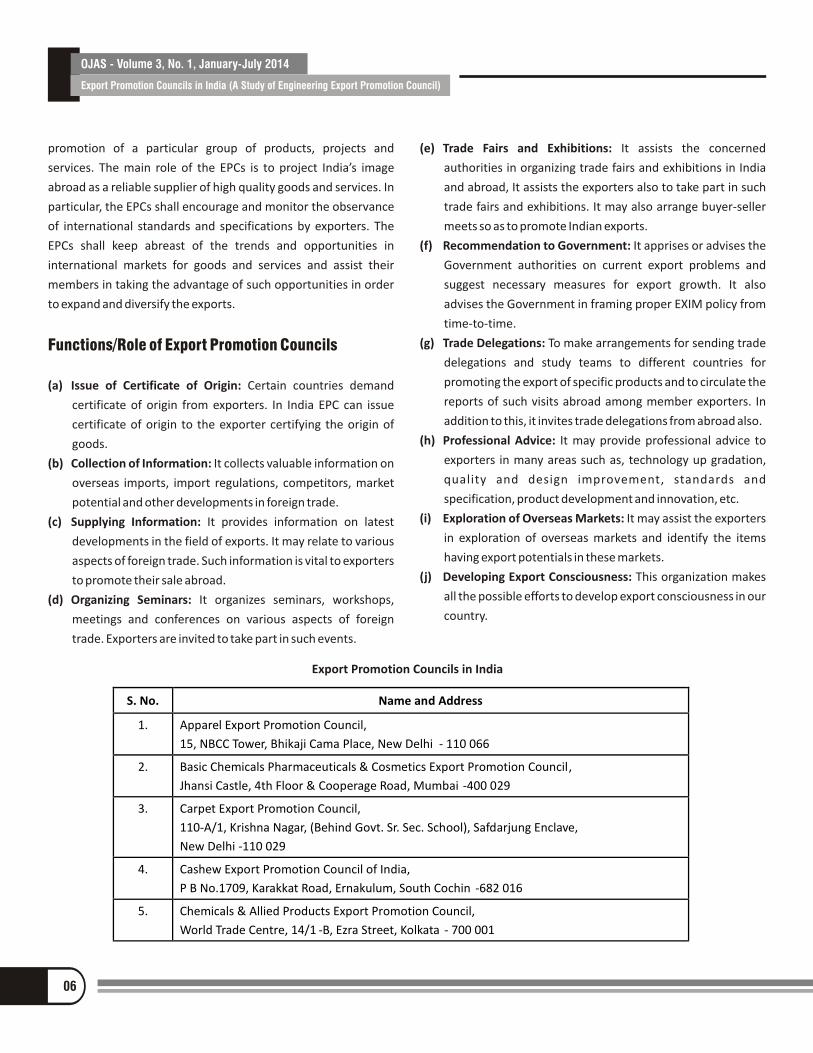
Functions/Role of Export Promotion Councils
(a) Issue of Certificate of Origin: Certain countries demand
certificate of origin from exporters. In India EPC can issue
certificate of origin to the exporter certifying the origin of
goods.
(b) Collection of Information: It collects valuable information on
overseas imports, import regulations, competitors, market
potential and other developments in foreign trade.
(c) Supplying Information: It provides information on latest
developments in the field of exports. It may relate to various
aspects of foreign trade. Such information is vital to exporters
to promote their sale abroad.
(d) Organizing Seminars: It organizes seminars, workshops,
meetings and conferences on various aspects of foreign
trade. Exporters are invited to take part in such events.
(e) Trade Fairs and Exhibitions: It assists the concerned
authorities in organizing trade fairs and exhibitions in India
and abroad, It assists the exporters also to take part in such
trade fairs and exhibitions. It may also arrange buyer-seller
meets so as to promote Indian exports.
(f) Recommendation to Government: It apprises or advises the
Government authorities on current export problems and
suggest necessary measures for export growth. It also
advises the Government in framing proper EXIM policy from
time-to-time.
(g) Trade Delegations: To make arrangements for sending trade
delegations and study teams to different countries for
promoting the export of specific products and to circulate the
reports of such visits abroad among member exporters. In
addition to this, it invites trade delegations from abroad also.
(h) Professional Advice: It may provide professional advice to
exporters in many areas such as, technology up gradation,
quality and design improvement, standards and
specification, product development and innovation, etc.
(i) Exploration of Overseas Markets: It may assist the exporters
in exploration of overseas markets and identify the items
having export potentials in these markets.
(j) Developing Export Consciousness: This organization makes
all the possible efforts to develop export consciousness in our
country.
S. No. Name and Address
1. Apparel Export Promotion Council,
15, NBCC Tower, Bhikaji Cama Place, New Delhi - 110 066
2. Basic Chemicals Pharmaceuticals & Cosmetics Export Promotion Council,
Jhansi Castle, 4th Floor & Cooperage Road, Mumbai -400 029
3. Carpet Export Promotion Council,
110-A/1, Krishna Nagar, (Behind Govt. Sr. Sec. School), Safdarjung Enclave,
New Delhi -110 029
4. Cashew Export Promotion Council of India,
P B No.1709, Karakkat Road, Ernakulum, South Cochin -682 016
5. Chemicals & Allied Products Export Promotion Council,
World Trade Centre, 14/1 -B, Ezra Street, Kolkata - 700 001
Export Promotion Councils in India

07
6. Cotton Textile Export Promotion Council,
5th
Floor, Engineering Centre, 9, Mathew Road, Mumbai - 400 004
7. Council for Leather Exports,
53, Raja Muthiah Road, Chennai - 600 003
8. Electronics & Computer Software Export Promotion Council,
PHD House, 3rd
Floor, Opp. Asian Games Village, New Delhi – 110016
9. Engineering Export Promotion Council,
World Trade Centre, 1st
Floor, 14/1-B, Ezra Street, Kolkata - 700 001
10. Export Promotion Council for EOUs and SEZ Units,
8G, 8th Floor, Hansalaya Building , 15 Barakhamba Road, New Delhi-110001
11. Export Promotion Council for Handicrafts,
6, Community Centre, 2nd
Floor, Basant Lok, Vasant Vihar, New Delhi - 110 057
12. Gems & Jewellery Export Promotion Council,
Diamond Plaza, 5th
Floor, Dr. Dadasaheb Bhadkamkar Marg, Mumbai - 400 004
13. Handloom Export Promotion Council,
18, Cathedral Garden Road, Nunagambakkam, Chennai - 600 034
14. Indian Oilseeds & Produce Export Promotion Council,
78-79, Bajaj Bhavan, Nariman Point, Mumbai-400 021
15. Indian Silk Export Promotion Council,
62, Mittal Chambers, 6th
Floor, Nariman Point, Mumbai -400021
16. Jute Products Development and Export Promotion Council,
1, B.K. Paul Avenue, Kolkata - 700005
17. Pharmaceuticals Export Promotion Council,
101, Aditya Trade Centre, Ameerpet, Hyderabad -500 038
18. Plastic Export Promotion Council,
Crystal Tower, Ground Floor, Crystal Cooperativ e Housing Society, Gundowli Road No. 3, Andheri (E), Mumbai - 400 069
19. Project Exports Promotion Council of India,
123, 1st floor, Behind Shankar Road Market, New Delhi -110 060
20. Power loom Development & Export Promotion Council,
16, 1st
Floor, Mittal Chambers, Nariman Point, Mumbai - 400 021
21. Services Export Promotion Council,
509-511 and 514-518, 5th Floor, Apparel House, Institutional Area, Sector -44,
Gurgaon-122003
22. Shellac and Forest Export Promotion Council,
World Trade Centre, 14/1 B, Ezra Street, 2nd
Floor, Kolkata - 700 001
23. Sports Goods Export Promotion Council,
2nd
Floor, 1E/6, Swami Ram Tirth Nagar, Jhandewanan Extn. New Delhi -110 055
24. Synthetic and Rayon Textiles Export Promotion Council,
Resham Bhavan, 78, Veer Nariman Road, Mumbai -400 021
Export Promotion Councils in India (A Study of Engineering Export Promotion Council)
OJAS - Volume 3, No. 1, January-July 2014

08
Engineering Export Promotion Council (EEPC)
Way back in 1955-56, the nascent Indian engineering sector was
in the process of diversifying and restructuring the export base of
the industry and it needed a strong push. The EEPC INDIA
(Formerly Engineering Export Promotion Council of India) was set
up in 1955 under the sponsorship of Ministry of Commerce and
Industry, Govt. of India, for export promotion of engineering
goods, projects and services from India. Initially started with a few
hundreds of engineering units as a small outfit, with a passage of
time it has grown to be the largest Export Promotion Council of
India having a membership of nearly 12,000 from amongst large
Corporate Houses, Star Trading Houses, Small & Medium Scale
Units (SME), Trading Houses, etc. Out of the total membership of
the Council, 60% constitutes the SMEs.
The steady growth in the export of engineering goods from India
has been the continuous innovation and setting up quality
standards in manufacturing and delivering services - this is
evident as a large number of exporters are ‘ISO 9000’ or
equivalent accredited. EEPC, India right from its inception, has
been insisting the exporting community on the quality parameter
and the Council itself has the distinction of achieving the ‘ISO
9002’ accreditation from world renowned KPMG. This has further
been upgraded to ‘ISO 9001:2008’ for designing and execution of
exhibition management services and provision of specialized
management, educational, and consulting services to
engineering industry.
Engineering exports from India have been steadily growing and
the performance has probably exceeded all expectations ever
since the birth of the Council. Apart from being one of the largest
stakeholders in the total exports out of India, engineering
exporters are the foremost net foreign exchange earners in the
country. As the engineering sector is extremely diversified, the
Council has set up different Product Panels with a view to ensure
that all potential Indian products may reach out to the global
markets.
Activities and Services of EEPC
EEPC India aggressively pursues a number of activities and
services for its exporting community, members and potential
overseas buyers with a two-point objective of facilitating the
exports of Indian engineering products and services to the global
markets and to provide the overseas buyers true value.
Marketing activities of the Council are manifold and, in addition to
direct marketing, structured promotional events are organized on
a regular basis so as to create awareness about the capability of
25. Telecom Equipment and Services Export Promotion Council,
3rd Floor, Niryat Bhawan, Rao Tula Ram Marg (Opp. Army Hospital Research & Referral),
Vasant Village, New Delhi-110057
26. Wool and Woolens Export Prom otion Council,
612/714, Ashoka Estate, 24, Barakhamba Road, New Delhi - 110 001
27. Wool Industry Export Promotion Council,
Churchgate Chamber, 7th Floor, New Marine Lines, Mumbai -400 020
Export Promotion Councils in India (A Study of Engineering Export Promotion Council)
OJAS - Volume 3, No. 1, January-July 2014

09
Indian engineering exporters. Important promotional activities
carried out on regular basis are product specific delegations to
select countries, exclusive Indian Engineering Exhibition,
participation in Specialized Trade Fairs, Catalogue Shows, Buyer-
Seller Meets, Product Specific Seminars and Conferences - both in
India and abroad.
• Publicity & Promoting the ‘Made in India’ brand
• Organizing INDEE Exhibition
• Participation at leading Exhibitions and Trade Fairs
• Organizing Seminars and Conferences
• Sending Trade Delegations and Organizing Buyer-Seller Meet
• Opening and Maintaining Foreign Offices of the Council
• Providing Export Related Services to Members
Export Performance of EEPC
During last five decades, EEPC India has been playing a pivotal role
in increasing country’s engineering exports and as on the date,
engineering exports stands at US$ 34 billion in the year 2010-11 in
comparison to US$ 10 million in the year 1956-57. Engineering
exports have been registering steady growth each year and has
registered a growth of 25% during 2010-11 over the previous year.
Seminars and Conferences
The Council organizes on regular basis seminars and conferences,
both in India and abroad, on a wide range of topics to foster
increased trade and formation of strategic alliances. Such
conferences had earlier been held in Paris, Houston, Tokyo,
Dusseldorf and other major cities on the issues related to third
country cooperation in projects and sub-contracting.
Source: Drawn by Researcher on the basis of Data taken from Annual Reports of EEPC (Various Issues).
Export Promotion Councils in India (A Study of Engineering Export Promotion Council)
OJAS - Volume 3, No. 1, January-July 2014

10
The focus on such conferences have, of late, taken a paradigm
shift and today they are oriented to focus on trade exchanges
between India and trading blocks. The most recent of such
conferences like Euro-India conference on sub-contracting
collaboration, trade with SAARC, Afro-India, Indo-Lac, Indo-
NAFTA were organized in which participants from these regions
were invited for interaction with their Indian counter-parts on
such platforms. The participants in these events, from both the
sides, found the meets to be extremely useful and were also
immensely benefited.
Trade Delegations and Buyer-Seller Meets
The Council sponsors, on regular basis, the visit of Multi-product
Trade Delegations to identified markets overseas to foster closer
cooperation to promote strategic alliances and joint ventures
with overseas companies. It also sponsors the visit of overseas
delegations to India for similar purpose on specific products and
from various countries or regions so that the continuity is
maintained in the trade dialogue. Proposal for delegations in both
the directions is finalized on the basis of detailed inter-action and
with the full support of the Ministry of Commerce, Government of
India.
Export Related Services to Members
Services of the Council are planned in a manner to create an
ambience for providing appropriate services to its members by
taking up, on their behalf, the issues related with policy and
procedures for exports, timely availability of finance,
coordination with financial institutions, banks and other
institutions.
The Council keeps its members abreast of the trends and
opportunities in international markets to provide commercially
useful information so as to help in increasing and expanding their
exports. It also offers professional advice to members in the areas
such as, technology up-gradation, quality and design
improvement, product development, innovations, environment
protections, standards and specifications.
In addition to the above, Council is always alert to international
demand and ever changing needs of the small and medium
enterprises in recognition to their commitments to exports and
substantial contribution to engineering exports. It highlights the
issues related to small, medium and tiny sector exporters with
concerned authorities and also plays an active role in providing
Market Development Assistance (MDA) for the cause of export
marketing and market entries.
Services to Buyers
EEPC provides a host of services to overseas buyers at no cost so as
to facilitate in their sourcing of engineering goods & services from
India. This includes-
• Acts as a dynamic vehicle and trusted link between Indian
exporters and foreign buyers so to maintain mutual rapport.
• Identifies suitable suppliers in India who are able to cater
goods and services conforming to buyers’ needs.
• Arranges visits of overseas buyers, exploratory missions,
delegations to India.
• Provides suppliers’ profile and status reports on request.
• Assists in establishing collaboration with third country
exports.
• Makes publicity to create awareness amongst overseas
buyers on India’s technical competence and supply
capability.
• Acquaints overseas buyers with business climate and policies
prevailing in India.
• Helps in amicable settlement of trade disputes and removing
operational constraints.
Transformation
EEPC India has proved to be an important instrument in
transforming the profile of Indian engineering exports as a
supplier of low value items to capital goods, plant and machinery,
high-end engineering services, etc. Today, out of total engineering
exports, capital goods & machinery account for around 47% as
against around 12% in the year 1956-57.
Export Promotion Councils in India (A Study of Engineering Export Promotion Council)
OJAS - Volume 3, No. 1, January-July 2014

11
Diversification
During the nascent stage, Indian engineering exports were mainly
confined to Asia and to small part of Africa. Over the years, the
scenario has completely changed and as on date, about 40% of
total engineering exports are made to developed countries. A
table showing direction of Indian Engineering exports with a focus
on exports to developed countries out of total engineering
exports is given below-
Source: Official Website of EEPC (www.eepcindee.com)
Region 1956-57 2009-10
Europe 0% 24%
America 0% 15%
Source: Results drawn by Researcher on the basis of Data taken from the Reports of EEPC.
Source: Official Website of EEPC (www.eepcindee.com)
Export Promotion Councils in India (A Study of Engineering Export Promotion Council)
OJAS - Volume 3, No. 1, January-July 2014

12
Exports of EEPC Products from India during 2011-12 and 2012-13
Country Value (INR)
2011-12
Value (INR)
2012-13
Country Value (INR)
2011-12
Value (INR)
2012-13
AFGHANISTAN TIS 1058261359 1225012055 LEBANON 832984161 870523292
ALBANIA 47270089 26036621 LESOTHO 14023766 12109912
ALGERIA 1796854188 2387010875 LIBERIA 441937835 446752203
AMERI SAMOA 1803016 7887564 LIBYA 242019958 1428153606
ANDORRA 11154730 1118217 LIECHTENSTE IN 0 203942
ANGOLA 1478465619 1156384563 LITHUANIA 2484936398 353021778
ANGUILLA 48438 60763 LUXEMBOURG 169525391 163712700
ANTIGUA 0 9666635 MACAO 3346258 11045719
ARGENTINA 1901574394 1925177285 MACEDONIA 21336664 48069534
ARMENIA 54948962 77004193 MADAGASCAR 179679492 289274599
AUSTRALIA 9443432443 11982401343 MALAWI 1966782897 998074737
AUSTRIA 1749596895 1917527384 MALAYSIA 11187611554 15567338712
ARUBA 1509553 18183 MALDIVES 370732114 357882581
AZERBAIJAN 123960374 172211120 MALI 861472116 795671259
BAHAMAS 40064273 630457 MALTA 38970369 28443319
BAHARAIN IS 2543242396 4676270649 MARSHALL ISLAND 98654 3231822
BANGLADESH PR 12122470109 17984349740 MARTINIQUE 0 172204
BARBADOS 30717600 6336392 MAURITANIA 28248320 51137445
BELIZE 816048 10339393 MICRONESIA 0 188715
BELGIUM 7558499726 5777425606 MAURITIUS 612993622 664181179
BENIN 1473525281 981145580 MYANMAR 1722908795 5565407963
BERMUDA 372145 645667 MEXICO 5576261190 5824396897
BHUTAN 1368222913 888132429 MOLDOVA 10676411 12183927
BOLIVIA 109181048 265208701 MONGOLIA 85866879 150072983
BOSNIAHRZGOVIN 33339527 39841465 MONACO 443974 96906
BOTSWANA 200859729 207762263 MOROCCO 1165144725 3774641010
BRAZIL 16052557115 19388849193 MOZAMBIQUE 1484519588 2279724439
BR VIRGN IS 1833954 278393 NAMIBIA 79334917 63695044
BRUNEI 501999304 28535229 NAURU REP 28583 75761
BULGARIA 280994280 447603092 NEPAL 7147730183 8397052011
BURKINA FASO 457662238 817765251 NETHERLAND 8884832749 11894561539
BURUNDI 63460007 208957041 NETHERLANDANTIL 4885376 1193600
BELARUS 216282444 212095639 NEUTRAL ZONE 672790 0
CAMBODIA 314056944 285326137 NEW CALEDONIA 1673323781 194658819
CAMEROON 535420212 1095093796 NEW ZEALAND 501830729 1756568488
CANADA 6285276262 5955533145 NICARAGUA 296863783 171280460
CAPE VERDE IS 2595630 3983369 NIGER 109137015 100324528
Export Promotion Councils in India (A Study of Engineering Export Promotion Council)
OJAS - Volume 3, No. 1, January-July 2014

13
CAYMAN IS 209844 150812 NIGERIA 15604642452 19389118837
C AFRI REP 58073299 84263864 NORFOLK IS 485381 0
CHAD 244068864 232425894 NORWAY 1429657124 975817203
CHILE 1321114027 1450120128 OMAN 6389367587 9781302568
TAIWAN 2892077048 4659530625 PACIFIC IS 0 286913
CHINA P RP 18749463115 23009278773 PAKISTAN IR 1289511586 1923187381
COLOMBIA 1761520180 3193166334 PANAMA REPUBLIC 201984478 321739847
COMOROS 21962366 33575208 PANAMA C Z 0 5319833
CONGO P REP 882721769 1094709398 PAPUA N GNA 252587789 301711531
COOK IS 95326 0 PARAGUAY 380048683 463488071
COSTA RICA 237169651 304707770 PERU 1365392419 1469312657
CROATIA 685364915 306561727 PHILIPPINES 3832658722 5191710255
CUBA 55696530 173209810 POLAND 2002121552 2427785572
CYPRUS 128145638 130643469 PORTUGAL 793058063 610612157
CZECH REPUBLIC 1644817821 1525036226 EAST TIMOR 10159145 23400385
DENMARK 2003148735 1805518224 PUERTO RICO 20782086 30303613
DJIBOUTI 2929775357 1388620174 QATAR 2639153932 4251381555
DOMINIC REP 160053639 391608335 REUNION 6773528 3431710
DOMINICA 20502115 31179269 ROMANIA 1303493521 1934410909
ECUADOR 357764046 701187480 RUSSIA 5075682893 9019809323
EGYPT A REP 7087447920 9286222010 RWANDA 403208801 801350273
EL SALVADOR 112118303 460165096 SAO TOME 2235875 1469562
ESTONIA 638300007 247665782 SAUDI ARAB 19165355912 29564408490
ETHIOPIA 5095282840 7056095099 SENEGAL 1684284262 817798800
ERITREA 45048997 110750789 SERBIA MONTNGRO 39085490 1263540211
EQUTL GUINEA 9499459 43425861 SEYCHELLES 125098584 100778459
FAROE IS. 0 82080 SIERRA LEONE 700302150 2583222966
FALKLAND IS 0 67312 SLOVAK REP 309801832 561688371
FINLAND 896167046 880144051 SINGAPORE 30082196388 28048001823
FIJI IS 184335080 212141088 SLOVENIA 891951274 1049669686
FRANCE 12110568118 15171798631 SOLOMON IS 2713214 32641523
FR GUIANA 312548 122264032 SOMALIA 55571980 91849451
FR POLYNESIA 86400 5504167 SOUTH AFRICA 9470512452 13288017482
GABON 200581915 396642926 SPAIN 12702041276 10621743804
GAMBIA 85418471 72136702 SRI LANKA DSR 12800699409 15221770305
GEORGIA 242218559 389403670 ST KITT N A 652461 242075
GERMANY 39366917811 41155842719 ST LUCIA 7474577 2157718
GHANA 4775895712 4492584574 ST VINCENT 1625032 1758597
GIBRALTAR 3183679 1201342 SUDAN 5521887469 3435508709
GREECE 550916397 482444389 SURINAME 24295004 922966759
GREENLAND 0 54591 SWAZILAND 40761172 30603597
Export Promotion Councils in India (A Study of Engineering Export Promotion Council)
OJAS - Volume 3, No. 1, January-July 2014

14
GRENADA 11132517 3482360 SWEDEN 3244998016 3478481230
GUADELOUPE 2179392 547570 SWITZERLAND 4577245979 6009890052
GUAM 11934470 510590 SYRIA 2479123861 2016419672
GUATEMALA 1322783920 1928687940 TAJIKISTAN 76999354 52199228
GUINEA 261673029 432051595 TANZANIA REP 4731330987 6340204904
GUINEA BISSAU 6504128 22190957 THAILAND 12146918522 22393768871
GUYANA 105263318 163818532 TOGO 526009837 587924937
HAITI 81249757 73938337 TOKELAU IS 0 163796
HEARD MACDONALD 0 62732 TONGA 110093 520254
HONDURAS 243561982 363218888 TRINIDAD 181408101 143240907
HONG KONG 3805654499 4763417444 TUNISIA 625283655 757866785
HUNGARY 2789903233 3180403168 TURKEY 11552125926 12684244733
ICELAND 18518301 31025785 TURKMENISTAN 836022870 2320279342
INDONESIA 13146554748 18199072589 TURKS C IS 127083 95872
IRAN 10622676903 16916819773 TUVALU 6637 0
IRAQ 2731835166 5394478010 UGANDA 2688980058 2989444572
IRELAND 692037534 1195280275 U ARAB EMTS 38105595568 47264658530
ISRAEL 2635101791 2988150679 U K 35004159789 36931322102
ITALY 18647288880 18990478620 UKRAINE 937512949 853331488
COTE D' IVOIRE 332974413 761856124 U S A 99448721789 116554231214
JAMAICA 62932921 36168441 URUGUAY 511637946 425431392
JAPAN 8606606446 12532867086 UZBEKISTAN 716291124 972593483
JORDAN 1510737100 3446712932 VANUATU REP 2323332 903635
KAZAKHSTAN 650001176 1189320733 VENEZUELA 1349612705 1824134005
KENYA 9982110840 12475929085 VIETNAM SOC REP 8095379153 6260144000
KIRIBATI REP 7331825 779774 VIRGIN IS US 542377 3411652
KOREA DP REP 872648422 514483581 SAMOA 6608066 3971967
KYRGHYZSTAN 32745256 27247760 YEMEN REPUBLC 1199192647 1761159042
KOREA REP 6532825324 7851584095 CONGO D. REP. 7227298 597917294
KUWAIT 6293791094 6244187359 ZAMBIA 2421896591 3087454112
LAO PD REP 172731967 55215791 ZIMBABWE 1608326203 1251068665
LATVIA 161114234 89943115 UNSPECIFIED 2128926241 328299788
Source: Annual Reports of EEPC 2011-12 and 2012-13.
Export Promotion Councils in India (A Study of Engineering Export Promotion Council)
OJAS - Volume 3, No. 1, January-July 2014

15
Bibliography
Books
1. Pinpointing Export Promotion -A.C. Banerji
2. Export Marketing .of India’s New Manufactures -S.R. Khanna
3. Export-Led Growth: India’s Strategy and Policy Options - K.M.
Raipuria
4. The International Business Environment - Anant K. Sundaram
5. Free Trade Zones and Export Strategy - N. Villal
Official and Government Publications
1. Annual Report -Ministry of Commerce, Government of India,
Various Issues
2. Draft of Five Year Plane (I Plan to XII Plan)-Planning
Commission
3. EXIM Policies -Government of India
Journals & Periodicals
1. Foreign Trade Review
2. India Invites ‘U’
3. Commerce & Trade
References and Articles
1. Anwar, M., and R. Sampath, 2000, ‘Exports and Economic
Growth’, Indian Economic Journal 41, 3, pp. 79-88.
2. Bhat, S., 1995, ‘Export and Economic Growth in India’, Artha
Vijana 37, 44, pp. 350-358.
3. Chandra, R., 2000, ‘The Impact of Trade Policy on Growth in
India’, Unpublished Ph.D Thesis, Department of Economics,
University of Strathclyde, Glasgow
4. Chandra, R., 2002, ‘Export Growth and Economic Growth: An
Investigation of Causality in India’, Indian Economic Journal,
49, pp. 64-73.
5. Dash, R. K., 2009, ‘Revisited Export-Led Growth Hypothesis:
An Empirical .Study on India’, South Asia Economic Journal,
10, 2, pp. 305-324.
6. Dhawan, U. and Biswal, B., 1999, ‘Re-examining Export-led
Growth Hypothesis: A Multivariate Cointegration Analysis for
India’, Applied Economics, 31, pp. 525-530.
7. Dutt, S. D. and D. Ghosh, 1994, ‘An Empirical Investigation of
the Export Growth - Economic Growth Relationship’, Applied
Economics Letters, 1, pp. 44-48.
8. Ghatak, Subrata, and Stephen Wheatley Price, 1997, ‘Export
Composition and Economic Growth: Cointegration and
Causality Evidence for India’, Weltwirtschaftliches Archiv,
133, 3, pp. 538-553.
9. Nandi, S. and Biswas, B., 1991, ‘Export and Economic Growth
in India: Empirical Evidence’, Indian Economic Journal, pp. 53-
59.
10. Nidugala, G. K., 2001, ‘Exports and Economic Growth in India:
An Empirical Investigation’, Indian Economic Journal, 47, 3,
pp. 67-78.
Export Promotion Councils in India (A Study of Engineering Export Promotion Council)
OJAS - Volume 3, No. 1, January-July 2014

“Pradhan Mantri Jan Dhan Yojana”: An Economic Boost“Come, Join hands and give boost to Indian economy”
Jyoti Kumari*
Abstract
Indian government and Reserve Bank of India (RBI) are trying from so many years to bring all the people in the ambit of banking. On the eve of 68th Independence Day, Prime Minister Narendra Modi publicized “Pradhan Mantri Jan Dhan Yojana” to reduce financial untouchability by including millions of people in the financial mainstream. By joining hands with the people at the ‘bottom of the pyramid’, this programme will give a new height to our economy. This paper aims to highlight the benefit of this programme to the bank, the Government and the life of millions of people. This paper focuses on very important shortcoming of this programme. This paper will also suggest the complementary measure for long run and definite success of this programme and highlight some of the challenges ahead. Hence, this paper tries to focus on the impact of new programme initiated to reduce poverty, social upliftment and for economic boost.
Keywords: Financial Inclusion, Pradhan Mantri Jan Dhan Yojana, Economic Boost, People, Government, Bank.
*SRF (UGC), Department of Business, Finance & Economics, FCMS, JNVU, Jodhpur 342001, Rajasthan, India. Email id: [email protected]
Introduction
Banking facility is one of the fundamental necessities of the
people and everyone must be the part of civilization. This not only
helps people in becoming the part of civilization but also help
them in contributing towards the growth and development of the
economy. Banks not only act as finance provider but also act as a
friend, custodian, and financial advisor and can also play the role
of mediator between government and public. In case of India,
where large number of people belongs to middle and low income
group who have tendency to spend a very small proportion of
their income and to save more and more for their future need. But
still, in India, millions of people are facing the problem of financial
untouchability. In India, according to census 2011, around 68.68
percent of total population lives in rural areas and 31.2percent
lives in urban areas and out of this, only 54.4 percent households
of total rural population and 67.8 percent households of total
urban population have access to banking services. Hence, these
figures reflect that even after 68th year of Independence Day and
lot of efforts from the side of previous government and Reserve
Bank of India (RBI), the problem of financial untouchability
continues to persist in our economy. Therefore, Prime Minister
highlighted this problem by stating Economic Times Bureau
(2014) that not even 68 percent of Indian population has access to
banking services even after 68 years of Independence. Thapar
(2013) stated the actual challenge to the banking industry is from
the people who are not availing its services. She also emphasized
on the significance of financial services for development of
human being and economy at a large. Gandhi (2013) highlighted
banking services as a fundamental element to alleviate poverty.
To overcome this problem RBI urged banks to follow the objective
of financial inclusion, in this way this word was first featured in
India in 2005. The term financial inclusion refers to ‘impart of
banking services to the deprived and low income group people at
reasonable cost’. Leeladhar (2006) defined financial inclusion as a
means to deliver banking services to the huge sections of the
disadvantaged and low-income groups at an affordable cost. This
financial inclusion will help poor to liberate from the clutches of

“Pradhan Mantri Jan Dhan Yojana”: An Economic Boost “Come, Join hands and give boost to Indian economy”
OJAS - Volume 3, No. 1, January-July 2014
traditional and informal finance provider and motivates them to
change their lifestyle and in this way it will prove to be the move
towards modernization. Through successful implementation of
this programme, the banks will reach to the village level.
Indian government and RBI are trying from so many years to bring
all the people in the ambit of banking. To achieve this objective,
Prime Minister Narendra Modi announced “Pradhan Mantri Jan
Dhan Yojana” on the eve of 68th Independence Day to reduce
financial untouchability by including millions of people in the
financial mainstream and targeted to open 7.5 crore bank
accounts till 26th January 2015. Thus, this scheme is going to
cover poor and underprivileged not only from rural areas but also
from urban areas and all the accounts opened under this scheme
will be linked to the Aadhar card and provided the facility of debit
card under the Ru-pay scheme. Two bank accounts will be opened
per household at zero balance. Those who open accounts by 26th
January 2015, they will be entitled to receive Rs. 30000 as life
insurance over and above Rs. 100000 as accidental insurance for
his entire family. These amounts will definitely support the poor
family who do not have enough money to insure the life of their
family or self and many a times it happens that the earning
member of the family caught in the accident and family left with
no means of livelihood and were forced to opt either wrong way to
earn livelihood or to beg or to commit suicide, in such cases this
accidental insurance will prove to be the ray of hope in the life of
those poor people. After satisfactory operation of account for six
months and account linked to the Aadhar card, every individual
opened account under this scheme will become eligible for
overdraft facility of Rs. 5000 which will be decided by the bank and
also all the benefits will be directly transferred from the
government to the beneficiaries and this reduces leakages and
corruption. This overdraft amount will also act as strong tool
which support family to start small business and assist people to
live life with dignity.
Review of Literature
Various literatures have been reviewed which highlights the
fundamental necessity of banking services in the life of the people
and in the era of economic reforms, Thapar (2013) mentioned
that the biggest challenge for the banks is from the people who
are not availing the banking services. In present scenario, where
people have reached to the space, it is very shameful for our
country where neither millions of people have even reached to
the banks nor banks are capable to reach to those millions of
people. Ravichandran & Alkhathlan (2009) mentioned financial
exclusion as one of the emblematic reasons for poverty in India. If
financial inclusion is properly implemented for each and every
segment of society, then this will definitely raise the living
standard of millions of poor and make India proud. Gandhi (2013)
also highlighted financial exclusion as one of the problem of our
economy which needs an urgent attention to attain the objective
of equitable and sustainable growth. He also said that may be this
task will prove to be the responsibility of the bank in the short run
but it will convert into the business opportunity in the long-run.
He emphasized on the fact that increased saving motivates the
risk taking capacity of the people which encourage investment
and hence lead to the development of new business
opportunities. Rao & Bhatnagar (2012) underlined that greater
financial access will invite attention of several global market
players to our country which result in increasing business
opportunities and employment. Jagannathan (2014) focussed
that the use of banking services will reduce the financial cost
because the purchase and sale of goods and services can be done
without the use of money and this will reduce the printing cost of
currency. But he also questioned that whether this yojana will
prove to be the hidden loan fair which in future going to increases
the Non Performing Assets (NPA) of the banks? This is due to the
fact that if the overdraft facility availed by the people are not
repaid then lastly all the burden of those NPA will be bear by the
governments because government has the ownership right over
most of the banks.
Mobilization of savings through opening of bank account will help
bank to fulfill the growing credit demands in the economy. Mohan
(2006) emphasized that financial inclusion will fortify financial
deepening and offer means to the banks to enlarge credit delivery.
Thus, financial inclusion helps in financial development which
further accelerates economic growth. Mas (2010) emphasized
financial inclusion as an engine for reduction of poverty as it
assign poor people with more tools to manage their lives and plan
routes out of poverty. Mitton (2008) indicated that the financial
17

inclusion must be the priority of the government because it
reduces the problem of social exclusion. Hannig & Janse (2010)
argued that the better financial inclusion offers opportunities to
augment financial stability. Khan H., (2012) stressed that both
financial inclusion and financial stability must coexist to attain the
objective of inclusive growth in sustainable manner.
Only integrating people with the financial mainstream is not
satisfactory but in order to make effective utilization of banking
services and for successful implementation of this programme,
this requires proper banking education to the people.
Morawczynski et al. (2010) argued that financial education must
be assimilated with the financial inclusion then only people will
effectively utilize the financial services. Damodaran (2013)
highlighted that financial inclusion will help in faster and more
stable growth and development of an economy. It upsurge the
standard of living of the people, guarantees the systematic
growth and prove to be the strongest tool to break the wall
between rich and poor. Kelkar (2009) focused on multi-
dimensional benefit of financial inclusion like it will help farmers
in reducing their problem of indebtedness, encourage
modernization of agriculture, promote equitable and inclusive
growth as it mobilize the people from the ‘bottom of the pyramid’,
encourage grass-root entrepreneurs and innovations. Thus, it will
prove to be the pre-condition for supporting comprehensive
growth. Sarma & Pais (2008) found the existence of strong
positive co-relation between financial inclusion and human
development with certain exceptions and highlighted that the
financial exclusion is certainly the reflection of social exclusion.
Khan (2012) believed financial inclusion ensures to attain the
objective of inclusive growth with financial stability. Financial
inclusion will raise the awareness and raises the ambitions of the
poor because banks will convert the wishes of poor into reality
and give them wings to fly high. Subbarao (2009) claimed financial
inclusion to be the win-win prospect for the poor, for the banks
and for the nation.
Bhatia & Chatterjee (2010) mentioned financial inclusion to be
the buzzword and will take long time to become reality. Leeladhar
(2006) stressed that the banks must reform their business
strategies to integrate specific plans to encourage financial
inclusion of poor people by considering it be the business
opportunity as well as a corporate social responsibility (CSR).
Shetty & Deokar (2014) underlined that the “Pradhan Mantri Jan
Dhan Yojana” is not a new programme but there were various
programmes initiated by RBI and Ministry of Finance, but due to
lack of co-ordination among people, government and RBI, the
objectives of all those programme has not been achieved till now.
Hence, only formulation of programme is not sufficient for
conversion of dreams into reality, but this requires effective and
transparent implementation of that programme at the ground
level with co-ordination of government, bank and public.
Need/ Significance of the Study
There are around 135 million household who do not have access
to banking services even after nationalization of 14 banks in 1969
with the purpose of financial inclusion. This show that even after
45 years of nationalization of banks and various other steps taken
by RBI, this problem still persist in our economy. Therefore Prime
Minister Narendra Modi took initiative through “Pradhan Mantri
Jan Dhan Yojana” to take people in the realm of banking. As we
know there is a very big wall between the rich and poor in our
economy. At one side, there are various people in our country
who have ample amount of cash balance but do not have access
to banking facility, and they use to keep their money in the pot
under the land or in the wall. Hence we can say there is lot of
money which fails to circulate in the economy. There are many
people holding black money (unaccounted money) earned
through legal or illegal sources and they also use to keep that in
the same way. Therefore, opening of bank account will boost the
economy through conversion of black money into white and by
increasing the volume of circulation of money. On the other side,
there are many people who were caught in the grip of
moneylenders and sahukars who exploit them and charge hiked
interest rate from those poor people. Even at the time of
emergencies, these poor people sometimes fails to arrange
money even for the medicines to their family and in the shortage
of and limited sources of finance; they even lost their near and
dear ones. Many times, due to urgent needs, these people were
even forced to sale their children in the hands of cruel people who
exploit them extremely also they are so deeply fall in the well of
loan that their seven generation even fails to overcome that
18
“Pradhan Mantri Jan Dhan Yojana”: An Economic Boost “Come, Join hands and give boost to Indian economy”
OJAS - Volume 3, No. 1, January-July 2014

situation. Hence, in this 21st century, where many miracles have
taken place due to the grace of science, now it is the time to pull
those millions of people from the grip and clutches of
moneylenders and sahukars and to give them opportunity to live
the life with dignity. Therefore, this study is significance in the
manner that it emphasis on how this programme is going to
benefit the bank, the Government, the life of millions of people
and economy as a whole. This study also emphasis on the very
important shortcoming of this programme. This paper will also
suggest the complementary measure for long run and definite
success of this programme and also highlights some of the
challenges ahead. Hence, this paper tries to focus on the impact of
new programme initiated to reduce poverty, social upliftment and
for economic boost. Hence this paper is going to check the
relevance of the programme initiated by Prime Minister.
Objectives of the study
The objective to launch this programme is to bring millions of
people in the ambit of banking which is the major challenge for
the banks. After travelling such a long distance of Independence,
there are still around 68 percent of total Indians who are not
included in the financial mainstream. Although many efforts have
been taken in India to eradicate financial untouchability but those
efforts have not got success. The main aim behind this
programme is to link Indians together to move towards the path
of economic growth and development. This study was undertaken
in the light of programme announced by the Prime Minister. The
objectives of the study are mentioned below:
To find out the prospective benefit of “Pradhan Mantri Jan Dhan
Yojana” to the people, banks, government and the economy as a
whole,
To find out demerits of the programme,
To find out thathow this programme is effective to remove
poverty,
To find out prospective challenges ahead this programme.
Prospective Relevance of “Pradhan Mantri Jan Dhan Yojana”
The opening up of zero balance account will not only help poor to
be included under the financial mainstream but also benefit the
bank, the government and hence the economy at large. As we
know that the importance of small needle cannot be met by the
sword similarly touching the lower segment of the pyramid will
bring a very drastic change in the economy because these people
are in the lower segment of the pyramid but when these Indians
join their hands with the mainstream then they give a new boost
to Indian economy and assist India to move towards the path of
developed economy. When these financially excluded people get
connected with the bank by opening their account then they start
depositing their small savings with the bank in lure of interest and
safety and that small-small savings will become such a large
amount that when put to investment will generate greater
employment opportunities, which in return generate income
which produce demand and this will encourage further
production and employment generation and again will boost
saving and investment. Hence, this effort of the government will
bring movement to the vicious cycle of growth and bring major
favourable changes in the economy in the long run. If we take only
one aspect of the plan that is the overdraft facility of the bank
then also we may come to know that if the bank decided to give
overdraft facility to both the account holder from one house then
with the help of Rs. 10000, that household can start very small
business and hence that overdraft facility will act as a backbone
for the family. This scheme will eradicate the role of mediator who
act as parasite and eats up the benefits given by the government
to the people because with the help of this scheme all the
subsidies and benefits will directly be deposited in the account of
the beneficiary by linking account with the Aadhar card. The role
of Sahukars and Mahajans will also be reduced because now
people will go to the bank in their emergency period and not to
those traditional lenders. In this way, this programme assists in
reducing poverty upto certain extent. This scheme will also
convert the black money (unaccounted money) into white money,
reduce the problem of corruption because when everything will
become online then people hesitate and fear in doing wrong
deeds. Hence, in this way this scheme will not only increase the
circulation of money but also bring multi-dimensional benefit to
the economy.
19
“Pradhan Mantri Jan Dhan Yojana”: An Economic Boost “Come, Join hands and give boost to Indian economy”
OJAS - Volume 3, No. 1, January-July 2014

Table 1: Benefits of Pradhan Mantri Jan Dhan Yojana
Basis of Benefits Person Government Bank
Financial inclusion Poor and deprived will be included in the financial mainstream
Have record of each and every person
Increase in cash balance with the banks
Impact on saving People motivated to save more and more in the lure of safe custody and interest rate.
Mobilize savings which leads to enhanced circulation of money and enhance investment in the economy.
Give new wings to banking business.
Reduction in corruption Direct transfer of benefits from government to the beneficiaries.
Reduction of currency printing expenses and enhances transparency in work.
Continuous flow of money in the new account and reduces the chances of NP!’s in the banks.
Reduces the role of sahukars and mahajans
Emancipation of poor people from the grip of traditional money lenders.
Reduces gap between government and public and hence leads to social welfare.
Enhance lending business of banks.
Impact of overdraft facility Work as a tool for emergency assistance.
Increase faith on government. Enhance additional source of interest.
‘Digital India Scheme’ Through direct deposit of subsidies in the account, it motivates people to change their lifestyle and step-up towards modernization.
Complementary to government’s ‘Digital India Scheme’ as it is move towards cashless economy.
Limit the role of cash in an economy.
Economic growth Increases employment opportunities in the long run.
Attain the objective of reduction in poverty and attain the objective of maximum social welfare.
Expansion of banking branches and personnel.
Reduction in poverty People get means to earn livelihood.
Sustainable and continuous economic growth.
Regularity and certainty of account.
Social upliftment Raise the living standard of people and help them to become the part of civilization.
Reduction in corruption and leakages by limiting the role of middlemen.
Accounting of all black money which proves to be the effective tool for development.
Economic growth Cycle Deposits of saving ensure the continuous flow of economic cycle.
Increased investment generates employment opportunities which increase income and purchasing power and give boost to production and growth cycle continues.
Increased saving with bank encourage more and more lending for investment purposes.
Strong Financial Position Idle deposits circulate in the economy.
Circulation of money increases in the economy and economy will become financially strong.
Strong financial position of banks by joining hands with millions of financially excluded people.
Reduction in Financial Cost Risk of carrying and handling cash reduces.
Reduction in burden and cost of printing of currency and helps in making India green by saving trees.
Less chances of wear and tear of notes.
Role of Self-employment Two accounts from each house and the total amount of overdraft facility will help poor to start some small business.
Responsibility of government to provide employment to vast population decreases upto certain extent.
Deposits with banks increases and chances of NPA reduce.
Prospective Challenges of “Pradhan Mantri Jan Dhan Yojana”
As we know that “The path of success is not easy and smooth”
similarly there are many challenges in front of the “Pradhan
Mantri Jan Dhan Yojana”. The very biggest challenge is its
implementation because opening of bank account is not the big
issue but to maintain regularity and continuity of those accounts
is very important. Opening of 7.5 crore zero balance bank account
till 26th January is very biggest task in front of bank. This requires
Source: Author’s contribution
20
“Pradhan Mantri Jan Dhan Yojana”: An Economic Boost “Come, Join hands and give boost to Indian economy”
OJAS - Volume 3, No. 1, January-July 2014

patience among the banking personnel because the people
opening bank account have not used the banking facility till now
so many people may ask very silly questions which banking
personnel has to respond softly. After opening of account, the
next challenge in front of bank and government will be to open
various branches of banks to make banks upto the reach of the
people and then to appoint various personnel to look after day to
day working of the banks and then to keep an eye on various
accounts and decide the sanction of overdraft facility. After
sanction of overdraft limit the work of bank doesn’t get complete
because after that bank has to check about the utilization of
overdraft limit and also have to take various steps to collect the
amount of overdraft otherwise the amount of NPA of banks
increases when people fails to repay then finally government has
to bear the burden of NPA because almost for all the banks
government has the ownership right. Also the use of Ru-pay debit
card and banking services needs proper training and education so
that no one can misguide these people. Hence, this is required by
the bank to undertake training programme in order to educate
these people for effective utilization of banking services in reality
and for successful implementation of this programme. Thus, lot of
precautions and safety must be undertaken while
implementation of this programme. Therefore, this requires
efforts not only from the side of the government but also from the
side of the public and the bank. Some of the challenges are as
under:
Challenge to manage the workload by the banking personnel.
Challenge to launch training programme at a very large scale and
to motivate people to join this programme.
Challenge to open various banks at different places for successful
implementation of this programme.
Challenge to maintain transparency for effective implementation
of the programme.
Chances of increase in the amount of NPA’s due to incapability of
the poor to repay the borrowed amount.
Suggestions
One of the important demerits of this programme is the issue of
Ru-pay debit card at a very short interval of time and without any
prior training, therefore there are chances of mis-utilization of
debit card. Therefore, to overcome that evil, movement is
prerequisite to be launched to instruct people about how to use
the debit card and this can be done by taking help of non-
government organization (NGO’s) and other banking staffs.
Morawczynski et al. (2010) emphasized that the financial
education must be integrated into the financial inclusion
programme, and then only people will effectively exploit the
banking services.
If people, in the short run, avail the facility of overdraft facility
without any continuous and certain flow of income, then the
facility of overdraft and its interest will slowly and gradually
becomes burden for the poor people and if they fail to repay then
banks will deduct the same from their credited subsidies and if it
fall short then their goodwill vanished in the eyes of Banks and
again, this force them to go in the hands of traditional lenders who
treat them crudely. Hence opening of account will definitely
reduce the corruption and break the chain of mediator but in
order to remove poverty at the ground level it requires people to
be offered with the means to earn livelihood then only people will
be able to maintain their account and our country will move
towards the real growth and development.
Conclusion
For effective implementation and success of this program sincere
efforts are required not only from the side of banks and
government but also from the general public. This programme is
not only going to benefit the public at large but also to the banks,
the government and give boost to the economy. In the long run,
this programme will generate employment at large scale for all
types of workers whether skilled, semi-skilled or un-skilled. Hence
we can say that this programme will not only open-up zero
balance account but also a step to alleviate poverty by generating
employment opportunities which improves the living standard of
millions of people. This programme is going to speed up the
growth cycle of economy by motivating savings which further
motivates more and more investment, which encourages
employment, this in turn increases the income and purchasing
power, this encourage production, this will lead to effective and
optimum utilization of resources and lead to economic growth
21
“Pradhan Mantri Jan Dhan Yojana”: An Economic Boost “Come, Join hands and give boost to Indian economy”
OJAS - Volume 3, No. 1, January-July 2014

and development and ultimately a move towards higher living
standard and modernization. But this will take time.
Limitation of the Study
One of the important limitations of this study is that it is based on
secondary data. If instead of secondary data, its response is
collected from the concerned people, then the conclusion will be
more fare and relevant. Also this study ignored the actual
calculation of cost, burden and duration relating to the opening of
bank branches to make banking facility to the reach of those
people.
Scope for future research
After complete implementation of this programme, further
primary research needs to be conducted to judge the actual
performance and success of “Pradhan Mantri Jan Dhan Yojana”. A
separate research can also be conducted related to the burden of
NPA’s to the banks after implementation of the programme.
Presently, primary research can be conducted to check the burden
and response of banks while implementing this programme and
also the prospective expenditure incurred on opening and
maintaining the account. A research can also be conducted to find
out the expenditure to be incurred on maintaining and composing
prospective infrastructure, human talent to hold out daily
activities of the banks and boost to the economy in terms of
generation of employment opportunities and development of
infrastructure facilities.
“Link Indian and move India”
References
1. Bhatia, N., & Chatterjee, A. (2010, October 16). "Financial
Inclusion in the Slums of Mumbai". Economic & Political
Weekly, Vol.45(42), 23-26.
2. Damodaran, A. (2013). "Financial Inclusion: Issues and
Challenges". AKGEC International Journal of Technology,
Vol.4 (2), 54-59.
3. Economic Times Bureau. (2014, August 29). "PM 'Jan Dhan'
Yojana launched; 1.5 crore bank accounts opened in a day".
The Economics Times.
4. Gandhi, M. (2013, June). "Financial Inclusion in India: Issues
and Chal lenges". View of Space: International
Multidiciplinary Journal of Applied Research, Vol.1(3), 12-22.
5. Hannig, A., & Jansen, S. (2010). "Financial Inclusion and
Financial Stability: Current Policy Issues". Asian Development
Bank Institute working paper series no.259, 1-33.
6. Jagannathan, R. (2014, September 1). "Jan Dhan
Yojana:Simply a Loan Fair or Something Else". Weekly
Economic Review, p. 13.
7. Kelkar , V. (2009, September). "Financial Inclusion for Inclusive
Growth". ASCI Journal of Management, Vol.39(1), 55-68.
8. Khan, H. (2012, march). "Financial Inclusion and Financial
Stability: Are They Two Sides of the Same Coin?". RBI Monthly
Bulletin, 553-563.
9. Khan, H. R. (2012, August). "Issues and Challenges in Financial
Inclusion: Policies, Partnerships, Processes & Products". RBI
Monthly Bulletin, 1447-1457.
10. Leeladhar, V. (2006). "Taking Banking Services to the Common
Man - Financial Inclusion". RBI Bulletin .
11. Mas, I. (2010, August). "New Opportunities to Tackle the
Challenge of Financial Inclusion". Working Paper Series No.
40, 1-13. Institute for Financial Management and Research,
Centre for Micro Finance.
12. Mitton, L. (2008, July). "Financial Inclusion in the UK: Review
of Policy and Practice". 1-4. Joseph Rowntree Foundation.
13. Mohan , R. (2006). "Economic Growth, Financial Deepening
and Financial Inclusion". Reserve Bank of India Bulletin.
14. Morawczynski, O., Hutchful, D., Rangaswam, N., & Cutrell, E.
(2010). "The Bank Account is not Enough:Examining
Strategies for Financial Inclusion in India". International
Conference on Information and Communication Technologies
and Development, (pp. 24-33).
15. Rao, N., & Bhatnagar, H. (2012, September). "Financial
Inclusion: Issues and Prospects". Pacific Business Review
International, Vol.5(3), 84-96.
22
“Pradhan Mantri Jan Dhan Yojana”: An Economic Boost “Come, Join hands and give boost to Indian economy”
OJAS - Volume 3, No. 1, January-July 2014

16. Ravichandran, K., & Alkhathlan, K. (2009). "Financial
Inclusion-A path towards India’s future economic growth".
Rtrieved from http://ssrn.com/abstract=1353125, 1-30.
17. Sarma, M., & Pais, J. (2008). "Financial Inclusion and
Development: A Cross Country Analysis". 1-30.
18. Shetty, S., & Deokar, B. K. (2014, August 30). "Financial
Inclusion Differences between the Government and RBI?".
Economic & Political Weekly, Vol.49(35), 12-15.
19. Subbarao, D. (2009, December). "Financial Inclusion:
Challenges and Opportunities". 1-16. Remarks by RBI
Governor at the Bankers’ Club in Kolkata.
20. Thapar, A. (2013, June). "A study on the effectiveness of the
financial inclusion program in India". VSRD International
Journal of Business and Management Research, Vol.3(6),
211-216.
23
“Pradhan Mantri Jan Dhan Yojana”: An Economic Boost “Come, Join hands and give boost to Indian economy”
OJAS - Volume 3, No. 1, January-July 2014

A comparative study of Talent Management Practices implemented by Information Technology Companies & Automobile Companies in Pune Prof. Shraddha Purandare*
Abstract
The purpose of this article is to explore various talent management practices implemented by IT Companies & Automobile companies and its overall impact on retention of the talent and organizational performance. In the first phase of the survey, data collected from the sample of 280 employees using structured questionnaire. In second phase, in depth interviews of HR heads were conducted to get an idea about talent management practices implemented by them.
Findings reveal that the major factors for attrition were career development opportunities, incentives, inter personal relations. Finding also revealed that there is no significant difference between practices implemented by IT companies & Automobile companies. The positive aspect of the study was data collected through data triangulation i.e. data collected through literature, structured questionnaire & in depth interviews. Employee turnover is high in these companies & has direct impact on employee retention & overall performance of the organization.
For sustainability in the market, there is a need of adopting & executing strong talent management practices. Effective implementation of robust talent management practices will help to control the retention. This would enable organization to control cost & perform in a better manner
Keywords: Talent Management, retention, organizational performance, employee turnover
*Research Scholar, D.Y. Patil University’s Global Business School & Research Centre, Pune-Maharashtra. Email: [email protected]
Introduction
Talent Management is an issue which is bothering the growth
orientation of companies be it engineering, service,
manufacturing or IT. Talent Management has become a buzz word
in today’s HR profession. In fact CEO’s are also increasingly
involved in talent management process (Economist Intelligence
Unit, 2006). People are the most valued asset of the organization
and they significantly impact the organization transformations.
Talent management is management‘s main priority (Michaels,
Handfield-jones, H. & Axelrod, 2002) Challenge has shifted from
organizational growth to organizational sustainability (Collings,
2009). Among all the factors that could influence the
effectiveness of organizations in the future, the foremost driver is
talent (Buckingham & Vosburgh, 2001) It has become a growing
field for researchers and attracted attention of industries &
academicians. Talent Management has been considered as main
strategic priority (Kalomayra, 2009). The competitive advantage
for organizations come from having superior talent and managing
it appropriately (Oakes2006). Corporations now appear ready to
embrace this concept (Oakes, 2006).Talent management is all
about manpower planning, acquiring and placing right people for
right job, selection, succession and as well as retention of the
employees (Byham,2001; Heinen & O'Neill, 2004 Mercer, 2005).
Competition and the lack of availability of highly talented and
skilled employees make finding and retaining talented
employees’ major priorities for organizations (Fegley, 2006).
It is difficult to retain the talent with high performance ratings
that’s why it has become critical for HR to perform this function
(Walker & Larocco, 2002). Introducing talent management
process in a company needs to have clear objective and an

A comparative study of Talent Management Practices implemented by Information Technology Companies & Automobile Companies in Pune
OJAS - Volume 3, No. 1, January-July 2014
understanding about the expected achievements. Kumar (2007)
showed that talent is a critical driver of corporate performance
and potential competitive advantage. Due to this many
organizations invest their financial resources to attract, deploy,
and try to retain talent by application of various initiatives. Talent
management has moved away from being an administrative
process to a continuous organizational practice with a strategic
focal point that drives organizational outcomes. Recently,
substantial analysis has focused on the association between
talent management and enhanced performance (Boudreau and
Ramstad, 2007; Cappelli, 2008; Collings and Mellahi, 2009;
Huselid et al.2005, Ready and Conger, 2007)
Through this research, researcher has tried to find out various
talent management practices implemented by the companies
from different sectors & its overall impact on performance.
Literature Review-Talent Management
McKinsey & Company first coined the term talent in their report
The War for Talent (1997; Michaels, Handfield-Jones, and Axelrod
2001), revealing the ‘war for talent’ as a strategic business
challenge and a critical driver of corporate performance. Goffee
and Jones (2007) defined talent as a handful of employees whose
ideas, knowledge and skills give them the potential to produce the
disproportionate value from the resource they have available
from them. Tansley, et.all. (2006) pointed out that talent can be
considered as a complex amalgam of employees' skills,
knowledge, cognitive ability and potential. Employee’s values and
work preferences are also of major importance.
Different sets of opinions have been formed for managing the
talent due to which perceptions of managing this talent diverge.
Companies have found that they not only need to acquire good
talent worldwide but they need to retain it as well (P.A. Grobler
2010). Retaining top talent is becoming the key challenge for
companies which depend on knowledge-workers and intellectual
capital as the main resource (M.S. Srinivasan, 2011). A
benchmarking study conducted by DDI (Development
Dimensions International - Retaining Talent 2007) also stated that
organization needs to come up with different strategies to handle
employees of older & younger generations. Talent has become
the key differentiator for human capital management and for
leveraging competitive advantage.
Grounded within strategic HRM (Gratton, 2000; Becker et al.,
2001), the management of talent seems to be one of the key
functions that HRM is playing strategically in organizations
(Bhatnagar, 2004). Pfeffer and Sutton (2006) quoted that the
typical HRM/talent mindset, which looks at performance results
as an opportunity for an “assessment” of ability, leads to lower
performance and unhappy staff who do not fulfill their potential.
As per the survey conducted by Lewis and Heckman (2006), there
was a “disturbing lack of clarity concerning to definition of Talent
Management. They were of the opinion that conceptualizing
Talent Management in terms of the functions of traditional HRD
seems to add little or nothing new to our understanding of how to
manage talent strategically.
Talent Management has evolved into common management
practice and while originally focused on recruitment (Michaels et
al. 2001). Talent management is still evolving between the
employer & employees. There are 3 stages of development of this
relationship between employer & employee as mentioned by
Cheloha, R., & Swain, J. (2005).
1. Personal Control
2. People Development
3. Talent Multiplication.
At the last stage, talent is managed for getting competitive
advantage over competitors. This will create value for the
organization.
Spherion (2002-03) in Introduction to Talent Management has
stated that talent management involves individual and
organizational development in response to changing and complex
operating environment. It includes creation and maintenance of
supportive, people oriented organization culture. Talent
management implies recognizing individual inherent skills, traits,
personality and offering a matching job. P B.S Kumar (2006) in an
article on Talent Management has stated that talent management
implies recognizing inherent skills, traits, personality and offering
25

a challenging job. Every person has unique talent that suits a
particular job profile and any other position would cause
discomfort.
As the meaning of talent varies for every organization, definition
of talent management has been seen from different perspectives.
Sengupta S.B. (2010) has mentioned these perspectives as
follows:
1. The process perspectives
2. The cultural perspective
3. HR planning perspective
4. The competitive perspective
5. Developmental perspective
6. Change management perspective
Harvard Business Review mentioned that Talent Management is
simply a matter of anticipating the need for human capital and
then setting out a plan to meet it. Tanton (2007) explains effective
talent management is essential to achieve organizational
excellence and is a driving force for business success. Talent
management recognizes that different people make different
contributions to the enterprise and that top talent is the key
competitive differentiation (Forman, 2005).
Garvin David (2001) has mentioned that the future success of any
organizations relies on the ability to manage a diverse body of
talent that can bring innovative ideas, perspectives and views to
their work. Author has opined that, the challenge and problems
faced of workplace diversity can be turned into a strategic
organizational asset if an organization is able to capitalize on this
melting pot of diverse talents. Author has further stated that, with
the mixture of talents of diverse cultural backgrounds, genders,
ages and lifestyles, an organization can respond to business
opportunities more rapidly and creativity, especially in the global
arena, which must be one of the important organizational goals to
be attained.
According to Morton (2005) “Talent management is integral to
engaging employees in the organization”. Fegley, 2006 stated that
competition and the lack of availability of highly talented and
skilled employees make finding and retaining talented
employees’ major priorities for organizations.
Talent management is a multi-faceted concept that has been
championed by HR practitioners, fueled by the war for talent and
built on the foundations of strategic HRM (Julia Christensen,
2008). She defined Talent management as both a philosophy and
a practice. CIPD (2009) defines Talent Management as ‘the
systematic attraction, identification, development, engagement/
retention and deployment of those individuals with high potential
who are of particular value to an organization’. Boston Consulting
Group’s (2007) report identified talent management as one of five
critical challenges for HR in the European context.
Various researches indicate talent management as a key driver for
this strategy, and is on the agenda for HR executives in 2007 and
beyond (HR Focus, 2006, Focus, 2007). According to SHRM's
(2006) Talent Management Survey Report, 53% of organizations
have specific talent management initiatives in place. Of these
companies, 76% consider talent management a top priority.
Leo Webster (2008) has expressed that talent management has
become high priority for many companies in their human
resources organizations under pressure of cut costs even after
increasing productivity. Talent management is therefore being
positioned as the latest weapon in the human resource arsenal in
the ongoing struggle to elevate the practice of human resource
management to one of strategic importance (Hughes 2008). As
stated by Fernandez, Groysberg & Nohria (2011), in the war of
Talent, the most effective weapon is the careful management of
the candidate for the jobs.
Various researchers have studied the theme moving around
talent management. Jacob Walner (2000) has stated that trusting
talent to succeed means showing the talented people that you
have confidence in their capabilities by giving them responsibility
in the most important activities. Author has opined that, talented
people find this to be motivating, and it in increases their feelings
that they are valued, a crucial factor in their desire to stay with the
organization.
Richard S Wellins, Audrey B Smith and Scott Erker (2010) have
highlighted that organizations remain well aware of the
requirement of best talent to succeed in hyper-competitive and
26
A comparative study of Talent Management Practices implemented by Information Technology Companies & Automobile Companies in Pune
OJAS - Volume 3, No. 1, January-July 2014

increasing complex global economy. Quinn J.B. (2000) has opined
that talented individuals in the organizations are naturally
motivated to seek career advancement, opportunity to
contribute, learning and sharing opportunities, and independent
work assignments. Rani and Joshi (2012) address how
recruitment and selection, a traditional function of HRM, need to
be managed in an organizational context that has the focus on
talent management.
James B Quinn, Philip Anderson and Sydney Finkelstein have
expressed, in their article that, most organizations aimed to
enhance returns from investments in physical assets-property,
plant and equipment. While discussing on the significance of
talent management, authors have stated that, Command and
control structures made sense when management’s primary task
was to leverage such physical assets.
Leigh (2004), mentioned work performance is a product of ability
and motivation, which can be enhanced through talent
management.
For successful talent management system, Novona Duglas (2005),
has suggested five points implementing plan. These points are- a)
Discover what you are talking about. b) Describe what is all means
is transparent c) Discuss career aspirations with employees d)
Determine who belongs where e) Differentiated development. He
has mentioned that, this plan will ensure that people get exactly
the kind of growth which they want and they must be prepared for
future technological changes and competition.
Martin & Schmidt (2011), mentioned 6 common mistakes while
managing the talent like assuming that high potential are highly
engaged, equating current high performance with future
potential which is a big No, delegating down the management of
top talent, shielding rising stars from early derailment, expecting
star employees to share the pain and finally failing to link your
stars to your corporate strategy. Due to these mistakes top talent
gets disengaged & their disengagement & derailment can lead to
depleted leadership ranks which damages employee
commitment & retention across the firm.
Significance of the study
The Indian economy has been witnessing a growing contribution
of the service sector to the gross domestic product (GDP).
Services now contribute more than sixty percent to the GDP. Due
to its very nature the service sector is highly dependent on the
value of its human resources. The employee costs constitute
around 40 to 70 percent of the total turnover of business in this
sector. This study aims to understand talent management
practices implemented by the organizations, Effective talent
management practices enable companies to gain competitive
advantage by helping themselves to establish standard practices
for improving the effectiveness of HR function and in turn, that of
the organization.
Objectives
In the view of above background, following are the objectives
behind this study.
1. To understand the various Talent Management practices
implemented by the organizations & its correlation with
performance.
2. To understand whether Rewards & Recognition policies helps
to retain the Talent.
3. To study the differences in the responses of automobile
industry and IT service sector employees with regard to talent
management.
Research Methodology
The study was exploratory in nature and aimed at understanding
the perceptions of employees, regarding employee relations
practices & its impact on overall performance of the organization.
The directors & VP - HR of 10 companies from Automobile & IT
sector, were contacted through a formal letter of request seeking
permission for the research. After satisfying themselves about the
academic nature of the study, 6 organizations (3 IT & 3
Automobile) granted permission. In the 1st phase of the study, the
structured questionnaire was mailed to 350 employees, with
follow up letters to non-respondents, two weeks later.
Questionnaires were received from 280 employees, with a
27
A comparative study of Talent Management Practices implemented by Information Technology Companies & Automobile Companies in Pune
OJAS - Volume 3, No. 1, January-July 2014

response rate of 80%. The sample comprised 62% males & 38%
females. In the 2nd phase of the study, the researcher used in
depth interviewing technique as an efficient and qualitative
approach to understand the efforts taken by them for
implementing employee relations practices in their organizations
& its overall impact on organizational performance. All HR heads
of the above 6 companies were interviewed. These interviews
lasted for an average of 65 minutes. The profile of the
respondents shows that their average duration of working as a
human resource manager is 7.5 years.
Hypothesis of the study
1. There is a positive correlation between Talent Management
& the organizational performance.
2. Rewards & Recognition policies are highly correlated with
talent retention.
3. There is a significant difference in the responses of
employees of Automobile Sector and employees of IT sector
with regard to perception of Talent Management practices.
Table I: Demographic Profile of Respondents
Demographic Variables Categories Respondents
Number Percentage
Gender Male 174 62
Female 106 38
Age 20-25 65 23
25-35 80 29
35-45 75 27
45 & above 60 21
Education Graduate 162 58
Post Graduate 118 42
Total Experience Less than a year 70 25
1- 5 years 85 30
5-10 years 60 32
Above 10 years 65 28
Research Instrument
A structure questionnaire was designed comprising of 25
questions. Quantitative analysis was conducted with factor
analysis. The measures used a seven point Likert scale response
format. (Ranging from1- strongly disagree to 7- strongly agree).
Content validity was checked by discussing with experts, Industry
resources. Reliability (Internal consistency of the scale) was tested
by computing Cronbach Alpha. The items along with their factor
loadings and Cronbach’s alpha values are reported in Table II.
Alpha values found to be higher in each & every dimension.
Results and Discussions
A principal component analysis with subsequent rotation
(varimax) was conducted on 7 items related to Talent
Management. All communalities (i.e., proportion of variance
explained by the common factors) varied from 0.925 to 0.785.
28
A comparative study of Talent Management Practices implemented by Information Technology Companies & Automobile Companies in Pune
OJAS - Volume 3, No. 1, January-July 2014

Correlation Analysis
The results of the opinion of the employees towards talent
management & organizational performance are given in table IV.
For all the variables, the employees have agreed strongly. The
employees strongly feel that talent management practices help in
retaining employees & overall performance of the organization.
On the basis of the correlation analysis between talent
management & business performance, it was found that these
factors were positively & significantly correlated with the other
(See Table IV).
Reliability Values Scale
Sr. No Factors related to Talent Management No. of questions !lpha values á
1. Manpower Planning & Talent Acquisition 4 .785
2. Compensation & Benefits 4 .769
3. Career development 5 .910
4. Appreciation & Recognition 4 .925
5. Retention Strategies 4 .904
6. Organizational Performance 4 .828
Table II: Factor wise reliability statistics
Table III: Inter Correlation amongst Talent Management & Organizational Performance
Talent Management Organizational
Performance
Talent Management Pearson Correlation Sig.
(2-tailed) N
1.00 786**
Organizational
Performance
Pearson Correlation Sig.
(2-tailed) N
786** 1.00
The Pearson’s correlation coefficient for talent management and
organizational performance level is 0.786.These values show that
the correlation is significant at 0.01 levels (2 tailed)
Evidence shows that all the organizations were fully applying
talent practices for the organizational effectiveness. This shows
that organizations have realized the importance of talent
management on the effective and efficient performance of their
employees and in turn for the organization. All the respondents
from the organizations surveyed agree that talent management
implementation positively influence performance of their
organization. After implementation of talent management
practices effectively, retention level of employees has increased,
which helped to save the cost. Hence, financial performance has
also improved.
Thus we accept the 1st hypothesis, Talent Management practices
have significant impact on the organizational performance.
**Correlation is significant at the level 0.01 level (2-tailed)
29
A comparative study of Talent Management Practices implemented by Information Technology Companies & Automobile Companies in Pune
OJAS - Volume 3, No. 1, January-July 2014

Reward &
Recognition
Talent Retention
Talent Management Pearson Correlation
Sig. (2-tailed) N
1.00 816**
Organizational
Performance
Pearson Correlation
Sig. (2-tailed) N
816** 1.00
The Pearson’s correlation coefficient for reward& recognition and
talent retention is 0.816.These values show that the correlation is
significant at 0.01 levels (2 tailed)
All the respondents from the organizations surveyed strongly
agreed that reward & recognition policies adopted by their
organization are effectively implemented. This has helped to
retain the talent. Employee turnover rate has reduced after
revamping the reward & recognition policies.
Thus we accept the 2nd hypothesis, Rewards & Recognition
policies are highly correlated with talent retention.
Table IV: Inter Correlation amongst Rewards & Recognition and Talent Retention
An independent group Mann-Whitney U Test was conducted to
evaluate the hypothesis that significant differences existed
between the responses of two sectors. Table VI displays Mann-
Whitney U value and the significance level. For all the variables
the significance value is more than .05 (i.e. 5% significance level).
Thus the result shows that there is no significant difference in
responses of the IT Sector and Automobile Sector employees in
understanding the importance of talent management. Thus
hypothesis 3 is rejected. Employees’ perception towards talent
management practices is similar throughout the sectors.
Output of the in depth interviews
As mentioned, in 2nd phase of study, in depth interviews of HR
heads were conducted, which focused on understanding talent
management practices implemented by the organizations. Most
of the organizations have followed more or less same practices,
focusing on right acquisition of talent, conducting employee
surveys, overall growth & development of employees. Some
organizations have exclusive practices, which turned to be
differential factor. Below are these practices-
Table V: Mann-Whitney U-Test
Variables Industry N Mann-Whitney (U)
Manpower Planning & Talent Acquisition IT 145 0.662
Automobile 135
Compensation & Benefits IT 145 0.638
Automobile 135
Career development IT 145 0.561
Automobile 135
Appreciation & Recognition IT 145 0.699
Automobile 135
Retention Strategies IT 145 0.586
Automobile 135
Improved organizational performance IT 145 0.687
Automobile 135
30
A comparative study of Talent Management Practices implemented by Information Technology Companies & Automobile Companies in Pune
OJAS - Volume 3, No. 1, January-July 2014
1. Employee Management Connectivity programs
a. ‘Reach Program’ to understand inclusive culture,
b. ‘Connect program’ to get connected with company
employees
c. ‘Let’s talk’, a 24*7 help line to resolve the issues.
2. Work life balance strategies- Apart from regular practices
like, Flexi time, Work from home; some organizations have
taken help from NGO’s. These NGO’s representatives work for
parents of onsite employees & visit them on quarterly basis.
3. Career development strategies- ., Internal training centers
catering the needs of various divisions named as “Gurukuls”,
horizontal as well vertical growth in career ladder, job
rotation, free seminars, workshops, sponsored higher
education, people tool kit program.
4. Apart from these, Appreciation & Recognition - Recognition
in the form of cash award, on the spot awards, VCA,
worldwide profit is shared with the employees etc. are given
to employees to motivate them. All companies have strong
CSR activities. Employees get involve in these activities to
serve for the betterment of the Society, which gives them joy
as well as satisfaction.
This study suggested that all organizations need to boost up the
implementation of talent management practices. Study
suggested relations between employees & management should
be harnessed through appreciating & recognizing potential of
employees, by providing learning & development opportunities
and investing in career development.
This finding showed that through proper implementation of
talent management, organizational performance has improved.
This was captured through assessing Annual Reports of all the
companies participated in the survey. Assessment showed
upward trends in their business as well as profits. Same thing was
also emphasized by the HR heads of all the organizations.
Conclusion
Thus, this study revealed that talent management has become
crucial for the survival & sustainability in the market. Study
suggested that most of the talent management practices followed
across the organizations irrespective of their sectors are more or
less same. So employees from both the sectors did not find any
difference between the policies. As one of the strategy of talent
retention, all the organizations are paying attention to career
development of the employees & provide them enough
opportunities for growth. Organizations which would view it as a
strategic human resource practice would definitely find higher
levels of success and sustain for the future. It is equally of value
that firms should train and retrain their work force to develop
needed talent in the staff. Care must be taken of providing growth
opportunities. As mentioned by Fernandez Claudio (HBR 2014),
pushing high potentials up a straight ladder won’t accelerate their
growth- uncomfortable assignments will. Thus appropriate
opportunities created for development of employees play
enormous role in overall performance of the organization.
Recommendations
Given the research findings, effective implementation of talent
management practices are essential for organizational success.
Therefore, it is important for human resource practitioners to
align their strategies with the business strategy and to take a
strategic approach to meeting these imperatives. Resources such
as sound talent management policies are needed for retaining
talent & better performance of the organization. The correlation
between profitability and talent management cannot be
overstated. It is therefore recommended that:
• Firms should separate between their talent management
scheme and the total human recourses management style of
the firm.
• Talent management should be treated as a result oriented
and not another human resources management style
without result in focus.
• The focus of talent management should be on overall
development of the employee, which further help in
retention of the talent.
Future Scope for Study
Most of the organizations, today, focus on competencies in hiring
and developing talent. But as business is too unpredictable, it is
31
A comparative study of Talent Management Practices implemented by Information Technology Companies & Automobile Companies in Pune
OJAS - Volume 3, No. 1, January-July 2014

necessary to get the right talent. Organizations should focus more
on potential, adaptability of the employee. Most of the current
researches are focusing on competencies of employees as an
essential requirement of talent management, but hardly few of
them have discussed about importance of potential of
employees, their adaptability to change etc. Thus, there is need of
undertaking research in this area. This would help HR department
to come up with assessment parameters for prospective
employees which would ultimately result in retention of
employees.
References
1. Ashton, C., and Morton, L. (2005), “Managing talent for
competitive advantage”, Strategic HR Review, 4(5), 28- 31
2. ASTD Report (2013), “Talent Management Practices &
Opportunities”
3. Bernthal Paul and Wellins Richard, (2001), “Retaining talent-
A benchmarking study”, Development Dimension
International (DDI), HR Benchmark Group, 3(2)
4. Bhatnagar, J. (2004) “New dimensions of strategic HRM: HRIS
managed talent management and application of HR Six
Sigma.in R. Padaki, N.M Agrawal, Balaji, C., Mahapatra, G.
(Eds), Emerging Asia: An HR Agenda, Tata McGraw-Hill.
5. Bhatnagar Jyotsna, (2007) "Talent management strategy of
employee engagement in Indian ITES employees: key to
retention", Employee Relations, 29(6), 640 – 663.
6. Cappelli, P. (2008) "Talent Management for the Twenty-First
Century." Harvard Business Review, 74-81.
7. Cheloha, R., & Swain, J. (2005).Talent management system
key to effective succession planning. Canadian HR Reporter,
18(17)
8. Collings D.G and Mellahi K(2009), “Strategic talent
management: A review and research agenda”, Human
Resource Management Review, 19(9),.304–313
9. Fegley, S. (2006, January). 2006 Talent management survey
report. Alexandria, VA: Society for Human Resource
Management
10. Fernandez Claudio (2014), “ 21st Century Talent spotting”,
Harvard Business Review, June 2014
11. Fernandez, Groysberg, Nohria (2011), “How to hang on to
your high Potentials”, Harvard Business Review, Oct 2011.
12. Frank, F.D., Finnegan, R.P. and Taylor, C.R. (2004) “The Race
for Talent: Retaining and engaging workers in the 21st
century”, Human Resource Planning, 27(3), 12-25
13. Garvin D. (2001),The strategic asset of workplace diversity,
Harvard Business Review, 37,
14. Goffee, R. & Jones, G. 2007. ‘Leading clever people’, Harvard
Business Review, 85(3),72-79
15. Hagargi Anil Kumar (2012) “Talent Retention In Indian Bpo
Sector: A Challenge”, Abhinav Journal of research in
commerce & management, 1(6),71-79
16. Heinen, J. S. and O'Neill, C. (2004). “Managing talent to
maximize performance”. Employment Relations Today,
31,67- 82
17. Ian Cunningham, (2007),"Talent management: making it
real", Development and Learning in Organizations, 21(2) 4 - 6
18. Iles, P.A. (2007) “Employee resourcing and talent
management in HRM: A critical text”, (eds) J. Storey, 133–64.
Oxford: Blackwell, London: ITP.
19. Julia Christensen Hughes, Evelina Rog, (2008), "Talent
management: A strategy for improving employee
recruitment, retention and engagement within hospitality
organizations", International Journal of Contemporary
Hospitality Management, 20(7) 743 - 757
20. Kontoghiorghes Constantine & Kalomyra Frangou (2009),
“The Association Between Talent Retention, Antecedent
Factors, and Consequent Organizational Performance”, SAM
Advanced Management Journal - Winter 2009, 29-38
21. Lewis, R.E. and Heckman, R.J. (2006), “Talent Management: A
critical review”, Human Resource Management Review,
16,139-154.
22. Martin Jean & Schmidt (2010), “How to keep your top talent”,
Harvard Business Review, May 2010, 38-45
23. Michaels, E., Handfield-Jones, H. and Axelrod, B. (2001),”The
War for Talent”, Boston, Harvard Business School Press
24. Meisinger, S. 2006. ‘Talent management in a knowledge-
based economy’, HR Magazine,51(5): 10
25. Morton, L. (2005). Talent management value imperatives:
Strategies for execution, New York: The Conference Board,
Research Report
32
A comparative study of Talent Management Practices implemented by Information Technology Companies & Automobile Companies in Pune
OJAS - Volume 3, No. 1, January-July 2014

26. Novona, D, (2005), Confirmation of a successful talent
management. Harvard Business Review
27. Oakes, K. 2006. ‘The emergence of talent management’,
Training and Development, 60(4), 21–24
28. Quinn, J., Anderson, P. & Finkelstein, S. (2000, Apr).
“Managing professional intellect: Making the most of the
best”. Harvard Business Review, 72-80.
29. Quinn, J. (2000). Strategy for talent retention. Journal of
Industrial Relations, 3(7),
30. Srinivasan M.S. (2011), “An Integral approach to talent
Management”, Vilakshan, XIMB Journal of Management,
September 2011, 81-90
31. Tansley Carole, (2011),"What do we mean by the term
"talent" in talent management?", Industrial and Commercial
Training, 43(5) 266 - 274
32. Walner, J. (2000). Trust employees' talent to succeed.
Business and Management Review, Oxford.
33
A comparative study of Talent Management Practices implemented by Information Technology Companies & Automobile Companies in Pune
OJAS - Volume 3, No. 1, January-July 2014

Teachers and Computer Technology: Principal Views Dr. Neetu Sharma*
Abstract
This study aims to display the views of the primary school supervisors who apply supervision and guidance activities in computer technology class. The study was conducted in Mersin, Turkey, with 69 primary school supervisors. Data collection tool developed by the researchers as a form consisting of open-ended questions. The obtained data were analyzed with descriptive analysis method. According to the findings, computer-aided education is beneficial especially in in science and technology lessons, social studies and life science courses. The presentations and projection images are reflected and thus computer technology is beneficial for teachers. The results indicate that teachers need in-service training on computer-aided education.
Keywords: Education supervisor, computer technology, classroom teachers, elementary education, instructional technology
*Asst. Prof. Commerce and Management, Department of Commerce, Career College, Barkatullah University Bhopal (M.P.) Email: [email protected]
Introduction
It is an accepted fact that technology has great influence on the
field of education as well as in all other social sciences. To access
information and skills requires that one should be following the
technological developments to use it effectively to educate
individuals. This has been the main function of schools today and
teachers are suppsed to use technology in schools. It is essential
to trace and use developments in computer technology and
teachers are required to have a course if required. They see
concrete action, especially with children at primary education.
The classroom teachers are expected to create learning
environments that will attract the interest of students in lessons.
Technology crucially effects education like all others in their field.
Raising individuals endowed with reaching and utilizing the
information abilities, following the technological developments
closely and using that information effectively are basic functions
of the schools. Many important missions about enabling the
technology in schools fall to teachers. Teachers should benefit
from technological improvements, especially from the computer
technology during the lesson. Because, “The most important
component and sharer of the schools are teachers. Teachers’
being open to changes and adaptable to innovations, modern and
up-to-date is highly important since those are the most important
indicators of the training quality in schools” (Adiguzel, 2009: 90).
“What has been revealed after many scientific researches is that
computers about which many big projects and studies have been
carried out to popularize because of its importance in education
contributes to teaching-learning process with the preparation of
effective educational software. Although there have been
qualitative and quantitative discussions and criticism about
necessary teacher training and studies about popularizing
computers in educational environment, computerization process’
taking its place in the educational environment has been in a quick
progress” (Tor and Erden, 2004: 122).
Classroom teachers who carry out their duties in the first grade of
the elementary schools, in which the children in concrete
operational period have education, are expected to establish a
Teachers and Computer Technology: Principal Views
OJAS - Volume 3, No. 1, January-July 2014
learning environment that can arouse the interest of the students
during the lesson. The most important contributor for teachers to
provide this is, no doubt, the computer technology. Because,
thanks to this technology, a large number of course materials
become easily accessible.
In the field of “Benefiting from information technologies for
career development and communication”, it has been stated that
Ministry of National Education Teacher Training Directorate (MEB
OYEMG: 160) expect classroom teachers to “use search engines,
web sites and portals, databases so as to reach and share the
information”.
It has been confirmed that computer-assisted training has a
positive impact upon students’ academic success (Yalcinalp,
Geban and Ozkan, 1995; Mioduser, Nachmias, Tubin, Forkosh-
Baruch, 2002; Cekbas, Yakar, Yildirim, Savran, 2003; Passey,
Rogers, Machell, Mchugh, 2004). In addition, it was precipitated
that computer-assisted training influences students’ attitudes
towards the course positively (Yenice, N., 2003). Moreover, it has
been noticed that this also contributes to the development of
high-order thinking level (Renshaw and Taylor, 2000; Akbasli,
2000). However, it is clear that teachers cannot adequately
benefit from the computer technology for some reasons. On the
other hand, complying with the technology has become an
obligation for teachers.
All elementary school teachers’ having overall effectiveness
related to the teaching-learning process is important in terms of
running renewed elementary program that fits to its purpose
(Adiguzel, 2009:94). For this reason, it is necessary to provide
teachers that can use these technologies, encourage and orient
them. Teachers, directors of schools, and supervisors, who are the
partners of the environment, are in the key positions for fulfilling
the possible benefits of technology in higher level (Seferoglu,
2009:404). Education supervisors are required to inspect, observe
and guide to teachers in this respect, because “providing, using
and protecting course materials, establishing school and
classroom libraries, and enabling students to use them effectively
are among the inspection and counseling tasks of the supervisors”
(Tebligler Dergisi, 2005).
Aim of the study:
This study aims to reveal inspector’s views and recommendations
related to classroom teachers’ benefiting level from the computer
technology during the lessons. The supervisors and teachers meet
during the inspection and guidance services. The sub-problems
are set out below:
According to the views of the supervisors:
• What is the state of benefiting of classroom teachers from CT
(Computer Technology) in the lessons?
• In which lessons do the classroom teachers benefit from the
CT?
• What are the reasons of classroom teachers for benefiting
from the CT?
• What are the reasons of classroom teachers for not
adequately benefiting from CT?
• What are the recommendations of the education
supervisors?
Method
The research is a case study designed in survey type. Research
data were gathered with an open-ended question form. The
question form was developed by the researchers. For the
reliability, a pre-study was carried out with seven education
supervisors working in Balikesir and Kutahya provinces. The data
were analyzed with the content analysis method. The data
obtained were tabulated for a clear understanding. Percentage
and frequency distributions were shown in tables. The survey was
carried out in Mersin. 80 education supervisors working in Mersin
Provincial Directorate for National Education during 2010-2011
academic year participated in the research. This question form
was sent to all supervisors and the survey was carried out with 69
education supervisors who unassumingly answered the question
form. The participants’ personal qualities were shown in Table 1
set out below.
35

Table 1: information on the Study Group
Variables F %
Gender Male 65 94
Female 4 6
1-10 year 4 6
11-15 year 4 6
16-20 year 28 7
21-25 year 10 14
26-30 year 5 7
31-35 year 10 14
Graduation Gazi Un 27 39
Hacettepe Un 21 30
100. Year Un. 2 3
Inonu Un. 8 12
Anadolu Un 4 6
ÇOMU 2 3
Balýkesir Un 1 1
Istanbul Un 2 3
9 Eylül Un. 2 3
Findings
1. The state of benefiting of classroom teachers from CT
(Computer Technology) in the lessons is in Table 2.
proportion between seniority and utilizing from CT in lessons
(n=15). Ones who think classroom teachers adequately benefit
from CT in lessons are a few (n=9).
2- The lessons in which teachers benefit from the CT are given in
Table 3.
Line State f %
1
Teachers adequately benefit from
CT. 30 43
2
As seniority increases, rate of
utilization decreases. 15 22
3 They benefit in medium level. 10 14
4
Teachers don’t adequately benefit
from CT. 9 13
5
As school’s physical property
increases, the number of users
increases. 2 3
Line Lessons f %
1 Science and Technology 50 72
2 Social Studies 33 48
3 Science of Life 28 41
4 Turkish 14 20
5 Mathematics 14 20
6 First Reading and Writing 10 14
7 Foreign Language 6 9
8 In Whole Lessons 4 6
9 Music 4 6
10 In No lessons 2 3
Table 2: Classroom teachers’ state of benefiting from CT in lessons
When Table 2 has been analyzed, classroom teachers’ not
adequately benefiting from CT in lessons has become the most
frequently (n=30) voiced view of education supervisors. Another
remarkable point is the views of supervisors about inverse
Table 3: Lessons that Classroom Teachers Benefit from CT in
When Table 3 has been analyzed, education supervisors indicate
that classroom teachers mostly (n=50) benefit from CT in science
and technology lesson. Subsequent to it, it has been used in social
sciences (n=33) and science of life (n=28). Use of CT in Turkish
(n=14) and Mathematics (n=14) lessons are also mentioned by
some education supervisors. A few education supervisors
mention that classroom teachers do not use CT in any lessons
(n=2).
3- The reasons of classroom teachers for benefiting from the CT
are given in Table 4.
Table 4: Reasons for Teachers’ Benefiting from CT
Line Reasons for utilizing CT F %
1 For projecting onto the wall 24 35
2 For giving the lessons with prepared education CDs.
20 29
3 For prepared presentations. 10 14
4 For downloading presentations from the Internet.
8 12
5 For assessment and evaluation. 8 12
6 For presenting pictures and figures.
8 12
36
Teachers and Computer Technology: Principal Views
OJAS - Volume 3, No. 1, January-July 2014
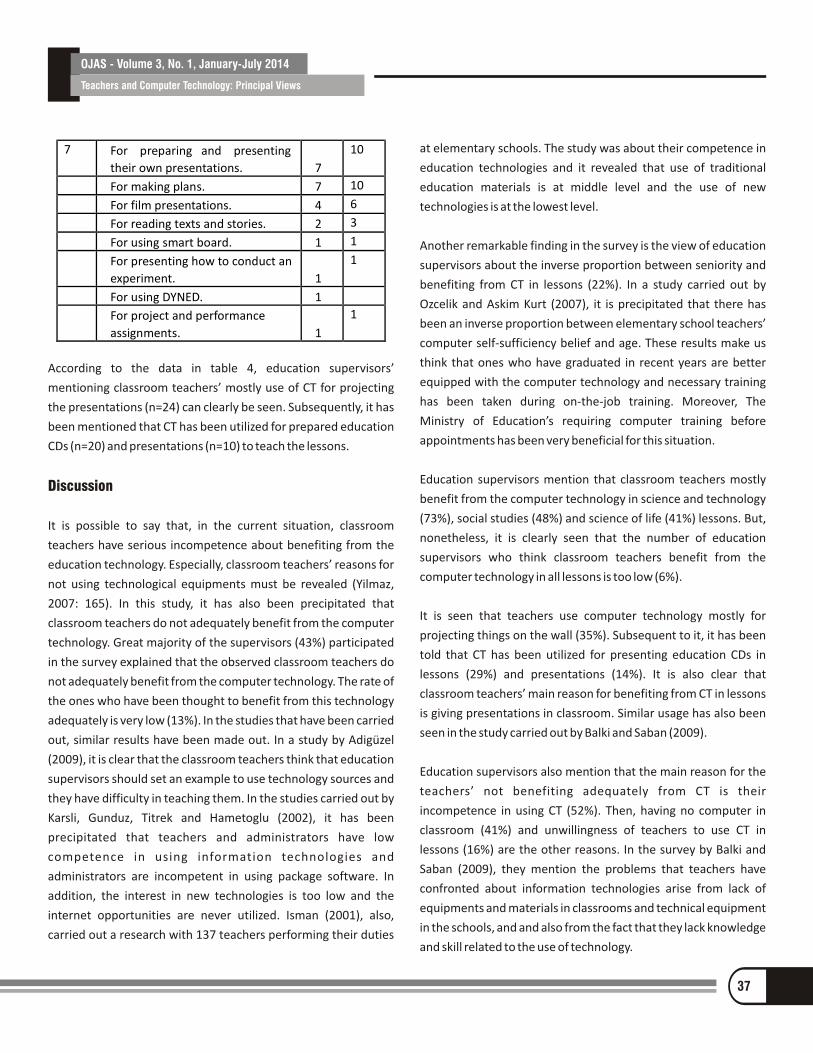
According to the data in table 4, education supervisors’
mentioning classroom teachers’ mostly use of CT for projecting
the presentations (n=24) can clearly be seen. Subsequently, it has
been mentioned that CT has been utilized for prepared education
CDs (n=20) and presentations (n=10) to teach the lessons.
Discussion
It is possible to say that, in the current situation, classroom
teachers have serious incompetence about benefiting from the
education technology. Especially, classroom teachers’ reasons for
not using technological equipments must be revealed (Yilmaz,
2007: 165). In this study, it has also been precipitated that
classroom teachers do not adequately benefit from the computer
technology. Great majority of the supervisors (43%) participated
in the survey explained that the observed classroom teachers do
not adequately benefit from the computer technology. The rate of
the ones who have been thought to benefit from this technology
adequately is very low (13%). In the studies that have been carried
out, similar results have been made out. In a study by Adigüzel
(2009), it is clear that the classroom teachers think that education
supervisors should set an example to use technology sources and
they have difficulty in teaching them. In the studies carried out by
Karsli, Gunduz, Titrek and Hametoglu (2002), it has been
precipitated that teachers and administrators have low
competence in using information technologies and
administrators are incompetent in using package software. In
addition, the interest in new technologies is too low and the
internet opportunities are never utilized. Isman (2001), also,
carried out a research with 137 teachers performing their duties
at elementary schools. The study was about their competence in
education technologies and it revealed that use of traditional
education materials is at middle level and the use of new
technologies is at the lowest level.
Another remarkable finding in the survey is the view of education
supervisors about the inverse proportion between seniority and
benefiting from CT in lessons (22%). In a study carried out by
Ozcelik and Askim Kurt (2007), it is precipitated that there has
been an inverse proportion between elementary school teachers’
computer self-sufficiency belief and age. These results make us
think that ones who have graduated in recent years are better
equipped with the computer technology and necessary training
has been taken during on-the-job training. Moreover, The
Ministry of Education’s requiring computer training before
appointments has been very beneficial for this situation.
Education supervisors mention that classroom teachers mostly
benefit from the computer technology in science and technology
(73%), social studies (48%) and science of life (41%) lessons. But,
nonetheless, it is clearly seen that the number of education
supervisors who think classroom teachers benefit from the
computer technology in all lessons is too low (6%).
It is seen that teachers use computer technology mostly for
projecting things on the wall (35%). Subsequent to it, it has been
told that CT has been utilized for presenting education CDs in
lessons (29%) and presentations (14%). It is also clear that
classroom teachers’ main reason for benefiting from CT in lessons
is giving presentations in classroom. Similar usage has also been
seen in the study carried out by Balki and Saban (2009).
Education supervisors also mention that the main reason for the
teachers’ not benefiting adequately from CT is their
incompetence in using CT (52%). Then, having no computer in
classroom (41%) and unwillingness of teachers to use CT in
lessons (16%) are the other reasons. In the survey by Balki and
Saban (2009), they mention the problems that teachers have
confronted about information technologies arise from lack of
equipments and materials in classrooms and technical equipment
in the schools, and and also from the fact that they lack knowledge
and skill related to the use of technology.
7 For preparing and presenting
their own presentations. 7
10
For making plans. 7 10
For film presentations. 4 6
For reading texts and stories. 2 3
For using smart board. 1 1
For presenting how to conduct an
experiment. 1
1
For using DYNED. 1
For project and performance
assignments. 1
1
37
Teachers and Computer Technology: Principal Views
OJAS - Volume 3, No. 1, January-July 2014

It is hard to say that there have been facilities in classrooms by
which they can benefit from the computer technology. However,
Ministry of Education have begun studies about providing
Internet and computer to all classrooms. Especially by the help of
FATIH Project (Movement of Enhancing Opportunities and
Improving Technology), prepared in 2010, they aim to provide all
the classrooms with computer technology. In this context,
computers, smart boards and Internet have been provided to all
classrooms. With the FATIH project, all the classrooms having the
computer technology will enhance the opportunities of
classrooms in terms of education.
Education supervisors recommend that classroom teachers
should take on-the-job training (13%). Teachers should
adequately benefit from this technology in lessons (7%) and
computers (6%) and projections (6%) should be provided to
classrooms.
Conclusion
The data clearly indicate that there is a problem about computer
use in the classrooms. There can be many reasons for it. However,
the results obtained in this study imply that, according to the
education supervisors, classroom teachers are generally
insufficient about benefiting from CT in lessons. For this reason, it
has been recommended that first of all basic but obligatory
training should be given to the teachers. Secondly, CT should be
utilized in as many lessons as possible and classrooms should be
provided with adequate support for CT use. In addition, sufficient
training should be provided in instructional technology, material
design and computer lessons during classroom teachers’ on-the-
job training.
References
• Adi güzel, A. (2009). Si ni f Ogretmenlerinin Ogrenme
Etkinliklerini Düzenleme ve Gerçeklestirme Çabalari nda
Zorlanma Düzeyleri. Yüzüncü Yil Üniversitesi, Egitim Fakültesi
Dergisi. 4(2), 89-110.
• Akbasli, S. (2010).The views of elementary supervisors on
teachers’ competencies.Egitim Arastirmalari-Eurasian
Journal of Educational Research, 39, 13-36.
• Balki , E. ve Saban, A., (2009). Ogretmenlerin Bilisim
Teknolojilerine Iliskin Algilari ve Uygulamalari: Ozel Esentepe
Ilkogretim Okulu Ornegi. Ilkogretim Online. 8(3), 771-781.
• Çekbas, Y., Yakar, H., Yildirim,B., Savran, A. (2003). Bilgisayar
Destekli Egitimin Ogrenciler Üzerine Etkisi. The Turkish Online
Journal of Educational Technology. 2(4), 76-78.
• Isman, A. (2002). Sakarya Ogretmenlerin Egitim Teknolojileri
Yonünden Yeterlilikleri. The Turkish Online Journal of
Educational Technology 1(1), 91-72
• Karsli, M. D., Gündüz, H. B., Titrek, O., Hametoglu, M. A.,
(2002). Egitim Yoneticileri Ve Ogretmenlerin Bilisim
Teknolojileri Kullanma Düzeyleri Ve Bilisim Teknolojilerinden
• Yararlanmalarini Engelleyen Nedenler. Sakarya Üniversitesi
Egitim Fakültesi Dergisi, 4, 176-188.
• MEB OYEGM. (2008). Ogretmen Yeterlikleri Ogretmenlik
Meslegi Genel ve Ozel Yeterlik Alanlari. Ankara: Devlet
Kitaplari Müdürlügü. (Elektronik). (22.11.2010).
• Mioduser, D, Nachmias, R.,Tubin, D., Forkosh-Baruch, A.,
(2002). Models of pedagogical implementation of ICT in
Israeli schools. Journal of ComputerAssisted Learning. 18(4),
405-414.
• Ozçelik ve Askim Kurt. (2007). Ilkogretim Ogretmenlerinin
Bilgisayar Ozyeterlikleri: Balikesir Ili Ornegi. Ilkogretim
Online. 6(3), 441-451.
• Passey, D.,Rogers, C., Machell J. And Mchugh G. (2004). The
motivational effect of ICT on pupils. Departmen for Education
Skills Research (Resaarch Report). University of Lencaster.
Renshaw, C. E., Taylor, H. A., (2000). The educational
effectiveness of computer-basedinstruction. Computers and
Geosciences, 26(6), 677-682.
38
Teachers and Computer Technology: Principal Views
OJAS - Volume 3, No. 1, January-July 2014

• Seferoglu, S. S., (2009). Ilkogretim okullarinda teknoloji
kullanimi ve yoneticilerin bakis açilari. Akademik Bilisim. 11-
13 Subat 2009. Sanliurfa: Harran Üniversitesi. 403-410.
• Tebligler Dergisi. (2005). Millî Egitim Bakanligi ilkogretim
müfettisleri baskanliklari rehberlik ve teftis yonergesi.
Tebligler Dergisi. Subat 2001/2521
• Tor, H. ve Erden, O. (2004).Ilkogretim ogrencilerinin bilgi
teknolojilerinden yararlanma düzeyleri üzerine bir arastirma.
The Turkish Online Journal of Educational Technology. 3(1),
120-130.
• Yalçinalp, S.,Geban, O., Ozkan, O. (1995). Effectiveness of
usingcomputer-assisted supplementary instruction for
teaching the moleconcept. Journal of Research in
ScienceTeaching. 32(10), 1083-1095.
• Yenice, N., (2003). Bilgisayar Destekli Fen Bilgisi Ogretiminin
Ogrencilerin Fen ve Bilgisayar Tutumlarina Etkisi.TheTurkish
Online Journal of Educational Technology. 2(4), 79-85.
• Yilmaz, M., (2007). Sinif Ogretmeni Yetistirmede Teknoloji
Egitimi. GÜ, Gazi Egitim Fakültesi Dergisi. 27(1), 155-167.
39
Teachers and Computer Technology: Principal Views
OJAS - Volume 3, No. 1, January-July 2014
Business/ IT Alignment as a key Contributor for IT Implementation in Delhi NCR Region: A Study Dr. Deepika S. Joshi*
Prof. Sanjive Saxena**
Abstract
The demand of today’s business world is the appropriate alignment of Business-IT and the subsequent implementation of the IT. This research paper is an attempt to study the business-IT alignment with the IT implementation. The design of the paper follows a structured approach. It start with the introduction highlighting the need for alignment of business-IT and their role in It implementation. The paper then moves onto the process of defining the meaning of business-IT alignment as used in the paper. Once the definition is scoped the paper moves onto literature review wherein prior work on the topic has been examined. The next part comes the objective of the study and the research methodology wherein the comprehensive process of research work is covered. The analysis and interpretation of follows the research methodology section where in some aspects of the study has been analyzed. The limitations and the future scope of the research comes as the natural consequence of the research paper. Appropriate references have been accounted for in this paper.
Keywords: Alignment, Application, Business units, Process, Value addition
*Asst. Prof. (IT &HR), Jaipuria Institute of Management Studies, Ghaziabad. Email: [email protected]**Associate Professor, Jagan Institute of Mgmt. Studies, Sector-5, Rohini, New Delhi. Email: [email protected]
Introduction
The business world of today is in the throes of hyper
competitiveness in a sense that it is being jostled by cumulative
affects of myriad forces each of them having potential to severely
impact the survival of business. The business units, thus, are
required to wrestle with contributory forces of recession, the
wavering and dithering demand of customers, who, it appears to
have developed an attitude of dictating terms when it comes to
placing requirements on vendors, the forces arising out of
rampant advancement of technology and its impact on customers
as well as its resultant affect on their requirements. to be fulfilled
by the business units and above all the business units are required
to meet mandatory and statutory requirements of green peace
initiatives as well as to meet the compliance to various
international standards such as ISO, CMMI and ISI .
However, despite the above forces in operation, business units,
necessarily, are required to stay competitive so as to survive in this
hyper competitive world. This invariably means that business
units are required to contemplate, identify, evaluate and adopt
business objectives which are aligned with the above so as to
meet ‘requirements’ for survival in current business world.
Information Technology or IT, is one of the technological forces
which has and is greatly impacting the business wold. The units
which have quickly and rapidly scaled and aligned their objectives
are leaders while those who fail to align are struggling to survive.
This paper, is thus, an attempt to study the alignment of business
with Information Technology as a key contributor for IT
implementation in Delhi and NCR regions.
Meaning of Business / IT Alignment
The term ‘Business-IT alignment’ means application of

Business/ IT Alignment as a key Contributor for IT Implementation in Delhi NCR Region: A Study
OJAS - Volume 3, No. 1, January-July 2014
Information technology so as to achieve business objectives.
Careful examination of above reveals the following
• It is the application of Information Technology
• This application of Information technology is necessarily
focused (or designed) to achieve objectives of business
• It is a supporting function which assists the management in
meeting the business objectives
However, the focus of study being, IT implementation in Delhi-
NCR, with inputs from IT business alignment the following is
vividly observed
• The objectives of the business
• The knowledge and working of processes required to attain
business objectives
• The success criterion which will assist the management in
determining the business - IT alignment for IT
implementation
Literature Review:
Despite of the apparent importance of aligning IT and business,
the majority of publications are rather vague in terms of how to
define or practice alignment (Maes et al. 2000). The first question
seems to be focused on dining the word ‘alignment’. Other
expressions used in he same context are ‘fit’ (Venkatraman,
1989), ‘harmony’ (Luftman et al. 1993), ‘integration’ (Weill and
Broadbent 1998), ‘linkage’ (Henderson and Venkatraman 1993),
‘bridge’ (Ciborra 1997) or ‘fusion’ (Smaczny 2001). A second
question is whether IT aligns to business or business to IT? Or
both? Wieringa et al. (2005) define Business IT Alignment (BIA) as
‘the problem of matching IT services with the requirements of the
business’, identifying business as leading. This logical, but also
traditional, approach is opposed by Poels (2006) who states that
Business IT Alignment (BIA) implies a ‘mutual influence’ between
business and IT. Another question is whether Business IT
Alignment (BIA) is a ‘state’ or level that can be achieved or a
‘process’ to get to a certain (higher) state. The concept of Business
IT Alignment (BIA) as a ‘state’ is further developed by Luftman
(2000), who assesses the BIA maturity level of organizations. Also
Reich and Benbasat (1996) ‘measure’ a degree or level of BIA. The
process approach to BIA can be found in the methodologies of IT
planning developed in the ‘70s and ‘80s (IBM Corporation 1981,
Martin 1982). Also Weill and Broadbent (1998) support the
process view when they state ‘Alignment is a journey, not an
event ’. Chan (2002) d ist inguishes two preva i l ing
conceptualizations of the alignment problem. The first one
focuses on planning and objectives integration and views
alignment as the degree to which the business mission, objectives
and plans are supported by the ICT mission, objectives and plans.
This view can be found with Reich and Benbasat (1996), Kearns
and Lederer (2004) and Hirschheim and Sabherwal (2001). A more
holistic conceptualization of BIA can be found with Henderson
and Venkatraman (1993). Their widespread framework of
alignment, known as the Strategic Alignment Model, describes
BIA along two dimensions (Figure 1). The dimension of strategic fit
differentiates between external focus, directed towards the
business environment, and internal focus, directed towards
administrative structures. The other dimension of functional
integration separates business and IT. Altogether, the model
defines four domains that have been harmonized in order to
achieve alignment. Each of these domains has its constituent
components: scope, competencies, governance, infrastructure,
processes and skills. Henderson and Venkatraman pay extensive
attention to the different approaches of achieving this alignment.
In the model this can be visualized by starting the process of
alignment from any one of the four domains. Maes et al. (2000)
refine the Strategic Alignment Model by identifying three, instead
of two, columns: business, information/communication and
technology column, and three, instead of two, rows: strategy,
structure and operations.
The importance of Business/IT Alignment has been eminent and
well accepted since the late 1970's (e.g., McLean & Soden, 1977;
IBM, 1981; Mills, 1986; Parker &Benson, 1988; Brancheau &
Whetherbe 1987; Dixon & Little, 1989; Niedermanet al., 1991;
Chan & Huff, 1993; Henderson, J., & Venkatraman, N.
1996;Luftman & Brier, 1999). Over the years, it persisted among
the major concerns of business executives. Alignment seems to
grow in importance as companies strive to link technology and
business in light of dynamic business strategies and continuously
evolving technologies (Papp, 1995; Luftman, 1996). Besides its
Importance, the main hurdle is a blurred vision towards how to
get and maintain this synchronization linking business and IT, how
to evaluate the alignment.
41

Objective of the study
The following are the objectives of study of the research paper
• Identification of the business objectives
• Identification of the business processes which will ensure the
achievement of those business objectives
• Alignment of these objectives and the processes with the
information technology
• Implementation of Information Technology as the driver for
achieving the identified objectives
Research Methodology
For the development of the paper, the following research
methodology was adopted.
• Extensive literature review was performed from various
sources utilizing Internet, journals, reference materials,
magazines and books
• Based on the findings of literature review gaps were
identified pertaining to the various perceptions, views and
contexts that are prevalent in academia and industry. Some
of the major findings have been covered under the section
literature review
• The next step involved the process of formulation of
definition for the business-IT alignment and based on this
definition the development of the paper commenced
accordingly
• The next involved the setting up of the objective of the
research. The objectives have been covered under the
section research objectives
• The next step involved designing of questionnaire inline with
research objectives. Some of the questions were multiple
choice, some of them were single valued while other
questions were based on ranking. The format of the
questions is given as an appendix.
• The next step comprised of sample selection. While selection
the samples, the following strategy was adopted
• Samples were selected from various sectors such as
public sector, health services, tourism, telecom and
others. The following is the breakup in terms of % of
sample data of 800 companies which provided the data
• Public services 30.6%
• Health services 18.7%
• Tourism 12.5%
• Telecom 15.6%
• Other 22.6%
• The next step comprised of selecting the companies with
a certain limit on the turnover of the company. For the
selection of the companies, the following criterion was
set
Figure 1: The ‘Strategic Alignment Model’
42
Business/ IT Alignment as a key Contributor for IT Implementation in Delhi NCR Region: A Study
OJAS - Volume 3, No. 1, January-July 2014
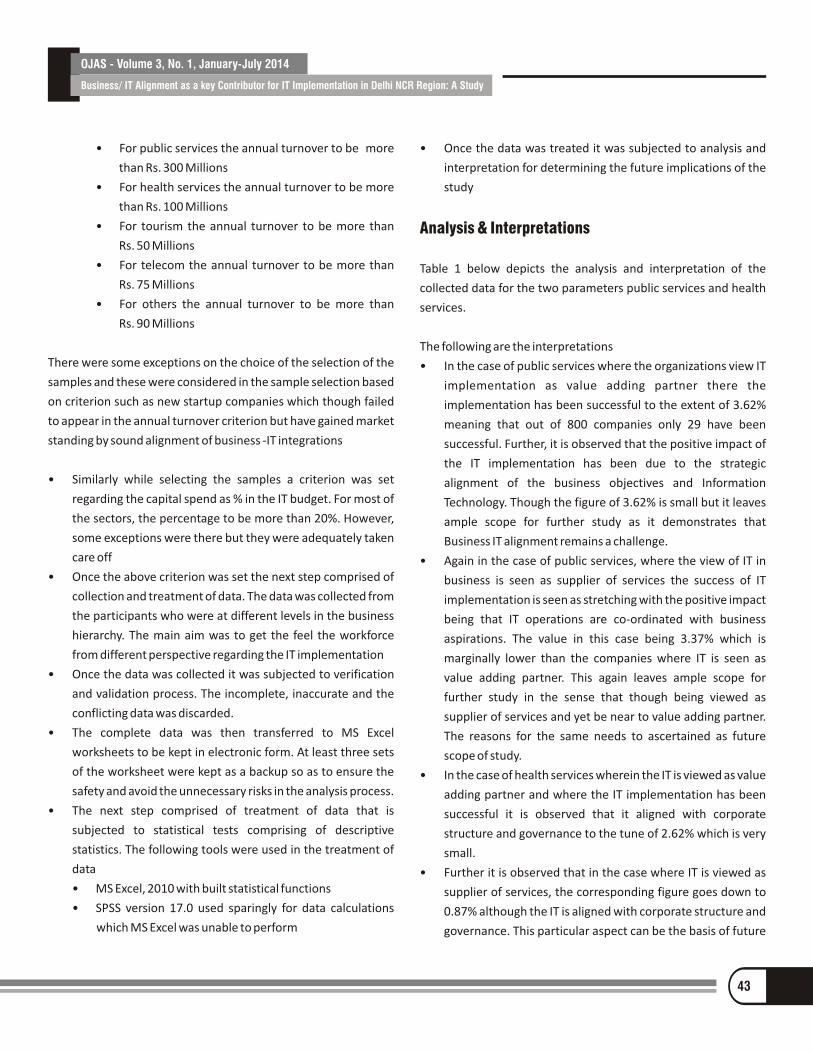
• For public services the annual turnover to be more
than Rs. 300 Millions
• For health services the annual turnover to be more
than Rs. 100 Millions
• For tourism the annual turnover to be more than
Rs. 50 Millions
• For telecom the annual turnover to be more than
Rs. 75 Millions
• For others the annual turnover to be more than
Rs. 90 Millions
There were some exceptions on the choice of the selection of the
samples and these were considered in the sample selection based
on criterion such as new startup companies which though failed
to appear in the annual turnover criterion but have gained market
standing by sound alignment of business -IT integrations
• Similarly while selecting the samples a criterion was set
regarding the capital spend as % in the IT budget. For most of
the sectors, the percentage to be more than 20%. However,
some exceptions were there but they were adequately taken
care off
• Once the above criterion was set the next step comprised of
collection and treatment of data. The data was collected from
the participants who were at different levels in the business
hierarchy. The main aim was to get the feel the workforce
from different perspective regarding the IT implementation
• Once the data was collected it was subjected to verification
and validation process. The incomplete, inaccurate and the
conflicting data was discarded.
• The complete data was then transferred to MS Excel
worksheets to be kept in electronic form. At least three sets
of the worksheet were kept as a backup so as to ensure the
safety and avoid the unnecessary risks in the analysis process.
• The next step comprised of treatment of data that is
subjected to statistical tests comprising of descriptive
statistics. The following tools were used in the treatment of
data
• MS Excel, 2010 with built statistical functions
• SPSS version 17.0 used sparingly for data calculations
which MS Excel was unable to perform
• Once the data was treated it was subjected to analysis and
interpretation for determining the future implications of the
study
Analysis & Interpretations
Table 1 below depicts the analysis and interpretation of the
collected data for the two parameters public services and health
services.
The following are the interpretations
• In the case of public services where the organizations view IT
implementation as value adding partner there the
implementation has been successful to the extent of 3.62%
meaning that out of 800 companies only 29 have been
successful. Further, it is observed that the positive impact of
the IT implementation has been due to the strategic
alignment of the business objectives and Information
Technology. Though the figure of 3.62% is small but it leaves
ample scope for further study as it demonstrates that
Business IT alignment remains a challenge.
• Again in the case of public services, where the view of IT in
business is seen as supplier of services the success of IT
implementation is seen as stretching with the positive impact
being that IT operations are co-ordinated with business
aspirations. The value in this case being 3.37% which is
marginally lower than the companies where IT is seen as
value adding partner. This again leaves ample scope for
further study in the sense that though being viewed as
supplier of services and yet be near to value adding partner.
The reasons for the same needs to ascertained as future
scope of study.
• In the case of health services wherein the IT is viewed as value
adding partner and where the IT implementation has been
successful it is observed that it aligned with corporate
structure and governance to the tune of 2.62% which is very
small.
• Further it is observed that in the case where IT is viewed as
supplier of services, the corresponding figure goes down to
0.87% although the IT is aligned with corporate structure and
governance. This particular aspect can be the basis of future
43
Business/ IT Alignment as a key Contributor for IT Implementation in Delhi NCR Region: A Study
OJAS - Volume 3, No. 1, January-July 2014

scope of study to the fact that whether this figure of 0.87% be
increased further
• Again there is sharp contrast to the place where one single
parameter is changed to the see the effect of IT
Limitation of The Study
The following are the limitations of the study which was carried
out in order to assess the Business-IT alignment with respect to IT
implementation
• Unwillingness, unavailability and hesitation in providing
company’s business objectives and the processes which are
required to achieve those objectives. This was the major
limitation which was observed during the course of data
collection process.
• Due to limited information on business objectives and the
process of gathering data pertaining to implementation of IT
became quite cumbersome as the respondents too were
unable to provide the correct response to benefits they were
able to derive by the IT implementation process. Perhaps this
could be the reason for low values that we have observed in
the table 1 above
implementation as stretching. Here it is observed that the
value goes down to the figure of 0.25% despite being aligned
with corporate structure and governance
• The nature of the sample being varied this posed a limitation
on the part of the process of gathering data for the study. For
example, in one of the company, the benefits of the IT
implementation was given by one respondents wherein his
work was simplified but on the whole the IT implementation
project was viewed as supplier of services
Future implications and Research
The study has opened several areas or avenues for research on
account of the following key points
• The study has opened new avenues for research wherein the
success criterion for IT implementation can be defined and
generalized or can be customized with measurable
parameters. For example in the case of public services, the
success criterion can be defined in terms of ROI for the last 4
months with IT being viewed as value adding partner. This
measurable concept will assist the organizations to improve
their process and move towards optimization. For instance, if
Table 1: Showing the success of It implementation and its alignment with Business objectives
Sr. No.
Industry View of IT in Business
IT implementation successful
Degree of positive impact as aligned to Business -IT
Percentage
1. Public Services
Value adding partner
Successful Aligned to strategic Business alignment
3.62 % (29 /800)
2. Public Services
Supplier of Services
Stretching IT operations co-ordinated with business aspirations
3.37% (27/100)
3. Health Services
Value adding partner
Successful Aligned with corporate structure and governance
2.62% (21/800)
4. Health Services
Supplier of Services
Successful Aligned with corporate structure and governance
0.87% (7/800)
5. Health Services
Supplier of Services
Stretching Aligned with corporate structure and governance
0.25% (2/800)
44
Business/ IT Alignment as a key Contributor for IT Implementation in Delhi NCR Region: A Study
OJAS - Volume 3, No. 1, January-July 2014

the ROI for the last 3 months is Rs. 3000/- then in the next
quarter can the process be improved to increase it to Rs.
3200/-
• Further, the research has opened avenues to the fact, that
can IT implementation project itself assist the organizations
in aligning the business objectives i.e. Reverse process. For
example, can the IT demonstrate that by using a particular
type of component it can increase carbon credits. With this
information can the business units formulate the business
objectives
Conclusion
From the above discussions, it becomes imperative that when it
comes to the process of aligning business-IT with IT
implementation there are several avenues which are required to
be taken into account. As this is an area which is still in incipient
stage several studies are still being conducted.
However, it will definitely take time to arrive at a generic solution
to the process of alignment of IT with business objectives.
References
Books / Journals and Research Papers
1. Sabherwal, R. & Chan, Y. E. (2001). Alignment between
business and IS strategies: A study of prospectors, analyzers
and defenders. IS Research, 12(1):11-33.
2. Sabherwal, R., Hirschheim, R. and Goles, T. (2001). The
Dynamics of Alignment: Insights from a punctuated
equilibrium model, Organization Science 12(2): 179-197.
3. Wagner, H.T, Weitzel T., & Koenig W (2005). Modeling the
impact of alignment routines on it performance: An approach
to making the resource based view explicit. In HICSS '05:
Proceedings of the 38th Annual Hawaii International
Conference on System Sciences, pages 230b-230b, Kona,
Hawaii, USA.
4. Zhou, H., Collier, D. A.,& Wilson, D. D. (2008) The relationship
of strategic business alignment and enterprise information
management in achieving better business performance.
Enterprise Information Systems, 2(2):201-220.
5. Weill, P. and Broadbend, M. (1988). Leveraging the new
infrastructure. Boston: Harvard Business School Press.
6. Porter, M. E. (1996). What is strategy? Harvard Business
Review, 74(6), pp. 61-78.
7. Henderson, J. C., & Venkatraman, H. (1993). Strategic
alignment: Leveraging information technology for
transforming organizations. IBM Systems Journal, 32(1)
8. Luftman, J. (1996). Competing in the Information Age:
Strategic Alignment in Practice. New York: Oxford University
Press.
9. Ciborra, C. U. (1997). De profundis? Deconstructing the
concept of strategic alignment. Scandinavian Journal of
Information Systems, 9(1), pp. 67-82.
10. Smaczny, T. (2001). Is an alignment between business and
information technology the appropriate paradigm to manage
IT in today's organisations? Management Decision, 39(10),
pp. 797-802.
11. Luftman, J. and Kempaiah, R. (2007a). An update on Business-
IT alignment: ‘a line' has been drawn. MIS Quarterly
Executive, 6(3), pp. 165-177.
12. Chan, Y. E. and Reich, B. H. (2007). IT alignment: What have we
learned? Journal of Information Technology, 22(4), pp. 297-
315.
13. Chan, Y. E., Sabherwal, R. and Thatcher, J. B. (2006).
Antecedents and outcomes of strategic IS alignment: An
empirical investigation. IEEE Transactions on Engineering
Management, 53(1), pp. 27-47.
14. Broadbent, M. and Weill, P. (1993). Improving business and
information strategy alignment: Learning from the banking
industry. IBM Systems Journal, 32(1), pp. 162-179.
15. Reich, B. H. and Benbasat, I. (1996). Measuring the linkage
between business and information technology objectives.
MIS Quarterly, 20(1), pp. 55-81.
16. Luftman, J. (2000). Assessing Business-IT Alignment Maturity.
Communications of the Association for Information Systems,
4(14), pp. 1-51.
Internet Resources
• www.slideshare.net/panditvidur/challenges-in-business-
and-it-alignment (accessed on 30th April, 2014)
45
Business/ IT Alignment as a key Contributor for IT Implementation in Delhi NCR Region: A Study
OJAS - Volume 3, No. 1, January-July 2014

• https://gupea.ub.gu.se/bitstream/2077/10496/1/gupea_
2077_10496_1.pdf (accessed on 5th May, 2014)
• http://www.paper121_luftmantheorydiagram.uni.edu.ni/
A%20METAMODEL%20FOR%20STRATEGIC%20BUSINESS.pd
f (accessed on 10th May, 2014)
• http://www.cutter.com/content-and-analysis/resource-
centers/enterprise-architecture/sample-our-research/
ear1102.html ((accessed on 15th May, 2014)
• https://www.successfactors.com/en_us/lp/articles/
corporate-goal-alignment.html ((accessed on 20th May,
2014)
Appendix
Questionnaire
Q. What industry does your company operate in?
Q. What is the current annual turnover of your organization?
Q. What is your capital spend as % of your IT budget?
Q. How do you think the business views IT?
Q. How would you rate IT/Business alignment in your
organization?
• Good
• Fair
• Excellent
• Poor
Q. What is the degree of positive impact on your company’s
outcome largely would you predict could be achieved as a
result of aligning each of the following?
• IT functions and business aligned to IT strategy
• IT organization and authority specially aligned with
corporate structure/governance
• IT expenditure clearly designed and calculated against
corporate priorities
• IT operational aims coordinated with company business
aspirations
• Applicable IT performance metrics defined in terms to be
realized by corporate executives (CEO, CFO, COO, VP
Sales, etc.)
Q. Overall, how successful has your company been in its work to
align IT in each of the following areas?
• IT operational goals matched to corporate business goals
• IT operations and organization aligned to stated IT
strategy
• IT spending aligned with corporate priorities
Q. Was IT Implementation Project Successful?
• Successful
• Unsuccessful
• Stretching
Q. If not successful, What are the factors which contributed for
failure ?
• Lack of IT/Business Alignment
• Lack of User Involvement
Q. What were or should be the priority factors to be considered
for a successful IT Implementation?
• Focus on filling the gap b/w Business & IT
• Focus on achieving a healthy ROI
• Constant Review
• Appropriate Communication
46
Business/ IT Alignment as a key Contributor for IT Implementation in Delhi NCR Region: A Study
OJAS - Volume 3, No. 1, January-July 2014
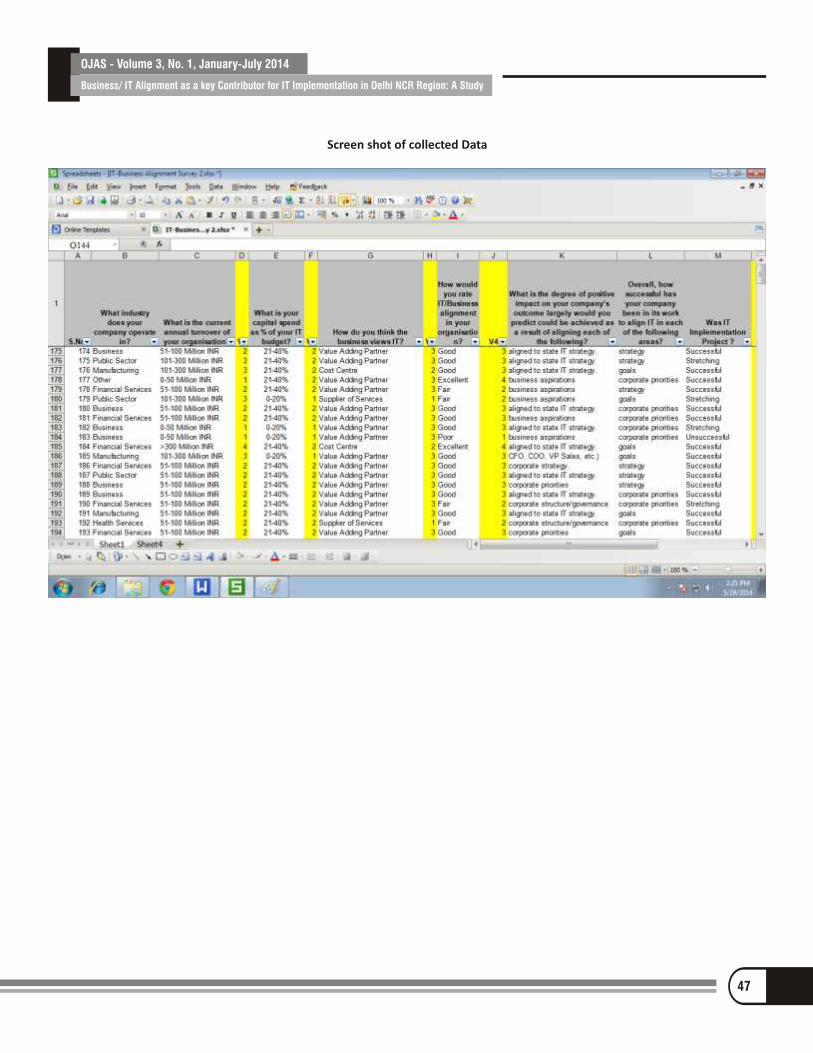
Screen shot of collected Data
47
Business/ IT Alignment as a key Contributor for IT Implementation in Delhi NCR Region: A Study
OJAS - Volume 3, No. 1, January-July 2014

Understanding The Pattern of Usage of Social Networking Sites in India Dr. Tripti Barthwal*
Dr. Akanksha Srivastava**
Abstract
Social Networking Sites (SNSs) have witnessed an exponential rise in usage within the last few years all over the world & India not an exception to this. Several studies around the world have focused on the usage patterns of these SNSs. However, the contemporary scientific literature addressing the usage patterns of social networks in the Indian context is scarce. Therefore, this study is intended to provide empirical insight into the patterns of usage of SNSs in India ie... whether Indians are addicted to SNS addiction and the pattern of usage of SNS across gender, age & marital status. It is based on a survey of respondents spread across different parts of the country.
Keywords: Social Networking Sites, SNS, Facebook, Blogging, Net Addiction
*Professor, Lal Bahadur Shastri Institute of Management & Development Studies, Lucknow. E-mail: [email protected]**Asso. Prof., Lal Bahadur Shastri Institute of Management & Development Studies, Lucknow. E-mail: [email protected]
Introduction
Social Networking is an umbrella term used for many different
aspects of the social internet like Facebook, blogging, to so many
different elements of the social web that it is confusing to define
exactly what social media is. For this paper, Social Networking has
been used to mean the sites where people connect with others
directly through the use of internet.
In recent years, there has been an explosion in the number of
online social networking sites and traffic to these sites. These
websites allow users to create a personal profile that can contain
personal information, photographs, videos and sound clips.
Some activities which individuals undertake on the Internet may
be potentially addictive. Rather than becoming addicted to the
medium per se, some users may develop an addiction to specific
activities they carry out online. Addiction usually refers to
compulsive behavior that leads to negative effects. In most
addictions, people feel compelled to do certain activities so often
that they become a harmful habit, which then interferes with
other important activities such as work or school.
One of the objectives of the paper is to find out whether the level
of SNS usage in India can be termed as addiction or not. In order to
understand the phenomenon of addiction, we discuss the
common characteristics of an addict. The individual (addict)
consumes in excess, the substance to which he is addicted to. He
individual constantly looks for opportunities to get & use the
substance to which he is addicted and serious attempts to give it
up are unsuccessful. The person gives up some activities eg:
social, recreational activities, etc because of addiction & the
addiction continues despite health problem awareness. The
individual continues taking the substance regularly, even though
he develops illnesses linked to it & may spend more and more
time and energy focusing on ways of getting hold of their
substance. He commonly feels that addiction is a means to deal
with their problems or to improve their mood. When the level of
substance usage goes below a certain level the patient displays

Understanding The Pattern of Usage of Social Networking Sites in India
OJAS - Volume 3, No. 1, January-July 2014
physical and mood-related symptoms. There are cravings, bouts
of moodiness, bad temper, poor focus, a feeling of being
depressed and empty, frustration, anger, bitterness and
resentment. The individual may not be able to restrain himself in
doing the act even if there is risk of being caught. In many cases
the addict may take the substance in solitude and even keep this a
secret. A significant number of people who are addicted to a
substance refuse to acknowledge that they are addicts. As the
addiction progresses the individual may stop doing things he/she
used to enjoy a lot. The addiction interferes in his personal
relations & he & his family faces relationship problems.
Literature Review
According to Pew Internet Project’s research related to social
networking in USA, 74% of online adults use social networking
sites (as of January 2014). In May 2013, 74% of women were users
of social networking sites, compared with 62% of men. The annual
Social Media Report (2012) by Nielson and NM Incite states that
social networks dominate internet usage in USA, with 20% of PC
time and 30% of mobile time spent on them: over any other
category of site. Females spend more time social networking than
males, spending an average of 8.37 minutes social networking on
PCs and 9.43 minutes on mobile web and apps, compared to 6.13
and 6.44 minutes for men. 76% of people felt positive after
participating in social networking, and key words used were
‘connected’ and ‘informed’.
As far as addiction to SNS is concerned, Young (1999) argues that
SNS addiction falls in the category of cyber-relationship addiction
(i.e., an addiction to online relationships) since the purpose and
main motivation to use SNSs is to establish and maintain both on-
and offline relationships.
Sherry Turkle (2011), a researcher at the Massachusetts Institute
of Technology, in her book, Alone Together: Why We Expect More
from Technology and Less from Each Other, chronicles some of the
negative impacts of constantly being connected by technology,
which paradoxically can leave people feeling more alone.
Research (2010) has been done concerning Generation Y’s
dependence on social media by International Center for Media &
Public Agenda at the University of Maryland, which tested a
“technology blackout.” They used a sample of 200 students and
initiated a media suspension for 24 hours. When asked to describe
that day, students used the words “in withdrawal, craving, very
anxious, extremely antsy, miserable, jittery and crazy.”
A behavioral addiction such as SNS addiction may thus be seen
from a biopsychosocial perspective (Griffiths 2005). Just like
substance-related addictions, SNS addiction incorporates the
experience of the ‘classic’ addiction symptoms, namely mood
modification (i.e., engagement in SNSs leads to a favourable
change in emotional states), salience (i.e., behavioral, cognitive,
and emotional preoccupation with the SNS usage), tolerance (i.e.,
ever increasing use of SNSs over time), withdrawal symptoms (i.e.,
experiencing unpleasant physical and emotional symptoms when
SNS use is restricted or stopped), conflict (i.e., interpersonal and
intrapsychic problems ensue because of SNS usage), and relapse
(i.e., addicts quickly revert back in their excessive SNS usage after
an abstinence period).
These few existent studies highlight the pattern of SNS usage and
the fact that very high levels of SNS usage can lead to a variety of
negative consequences that imply a potential decrease in
involvement in real-life communities and worse academic
performance, as well as relationship problems. Reducing and
jeopardizing academic, social and recreational activities are
considered as criteria for substance dependence and may thus be
considered as valid criteria for behavioral addictions, such as SNS
addiction. In light of this, endorsing these criteria appears to put
people at risk for developing addiction and the scientific research
base outlined in the preceding paragraphs supports the
potentially addictive quality of SNSs.
Objectives & Methodology
After going through various studies, it was found that there are
many studies on pattern of SNS usage but they are mostly in
context of USA. Similarly, there are studies on addiction to
internet but there are comparatively fewer studies on addiction
49

towards Social Networking Sites & the researches could not find
any with reference to India.
Thus, the present study has been conducted with the following
objectives:
• To determine whether access to SNS sites has become an
addiction in India
• To study if there is any difference in levels of SNS usage across
genders
• To understand the difference in levels of SNS usage across
ages
• To examine the impact (positive or negative) of SNS
Keeping in view the above objectives, the present research was
conducted using exploratory research design. For collection of
primary data, a questionnaire containing 20 statements based on
the objectives was constructed on a 5 point Likert scale. The
questions were designed keeping in view the characteristics of an
addict (discussed earlier) with reference to usage of SNS.
Secondary data was collected through journals & internet. The
universe of the study is India & the researchers have drawn 200
respondents trying to cover the entire country. The analysis was
done on SPSS by applying One-Way Anova & Cross Tabulation.
Data Analysis & Findings
The basic information about the respondents is presented in
Table 1.
Table 1: Basic Information about Respondents
Criteria Categories Percentage
Age Upto 20 years 2.40 20 – 30 years 72.60 30 – 40 years 19.0 40 – 50 years 3.60
More than 50 years
2.40
Gender
Male
57.10
Female
42.90
Marital Status
Single
65.50 Married
34.50
Current Status
Student
23.80 Working for an organisation
67.80
Self-Employed
6
Housewife
1.20
Retired
1.20
Social Networking Sites Accessed
4.80
Orkut
1.20
67.80
4.80
Twitter & Facebook
8.30
Orkut & Facebook
4.80
Twitter, Orkut & Facebook
10.70
Any other
6.0
History of SNS Usage
1 –
2 years
13.10
2 –
3 years
14.30
3 –
4 years
20.20
4 – 5 years 47.60
More than 5 years 4.80
50
Understanding The Pattern of Usage of Social Networking Sites in India
OJAS - Volume 3, No. 1, January-July 2014

Respondents’ Agreement & Disagreement on SNS Addiction is
presented in Table 2.
Table 2: Respondents’ Agreement & Disagreement on SNS Addiction
Statements Respondents
Agreement
Respondents
Disagreement
1. I stay online longer than planned by me. 58.3% 28.6%
2. I neglect households/ schoolwork/official work to spend more time
online.
17.9% 71.4%
3. I can forgo the time spent on SNS for my family. 44% 39.3%
4. I cannot restrain myself from accessing SNS even though I realize
that long hours of access are negatively affecting my health.
27.4% 61.9%
5. People in my life complain to me about the amount of time I spend
online.
26.2% 70.2%
6. I check my social networking account before something else that I
need to do.
47.6% 40.5%
7. My productivity or performance suffers because of the time spent on SNS.
21.5% 66.7%
8. I become defensive or secretive when anyone asks me what I do
online.
27.3% 63.1%
9. I aggressively argue with people who are against SNS. 20.2% 69%
10. I cannot restrain myself from accessing SNS at places (offices, class) where I can land into big trouble if I am caught.
27.4% 60.7%
11. I fear that life without the SNS would be boring, empty and joyless. 34.5% 52.4%
12. I become aggressive, shout or get annoyed if someone bothers me
while I am on SNS.
20.3% 70.3%
13. I lose sleep due to late night log-ins. 26.2% 65.5%
14. I try to cut down the amount I spend online and fail. 27.4% 60.7%
15. I try to hide how long I’ve been online. 26.2% 60.7%
16. I choose to spend more time online over going out with others. 16.7% 72.6%
17. I feel depressed, moody or nervous when I am offline, which goes away once I am back online.
14.3% 71.4%
18. If I decide not to access SNS I will feel depressed and incomplete. 13.1% 71.5%
19. I feel guilty of texting while driving/ working. 27.4% 54.8%
20. I can’t go a day without using SNS. 20.2% 63.1%
51
Understanding The Pattern of Usage of Social Networking Sites in India
OJAS - Volume 3, No. 1, January-July 2014
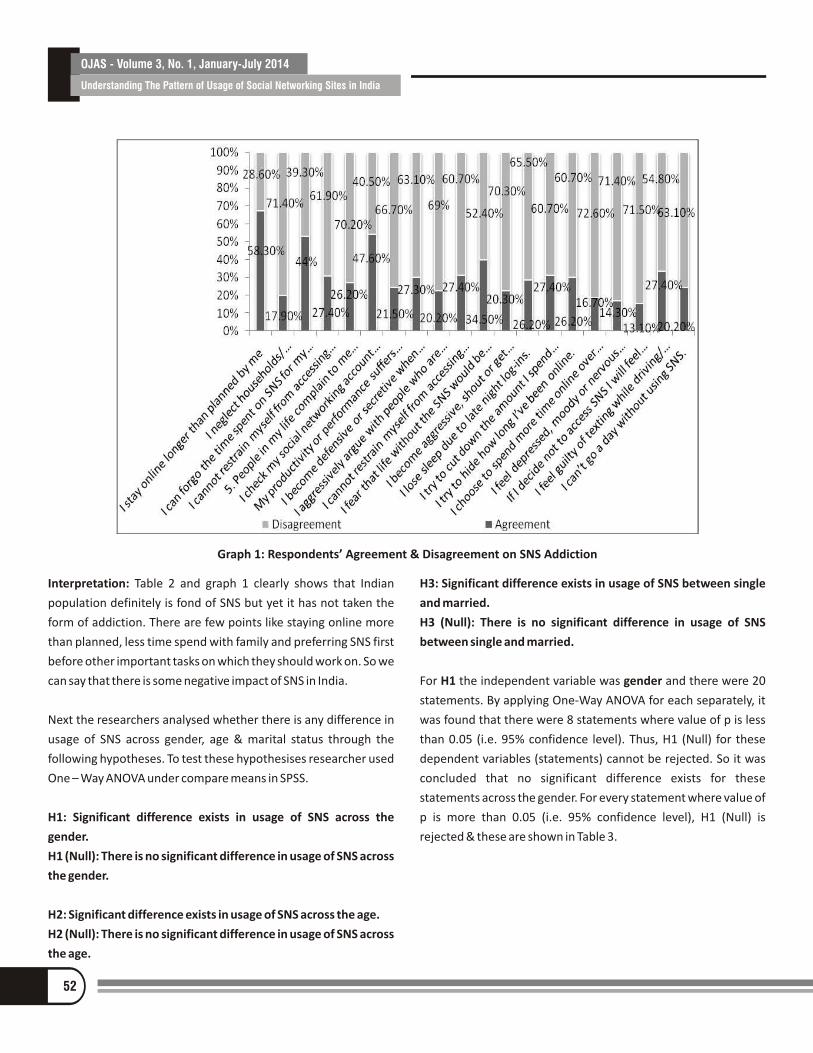
Interpretation: Table 2 and graph 1 clearly shows that Indian
population definitely is fond of SNS but yet it has not taken the
form of addiction. There are few points like staying online more
than planned, less time spend with family and preferring SNS first
before other important tasks on which they should work on. So we
can say that there is some negative impact of SNS in India.
Next the researchers analysed whether there is any difference in
usage of SNS across gender, age & marital status through the
following hypotheses. To test these hypothesises researcher used
One – Way ANOVA under compare means in SPSS.
H1: Significant difference exists in usage of SNS across the
gender.
H1 (Null): There is no significant difference in usage of SNS across
the gender.
H2: Significant difference exists in usage of SNS across the age.
H2 (Null): There is no significant difference in usage of SNS across
the age.
H3: Significant difference exists in usage of SNS between single
and married.
H3 (Null): There is no significant difference in usage of SNS
between single and married.
For H1 the independent variable was gender and there were 20
statements. By applying One-Way ANOVA for each separately, it
was found that there were 8 statements where value of p is less
than 0.05 (i.e. 95% confidence level). Thus, H1 (Null) for these
dependent variables (statements) cannot be rejected. So it was
concluded that no significant difference exists for these
statements across the gender. For every statement where value of
p is more than 0.05 (i.e. 95% confidence level), H1 (Null) is
rejected & these are shown in Table 3.
Graph 1: Respondents’ Agreement & Disagreement on SNS Addiction
52
Understanding The Pattern of Usage of Social Networking Sites in India
OJAS - Volume 3, No. 1, January-July 2014

Table 2: Respondents’ Agreement & Disagreement on SNS Addiction
Sum of Squares Sum of Squares
df
Mean Square
F
Sig.
I stay online longer than planned by me Between Groups 4.321 1 4.321 2.327 .131
Within Groups 152.250 82 1.857
Total 156.571 83
I can forgo the time spent on sns for my family
Between Groups 1.358 1 1.358 .600 .441
Within Groups 185.535 82 2.263
Total 186.893 83
I cannot restrain myself from accessing sns even though i realize that long hours of access is negatively affecting my health
Between Groups 1.921 1 1.921 .987 .324
Within Groups 159.639 82 1.947
Total 161.560 83
People in my life complain to me about the amount of time I spend online
Between Groups .834 1 .834 .368 .546
Within Groups 185.868 82 2.267
Total 186.702 83
I check my social networking account before something else that i need to do
Between Groups .778 1 .778 .311 .579
Within Groups 205.222 82 2.503
Total 206.000 83
I become defensive or secretive when anyone asks me what I do online
Between Groups 4.587 1 4.587 2.459 .121
Within Groups 152.972 82 1.866
Total 157.560 83
I aggressively argue with with people who are against sns
Between Groups 1.286 1 1.286 .748 .390
Within Groups 141.000 82 1.720
Total 142.286 83
I cannot restrain myself from accessing sns at places(offices, classes) where I can land into big trouble if I am caught
Between Groups .194 1 .194 .089 .766
Within Groups 179.556 82 2.190
Total 179.750 83
I fear that life without the internet would be boring, empty and joyless
Between Groups .397 1 .397 .181 .672
Within Groups 179.639 82 2.191
Total 180.036 83
I try to cut down the amount I spend online and fail
Between Groups 2.191 1 2.191 1.126 .292
Within Groups 159.618 82 1.947
Total 161.810 83
if i decide not to access sns I will feel Between Groups .143 1 .143 .104 .748
depressed and incomplete Within Groups 112.667 82 1.374
53
Understanding The Pattern of Usage of Social Networking Sites in India
OJAS - Volume 3, No. 1, January-July 2014
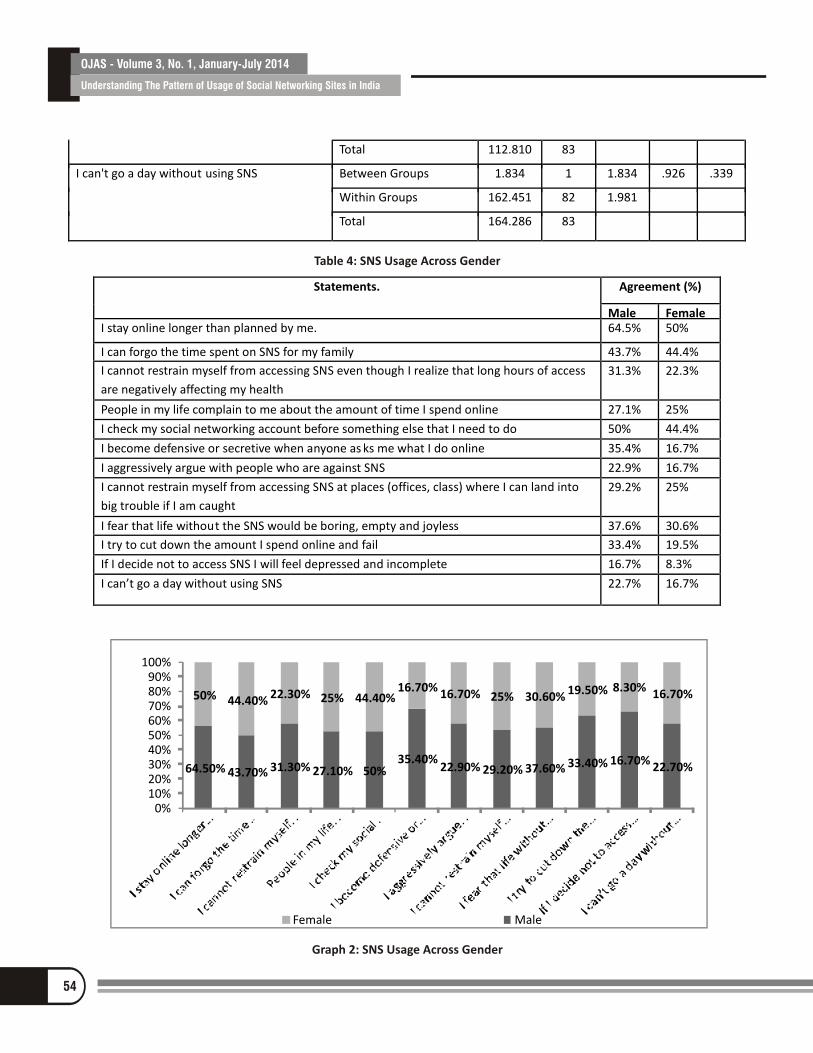
Total 112.810 83
I can't go a day without using SNS Between Groups 1.834 1 1.834 .926 .339
Within Groups 162.451 82 1.981
Total 164.286 83
Table 4: SNS Usage Across Gender
Statements. Agreement (%)
Male Female I stay online longer than planned by me. 64.5% 50%
I can forgo the time spent on SNS for my family 43.7% 44.4%
I cannot restrain myself from accessing SNS even though I realize that long hours of access
are negatively affecting my health
31.3% 22.3%
People in my life complain to me about the amount of time I spend online 27.1% 25%
I check my social networking account before something else that I need to do 50% 44.4%
I become defensive or secretive when anyone as ks me what I do online 35.4% 16.7%
I aggressively argue with people who are against SNS 22.9% 16.7%
I cannot restrain myself from accessing SNS at places (offices, class) where I can land into
big trouble if I am caught
29.2% 25%
I fear that life without the SNS would be boring, empty and joyless 37.6% 30.6%
I try to cut down the amount I spend online and fail 33.4% 19.5%
If I decide not to access SNS I will feel depressed and incomplete 16.7% 8.3%
I can’t go a day without using SNS 22.7% 16.7%
64.50% 43.70% 31.30% 27.10% 50%35.40%
22.90% 29.20% 37.60% 33.40% 16.70%22.70%
50% 44.40% 22.30% 25% 44.40%16.70%
16.70% 25% 30.60% 19.50% 8.30%16.70%
0%10%20%30%40%50%60%70%80%90%
100%
Female Male
Graph 2: SNS Usage Across Gender
54
Understanding The Pattern of Usage of Social Networking Sites in India
OJAS - Volume 3, No. 1, January-July 2014

Interpretation: The researchers found that usage of SNS is more in
males in comparison to females and this is clearly shown in Table 4
and Graph 2.
For H2 the independent variable was age and there were 20
statements. By applying One-Way ANOVA for each statement
separately, it was found that there were 2 statements where value
of p is less than 0.05 (i.e. 95% confidence level). Thus, H1 (Null) for
these dependent variables (statements) cannot be rejected. So it
was concluded that no significant difference exists for these
statements across the gender. For every statement where value of
p is more than 0.05 (i.e. 95% confidence level), H2 (Null) is
rejected & these are shown in Table 5.
Table 5: ANOVA FOR H2 (SNS Usage Across Age)
Statements Sum of
Squares
df
Mean
Square
F
Sig.
I stay online longer than planned by me Between Groups 11.358 4 2.840 1.545 .197
Within Groups 145.213 79 1.838
Total 156.571 83
I neglect household/school work/ official work to
spend more time online
Between Groups 2.750 4 .688 .424 .791
Within Groups 128.238 79 1.623
Total 130.988 83
I cannot restrain myself from accessing sns even
though I realize that long hours of access is
negatively affecting my health
Between Groups 10.260 4 2.565 1.339 .263
Within Groups 151.299 79 1.915
Total 161.560 83
People in my life complain to me about the
amount of time I spend online
Between Groups 9.375 4 2.344 1.044 .390
Within Groups 177.328 79 2.245
Total 186.702 83
I check my social networking account before
something else that I need to do
Between Groups 15.973 4 3.993 1.660 .168
Within Groups 190.027 79 2.405
Total 206.000 83
My productitvity or performance suffers because
of the time spent on sns
Between Groups 8.110 4 2.027 1.155 .337
Within Groups 138.700 79 1.756
Total 146.810 83
I become defensive or secretive when anyone asks
me what i do online
Between Groups 8.930 4 2.232 1.187 .323
Within Groups 148.630 79 1.881
Total 157.560 83
55
Understanding The Pattern of Usage of Social Networking Sites in India
OJAS - Volume 3, No. 1, January-July 2014

I aggressively argue with with people who are
against sns
Between Groups 6.853 4 1.713 .999 .413
Within Groups 135.433 79 1.714
Total 142.286 83
I cannot restrain myself from accessing sns at
places(offices, classes) where I can land into big
trouble if I am caught
Between Groups 11.394 4 2.849 1.337 .264
Within Groups 168.356 79 2.131
Total 179.750 83
I fear that life without the internet would be
boring, empty and joyless
Between Groups 7.357 4 1.839 .841 .503
Within Groups 172.679 79 2.186
Total 180.036 83
I become aggressive, shout or get annoyed if
someone bothers me while I am on sns
Between Groups 6.488 4 1.622 .919 .457
Within Groups 139.465 79 1.765
Total 145.952 83
I lose sleep due to late nights log-ins Between Groups 11.728 4 2.932 1.226 .307
Within Groups 188.974 79 2.392
Total 200.702 83
I try to cut down the amount Ispend online and fail Between Groups 15.814 4 3.953 2.139 .084
Within Groups 145.996 79 1.848
Total 161.810 83
I try to hide how long i have been online Between Groups 2.949 4 .737 .308 .872
Within Groups 189.003 79 2.392
Total 191.952 83
I choose to spend more time online over going out
with others
Between Groups 3.266 4 .817 .500 .736
Within Groups 129.150 79 1.635
Total 132.417 83
i feel depressed, moody or nervous when I am
offline, which goes away once I am back online.
Between Groups 3.520 4 .880 .583 .676
Within Groups 119.290 79 1.510
Total 122.810 83
if I decide not to access sns I will feel depressed
and incomplete
Between Groups 6.438 4 1.609 1.195 .319
Within Groups 106.372 79 1.346
Total 112.810 83
56
Understanding The Pattern of Usage of Social Networking Sites in India
OJAS - Volume 3, No. 1, January-July 2014

Further analysing the dependent variables for those H2 (Null) is rejected, to find out the
pattern of difference across the age (Refer Table 6 & Graph 3 ).
Table 6: SNS Usage Across Age
I feel guilty of texting while driving/working Between Groups 8.352 4 2.088 1.029 .398
Within Groups 160.350 79 2.030
Total 168.702 83
Statements
Agreement (%)
Up to 20 years
20-30 years
30-40 years
40-50 years
More than 50 years
I stay online longer than planned by me. 100% 62.3% 50% 33.3% 0%
I neglect households/ schoolwork/official work to spend more time online.
0% 18% 18.7% 33.3% 0%
I cannot restrain myself from accessing SNS even though I realize that long hours of access are negatively affecting my health.
0% 31.2% 12.4% 33.3% 0%
People in my life complain to me about the amount of time I spend online.
50% 31.2% 6.2% 33.3% 0%
I check my social networking account before something else that I need to do.
100% 52.5% 31.3% 33.3% 0%
My productivity or performance suffers because of the time spent on SNS.
0% 24.6% 12.4% 33.3% 0%
I become defensive or secretive when anyone asks me what I do online.
50% 32.8% 12.4% 0% 0%
I aggressively argue with people who are against SNS. 0% 19.7% 31.2% 0% 0%
I cannot restrain myself from accessing SNS at places (offices, class) where I can land into big trouble if I am caught.
50% 32.8% 6.2% 33.3% 0%
I fear that life without the SNS would be boring, empty and joyless.
50% 36.1% 31.2% 33.3% 0%
I become aggressive, shout or get annoyed if someone bothers me while I am on SNS.
0% 24.6% 12.4% 0% 0%
I lose sleep due to late night log-ins. 50% 31.2% 6.2% 33.3% 0%
I try to cut down the amount I spend online and fail. 100% 31.1% 6.2% 33.3% 0%
I try to hide how long I’ve been online.
50% 27.9% 18.8% 33.3% 0%
I choose to spend more time online over going out with others.
0% 21.3% 6.2% 0% 0%
I feel depressed, moody or nervous when I am offline, which goes away once I am back online.
0% 14.8% 12.4% 33.3% 0%
If I decide not to access SNS I will feel depressed and incomplete.
0% 16.4% 0% 33.3% 0%
I feel guilty of texting while driving/ working. 0% 29.5% 12.5% 66.6% 50%
57
Understanding The Pattern of Usage of Social Networking Sites in India
OJAS - Volume 3, No. 1, January-July 2014

Graph 3: SNS Usage Across Age
Interpretation: From the table 6 and graph 3, we can clearly see
the pattern of SNS usage across the different age groups. The
usage of SNS is more in young respondents & this is
understandable because at the upto 20 years, they are not
responsible for any type of liability like earning money for their
livelihood, spouse, kids, parents and other homely assignments.
Respondents between 20-30 years, feel their working and life
style is affected due to SNS. Respondents between 30-40 years are
again less affected because this phase of life is very tough, busy
and this is a phase when an individual is more accountable for
settling down his life as family responsibilities increase. The usage
of SNS amongst respondents between 40-50 years is high because
in this age most of the career & family requirements stabilise &
need to connect increases. Lastly, in respondents above 50 years
of age usage of SNS is low because they belong to a generation
where such things did not exist.
For H3 the independent variable was marital status. By applying
One-Way ANOVA for each statement separately, it was found that
there are 6 statements for which value of p value is less than 0.05
(i.e. 95% confidence level). Thus, H1 (Null) for these dependent
variables (statements) cannot be rejected. So it was concluded
that no significant difference exists for these statements across
marital status. For every statement where value of p is more than
0.05 (i.e. 95% confidence level), H1 (Null) is rejected & these are
shown in Table 7.
58
Understanding The Pattern of Usage of Social Networking Sites in India
OJAS - Volume 3, No. 1, January-July 2014

Table 7: ANNOVA for H3 (SNS Usage Across Marital Status)
Statements
Sum of
Squares
df
Mean
Square
F
Sig.
I stay online longer than planned by me Between Groups 1.552 1 1.552 .821 .368
Within Groups 155.019 82 1.890
Total 156.571 83
I neglect household/school work/ official
work to spend more time online
Between Groups .589 1 .589 .371 .544
Within Groups 130.399 82 1.590
Total 130.988 83
I can forgo the time spent on sns for my
family
Between Groups 1.298 1 1.298 .573 .451
Within Groups 185.595 82 2.263
Total 186.893 83
I cannot restrain myself from accessing sns
even though I realize that long hours of
access is negatively affecting my health
Between Groups 4.958 1 4.958 2.596 .111
Within Groups 156.602 82 1.910
Total 161.560 83
People in my life complain to me about the
amount of time I spend online
Between Groups 8.307 1 8.307 3.819 .054
Within Groups 178.395 82 2.176
Total 186.702 83
I aggressively argue with with people who
are against sns
Between Groups 1.987 1 1.987 1.162 .284
Within Groups 140.298 82 1.711
Total 142.286 83
Ican not restrain myself from accessing sns
at places(offices, classes) where I can land
into big trouble if I am caught
Between Groups 6.665 1 6.665 3.158 .079
Within Groups 173.085 82 2.111
Total 179.750 83
I fear that life without the internet would be
boring, empty and joyless
Between Groups 1.656 1 1.656 .761 .386
Within Groups 178.380 82 2.175
Total 180.036 83
I try to hide how long I have been online Between Groups 8.868 1 8.868 3.972 .050
Within Groups 183.085 82 2.233
59
Understanding The Pattern of Usage of Social Networking Sites in India
OJAS - Volume 3, No. 1, January-July 2014

Table 8: SNS Usage Across Marital Status
Further analysing the dependent variables for those H3 (Null) is
rejected, to find out the pattern of difference across the marital
status (Refer Table 8).
Total 191.952 83
I choose to spend more time online over Between Groups 4.837 1 4.837 3.109 .082
going out with others Within Groups 127.580 82 1.556
Total 132.417 83
I feel depressed, moody or nervous when i
am offline,which goes away once I am back
online.
Between Groups .126 1 .126 .084 .772
Within Groups 122.683 82 1.496
Total 122.810 83
if I decide not to access sns I will feel
depressed and incomplete
Between Groups 3.000 1 3.000 2.240 .138
Within Groups 109.809 82 1.339
Total 112.810 83
I feel guilty of texting while driving/working Between Groups 1.200 1 1.200 .588 .446
Within Groups 167.502 82 2.043
Total 168.702 83
Statements Agreement (%)
Single Married
I stay online longer than planned by me. 61.8% 51.7%
I neglect households/ schoolwork/official work to spend more time online. 18.2% 17.2%
I can forgo the time spent on SNS for my family. 40% 52.11
I cannot restrain myself from accessing SNS even though I realize that long
hours of access are negatively affecting my health.
32.7% 17.2%
People in my life complain to me about the amount of time I spend online. 32.7% 13.8%
I aggressively argue with people who are against SNS. 21.8% 17/2%
I cannot restrain myself from accessing SNS at places (offices, class) where I
can land into big trouble if I am caught.
34.5% 13.8%
I fear that life without the SNS would be boring, empty and joyless. 38.2% 27.6%
I try to hide how long I’ve been online. 32.8% 13.7%
I choose to spend more time online over going out with others. 23.7% 3.4%
I feel depressed, moody or nervous when I am offline, which goes away once I
am back online.
14.5% 13.7%
If I decide not to access SNS I will feel depressed and incomplete. 18.1% 3.4%
I feel guilty of texting while driving/ working. 30.9% 20.8%
60
Understanding The Pattern of Usage of Social Networking Sites in India
OJAS - Volume 3, No. 1, January-July 2014

Graph 4: SNS Usage Across Marital Status
Interpretation: From the above table 8 and graph 4, it is clear that
the usage of SNS is more in case of single respondents in
comparison to married and this is quite logical because singles
have more time because of less family responsibilities.
Conclusions
• Use of Social Networking Sites is very popular in India &
people use them very frequently but still their usage in India
cannot be termed as addiction.
• The usage of SNS is higher in males than females.
• The usage of SNS is higher in respondents below 20 years &
between 40-50 years than other age groups. The usage of SNS
is quite low in respondents above 50 years.
• Single respondents use SNS more in comparison to married
ones
Limitations
• The respondents may have not disclosed their real feelings.
Hence 100% accuracy cannot be assured.
• The research was carried out in a short span of time, where in
the researcher could not widen the study to a greater extent
than this.
• The survey is confined to the SNS users who participated in it,
hence its results may not be applicable to the entire country.
References
• Griffiths MD. A “components” model of addiction within a
biopsychosocial framework. J Subst Use. 2005;10:191–197
• Lawrence T. Lam, Zi-wen Peng, Jin-cheng Mai, and Jin Jing.
Cyber Psychology & Behavior. October 2009, 12(5): 551-555.
doi:10.1089/cpb.2009.0036. Published in Volume: 12 Issue 5:
October 9, 2009
61
Understanding The Pattern of Usage of Social Networking Sites in India
OJAS - Volume 3, No. 1, January-July 2014

• The Nielsen Company. Global Audience Spends Two Hours
More a Month on Social Networks than Last Year; The Nielsen
Company: New York, NY, USA, 2010; Available
online:http://blog.nielsen.com/nielsenwire/global/global-
audience-spends-two-hours-more-a-month-onsocial-
networks-than-last-year/ (accessed 23 May 2013).
• Turkle, S. Alone Together: Why We Expect More from
Technology and Less from Each Other , Basic Books, New
York:, ©2011.
• Young K. Internet addiction: Evaluation and treatment.
Student British Medical Journal. 1999;7:351–352.
• http ://www.pewinternet .org/fact -sheets/soc ia l -
networking-fact-sheet/
• Jaume J., How We Use Social: Highlights from the Social
Media Report 2012, Retrieved from http://www.brand
watch.com/2012/12/how-we-use-social-highlights-from-
the-social-media-report-2012/ on Sep. 1, 2014
62
Understanding The Pattern of Usage of Social Networking Sites in India
OJAS - Volume 3, No. 1, January-July 2014

Corporate Training: A perspective and its link to Organizational Outcome
Anshuman Das*
Abstract
Training is an important element of business growth. But most often when times get tough this is the first thing to get cut. CEO’s and Organizations do not realize that if the leaning stops in an environment it leave no room to differentiate oneself in the market place and face competition head on. They as a matter of fact do not realize that Training is one of the intrinsic factor in employee motivation and retention as it develops the job, role and aids in career enhancing skills thereby opening up many avenues for the organization. Many corporates also fail to understand what ROI any training actually gives. They feel organizations invest in training and development and it often fails to provide the desired results. Real employee behavioral change, based on the training content, is even harder to demonstrate in most organizations. So the objective remains to get the focus and mindshare of such institutions and CEO to appreciate that that Training is more meaningful and is synonymous to workplace transformations and has a direct link to ROI.
What training does is help you get access to what one does not have and needs to build or get through this approach that is demonstrated here by taking all into account. One has to look at it in totality by taking each stage in the process that have articulated some of which are not seen and practiced in organizations today. These can redefine the Training life cycle and give a new dimension to some of the questions which always remains a board room discussion point during budget sessions and company’s Annual strategic and Operations planning. Organizations must set signals that learning is important in this organization. It's about creating in employees the mental model that if I engage in this learning, it is to my and organizations benefit. That I as an employee will be more marketable with applied outcomes of such training that one undergoes. This would spring a chain reaction in employees across with a direct link to outcome. You can surely make training and development more meaningful and effective within your organization.
Keywords: Training, In house, External, T&D, Integrate, Outcome, Training & Development Lifecycle, Diagnosis, Field Performance, CEO, Delivery, Design, Develop, Customize, Periodic, Measurable, Periodic Assessment, Success, Schedule, Goal, Organisation, Training Need Identification, Work area, Manager, Action, Application, Practice, Skill, Knowledge, Dissemination, Learning, Methodology, Progress, Action based, Reward, Recognition, Link, Soft skill, Strategic plan, Boardroom, Result, Leader, Engage, Succession Planning, Assessment Centers, Leadership, Intervention, Reinforce, Career, Progression, Goal, OJT, Leadership, Seminars, Conferences, Workshops, Role Plays, Training, Business Objective, KRA, Performance, Evaluation, Trainer, Influence, Measure, Outcome, KPI, TNI, Capability Building.
*HR Advisor, Trainer, Writer & Career Coach, Dubai. Email: [email protected]
Introduction
Training is one of the intrinsic factor in employee motivation and
retention as it develops the job, role and aids in career enhancing
skills thereby opening up many avenues for the organization.
Many corporates fail to understand what return any training
actually gives. They feel organizations invest in training and
development and it often fails to provide the desired results. Real
employee behavioral change, based on the training content, is
even harder to demonstrate in most organizations. Training
happens to be one of the most important set in any Organisation
today.
Most of the Training fail as there is no follow up and there is lack of
meaningful assessment once a Training is done.
In fact there are number of myths and vague assumptions and
expectations that organizations have about Training.
1) They think once the Participant attends Training there has to
be immediate signs of change in some form.
2) Training is more for those who lack a certain skill and not an
enrichment measure for those who already have.

Corporate Training: A perspective and its link to Organizational Outcome
OJAS - Volume 3, No. 1, January-July 2014
64
3) Training Need Identification (TNI) should focus on skill gap. In
fact TNI should address beyond skill gap to focus on skill
enrichment as well.
4) Training Need Identification and analysis thereon is a simple
process and its outcome is Performance Appraisal which
alone in not true.
This actually starts from time candidate is interviewed and
from an appraisal or confirmation stage. Enough time is not
spent and lateral thinking is not done.
5) Training is not as important as Revenue generation.
6) A renowned Trainer or Training Organisation is an answer to
the Training Outcome.
This is a narrow thought process and will alone not help.
7) Assumption that a reputed Training Vendor will understand
the business cycle and having done program in same industry
also understands the Training need of your Organisation.
8) That it is the onus of the Training vendor or Trainer to design
the program.
While this may be true, in house Training function and
business have to provide all support and infact join in
designing the program.
9) TNI is enough and that no further engagement may be
required before the Training if the Trainer is renowned and
has done similar programs in same industry or with
competing organizations.
10) Training evaluation is all about feedback on Training Content,
Trainer and Training delivery, set up and aids.
These are all erroneous assumptions and myths as you may like to
call each one above.
Evaluation should take into account reaction or feedback to the
Training and its link thereafter to actual intervention on ground
wrt its application and learning outcome. Many Organizations
limit themselves to what I described in one of the above points
above.
Similarly among other points the organizations mindshare,
support from leaders and managers, opportunity to apply, all
influence which otherwise is found lacking. It has to come from
Top and right message should percolate down to give it its due
weightage to reap desired outcomes which will go a long way in
positively influencing the bottom line.
Another important aspect that I have seen esp. wrt Leadership
Training in Corporate is when such leaders are identified, sent for
Training and then not knowing what to do!
1) Organizations in first place do not have a clear methodology
to identify such leaders.
2) This identification is not linked to the leaders 3 years, 5 years
developmental or Organizational Succession plan. Some
large organizations don’t even have a robust plan in place.
3) If at all some are identified because of their performance,
breadth, geo spread and sheer volume of people or revenue
they are handling; they don’t have a direction as to what next
after attending the Training. In cases CEO’s mindshare limits it
to apply in off case or once back from a training the key
takeaways are briefed to next in line which is end of story. The
Internal Training function does not take it ahead beyond this
and there is no road map on how to derive the best of where
Organisation spends so much for the senior leaders.
4) In some cases I have seen Organizations have assessment
centers and have a clear cut strategy in place wrt their
Succession Planning. In this case also link with such
leadership training and its aftermath is a weak link and it is
not applied or disseminated properly for Organisation to
benefit at large.

65
5) At other times the leaders identified for such programs lack
self-drive to share with their colleagues and get engrossed in
the day to day business once they are back from such training.
Some also wonder after coming back ‘why did I go to that
training’
So it is important that each stage in the process is linked and a
robust Training and Development program is in place with clear
objectives through its application and Outcome which can be
translated well in terms of Organisation benefits- the ROI.
So what is that organization should do to ensure Corporate
Training is useful and leads to proper Organizational outcome.
Develop a Training & Development Life Cycle Process
Create a training and development life cycle process that will
ensure that the employee training you do work. Develop one and
link each stage in the process. Have a periodic review and ensure
you backward integrate at each stage in the process while you
advance to next stage in the link.
I having worked in Talent Engagement & Development in some
large organizations; seen this sub function very closely having
conceptualized and led many initiatives. Based on my experience,
practice and being a Trainer tried to come up with some thoughts
and approaches which could bring in a drastic change and scale
new heights when it comes to making Training more meaningful.
These will make your Corporate Training more effective and
transferable; the application will result in measurable differences
to final outcome.
Develop In-house Trainers and Integrate with External Trainers
during Delivery
Organizations differentiate training programs into in-house or
external. Time is ripe that organization should realize that the in-
house training and external be integrated. In-house trainers
should deliver and participate with their experience from being in
the organization, come up with case studies and join the external
trainers in delivering to make it more productive with a solution
centric approach. This must aim to attend use of a variety of
familiar examples from work areas and maximize the similarity
between the training situation and the work situation.
CEOs Time & Training as a Leadership KPI
CEOs are often seen focusing on the Business strategy sparing
very little time for the Capability building. Their direction and
expectation should be very clear from any intervention which is
going to have an Organisation wide impact and is foreseen as a
game changer. During any such programs a CEOs presence and
talk for 10 minutes can make a huge difference. Small and mid-size
organizations can still have this liberty which they should embrace
as quickly as they can. Large organizations should ensure that
their Business heads have the mindshare for this and make it an
important KPI for the leadership team.
Effective Training Need Identification (TNI) & Diagnosis:
Familiarity breeds contempt so training needs to vary from year to
year with help of an effective TNI and using right diagnostic tools.
Training employee’s uses up resources, including the cost of hiring
staff to replace those who are being trained. For training to be cost
effective, training function must ensure that staff have attended
training sessions and measure the benefits. Training Need
identification (TNI) should not be restricted and drawn only on the
basis of the appraisal and/or department and business heads
views and inputs. What is important is how much of the depth the
Training function gets into while designing a TNI. Need of the hour
is to get a 360* view of department performance and
organization, customer feedbacks, crosscheck with field on
people related gaps in each department and design a TNI.
Link Training Design to Field Performance
Training gets delivered but the measurement and actual ROI
always remains a question mark. In continuation, Capability
building as a process often is seen as an isolated intervention
without taking the ground business realities into account as
stressed earlier. While it’s true that Training is customized but that
more often is restricted to inputs from only chosen few managers
or in-house function. I have not seen or heard many organizations
do a Training diagnostics to aid in design before imparting the
Corporate Training: A perspective and its link to Organizational Outcome
OJAS - Volume 3, No. 1, January-July 2014
66
Training from all the Participants which is a must if you have to
bridge the gap between Training design-delivery and Field
performance which shows in final outcome.
Internal Training function need to influence Translation of
training into practice
There is a need for internal training function to be more than
ticking boxes, verify that everyone involved has a seat in a training
room to translate and take the plunge to make sure employees are
engaged in the training provided to them, learn and apply over a
period. They need to play an active role in such transformation. It
is but not easy to apply instantly. They have to constantly engage
with such staffs and design such model of engagement given their
industry and company size to see that transformation and
effective change happens.
Creating Training Stickiness before the Employee Training
Sessions
In organizations there are different types of employees, some see
Training as a great platform for their skill enhancement while
there are a few who see it a welcome break from their work
schedule. It is important that the stickiness is built before training
sessions so that even for those who see it a mere break increase
their chances of knowledge gain and application to the
workplace.
It is required that the employee thought processes are aligned
with the training by showing their gaps and outcome of such
training. Provide information to the employee about why the new
skills, skill enhancement, or information is necessary - Create the
context. Make sure that the employee understands the link
between the training and his job.
Self-Development as a KRA in appraisal Linking to Organization
goals.
Whenever possible, connect the employee training to the
employee's job and work objectives. Make sure the self-
development process is integrated as a KRA in appraisal across
levels and the connection to the Organization and department
objectives are clear. Define a series of KPIs (Key Performance
Indicators) for such training programs, such as average number of
training hours per student, How it resulted in Outcome-
Quantifiable measure and more.
Give a platform to apply the Training in Work area.
Training function should intervene and along with managers
should aid by encouraging a community practice to apply. Involve
and Connect the managers to the course expectations and how
the same is going to be attained. Get their buy-in early. It is equally
important for Training function to engage with managers of such
participants of training as with them after the training. It is a good
idea to then engage the three levels of managers of the training
participants so that this gets an organization wise mindshare in
the span.
Develop Trainer’s mindshare for the end objective
Like all other stakeholders it is required that the trainers
understand and appreciate what the organisation is looking at as
an outcome of such training. Apart from involving them in
customization, diagnostic and design they need to understand the
batch’s strengths and weakness in the areas of Training which is
planned for them.
Important is to understand the group, use terms and concepts
that are already familiar to them and which they can relate to in
workplace scenario. These make skill transfer easy and induces
change. They should try to hook up the attendee’s attention to
important aspects of the job. For example if the group is that of
Customer service professionals it is important to make them
understand what type of customers they may encounter, under
what circumstances they may react, how their reaction
mechanisms will be, how one as a customer service professional
feel then and the likes without straightway getting into how to
handle irate customers which I have seen many trainers do.
Trainers should be conscious of the fact that they should relate to
situations and impart in a way that can be immediately applicable
on the job.
Periodic reassessment of application of Training
I have seen Training is done and that is the end of story for the
Corporate Training: A perspective and its link to Organizational Outcome
OJAS - Volume 3, No. 1, January-July 2014

67
participants, In-house Training functional managers and line
managers. I stressed earlier that the link should be established to
see measurable outcomes. For that it is a good idea to develop a
periodic reassessment after 3 months and 6 months on the job.
Training Rewards for practice and outcome in work area.
Organizations and Training functions need to think about
recognitions beyond the Training Attendance Certificates,
Knowledgement enhancement and experience sharing rewards.
It is important to provide rewards and recognition as a result of
successful completion and such application of the training in the
work area. That in its real sense will be closer to any outcome and
getting much needed mindshare and changing perception about
Training as another investment which can be cut in the first place
when things don’t go well.
Conclusion
Training has to bring in transformations in individuals in their
skills, knowledge, personality, attitude, behavior and adaptability.
The most successful companies in the world recognize the fact
that training is not an event but an ongoing process. Business
environments are evolving constantly, with new developments
being created and existing ones enhanced. Consequently, training
is an ongoing exercise without an end date. Best practices are
around providing cross-training, proving varied opportunities for
existing employees and comprehensive orientation and
assimilation training for new hires.
The evaluation and refresher should be done periodically which
often is not seen in many organizations. You can surely make
training and development better and effective within your
organization.
Corporate Training: A perspective and its link to Organizational Outcome
OJAS - Volume 3, No. 1, January-July 2014

68
Corporate Training: A perspective and its link to Organizational Outcome
OJAS - Volume 3, No. 1, January-July 2014

SUBSCRIPTION FORM
Please accept the enclosed cheque/demand draft No_________________________dated______________drawn
on______________________________bank favouring Jaipuria School of Business Ghaziabad for (Rs._______________/ US
$_______________) towards subscription of OJAS for one/two/three years (Please Tick).
Name:___________________________________________________________________________________________________
Organisation:____________________________________________________________________________________________
Mailing Address:_________________________________________________________________________________________
________________________________________________________________________________________________________
________________________________________________________________________________________________________
City_______________________________________Pin/Zip_________________________Country ______________________
E-mail:__________________________________________________________________________________________________
Send your Feedback Enquiry to:
The Editor-In-Chief
OJAS
Jaipuria School of Business
Shakti Khand IV, Indirapuram, Ghaziabad
Ph: 0120-488 11 00, 08860852754
e-mail: [email protected]
Website: www.jaipuria.edu.in/pgdm
Please Note:-
1. The subscription will be from January to December, i.e.
for complete set of volumes for one year.
2. Please send Rs. 50 extra for outstation cheque.
3. Any change in address should be informed immediately.
4. The subscription should be sent on the given address.
SUBSCRIPTION RATE
One YearPrint Institutions: Rs. 1000/- Individuals: Rs. 750/- Overseas: 150 USD
Two YearPrint Institutions: Rs. 1800/- Individuals: Rs. 1300/- Overseas: 200 USD
Three YearPrint Institutions: Rs. 2600/- Individuals: Rs. 2000/- Overseas: 250 USD
OJASExpanding�Knowledge�Horizon


The contributors are requested to adhere to the following guidelines.
• The selection of papers for publication is based on their originality, knowledge content and application. The journal endeavors to maintain balance between purely research oriented papers and those derived mainly from the experiences of practitioners involved in different areas of management.
• Authors are encouraged to contribute the empirical and analytical research or case research. In case of case studies, contributors are required to provide the teaching notes of the case along with brief description of the real life situation faced and the decision or action taken by the manager or organization. The perspectives need to be based on emerging issues and ideas. The journal encourages the contributors to review the current management books.
• The manuscript should normally not exceed 20 double spaced, single sided typed pages, 12 font size in Times New Roman font, leaving 1.5 inches margin on all sides of A-4 size paper.
• All manuscripts and related correspondence should be mailed to [email protected]. The contributions received will be acknowledged within 2-3 working days by e-mail. The manuscripts not considered for publication will not be sent back. The acceptance or rejection of the contributions will be informed to the contributors through email only.
• The journal follows a policy of blind peer review.
• The contributors are required to attach a separate title page which should include the title of the paper, name(s) of the author(s) and relevant biographical information. The second page should carry the title of the paper and 100 to 150 word- single paragraph abstract of the paper.
• All tables, charts, and graphs should be black, not in color. Authors must acknowledge all the sources they have drawn upon and the sources should be indicated at bottom.
• References should be complete in all respects and arranged in alphabetical order as per the standard pattern of research.
• The authors should provide a declaration along with the manuscripts, stating that the article is an original work of author(s) and the same has not been published earlier in any other publication.
• The main author will receive a complimentary copy of the journal in which their articles are published.
References: Place the references at the end of the manuscript following the footnotes. The list should mention only those sources actually cited in the text or notes. Authors name should be same as in the original source. For more than one publication by the same author, list them in chronological order, with the older item first. For more than one publication in one year by the same author, use small lower case) letters to distinguish them (e.g. 1980a, 1980b). Following are some examples:• Books - Diwan Parag (2000) E-Commerce. New Delhi Excel Publication.• Ph.D. Thesis - Pant, RC (2000) ‘Performance Appraisal Techniques: A Tool or a Threat’Ph.D. thesis, BHU, Varanasi.• Journal - Luftman, J., and Kempaiah, R.,” An Update on Business-IT Alignment: “A Line” Has Been Drawn, MIS Quarterly Executive (6,3)
September 2007, PP. 165-175
Guidelines for Authors
OJASAN INTERNATIONAL JOURNAL OF RESEARCH IN MANAGEMENT
Expanding�Knowledge�Horizon

Jaipuria School of Business
Shakti Khand-IV, Indirapuram, Ghaziabad - 201014 (UP)Phone: 0120-4881100-20E-mail: [email protected] JAIPURIA at 52424Website: www.jaipuria.edu.in/pgdm
PGDM ADMISSION 2015
Jaipuria School of Business, an autonomous Institute
approved by AICTE. Established in 2008 by the noted
philanthropist industrialist, Dr. Rajaram Jaipuria. The
Institute has been rated by various agencies – AIMA, IMRB,
Business Today, GHRDC etc as upcoming ‘B’ School in
Northern India, and they hare ranked it at No.-2 in 2014.The
‘B’ School is in the process of being accredited by the
respective authorised accreditation agency.
• Task Parformance
• Role performance
• Situational Awareness and Understanding
• Teamwork
• Personal and Group Development
• Decision-Making and problem-solving
• Academic Knowledge and Skills
• Judgment.
Welcome to JAIPURIA an Integrated Business School
For Enquiries Call: 1800 103 3488
Admission open for PGDM 2015-17 (Batch)
110 Years of Excellence
01
Case Based Teaching
02
LiveProjects
03
Sctoral Projects
04
Lively Class Discussions
05
IndustrialVisit
06
Assignment& Evalua�on
07
SIP
Skill is the major “important ingredient” to push the
production possibility frontier outward and to take growth
rate of the economy to a higher trajectory. Skill building
could also be seen as an instrument to empower the
individual and improve his/her social acceptance or value.
We at Jaipuria School of Business make endeavour to
develop the student’s individual, and collective skills
through “case based teaching”, “live projects”, “sectoral
projects”, Interactive classes”, “industrial visits”, “Six Sigma
Green Belt” etc. etc.
In fine, we believe in “if you let me experience, I will learn”.
In the process we do help our students to acquire the skills
and hone up their individuality, with their inherent skills, in
their journey to be genius.