
Oil Price Shocks and Stock Market...
50
1 Master Thesis Spring 2014 Oil Price Shocks and Stock Market Returns: A study on Portugal, Ireland, Italy, Greece and Spain Supervisor: Authors: Martin Strieborny Anette Brose Olsen Paul Henriz
Transcript of Oil Price Shocks and Stock Market...

1
Master Thesis
Spring 2014
Oil Price Shocks and Stock Market Returns:
A study on Portugal, Ireland, Italy, Greece and Spain
Supervisor: Authors:
Martin Strieborny Anette Brose Olsen
Paul Henriz

2
ABSTRACT Following the oil price shocks of the 1970s, a great deal of research has been focused on the
relationship between oil price changes and macroeconomic variables. However, the body of
literature focusing on oil price shocks and stock markets are more limited. In our thesis, we
have decided to focus on five OECD countries: Portugal, Ireland, Italy, Greece and Spain,
commonly known as the PIIGS economies in financial markets due to their high levels of debt
and budget deficits in the aftermath of the Eurozone crisis of 2008/2009.
The primary purpose of this study is to examine the relationship between oil price shocks and
stock market returns. We employ an unrestricted vector autoregressive (VAR) model
containing five variables in order to assess the different effects. We have chosen a linear
specification of the world real oil price, and also included other variables connected to stock
market returns. These variables are short-term interest rate, long-term interest rate and
industrial production. The sample period contains monthly observations from 1993m07 to
2014m01. We have also divided the sample into a subsample covering the years from
1993m07 to 2008m08, to be able to compare the period with and without the financial crisis.
Our main results show indications of a negative impact of linear oil price shocks on real stock
returns in all countries. This effect was, however, statistically insignificant. The same applies
for the interest rates. When dividing the sample, and excluding the financial crisis, we saw
from the forecast error variance decomposition results an increase in the contribution of the
real oil price to the variability in real stock returns.

3
Table of Contents
ABSTRACT 1. INTRODUCTION ......................................................................................................................................... 5
2. THEORETICAL BACKGROUND .......................................................................................................... 6 2.1. OIL PRICE FLUCTUATIONS ...................................................................................................................................... 6 2.2. OIL PRICE AND STOCK RETURNS ........................................................................................................................... 8 2.3. INTEREST RATES AND STOCK RETURNS ............................................................................................................... 9
3. LITERATURE REVIEW ............................................................................................................................. 10 3.1. OIL PRICE SHOCKS AND THE MACROECONOMY ................................................................................................ 10 3.2. OIL PRICE SHOCKS AND STOCK MARKETS ......................................................................................................... 11
4. DATA ............................................................................................................................................................. 14 4.2. DATA COLLECTION ................................................................................................................................................. 14 4.3. DATA DESCRIPTION ............................................................................................................................................... 14 4.4. DESCRIPTIVE STATISTICS ...................................................................................................................................... 16
5. METHODOLOGY ..................................................................................................................................... 18 5.1. UNIT ROOT TESTS .................................................................................................................................................. 18 5.2. COINTEGRATION TEST ........................................................................................................................................... 19 5.3. VECTOR AUTOREGRESSIVE MODEL ..................................................................................................................... 20 5.4. LAG LENGTH SELECTION ....................................................................................................................................... 20 5.6. IMPULSE RESPONSE ............................................................................................................................................... 21 5.8. ORDERING ................................................................................................................................................................ 22
6. RESULTS ..................................................................................................................................................... 22 6.1. UNIT ROOT TESTS .................................................................................................................................................. 22 6.2. COINTEGRATION TEST ........................................................................................................................................... 23 6.3. VECTOR AUTOREGRESSIVE MODELS ................................................................................................................... 25 6.5. IMPULSE RESPONSE ............................................................................................................................................... 26 6.6. VARIANCE DECOMPOSITION ................................................................................................................................. 30
7. DISCUSSION .............................................................................................................................................. 33
8. CONCLUSION ........................................................................................................................................... 35
REFERENCES ................................................................................................................................................... 37
APPENDICES.................................................................................................................................................. 42

4
List of Figures
Figure 1: Brent crude oil price fluctuations (1993m07-2014m01)……………………………7
Figure 2: Orthogonalized impulse response function of real stock returns to world real oil
price shocks in VAR (d(irs), d(irl), dlog(op), dlog(ip), rsr). ……………………………………28
List of Tables:
Table 1: Summary statistics for world real oil price, dlog(op)………………………………17
Table 2: Summary statistics for real stock returns, rsr……………………………………….17
Table 3: ADF and DF-GLS unit root tests……………………………………………….......24
Table 4: Summarizing table of the results of the impulse response of real stock returns to
shocks to short-term interest rate, long-term interest rate, world real oil price and
industrial production, with a 95% confidence level, for the whole sample
period………………………………………………………………………………….28
Table 5: Summarizing table of the results of the impulse response (pre-crisis) of real stock
returns to shocks to short-term interest rate, long-term interest rate, world real oil
price and industrial production, with a 95% confidence level…………………..........29
Table 6: Variance decomposition of forecast error variance of real stock returns due to
irs, irl, op and ip after 12 months………………..…………..………………………30
Table 7: Variance decomposition of forecast error variance in real stock returns due to
irs, irl, op and ip after 12 months…………………………………………………...31

5
1. Introduction Following the 1970’s, the until then, fairly steady oil price behavior changed and there was an
increased interest in investigating the relationship between the oil price and macroeconomic
variables. One of the first to examine this relationship was Hamilton (1983) demonstrating a
negative relation between the oil price and economic growth. Jones and Kaul (1996) made a
contribution to the literature on oil price and stock markets by demonstrating a negative oil
price effect on aggregate stock returns. Since then, there is a growing body of literature on the
subject employing different samples, time periods and estimation techniques. Furthermore,
there are also variations in which variables that are included in the analyses. Besides
including the variable on the oil price, there is an understanding on the importance of
including other variables that also might be able to explain changes in stock market returns.
In this context, previous studies on the oil price effect using a VAR model have included
variables such as short-term interest rates, industrial production and inflation rates.
In our thesis, following existing literature e.g. Sadorsky (1999) and Park and Ratti (2008), we
will be investigating the effect of oil price shocks on real stock returns in five OECD
countries. We have decided to focus on Portugal, Ireland, Italy, Spain and Greece, also known
as the PIIGS economies. This acronym gained popularity in financial markets after the
Eurozone crisis, referring to the heavily indebted countries. No other empirical studies, as we
are aware of, have examined this group of countries together, in the context we are interested
in. Furthermore, we are also including the variable long-term interest rate in order to see if the
impact on real stock returns will differ.
In our empirical analysis we have employed an unrestricted vector autoregressive (VAR)
model consisting of five variables. These variables are; short-term interest rate, long-term
interest rate, world real oil price, industrial production and real stock returns. Hence, we will
also look at the effect on real stock returns of shocks to other variables as well. Regarding the
oil price, we have decided to focus our analyses on a linear specification and hence will no
other specifications be applied. Neither will we make the distinction between oil price shocks
driven by supply and demand as documented by Killian (2008).
Our chosen sample period contains monthly observations from 1993m07 to 2014m01. We
have also investigated a subsample from 1993m07 to 2008m08 in order to assess the ‘normal’
macroeconomic conditions before the financial crisis peaked. Furthermore, we can then

6
compare the results from the different samples in order to see whether the results will greatly
differ or not.
We found little evidence of an impact of linear oil price shocks on real stock returns in all
sample countries. We were able to determine the direction of the effect, which was as
expected and according to theory, but our results were however statistically insignificant. The
same applies for the results on both interest rates. When dividing the sample, and excluding
the financial crisis period, we saw from the forecast error variance decomposition results an
increase in the contribution of the real oil price to the variability in real stock returns.
The thesis will be structured in the following way. First we will consider some theoretical
background, where we have included some history on oil price fluctuations and the link
between oil price and stock returns is investigated. We have also included a short section on
the relation between interest rates and stock returns. The following chapter is a literature
review assessing the relation between both oil price shocks and the macroeconomy, and oil
price shocks and stock markets. In chapter 4 we describe the data used in our analyses and
chapter 5 explains the empirical models applied. The results from the empirical analyses are
presented in chapter 6 and discussed in chapter 7. Finally, the last chapter concludes and
proposes suggestions for further research.
2. Theoretical Background
2.1. Oil Price Fluctuations Crude oil is one of the most basic global commodities, making every country dependent on oil
from both a producers’ and consumers’ point of view. This implies that fluctuations in crude
oil prices have great impact on the global economy. Important factors that are considered to
drive crude oil prices are production, inventory, natural causes and demand for oil (URL 1).
The majority of global oil production comes from the Organization of Petroleum Exporting
Countries (OPEC) nations. According to OPEC’s annual Statistical Bulletin 2013, more than
81 % of the world’s oil reserves are located in the OPEC member countries (URL 2).
Consequently, the decisions made by these nations regarding raising the price of oil or
reducing the production will affect the price of crude oil on the international market. When it
comes to the demand side, global demand is affected by both current conditions and future
expectations. The demand for crude oil is considered to rise with increased economic growth

7
and demand from emerging countries. Yan (2012) argues that the relation between oil supply
and oil demand in the international market is the most obvious and direct factor affecting the
international oil price, where he mentions that limited supply capability and instability of oil
production in OPEC affect oil supply.
When analyzing the fluctuations in the price for crude oil on a global basis it is commonly
accepted to start at the period after World War II due to the infant stage of the oil industry
prior to this (Yan 2012). Following the years after World War II, there were no major oil
price fluctuations until the 1970s where several oil price shocks took place. In 1986,
following the Iran-Iraq War in the early 1980s, the world experienced an oil prices collapse
where the price of oil dropped from $27/barrel in 1985 to $12/barrel in 1986. Following this,
the oil price was stabilized and increased to more normal levels. During the Persian Gulf War
in 1990-1991 the oil price experienced a spike, which was followed by a drop after the war
ended. The same applies for the Asian financial crisis in 1997, where one could see
historically low levels in 1998 when the price dropped below $12 a barrel (Hamilton, 2010).
After this there was a period of resumed growth.
World oil price experienced an exceptional volatility during the 2008 financial crisis, with
prices ranging from a peak at nearly $150 per barrel in July to a low of around $40 per barrel
in December (EIA report 2013). In the following years the oil price moved in a range between
$90 and $130 per barrel. Future expectations for improved economic growth in the years
following the global recession of 2008-2009 and unrest in North Africa and the Middle East
have helped keeping prices relatively high, with Brent crude oil spot price averaged $112 per
barrel in 2012.
Figure 1: Brent crude oil price fluctuations (1993m07-2014m01)
0
10
20
30
40
50
60
70
1994 1996 1998 2000 2002 2004 2006 2008 2010 2012
Real world oil price

8
2.2. Oil Price and Stock Returns From a theoretical point of view, oil price fluctuations can affect financial markets through
various channels. An increase in the price of oil, by affecting economic activity, corporate
earnings, inflation and monetary policy has implications for asset prices and hence also
financial markets (Mussa 2002 p.26, IMF working paper).
The link between oil and stock prices can be explained by considering the valuation method
based on the Discounted Cash Flows (DCF) approach, following previous work of Huang et
al. (1996). According to this approach, the value of a company and hence the value of its
stock is said to be equal to the sum of expected future cash flows discounted by the discount
rate (e.g. average cost of capital). Hence, systematic movements in expected cash flows and
discount rates will have an effect on stock returns. The price of oil can affect these two
“channels” in various ways due to different causes. Oil is a real resource and an essential
input in the production of many goods, implying that future oil prices can have an impact on
expected cash flows. Higher crude oil prices lead to higher energy prices, which will have an
effect on costs for all business and industry aspects dependent on energy. Hence, expected
changes in energy prices result in similar changes in expected costs and opposite changes in
stock prices. Regarding the effect on a specific stock, the outcome depends on whether the
company is a net producer or net consumer of oil in which an oil price increase would result
in higher earnings for the producer and decreased earnings for the consumer. For the world
economy as a whole however, oil is an input and therefore increases in oil prices would
depress aggregate stock returns (Huang et al 1996 p.5).
Oil prices can also affect stock returns through the discount rate. According to economic
theory, expected discount rate consists of the expected inflation rate and the expected real
interest rate both which may also depend on expected oil prices. In this context, for a net oil
importing country, higher oil prices will have a negative effect on the trade balance and hence
put a downward pressure on the country’s foreign exchange rate and an upward pressure on
the domestic inflation rate. Therefore, a higher expected inflation rate is positively related to
the discount rate and negatively related to stock returns. Since oil is a major resource in the
economy, the real interest rate is also affected by the oil price. Considering a situation with
higher oil prices relative to the general price level, the real interest rate may increase forcing a
rise in the rate of return on corporate investment which in turn lead to a decline in stock prices
(Huang et al. 1996 p.6).

9
2.3. Interest Rates and Stock Returns As mentioned above, the discount rate in the DCF model is a risk adjusted required rate of
return, which is said to be equalized the level of interest rates in the economy (Panda, 2008
p.107). From a theoretical point of view, according to this model, the relationship between
interest rates and stock prices is found to be negative in which an increase in the interest rates
directly leads to a decline in the present values of stocks resulting in a decline in stock prices.
Furthermore, increasing interest rates also reduce the profitability of firms, leading to a
reduction in cash flows and a decrease in stock prices.
Panda (2008) also mentions another reason for the negative relationship. When taking into
account that interest rates are risk free returns on bonds, one can demonstrate that when
interest rates on bonds increase the attractiveness of bonds compared to stocks also increase.
Hence, there is a reallocation in assets in favor of the bonds market where funds move from
the stock market to the bond market increasing the demand for bonds and reducing the
demand for stocks. This again leads to a decline in the price of stocks, which in turn lowers
stock returns. The opposite holds for an interest rate reduction.
Regarding the empirical work on interest rates and stock prices, various studies such as
Rigobon and Sack (2004), have found a negative relation between short-term interest rates
and stock returns. However, there are a limited number of studies focusing on the effect of
long-term interest rates in this context. In his study, Panda (2008) investigated the relationship
between the Indian stock market and both short-term and long-term interest rates for the
period 1996-2006. In his analysis, the short-term interest rate had a positive effect on stock
prices. Furthermore, he used the month-end yields on 10-year government security as a proxy
for the long-term interest rate, and found its effect on stock prices to be negative. Zhou (1996)
emphasizes the importance of long-term interest rates in explaining the fluctuations in the
stock markets. He found that the short-term interest rate contains very little information on the
movements in the stock market, while the long-term rate played an important role in relation
to the changes. Durre and Giot (2005), found a short-term impact of long-term government
bond yield on the stock market in their cointegration analysis on 13 countries from 1973-
2003.

10
3. Literature Review
3.1. Oil Price Shocks and the Macroeconomy Following the oil price shocks of the 1970s, there has been an increasing amount of studies
focusing on how oil price shocks affect economic activity and macroeconomic performance.
One of the first to investigate this relationship is Hamilton (1983) who found a strong
correlation between oil price changes and gross national product growth using a vector
autoreggresion (VAR) methodology, where he demonstrated that increases in oil price led to a
fall in real GNP in the U.S. Following this result, Hamilton argued that oil price increases has
been responsible for almost every recession in the U.S. between the end of World War II and
1973. Gisser and Goodwin (1986) also provide supporting evidence on Hamilton’s findings
for the U.S. macroeconomy, using alternative data and estimation techniques. Since then,
Hamilton’s research has been expanded using different samples and different estimation
techniques.
Following the 1986 oil price collapse and the resulting macroeconomic fluctuations, Mork
(1989) extended Hamilton (1993)’s analysis by allowing for asymmetric effects in the oil
price changes where he looked at both oil price increases and decreases. Research on the
asymmetric effects of oil price fluctuations received support after it became evident that the
sharp decrease in crude oil prices in 1986 was in fact not followed by economic expansion, as
one might expect (Kilian 2008 p.889). Studies had demonstrated that the oil price increase of
1979 was followed by a recession, so after the decrease in 1986 an economic expansion was
viewed as a reasonable outcome.
In his paper, Mork (1989) found support for Hamilton’s results on the strong negative
correlation between oil price increases and real GNP, which also showed persistency in a
longer sample covering the oil price drop in 1986 and also after the introduction of price
controls. He did not, however, find any significant effects on oil price decreases although he
concluded that the two effects are significantly different. Mork et al. (1994) again expanded
the analysis on oil price movements and GDP fluctuations by including another six OECD
countries in the sample, in addition to the U.S. They also found evidence for the negative
correlation when extending the sample through 1992. Furthermore, they demonstrated the
presence of asymmetric effects in the results for most of the countries in which the U.S.
showed the strongest effect. The only exception where Norway, where oil price increases
showed a positive effect on the economy and decreases resulted in a negative effect.

11
In more recent studies Cuñando and Pérez de Gracia (2003) and Cologni and Manera (2008)
shed light on other macroeconomic variables as well. Cuñando and Pérez de Gracia (2003)
investigates the effect of oil price shocks on inflation and industrial production growth rates in
15 European countries using quarterly data from 1960 to 1999 and four different proxies for
oil price shocks. They found that shocks to the oil price have permanent effect on inflation
while the effect on industrial production is short-lived and asymmetric. Furthermore, their
results become more significant when using national oil price instead of world oil price.
Cologni and Manera (2008) also find a long-run equilibrium relationship between oil prices
and inflation rates for the G7 countries using a structural co-integrated VAR model with
quarterly data for the period 1980 to 2003.
3.2. Oil Price Shocks and Stock Markets Previous studies have demonstrated various results on the effects of oil price shocks on
international stock markets, and no consensus has been made on the matter. One of the first
papers to examine the relationship between oil price shocks and stock markets is a study by
Jones and Kaul (1996), focusing on the U.S., Canada, The U.K. and Japan, using quarterly
data for the period 1947-1991. They use the Producer Price Index for Fuels as a measure for
oil price, and investigate whether oil price shocks’ impact on stock markets can be explained
by current and future cash flows and/or changes in expected returns. Their results demonstrate
a negative oil price effect on aggregate stock returns. The effect, however, was not that strong
for the U.K. and Japan.
Opposing the finding of Jones and Kaul, is a study by Huang et al. (1996). They focus their
research on the relationship between daily oil futures returns and daily U.S. stock returns for
the sample period 1979-1990. By using a VAR approach they find evidence that oil future
returns do lead some individual oil company stock returns, but do not find any impact on
aggregate stock returns. Supporting this result by looking into economic forces and the stock
market, Chen et al. (1986) find no overall effect of oil price changes on asset prices in the
U.S. for the period 1959 to 1984.
Since then, there is a growing body of literature and empirical studies investigating the
relationship between oil prices and stock market activity. Sadorsky (1999) estimates an

12
unrestricted VAR model using monthly data from the U.S. for the period 1947:1-1996:4. By
defining real stock return as the difference between continuously compounded return on the
S&P 500 and the consumer price index (as a measure for inflation), he investigates the
importance of oil prices and oil price volatility in explaining movements in stock returns. In
his paper, Sadorsky finds evidence of a negative oil price effect by demonstrating that
positive oil price shocks depress stock returns. His results also show evidence of a change in
oil price dynamics after 1986 by demonstrating that movements in the price of oil explains a
greater fraction of the forecast error variance in real stock returns than the interest rate after
this year.
Adding to the list of papers finding a negative oil price effect in the U.S. stock market is
Killian and Park (2009) who uses a structural VAR model with monthly data covering the
period 1973-2006. One of their main results states that in the long run, on average, 22 % of
variations in aggregate stock returns can be explained by shocks to the oil price. They, as
Killian (2009), also make the distinction between demand and supply shocks and emphasizes
in their study the importance of the demand-shock channel.
Extending the analysis to other industrialized countries is, among others, Papapetrou (2001)
using a multivariate VAR approach to investigate the dynamic relationship between oil prices,
real stock prices, interest rates, real economic activity and employment for Greece using
monthly data for the period 1989:1 to 1999:6. She demonstrates that oil price shocks have a
negative effect on stock prices through its immediate negative impact on output and
employment.
Park and Ratti (2008) find that oil price shocks have a negative statistical significant impact
on stock returns for the U.S. and 13 European countries, where the results are more significant
using world real oil price. They estimate a multivariate VAR model with monthly data from
1986:1 to 2003:4 using both linear and non-linear specifications of oil price. Apergis and
Miller (2009), on the other hand, only find a small effect of oil price shocks on international
stock markets using a VAR methodology with monthly observations from 1981 to 2007 for
sample countries Austria, Canada, France, Germany, Italy, Japan, the U.K. and the U.S.
Nandha and Faff (2008) focus their analysis on industry level by investigating 35 global
industry indices from DataStream for the period 1983:4 to 2005:9. They find that oil price

13
increases have a negative impact on equity returns for all sectors, except for mining and oil &
gas industries. Moreover, they oppose results by Mork (1989) and Mork et al. (1994) by
showing evidence of a symmetric oil price effect.
There are also various papers emphasizing the importance of emerging economies and their
economic importance regarding both oil production and consumption. Basher et al. (2012)
investigating the dynamics between oil prices, emerging market stock prices and exchange
rates, find that positive shocks to oil price tends to depress stock prices. They use a six-
variable structural VAR methodology with monthly data from 1988:1 to 2008:12. Also
adding to the literature on emerging stock markets are Basher and Sadorsky (2006) who looks
into oil price risk and its impact on stock market returns. They evaluate the relationship
between movements in oil price and stock market returns in 21 emerging markets by using
both unconditional and conditional risk analysis finding. Their results show that oil price risk
to be positive and statistical significant in pricing emerging market stock returns in the
majority of the models.
In a more recent study, Cunando and Perez de Gracia (2013) studies 12 European oil-
importing countries using a VAR and VECM methodology for the period 1973-2011. They
find that oil price changes have a significant and negative impact on stock market returns in
most of the countries in the sample. By making the distinction between oil supply and demand
shocks, they also show that oil supply shocks demonstrate a greater negative effect on real
returns using both world oil price and local oil prices.
The distinction between oil exporting and oil importing countries has also been made in the
literature on oil price shocks and stock markets. Examples of studies with this focus are
Bjornland (2008), Wang et al. (2013) and Güntner (2011). Bjornland (2008) look at how oil
price changes affect stock prices indirectly through monetary policy responses in Norway, an
oil exporting country. She demonstrates a positive effect of oil price increases where higher
oil prices increase stock returns through the economy’s response to increase in prices by
increasing aggregate wealth and demand.
In our thesis, by employing an unrestricted VAR model, we will be using the same linear
specification for the world real oil price as Park and Ratti (2008). We will, however, be
investigating a group of countries not studied together in this context before, as far as we are

14
aware of. Furthermore, by including data on both short-term and long-term interest rates we
are trying to shed light on the different effects these two different rates may have on real stock
returns.
4. Data
4.2. Data Collection The literature review reveals a broad range of empirical research covering a variety of data
series, countries, time periods and use of methodology. In this thesis we will examine how oil
price shocks affect stock markets in five OECD countries, namely Portugal, Ireland, Italy,
Greece and Spain. Our sample period contains monthly observations for the period April 1993
to January 2014. The starting point for our sample is justified by difficulties collecting data
for all variables for all the countries for periods previous to this. Furthermore, our main
purpose of the study is to investigate how oil price shocks affect stock market returns, with
and without the period around the financial crisis in 2008/2009. We therefore believe that we
have enough observations from our chosen sample period to be able to draw some
conclusions and make indications.
In accordance with economic theory and previous empirical studies we include the following
variables in our empirical analysis: stock prices, oil price, real industrial production and short-
term interest rates. We also include the variable long-term interest rate to make distinctions
between the effects of the two interest rates.
Data on stock price indices and industrial production was collected from the Organization for
Economic Cooperation and Development (OECD) from their Main Economic Indicator (MEI)
database. Short-term and long-term interest rates were also taken from OECD, except for the
series for Greece which were collected from Thomson Reuters DataStream (DS) due to
missing observations for the period prior to 2001 in the OECD database. Data on the oil price
is from the U.S. Energy Information Administration (EIA).
4.3. Data Description Data on the stock price indices refer to quoted prices, excluded dividend payments, from the
Dow Jones EURO STOXX Index for the Euro area (OECD Factbook 2010). The monthly

15
indices are generally computed as averages of daily closing quotes with 2005 as a base year,
and prices are expressed in nominal terms.
In line with previous empirical literature, see for example Park & Ratti (2008), Cunando &
Perez de Gracia (2014) and Sadorsky (1999), we define real stock market returns as the
difference between continuously compounded returns on stock price index and the log
difference in the consumer price index as a proxy for inflation. The variable, real stock return,
measures the return on investment after taking inflation into account.
(
) (
)
In the world market for crude oil, there are three different oil price measures considered main
benchmarks, namely West Texas Intermediate, Brent and Dubai. Since our study considers
European countries we chose to use the Europe Brent Spot Price FOB expressed in dollars per
barrel. Furthermore, although Brent is essentially drawn from oil fields located in the North
Sea, it is considered to be a good indicator of global oil prices (URL 3). The world oil price is
adjusted for inflation by deflating the nominal price by the U.S. Producer Price Index for fuels
& related products & power to get the world real oil price.
Real industrial production is defined as the nominal industrial production deflated by the
consumer price index of each country. The real industrial production variable is included in
the analysis as a measure of real economic activity, following previous studies such as
Cunando and Perez de Gracia (2014), Sadorsky (1999) and Park and Ratti (2008). Empirical
evidence from Fama (1990) and Chen et al. (1996) have found correlation between stock
returns and aggregate real activity in the U.S., and others have found similar results for other
sample countries.
Like other existing empirical articles we include the variable short-term interest rate.
According to the OECD’s MEI database, short-term interest rates are usually associated with
Treasury bill, Certificates of Deposit or comparable instruments, each of three-month
maturity (URL 4). For the Euro-area the OECD database uses 3-month “European Interbank
Offered Rate” from the date which the country joined the Euro. Since Greece did not join the

16
Euro until 2001, we collected data on short-term interest rate for this specific country from
DataStream where the variable is defined as the IMF-IFS 3-month Treasury bill.
The interest rate may affect stock returns in different ways through different channels. The
Neoclassical theory argues that increases in interest rates raise the cost of capital making
loans more expensive for business owners. This again may result in reduced investment
activity, lower spending and output, reduced profits and hence reduced stock market value.
(Blanchard 1981). As mentioned in the theoretical background section, higher interest rates
may also affect stock markets by increasing the attractiveness of investing in bonds, implying
a decrease in equity-investments, which again depresses stock returns
The long-term interest rate refers to government bonds with a residual maturity of about ten
years (OECD Factbook 2014). The same definition applies for Greece, where the data was
collected from DS. The long-term interest rate is included in the analysis due to the findings
listed in the theoretical background section emphasizing the importance of the rate.
Other variables used in the analysis are the consumer price index and the producer price
index. The producer price index was collected from the Federal Reserve Economic Database
of the U.S. Federal Reserve Bank of St. Louis, while the consumer price index is from the
OECD database.
All variables, except the interest rate variables, which are already in ratios, are in natural
logarithms.
4.4. Descriptive Statistics In table 1 below, the summary statistics for the world real oil price variable, dlog(op), is
listed.

17
Table 1:
As seen from the table, the summary statistics for the world real oil price changes
demonstrates a slightly positive mean, which indicate that oil price increases has been
somewhat larger than oil price decreases in our sample period. The highest increase is
20.26% took place at 1999m03. The minimum value of -22.77% corresponds to the greatest
decrease in the sample. This decrease was observed in 2008m11, which was during the
financial crisis. Regarding the standard deviation of 7.54 %, it is clear that the real oil price
demonstrates a high volatility.
The summary statistics demonstrates a skewness of -0.459 and kurtosis of 3.792, indicating a
non-normal distribution.
Table 2:
Table 2 displays the summary statistics for the real stock return, rsr, variable for the five
countries. As seen from the table, the mean returns of all countries, except for Greece, is
Summary statistics for world real oil price, dlog(op).
dlog(op)
Mean 0.5581
Maximum 20.26
Minimum -22.77
Std. Dev. 7.538
Skewness -0.459
Kurtosis 3.792
No. of obs. 246
Notes: Mean, maximum, minimum and std. dev is in percent.
Summary statistics for real stock returns (rsr)
Variable Mean Maximum Minimum St.Dev Skewness Kurtosis No. of obs.
Portugal
0.325
14.416
-23.081
4.729
-0.751
5.615
246
Ireland
0.231 11.149 -30.389 4.887 -1.592 9.359 246
Italy
0.042 13.663 -24.083 5.029 -0.979 7.052 246
Greece
-2.221 30.017 -33.337 7.445 -0.078 5.406 246
Spain
0.291 14.933 -18.579 4.858 -0.777 4.838 246
Notes: Summary statistics for real stock returns. Mean, maximum, minimum and standard deviation are denoted in percent.

18
positive. The highest standard deviation (volatility in stock returns) is found in Greece, while
the lowest is observed in Portugal. Here, one can also see evidence of non-normal distribution
properties.
5. Methodology The following section outlines the methodology and the empirical tests performed in our
analysis. The choice of empirical models was based upon previous research on oil price
shocks and stock market activity. All regressions have been carried out using the software
package EViews.
5.1. Unit Root Tests The first step in the statistical analysis, when working with time series, is to examine the
necessary condition of stationarity in the variables. Considering a time series,
Yt , the series is
said to be stationary if the distribution of the variable does not depend upon time, that is the
mean and the variance of the time series are constant over time (Verbeek, 2012). The
presence of unit roots in the times series can lead to non-stationarity in the variables. When
running regressions on non-stationary time series the regression might be spurious, resulting
in a non-reliable t-statistic. Furthermore, results from spurious regressions might also show a
significant economic relationship, even when this is not the case (Brooks, 2008).
There are several methods to test for stationarity in time series. In this thesis we will apply the
Augmented Dickey-Fuller (ADF) test and the DF-GLS test. The ADF test is based on the
Dickey-Fuller test introduced in the 1970s by David Dickey and Wayne Fuller. The basic test
was employed to investigate the presence of unit roots in first-order autoregressive models.
Considering an AR(1) process:
For ease of computation and interpretation, the process is transformed to the following
expression where :
Testing for stationarity implies to test the null hypothesis that states that the time series is
non-stationary, against the alternative hypothesis. That is:

19
Since the Dickey-Fuller test is restricted to include only one lag, the Agumented Dickey-
Fuller (ADF) test was introduced to test for stationarty in models with more complicated
dynamics. The hypothesis for stationarity is the same as for the original DF test. The extended
test equation is now expressed by:
∑
The other unit root test that will be applied in the thesis, the DF-GLS unit root test, is a
modified Dickey-Fuller test introduced by Elliott, Rothenberg and Stock in their 1996
Econometrica article. With their test, they proposed a more efficient test with higher power by
modifying the Dickey-Fuller test statistic using a generalized least squares rationale (Elliott et
al., 1996).
5.2. Cointegration Test After testing the variables for stationarity, we conduct the Johansen and Juselius (1990) test
for cointegration for the variables containing a unit root in order to check for any common
stochastic trend in the non-stationary variables. In this context, two non-stationary time series
are cointegrated if there is a linear combination of them that is stationary.
The Johansen and Juselius framework applied allows for the testing of more than one
cointegrating vectors in the data by estimating the maximum likelihood estimates on these
vectors. Two test statistics, trace statistic ( ) and max-eigenvalue , are used to
determine the number of cointegrating vectors (Brooks, 2008). The two test statistics are
expressed as follows:
∑
where r is the number of cointegrating vectors under the null hypothesis, g is the number of

20
variables and are the ordered eigenvalues. For each value of r, for the given orders: (r=0, 1,
2, 3...g-1), the test statistic is compared to the critical value to determine the number of
cointegrating vectors. If the test statistic is greater than the critical value, then the null
hypothesis of r=0 cointegrating vector is rejected in favor of the alternative hypothesis and
one check the critical value for r=1. If the test statistic is lower than the critical value,
however, the null hypothesis of no cointegrating vectors is not rejected.
For the test, the null hypothesis is that the number of cointegrating vectors is less than
or equal to r, against an unspecified or general alternative that there are more than r (Brooks,
2008 p. 351). For the test, the null hypothesis is that there is r cointegrating vectors,
against the alternative of r+1.
5.3. Vector Autoregressive Model In line with previous empirical research on the relationship between oil price shocks,
economic activity and stock markets, we have chosen to use an unrestricted Vector
autoregressive (VAR) model to study the interactions between the oil price and the stock
market return. The main advantage of this model, introduced by Sims (1980), is its ability to
capture the dynamic relationship among the variables of interest. A VAR model consists of a
system of equations that expresses each variable in the system as a linear function of its own
lagged value and the lagged value of all the other variables in the system (Park and Ratti,
2008 p.2594). A VAR model of order p, where p denotes the number of lags, that includes k
variables, can be expressed as:
∑
where [ ] is a column vector of observations on the current values of all
variables in the model, is a matrix of unknown coefficients to be estimated, is a
column vector of deterministic constant terms and is a column vector of error terms. The
error terms are assumed to be zero-mean independent white noise processes. Furthermore,
they are uncorrelated but may be contemporaneously correlated (Park and Ratti, 2008).
5.4. Lag Length Selection When applying an unrestricted VAR model it is required that the same number of lags of all
of the variables is used in all the equations of the system. Therefore, the optimal lag length for

21
the VAR model has to be determined by employing information criteria. Verbeek (2012,
p.310) suggests the use of Akaike’s information criterion (AIC) or the Schwarz’s Bayesian
information criterion (BIC) when deciding the appropriate lag length. Information criteria
include two factors: a term that is a function of the residual sum of squares (RSS) and a
penalty term which is the loss of degrees of freedom from adding extra parameters Brooks
(2008, p.232). Hence, adding a new variable or an additional lag to the model will have to
effects on the information criterion where the RSS will fall but the value of the penalty term
will increase. Therefore, the object is to choose the number of parameters that minimizes the
value of the information criteria. In general, the model with the lowest AIC or BIC will be
preferred. The question then becomes which model should be the preferred model. As seen
from the formulas:
Akaike (1974) information criterion (AIC):
∑
Schwarz Bayesian (1979) information criterion (BIC):
∑
BIC tends to favor a more parsimonious model since it gives a bigger “penalty” then AIC
does. According to Brooks (2008), BIC is strongly consistent, but AIC is generally more
efficient. Moreover, the BIC will be consistent to show the true model in the data set
(Verbeek, 2012, p.66) However, one can also argue that AIC is a more preferable in smaller
samples due to the fact that extra parameters may approximate misspecifications in the model
(Verbeek, 2012 p.310). We will apply both of these information criterions and compare the
results in order to choose the appropriate number of lags for our model.
5.6. Impulse Response An impulse response function examines the responsiveness of the endogenous variables in the
VAR to shocks to each of the variables (Brooks, 2008 p. 299). That is, for each variable from
each equation separately, a unit shock is applied to the error and the effects upon the VAR

22
over time is demonstrated. A shock to the i-th variable will have a direct effect on the i-th
variable, but is also transmitted to the other endogenous variables through the dynamic
structure of the VAR model. Given that the system is stable, the shock should gradually die
away. A shock to each of the n variables in the VAR system results in n impulse response
functions and graphs, giving a total of n x n graphs showing these impulse response functions
(Wang, 2003, p. 65).
5.7. Variance Decomposition
Another test used to interpret VAR models is the forecast error variance decomposition.
According to Brooks (2008, p. 300), variance decompositions give the proportion of the
movements in the endogenous variables that are caused by their “own” shocks versus shocks
to the other variables in the model. Hence, the variance decompositions provides evidence
about the relative importance of each random innovation in affecting the variation of the
variables in the VAR (EViews 7 User’s Guide II, p.470). Furthermore, it is generally
observed that own series shocks explain the larger fraction of the forecast error variance of
the series in the VAR.
5.8. Ordering When estimating a VAR model, the ordering of the variables has an effect on the impulse
responses and variance decompositions. The ordering of the variables should therefore be
based on economic theory and/or supported by sensitivity analysis (Brooks, 2008 p. 314).
6. Results
6.1. Unit Root Tests In order to test whether the variables are stationary or not, unit root tests are conducted. We
have chosen to apply both the Augmented Dickey Fuller test (ADF) and the DF-GLS test. The
null hypothesis for both tests is that the series contain a unit root, that is that the series are
non-stationary. The results from the tests are reported in table 3.
Starting with the variable real stock returns (rsr), the variable is already first differenced in the
data transformation prior to regressions in EViews. We have therefore only included the

23
values for the unit root test in 1st difference for this variable. As sees from the table, rsr is
stationary in its first difference for all five countries. The oil price variable, log(op), is non-
stationary in level form leading to a failure to reject the null hypothesis of non-stationary at
the 5 % significance level. This also applies for the variables: irs, irl and log(ip). When
inducing first difference transformations on these variables, that is converting them to
percentage growth forms, all the time series become stationary and one can reject the null
hypothesis.
Hence, the following variables, in following forms are included in the VAR model:
d(irs): first difference of short term interest rate
d(irl): first difference of long term interest rate
dlog(op): first difference of natural logarithms of world real oil price
dlog(ip): first difference of natural logarithms of real industrial production
rsr: real stock returns
We will therefore be working with differentiated data (I(1)) in our analyses. These variables
can now be interpreted as monthly growth rates. Furthermore, all variables are seasonally
adjusted after the transformations making it easier to observe the underlying trends in the
data, and assess monthly fluctuations.
6.2. Cointegration Test The Johansen cointegration test is used to test for long-term equilibrium relationships between
non-stationary variables. Since we will be working with first differenced variables in our
analyses, which are all stationary in their respective differenced form, it will not be necessary
to employ a cointegration test. Consequently, we can run an unrestricted vector autoregressive
model on all five countries in our sample.
If we were to use non-stationary time series, and therefore would have to apply the
cointegration test, and detect presence of cointegrating vectors, econometric theory suggests
applying the vector error correction model (VECM). This model allows for built in
specifications restricting the long-run behavior of the endogenous variables to converge to
their cointegrating relationship while at the same time allowing for short-run adjustment
dynamics.

24
Table 3: ADF and DF-GLS unit root tests
irs irl log(op) log(ip) rsr ADF DF-GLS ADF DF-GLS ADF DF-GLS ADF DF_GLS ADF DF-GL
Variables in levels
Greece -2.76* -0.88 -2.36* -0.49 -1.23 -0.30 0.88 3.98
Ireland -1.78 -0.47 -1.90 -1.16 -1.23 -0.30 -3.77** 0.79
Italy -1.61 0.08 -1.63 -0.02 -1.23 -0.30 -0.03 0.78
Portugal -2.60* 1.10 -2.15 0.91 -1.23 -0.30 0.78 0.18
Spain -1.72 0.30 -1.52 -0.06 -1.23 -0.30 1.22 1.78
Variables in first differences
Greece -8.21*** -4.08*** -5.24*** -3.30*** -6.52*** -6.35*** -8.45*** -3.89*** -6.05*** -4.61***
Ireland -5.23*** -2.77*** -5.29*** -3.94*** -6.52*** -6.35*** -8.83*** -8.65*** -4.70*** -3.52***
Italy -4.81*** -1.91* -6.08*** -0.74* -6.52*** -6.35*** -4.68*** -4.32*** -5.29*** -2.04**
Portugal -7.13*** -0.79* -4.47*** -3.13*** -6.52*** -6.35*** -8.39*** -2.17** - 5.18*** - 1.87*
Spain -4.69*** 0.76* -5.67*** -1.66* -6.52*** -6.35*** -5.05*** -2.23*** -5.93*** -2.10**
Notes. ADF: Augmented Dickey-Fuller unit root tests, and DF-GLS unit root tests. *,** and *** means significant at 10%, 5% and 1% level respectively. Oil price (op)
and real industrial production (ip) are in logs, and rsr are computed according to the formula in the data description section.

25
However, studies by Engle and Yoo (1987), Clements and Hendry (1995) and Hoffman and
Rasche (1996) argue that an unrestricted VAR is a preferred model in the short-run setting
(especially regarding forecast error variance). Furthermore, Naka and Tufte (1997) find in
their stimulations that the two models perform almost identical at short-run impulse response
functions.
6.3. Vector Autoregressive Models The VAR model is employed to investigate the dynamic relationship between the variables in
question. The model will be investigated containing five variables.
The ordering of the variables is in line with earlier studies by Sadorsky (1999), Park and Ratti
(2008) and Cong et al. (2008). We have employed the following ordering: first difference of
short-term interest rate (d(irs)), first difference of long-term interest rate (d(irl)), first log
difference of world real oil price (dlog(op)), first log difference of real industrial production
(dlog(ip)) and real stock returns (rsr). Hence we are estimating the following model: VAR
(d(irs), d(irl), dlog(op), dlog(ip), rsr). This ordering will assume that interest rate shocks are
independent of contemporaneous disturbances to the other variables. This means that all
variables may have a contemporary effect on real stock returns but not the other way around.
Furthermore, real stock returns are placed last in the ordering (Sadorsky, 1999 p.455).
Ferderer (1996) also argues that by following an ordering with interest rate prior to oil price,
the influence of interest rates on real oil prices can be captured.We have also conducted
sensitivity analyses where we performed the tests with different orderings and got the same
results.
The optimal number of lags was chosen based on the information criterions, AIC and BIC,
mentioned in the methodology section. The number of lags that minimizes the value of
Schwarz’s Bayesian’s information criterion (BIC) is 1 for all five countries. The number that
minimizes the value of Akaike’s criterion (AIC) on the other hand is greater than BIC´s. AIC
suggests 2 lags for Portugal, 3 for Ireland, Italy and Spain, and 6 for Greece. Since the two
information criterions do not agree on the number of lags to be included in the VAR model,
we will estimate our model using both the lag length suggested by both BIC and AIC to see
whether the results become significantly different depending on which criterion we apply.

26
In order to be able to interpret the VAR model it is necessary to estimate impulse response
and variance decomposition functions, we therefor employ these analyses in order to
investigate the effect of oil price shocks on stock returns in our sample countries. We will also
look at how the other variables affect real stock returns by looking at their impulse responses
and variance decomposition functions as well.
We have performed tests covering the whole sample period, and then divided the sample into
a pre-crisis subsample from 1993m07 to 2008m08. We chose this end date for the sample
since according to Keeley and Love (2010), the crisis peaked around the time the Lehman
Brothers went bankrupt in September 2008. The pre-crisis subsample allows us to examine
the normal macroeconomic conditions before the financial crisis and its fluctuations hit the
economy. Initially, we also wanted to look at the financial crisis period in order to assess how
the results would be during this period. Unfortunately, there was not sufficient information in
this period to run regressions in EViews. We will therefore not be discussing the financial
crisis exclusively.
The VAR estimation outputs are presented in appendix A.
6.5. Impulse Response
In this section we will assess the results from the impulse response functions to see the effect
on real stock returns due to shocks to short-term interest rate, long-term interest rate, world
real oil price and industrial production for the five different sample countries.
Whole sample: 1993m07-2014m01
Impulse response functions (IRF’s) are estimated for the whole sample period from 1993m07
to 2014m01. Figure 2 shows the orthogonalized impulse response curves of real stock
returns from a one standard deviation shock to world real oil price. The analytical IRF’s are
applied to investigate the statistical significance of the impulse response functions. The
impulse response graphs of real stock returns due to shocks to the other variables are listed in
appendix B1.

27
Figure 2: Orthogonalized impulse response function of real stock returns to world real oil price
shocks in VAR (d(irs), d(irl), dlog(op), dlog(ip), rsr).
Greece Ireland
Italy Portugal
Spain
Notes: Model estimated with 1 lag according to BIC information criterion.
- .1
.0
.1
.2
.3
.4
2 4 6 8 10 12
Response of DIRS_SA to DIRS_SA
- .1
.0
.1
.2
.3
.4
2 4 6 8 10 12
Response of DIRS_SA to DIRL_SA
- .1
.0
.1
.2
.3
.4
2 4 6 8 10 12
Response of DIRS_SA to DLOGOP_SA
- .1
.0
.1
.2
.3
.4
2 4 6 8 10 12
Response of DIRS_SA to DLOGIP_SA
- .1
.0
.1
.2
.3
.4
2 4 6 8 10 12
Response of DIRS_SA to RSR_SA
-0.5
0.0
0.5
1.0
1.5
2 4 6 8 10 12
Response of DIRL_SA to DIRS_SA
-0.5
0.0
0.5
1.0
1.5
2 4 6 8 10 12
Response of DIRL_SA to DIRL_SA
-0.5
0.0
0.5
1.0
1.5
2 4 6 8 10 12
Response of DIRL_SA to DLOGOP_SA
-0.5
0.0
0.5
1.0
1.5
2 4 6 8 10 12
Response of DIRL_SA to DLOGIP_SA
-0.5
0.0
0.5
1.0
1.5
2 4 6 8 10 12
Response of DIRL_SA to RSR_SA
- .04
.00
.04
.08
.12
2 4 6 8 10 12
Response of DLOGOP_SA to DIRS_SA
- .04
.00
.04
.08
.12
2 4 6 8 10 12
Response of DLOGOP_SA to DIRL_SA
- .04
.00
.04
.08
.12
2 4 6 8 10 12
Response of DLOGOP_SA to DLOGOP_SA
- .04
.00
.04
.08
.12
2 4 6 8 10 12
Response of DLOGOP_SA to DLOGIP_SA
- .04
.00
.04
.08
.12
2 4 6 8 10 12
Response of DLOGOP_SA to RSR_SA
- .02
-.01
.00
.01
.02
.03
2 4 6 8 10 12
Response of DLOGIP_SA to DIRS_SA
- .02
-.01
.00
.01
.02
.03
2 4 6 8 10 12
Response of DLOGIP_SA to DIRL_SA
- .02
-.01
.00
.01
.02
.03
2 4 6 8 10 12
Response of DLOGIP_SA to DLOGOP_SA
- .02
-.01
.00
.01
.02
.03
2 4 6 8 10 12
Response of DLOGIP_SA to DLOGIP_SA
- .02
-.01
.00
.01
.02
.03
2 4 6 8 10 12
Response of DLOGIP_SA to RSR_SA
- .02
.00
.02
.04
.06
.08
2 4 6 8 10 12
Response of RSR_SA to DIRS_SA
- .02
.00
.02
.04
.06
.08
2 4 6 8 10 12
Response of RSR_SA to DIRL_SA
- .02
.00
.02
.04
.06
.08
2 4 6 8 10 12
Response of RSR_SA to DLOGOP_SA
- .02
.00
.02
.04
.06
.08
2 4 6 8 10 12
Response of RSR_SA to DLOGIP_SA
- .02
.00
.02
.04
.06
.08
2 4 6 8 10 12
Response of RSR_SA to RSR_SA
Response to Cholesky One S.D. Innovations ± 2 S.E.
.0
.1
.2
2 4 6 8 10 12
Response of DIRS_SA to DIRS_SA
.0
.1
.2
2 4 6 8 10 12
Response of DIRS_SA to DIRL_SA
.0
.1
.2
2 4 6 8 10 12
Response of DIRS_SA to DLOGOP_SA
.0
.1
.2
2 4 6 8 10 12
Response of DIRS_SA to DLOGIP_SA
.0
.1
.2
2 4 6 8 10 12
Response of DIRS_SA to RSR_SA
- .1
.0
.1
.2
.3
.4
2 4 6 8 10 12
Response of DIRL_SA to DIRS_SA
- .1
.0
.1
.2
.3
.4
2 4 6 8 10 12
Response of DIRL_SA to DIRL_SA
- .1
.0
.1
.2
.3
.4
2 4 6 8 10 12
Response of DIRL_SA to DLOGOP_SA
- .1
.0
.1
.2
.3
.4
2 4 6 8 10 12
Response of DIRL_SA to DLOGIP_SA
- .1
.0
.1
.2
.3
.4
2 4 6 8 10 12
Response of DIRL_SA to RSR_SA
- .04
.00
.04
.08
.12
2 4 6 8 10 12
Response of DLOGOP_SA to DIRS_SA
- .04
.00
.04
.08
.12
2 4 6 8 10 12
Response of DLOGOP_SA to DIRL_SA
- .04
.00
.04
.08
.12
2 4 6 8 10 12
Response of DLOGOP_SA to DLOGOP_SA
- .04
.00
.04
.08
.12
2 4 6 8 10 12
Response of DLOGOP_SA to DLOGIP_SA
- .04
.00
.04
.08
.12
2 4 6 8 10 12
Response of DLOGOP_SA to RSR_SA
- .04
-.02
.00
.02
.04
.06
2 4 6 8 10 12
Response of DLOGIP_SA to DIRS_SA
- .04
-.02
.00
.02
.04
.06
2 4 6 8 10 12
Response of DLOGIP_SA to DIRL_SA
- .04
-.02
.00
.02
.04
.06
2 4 6 8 10 12
Response of DLOGIP_SA to DLOGOP_SA
- .04
-.02
.00
.02
.04
.06
2 4 6 8 10 12
Response of DLOGIP_SA to DLOGIP_SA
- .04
-.02
.00
.02
.04
.06
2 4 6 8 10 12
Response of DLOGIP_SA to RSR_SA
- .02
.00
.02
.04
.06
2 4 6 8 10 12
Response of RSR_SA to DIRS_SA
- .02
.00
.02
.04
.06
2 4 6 8 10 12
Response of RSR_SA to DIRL_SA
- .02
.00
.02
.04
.06
2 4 6 8 10 12
Response of RSR_SA to DLOGOP_SA
- .02
.00
.02
.04
.06
2 4 6 8 10 12
Response of RSR_SA to DLOGIP_SA
- .02
.00
.02
.04
.06
2 4 6 8 10 12
Response of RSR_SA to RSR_SA
Response to Cholesky One S.D. Innovations ± 2 S.E.
- .1
.0
.1
.2
.3
2 4 6 8 10 12
Response of DIRS_SA to DIRS_SA
- .1
.0
.1
.2
.3
2 4 6 8 10 12
Response of DIRS_SA to DIRL_SA
- .1
.0
.1
.2
.3
2 4 6 8 10 12
Response of DIRS_SA to DLOGOP_SA
- .1
.0
.1
.2
.3
2 4 6 8 10 12
Response of DIRS_SA to DLOGIP_SA
- .1
.0
.1
.2
.3
2 4 6 8 10 12
Response of DIRS_SA to RSR_SA
- .1
.0
.1
.2
.3
2 4 6 8 10 12
Response of DIRL_SA to DIRS_SA
- .1
.0
.1
.2
.3
2 4 6 8 10 12
Response of DIRL_SA to DIRL_SA
- .1
.0
.1
.2
.3
2 4 6 8 10 12
Response of DIRL_SA to DLOGOP_SA
- .1
.0
.1
.2
.3
2 4 6 8 10 12
Response of DIRL_SA to DLOGIP_SA
- .1
.0
.1
.2
.3
2 4 6 8 10 12
Response of DIRL_SA to RSR_SA
.00
.04
.08
2 4 6 8 10 12
Response of DLOGOP_SA to DIRS_SA
.00
.04
.08
2 4 6 8 10 12
Response of DLOGOP_SA to DIRL_SA
.00
.04
.08
2 4 6 8 10 12
Response of DLOGOP_SA to DLOGOP_SA
.00
.04
.08
2 4 6 8 10 12
Response of DLOGOP_SA to DLOGIP_SA
.00
.04
.08
2 4 6 8 10 12
Response of DLOGOP_SA to RSR_SA
- .005
.000
.005
.010
.015
2 4 6 8 10 12
Response of DLOGIP_SA to DIRS_SA
- .005
.000
.005
.010
.015
2 4 6 8 10 12
Response of DLOGIP_SA to DIRL_SA
- .005
.000
.005
.010
.015
2 4 6 8 10 12
Response of DLOGIP_SA to DLOGOP_SA
- .005
.000
.005
.010
.015
2 4 6 8 10 12
Response of DLOGIP_SA to DLOGIP_SA
- .005
.000
.005
.010
.015
2 4 6 8 10 12
Response of DLOGIP_SA to RSR_SA
- .02
.00
.02
.04
.06
2 4 6 8 10 12
Response of RSR_SA to DIRS_SA
- .02
.00
.02
.04
.06
2 4 6 8 10 12
Response of RSR_SA to DIRL_SA
- .02
.00
.02
.04
.06
2 4 6 8 10 12
Response of RSR_SA to DLOGOP_SA
- .02
.00
.02
.04
.06
2 4 6 8 10 12
Response of RSR_SA to DLOGIP_SA
- .02
.00
.02
.04
.06
2 4 6 8 10 12
Response of RSR_SA to RSR_SA
Response to Cholesky One S.D. Innovations ± 2 S.E.
- .1
.0
.1
.2
.3
.4
2 4 6 8 10 12
Response of DIRS_SA to DIRS_SA
- .1
.0
.1
.2
.3
.4
2 4 6 8 10 12
Response of DIRS_SA to DIRL_SA
- .1
.0
.1
.2
.3
.4
2 4 6 8 10 12
Response of DIRS_SA to DLOGOP_SA
- .1
.0
.1
.2
.3
.4
2 4 6 8 10 12
Response of DIRS_SA to DLOGIP_SA
- .1
.0
.1
.2
.3
.4
2 4 6 8 10 12
Response of DIRS_SA to RSR_SA
- .1
.0
.1
.2
.3
.4
2 4 6 8 10 12
Response of DIRL_SA to DIRS_SA
- .1
.0
.1
.2
.3
.4
2 4 6 8 10 12
Response of DIRL_SA to DIRL_SA
- .1
.0
.1
.2
.3
.4
2 4 6 8 10 12
Response of DIRL_SA to DLOGOP_SA
- .1
.0
.1
.2
.3
.4
2 4 6 8 10 12
Response of DIRL_SA to DLOGIP_SA
- .1
.0
.1
.2
.3
.4
2 4 6 8 10 12
Response of DIRL_SA to RSR_SA
- .2
-.1
.0
.1
.2
.3
2 4 6 8 10 12
Response of DLOGOP_SA to DIRS_SA
- .2
-.1
.0
.1
.2
.3
2 4 6 8 10 12
Response of DLOGOP_SA to DIRL_SA
- .2
-.1
.0
.1
.2
.3
2 4 6 8 10 12
Response of DLOGOP_SA to DLOGOP_SA
- .2
-.1
.0
.1
.2
.3
2 4 6 8 10 12
Response of DLOGOP_SA to DLOGIP_SA
- .2
-.1
.0
.1
.2
.3
2 4 6 8 10 12
Response of DLOGOP_SA to RSR_SA
- .02
-.01
.00
.01
.02
.03
2 4 6 8 10 12
Response of DLOGIP_SA to DIRS_SA
- .02
-.01
.00
.01
.02
.03
2 4 6 8 10 12
Response of DLOGIP_SA to DIRL_SA
- .02
-.01
.00
.01
.02
.03
2 4 6 8 10 12
Response of DLOGIP_SA to DLOGOP_SA
- .02
-.01
.00
.01
.02
.03
2 4 6 8 10 12
Response of DLOGIP_SA to DLOGIP_SA
- .02
-.01
.00
.01
.02
.03
2 4 6 8 10 12
Response of DLOGIP_SA to RSR_SA
- .02
.00
.02
.04
.06
2 4 6 8 10 12
Response of RSR_SA to DIRS_SA
- .02
.00
.02
.04
.06
2 4 6 8 10 12
Response of RSR_SA to DIRL_SA
- .02
.00
.02
.04
.06
2 4 6 8 10 12
Response of RSR_SA to DLOGOP_SA
- .02
.00
.02
.04
.06
2 4 6 8 10 12
Response of RSR_SA to DLOGIP_SA
- .02
.00
.02
.04
.06
2 4 6 8 10 12
Response of RSR_SA to RSR_SA
Response to Cholesky One S.D. Innovations ± 2 S.E.
- .05
.00
.05
.10
.15
.20
2 4 6 8 10 12
Response of DIRS_SA to DIRS_SA
- .05
.00
.05
.10
.15
.20
2 4 6 8 10 12
Response of DIRS_SA to DIRL_SA
- .05
.00
.05
.10
.15
.20
2 4 6 8 10 12
Response of DIRS_SA to DLOGOP_SA
- .05
.00
.05
.10
.15
.20
2 4 6 8 10 12
Response of DIRS_SA to DLOGIP_SA
- .05
.00
.05
.10
.15
.20
2 4 6 8 10 12
Response of DIRS_SA to RSR_SA
- .1
.0
.1
.2
.3
2 4 6 8 10 12
Response of DIRL_SA to DIRS_SA
- .1
.0
.1
.2
.3
2 4 6 8 10 12
Response of DIRL_SA to DIRL_SA
- .1
.0
.1
.2
.3
2 4 6 8 10 12
Response of DIRL_SA to DLOGOP_SA
- .1
.0
.1
.2
.3
2 4 6 8 10 12
Response of DIRL_SA to DLOGIP_SA
- .1
.0
.1
.2
.3
2 4 6 8 10 12
Response of DIRL_SA to RSR_SA
- .2
-.1
.0
.1
.2
.3
2 4 6 8 10 12
Response of DLOGOP_SA to DIRS_SA
- .2
-.1
.0
.1
.2
.3
2 4 6 8 10 12
Response of DLOGOP_SA to DIRL_SA
- .2
-.1
.0
.1
.2
.3
2 4 6 8 10 12
Response of DLOGOP_SA to DLOGOP_SA
- .2
-.1
.0
.1
.2
.3
2 4 6 8 10 12
Response of DLOGOP_SA to DLOGIP_SA
- .2
-.1
.0
.1
.2
.3
2 4 6 8 10 12
Response of DLOGOP_SA to RSR_SA
- .008
-.004
.000
.004
.008
.012
.016
2 4 6 8 10 12
Response of DLOGIP_SA to DIRS_SA
- .008
-.004
.000
.004
.008
.012
.016
2 4 6 8 10 12
Response of DLOGIP_SA to DIRL_SA
- .008
-.004
.000
.004
.008
.012
.016
2 4 6 8 10 12
Response of DLOGIP_SA to DLOGOP_SA
- .008
-.004
.000
.004
.008
.012
.016
2 4 6 8 10 12
Response of DLOGIP_SA to DLOGIP_SA
- .008
-.004
.000
.004
.008
.012
.016
2 4 6 8 10 12
Response of DLOGIP_SA to RSR_SA
- .02
.00
.02
.04
.06
2 4 6 8 10 12
Response of RSR_SA to DIRS_SA
- .02
.00
.02
.04
.06
2 4 6 8 10 12
Response of RSR_SA to DIRL_SA
- .02
.00
.02
.04
.06
2 4 6 8 10 12
Response of RSR_SA to DLOGOP_SA
- .02
.00
.02
.04
.06
2 4 6 8 10 12
Response of RSR_SA to DLOGIP_SA
- .02
.00
.02
.04
.06
2 4 6 8 10 12
Response of RSR_SA to RSR_SA
Response to Cholesky One S.D. Innovations ± 2 S.E.

28
Table 4: Summarizing table of the results of the impulse response of real stock returns to shocks to
short-term interest rate, long-term interest rate, world real oil price and industrial production, with a
95% confidence level, for the whole sample period.
Notes: n (p) indicates negative (positive) orthogonalized impulse responses. Oil price shocks are measured as the
first log difference in the world real oil price.
As we can see from the table above, an oil price shock has a negative impact on real stock
returns for all five countries in the same month and/or within one month. They are during the
period also statistically insignificant. We can also see that the shock will revert towards zero
(die out) during period 7 for Greece, 6 for Ireland and Portugal, 9 for Italy and Spain.
A unit shock to the industrial production shows us that the results for the five countries will
vary. Greece, Italy, Portugal and Spain will experience a positive effect on real stock returns,
while Ireland on the other hand demonstrates a negative reaction. All countries except for
Ireland will also be statistically insignificant. The shock will revert towards zero during
period 6 for Greece, 9 for Ireland 8 for Italy and Spain and 10 for Portugal.
In the case of short-term and long-term interest rates we can see that stock returns in all
countries except for Greece are negatively affected and statistically insignificant. The IRS
shock will revert towards zero during period 8 for Greece, 10 for Ireland, 11 for Italy, 7 for
Portugal and 9 for Spain. Considering IRL we se that the shock will revert toward zero during
period 9 for Greece, Ireland and Italy, 8 for Portugal and 7 for Spain.
Gre
ece
Irel
and
Ital
y
Po
rtug
al
Sp
ain
Short-term interest rate shock p n n n n
Long-term interest rate shock p n n n n
World real oil price shock n n n n n
Industrial production shock p n p p p

29
Pre-crisis subsample: 1993m07-2008m08
Allowing for a structural break in our dataset, around the financial crisis we divide our sample
into a pre-crisis subsample from 1993m07-2008m08. Table 5 displays the results of the
impulse responses of real stock return due to shocks to the variables in the model. As we can
see from the graphs in appendix B2, when comparing the whole period and the first
subsample, we do not see any great differences in the response of the real stock returns due to
oil price shocks. Shocks to oil price will revert towards zero in period 8 for Greece and
Portugal, in period 9 for Ireland and Spain and period 6 for Italy.
Table 5: Summarizing table of the results of the impulse response (pre-crisis) of real stock
returns to shocks to short-term interest rate, long-term interest rate, world real oil price and industrial
production, with a 95% confidence level
Notes: n (p) indicates negative (positive) orthogonalized impulse responses. Oil price shocks are measured as the
first log difference in the world real oil price.
Furthermore, by looking at the other variables in our VAR model we see that only shocks to
long-term interest rate will change from being positive to negative for Greece, and from
negative to positive for Italy. The shocks will die out in period 9 for Greece and Ireland, 8 for
Italy and period 11 for Portugal. For Spain, the shock does not revert towards zero during our
time period. Shocks to short-term interest rate will revert towards zero in period 10 for
Greece, 9 for Ireland and Portugal and 8 for Italy and Spain. Industrial production shocks will
revert towards zero in period 9 for Greece, Ireland, Portugal and Spain and 7 for Italy.
Gre
ece
Irel
and
Ital
y
Port
ugal
Spai
n
Short-term interest rate shock
(irs)
p n n n n
Long-term interest rate shock n n p n n
World real oil price shock n n n n n
Industrial production shock p n p p p
30
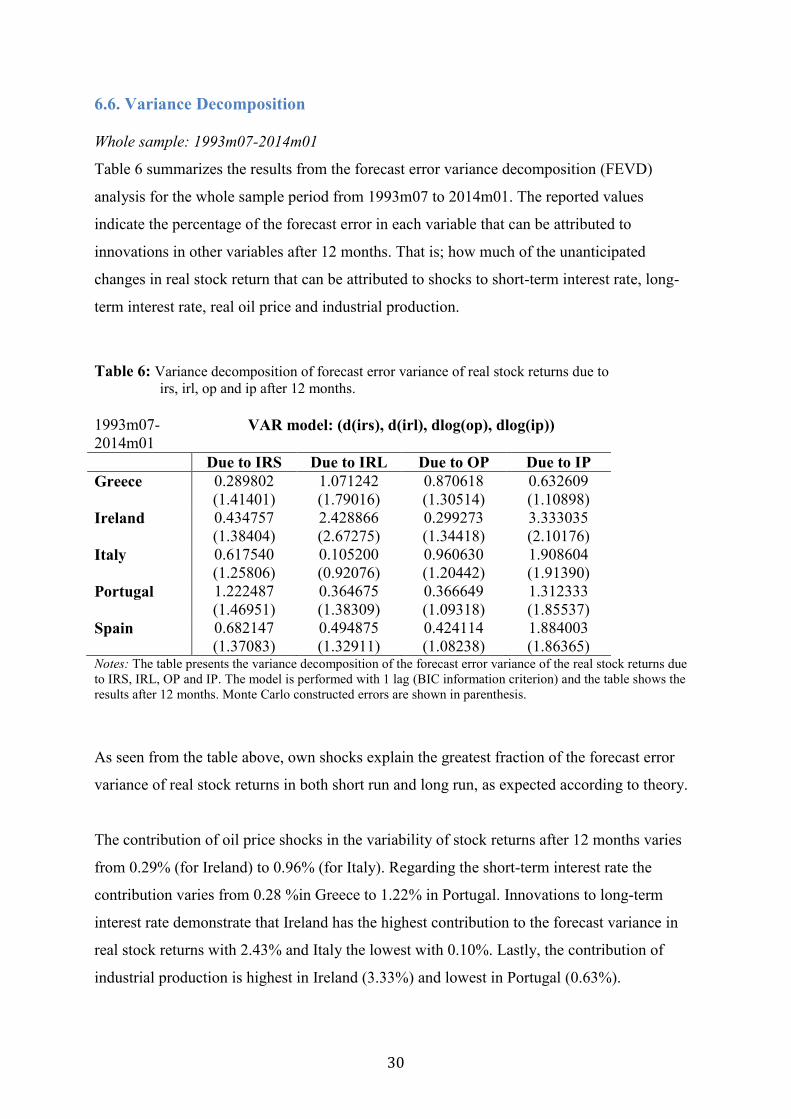
6.6. Variance Decomposition Whole sample: 1993m07-2014m01
Table 6 summarizes the results from the forecast error variance decomposition (FEVD)
analysis for the whole sample period from 1993m07 to 2014m01. The reported values
indicate the percentage of the forecast error in each variable that can be attributed to
innovations in other variables after 12 months. That is; how much of the unanticipated
changes in real stock return that can be attributed to shocks to short-term interest rate, long-
term interest rate, real oil price and industrial production.
Table 6: Variance decomposition of forecast error variance of real stock returns due to
irs, irl, op and ip after 12 months.
1993m07-
2014m01 VAR model: (d(irs), d(irl), dlog(op), dlog(ip))
Due to IRS Due to IRL Due to OP Due to IP
Greece 0.289802
(1.41401)
1.071242
(1.79016)
0.870618
(1.30514)
0.632609
(1.10898)
Ireland 0.434757
(1.38404)
2.428866
(2.67275)
0.299273
(1.34418)
3.333035
(2.10176)
Italy 0.617540
(1.25806)
0.105200
(0.92076)
0.960630
(1.20442)
1.908604
(1.91390)
Portugal 1.222487
(1.46951)
0.364675
(1.38309)
0.366649
(1.09318)
1.312333
(1.85537)
Spain 0.682147
(1.37083)
0.494875
(1.32911)
0.424114
(1.08238)
1.884003
(1.86365) Notes: The table presents the variance decomposition of the forecast error variance of the real stock returns due
to IRS, IRL, OP and IP. The model is performed with 1 lag (BIC information criterion) and the table shows the
results after 12 months. Monte Carlo constructed errors are shown in parenthesis.
As seen from the table above, own shocks explain the greatest fraction of the forecast error
variance of real stock returns in both short run and long run, as expected according to theory.
The contribution of oil price shocks in the variability of stock returns after 12 months varies
from 0.29% (for Ireland) to 0.96% (for Italy). Regarding the short-term interest rate the
contribution varies from 0.28 %in Greece to 1.22% in Portugal. Innovations to long-term
interest rate demonstrate that Ireland has the highest contribution to the forecast variance in
real stock returns with 2.43% and Italy the lowest with 0.10%. Lastly, the contribution of
industrial production is highest in Ireland (3.33%) and lowest in Portugal (0.63%).

31
In Greece the largest fraction explaining the forecast error variance of real stock returns is
explained by shocks to long-term interest rate. In Ireland and Italy, shocks to industrial
production contribute the most. This applies for Portugal and Spain as well, and here
industrial production is followed by the short-term interest rate.
Pre-crisis subsample: 1993m07-2008m08
The following table demonstrates the results from the variance decomposition of real stock
returns after dividing the sample into a pre-crisis subsample. Table 7 lists the percentages of
variation in real stock returns due to short-term and long-term interest rate shocks, real oil
price shocks and industrial production shocks.
Table 7: Variance decomposition of forecast error variance in real stock returns due to
irs, irl, op and ip after 12 months. 1993m07-
2008m08 VAR model: (d(irs), d(irl), dlog(op), dlog(ip))
Due to IRS Due to IRL Due to OP Due to IP
Greece 3.142980
(2.93726)
0.848962
(2.36151)
1.655739
(1.91156)
0.963178
(1.40093)
Ireland 0.707454
(1.83781)
0.834221
(1.69764)
1.367082
(2.62296)
5.363761
(2.37273)
Italy 0.597554
(1.55090)
0.999402
(1.64411)
2.103127
(1.89755)
2.350280
(2.02136)
Portugal 1.212167
(1.89928)
0.043428
(0.88410)
1.541819
(2.10963)
0.322786
(1.05541)
Spain 0.522926
(1.65129)
0.894830
(1.74007)
1.797242
(2.74922)
4.165913
(3.13008) Notes: The table presents the variance decomposition of the forecast error variance of the real stock returns due
to IRS, IRL, OP and IP. The model is performed with 1 lag (BIC information criterion) and the table shows the
results after 12 months. Monte Carlo constructed errors are shown in parenthesis.
This time period will now be regarded to cover the ‘normal’ macroeconomic conditions
without the financial crisis period, and we can now examine these results to see if there are
any great changes to the results when comparing them to the whole sample. If we start with
the contribution of the real oil price to the forecast variance of real stock returns, it is obvious
that the contribution has increased in all countries. The largest contribution can be found in
Italy (2.10%), while the lowest is seen in Ireland (1.37%).
Regarding the decomposition of the shocks in the forecast error variance of real stock returns,

32
the largest contribution for Portugal is now the oil price, followed by the short-term interest
rate. For Greece, the contribution of short-term interest rate has now increased and
consequently explains the largest variance in real stock returns, followed by the oil price.
From the table we can see that in Ireland, Italy and Spain, industrial production still
contributes the most to the forecast error variance in real stock returns.
Alternative VAR specifications
Sine the lags suggested by the information criterions, BIC and AIC, did not agree on the
number of lags that should be included in the model, we have estimated our VAR model with
the number of lags suggested by AIC as well to be able to check whether our results will
differ from when using the lags suggested by BIC. As mentioned earlier AIC criterion
suggests the following for the different countries: 2 lags for Portugal, 3 for Ireland, Italy and
Spain, and 6 for Greece. The results from the impulse response functions and variance
decomposition functions are listed in appendix C1.
As we can see from the graphs in the appendix the impulse responses demonstrates quite
similar results as when estimating the model according to lags suggested by BIC. The real
stock returns in all countries display the same signs of the effects from the shocks to the
various variables. We now also see that shocks to industrial production become marginally
statistically significant for Spain.
The results from the variance decomposition functions with AIC information criterion are
listed in appendix C2. When introducing a greater number of lags, the contribution of oil price
in the forecast error variance of real stock returns after 12 months, increases in all countries.
The contribution of industrial production also increases with a substantial amount for all
countries, except for Ireland where the share somewhat decreases. After 12 months, we can
also see an increase in the contribution of both interest rates. In Greece, the contribution of
both interest rates increased by around 3 % when adding more lags, however, for Greece AIC
suggested a rather large lag length (6) comparing to the other countries.

33
7. Discussion In this section we will discuss the results from our analysis, and put them into context with
other studies from the literature on oil price shocks and international stock markets. We will
also assess what might be the reason for the results we got.
Analyzing the oil price shocks effect, we see that shocks to the world real oil price have a
negative effect on the real stock returns for all the countries in our sample. This effect also
holds when excluding the financial crisis from the sample. The negative oil price effect found
in our analysis is consistent with findings from, among others, Park and Ratti (2008),
Papapetrou (2001) and Cunando and Perez de Gracia (2013) where all studies find a negative
oil price effect on real stock market returns. Moreover, Park and Ratti used a linear
specification of the oil price displaying percentage changes, which is the specification we are
using as well, giving further support to our findings. However, Killian and Park (2009) argues
that, at best, the estimates from an analysis with this variable represent the stock markets
response to an average oil price shock during the sample period in question.
We did not, however, find the oil price effect to be statistically significant for our sample
period. As mentioned in our literature review, there are other studies finding similar limited
results. Apergis and Miller (2009) only found a small effect in their VAR model for sample
period 1981-2007 in eight different countries (in which Italy was on of them). A reason for
our statistically insignificant results might have to do with the estimation of the model. As
mentioned earlier, both the impulse responses and variance decompositions are sensitive to
the ordering of the variables. We did, however, try different orderings without getting any
more significant results.
Furthermore, Lütkepohl (2005, p.66) argues that the results might be different when altering
the system of equations in the VAR model, either by adding more variables or deleting
variables that are already in the system. We are aware of the omitted variable-bias that might
occur, but since we have followed other similar empirical studies when deciding which
variables to include, this should not be a great issue. Moreover, there is a possibility that
measurement error in the preliminary data transformation of the variables. We did not,
however, have capacity to look further into this possibility but are aware of it. Although our
results are insignificant, we know the direction of the responses, which are as excepted, and
can make indications based on this.

34
The negative oil price effect can also be seen in comparison to the fact that all five countries
are net importers of oil (URL 5). Wang et al. shows evidence that the stock market response
to oil price shocks, depends on a country’s net position in the crude oil market. They find that
in oil-importing countries, an increase in the price of oil will result in higher industry costs,
which will negatively affect stock markets. According to the World Factbook (URL 6), Italy
is the country ranked highest when it comes to oil imports, making Italy the country most
dependent on oil out of our sample countries. In our variance decomposition analysis, we
found that regarding the contribution of oil price shocks in the variation of stock returns, Italy
had the largest contribution in both subsamples. This is consistent with the argument by Wang
et al.
When dividing the sample, and excluding the period around the financial crisis, we saw an
increase in the contribution of oil price shocks in the variability of real stock returns
compared to the sample containing observations for the whole period. This might be a result
of the more stable conditions during that time period (pre-crisis). In the subsample the oil
price innovations contribute more to the variability in real stock returns, than that of the
interest rate, for all countries except Greece. In the whole sample, however, short-term
interest rate shocks contributed more than oil price shocks for Ireland, Portugal and Spain.
When seen in relation to the financial crisis one can argue that the greater contribution can be
due to the interest rate policy adapted as a response to the decreased economic growth caused
by the recession, in which banks tried to push down the interest rate in order to encourage
increased economic activity.
We also employed an alternative specification of the VAR model and conducted the analyses
with the lag length suggested by AIC information criterion. The results were pretty much the
same as when estimating the model with lags according to BIC, and we saw that none of the
already insignificant effects became significant when introducing more lags.
Considering the different effects of shocks to short-term and long-term interest rate both type
of shocks demonstrates a negative impact on real stock returns, with the exception being
Greece in which shocks to both rates yield a positive effect on real stock returns and Italy
when excluding the financial crisis from the sample. After 2 periods the shock to short-term
interest rate becomes marginally statistically significant. Hence, the results for the majority of

35
our sample countries are in line with economic theory emphasizing a negative relationship
between interest rates and stock returns, although we do not find this negative relationship to
be statistically significant in our sample.
Regarding the comparison between the effects of the two different interest rates, we do not
see any clear patterns indicating whether one rate is more important in explaining the
variability of real stock returns. For the whole sample period, the long-term interest rate
contributes more than the short-term for Greece and Ireland, while for the other countries the
short-term rate contributes the most.
Shocks to industrial production demonstrate a positive effect on real stock returns for all
countries, except for Ireland, in both sample periods analyzed. This result is in line with
previous work by among others Papapetrou (2001) who found a positive effect of industrial
production shocks on real stock returns in Greece. The effect is however, not statistically
significant for both samples. The only exception is Spain, where shocks to industrial
production show a positive and statistically significant effect on real stock returns after two
periods. Shocks to industrial production in Ireland are, on the other hand, negative and
statistically significant during the first month. This also holds, when analyzing the subsample
without the financial crisis.
8. Conclusion In this thesis we have studied the effect of oil price shock on real stock returns in the five
OECD countries; Portugal, Ireland, Italy, Greece and Spain. We found little evidence of an
impact of linear oil price shocks on real stock returns for all sample countries. We were able
to evaluate the direction of the effect, but did not find any statistically significant results
regarding the oil price shocks’ effect on real stock returns. The direction of our results is in
line with existing studies demonstrating a negative oil price effect in which shocks to the real
oil price depresses stock returns. We also saw indications of the relation between oil
dependency and the effect of stock returns, in which the contribution of oil price shocks to the
variability in real stock results was highest in Italy, the country displaying the highest
dependency on oil. Furthermore, when excluding the financial crisis from the sample we
found that the contribution of the oil price shocks in the variability of real stock returns,
increased.

36
By adding other economic variables to our analysis we were able to investigate the effect of
shocks to these variables as well. We found that, for the majority of the countries, shocks to
both interest rates demonstrates a negative impact on real stock returns, which is in line with
economic theory. The effects were, however, not statistically significant. Furthermore, we
were not able to see any important differences between the effects of shocks to short-term and
long-term interest rates. There may be several reasons for our statistically insignificant results.
The fact that our thesis shows different results then other papers can be dependent on the data
used in the analyses, and the time period investigated.
For further research we suggest to look into other specifications of the oil price to be able to
compare the effects from the different specifications, and investigate if one gets more
significant results applying other specifications. Mork (1989) stresses the use of an
asymmetric specification of the oil price where one makes the distinction between oil price
increases and decreases and assess the different effects on the stock market returns due to
these changes. Another interesting aspect one could look into is the decomposition of oil price
shocks into supply and demand driven shocks. Killian (2008) argues that estimates may be
sensitive to the choice of sample period since the composition of underlying demand and
supply shocks evolves over time.
It could also be interesting to include net oil exporting countries in the analysis in order to
make distinctions between the effects on real stock returns in importing and exporting
countries within the OECD.

37
References
Literature
Apergis, N and Miller, S.M (2009), “Do Structural Oil-market Shocks Affect Stock Prices?”,
Energy Economics, Vol. 31, pp. 569-575.
Barsky, R.B. and Kilian, L. (2004), “Oil and the Macroeconomy Since the 1970s”, Journal of
Economic Perspectives, Vol. 18, Iss. 4, pp. 115-134.
Basher, S.A., Haug, A.A. and Sadorsky, P. (2012), “Oil Prices, Exchange Rates and Emerging
Stock Markets”, Energy Economics, Vol. 34, pp. 227-240.
Basher, S.A. and Sadorsky, P. (2006), “Oil Price Risk and Emerging Stock Markets”, Global
Finance Journal, Vol. 17, pp.224-251.
Bjornland, H.C. (2008), “Oil Price Shocks and Stock Market Booms in an Oil Exporting
Country”, Working Paper No.16 for Norges Bank, pp. 1-41.
Blanchard, O.J. (1981), “Output, the Stock Market, and Interest Rates”, The American
Economic Review, Vol. 71, Iss. 1, pp. 132-143.
Brooks, C. (2008), “Introductory Econometrics for Finance”, Cambridge University Press.
2nd edition. eBook
Chen, N-F., Roll, R. and Ross, S.A. (1986), “Economic Forces and the Stock Market”, The
Journal of Business, Vol. 59, Iss. 3, pp. 383-403.
Clements, M.P. and Hendry, D.F. (1995), “Forecasting in Cointegrated Systems”, Journal of
Applied Econometrics, Vol. 10, Iss. 2, pp. 127-146.
Cologni, A. and Manera, M. (2008), “Oil prices, inflation and interest rates in a structural
cointegrated VAR model for the G-7 countries”, Energy Economics, Vol. 30, pp. 856-888.

38
Cuñado, J. and Pérez de Gracia, F. (2014), “Oil price shocks and stock market returns:
Evidence for some European countries”, Energy Economics, Vol. 42, pp. 365-77.
Darby, M. R. (1982), "The Price of Oil and World Inflation and Recession." American
Economic Review, Vol. 72, Iss.4, pp. 738-751.
Durre, A. and Giot, P. (2005), “An International Analysis of Earnings, Stock Prices, and Bond
Yields”, European Central Bank Working Paper Series No 515.
Elliott, G., Rothenberg, T.J. and Stock, J.H. (1996), “Efficient Test for an Autoregressive Unit
Root”, Econometrica, Vol. 96, Iss. 4, pp.813-836.
Engle, R.F. and Yoo, B.S. (1987), “Forecasting and Testing in Co-integrated Systems”,
Journal of Econometrics, Vol. 35, pp.143-159.
EViews 7 User’s Guide II, 1994-2009 Quantative Micro Software, LLC.
Fama, E. (1990), “Stock Returns, Expected Returns, and Real Acitivity”, The Journal of
Finance, Vol. 45, Iss. 4, pp: 1089-1108.
Ferderer, J.P. (1996), “Oil Price Volatility and the Macroeconomy”, Journal of
Macroeconomics, Vol. 18, Iss. 1, pp. 1-26.
Gisser, M. and Goodwin, T.H. (1986), “Crude Oil and the Macroeconomy: Tests of Some
Popular Notions”, Journal of Money, Credit & Banking (Ohio State University Press), Vol.
18 Iss. 1, pp. 95-103.
Güntner, J.H.F. (2011), “How do International Stock Markets Respond to Oil Demand and
Supply Shocks?, Working Paper No. 28
Hamilton, J. D. (1983), “Oil and the Macroeconomy since World War II”, Journal of
Political Economy, Vol. 91, Iss. 2, pp. 228-248.

39
Hamilton, J.D. (2010), “Historical Oil Shocks”, Prepared for the Handbook of Major Events
in Economic History, pp.1-51.
Hoffman, D.L. and Rasche, R.H. (1996), “Assesing Forecast Performance in a Cointegrated
System”, Journal of Applied Econometrics, Vol. 11, pp. 495-517.
Huang, R.D., Masulis, R.W. and Stoll, H.R. (1996), “Energy Shocks and Financial Markets”,
Journal of Futures Markets, Vol. 16, Iss. 1, pp. 1-27.
Jones, C. M. and Kaul, G. (1996), “Oil and the Stock Markets”, The Journal of Finance,
Vol.51, Iss. 2, pp. 463-491.
Keeley, B. and Love, P. (2010), “From Crisis to Recovery. The Causes, Course and
Consequences of the Great Recession”, OECD Insights series.
Killian, L. (2008), “The Economic Effects of Energy Price Shocks”, Journal of Economic
Literature, Vol.46, Iss. 4, pp. 871-909.
Kilian, L. (2009), “Not All Oil Price Shocks Are Alike: Distangling Demand and Supply
Shocks in the Crude Oil Market”, The American Economic Review, Vol. 99, Iss. 3, pp. 1053-
1069.
Kilian, L. and Park, C. (2009), “The Impact of Oil Price Shocks on the U.S. Stock Market”,
International Economic Review, Vol. 50, Iss. 4, pp. 1267-1287.
Mork, K.A. (1989), “Oil and the Macroeconomy When Prices Go Up and Down: An
Extension of Hamilton's Results”, Journal of Political Economy, Vol. 97, Iss. 3, pp. 740-744.
Lütkepohl, H. (2005), “New Introduction to Multiple Time Series Analysis”, Spinger-Verlag
Berlin Heidelberg. E-book.
Mork, KA., Olsen, O. and Mysen, H.T. (1994), “Macroeconomic responses to oil price
increases and decreases in seven OECD countries”, Energy Journal, Vol. 15, Iss. 4, pp.19-35.

40
Naka,A. and Tufte, D. (1997), “Examining Impulse Response Functions in Cointegrated
Systems”, Journal of Applied Econometrics, Vol. 29, pp.1593-1603.
Nandha, M. and Faff, R. (2008), “Does Oil Move Equity Prices? A Global View”, Energy
Economics, Vol. 30, pp. 986-997.
Panda, C. (2008), “Do Interest Rates Matter for Stock Markets?”, Economic and Political
Weekly, Vol. 43, Iss. 17, pp. 107-115.
Papapetrou, E. (2001), “Oil Price Shocks, Stock Markets, Economic Activity and
Employment in Greece”, Energy Economics, Vol. 23, pp. 511-532.
Park, J. and Ratti, R.A. (2008), “Oil price shocks and stock markets in the U.S. and 13
European countries”, Energy Economics, Vol. 30, Iss. 5, pp. 2587-2608.
Rigobon, R. and Sack, B. (2004), “The Impact of Monetary Policy on Asset Prices”, Journal
of Monetary Economics, Vol. 51, pp. 639-669.
Sadorsky, P. (1999), “Oil price shocks and stock market activity”, Energy Economics, Vol.
21, pp. 449-469.
Sims, C.A. (1980), “Macroeconomics and Reality”, Econometrica, Vol. 48, pp. 1-48.
U.S. Energy Information Administration (EIA), July 2013, “International Energy Outlook
2013”. On the Web: www.eia.gov/ieo
Verbeek, M. (2012), “A Guide to Modern Econometrics”, 4th Edition, Rotterdam School of
Management, Erasmus University, Rotterdam.
Wang, P. (2003), ”Financial Econometrics. Methods and Models”. Routledge Advanced Texts
in Economics and Finance.

41
Wang, Y., Wu, C. and Yang, L. (2013), “Oil Price Shocks and Stock Market Activities:
Evidence from Oil-Importing and Oil-exporting Countries”, Journal of Comparative
Economics, Vol. 41, pp.1220-1239.
Yan, L. (2012), “Analysis of the International Oil Price Fluctuations and Its Influencing
Factors”, American Journal of Industrial and Business Management, pp: 39-46. Published
online April 2012.
Zhou, C. (1996), “Stock Market Fluctuations and the Term Structure”, Finance and Economic
Discussion Series No 96-3, Federal Reserve Board of Governors.
Web sources
URL1: http://articles.economictimes.indiatimes.com/2008-05-18/news/27734891_1_oil-
producers-and-consumers-opec-countries-prices-in-global-markets
Accessed 15.07.14
URL 2: http://www.opec.org/opec_web/en/data_graphs/330.htm
Accessed 15.07.14
URL 3: http://www.energyandcapital.com/resources/brent-vs-wti
Accessed 05.08.14
URL 4: http://stats.oecd.org/mei/default.asp?lang=e&subject=15
Accessed 25.05.14
URL 5: http://data.worldbank.org/indicator/EG.IMP.CONS.ZS
Accessed 05.08.14
URL 6: http://www.indexmundi.com/g/r.aspx?v=93
Accessed 05.08.14
OECD Factbook 2014:Economic, Environmental and Social Statistics:
URL: http://dx.doi.org/10.1787/factbook-2014-en
Accessed 14.05.14

42
Appendices
Appendix A: VAR coefficients
A.1. Whole sample (1993m07-2014m01) Greece dIRS dIRL dlogOP dlogIP RSR
dIRS(-1)
0.162181 0.078740 -0.011330 0.007868 0.006849
dIRL(-1)
0.028159 0.081615 0.000958 -0.001038 0.006523
dlogOP(-1)
0.360052 0.191403 0.125696 0.010061 0.041215
dlogIP(-1)
0.684562 4.033829 0.043103 -0.467545 0.090599
RSR(-1)
-0.775918 -4.385290 0.168909 0.013789 0.382362
C -0.068023 -0.036940 0.004487 -0.004532 -0.000156
Ireland dIRS dIRL dlogOP dlogIP RSR
dIRS(-1)
0.433229 -0.057447 0.028593 0.003822 -0.006946
dIRL(-1)
0.433229 0.205243 0.016179 -0.005674 -0.007672
dlogOP(-1)
0.261717 0.060066 0.097338 -0.025982 0.037246
dlogIP(-1)
0.120066 -0.466621 -0.098876 -0.476237 0.035638
RSR(-1)
0.308483 0.414780 0.184430 0.037938 0.350776
C -0.016710 -0.010381 0.005905 0.005079 0.000977
Italy dIRS dIRL dlogOP dlogIP RSR
dIRS(-1)
0.324402 -0.019502 0.009295 0.010028 0.000859
dIRL(-1)
0.004269 0.274159 0.018692 0.001403 0.000524
dlogOP(-1)
0.443844 0.114117 0.109480 0.025873 0.034453
dlogIP(-1)
1.790788 1.067951 0.273262 -0.114238 0.556023
RSR(-1)
-0.524530 -1.119061 0.332692 0.048368 0.216928
C -0.021705 -0.013809 0.006357 -0.002130 0.001363
Portugal dIRS dIRL dlogOP dlogIP RSR
dIRS(-1)
-0.040586 0.110580 0.022468 0.009911 0.002535

43
dIRL(-1)
0.084689 0.239817 0.010088 -0.001635 0.000909
dlogOP(-1)
0.435642 0.241694 0.103076 0.002807 0.008654
dlogIP(-1)
-0.029595 -1.136830 0.040916 -0.415464 0.187701
RSR(-1)
-0.442506 -0.516048 0.250189 0.045404 0.331184
C -0.047450 -0.010556 0.005640 -0.002294 0.002424
Spain dIRS dIRL dlogOP dlogIP RSR
dIRS(-1)
0.478821 -0.052108 0.048162 0.003564 -0.002001
dIRL(-1)
0.003240 0.295054 0.024384 0.000981 -0.006821
dlogOP(-1)
0.277886 0.150730 0.105847 0.008381 0.017573
dlogIP(-1)
-0.272569 0.280262 -0.190462 -0.273443 0.456782
RSR(-1)
-0.181910 -1.028891 0.202081 0.055528 0.262916
C -0.021655 -0.015478 0.006788 -0.002616 0.002633
A.2. Subsample (1993m07-2008m08)
Greece dIRS dIRL dlogOP dlogIP RSR
dIRS(-1)
-0.074806 -0.047747 -0.020428 0.005997 0.027993
dIRL(-1)
0.468667 0.332365 0.031066 0.005102 -0.017363
dlogOP(-1)
-0.093175 0.595337 -0.000169 0.014913 -0.026391
dlogIP(-1)
1.298497 0.328699 0.057074 -0.361839 -0.265635
RSR(-1)
-1.116100 -1.702635 0.011415 0.010359 0.346283
C -0.037132 -0.064892 0.008905 -0.002471 0.002482
Ireland dIRS dIRL dlogOP dlogIP RSR
dIRS(-1)
0.325540 -0.051668 0.037287 -0.005050 -0.005641
dIRL(-1)
0.086653 0.106159 0.053957 -0.007899 -0.007647
dlogOP(-1)
0.040870 0.210813 -0.020947 -0.019940 -0.026680
dlogIP(-1)
0.103996 -0.403096 -0.186180 -0.460944 0.064573
RSR(-1)
0.262073 -0.262614 -0.170848 0.083051 0.340498

44
C -0.006941 -0.011066 0.009975 0.006984 0.001198
Italy dIRS dIRL dlogOP dlogIP RSR
dIRS(-1)
0.204002 -0.094395 0.014191 0.002485 0.019384
dIRL(-1)
0.057914 0.354220 0.033834 0.002527 -0.022991
dlogOP(-1)
0.193138 0.174527 0.007012 0.007254 0.020263
dlogIP(-1)
0.304351 0.612568 -0.335566 -0.218277 0.586278
RSR(-1)
-1.035182 -1.088961 0.155254 0.017310 0.234581
C -0.014699 -0.014633 0.008115 -0.001582 0.001856
Portugal dIRS dIRL dlogOP dlogIP RSR
dIRS(-1)
-0.152784 0.081789 0.017780 0.007376 0.007757
dIRL(-1)
0.306127 0.390013 0.047322 0.004746 0.002907
dlogOP(-1)
0.112916 0.259701 -0.014954 -0.006855 -0.027827
dlogIP(-1)
-0.505955 -0.478666 0.047411 -0.461573 0.108059
RSR(-1)
-0.709598 -0.129338 0.011907 -0.461573 0.382480
C -0.032273 -0.016637 0.009904 -0.001910 0.003285
Spain dIRS dIRL dlogOP dlogIP RSR
dIRS(-1)
0.373450 -0.102830 0.059951 -0.004404 0.000344
dIRL(-1)
0.011718 0.432930 0.041913 0.003085 -0.017424
dlogOP(-1)
-0.005681 0.122127 -0.005001 -0.009142 -0.002369
dlogIP(-1)
-1.430795 -0.198852 -0.583885 -0.347030 0.635767
RSR(-1)
-0.588650 -0.863751 0.001396 0.025208 0.276568
C -0.015767 -0.013986 0.010348 -0.001453 0.003679

45
Appendix B: Orthogonalized impulse response function of real stock returns to world real oil price shocks in VAR (d(irs), d(irl),
dlog(op), dlog(ip), rsr).
B.1. Whole sample (1993m07-2014m01)
Greece
- .1
.0
.1
.2
.3
.4
2 4 6 8 10 12
Response of DIRS_SA to DIRS_SA
- .1
.0
.1
.2
.3
.4
2 4 6 8 10 12
Response of DIRS_SA to DIRL_SA
- .1
.0
.1
.2
.3
.4
2 4 6 8 10 12
Response of DIRS_SA to DLOGOP_SA
- .1
.0
.1
.2
.3
.4
2 4 6 8 10 12
Response of DIRS_SA to DLOGIP_SA
- .1
.0
.1
.2
.3
.4
2 4 6 8 10 12
Response of DIRS_SA to RSR_SA
-0.5
0.0
0.5
1.0
1.5
2 4 6 8 10 12
Response of DIRL_SA to DIRS_SA
-0.5
0.0
0.5
1.0
1.5
2 4 6 8 10 12
Response of DIRL_SA to DIRL_SA
-0.5
0.0
0.5
1.0
1.5
2 4 6 8 10 12
Response of DIRL_SA to DLOGOP_SA
-0.5
0.0
0.5
1.0
1.5
2 4 6 8 10 12
Response of DIRL_SA to DLOGIP_SA
-0.5
0.0
0.5
1.0
1.5
2 4 6 8 10 12
Response of DIRL_SA to RSR_SA
- .04
.00
.04
.08
.12
2 4 6 8 10 12
Response of DLOGOP_SA to DIRS_SA
- .04
.00
.04
.08
.12
2 4 6 8 10 12
Response of DLOGOP_SA to DIRL_SA
- .04
.00
.04
.08
.12
2 4 6 8 10 12
Response of DLOGOP_SA to DLOGOP_SA
- .04
.00
.04
.08
.12
2 4 6 8 10 12
Response of DLOGOP_SA to DLOGIP_SA
- .04
.00
.04
.08
.12
2 4 6 8 10 12
Response of DLOGOP_SA to RSR_SA
- .02
-.01
.00
.01
.02
.03
2 4 6 8 10 12
Response of DLOGIP_SA to DIRS_SA
- .02
-.01
.00
.01
.02
.03
2 4 6 8 10 12
Response of DLOGIP_SA to DIRL_SA
- .02
-.01
.00
.01
.02
.03
2 4 6 8 10 12
Response of DLOGIP_SA to DLOGOP_SA
- .02
-.01
.00
.01
.02
.03
2 4 6 8 10 12
Response of DLOGIP_SA to DLOGIP_SA
- .02
-.01
.00
.01
.02
.03
2 4 6 8 10 12
Response of DLOGIP_SA to RSR_SA
- .02
.00
.02
.04
.06
.08
2 4 6 8 10 12
Response of RSR_SA to DIRS_SA
- .02
.00
.02
.04
.06
.08
2 4 6 8 10 12
Response of RSR_SA to DIRL_SA
- .02
.00
.02
.04
.06
.08
2 4 6 8 10 12
Response of RSR_SA to DLOGOP_SA
- .02
.00
.02
.04
.06
.08
2 4 6 8 10 12
Response of RSR_SA to DLOGIP_SA
- .02
.00
.02
.04
.06
.08
2 4 6 8 10 12
Response of RSR_SA to RSR_SA
Response to Cholesky One S.D. Innovations ± 2 S.E.
Ireland
.0
.1
.2
2 4 6 8 10 12
Response of DIRS_SA to DIRS_SA
.0
.1
.2
2 4 6 8 10 12
Response of DIRS_SA to DIRL_SA
.0
.1
.2
2 4 6 8 10 12
Response of DIRS_SA to DLOGOP_SA
.0
.1
.2
2 4 6 8 10 12
Response of DIRS_SA to DLOGIP_SA
.0
.1
.2
2 4 6 8 10 12
Response of DIRS_SA to RSR_SA
- .1
.0
.1
.2
.3
.4
2 4 6 8 10 12
Response of DIRL_SA to DIRS_SA
- .1
.0
.1
.2
.3
.4
2 4 6 8 10 12
Response of DIRL_SA to DIRL_SA
- .1
.0
.1
.2
.3
.4
2 4 6 8 10 12
Response of DIRL_SA to DLOGOP_SA
- .1
.0
.1
.2
.3
.4
2 4 6 8 10 12
Response of DIRL_SA to DLOGIP_SA
- .1
.0
.1
.2
.3
.4
2 4 6 8 10 12
Response of DIRL_SA to RSR_SA
- .04
.00
.04
.08
.12
2 4 6 8 10 12
Response of DLOGOP_SA to DIRS_SA
- .04
.00
.04
.08
.12
2 4 6 8 10 12
Response of DLOGOP_SA to DIRL_SA
- .04
.00
.04
.08
.12
2 4 6 8 10 12
Response of DLOGOP_SA to DLOGOP_SA
- .04
.00
.04
.08
.12
2 4 6 8 10 12
Response of DLOGOP_SA to DLOGIP_SA
- .04
.00
.04
.08
.12
2 4 6 8 10 12
Response of DLOGOP_SA to RSR_SA
- .04
-.02
.00
.02
.04
.06
2 4 6 8 10 12
Response of DLOGIP_SA to DIRS_SA
- .04
-.02
.00
.02
.04
.06
2 4 6 8 10 12
Response of DLOGIP_SA to DIRL_SA
- .04
-.02
.00
.02
.04
.06
2 4 6 8 10 12
Response of DLOGIP_SA to DLOGOP_SA
- .04
-.02
.00
.02
.04
.06
2 4 6 8 10 12
Response of DLOGIP_SA to DLOGIP_SA
- .04
-.02
.00
.02
.04
.06
2 4 6 8 10 12
Response of DLOGIP_SA to RSR_SA
- .02
.00
.02
.04
.06
2 4 6 8 10 12
Response of RSR_SA to DIRS_SA
- .02
.00
.02
.04
.06
2 4 6 8 10 12
Response of RSR_SA to DIRL_SA
- .02
.00
.02
.04
.06
2 4 6 8 10 12
Response of RSR_SA to DLOGOP_SA
- .02
.00
.02
.04
.06
2 4 6 8 10 12
Response of RSR_SA to DLOGIP_SA
- .02
.00
.02
.04
.06
2 4 6 8 10 12
Response of RSR_SA to RSR_SA
Response to Cholesky One S.D. Innovations ± 2 S.E.
Italy
- .1
.0
.1
.2
.3
2 4 6 8 10 12
Response of DIRS_SA to DIRS_SA
- .1
.0
.1
.2
.3
2 4 6 8 10 12
Response of DIRS_SA to DIRL_SA
- .1
.0
.1
.2
.3
2 4 6 8 10 12
Response of DIRS_SA to DLOGOP_SA
- .1
.0
.1
.2
.3
2 4 6 8 10 12
Response of DIRS_SA to DLOGIP_SA
- .1
.0
.1
.2
.3
2 4 6 8 10 12
Response of DIRS_SA to RSR_SA
- .1
.0
.1
.2
.3
2 4 6 8 10 12
Response of DIRL_SA to DIRS_SA
- .1
.0
.1
.2
.3
2 4 6 8 10 12
Response of DIRL_SA to DIRL_SA
- .1
.0
.1
.2
.3
2 4 6 8 10 12
Response of DIRL_SA to DLOGOP_SA
- .1
.0
.1
.2
.3
2 4 6 8 10 12
Response of DIRL_SA to DLOGIP_SA
- .1
.0
.1
.2
.3
2 4 6 8 10 12
Response of DIRL_SA to RSR_SA
.00
.04
.08
2 4 6 8 10 12
Response of DLOGOP_SA to DIRS_SA
.00
.04
.08
2 4 6 8 10 12
Response of DLOGOP_SA to DIRL_SA
.00
.04
.08
2 4 6 8 10 12
Response of DLOGOP_SA to DLOGOP_SA
.00
.04
.08
2 4 6 8 10 12
Response of DLOGOP_SA to DLOGIP_SA
.00
.04
.08
2 4 6 8 10 12
Response of DLOGOP_SA to RSR_SA
- .005
.000
.005
.010
.015
2 4 6 8 10 12
Response of DLOGIP_SA to DIRS_SA
- .005
.000
.005
.010
.015
2 4 6 8 10 12
Response of DLOGIP_SA to DIRL_SA
- .005
.000
.005
.010
.015
2 4 6 8 10 12
Response of DLOGIP_SA to DLOGOP_SA
- .005
.000
.005
.010
.015
2 4 6 8 10 12
Response of DLOGIP_SA to DLOGIP_SA
- .005
.000
.005
.010
.015
2 4 6 8 10 12
Response of DLOGIP_SA to RSR_SA
- .02
.00
.02
.04
.06
2 4 6 8 10 12
Response of RSR_SA to DIRS_SA
- .02
.00
.02
.04
.06
2 4 6 8 10 12
Response of RSR_SA to DIRL_SA
- .02
.00
.02
.04
.06
2 4 6 8 10 12
Response of RSR_SA to DLOGOP_SA
- .02
.00
.02
.04
.06
2 4 6 8 10 12
Response of RSR_SA to DLOGIP_SA
- .02
.00
.02
.04
.06
2 4 6 8 10 12
Response of RSR_SA to RSR_SA
Response to Cholesky One S.D. Innovations ± 2 S.E.

46
Portugal
- .1
.0
.1
.2
.3
.4
2 4 6 8 10 12
Response of DIRS_SA to DIRS_SA
- .1
.0
.1
.2
.3
.4
2 4 6 8 10 12
Response of DIRS_SA to DIRL_SA
- .1
.0
.1
.2
.3
.4
2 4 6 8 10 12
Response of DIRS_SA to DLOGOP_SA
- .1
.0
.1
.2
.3
.4
2 4 6 8 10 12
Response of DIRS_SA to DLOGIP_SA
- .1
.0
.1
.2
.3
.4
2 4 6 8 10 12
Response of DIRS_SA to RSR_SA
- .1
.0
.1
.2
.3
.4
2 4 6 8 10 12
Response of DIRL_SA to DIRS_SA
- .1
.0
.1
.2
.3
.4
2 4 6 8 10 12
Response of DIRL_SA to DIRL_SA
- .1
.0
.1
.2
.3
.4
2 4 6 8 10 12
Response of DIRL_SA to DLOGOP_SA
- .1
.0
.1
.2
.3
.4
2 4 6 8 10 12
Response of DIRL_SA to DLOGIP_SA
- .1
.0
.1
.2
.3
.4
2 4 6 8 10 12
Response of DIRL_SA to RSR_SA
.00
.04
.08
2 4 6 8 10 12
Response of DLOGOP_SA to DIRS_SA
.00
.04
.08
2 4 6 8 10 12
Response of DLOGOP_SA to DIRL_SA
.00
.04
.08
2 4 6 8 10 12
Response of DLOGOP_SA to DLOGOP_SA
.00
.04
.08
2 4 6 8 10 12
Response of DLOGOP_SA to DLOGIP_SA
.00
.04
.08
2 4 6 8 10 12
Response of DLOGOP_SA to RSR_SA
- .02
-.01
.00
.01
.02
.03
2 4 6 8 10 12
Response of DLOGIP_SA to DIRS_SA
- .02
-.01
.00
.01
.02
.03
2 4 6 8 10 12
Response of DLOGIP_SA to DIRL_SA
- .02
-.01
.00
.01
.02
.03
2 4 6 8 10 12
Response of DLOGIP_SA to DLOGOP_SA
- .02
-.01
.00
.01
.02
.03
2 4 6 8 10 12
Response of DLOGIP_SA to DLOGIP_SA
- .02
-.01
.00
.01
.02
.03
2 4 6 8 10 12
Response of DLOGIP_SA to RSR_SA
- .02
.00
.02
.04
.06
2 4 6 8 10 12
Response of RSR_SA to DIRS_SA
- .02
.00
.02
.04
.06
2 4 6 8 10 12
Response of RSR_SA to DIRL_SA
- .02
.00
.02
.04
.06
2 4 6 8 10 12
Response of RSR_SA to DLOGOP_SA
- .02
.00
.02
.04
.06
2 4 6 8 10 12
Response of RSR_SA to DLOGIP_SA
- .02
.00
.02
.04
.06
2 4 6 8 10 12
Response of RSR_SA to RSR_SA
Response to Cholesky One S.D. Innovations ± 2 S.E.
Spain
- .05
.00
.05
.10
.15
.20
2 4 6 8 10 12
Response of DIRS_SA to DIRS_SA
- .05
.00
.05
.10
.15
.20
2 4 6 8 10 12
Response of DIRS_SA to DIRL_SA
- .05
.00
.05
.10
.15
.20
2 4 6 8 10 12
Response of DIRS_SA to DLOGOP_SA
- .05
.00
.05
.10
.15
.20
2 4 6 8 10 12
Response of DIRS_SA to DLOGIP_SA
- .05
.00
.05
.10
.15
.20
2 4 6 8 10 12
Response of DIRS_SA to RSR_SA
- .1
.0
.1
.2
.3
2 4 6 8 10 12
Response of DIRL_SA to DIRS_SA
- .1
.0
.1
.2
.3
2 4 6 8 10 12
Response of DIRL_SA to DIRL_SA
- .1
.0
.1
.2
.3
2 4 6 8 10 12
Response of DIRL_SA to DLOGOP_SA
- .1
.0
.1
.2
.3
2 4 6 8 10 12
Response of DIRL_SA to DLOGIP_SA
- .1
.0
.1
.2
.3
2 4 6 8 10 12
Response of DIRL_SA to RSR_SA
- .04
.00
.04
.08
.12
2 4 6 8 10 12
Response of DLOGOP_SA to DIRS_SA
- .04
.00
.04
.08
.12
2 4 6 8 10 12
Response of DLOGOP_SA to DIRL_SA
- .04
.00
.04
.08
.12
2 4 6 8 10 12
Response of DLOGOP_SA to DLOGOP_SA
- .04
.00
.04
.08
.12
2 4 6 8 10 12
Response of DLOGOP_SA to DLOGIP_SA
- .04
.00
.04
.08
.12
2 4 6 8 10 12
Response of DLOGOP_SA to RSR_SA
- .008
-.004
.000
.004
.008
.012
.016
2 4 6 8 10 12
Response of DLOGIP_SA to DIRS_SA
- .008
-.004
.000
.004
.008
.012
.016
2 4 6 8 10 12
Response of DLOGIP_SA to DIRL_SA
- .008
-.004
.000
.004
.008
.012
.016
2 4 6 8 10 12
Response of DLOGIP_SA to DLOGOP_SA
- .008
-.004
.000
.004
.008
.012
.016
2 4 6 8 10 12
Response of DLOGIP_SA to DLOGIP_SA
- .008
-.004
.000
.004
.008
.012
.016
2 4 6 8 10 12
Response of DLOGIP_SA to RSR_SA
- .02
.00
.02
.04
.06
2 4 6 8 10 12
Response of RSR_SA to DIRS_SA
- .02
.00
.02
.04
.06
2 4 6 8 10 12
Response of RSR_SA to DIRL_SA
- .02
.00
.02
.04
.06
2 4 6 8 10 12
Response of RSR_SA to DLOGOP_SA
- .02
.00
.02
.04
.06
2 4 6 8 10 12
Response of RSR_SA to DLOGIP_SA
- .02
.00
.02
.04
.06
2 4 6 8 10 12
Response of RSR_SA to RSR_SA
Response to Cholesky One S.D. Innovations ± 2 S.E.
B.2. Subsample: 1997m03-2008m08
Greece
- .2
-.1
.0
.1
.2
.3
.4
2 4 6 8 10 12
Response of DIRS_SA to DIRS_SA
- .2
-.1
.0
.1
.2
.3
.4
2 4 6 8 10 12
Response of DIRS_SA to DIRL_SA
- .2
-.1
.0
.1
.2
.3
.4
2 4 6 8 10 12
Response of DIRS_SA to DLOGOP_SA
- .2
-.1
.0
.1
.2
.3
.4
2 4 6 8 10 12
Response of DIRS_SA to DLOGIP_SA
- .2
-.1
.0
.1
.2
.3
.4
2 4 6 8 10 12
Response of DIRS_SA to RSR_SA
- .2
-.1
.0
.1
.2
.3
2 4 6 8 10 12
Response of DIRL_SA to DIRS_SA
- .2
-.1
.0
.1
.2
.3
2 4 6 8 10 12
Response of DIRL_SA to DIRL_SA
- .2
-.1
.0
.1
.2
.3
2 4 6 8 10 12
Response of DIRL_SA to DLOGOP_SA
- .2
-.1
.0
.1
.2
.3
2 4 6 8 10 12
Response of DIRL_SA to DLOGIP_SA
- .2
-.1
.0
.1
.2
.3
2 4 6 8 10 12
Response of DIRL_SA to RSR_SA
- .04
.00
.04
.08
.12
2 4 6 8 10 12
Response of DLOGOP_SA to DIRS_SA
- .04
.00
.04
.08
.12
2 4 6 8 10 12
Response of DLOGOP_SA to DIRL_SA
- .04
.00
.04
.08
.12
2 4 6 8 10 12
Response of DLOGOP_SA to DLOGOP_SA
- .04
.00
.04
.08
.12
2 4 6 8 10 12
Response of DLOGOP_SA to DLOGIP_SA
- .04
.00
.04
.08
.12
2 4 6 8 10 12
Response of DLOGOP_SA to RSR_SA
- .02
-.01
.00
.01
.02
.03
2 4 6 8 10 12
Response of DLOGIP_SA to DIRS_SA
- .02
-.01
.00
.01
.02
.03
2 4 6 8 10 12
Response of DLOGIP_SA to DIRL_SA
- .02
-.01
.00
.01
.02
.03
2 4 6 8 10 12
Response of DLOGIP_SA to DLOGOP_SA
- .02
-.01
.00
.01
.02
.03
2 4 6 8 10 12
Response of DLOGIP_SA to DLOGIP_SA
- .02
-.01
.00
.01
.02
.03
2 4 6 8 10 12
Response of DLOGIP_SA to RSR_SA
- .02
.00
.02
.04
.06
.08
2 4 6 8 10 12
Response of RSR_SA to DIRS_SA
- .02
.00
.02
.04
.06
.08
2 4 6 8 10 12
Response of RSR_SA to DIRL_SA
- .02
.00
.02
.04
.06
.08
2 4 6 8 10 12
Response of RSR_SA to DLOGOP_SA
- .02
.00
.02
.04
.06
.08
2 4 6 8 10 12
Response of RSR_SA to DLOGIP_SA
- .02
.00
.02
.04
.06
.08
2 4 6 8 10 12
Response of RSR_SA to RSR_SA
Response to Cholesky One S.D. Innovations ± 2 S.E.

47
Ireland
- .1
.0
.1
.2
.3
2 4 6 8 10 12
Response of DIRS_SA to DIRS_SA
- .1
.0
.1
.2
.3
2 4 6 8 10 12
Response of DIRS_SA to DIRL_SA
- .1
.0
.1
.2
.3
2 4 6 8 10 12
Response of DIRS_SA to DLOGOP_SA
- .1
.0
.1
.2
.3
2 4 6 8 10 12
Response of DIRS_SA to DLOGIP_SA
- .1
.0
.1
.2
.3
2 4 6 8 10 12
Response of DIRS_SA to RSR_SA
- .1
.0
.1
.2
.3
2 4 6 8 10 12
Response of DIRL_SA to DIRS_SA
- .1
.0
.1
.2
.3
2 4 6 8 10 12
Response of DIRL_SA to DIRL_SA
- .1
.0
.1
.2
.3
2 4 6 8 10 12
Response of DIRL_SA to DLOGOP_SA
- .1
.0
.1
.2
.3
2 4 6 8 10 12
Response of DIRL_SA to DLOGIP_SA
- .1
.0
.1
.2
.3
2 4 6 8 10 12
Response of DIRL_SA to RSR_SA
- .04
.00
.04
.08
.12
2 4 6 8 10 12
Response of DLOGOP_SA to DIRS_SA
- .04
.00
.04
.08
.12
2 4 6 8 10 12
Response of DLOGOP_SA to DIRL_SA
- .04
.00
.04
.08
.12
2 4 6 8 10 12
Response of DLOGOP_SA to DLOGOP_SA
- .04
.00
.04
.08
.12
2 4 6 8 10 12
Response of DLOGOP_SA to DLOGIP_SA
- .04
.00
.04
.08
.12
2 4 6 8 10 12
Response of DLOGOP_SA to RSR_SA
- .04
-.02
.00
.02
.04
.06
2 4 6 8 10 12
Response of DLOGIP_SA to DIRS_SA
- .04
-.02
.00
.02
.04
.06
2 4 6 8 10 12
Response of DLOGIP_SA to DIRL_SA
- .04
-.02
.00
.02
.04
.06
2 4 6 8 10 12
Response of DLOGIP_SA to DLOGOP_SA
- .04
-.02
.00
.02
.04
.06
2 4 6 8 10 12
Response of DLOGIP_SA to DLOGIP_SA
- .04
-.02
.00
.02
.04
.06
2 4 6 8 10 12
Response of DLOGIP_SA to RSR_SA
- .02
.00
.02
.04
.06
2 4 6 8 10 12
Response of RSR_SA to DIRS_SA
- .02
.00
.02
.04
.06
2 4 6 8 10 12
Response of RSR_SA to DIRL_SA
- .02
.00
.02
.04
.06
2 4 6 8 10 12
Response of RSR_SA to DLOGOP_SA
- .02
.00
.02
.04
.06
2 4 6 8 10 12
Response of RSR_SA to DLOGIP_SA
- .02
.00
.02
.04
.06
2 4 6 8 10 12
Response of RSR_SA to RSR_SA
Response to Cholesky One S.D. Innovations ± 2 S.E.
Italy
- .1
.0
.1
.2
.3
2 4 6 8 10 12
Response of DIRS_SA to DIRS_SA
- .1
.0
.1
.2
.3
2 4 6 8 10 12
Response of DIRS_SA to DIRL_SA
- .1
.0
.1
.2
.3
2 4 6 8 10 12
Response of DIRS_SA to DLOGOP_SA
- .1
.0
.1
.2
.3
2 4 6 8 10 12
Response of DIRS_SA to DLOGIP_SA
- .1
.0
.1
.2
.3
2 4 6 8 10 12
Response of DIRS_SA to RSR_SA
- .1
.0
.1
.2
.3
2 4 6 8 10 12
Response of DIRL_SA to DIRS_SA
- .1
.0
.1
.2
.3
2 4 6 8 10 12
Response of DIRL_SA to DIRL_SA
- .1
.0
.1
.2
.3
2 4 6 8 10 12
Response of DIRL_SA to DLOGOP_SA
- .1
.0
.1
.2
.3
2 4 6 8 10 12
Response of DIRL_SA to DLOGIP_SA
- .1
.0
.1
.2
.3
2 4 6 8 10 12
Response of DIRL_SA to RSR_SA
- .04
.00
.04
.08
.12
2 4 6 8 10 12
Response of DLOGOP_SA to DIRS_SA
- .04
.00
.04
.08
.12
2 4 6 8 10 12
Response of DLOGOP_SA to DIRL_SA
- .04
.00
.04
.08
.12
2 4 6 8 10 12
Response of DLOGOP_SA to DLOGOP_SA
- .04
.00
.04
.08
.12
2 4 6 8 10 12
Response of DLOGOP_SA to DLOGIP_SA
- .04
.00
.04
.08
.12
2 4 6 8 10 12
Response of DLOGOP_SA to RSR_SA
- .005
.000
.005
.010
.015
2 4 6 8 10 12
Response of DLOGIP_SA to DIRS_SA
- .005
.000
.005
.010
.015
2 4 6 8 10 12
Response of DLOGIP_SA to DIRL_SA
- .005
.000
.005
.010
.015
2 4 6 8 10 12
Response of DLOGIP_SA to DLOGOP_SA
- .005
.000
.005
.010
.015
2 4 6 8 10 12
Response of DLOGIP_SA to DLOGIP_SA
- .005
.000
.005
.010
.015
2 4 6 8 10 12
Response of DLOGIP_SA to RSR_SA
- .02
.00
.02
.04
.06
2 4 6 8 10 12
Response of RSR_SA to DIRS_SA
- .02
.00
.02
.04
.06
2 4 6 8 10 12
Response of RSR_SA to DIRL_SA
- .02
.00
.02
.04
.06
2 4 6 8 10 12
Response of RSR_SA to DLOGOP_SA
- .02
.00
.02
.04
.06
2 4 6 8 10 12
Response of RSR_SA to DLOGIP_SA
- .02
.00
.02
.04
.06
2 4 6 8 10 12
Response of RSR_SA to RSR_SA
Response to Cholesky One S.D. Innovations ± 2 S.E.
Portugal
- .1
.0
.1
.2
.3
.4
2 4 6 8 10 12
Response of DIRS_SA to DIRS_SA
- .1
.0
.1
.2
.3
.4
2 4 6 8 10 12
Response of DIRS_SA to DIRL_SA
- .1
.0
.1
.2
.3
.4
2 4 6 8 10 12
Response of DIRS_SA to DLOGOP_SA
- .1
.0
.1
.2
.3
.4
2 4 6 8 10 12
Response of DIRS_SA to DLOGIP_SA
- .1
.0
.1
.2
.3
.4
2 4 6 8 10 12
Response of DIRS_SA to RSR_SA
- .05
.00
.05
.10
.15
.20
2 4 6 8 10 12
Response of DIRL_SA to DIRS_SA
- .05
.00
.05
.10
.15
.20
2 4 6 8 10 12
Response of DIRL_SA to DIRL_SA
- .05
.00
.05
.10
.15
.20
2 4 6 8 10 12
Response of DIRL_SA to DLOGOP_SA
- .05
.00
.05
.10
.15
.20
2 4 6 8 10 12
Response of DIRL_SA to DLOGIP_SA
- .05
.00
.05
.10
.15
.20
2 4 6 8 10 12
Response of DIRL_SA to RSR_SA
- .04
.00
.04
.08
.12
2 4 6 8 10 12
Response of DLOGOP_SA to DIRS_SA
- .04
.00
.04
.08
.12
2 4 6 8 10 12
Response of DLOGOP_SA to DIRL_SA
- .04
.00
.04
.08
.12
2 4 6 8 10 12
Response of DLOGOP_SA to DLOGOP_SA
- .04
.00
.04
.08
.12
2 4 6 8 10 12
Response of DLOGOP_SA to DLOGIP_SA
- .04
.00
.04
.08
.12
2 4 6 8 10 12
Response of DLOGOP_SA to RSR_SA
- .02
-.01
.00
.01
.02
.03
2 4 6 8 10 12
Response of DLOGIP_SA to DIRS_SA
- .02
-.01
.00
.01
.02
.03
2 4 6 8 10 12
Response of DLOGIP_SA to DIRL_SA
- .02
-.01
.00
.01
.02
.03
2 4 6 8 10 12
Response of DLOGIP_SA to DLOGOP_SA
- .02
-.01
.00
.01
.02
.03
2 4 6 8 10 12
Response of DLOGIP_SA to DLOGIP_SA
- .02
-.01
.00
.01
.02
.03
2 4 6 8 10 12
Response of DLOGIP_SA to RSR_SA
- .02
.00
.02
.04
.06
2 4 6 8 10 12
Response of RSR_SA to DIRS_SA
- .02
.00
.02
.04
.06
2 4 6 8 10 12
Response of RSR_SA to DIRL_SA
- .02
.00
.02
.04
.06
2 4 6 8 10 12
Response of RSR_SA to DLOGOP_SA
- .02
.00
.02
.04
.06
2 4 6 8 10 12
Response of RSR_SA to DLOGIP_SA
- .02
.00
.02
.04
.06
2 4 6 8 10 12
Response of RSR_SA to RSR_SA
Response to Cholesky One S.D. Innovations ± 2 S.E.

48
Spain
- .1
.0
.1
.2
2 4 6 8 10 12
Response of DIRS_SA to DIRS_SA
- .1
.0
.1
.2
2 4 6 8 10 12
Response of DIRS_SA to DIRL_SA
- .1
.0
.1
.2
2 4 6 8 10 12
Response of DIRS_SA to DLOGOP_SA
- .1
.0
.1
.2
2 4 6 8 10 12
Response of DIRS_SA to DLOGIP_SA
- .1
.0
.1
.2
2 4 6 8 10 12
Response of DIRS_SA to RSR_SA
- .1
.0
.1
.2
2 4 6 8 10 12
Response of DIRL_SA to DIRS_SA
- .1
.0
.1
.2
2 4 6 8 10 12
Response of DIRL_SA to DIRL_SA
- .1
.0
.1
.2
2 4 6 8 10 12
Response of DIRL_SA to DLOGOP_SA
- .1
.0
.1
.2
2 4 6 8 10 12
Response of DIRL_SA to DLOGIP_SA
- .1
.0
.1
.2
2 4 6 8 10 12
Response of DIRL_SA to RSR_SA
- .04
.00
.04
.08
.12
2 4 6 8 10 12
Response of DLOGOP_SA to DIRS_SA
- .04
.00
.04
.08
.12
2 4 6 8 10 12
Response of DLOGOP_SA to DIRL_SA
- .04
.00
.04
.08
.12
2 4 6 8 10 12
Response of DLOGOP_SA to DLOGOP_SA
- .04
.00
.04
.08
.12
2 4 6 8 10 12
Response of DLOGOP_SA to DLOGIP_SA
- .04
.00
.04
.08
.12
2 4 6 8 10 12
Response of DLOGOP_SA to RSR_SA
- .008
-.004
.000
.004
.008
.012
.016
2 4 6 8 10 12
Response of DLOGIP_SA to DIRS_SA
- .008
-.004
.000
.004
.008
.012
.016
2 4 6 8 10 12
Response of DLOGIP_SA to DIRL_SA
- .008
-.004
.000
.004
.008
.012
.016
2 4 6 8 10 12
Response of DLOGIP_SA to DLOGOP_SA
- .008
-.004
.000
.004
.008
.012
.016
2 4 6 8 10 12
Response of DLOGIP_SA to DLOGIP_SA
- .008
-.004
.000
.004
.008
.012
.016
2 4 6 8 10 12
Response of DLOGIP_SA to RSR_SA
- .02
.00
.02
.04
.06
2 4 6 8 10 12
Response of RSR_SA to DIRS_SA
- .02
.00
.02
.04
.06
2 4 6 8 10 12
Response of RSR_SA to DIRL_SA
- .02
.00
.02
.04
.06
2 4 6 8 10 12
Response of RSR_SA to DLOGOP_SA
- .02
.00
.02
.04
.06
2 4 6 8 10 12
Response of RSR_SA to DLOGIP_SA
- .02
.00
.02
.04
.06
2 4 6 8 10 12
Response of RSR_SA to RSR_SA
Response to Cholesky One S.D. Innovations ± 2 S.E.
Appendix C: Alternative VAR specification
C.1: Impulse responses (AIC). Whole sample (1993m07-2014m01): Orthogonalized impulse response function of real stock returns to world
real oil price shocks in VAR (d(irs), d(irl), dlog(op), dlog(ip), rsr).
Greece AIC (6 lags)
- .2
-.1
.0
.1
.2
.3
.4
2 4 6 8 10 12
Response of DIRS_SA to DIRS_SA
- .2
-.1
.0
.1
.2
.3
.4
2 4 6 8 10 12
Response of DIRS_SA to DIRL_SA
- .2
-.1
.0
.1
.2
.3
.4
2 4 6 8 10 12
Response of DIRS_SA to DLOGOP_SA
- .2
-.1
.0
.1
.2
.3
.4
2 4 6 8 10 12
Response of DIRS_SA to DLOGIP_SA
- .2
-.1
.0
.1
.2
.3
.4
2 4 6 8 10 12
Response of DIRS_SA to RSR_SA
-0.5
0.0
0.5
1.0
1.5
2 4 6 8 10 12
Response of DIRL_SA to DIRS_SA
-0.5
0.0
0.5
1.0
1.5
2 4 6 8 10 12
Response of DIRL_SA to DIRL_SA
-0.5
0.0
0.5
1.0
1.5
2 4 6 8 10 12
Response of DIRL_SA to DLOGOP_SA
-0.5
0.0
0.5
1.0
1.5
2 4 6 8 10 12
Response of DIRL_SA to DLOGIP_SA
-0.5
0.0
0.5
1.0
1.5
2 4 6 8 10 12
Response of DIRL_SA to RSR_SA
- .04
.00
.04
.08
2 4 6 8 10 12
Response of DLOGOP_SA to DIRS_SA
- .04
.00
.04
.08
2 4 6 8 10 12
Response of DLOGOP_SA to DIRL_SA
- .04
.00
.04
.08
2 4 6 8 10 12
Response of DLOGOP_SA to DLOGOP_SA
- .04
.00
.04
.08
2 4 6 8 10 12
Response of DLOGOP_SA to DLOGIP_SA
- .04
.00
.04
.08
2 4 6 8 10 12
Response of DLOGOP_SA to RSR_SA
- .02
-.01
.00
.01
.02
.03
2 4 6 8 10 12
Response of DLOGIP_SA to DIRS_SA
- .02
-.01
.00
.01
.02
.03
2 4 6 8 10 12
Response of DLOGIP_SA to DIRL_SA
- .02
-.01
.00
.01
.02
.03
2 4 6 8 10 12
Response of DLOGIP_SA to DLOGOP_SA
- .02
-.01
.00
.01
.02
.03
2 4 6 8 10 12
Response of DLOGIP_SA to DLOGIP_SA
- .02
-.01
.00
.01
.02
.03
2 4 6 8 10 12
Response of DLOGIP_SA to RSR_SA
- .04
.00
.04
.08
2 4 6 8 10 12
Response of RSR_SA to DIRS_SA
- .04
.00
.04
.08
2 4 6 8 10 12
Response of RSR_SA to DIRL_SA
- .04
.00
.04
.08
2 4 6 8 10 12
Response of RSR_SA to DLOGOP_SA
- .04
.00
.04
.08
2 4 6 8 10 12
Response of RSR_SA to DLOGIP_SA
- .04
.00
.04
.08
2 4 6 8 10 12
Response of RSR_SA to RSR_SA
Response to Cholesky One S.D. Innovations ± 2 S.E.

49
Ireland AIC (3 lags)
- .05
.00
.05
.10
.15
.20
2 4 6 8 10 12
Response of DIRS_SA to DIRS_SA
- .05
.00
.05
.10
.15
.20
2 4 6 8 10 12
Response of DIRS_SA to DIRL_SA
- .05
.00
.05
.10
.15
.20
2 4 6 8 10 12
Response of DIRS_SA to DLOGOP_SA
- .05
.00
.05
.10
.15
.20
2 4 6 8 10 12
Response of DIRS_SA to DLOGIP_SA
- .05
.00
.05
.10
.15
.20
2 4 6 8 10 12
Response of DIRS_SA to RSR_SA
- .1
.0
.1
.2
.3
.4
2 4 6 8 10 12
Response of DIRL_SA to DIRS_SA
- .1
.0
.1
.2
.3
.4
2 4 6 8 10 12
Response of DIRL_SA to DIRL_SA
- .1
.0
.1
.2
.3
.4
2 4 6 8 10 12
Response of DIRL_SA to DLOGOP_SA
- .1
.0
.1
.2
.3
.4
2 4 6 8 10 12
Response of DIRL_SA to DLOGIP_SA
- .1
.0
.1
.2
.3
.4
2 4 6 8 10 12
Response of DIRL_SA to RSR_SA
- .04
.00
.04
.08
.12
2 4 6 8 10 12
Response of DLOGOP_SA to DIRS_SA
- .04
.00
.04
.08
.12
2 4 6 8 10 12
Response of DLOGOP_SA to DIRL_SA
- .04
.00
.04
.08
.12
2 4 6 8 10 12
Response of DLOGOP_SA to DLOGOP_SA
- .04
.00
.04
.08
.12
2 4 6 8 10 12
Response of DLOGOP_SA to DLOGIP_SA
- .04
.00
.04
.08
.12
2 4 6 8 10 12
Response of DLOGOP_SA to RSR_SA
- .04
-.02
.00
.02
.04
.06
2 4 6 8 10 12
Response of DLOGIP_SA to DIRS_SA
- .04
-.02
.00
.02
.04
.06
2 4 6 8 10 12
Response of DLOGIP_SA to DIRL_SA
- .04
-.02
.00
.02
.04
.06
2 4 6 8 10 12
Response of DLOGIP_SA to DLOGOP_SA
- .04
-.02
.00
.02
.04
.06
2 4 6 8 10 12
Response of DLOGIP_SA to DLOGIP_SA
- .04
-.02
.00
.02
.04
.06
2 4 6 8 10 12
Response of DLOGIP_SA to RSR_SA
- .02
.00
.02
.04
.06
2 4 6 8 10 12
Response of RSR_SA to DIRS_SA
- .02
.00
.02
.04
.06
2 4 6 8 10 12
Response of RSR_SA to DIRL_SA
- .02
.00
.02
.04
.06
2 4 6 8 10 12
Response of RSR_SA to DLOGOP_SA
- .02
.00
.02
.04
.06
2 4 6 8 10 12
Response of RSR_SA to DLOGIP_SA
- .02
.00
.02
.04
.06
2 4 6 8 10 12
Response of RSR_SA to RSR_SA
Response to Cholesky One S.D. Innovations ± 2 S.E.
Italy AIC (3 lags)
- .1
.0
.1
.2
.3
2 4 6 8 10 12
Response of DIRS_SA to DIRS_SA
- .1
.0
.1
.2
.3
2 4 6 8 10 12
Response of DIRS_SA to DIRL_SA
- .1
.0
.1
.2
.3
2 4 6 8 10 12
Response of DIRS_SA to DLOGOP_SA
- .1
.0
.1
.2
.3
2 4 6 8 10 12
Response of DIRS_SA to DLOGIP_SA
- .1
.0
.1
.2
.3
2 4 6 8 10 12
Response of DIRS_SA to RSR_SA
- .1
.0
.1
.2
.3
2 4 6 8 10 12
Response of DIRL_SA to DIRS_SA
- .1
.0
.1
.2
.3
2 4 6 8 10 12
Response of DIRL_SA to DIRL_SA
- .1
.0
.1
.2
.3
2 4 6 8 10 12
Response of DIRL_SA to DLOGOP_SA
- .1
.0
.1
.2
.3
2 4 6 8 10 12
Response of DIRL_SA to DLOGIP_SA
- .1
.0
.1
.2
.3
2 4 6 8 10 12
Response of DIRL_SA to RSR_SA
- .04
.00
.04
.08
.12
2 4 6 8 10 12
Response of DLOGOP_SA to DIRS_SA
- .04
.00
.04
.08
.12
2 4 6 8 10 12
Response of DLOGOP_SA to DIRL_SA
- .04
.00
.04
.08
.12
2 4 6 8 10 12
Response of DLOGOP_SA to DLOGOP_SA
- .04
.00
.04
.08
.12
2 4 6 8 10 12
Response of DLOGOP_SA to DLOGIP_SA
- .04
.00
.04
.08
.12
2 4 6 8 10 12
Response of DLOGOP_SA to RSR_SA
- .005
.000
.005
.010
.015
2 4 6 8 10 12
Response of DLOGIP_SA to DIRS_SA
- .005
.000
.005
.010
.015
2 4 6 8 10 12
Response of DLOGIP_SA to DIRL_SA
- .005
.000
.005
.010
.015
2 4 6 8 10 12
Response of DLOGIP_SA to DLOGOP_SA
- .005
.000
.005
.010
.015
2 4 6 8 10 12
Response of DLOGIP_SA to DLOGIP_SA
- .005
.000
.005
.010
.015
2 4 6 8 10 12
Response of DLOGIP_SA to RSR_SA
- .02
.00
.02
.04
.06
2 4 6 8 10 12
Response of RSR_SA to DIRS_SA
- .02
.00
.02
.04
.06
2 4 6 8 10 12
Response of RSR_SA to DIRL_SA
- .02
.00
.02
.04
.06
2 4 6 8 10 12
Response of RSR_SA to DLOGOP_SA
- .02
.00
.02
.04
.06
2 4 6 8 10 12
Response of RSR_SA to DLOGIP_SA
- .02
.00
.02
.04
.06
2 4 6 8 10 12
Response of RSR_SA to RSR_SA
Response to Cholesky One S.D. Innovations ± 2 S.E.
Portugal AIC (2 lags)
- .1
.0
.1
.2
.3
.4
2 4 6 8 10 12
Response of DIRS_SA to DIRS_SA
- .1
.0
.1
.2
.3
.4
2 4 6 8 10 12
Response of DIRS_SA to DIRL_SA
- .1
.0
.1
.2
.3
.4
2 4 6 8 10 12
Response of DIRS_SA to DLOGOP_SA
- .1
.0
.1
.2
.3
.4
2 4 6 8 10 12
Response of DIRS_SA to DLOGIP_SA
- .1
.0
.1
.2
.3
.4
2 4 6 8 10 12
Response of DIRS_SA to RSR_SA
- .1
.0
.1
.2
.3
.4
2 4 6 8 10 12
Response of DIRL_SA to DIRS_SA
- .1
.0
.1
.2
.3
.4
2 4 6 8 10 12
Response of DIRL_SA to DIRL_SA
- .1
.0
.1
.2
.3
.4
2 4 6 8 10 12
Response of DIRL_SA to DLOGOP_SA
- .1
.0
.1
.2
.3
.4
2 4 6 8 10 12
Response of DIRL_SA to DLOGIP_SA
- .1
.0
.1
.2
.3
.4
2 4 6 8 10 12
Response of DIRL_SA to RSR_SA
- .04
.00
.04
.08
.12
2 4 6 8 10 12
Response of DLOGOP_SA to DIRS_SA
- .04
.00
.04
.08
.12
2 4 6 8 10 12
Response of DLOGOP_SA to DIRL_SA
- .04
.00
.04
.08
.12
2 4 6 8 10 12
Response of DLOGOP_SA to DLOGOP_SA
- .04
.00
.04
.08
.12
2 4 6 8 10 12
Response of DLOGOP_SA to DLOGIP_SA
- .04
.00
.04
.08
.12
2 4 6 8 10 12
Response of DLOGOP_SA to RSR_SA
- .02
-.01
.00
.01
.02
.03
2 4 6 8 10 12
Response of DLOGIP_SA to DIRS_SA
- .02
-.01
.00
.01
.02
.03
2 4 6 8 10 12
Response of DLOGIP_SA to DIRL_SA
- .02
-.01
.00
.01
.02
.03
2 4 6 8 10 12
Response of DLOGIP_SA to DLOGOP_SA
- .02
-.01
.00
.01
.02
.03
2 4 6 8 10 12
Response of DLOGIP_SA to DLOGIP_SA
- .02
-.01
.00
.01
.02
.03
2 4 6 8 10 12
Response of DLOGIP_SA to RSR_SA
- .02
.00
.02
.04
.06
2 4 6 8 10 12
Response of RSR_SA to DIRS_SA
- .02
.00
.02
.04
.06
2 4 6 8 10 12
Response of RSR_SA to DIRL_SA
- .02
.00
.02
.04
.06
2 4 6 8 10 12
Response of RSR_SA to DLOGOP_SA
- .02
.00
.02
.04
.06
2 4 6 8 10 12
Response of RSR_SA to DLOGIP_SA
- .02
.00
.02
.04
.06
2 4 6 8 10 12
Response of RSR_SA to RSR_SA
Response to Cholesky One S.D. Innovations ± 2 S.E.
Spain AIC (3 lags)
- .05
.00
.05
.10
.15
.20
2 4 6 8 10 12
Response of DIRS_SA to DIRS_SA
- .05
.00
.05
.10
.15
.20
2 4 6 8 10 12
Response of DIRS_SA to DIRL_SA
- .05
.00
.05
.10
.15
.20
2 4 6 8 10 12
Response of DIRS_SA to DLOGOP_SA
- .05
.00
.05
.10
.15
.20
2 4 6 8 10 12
Response of DIRS_SA to DLOGIP_SA
- .05
.00
.05
.10
.15
.20
2 4 6 8 10 12
Response of DIRS_SA to RSR_SA
- .1
.0
.1
.2
.3
2 4 6 8 10 12
Response of DIRL_SA to DIRS_SA
- .1
.0
.1
.2
.3
2 4 6 8 10 12
Response of DIRL_SA to DIRL_SA
- .1
.0
.1
.2
.3
2 4 6 8 10 12
Response of DIRL_SA to DLOGOP_SA
- .1
.0
.1
.2
.3
2 4 6 8 10 12
Response of DIRL_SA to DLOGIP_SA
- .1
.0
.1
.2
.3
2 4 6 8 10 12
Response of DIRL_SA to RSR_SA
- .04
.00
.04
.08
.12
2 4 6 8 10 12
Response of DLOGOP_SA to DIRS_SA
- .04
.00
.04
.08
.12
2 4 6 8 10 12
Response of DLOGOP_SA to DIRL_SA
- .04
.00
.04
.08
.12
2 4 6 8 10 12
Response of DLOGOP_SA to DLOGOP_SA
- .04
.00
.04
.08
.12
2 4 6 8 10 12
Response of DLOGOP_SA to DLOGIP_SA
- .04
.00
.04
.08
.12
2 4 6 8 10 12
Response of DLOGOP_SA to RSR_SA
- .010
-.005
.000
.005
.010
.015
2 4 6 8 10 12
Response of DLOGIP_SA to DIRS_SA
- .010
-.005
.000
.005
.010
.015
2 4 6 8 10 12
Response of DLOGIP_SA to DIRL_SA
- .010
-.005
.000
.005
.010
.015
2 4 6 8 10 12
Response of DLOGIP_SA to DLOGOP_SA
- .010
-.005
.000
.005
.010
.015
2 4 6 8 10 12
Response of DLOGIP_SA to DLOGIP_SA
- .010
-.005
.000
.005
.010
.015
2 4 6 8 10 12
Response of DLOGIP_SA to RSR_SA
- .02
.00
.02
.04
.06
2 4 6 8 10 12
Response of RSR_SA to DIRS_SA
- .02
.00
.02
.04
.06
2 4 6 8 10 12
Response of RSR_SA to DIRL_SA
- .02
.00
.02
.04
.06
2 4 6 8 10 12
Response of RSR_SA to DLOGOP_SA
- .02
.00
.02
.04
.06
2 4 6 8 10 12
Response of RSR_SA to DLOGIP_SA
- .02
.00
.02
.04
.06
2 4 6 8 10 12
Response of RSR_SA to RSR_SA
Response to Cholesky One S.D. Innovations ± 2 S.E.

50
C.2: Variance decomposition of rsr due to irs, irl, op and ip. Lags applied in the model
according to AIC information criterion.
1993m07-
2014m01
VAR model: d(irs), d(irl), dlog(op), dlog(ip) and rsr.
Due to IRS Due to IRL Due to OP Due to IP
Greece (lags=6) 4.063076
(2.95032)
4.162242
(2.76901)
2.943797
(3.3188)
7.272448
(3.60811)
Ireland (lags=3) 3.215934
(3.09682)
2.682940
(2.79990)
2.047296
(2.01868)
3.274634
(2.15910)
Italy (lags=3) 2.21009
(1.90592)
0.998711
(2.06379)
1.956151
(2.06411)
2.437694
(1.91327)
Portugal(lags=2) 1.340319
(1.60406)
1.058939
(1.84566)
0.459827
(1.49844)
1.649212
(1.96584)
Spain (lags=3) 1.363326
(1.98220)
1.675968
(2.05614)
0.926731
(1.61887)
3.754831
(2.72843) Notes: The table presents the Variance decomposition of forecast variance, of the real stock returns to IRS, IRL,
OP and IP after 12 months. The model is performed with lags according to AIC information criterion. Monte
Carlo constructed errors are shown in parenthesis.


