
Oil Market Outlook - marinemoney.com Market Outlook The world has changed ... - For 2014 the initial...
25
Oil Market Outlook The world has changed… The DNB oil story in pictures & graphs January 2015 - Torbjørn Kjus
Transcript of Oil Market Outlook - marinemoney.com Market Outlook The world has changed ... - For 2014 the initial...

Oil Market Outlook The world has changed… The DNB oil story in pictures & graphs
January 2015 - Torbjørn Kjus
Torbjørn Kjus – [email protected] – Telephone: +47 24 16 91 66 2
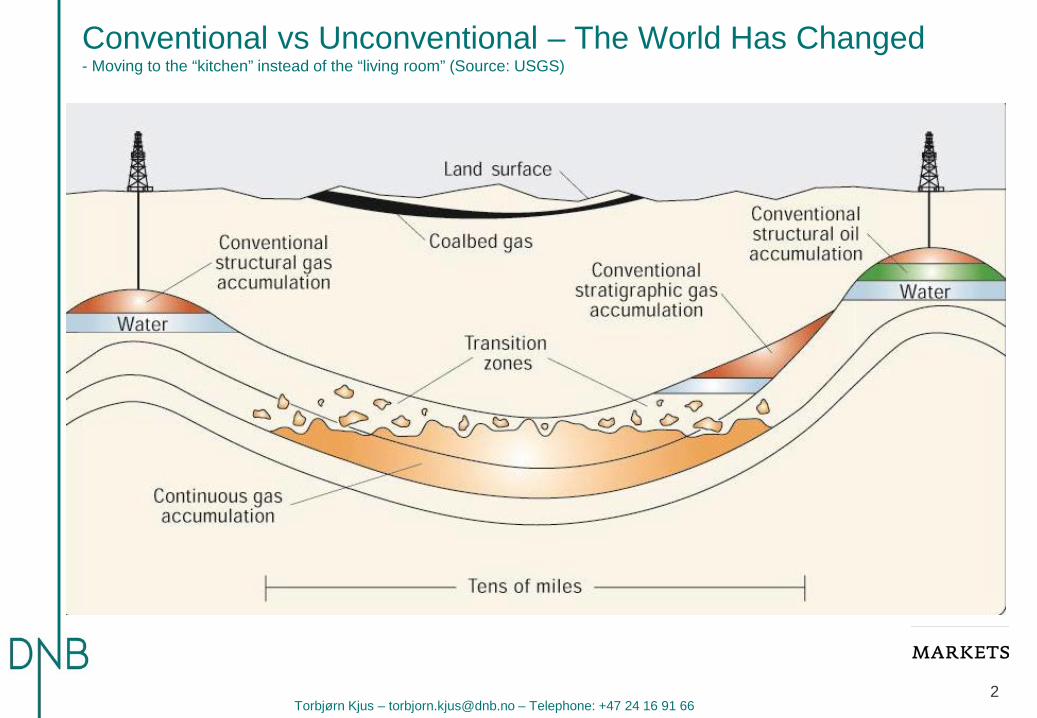
Conventional vs Unconventional – The World Has Changed - Moving to the “kitchen” instead of the “living room” (Source: USGS)

Torbjørn Kjus – [email protected] – Telephone: +47 24 16 91 66 3
Torbjørn Kjus – [email protected] – Telephone: +47 24 16 91 66
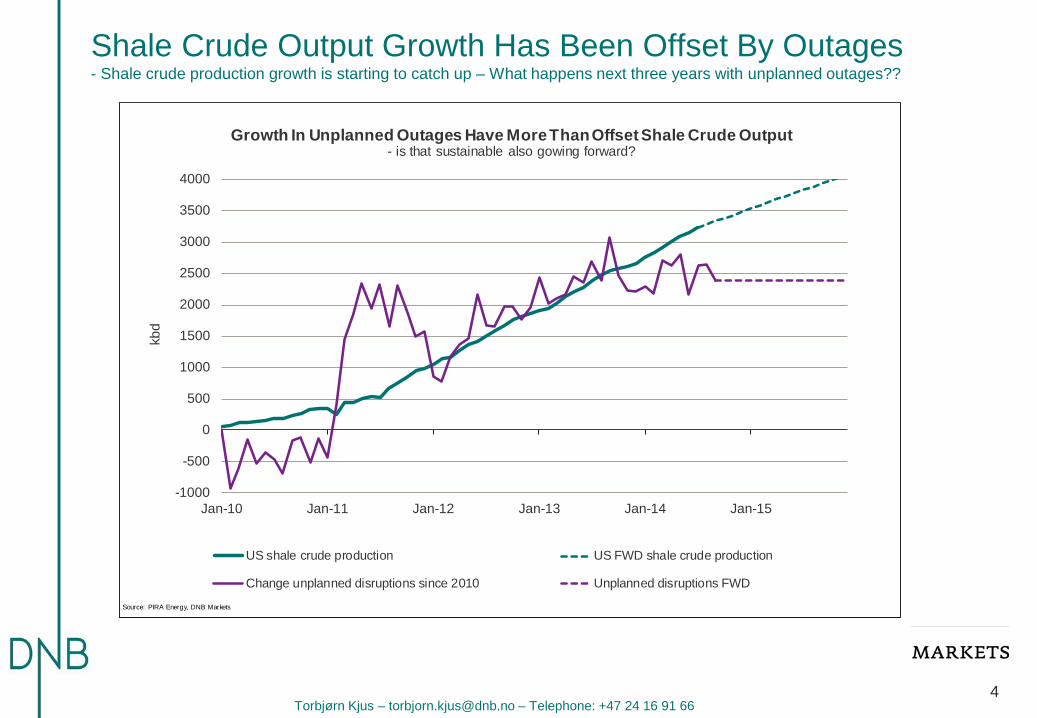
Shale Crude Output Growth Has Been Offset By Outages - Shale crude production growth is starting to catch up – What happens next three years with unplanned outages??
-1000
-500
0
500
1000
1500
2000
2500
3000
3500
4000
Jan-10 Jan-11 Jan-12 Jan-13 Jan-14 Jan-15
kbd
With This Enormous Growth In Shale Oil Production: - why are not oil prices below 100 $/b already?
US shale crude production US FWD shale crude production
Source: PIRA Energy, DNB Markets
-1000
-500
0
500
1000
1500
2000
2500
3000
3500
4000
Jan-10 Jan-11 Jan-12 Jan-13 Jan-14 Jan-15
kbd
Growth In Unplanned Outages Have More Than Offset Shale Crude Output - is that sustainable also gowing forward?
US shale crude production US FWD shale crude production
Change unplanned disruptions since 2010 Unplanned disruptions FWD
Source: PIRA Energy, DNB Markets
4
Torbjørn Kjus – [email protected] – Telephone: +47 24 16 91 66 5
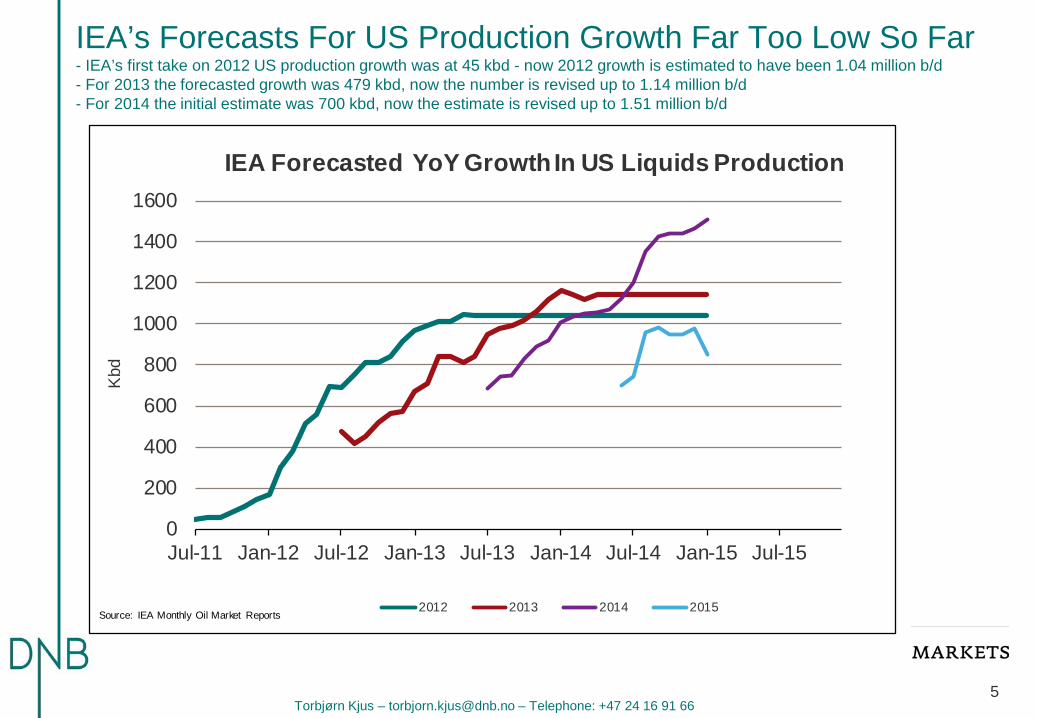
IEA’s Forecasts For US Production Growth Far Too Low So Far - IEA’s first take on 2012 US production growth was at 45 kbd - now 2012 growth is estimated to have been 1.04 million b/d - For 2013 the forecasted growth was 479 kbd, now the number is revised up to 1.14 million b/d - For 2014 the initial estimate was 700 kbd, now the estimate is revised up to 1.51 million b/d
0
200
400
600
800
1000
1200
1400
1600
Jul-11 Jan-12 Jul-12 Jan-13 Jul-13 Jan-14 Jul-14 Jan-15 Jul-15
Kbd
IEA Forecasted YoY Growth In US Liquids Production
2012 2013 2014 2015Source: IEA Monthly Oil Market Reports

Torbjørn Kjus – [email protected] – Telephone: +47 24 16 91 66 6
Nobody Were More Bearish Than DNB In October - But we were not bearish enough
Torbjørn Kjus – [email protected] – Telephone: +47 24 16 91 66 7
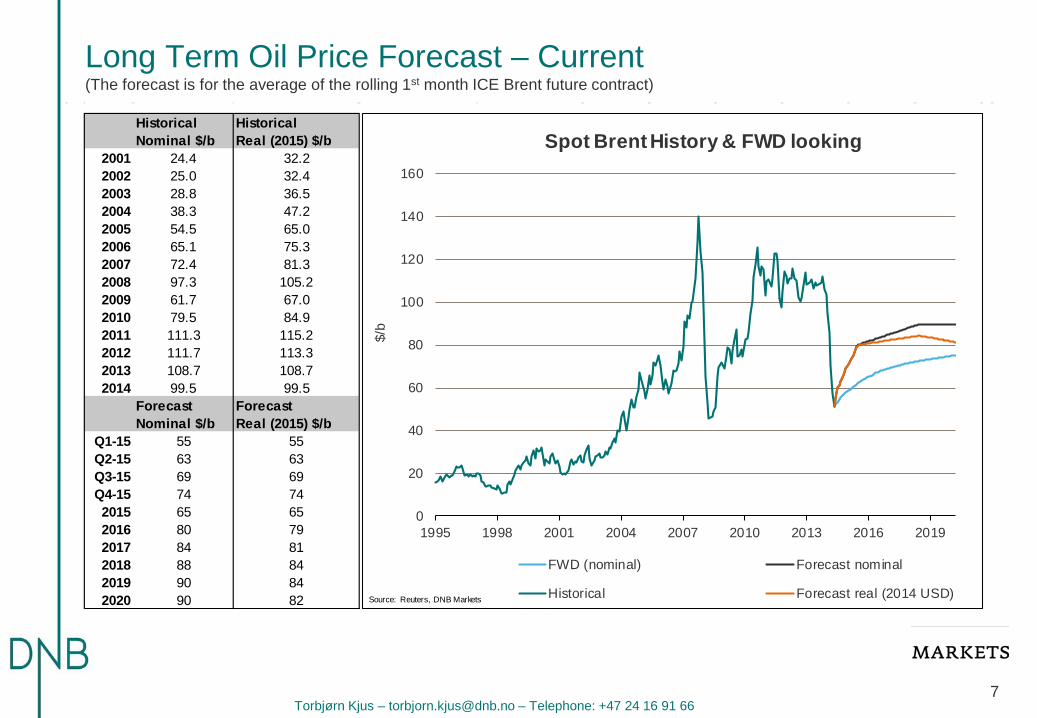
Long Term Oil Price Forecast – Current (The forecast is for the average of the rolling 1st month ICE Brent future contract)
Historical HistoricalNominal $/b Real (2015) $/b
2001 24.4 32.22002 25.0 32.42003 28.8 36.52004 38.3 47.22005 54.5 65.02006 65.1 75.32007 72.4 81.32008 97.3 105.22009 61.7 67.02010 79.5 84.92011 111.3 115.22012 111.7 113.32013 108.7 108.72014 99.5 99.5
Forecast ForecastNominal $/b Real (2015) $/b
Q1-15 55 55Q2-15 63 63Q3-15 69 69Q4-15 74 742015 65 652016 80 792017 84 812018 88 842019 90 842020 90 82
0
20
40
60
80
100
120
140
160
1995 1998 2001 2004 2007 2010 2013 2016 2019
$/b
Spot Brent History & FWD looking
FWD (nominal) Forecast nominal
Historical Forecast real (2014 USD)Source: Reuters, DNB Markets

Torbjørn Kjus – [email protected] – Telephone: +47 24 16 91 66 8
What Is Different From The 2012-Correction - Deeper and longer drop now and the key difference is the contango which suggest a much weaker physical market than in 2012
40
50
60
70
80
90
100
1 11 21 31 41 51 61 71 81 91 101 111 121 131 141 151
$/b
Days
Brent 1st Month FutureDays below 100 $/b
2012 spring correction 2014 downturnSource: Reuters
Daily QLCOc1, QLCOc3 31/07/2007 - 23/06/2015 (LON)
Spread, QLCOc1, Trade Price(Last), QLCOc3, Trade Price(Last), 1.0, 1.026/01/2015, -2.40Line, QLCOc1, Trade Price(Last)26/01/2015, 48.25
ValueUSDBbl
Auto-6
-5
-4
-3
-2
-1
0
1
2
3
PriceUSDBbl
Auto40
50
60
70
80
90
100
110
120
130
Q4 Q1 Q2 Q3 Q4 Q1 Q2 Q3 Q4 Q1 Q2 Q3 Q4 Q1 Q2 Q3 Q4 Q1 Q2 Q3 Q4 Q1 Q2 Q3 Q4 Q1 Q2 Q3 Q4 Q1 Q22007 2008 2009 2010 2011 2012 2013 2014 2015

Torbjørn Kjus – [email protected] – Telephone: +47 24 16 91 66 9
The Market Has Been Over-supplied Through 2014 - The red line is our view on 2015
-3.0
-2.0
-1.0
0.0
1.0
2.0
3.0
Jan Feb Mar Apr May Jun Jul Aug Sep Oct Nov Dec
Milli
on b
/d
DNB Markets World Oil Supply-Demand Balance (time phased)
5 year range 5 year avg 2013 2014 2015Source: IEA, DNB Markets

Torbjørn Kjus – [email protected] – Telephone: +47 24 16 91 66 10
How Can Anyone Doubt That The Market Is Over Supplied? - Global oil stocks (excl. Chinese strategic stocks) are building massively. This is a function of supply being larger than demand.
5300
5350
5400
5450
5500
5550
5600
5650
5700
Jan Feb Mar Apr May Jun Jul Aug Sep Oct Nov Dec
Mill
ion
barre
ls
Global Crude & Product Stocks - JODI-dataJODI-data are adjusted for countries w ith irregular reporting - and China is added w ith Xinhua New s Agency Data
2011 2012 2013 2014Source: JODI, DNB Markets
Torbjørn Kjus – [email protected] – Telephone: +47 24 16 91 66
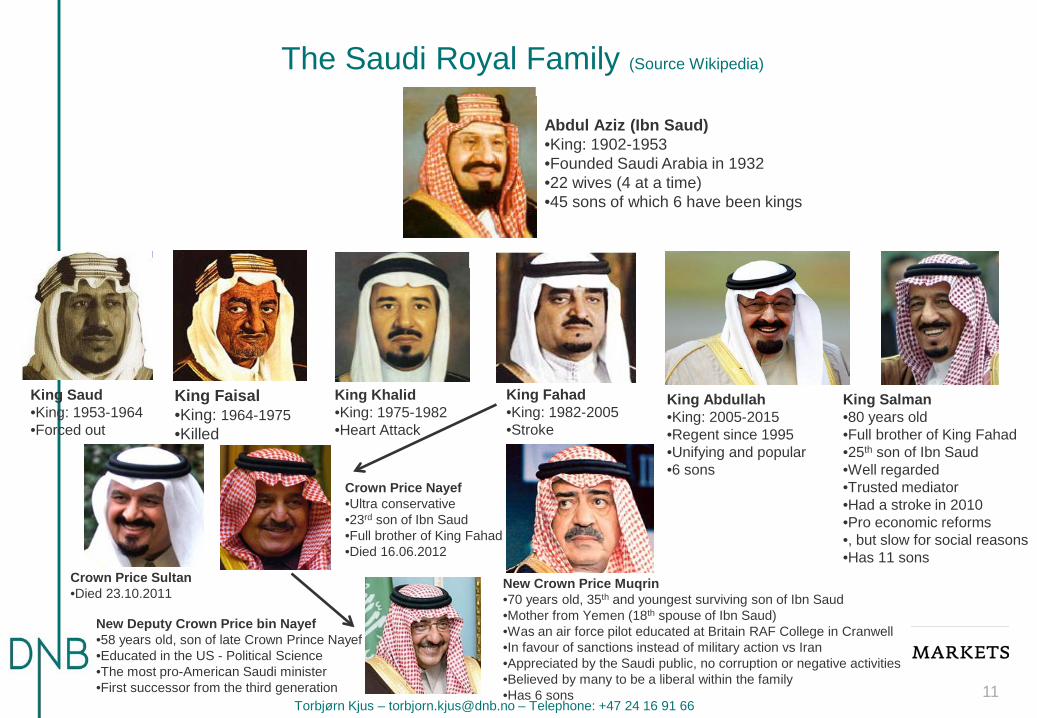
The Saudi Royal Family (Source Wikipedia)
Abdul Aziz (Ibn Saud) •King: 1902-1953 •Founded Saudi Arabia in 1932 •22 wives (4 at a time) •45 sons of which 6 have been kings
King Saud •King: 1953-1964 •Forced out
King Faisal •King: 1964-1975 •Killed
King Khalid •King: 1975-1982 •Heart Attack
King Fahad •King: 1982-2005 •Stroke
King Abdullah •King: 2005-2015 •Regent since 1995 •Unifying and popular •6 sons
Crown Price Sultan •Died 23.10.2011
Crown Price Nayef •Ultra conservative •23rd son of Ibn Saud •Full brother of King Fahad •Died 16.06.2012
King Salman •80 years old •Full brother of King Fahad •25th son of Ibn Saud •Well regarded •Trusted mediator •Had a stroke in 2010 •Pro economic reforms •, but slow for social reasons •Has 11 sons
11
New Crown Price Muqrin •70 years old, 35th and youngest surviving son of Ibn Saud •Mother from Yemen (18th spouse of Ibn Saud) •Was an air force pilot educated at Britain RAF College in Cranwell •In favour of sanctions instead of military action vs Iran •Appreciated by the Saudi public, no corruption or negative activities •Believed by many to be a liberal within the family •Has 6 sons
New Deputy Crown Price bin Nayef •58 years old, son of late Crown Prince Nayef •Educated in the US - Political Science •The most pro-American Saudi minister •First successor from the third generation
Torbjørn Kjus – [email protected] – Telephone: +47 24 16 91 66 12
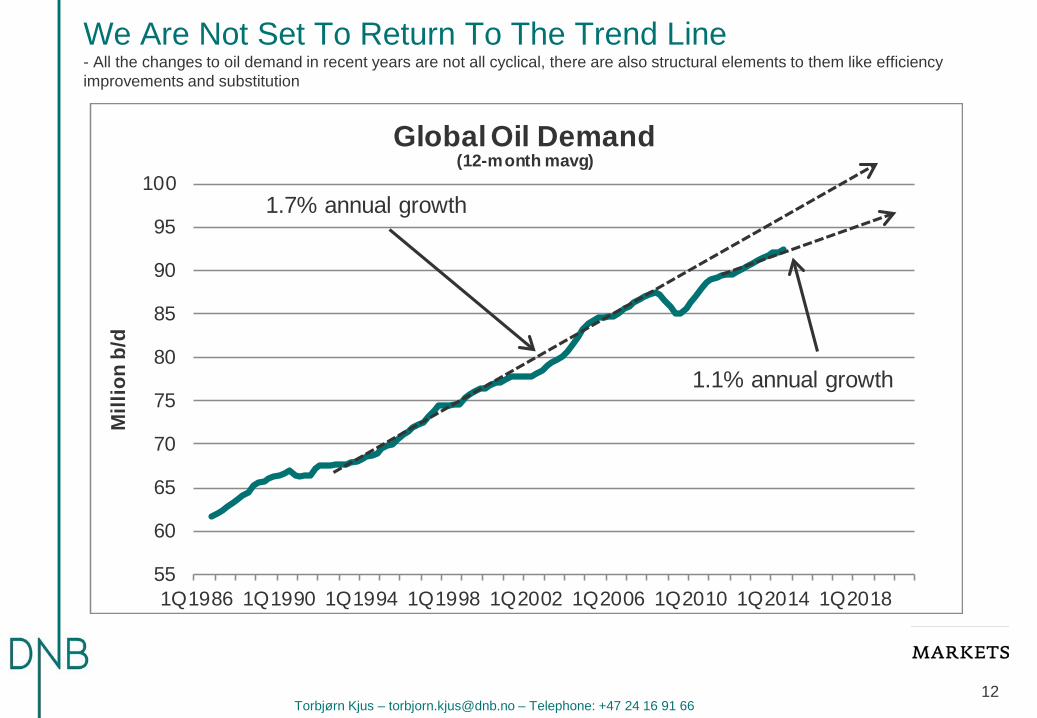
We Are Not Set To Return To The Trend Line - All the changes to oil demand in recent years are not all cyclical, there are also structural elements to them like efficiency improvements and substitution
55
60
65
70
75
80
85
90
95
100
1Q1986 1Q1990 1Q1994 1Q1998 1Q2002 1Q2006 1Q2010 1Q2014 1Q2018
Mill
ion
b/d
Global Oil Demand(12-month mavg)
1.1% annual growth
1.7% annual growth
Torbjørn Kjus – [email protected] – Telephone: +47 24 16 91 66
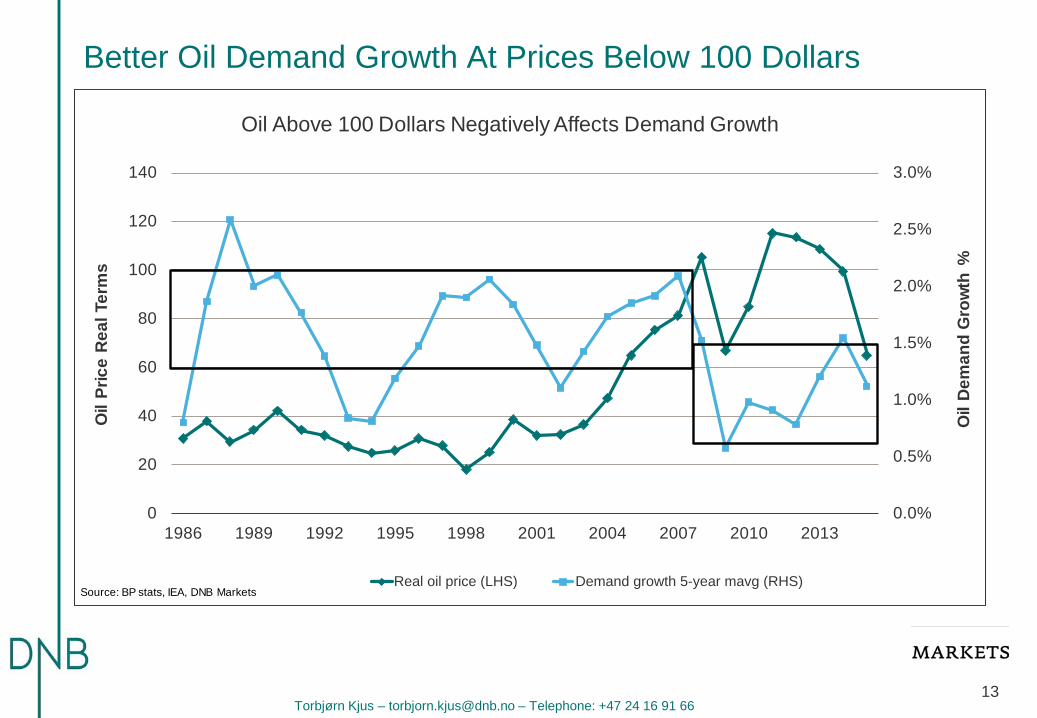
Better Oil Demand Growth At Prices Below 100 Dollars
13
0.0%
0.5%
1.0%
1.5%
2.0%
2.5%
3.0%
0
20
40
60
80
100
120
140
1986 1989 1992 1995 1998 2001 2004 2007 2010 2013
Oil
Dem
and
Gro
wth
%
Oil
Pric
e R
eal T
erm
sOil Above 100 Dollars Negatively Affects Demand Growth
Real oil price (LHS) Demand growth 5-year mavg (RHS)Source: BP stats, IEA, DNB Markets

Torbjørn Kjus – [email protected] – Telephone: +47 24 16 91 66 14
Reduced Oil Burden May Support Oil Demand Growth - The lower oil burden may increase the oil intensity back to 0.4 from 0.2 in 2014 (oil demand as a factor of GDP-growth)
1.0%
1.5%
2.0%
2.5%
3.0%
3.5%
4.0%
4.5%
5.0%
5.5%0.0
0.1
0.2
0.3
0.4
0.5
0.6
0.7
0.8
1987 1990 1993 1996 1999 2002 2005 2008 2011 2014
Glo
bal O
il B
urde
n
Oil
Inte
nsity
Oil Demand Change Per Unit Real GDP Change (oil intensity) vs Oil Burden(Average: last 20 years is 0.4, last 10 years is 0.3 - both excluding 2008-09)
Oil Intensity 5-year mavg - LHS Oil Burden - RHSSource: BP stats, IEA, IMF, DNB Markets

Torbjørn Kjus – [email protected] – Telephone: +47 24 16 91 66 15
US Oil Demand Improving On Lower Oil Prices - Gasoline demand very strong since the autumn – People driving more coupled with lower fuel efficiency
17.0
18.0
19.0
20.0
21.0
22.0
Jan Jan Feb Mar Apr May Jun Jul Aug Sep Oct Nov Dec
Milli
on b
/d
US Total Demand(Product Supplied)
Range 5 year avg2014 2015Source: US DOE
13.013.413.814.214.615.015.415.8
Jan Jan Feb Mar Apr May Jun Jul Aug Sep Oct Nov DecM
illion
b/d
US Demand 4 Main Products (4 week mavg)(Product Supplied: Gasoline, Distillates, Jet, Residual Fuel)
Range 5 year avg 2014 2015Source: US DOE
8.0
8.5
9.0
9.5
Jan Jan Feb Mar Apr May Jun Jul Aug Sep Oct Nov Dec
Milli
on b
/d
US Gasoline Demand 4 week mavg(Product Supplied)
Range 5 year avg 2014 2015Source: US DOE
3.03.23.43.63.84.04.24.44.64.8
Jan Jan Feb Mar Apr May Jun Jul Aug Sep Oct Nov Dec
Milli
on b
/d
US Distillate Demand 4 week mavg(Product Supplied)
Range 5 year avg 2014 2015Source: US DOE

Torbjørn Kjus – [email protected] – Telephone: +47 24 16 91 66 16
Chinese Oil Demand Growth Improving - Gasoline demand growth still strong and diesel on the mend after infrastructure projects
-1.5
-1.0
-0.5
0.0
0.5
1.0
1.5
Jan-01 Feb-03 Mar-05 Apr-07 May-09 Jun-11 Jul-13 Aug-15
Milli
on b
/dYear on Year Calculated Chinese Demand
(Demand is refinery runs plus net product imports.Figures are adjusted for inventory changes since Feb 2009)
Source: China OGP, Xinhua News, The Chinese General Administration & Customs, National Bureau of Statistics

Torbjørn Kjus – [email protected] – Telephone: +47 24 16 91 66 17
CAPEX Guided Down 28% - Rig Count Guided Down 42% - Production guided to rise 10%, but we think CAPEX guiding and rig count will drop even more than guided below
Source: US Capital Advisors
Torbjørn Kjus – [email protected] – Telephone: +47 24 16 91 66 18
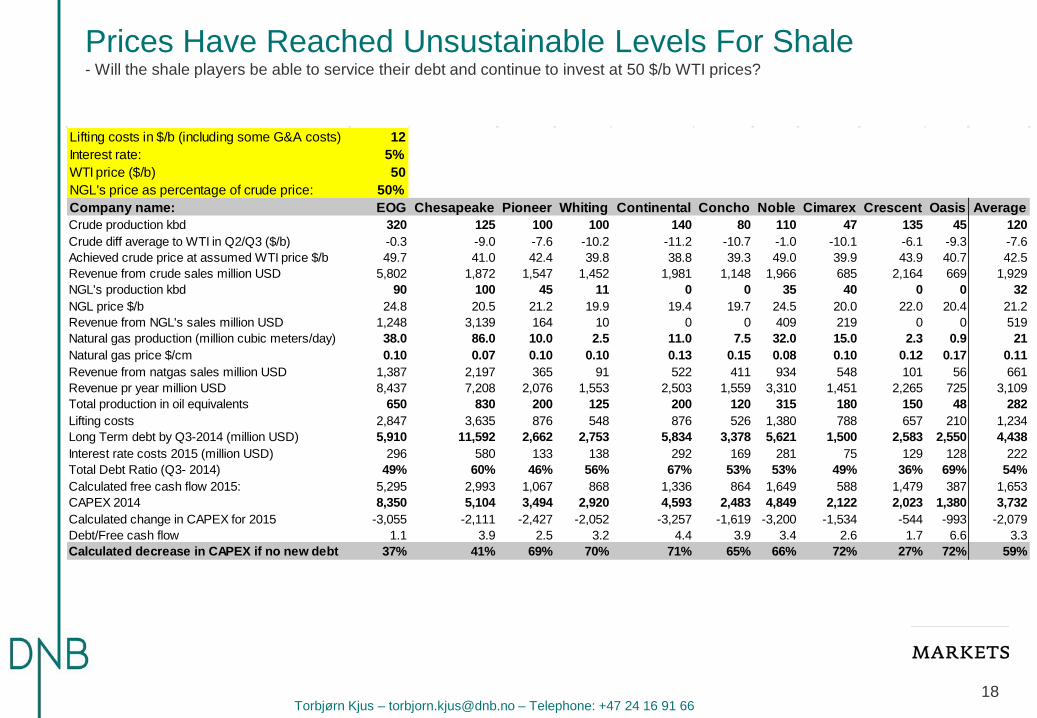
Prices Have Reached Unsustainable Levels For Shale - Will the shale players be able to service their debt and continue to invest at 50 $/b WTI prices?
Lifting costs in $/b (including some G&A costs) 12Interest rate: 5%WTI price ($/b) 50NGL's price as percentage of crude price: 50%Company name: EOG Chesapeake Pioneer Whiting Continental Concho Noble Cimarex Crescent Oasis AverageCrude production kbd 320 125 100 100 140 80 110 47 135 45 120Crude diff average to WTI in Q2/Q3 ($/b) -0.3 -9.0 -7.6 -10.2 -11.2 -10.7 -1.0 -10.1 -6.1 -9.3 -7.6Achieved crude price at assumed WTI price $/b 49.7 41.0 42.4 39.8 38.8 39.3 49.0 39.9 43.9 40.7 42.5Revenue from crude sales million USD 5,802 1,872 1,547 1,452 1,981 1,148 1,966 685 2,164 669 1,929NGL's production kbd 90 100 45 11 0 0 35 40 0 0 32NGL price $/b 24.8 20.5 21.2 19.9 19.4 19.7 24.5 20.0 22.0 20.4 21.2Revenue from NGL's sales million USD 1,248 3,139 164 10 0 0 409 219 0 0 519Natural gas production (million cubic meters/day) 38.0 86.0 10.0 2.5 11.0 7.5 32.0 15.0 2.3 0.9 21Natural gas price $/cm 0.10 0.07 0.10 0.10 0.13 0.15 0.08 0.10 0.12 0.17 0.11Revenue from natgas sales million USD 1,387 2,197 365 91 522 411 934 548 101 56 661Revenue pr year million USD 8,437 7,208 2,076 1,553 2,503 1,559 3,310 1,451 2,265 725 3,109Total production in oil equivalents 650 830 200 125 200 120 315 180 150 48 282Lifting costs 2,847 3,635 876 548 876 526 1,380 788 657 210 1,234Long Term debt by Q3-2014 (million USD) 5,910 11,592 2,662 2,753 5,834 3,378 5,621 1,500 2,583 2,550 4,438Interest rate costs 2015 (million USD) 296 580 133 138 292 169 281 75 129 128 222Total Debt Ratio (Q3- 2014) 49% 60% 46% 56% 67% 53% 53% 49% 36% 69% 54%Calculated free cash flow 2015: 5,295 2,993 1,067 868 1,336 864 1,649 588 1,479 387 1,653CAPEX 2014 8,350 5,104 3,494 2,920 4,593 2,483 4,849 2,122 2,023 1,380 3,732Calculated change in CAPEX for 2015 -3,055 -2,111 -2,427 -2,052 -3,257 -1,619 -3,200 -1,534 -544 -993 -2,079Debt/Free cash flow 1.1 3.9 2.5 3.2 4.4 3.9 3.4 2.6 1.7 6.6 3.3Calculated decrease in CAPEX if no new debt 37% 41% 69% 70% 71% 65% 66% 72% 27% 72% 59%

Torbjørn Kjus – [email protected] – Telephone: +47 24 16 91 66 19
Horizontal Rig Count Must Drop Going Forward - The process has just started
300
400
500
600
700
800
900
1000
1100
1200
Jan-11 Jan-12 Jan-13 Jan-14 Jan-15
US horizontal oil rigs
Source: Baker Hughes, PIRA Energy

Torbjørn Kjus – [email protected] – Telephone: +47 24 16 91 66 20
A Drop In The Rig Count Could Lead To Lower Output - Unlike the 2012/13-period we now look to need more rigs to grow output as output per rig is growing more slowly in 2014
0
500
1000
1500
2000
2500
3000
3500
4000
300 400 500 600 700 800 900 1000 1100 1200
Thou
sand
b/d
Total US horizontal oil rigs
Shale oil production vs horizontal oil rigs(since 2011)
Source: US DOE, Baker Hughes rig count, DNB Markets
y = 3.8408x - 717.83R² = 0.9917
2400
2600
2800
3000
3200
3400
3600
3800
850 900 950 1000 1050 1100 1150
Thou
sand
b/d
Total US horizontal oil rigs
Shale oil production vs horizontal oil rigs(latest year)
Source: US DOE, Baker Hughes rig count, DNB Markets
500
1000
1500
2000
2500
3000
3500
Jan-11 Jan-12 Jan-13 Jan-14 Jan-15
Thou
sand
of b
/d
US shale crude oil production per horizontal oil rig
Source: US DOE, Baker Hughes, DNB Marklets
Torbjørn Kjus – [email protected] – Telephone: +47 24 16 91 66 21
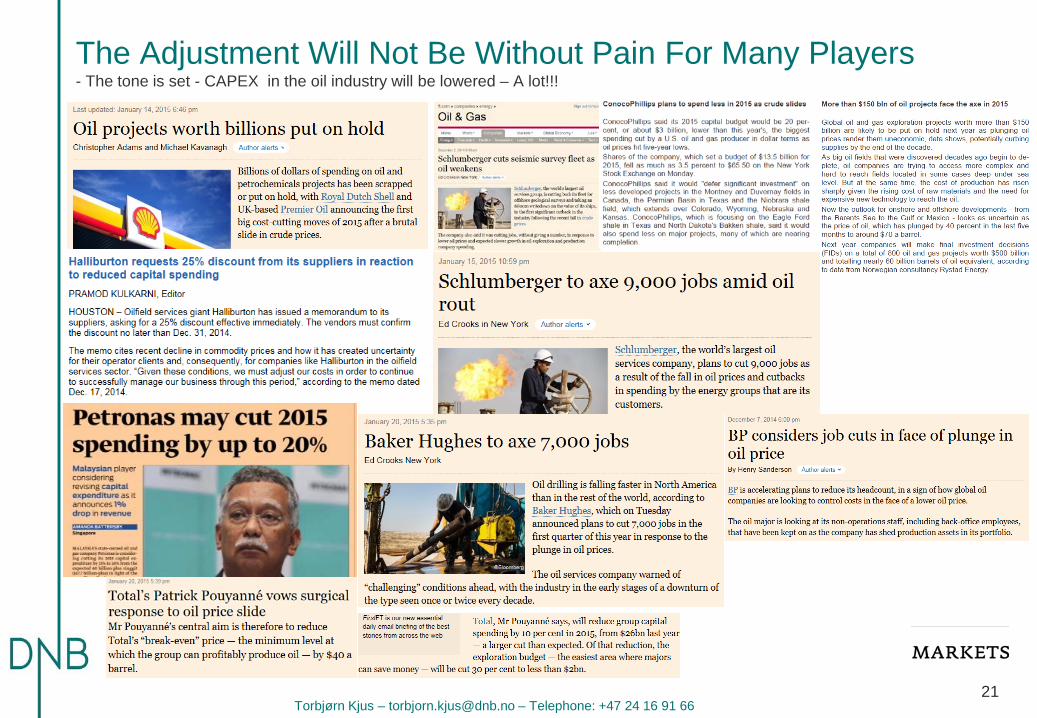
The Adjustment Will Not Be Without Pain For Many Players - The tone is set - CAPEX in the oil industry will be lowered – A lot!!!

Torbjørn Kjus – [email protected] – Telephone: +47 24 16 91 66 22
Prices Can Recover Before The Supply-Demand Balance - 2009 is a good example – Oversupplied through the first half but prices rising from 40 $/b to 70 $/b from January to July
-1.5
-1.0
-0.5
0.0
0.5
1.0
1.5
Jan Feb Mar Apr May Jun Jul Aug Sep Oct Nov Dec
Milli
on b
/d
2009 DNB Markets World Oil Supply-Demand Balance (time phased)
Source: IEA, DNB Markets
2550
2600
2650
2700
2750
2800
2850
35
45
55
65
75
85
95
105
Sep-08 Dec-08 Mar-09 Jun-09 Sep-09 Dec-09 Mar-10 Jun-10
OEC
D O
il St
ocks
Milli
on B
arre
ls
Bren
t Pric
e $/
b
OECD Total Oil Industry Stocks (IEA-data)
Brent Price OECD Oil StocksSource: IEA, Reuters
Torbjørn Kjus – [email protected] – Telephone: +47 24 16 91 66 23
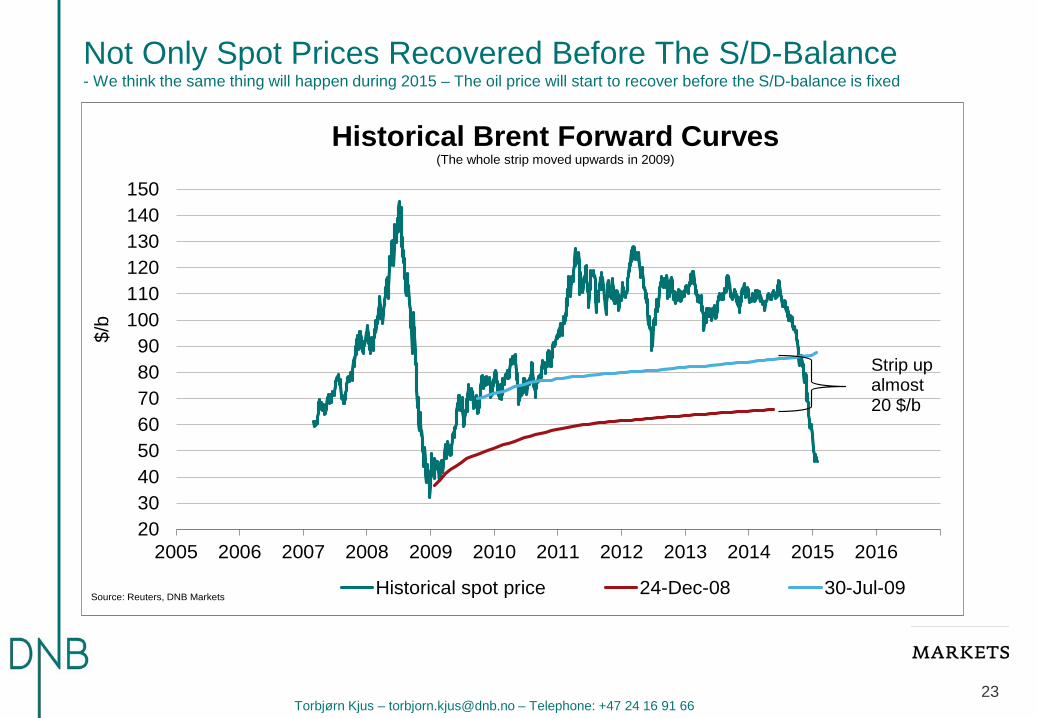
Not Only Spot Prices Recovered Before The S/D-Balance - We think the same thing will happen during 2015 – The oil price will start to recover before the S/D-balance is fixed
2030405060708090
100110120130140150
2005 2006 2007 2008 2009 2010 2011 2012 2013 2014 2015 2016
$/b
Historical Brent Forward Curves(The whole strip moved upwards in 2009)
Historical spot price 24-Dec-08 30-Jul-09Source: Reuters, DNB Markets
Strip up almost 20 $/b
Torbjørn Kjus – [email protected] – Telephone: +47 24 16 91 66
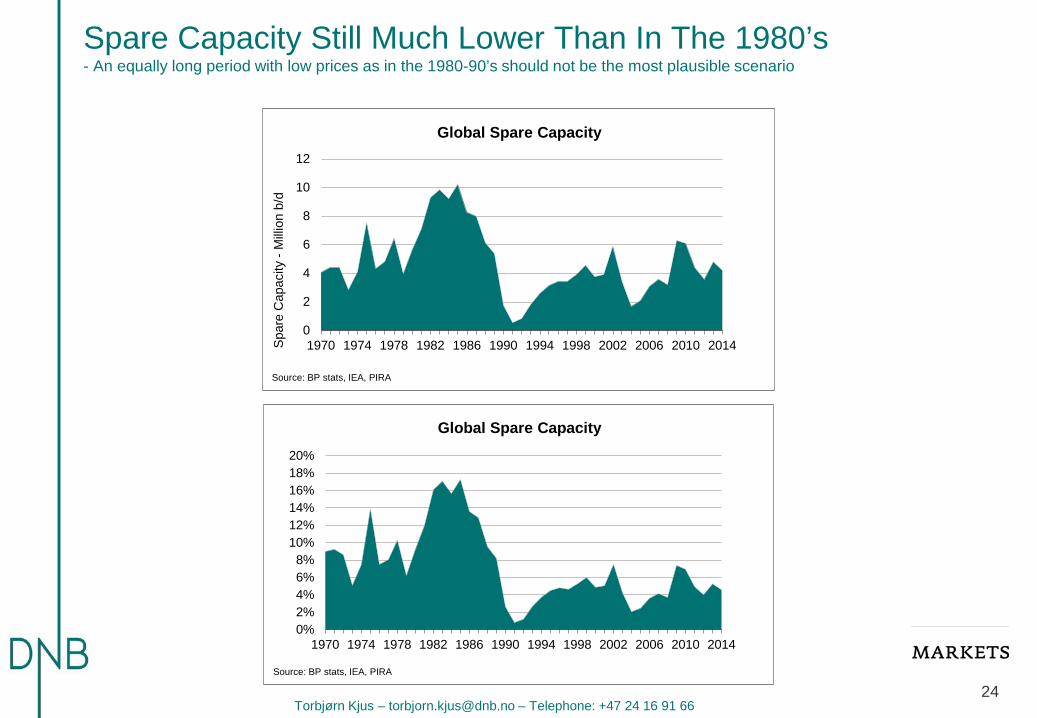
Spare Capacity Still Much Lower Than In The 1980’s - An equally long period with low prices as in the 1980-90’s should not be the most plausible scenario
24
0%2%4%6%8%
10%12%14%16%18%20%
1970 1974 1978 1982 1986 1990 1994 1998 2002 2006 2010 2014
Global Spare Capacity
Source: BP stats, IEA, PIRA
0
2
4
6
8
10
12
1970 1974 1978 1982 1986 1990 1994 1998 2002 2006 2010 2014Spa
re C
apac
ity -
Mill
ion
b/d
Global Spare Capacity
Source: BP stats, IEA, PIRA

Torbjørn Kjus – [email protected] – Telephone: +47 24 16 91 66
Oslo, Sales & Trading London, Sales Oslo, Research Nils Fredrik Hvatum +47 24 16 91 59 Ane Tobiassen +44(0) 20 7621 6082 Torbjørn Kjus +47 24 16 91 66 Fredrik Sagen Andersen +47 24 16 91 48 Singapore, Sales Karl Magnus Maribu +47 24 16 91 57 Jesper Meyer Hatletveit +47 24 16 91 53 Seng Leong Ong +65 622 480 22 Nils Wierli Nilsen +47 24 16 91 61 New York, Sales Andre Rørheim +47 24 16 91 64 Kenneth Tveter +1 212 681 3888 Erik Warren +47 24 16 91 46
CONTACTS & DISCLAIMER
This note (the “Note”) must be seen as marketing material and not as an investment recommendation within the meaning of the Norwegian Securities Trading Act of 2007 paragraph 3-10 and the Norwegian Securities Trading Regulation 2007/06/29 no. 876. The Note has been prepared by DNB Markets, a division of DNB Bank ASA, a Norwegian bank organized under the laws of the Kingdom of Norway (the “Bank”), for information purposes only. The Note shall not be used for any unlawful or unauthorized purposes. The Bank, its affiliates, and any third-party providers, as well as their directors, officers, shareholders, employees or agents (individually, each a “DNB Party”; collectively, “DNB Parties”) do not guarantee the accuracy, completeness, timeliness or availability of the Note. DNB Parties are not responsible for any errors or omissions, regardless of the cause, nor for the results obtained from the use of the Note, nor for the security or maintenance of any data input by the user. The Note is provided on an “as is” basis. DNB PARTIES DISCLAIM ANY AND ALL EXPRESS OR IMPLIED WARRANTIES, INCLUDING, BUT NOT LIMITED TO, ANY WARRANTIES OF MERCHANTABILITY OR FITNESS FOR A PARTICULAR PURPOSE OR USE, FREEDOM FROM BUGS, SOFTWARE ERRORS OR DEFECTS, THAT THE NOTE’S FUNCTIONING WILL BE UNINTERRUPTED OR THAT THE NOTE WILL OPERATE WITH ANY SOFTWARE OR HARDWARE CONFIGURATION. In no event shall DNB Parties be liable to any party for any direct, indirect, incidental, exemplary, compensatory, punitive, special or consequential damages, costs, expenses, legal fees, or losses (including, without limitation, lost income or lost profits and opportunity costs) in connection with any use of the Note, even if advised of the possibility of such damages. Any opinions expressed herein reflect the Bank’s judgment at the time the Note was prepared and DNB Parties assume no obligation to update the Note in any form or format. The Note should not be relied on and is not a substitute for the skill, judgment and experience of the user, its management, employees, advisors and/or clients when making investment and other business decisions. No DNB Party is acting as fiduciary or investment advisor in connection with the dissemination of the Note. While the Note is based on information obtained from public sources that the Bank believes to be reliable, no DNB Party has performed an audit of, nor accepts any duty of due diligence or independent verification of, any information it receives. Confidentiality rules and internal rules restrict the exchange of information between different parts of the Bank and this may prevent employees of DNB Markets who are preparing the Note from utilizing or being aware of information available in DNB Markets/the Bank which may be relevant to the recipients of the Note. The Note is not an offer to buy or sell any security or other financial instrument or to participate in any investment strategy. Distribution of material like the Note is in certain jurisdictions restricted by law. Persons in possession of the Note should seek further guidance regarding such restrictions before distributing the Note. The Note is for clients only, and not for publication, and has been prepared for information purposes only by DNB Markets - a division of DNB Bank ASA registered in Norway with registration number NO 984 851 006 (the Register of Business Enterprises) under supervision of the Financial Supervisory Authority of Norway (Finanstilsynet), The Monetary Authority of Singapore, and on a limited basis by the Financial Conduct Authority and the Prudential Regulation Authority of the UK, and the Financial Supervisory Authority of Sweden. Details about the extent of our regulation by local authorities outside Norway are available from us on request. Information about DNB Markets can be found at dnb.no. Additional information for clients in Singapore The Note has been distributed by the Singapore Branch of DNB Bank ASA. It is intended for general circulation and does not take into account the specific investment objectives, financial situation or particular needs of any particular person. You should seek advice from a financial adviser regarding the suitability of any product referred to in the Note, taking into account your specific financial objectives, financial situation or particular needs before making a commitment to purchase any such product. You have received a copy of the Note because you have been classified either as an accredited investor, an expert investor or as an institutional investor, as these terms have been defined under Singapore’s Financial Advisers Act (Cap. 110) (“FAA”) and/or the Financial Advisers Regulations (“FAR”). The Singapore Branch of DNB Bank ASA is a financial adviser exempt from licensing under the FAA but is otherwise subject to the legal requirements of the FAA and of the FAR. By virtue of your status as an accredited investor or as an expert investor, the Singapore Branch of DNB Bank ASA is, in respect of certain of its dealings with you or services rendered to you, exempt from having to comply with certain regulatory requirements of the FAA and FAR, including without limitation, sections 25, 27 and 36 of the FAA. Section 25 of the FAA requires a financial adviser to disclose material information concerning designated investment products which are recommended by the financial adviser to you as the client. Section 27 of the FAA requires a financial adviser to have a reasonable basis for making investment recommendations to you as the client. Section 36 of the FAA requires a financial adviser to include, within any circular or written communications in which he makes recommendations concerning securities, a statement of the nature of any interest which the financial adviser (and any person connected or associated with the financial adviser) might have in the securities. Please contact the Singapore Branch of DNB Bank ASA at +65 6212 0753 in respect of any matters arising from, or in connection with, the Note. The Note is intended for and is to be circulated only to persons who are classified as an accredited investor, an expert investor or an institutional investor. If you are not an accredited investor, an expert investor or an institutional investor, please contact the Singapore Branch of DNB Bank ASA at +65 6212 0753. We, the DNB group, our associates, officers and/or employees may have interests in any products referred to in the Note by acting in various roles including as distributor, holder of principal positions, adviser or lender. We, the DNB group, our associates, officers and/or employees may receive fees, brokerage or commissions for acting in those capacities. In addition, we, the DNB group, our associates, officers and/or employees may buy or sell products as principal or agent and may effect transactions which are not consistent with the information set out in the Note. Additional Information, including for Recipients in the In the United States: The Note does not constitute an offer to sell or buy a security and does not include information, opinions, or recommendations with respect to securities of an issuer or an analysis of a security or an issuer; rather, it is a “market letter,” as the term is defined in NASD Rule 2211.


