OFWAT’S ODI INTERVENTIONS ON THE WACC AT PR19
24
1 This report for Wessex Water sets out our assessment of the impact of Ofwat’s Outcome Delivery Incentives (ODI) interventions on water companies’ weighted average cost of capital (WACC) at PR19. Our main conclusions are as follows: (i) Ofwat’s interventions on ODIs have reduced upside risk and increased downside risk, leading to a greater negative skew in returns; (ii) the standard Capital Asset Pricing Model (CAPM) framework does not account for skewness in returns; and (iii) we estimate that greater skewness could increase the cost of equity by 0.05% to 0.07%. The impact of skewness is separate from the issue of whether the target levels for PCs genuinely represent the P50 for a notionally efficient firm; and whether, therefore, the expected returns of an efficient firm will equal their allowed returns. In practice, Ofwat’s approach also means this is likely not the case. 1. Introduction Ofwat’s initial assessment of company business plans (IAP) and subsequent draft determinations (DDs) for fast track companies included material interventions in companies’ proposed ODI packages (which have been mirrored in the DDs for slow track companies). These interventions resulted in substantial changes to the ODI packages’ implied impact on return on regulatory equity (RoRE); in particular, introducing a pronounced negative skew to expected returns. As ODIs are a source of revenue risk for companies, this has clear potential implications for the cost of capital. When it made its ODI interventions, however, Ofwat did not appear to consider this possibility (insomuch that Ofwat’s publications at IAP did not include any discussion of a need to consider revising its ‘early view’ on the cost of capital in light of its calibration of incentives, nor vice versa). 1 Accordingly, this report for Wessex Water (Wessex) analyses the impact of Ofwat’s ODI interventions on the cost of capital, focusing on the issue of skewness. It is structured as follows. • We describe how Ofwat’s ODI interventions have increased regulatory risk, especially on the downside, leading to negatively skewed returns. • We show that the standard CAPM approach does not compensate investors for negatively skewed returns. • We review quantitative evidence on the potential impact of greater negative skew on the WACC. 1 ‘PR19 initial assessment of plans: Overview of company categorisation.’ Ofwat (2019) p4. IMPACT OF OFWAT’S ODI INTERVENTIONS ON THE WACC AT PR19 Report for Wessex Water Economic Insight | August 2019
Transcript of OFWAT’S ODI INTERVENTIONS ON THE WACC AT PR19

1
This report for Wessex Water sets out our assessment of the impact of Ofwat’s Outcome Delivery Incentives (ODI) interventions on water companies’ weighted average cost of capital (WACC) at PR19. Our main conclusions are as follows: (i) Ofwat’s interventions on ODIs have reduced upside risk and increased downside risk, leading to a greater negative skew in returns; (ii) the standard Capital Asset Pricing Model (CAPM) framework does not account for skewness in returns; and (iii) we estimate that greater skewness could increase the cost of equity by 0.05% to 0.07%. The impact of skewness is separate from the issue of whether the target levels for PCs genuinely represent the P50 for a notionally efficient firm; and whether, therefore, the expected returns of an efficient firm will equal their allowed returns. In practice, Ofwat’s approach also means this is likely not the case.
1. Introduction
Ofwat’s initial assessment of company business plans (IAP) and subsequent draft
determinations (DDs) for fast track companies included material interventions in
companies’ proposed ODI packages (which have been mirrored in the DDs for slow
track companies). These interventions resulted in substantial changes to the ODI
packages’ implied impact on return on regulatory equity (RoRE); in particular,
introducing a pronounced negative skew to expected returns. As ODIs are a source of
revenue risk for companies, this has clear potential implications for the cost of capital.
When it made its ODI interventions, however, Ofwat did not appear to consider this
possibility (insomuch that Ofwat’s publications at IAP did not include any discussion
of a need to consider revising its ‘early view’ on the cost of capital in light of its
calibration of incentives, nor vice versa).1
Accordingly, this report for Wessex Water (Wessex) analyses the impact of Ofwat’s
ODI interventions on the cost of capital, focusing on the issue of skewness. It is
structured as follows.
• We describe how Ofwat’s ODI interventions have increased regulatory risk,
especially on the downside, leading to negatively skewed returns.
• We show that the standard CAPM approach does not compensate investors for
negatively skewed returns.
• We review quantitative evidence on the potential impact of greater negative skew
on the WACC.
1 ‘PR19 initial assessment of plans: Overview of company categorisation.’ Ofwat (2019) p4.
IMPACT OF OFWAT’S ODI INTERVENTIONS ON THE WACC AT PR19 Report for Wessex Water Economic Insight | August 2019

2
2. Ofwat’s ODI interventions have increased regulatory risk on the downside and capped the upside
In this section, we firstly explain how Ofwat’s interventions to date have increased
regulatory risk and the implications of this for Wessex specifically. In turn, we expand
on the following key points: (i) Ofwat’s interventions in company ODIs have been
unpredictable and inconsistent – and so have likely increased regulatory risk; (ii)
Ofwat’s interventions have also demonstrably skewed expected returns to the
downside (including on the regulator’s own evidence); and (iii) that Ofwat’s
interventions, specifically in relation to Wessex’s proposed ODIs, also have these
characteristics.
2.1 Ofwat has intervened in an unpredictable and inconsistent manner, thereby increasing regulatory risk
Ofwat’s approach to ODIs at PR19 increased firms’ exposure to revenue risk. In other
words, it (intentionally) resulted in an ex ante increase in regulatory risk. In itself,
this need not be problematic, if firms are adequately compensated for the impact of
any systematic element of this risk on the cost of capital (to the extent that this
element exists). Importantly, however, in practice Ofwat has acted in an
unpredictable and inconsistent manner, thereby also increasing ex post regulatory
risk.
In its PR19 methodology document, Ofwat set out its expectations with respect to
companies’ ODIs. Ofwat said that it considered there was scope to ‘sharpen’
incentives to improve performance. Putting a higher proportion of revenue at risk
was one of the ways in which Ofwat sought to sharpen incentives, with the following
requirements.2
• It required companies to make greater use of financial ODIs, effectively making
them the default option, by requiring companies to evidence why performance
commitments (PC) were not supported by a financial ODI.
• Removing the aggregate ODI RoRE cap and collar. This involved removing limits
on the total impact of ODIs on RoRE. At PR14, ODIs were set with an indicative
range of ±1% to ±2% of RoRE, with the total impact capped at ±2% of RoRE.
• Setting a wider indicative RoRE range for ODIs of ±1% to ±3%. Ofwat said that it
expected the upper end of the range to be achievable only in ‘extremely stretching
circumstances’ and that it expected companies to gain customer support for their
RoRE ranges.
Ofwat also sharpened incentives in three further ways:
• Changing the timing of ODI payments, to bring them closer to service performance
triggers, including through use of in-period ODIs and linking end-of-period ODIs
to revenue rather than regulatory capital value (RCV).
• Encouraging the use of enhanced outperformance payments for the common PCs.
This involves higher penalty and reward rates beyond certain performance
thresholds.
2 ‘Delivering Water 2020: Our final methodology for the 2019 price review.’ Ofwat (2017), p59-60.

3
• Use of ODIs for asset health PCs.3
Ofwat said that, in practice, the RoRE ranges for some companies ‘may not be
symmetrical’ for three reasons: (i) the role of customer engagement in shaping ODI
rates; (ii) because some ODIs might be penalty-only; and (iii) because upper quartile
PCs would require stretching performance.4 Ofwat’s general position seemed to be
that RoRE risk should be symmetrical for ‘efficient’ companies, but might not be so for
less efficient companies.
Related to the above, in its initial PR19 methodology consultation, Ofwat signalled that
there were advantages to having symmetric ODIs, saying:
‘The symmetric approach to ODIs reveals new information about service quality
that customers, CCGs and we can use to challenge companies to set more stretching
performance commitments in the future.’5
And:
‘A symmetric RoRE range with more scope for rewards than at PR14 might increase
management focus on delivering the outcomes that [companies’] customers want.’6
2.1.1 In practice Ofwat has materially and systematically deviated from the expectations that it set out in its methodology
Ofwat’s IAP contained ‘required’ and ‘recommended’ amendments to company plans,
which substantially changed their ODI packages in a way that represents a clear
departure from the methodology originally published by the regulator. These changes
include the following.
• Retrospective changes to target PC levels. Ofwat intervened across multiple
PCs to require or recommend adjustments, to make the PC target levels more
demanding. The extent of these interventions was not signalled in its PR19
methodology. Ofwat generally did not require or recommend adjustments to
make PCs less demanding, resulting in an asymmetric impact on final PC levels.
• Retrospective changes to ODI incentive rates. At IAP, Ofwat imposed a
‘measurement error adjustment’ to companies’ proposed rates, which was not
signalled in its PR19 methodology. These adjustments were based on a what
Ofwat termed a ‘reasonable range’ for ODI rates of ± 0.5 standard deviations from
the mean, and for some companies were greater than 100% in totality. Ofwat did
not set out in its methodology any view of what the reasonable range of variation
between companies might be. This adjustment is further predicated on an
assumption (unsupported by evidence) that the variation is due to measurement
error.
• Asymmetric application of changes to enhanced ODI incentive rates. Ofwat
intervened to require or recommend companies to reduce enhanced ODI
incentive rates, without requiring or recommending similar reductions to
3 ‘Delivering Water 2020: Our final methodology for the 2019 price review.’ Ofwat (2017), p59. 4 ‘Delivering Water 2020: Our final methodology for the 2019 price review.’ Ofwat (2017), p60. 5 ‘A consultation on the outcomes framework for PR19: Appendix 2 – More powerful outcome delivery
incentives.’ Ofwat (2016), p10. 6 ‘A consultation on the outcomes framework for PR19: Appendix 2 – More powerful outcome delivery
incentives.’ Ofwat (2016), p17.

4
downside risk. Ofwat cited the need for incentive rates to more closely match
customer willingness to pay, despite having stated that companies should take
‘wider benefits’ into account in its PR19 methodology.
• Asymmetric application of caps and collars. Ofwat intervened to apply caps to
the upside (for instance to enhanced ODI payments), without corresponding
collars. This runs contrary to the position set out regarding the benefits of a
symmetric distribution of risks (for efficient firms) described above.
In this context, we note that the combination of ODI rates, PC levels, caps, collars and
deadbands represent an overall package that companies have calibrated, based on the
expectations set out in the PR19 methodology, to deliver the RoRE risk range of ±1%
to ±3%. The application of multiple, piecemeal, interventions across individual PCs
does not account for these interrelationships. Logically, therefore, the clear
presumption must be that Ofwat’s interventions, when considered in the round, will
likely not be consistent with the previously signalled views on expected RoRE ranges.
2.2 Ofwat’s interventions have led to negatively skewed returns
The overall impact of Ofwat’s interventions is to skew returns to the downside. This
can be seen in fast track companies’ ODI RoRE ranges. The figure below shows
Ofwat’s calculations of the ODI RoRE risk ranges set out in the fast track companies’
DDs. These ranges are the P10 and P90 outcomes, as determined by Ofwat.
Figure 1: ODI RoRE risk ranges – business plans versus draft determinations
Source: Ofwat Draft Determinations for Fast Track Companies
The overarching conclusion is that, in all cases, Ofwat’s interventions have: (i) reduced
the RoRE risk ranges themselves; and (ii) resulted in more negatively skewed RoRE
risk ranges.
-4.6%
-3.9%
-2.8%
-3.2%
-1.9%
-2.3%
3.6%
1.7%
2.4%
1.6%
2.0%
1.0%
-6.0% -5.0% -4.0% -3.0% -2.0% -1.0% 0.0% 1.0% 2.0% 3.0% 4.0% 5.0%
Severn Trent - BP
Severn Trent - DD
South West - BP
South West - DD
United Utilities - BP
United Utilities - DD
ODI RoRE risk ranges

5
We make the following more observations.
• In all three cases Ofwat has lowered the ODI RoRE risk ranges: by 2.6% for Severn
Trent, 0.4% for South West and 0.6% for United Utilities.
• In all three cases Ofwat has significantly lowered the potential upside, by 1.9% for
Severn Trent, 0.8% for South West and 1.0% for United Utilities.
• In two out of the three cases, Ofwat’s interventions have increased downside risk,
by 0.4% in the cases of South West and United Utilities. In Severn Trent’s case,
downside risk is reduced slightly, though by less than the upside reduction.
2.3 Ofwat’s interventions on Wessex’s ODIs will also lead to negatively skewed returns
Ofwat’s interventions on Wessex’s ODIs will also lead to negatively skewed RoRE
ranges. Examples of these interventions include the following.
- requiring Wessex to lower (or consider lowering) enhanced incentive rates, to
be at a lower multiple of standard incentive rates;
- requiring Wessex to propose a cap on enhanced outperformance payments;
- requiring Wessex to consider more challenging thresholds for
outperformance payments;
- requiring Wessex to remove or tighten deadbands from PCs and/or lower or
remove collars; and
- requiring Wessex to provide a greater level of evidence to support
outperformance payments for some PCs.
To demonstrate the impact of Ofwat’s interventions, we ran Wessex’s pre- and post-
IAP App1 tables through our own Monte Carlo model. We first calibrated the
probability distributions in our model so that the implied RoRE range was consistent
with the range set out Wessex’s business plan.7 We then calculated the equivalent
RoRE range based on Wessex’s post-IAP App1 table. As we set out in the figure
overleaf, the RoRE range changes from:
- -1.2% to 1.5% in Wessex’s business plan; to
- -1.3% to 1.0% post-IAP.
In addition, Wessex undertook its own Monte Carlo analysis of post-DD ODI RoRE.
This analysis took the further step of updating the company’s own view on the
outcome probability distributions, to reflect the impact of reductions in totex (as
proposed by Ofwat in its DD) on Wessex’s outcomes. Wessex’s analysis suggests a
RoRE range shifted further to the downside, at -2.4% to -0.3%. These analyses of
RoRE risk are summarised in figure overleaf.
7 ‘Review of Wessex Water’s RoRE Range Spreadsheet Tool: An assurance note prepared for Wessex Water.’
Frontier Economics (2018). Calibrated to the ‘adjusted’ RoRE range quoted by Frontier.

6
Figure 2: ODI RoRE risk ranges – business plans versus draft determinations (Wessex)
Source: Frontier Economics, Economic Insight, Wessex Water
3. The standard CAPM approach does not compensate investors for skewed returns
Having established that Ofwat’s interventions in relation to ODIs represent a clear
departure from the Final Methodology, and that collectively they result in negatively
skewed returns, in this section we consider the broader implications of this for the
WACC. Specifically, we address the following points: (i) that the standard CAPM
approach does not compensate investors for skewed returns; (ii) there is strong
evidence that investors care about skewness; and (iii) that this implies an adjustment
to the cost of capital is required, in light of Ofwat’s interventions.
3.1 The standard CAPM approach only accounts for the mean and variance of returns
At PR19, as in all other UK regulatory determinations, Ofwat’s ‘early view’ of the
WACC included a cost of equity calculation based on the CAPM framework. A key
result of portfolio theory is that only non-diversifiable (systematic) risk increases the
cost of capital. As rational investors prefer higher returns and lower risk, they invest in
a diverse portfolio of assets. By diversifying, investors can eliminate risks across
individual assets that are not correlated with one another. As a consequence,
investors will only require a higher return if the asset in question increases the
systematic risk of their portfolio – in other words, if the risk asset in question is
correlated with the risk of their portfolio.
1.5%
1.0%
-0.3%
-1.2%
-1.3%
-2.4%
-3.0% -2.5% -2.0% -1.5% -1.0% -0.5% 0.0% 0.5% 1.0% 1.5% 2.0%
Wessex - BP
Wessex - IAP (EI)
Wessex - Post DD (totex reductions)
ODI RoRE risk ranges
7
In the CAPM approach, systematic risk is represented by the beta term. The CAPM
formula requires that the excess returns for an asset (i.e. returns in excess of the risk-
free rate) equal the excess returns on the market portfolio, multiplied by a measure of
systematic risk, called beta.
Ri = RF + βi ∙ (RM – RF)
Under this specification, RM and RF are economy-wide parameters. Beta equals the
covariance of the excess return of the asset with the market excess return, divided by
the variance of the market excess return:
𝛽𝑖 =𝐶𝑜𝑣(𝑅𝑖 − 𝑅𝑓 , 𝑅𝑚 − 𝑅𝑓)
𝑉𝑎𝑟(𝑅𝑚 − 𝑅𝑓)
Under this specification, what matters for the cost of capital is not the variance of the
asset per se. Rather, it is whether the returns of the asset and the market portfolio
tend to move together.
As detailed above, systematic risk is incorporated in this framework through the beta
term, which relates to the covariance of the asset excess return with that of the market
portfolio. As a consequence, this approach only accounts for risk in terms of the mean
and variance of the investor’s portfolio. It does not account for the impact of skewness
on investors’ required returns.
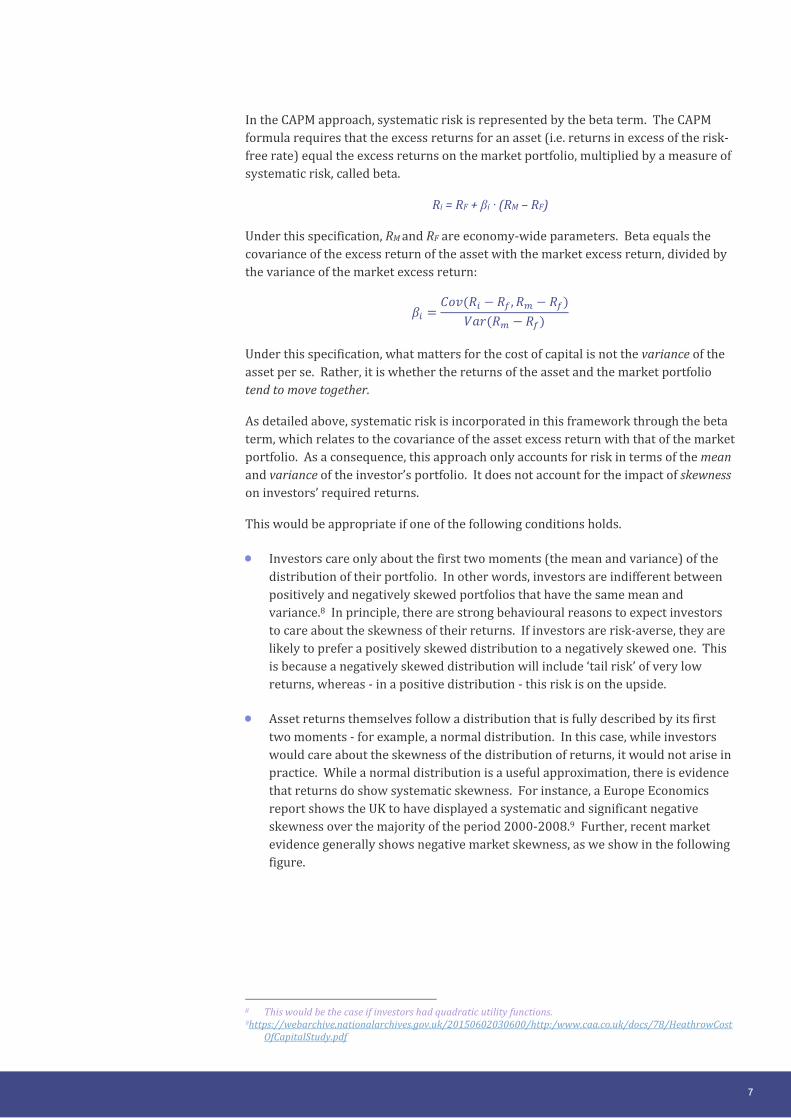
This would be appropriate if one of the following conditions holds.
• Investors care only about the first two moments (the mean and variance) of the
distribution of their portfolio. In other words, investors are indifferent between
positively and negatively skewed portfolios that have the same mean and
variance.8 In principle, there are strong behavioural reasons to expect investors
to care about the skewness of their returns. If investors are risk-averse, they are
likely to prefer a positively skewed distribution to a negatively skewed one. This
is because a negatively skewed distribution will include ‘tail risk’ of very low
returns, whereas - in a positive distribution - this risk is on the upside.
• Asset returns themselves follow a distribution that is fully described by its first
two moments - for example, a normal distribution. In this case, while investors
would care about the skewness of the distribution of returns, it would not arise in
practice. While a normal distribution is a useful approximation, there is evidence
that returns do show systematic skewness. For instance, a Europe Economics
report shows the UK to have displayed a systematic and significant negative
skewness over the majority of the period 2000-2008.9 Further, recent market
evidence generally shows negative market skewness, as we show in the following
figure.
8 This would be the case if investors had quadratic utility functions. 9https://webarchive.nationalarchives.gov.uk/20150602030600/http:/www.caa.co.uk/docs/78/HeathrowCost
OfCapitalStudy.pdf

8
Figure 3: Skewness of FTSE 100 returns based on five-year rolling window (monthly data, one month holding period)
Source: Economic Insight Analysis
In this context, while the focus of this report is on the relationship between the WACC
and skewness in returns, we note that, significantly, Ofwat’s ODI interventions have the
potential to affect the cost of capital in other ways. Most notably, interventions that
introduce negative skew also have the potential to reduce expected returns – which
could affect the cost of capital (through the impact on beta in a standard two-moment
CAPM). In fact, given that: (i) Ofwat’s determined PC levels largely reflect a ‘policy
decision’ (e.g. forecast upper quartile) rather than being the outcome of an analysis of
what a notionally efficient firm can achieve; and (ii) Ofwat’s approach further did not
recognise any interaction between cost and outcomes efficiency, a logical presumption
might be that the expected return of an efficient firm will, in fact, be below its allowed
return at PR19. We do not, however, consider this matter further within the scope of
this report.
-1.800
-1.600
-1.400
-1.200
-1.000
-0.800
-0.600
-0.400
-0.200
0.000
0.200
0.400
01/0
6/20
04
01/1
2/20
04
01/0
6/20
05
01/1
2/20
05
01/0
6/20
06
01/1
2/20
06
01/0
6/20
07
01/1
2/20
07
01/0
6/20
08
01/1
2/20
08
01/0
6/20
09
01/1
2/20
09
01/0
6/20
10
01/1
2/20
10
01/0
6/20
11
01/1
2/20
11
01/0
6/20
12
01/1
2/20
12
01/0
6/20
13
01/1
2/20
13
01/0
6/20
14
01/1
2/20
14
01/0
6/20
15
01/1
2/20
15
01/0
6/20
16
01/1
2/20
16
01/0
6/20
17
01/1
2/20
17
01/0
6/20
18
01/1
2/20
18
01/0
6/20
19
Mar
ket s
kew
ness
(mom
ent c
oeff
icie
nt)
Rolling 5 year skewness

9
3.3 There is theoretical and empirical evidence that investors care about skewness
The relative restrictiveness of the standard CAPM led to the development of models
that incorporated preferences over skewness into investor behaviour. Common to
these models is the concept of coskewness. This concept is analogous to covariance
and reflects the principle that it may be possible to diversify away the negative
skewness of an individual asset, provided that this is not correlated with the degree of
skewness in the market portfolio. In this framework, with a negatively skewed
market portfolio, investors will require higher returns for holding assets that are
positively coskewed.
We now summarise the main conclusions from the economic literature on skewness
and investor behaviour. Kraus and Litzenberger (1976) introduced the ‘three-
moment CAPM’. In this model, an asset’s excess returns depend on parameters beta
(related to covariance) and gamma (related to coskewness), as set out in the equation
below:
𝑅𝑖 − 𝑅𝑓 = 𝑏1𝛽𝑖 + 𝑏2𝛾𝑖
The terms 𝑏1 and 𝑏2 represent the ‘variance risk premium’ and ‘skewness risk
premium’ respectively. As beta and gamma equal 1 for the market portfolio, by
definition it follows that the market excess return equals the sum of the variance and
skewness risk premiums: 𝑅𝑀 − 𝑅𝑓 = 𝑏1 + 𝑏2 . Analogous to beta, the gamma term
equals the asset’s coskewness with the market, divided by the market skewness.
𝛾𝑖 =𝐶𝑜𝑠𝑘𝑒𝑤(𝑅𝑖 − 𝑅𝑓 , 𝑅𝑚 − 𝑅𝑓)
𝑆𝑘𝑒𝑤(𝑅𝑚 − 𝑅𝑓)
The authors tested the model empirically and found a coefficient for 𝑏2 of -0.212,
which is negative and significant at the 10% level, as would be predicted by the three-
moment CAPM. The normal CAPM beta was also significant at the 5% level, which was
considered impressive by the authors due to the presence of significant collinearity
between the regressors.
Friend and Westerfield (1980) further investigated the model of Kraus and
Litzenberger, aiming to test their specification. They incorporated bonds into the
market portfolio to give a more accurate representation of the market portfolio and
examined a wider range of time periods to check that the results were robust to this
change. Their analysis provided support of a coskewness premium but failed in other
aspects. The authors also estimated asset pricing models, specifically those of Fama
and French, including an additional term for skewness. This yielded an estimate of the
skewness premium, which is indicative of how individual stock returns might depend
on skewness. Their estimates confirmed that negative coskewness confers a premium
to the investor - and the result was significant at the 5% level.
Harvey and Siddique (2000) investigated the role of skewness in explaining asset
returns. Constructing two weighted portfolios containing the bottom and top 30% of
securities in terms of skew, they tested the hypothesis that the spread between the
two portfolios was zero. Rejecting the null hypothesis at the 5% level, the data
indicated that there was, indeed, a premium on skewed assets. They also added a
measure of conditional skewness to a Fama-French three factor model, finding a
negative and statistically significant coefficient (at the 5% level) on the conditional

10
skewness term of -0.019, in other words, an additional ‘unit’ of negative skewness will
increase the cost of equity by 1.9%.10
In a paper regarding adjusting Heathrow’s cost of capital for skewness, Professor Ian
Cooper outlined evidence that investors do consider skewness when undertaking
investment decisions. Quotes in investment literature contrast differing upside and
downside risk. If the two are not equal this is evidence of skewness in the distribution
of returns. Furthermore, he quotes more formal studies that have found that the
behaviour of investors is more complex than simple mean-variance analysis. These
include Agarwal and Naik (2004) and Mitton and Vorkink (2004). Europe Economics
also estimate the premium attached to the coskewness of Heathrow airport. They also
find that there is a positive premium attached to negative coskewness over the time
period. This is significant at the 5% level and amounts to 1.9%.
3.4 Ofwat recognised the importance of upside and downside risk in its methodology consultation
In the above context, it is important to highlight that Ofwat itself has recognised the
relationship between upside and downside risk and required returns, in its
methodology consultation for PR19. Specifically, in its methodology consultation on
outcomes, Ofwat linked an anticipated increase in upside risk at PR19 with the
potential for a lower cost of capital, saying:
“By providing investors with more upside risk from ODI rewards, for stretching levels of
outperformance, we can set a lower cost of capital for companies than would otherwise
be the case which leads to lower bills for customers.”11
While this statement relates to upside risk lowering the cost of capital, the key point is
that Ofwat seems to recognise that either: (i) increasing the ‘skew’ on returns can, and
does, affect that cost of capital; and / or (ii) that if ‘expected returns’ are biased
upwards or downwards by the setting of incentives, this may need to be offset in some
way. Of course, at the time of the above statement, Ofwat was contemplating the
theoretical possibility of an upside skew (or more specifically, ‘greater’ upside). In
practice, and as evidenced above, in fact at PR19 Ofwat’s approach results in the
opposite – the implication being, under Ofwat’s own logic, that the cost of capital
would need to increase, unless incentives are recalibrated.
10 Conditional skewness measures coskewness controlling for the skewness of the market, meaning that
negative conditional skewness will always translate into an asset adding negative skew to a portfolio. It is
measured as follows:
𝛾𝑖 =E[ϵ𝑖,𝑡+1ϵ𝑀,𝑡+1
2 ]
√𝐸[𝜖𝑖,𝑡+12 ]𝐸[𝜖𝑀,𝑡+1
2 ]
Where ϵ𝑀,𝑡+12 is the square of the market return and 𝜖𝑖,𝑡+1is the residual from the estimated equation:
𝑟𝑖,𝑡+1 = 𝑎𝑖 + 𝛽𝑖(𝑟𝑀,𝑡+1) + ϵ𝑖,𝑡+1
11 ‘A consultation on the outcomes framework for PR19: Appendix 2 – More powerful outcomes delivery
incentives.’ Ofwat (2016) p29.

11
3.6 The introduction of a material level of skewness therefore requires an adjustment to the WACC
Theoretical and empirical evidence therefore suggests that investors do care about
the skewness of their portfolios. As a consequence, the introduction of a material
degree of negative skew into water company returns would likely lead investors to
require higher returns (especially equity returns). However, as outlined previously,
this is not reflected in Ofwat’s currently proposed WACC. We therefore proceed to
estimate the size of any potential adjustment to the WACC in order to take account of
Ofwat’s interventions on ODIs.
4. Estimated adjustment to the WACC
This section sets out an empirical approach to estimating the impact of additional
skewness on Wessex’s WACC. We first set out our approach, before going on to
describe our results.
4.1 Approach
Our approach to estimating the impact of additional negative skewness on Wessex’s
WACC is as follows.
• Our starting point is the implied increase in negative skewness between Wessex’s
pre- and post-IAP position. We use this to adjust historical data on water
company equity returns, to determine what possible ‘more negatively skewed’
water company returns could look like.
• We therefore first estimate the extent to which Ofwat’s IAP interventions increase
potential skewness. To do this, we compare the skewness of ODI revenue impacts
estimated from our Monte Carlo simulations for: (i) ODIs as specified in the App1
table submitted in Wessex’s business plan; and (ii) ODIs as specified in Wessex’s
post-IAP App1 table.
• We then infer the potential impact on equity returns by taking realised historical
equity returns in the water industry and adjusting these to increase negative
skewness by an equivalent amount. We do this by calculating the amounts by
which returns would need to be reduced, in order to result in an equivalent
increase in negative skewness.
• We then calculate the implied change in the measure of conditional skewness
suggested by Harvey and Siddique (2000). This measures coskewness, adjusted
for the direction of skewness of market returns. We then calculate the impact on
the cost of equity, by combining the estimated change in conditional skewness
with Harvey and Siddique’s estimate that each additional unit of coskewness
increases the cost of equity by 1.9% (as described above).
4.2 Changes to the distribution of water company returns
As set out in section 3.3, we used Monte Carlo simulations to estimate the impact of
changes between Wessex’s business plan and IAP submission. Using these
simulations, we found a change in skewness of -0.419. We then adjust historical water
company equity returns, such that their skewness falls by the same amount, while
their systematic risk (measured by beta) is unchanged.

12
The following figures show the distribution of returns for the listed water companies
(Severn Trent, United Utilities and Pennon). The figures show the distribution of two
years of returns data (up to July 2019), calculated based on monthly holding periods.
In each case, we firstly show the ‘actual’ distribution; followed by the ‘downward
adjusted’ distribution, as per the method described above (i.e. in relation to the latter,
the skewness is apparent in the longer tail at the bottom end of the distribution).
Figure 4: Severn Trent – actual returns (2 years, monthly holding periods)
Source: Economic Insight Analysis
Figure 5: Severn Trent – adjusted returns (2 years, monthly holding periods)
Source: Economic Insight Analysis

13
Figure 6: United Utilities – actual returns (2 years, monthly holding periods)
Source: Economic Insight Analysis
Figure 7: United Utilities – adjusted returns (2 years, monthly holding periods)
Source: Economic Insight Analysis

14
Figure 8: Pennon – actual returns (2 years, monthly holding periods)
Source: Economic Insight Analysis
Figure 9: Pennon – adjusted returns (2 years, monthly holding periods)
Source: Economic Insight Analysis
15
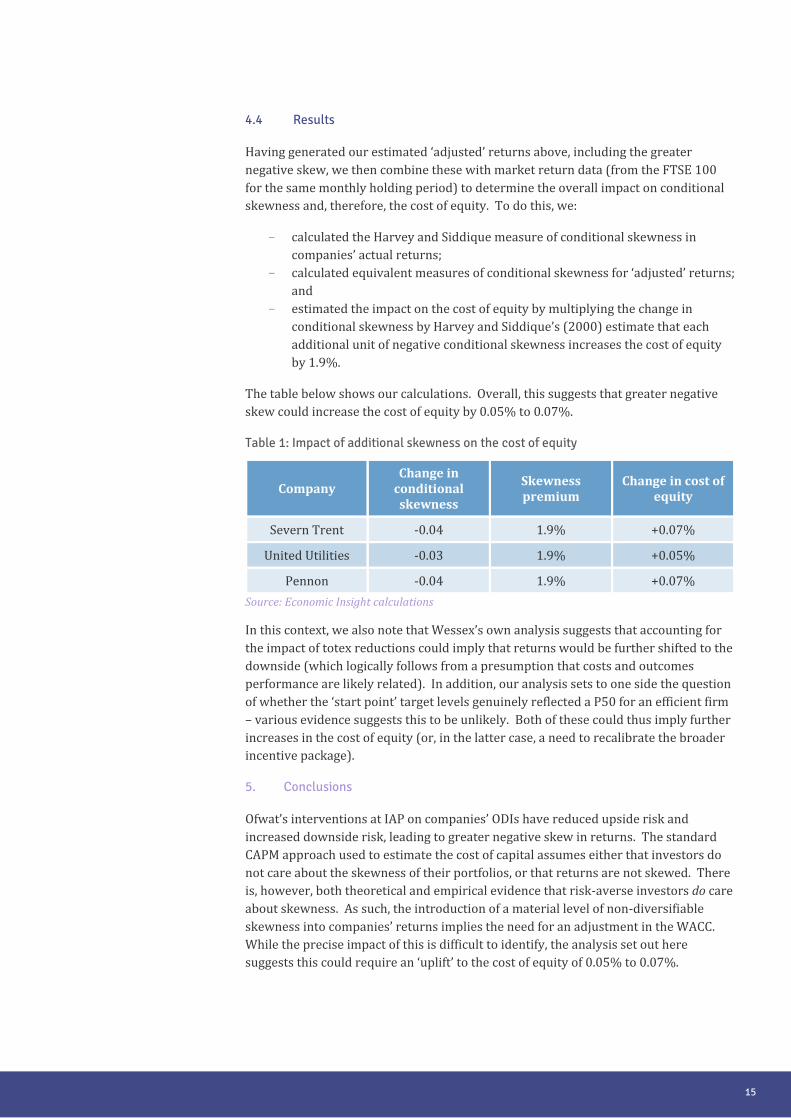
4.4 Results
Having generated our estimated ‘adjusted’ returns above, including the greater
negative skew, we then combine these with market return data (from the FTSE 100
for the same monthly holding period) to determine the overall impact on conditional
skewness and, therefore, the cost of equity. To do this, we:
- calculated the Harvey and Siddique measure of conditional skewness in
companies’ actual returns;
- calculated equivalent measures of conditional skewness for ‘adjusted’ returns;
and
- estimated the impact on the cost of equity by multiplying the change in
conditional skewness by Harvey and Siddique’s (2000) estimate that each
additional unit of negative conditional skewness increases the cost of equity
by 1.9%.
The table below shows our calculations. Overall, this suggests that greater negative
skew could increase the cost of equity by 0.05% to 0.07%.
Table 1: Impact of additional skewness on the cost of equity
Company Change in
conditional skewness
Skewness premium
Change in cost of equity
Severn Trent -0.04 1.9% +0.07%
United Utilities -0.03 1.9% +0.05%
Pennon -0.04 1.9% +0.07%
Source: Economic Insight calculations
In this context, we also note that Wessex’s own analysis suggests that accounting for
the impact of totex reductions could imply that returns would be further shifted to the
downside (which logically follows from a presumption that costs and outcomes
performance are likely related). In addition, our analysis sets to one side the question
of whether the ‘start point’ target levels genuinely reflected a P50 for an efficient firm
– various evidence suggests this to be unlikely. Both of these could thus imply further
increases in the cost of equity (or, in the latter case, a need to recalibrate the broader
incentive package).
5. Conclusions
Ofwat’s interventions at IAP on companies’ ODIs have reduced upside risk and
increased downside risk, leading to greater negative skew in returns. The standard
CAPM approach used to estimate the cost of capital assumes either that investors do
not care about the skewness of their portfolios, or that returns are not skewed. There
is, however, both theoretical and empirical evidence that risk-averse investors do care
about skewness. As such, the introduction of a material level of non-diversifiable
skewness into companies’ returns implies the need for an adjustment in the WACC.
While the precise impact of this is difficult to identify, the analysis set out here
suggests this could require an ‘uplift’ to the cost of equity of 0.05% to 0.07%.

16
6. Annex A: Why non-diversifiable regulatory risk increases the cost of capital
In this section we set out: (i) that ex post regulatory risk can occur through regulators’
actions; and (ii) that Ofwat’s actions at PR19 increased regulatory risk.
6.1 Regulatory risk occurs through the price control and the regulator’s actions
Regulatory risk is generally thought of as being imposed ex ante, through the
structures of the price control. For example, Alexander et al (1996) set out how the
structure of regulatory controls affects the cost of capital. They note that price capped
firms have less ability to respond to cost changes, which increases risk to equity (and
debt) holders. Under rate of return regulation, firms bear less risk, as prices are set to
deliver the fixed rate of return. Thus, the cost of capital is generally higher under
price cap regulation, relative to rate of return regulation. For example, the authors
estimate that beta is 0.67 for the water sector in the UK under price cap regulation
and 0.29 for the water sector in the US under rate of return regulation. This is thought
to be predominantly due to the regulatory system, though it cannot be proven to be
solely the result of this without being able to control for all other potentially relevant
factors.
Regulatory risk can, however, also be imposed ex post (Pedell, 2006). Ex post
regulatory risk occurs when regulators change the rules of the price control ‘after the
event’, for example, to retroactively lower high returns. Although this type of risk
generally receives less attention (as it is widely accepted that ex post changes by
regulators are undesirable, and so such instances may be infrequent), it is extremely
important. In particular, ex post changes that affect incentives and thus the spread of
expected returns may be far more material to investors (and thus the cost of capital)
than differences in ex ante regulatory frameworks. This is because, once a precedent
is set that a regulator may retrospectively intervene to change the return envelope,
investors cannot ‘trust’ the incentive properties of the regime on a forward-looking
basis and will require compensation for this. Indeed, even where a regulator
intervenes in a way that reduces uncertainty over revenue in one control period, if it
does this in an unpredictable or inconsistent manner, the implied increase in
regulatory risk could substantially outweigh the reduction in revenue risk.
The importance of regulatory risk is reflected in several features of the price control
process itself. This includes the expectation that regulators will act in a predictable
and consistent manner, alongside the use of RCV (also called regulatory asset value
and regulatory asset base) in calculating the return element of allowed revenues. This
acts as a commitment mechanism that links price controls, ensuring that long-term
investments continue to earn a return.
6.2 Why regulatory risk is generally non-diversifiable
Greater regulatory risk (whether ex ante or ex post) may not necessarily translate
directly into a higher cost of capital, if it is possible for investors to diversify it away.
In practice, however, it is likely that ex post regulatory risk is, for the most part, non-
diversifiable, and so increases in it will lead to a higher cost of capital.
There are several reasons why this may occur. In the first place, regulatory actions to
reduce companies’ returns generally represent direct transfers of realised returns
from companies (or more specifically, their investors and employees) to consumers.
It is generally not possible for an investor to diversify this risk away by taking a

17
position in which it would directly benefit from an increase in consumer income. In
addition, the pressure on regulators to ‘crack down’ on regulated companies’ returns
is likely to be procyclical. For example, in periods of low growth and low returns,
there may extra pressure to reduce customer bills; whereas in periods of higher
growth and returns this pressure may be reduced.
Havener et al (2001) investigated this in the context of cable-related investments in
the United States. They sought to determine whether re-regulation events, ambiguous
rule making, and frequent rule changes increased the cost of capital for affected
companies. To investigate this, the authors extend the two-moment CAPM model to
an intertemporal asset pricing model. This allowed them to ascertain a time varying
beta, which enabled inspection of how regulatory change impacts the level of non-
diversifiable risk. They found that periods of re-regulation led to increases in the beta
of the stock. This increase in the beta was often quite significant as a proportion of the
mean betas, indicating that the effects are quite substantial. For example, Cablevision
had a mean beta of 0.668, but received a 0.344 addition from a failed re-regulation in
1990 as well as a 0.325 addition from the 10% rate rollback. These effects were all
significant at the 1% level. This view was supported by Hazlett and Spitzer (1997),
who found that the markets demanded greater yield compensation around regulatory
events.
6.3 Regulatory risk is likely to be negatively skewed
A further implication of the literature on this subject is that regulatory risk is likely to
be negatively skewed. This occurs because retroactive interventions aimed at
reducing high returns are not offset by corresponding interventions to cap downside
risk or to boost returns on the upside. As a consequence, the downside risks continue
to be borne primarily by the company’s equity holders, whereas upside risks are
capped.12
12 Pedell, 2006.

18
7. Annex B: Literature review
The table below summarises our review of relevant economic literature on the impact
of skewness on required returns.
Table 2: Literature review summary
Author Title & date Key points
Cooper
Adjusting Heathrow’s cost of capital for
skewness: Methodological and
qualitative issues (2011).
- Evidence suggests that
investors do consider skewness
in their decision making.
- Skewness is omitted in most
analysis as returns are only
skewed in a minority of cases.
- There were no compelling
reasons found to omit skewness
from the analysis when the
asset in question can be shown
to be skewed.
- The literature review suggests
Harvey and Siddique (2000)
have produced the most robust
estimates of the risk premium
to date.
Kraus and Litzenberger
Skewness preference and the valuation of risk
assets (1976).
- Including utility functions which depend on higher order
moments relaxes the strict assumptions underpinning the
CAPM. - The three-moment CAPM takes
a linear form, including risk premiums for both covariance
and coskewness. - The risk premium for
coskewness is estimated to be -0.212, which is significant at the
10% level.
Harvey and Siddique
Conditional skewness in asset pricing tests
(2000)
- Find the presence of significant skewness in certain types of
assets. - Reject the hypothesis of no
premium when comparing the returns of two portfolios with
opposing skewness. - Extending the asset pricing
equations of Fama and French, they estimate the skewness risk
premium. - They find the risk premium to
be -1.9% (significant at the 5% level).

19
Author Title & date Key points
Conine and Tamarkin
Implications of skewness in returns for utilities cost of equity capital
(1985)
- Application of skewness premium to the US utilities
sector. - Undertake theoretical analysis
to estimate the skewness premium, which they find to be
1.35%.
Friend and Westerfield
Coskewness and capital asset pricing (1980)
- Investigate different time periods, as well as including
bonds in the market portfolio for realism.
- Find some evidence supporting the existence of a skewness
premium.
Europe Economics
Heathrow airport’s cost of capital – a report on
behalf of Heathrow (2013)
- Estimates impact of skewness on Heathrow’s cost of equity.
- Finds that the market exhibited significant negative skew between 2001 and 2008.
- Estimates the skewness premium to be 1.9% for
Heathrow.
Source: Economic Insight
7.1 Skewness in asset pricing
7.1.1 Skewness preference and the valuation of risk assets, Kraus and Litzenberger (1976)
The literature on the topic of skewness begins with this paper by Kraus and
Litzenberger. Motivated by the growing literature showing inconsistencies in the
original CAPM, they extend the model to allow for the impact of skewness. While
possible to extend the model to account for higher moments, this is not explored due
to the there being no strong arguments outlining investor attitudes to higher
moments. The authors ensure the classes of utility function used adhere to the
guidance laid out by Arrow for risk-averse agents: (i) positive marginal utility of
wealth, (ii) decreasing marginal utility for wealth, and (iii) non-increasing absolute
risk aversion.
The three-moment equilibrium relationship is characterised as:
𝑅𝑖 − 𝑅𝑓 = 𝑏1𝛽𝑖 + 𝑏2𝛾𝑖
where 𝛾𝑖 is:
𝛾 =𝐶𝑜𝑠𝑘𝑒𝑤(𝑅𝑖 − 𝑅𝑓 , 𝑅𝑚 − 𝑅𝑓)
𝑆𝑘𝑒𝑤(𝑅𝑚 − 𝑅𝑓)
They assert that the crucial test of a theory of valuation lies in its ability to be taken to
the data and accurately predict market values. Expectational data is unavailable so

20
the analysis hinges on the assumption that variables observed ex post are unbiased
estimates of the ex ante expectational variables they are proxying for.
The equation tested in their empirical analysis is:
�̅�𝑖 = 𝑏0 + 𝑏1�̂�𝑖 + 𝑏2�̂�𝑖 + 𝑢𝑖
The coefficient value for 𝑏2 is reported to be -0.212, which is negative and significant
at the 10% level, as would be predicted by the three-moment CAPM. The normal
CAPM beta was also significant at the 5% level, which was considered impressive by
the authors due to the presence of significant collinearity between the regressors.
7.1.2 Adjusting Heathrow’s cost of capital for skewness: Methodological and qualitative issues, Cooper (2011)
Cooper presents an evaluation of why skewness is a relevant concept in the
estimation of Heathrow’s cost of capital. Heathrow’s equity is seen as a negatively
skewed asset, due to it having a binding capacity constraint limiting upside risk, while
also being subject to downside risk, given its exposure to falls in demand. Given that
regulatory constraints restrict Heathrow from raising prices to reflect demand, this
limits the upside of their returns, inducing a negative skew.
Cooper undertakes a review of why skewness is relevant to the cost of equity, drawing
on evidence that investors do, indeed, care about the skewness properties of the
assets they purchase. Formal studies have found that the behaviour of investors is
consistent with more sophisticated methods than simple mean-variance analysis.
These studies include Li (1999), Agarwal and Naik (2004), and Mitton and Vorink
(2004).
Skewness is found to be the accepted measure of asymmetry in returns. In general,
the author found no arguments for its exclusion, other than the fact that for some
shares (whose returns are well approximated by the normal distribution) it is simply
not relevant.
Cooper also undertakes a literature review to determine the consensus value for the
coskewness risk premium (CRP), in order to be able to apply this to his case study of
Heathrow. While there appears to be an ever-expanding literature on the merits of
accounting for higher order moments in the CAPM model, there were few studies
which actually published estimates of the CRP. The most notable of these was Harvey
and Siddique, who found a CRP of -1.9% (significant at the 5% level) using monthly US
data.
The paper also outlines the importance of accounting for coskewness in the context of
a regulated industry. In regulated industries the author outlines three considerations:
(i) allowing a return which is fair in relation to the risks taken by investors, (ii)
allowing a return that is fair to the regulated entity, relative to its customers, and (iii)
allowing a return that is fair, relative to other regulated companies.
In the case that coskewness is not accounted for, investors will be given an inadequate
return, as the model will only account for the beta and will omit the coskewness
adjustment. This means that the return allowed by the regulator would be insufficient
to incentivise the competitive level of investment. In the short run, customers may
benefit through reduced prices resulting from more stringent regulation. These

21
benefits will be short-lived, if investment is deficient, however, disadvantaging
consumers in the long run.
The omission of skewness from the analysis will also deprive regulated industries
with negative coskewness of some of the return that the equity market demands,
relative to other industries that are not subject to negatively skewness. This will
make the regulatory regime inequitable between different regulated industries.
7.1.3 Conditional skewness in asset pricing tests, Harvey and Siddique (2000)
Harvey and Siddique set out to investigate the deficiencies in the single factor CAPM
model. Their focus was to examine the linkage between the identified additional
factors that explain the return on equity and the systematic coskewness of the
security. The inadequacies of the CAPM stemmed from its failure to explain the
returns of specific types of securities. These include those with the smallest market
capitalization; and the returns from specific strategies, such as those based on
momentum. These assets also display the most skewed returns.
Caring about skewness is noted to be consistent with the Arrow-Pratt notion of risk
aversion. Ceteris paribus, investors should prefer portfolios with right-skew as
opposed to left, and therefore left skewed portfolios should command premiums. This
is because for right-skew the upside is relatively unbounded allowing more potential
to gain, whereas for left-skew the downside is unbounded, offering the potential of
larger losses.
Harvey and Siddique assume that the marginal rate of substitution is quadratic in the
market rate of return. As a result, the utility function yields favourable properties,
namely: non-increasing absolute risk aversion, which is a vital property of utility
functions for risk-averse agents according to Arrow.
The authors find the presence of significant skewness in certain types of assets and
reject the hypothesis of no premium when comparing the returns of two portfolios
with opposing skewness. Extending the asset pricing equations of Fama and French,
they estimate the skewness risk premium, which they find to be -1.9% (significant at
the 5% level).
7.2 Regulatory risk and diversification
7.2.1 Regulatory structure and risk and infrastructure firms, Alexander, Mayer, and Weeds (1996)
In this paper entitled ‘Regulatory structure and risk and infrastructure firms’ the
authors evaluate the impact that the regulatory regime has on the level of shareholder
risk. The general theory motivating the empirical investigation is that under various
regulatory regimes, firms are exposed to different levels of risk. As such, they will
have differing costs of capital. For example, under price caps firms have diminished
ability to respond to cost changes, therefore increasing the risk to equity holders and
the premiums they will demand. Cost pass throughs can help to mitigate such issues,
so long as they are implemented in a symmetric manner, so as not to expose
companies to more risk. On the other hand, regulatory regimes such as ‘rate of
return’, which are commonly implemented in the US, are far less restrictive, leading
the company to bear much less risk. The equity premiums should be smaller under
these regimes than those with price caps.

22
The authors also identify other important factors that may influence the cost of
capital:
- Ownership – if the government is a partial shareholder, it may confer reduced
risk. Cost of borrowing may fall, as well as perceived risk of insolvency.
- Competition – how many competitors operate in the industry will influence
ability to pass on cost and risk.
- Industry structure – vertical integration could confer a lower beta, due to
improved ability to deal with cyclical fluctuations.
- Diversity of operation – few companies are pure utilities operators, making
computing a separate beta for each industry challenging.
The authors estimate the betas for a range of utilities sectors and countries, enabling
comparison of the equity premium effects of different regulatory regimes. The results
show a clear disparity between the US and UK, with UK betas significantly higher. For
example, the beta is 0.67 for the water sector in the UK and 0.29 for the water sector
in the US. This is thought to be predominantly down to the ‘rate of return’ style
regulatory regime in the US reducing the level of risk undertaken by investors, though
it cannot be proven to be solely the result of this without controlling for other factors.
7.2.2 Regulatory risk and the cost of capital – Pedell (2006)
The author outlines that asymmetry is ‘one of the most striking characteristics of
regulatory risk’. This type of risk can be created ex ante, through the existing rules of
the regulatory system. It can also be imposed ex post, after investments have taken
place, to retroactively reduce returns. All of this is done without mitigating the
downside risks that accompany these investments. As payments to debt holders are
fixed, due to the seniority of debt to equity, this means that the risk is borne mostly by
the equity holders as opposed to the debt holders, so long as the risk of financial
distress does not increase substantially.
The author also notes that this type of risk would, in most cases, not be diversifiable.
In cases where the asymmetry applies to something like access rates, this could be
diversified by investing in a range of competitors. If, however, as is the case in the
water sector in the UK, the regulation applies to consumer prices, then it will not be
possible to diversify this risk, given that consumers are the net beneficiary of this
policy.
This is predicted to lead to underinvestment in these types of regulated utilities. Even
if the allowed rate of return is greater than the cost of capital (computed by the
standard CAPM), the asymmetries imposed by regulation may still demand a greater
premium depending on the extent of the skewness. Suggested ways of dealing with
this issue are given as:
- estimate and compensate for any induced asymmetry;
- do not induce asymmetry in the first place; and / or
- in a similar way to limiting the upside risk, the regulator could safeguard the
firm against downside risk to reduce the skewness.

23
7.2.4 The effects of rate regulations on mean returns and non-diversifiable risk: the case of cable television, Havenner, Hazlett, and Leng (2001)
The authors posit that re-regulation events increased risk for cable-related
investments. They cite ambiguous rule makings issued by the Federal
Communications Commission, as well as frequent rule changes for this increased risk.
This view was supported by Hazlett and Spitzer (1997) where they found that the
markets demanded greater yield compensation around regulatory events. Their belief
was that the risk premium rose during periods of regulatory change.
To investigate this, the authors extend the two-moment CAPM model to an
intertemporal asset pricing model. This allowed them to ascertain a time varying
beta, which enabled inspection of how regulatory change impacts the level of non-
diversifiable risk. They found that periods of re-regulation led to increases in the beta
of the stock, and this increase in the beta was often quite significant as a proportion of
the mean betas, indicating that the effects are quite substantial. For example,
Cablevision had a mean beta of 0.668, but received a 0.344 addition from a failed re-
regulation in 1990 as well as a 0.325 addition from the 10% rate rollback. These
effects were all significant at the 1% level.

24
Economic Insight Limited 125 Old Broad Street London EC2N 1AR 0207 100 3746 www.economic-insight.com
Economic Insight Ltd is registered in England No. 7608279.
Whilst every effort has been made to ensure the accuracy of the material and analysis contained in this
document, the Company accepts no liability for any action taken on the basis of its contents. Economic Insight
is not licensed in the conduct of investment business as defined in the Financial Services and Markets Act 2000.
Any individual or firm considering a specific investment should consult their own broker or other investment
adviser. The Company accepts no liability for any specific investment decision, which must be at the investor’s
own risk.
© Economic Insight, 2019. All rights reserved. Other than the quotation of short passages for the purposes
of criticism or review, no part of this document may be used or reproduced without express permission.