OFFSHORE WIND ENERGY - niwe.res.in
32
Dr. Rajesh Katyal Director General – Additional Charge Group Head – Wind Resource Assessment & Offshore OFFSHORE WIND ENERGY
Transcript of OFFSHORE WIND ENERGY - niwe.res.in

Dr. Rajesh Katyal Director General – Additional Charge
Group Head – Wind Resource Assessment & Offshore
OFFSHORE WIND ENERGY

Higher generation
Surfaces of seas are generally
smooth.
Low Roughness
less turbulent and possesses
high wind density
High Capacity Utilization Factors (CUF)
Less noise when compared to land based turbines
2

Logarithmic profiles indicating increasing wind speeds with height for typical onshore and offshore wind turbines
Viable and proven technology
Higher PLF than onshore wind
farm – calm, steady and less
turbulent wind flow
Acquisition of Land, Logistic
Management, Power Evacuation
are challenges for the land based
wind farms.
3

World wide 14.3 GW offshore wind capacity installed
Approximately equal capacity is under construction
Asia Pacific Offshore installations:
1. United Kingdom 5156 MW
2. Germany 4108 MW
3. China 1627 MW
4. Denmark 1271 MW
5. Netherlands 1118 MW
6. Belgium 712 MW
7. Sweden 202 MW
8. Others 190 MW
TOTAL 14384 MW
Off-shore Global Scenario
4

India is blessed a coast line of about 7600 kms.
Under national wind monitoring programme winds have been measured at 74 locations in the coast line
Indian Efforts [ by MNRE/ NIWE ]
5

Wind power density (measure of power available in the wind) as 603 W/m2 at 50 m a.g.l.
- Narrow piece of land
jutting towards Sri Lanka
Indian Efforts [by MNRE/ NIWE]
6

NIWE has already installed a 100 m guyed mast at Rameshwaram, Ramanathapuram district in Tamil Nadu.
Rameshwaram
Monthly Average Wind Speed at Rameshwaram at 100 m height (m/s)
October 2015 8.3457
November 2015 7.4629
December 2015 9.0546
January 2016 9.7545
February 2016 7.4781
March 2016 7.7169
April 2016 5.2374
May 2016 9.9044
June 2016 9.9286
July 2016 10.2385
August 2016 9.7407
Average 8.6238
Indian Efforts [ by MNRE/ NIWE ]
7

• WPD at Kanyakumari is in the range of 370 W/m2 at 30 m a.g.l.
• Nuclear Power Corporation Indian
Ltd., Kudangulam, near
Kanyakumari
• Proposed location for installing 2nd
100 m mast.
Indian Efforts [ by MNRE/ NIWE ]
Kanyakumari
8

• Western Coast line has modest potential at sea level.
• Gujarat has reasonable potential but is prone to cyclonic conditions that can be very severe.
• Coastal areas in Kerala and Karnataka have
shown marginal sites indicating that winds are rather poor in the first hundred meters.
• Elevated hills of Goa also exhibit similar
trends
• One moves up northwards there is some
improvement but it is not something that
will attract offshore wind farming
Gujarat / Goa / Karnataka / Kerala
Indian Efforts [ by MNRE/ NIWE]
9

IDENTIFIED OFFSHORE WIND POTENTIAL ZONES
GUJARAT TAMIL NADU
8 zones identified both for Gujarat and Tamil Nadu
Total area (A to H) = 17706 Sq.km
India has a coastline of - 7600 kms
Total area (A to H) = 10558 Sq.km

Location of the offshore structure at Gujarat
Location: Latitude 20° 41’ 30” N Longitude: 71° 32’ 50” E Village: Pipavav, Tehsil: Rajula District: Amreli
Distance from the shore: 23 km
CRZ classification of the zone : CRZ- IV as per CRZ notification 2011
Enlarged view of the proposed location

Location of the offshore structure at Gujarat
Sl.
No.
Latitude
North
Longitude
East
Area
(Km2)
Zone-A
1,921
1 A_1 20.39243489 71.00247467
2 A_2 20.72821685 71.57147993
3 A_3 20.21484215 71.57147993
Sl.
No.
Latitude
North
Longitude
East Area (Km2)
Zone-B
1 B_1 20.31356438 71.80858696
2,924
2 B_2 20.35591954 71.66020473
3 B_3 20.77858661 71.65984332
4 B_4 21.11836035 72.13794098
5 B_5 20.81027519 72.37086712
6 B_6 20.49462566 72.2078889
7 B_7 20.3512001 71.91726437
8 B_8 20.57374373 72.14044563
9 B_9 20.83390609 72.1391539
10 B_10 20.83407181 71.80732725

Location of the offshore structure at Gujarat
Sl.No. Latitude
North
Longitude
East
Area
(Km2)
Zone C
1,414
1 C_1 20.51474592 70.62598998
2 C_2 20.56310546 70.64595508
3 C_3 20.64769737 70.7101286
4 C_4 20.62084794 70.78856291
5 C_5 20.63695817 71.01816153
6 C_6 20.8496884 71.54977754
7 C_7 20.82453255 71.57848728
Sl.
No.
Latitude
North Longitude East Area (Km2)
Zone D
2,547
1 D_1 20.2560653 72.38257482
2 D_2 20.45556476 72.19124264
3 D_3 20.48804274 72.23283659
4 D_4 20.79176505 72.39719213
5 D_5 20.91911129 72.55263467
6 D_6 20.98051119 72.56855921
7 D_7 20.98720781 72.65234131
8 D_8 20.62180088 72.74325381
9 D_9 20.57523217 72.63259409
10 D_10 20.46954608 72.58886102
11 D_11 20.41757165 72.50709919

Location of the offshore structure at Gujarat
Sl.
No. Latitude North Longitude - East
Area
(Km2)
Zone E
2,503
1 E_1 19.98709564 72.29233427
2 E_2 20.18470016 71.6577294
3 E_3 20.34282578 71.66010619
4 E_4 20.30000218 71.82572143
5 E_5 20.45760545 72.15495539
6 E_6 20.21723576 72.37837433
7. E_7 20.34282578 71.66058155
Sl.
No. Latitude North Longitude - East
Area
(Km2)
Zone F
2,519
1 F_1 20.81776166 72.39760608
2 F_2 21.13084877 72.16052056
3 F_3 21.48665311 72.36373672
4 F_4 21.5807196 72.48138819
5 F_5 21.58005268 72.54912691
6 F_6 21.01807999 72.55554426
7. F_7 20.92833871 72.53272701

Location of the offshore structure at Gujarat
Sl.
No. Zones Latitude North Longitude - East
Area
(Km2)
Zone G
1,624
1 G_1 21.55618308 69.10222293
2 G_2 21.63384921 69.39962563
3 G_3 21.74411849 69.30189172
4 G_4 21.89946961 69.11745226
5 G_5 22.20965761 68.88452612
6 G_6 22.20080466 68.83508874
7 G_7 21.62318206 69.04453212
Sl.No. Latitude North Longitude - East Area
(Km2)
Zone H
2,254
1 H_1 21.20355861 69.83237505
2 H_2 21.18617237 69.65268918
3 H_3 21.2142568 69.33609978
4 H_4 21.54150759 69.1107794
5 H_5 21.62287092 69.41149179

Monopile of 1.2 m diameter – 25 mm thickness Total pile length – 47.5 m Platform Dia – 5 m
Conceptual layout of Sub-structure for mounting LIDAR
Substructure details


•NIWE has done Reanalysis with the help of MERRA / ERA data •Annual Energy Production (AEP) calculation has been done with various offshore turbines available in the market
S.No Make WTG rating
(MW)
Rotor
Diameter (m)
Hub Height
(m)
IEC 61400-3
1 Gamesa 5.00 128 100 Class 1B
2 Sinovel 6.00 128 100 -
3 RE power 6.20 126 100 -
4 Vestas 3.00 112 100 Class 1B
Wind Profile
levels Units Jan Feb Mar Apr May Jun Jul Aug Sep Oct Nov Dec All
10 m/s 2.81 3.01 3.79 5.79 7.98 8.57 9.35 8.84 6.99 4.17 2.54 3.22 5.60
25 m/s 4.23 4.22 4.96 6.24 8.35 8.96 9.84 9.30 7.26 4.79 3.90 4.72 6.41
50 m/s 5.32 5.15 5.87 6.58 8.62 9.25 10.22 9.65 7.47 5.26 4.95 5.86 7.03
75 m/s 5.96 5.70 6.40 6.78 8.78 9.43 10.44 9.86 7.59 5.53 5.56 6.54 7.39
100 m/s 6.39 6.08 6.79 6.96 8.91 9.55 10.60 10.01 7.69 5.73 5.97 6.98 7.65
150 m/s 6.81 6.48 7.41 7.54 9.20 9.75 10.81 10.23 7.88 6.00 6.21 7.35 7.98
200 m/s 6.74 6.48 7.63 7.86 9.42 9.92 10.99 10.49 8.07 6.05 6.26 7.41 8.12

Month Net Energy (kWh)
Gamesa G128-5 MW Offshore (100m)
Sinovel SL6000/128 Offshore (100m)
REpower 6.2M126 Offshore (100m)
Vestas V112 - 3.0 MW Offshore (100m)
Jan 767,657 717,579 767,619 582,006
Feb 637,062 592,498 633,755 483,827
Mar 903,810 868,829 921,029 681,531
Apr 960,450 941,934 993,360 716,000
May 1,589,039 1,640,575 1,705,449 1,152,437
Jun 1,728,022 1,823,600 1,886,677 1,231,424
Jul 2,200,557 2,356,054 2,424,719 1,557,409
Aug 1,993,582 2,102,893 2,171,951 1,428,173
Sep 1,097,800 1,082,825 1,142,383 815,446
Oct 556,859 505,500 544,698 424,269
Nov 609,447 557,401 600,381 466,116
Dec 970,971 941,101 993,671 729,958
Overall 14,015,218 14,130,815 14,785,722 10,268,590
Per MW 2,803,044 2,355,136 2,384,794 3,422,863
CUF % 32% 27% 27% 40%
Note : Applied standard correction Factors (Machine & Grid availability - 95%, Transmission loss- 5%)

Geophysical and Geotechnical studies off Gujarat and Tamil Nadu coasts
• To better understand the subsea profile data. • Varying water depths ranging between 15 to 35 meters. • Continuous Cone Penetration Test to be carried out. • Friction offered from the sub-surface soil and the tip resistance to be plotted. • Study will provide useful pointers for designing the offshore wind turbine
foundations.
Gujarat Tamil Nadu

Geophysical and Geotechnical studies
ENC Chart for Gujarat coast ENC Chart for Tamil Nadu coast

FUTURE PLANS
1. Installation of LiDAR based offshore wind measurements Gulf of Mannar, Near Tuticorin, Tamil Nadu
• LiDAR procurement underway • Central level clearances obtained – MoD, MEA, MHA and Dos • State level clearances underway – TMB, TNSCZMA • Design of sub-structure (monopile & platform) completed
LiDAR location 37 kms south of Tuticorin with water depth about 17 meters falling in Zone-A as per prefeasibility report submitted by FOWIND
Latitude : 8° 25' 00" N
Longitude : 78° 12' 00" E

Location of the offshore structure at TAMIL NADU
Sl.
No. Latitude North Longitude - East
Area
(Km2)
Zone A
588
1 A_1 8.35016539 78.18180888
2 A_2 8.41609179 78.194089
3 A_3 8.4956049 78.25303357
4 A_4 8.59342804 78.24892912
5 A_5 8.61530919 78.32023304
6 A_6 8.6998648 78.38500076
7 A_7 8.76563925 78.41479391
8 A_8 8.79732217 78.41812143
9 A_9 8.71669084 78.4618545
10 A_10 8.58645658 78.38328206
11 A_11 8.33864526 78.34049971
Sl.
No.
Latitude
North
Longitude -
East
Area
(Km2)
Zone B
1555
1 B_1 7.84427964 77.61085464
2 B_2 7.98372214 77.6202826
3 B_3 8.06190201 77.64523897
4 B_4 8.06641861 77.80779606
5 B_5 8.16056841 77.88266517
6 B_6 8.25824728 78.06449016
7 B_7 7.8599222 78.07005187

Location of the offshore structure at TAMIL NADU Sl.
No. Zone C Latitude North Longitude - East Area (Km2)
1 C_1 8.73207867 78.48050778
810
2 C_2 8.78947766 78.44521234
3 C_3 8.83351095 78.43065445
4 C_4 8.84533106 78.41936467
5 C_5 8.8531847 78.41783353
6 C_6 8.883918 78.46933664
7 C_7 8.95909274 78.67260825
8 C_8 8.98200937 78.71305583
9 C_9 8.98517305 78.80622804
10 C_10 9.00437245 78.89238694
11 C_11 9.01914052 78.9232853
12 C_12 9.04104339 79.06663922
13 C_13 9.07805401 79.20174678
14 C_14 9.05820887 79.28751114
15 C_15 8.96439127 79.50659106
16 C_16 8.91693499 79.49061898
17 C_17 9.01266913 79.25433183
18 C_18 9.02079774 79.19053917
19 C_19 8.99464402 78.96177966
20 C_20 8.8516538 78.59456448
Sl.
No. Latitude North Longitude - East
Area
(Km2)
Zone D
1015
1 D_1 7.86139162 78.0816031
2 D_2 8.26231966 78.07387851
3 D_3 8.31622736 78.14779691
4 D_4 8.31267636 78.26473533
5 D_5 8.29492086 78.27186573
6 D_6 8.28781844 78.33889141
7 D_7 8.12797971 78.29610906
8 D_8 8.10666298 78.27828308
9 D_9 8.06260477 78.27043965
10 D_10 7.86513625 78.15207514

Location of the offshore structure at TAMIL NADU
Sl.
No. Latitude North
Longitude -
East Area (Km2)
Zone E
1316
1 E_1 7.57955448 77.59532623
2 E_2 7.83299767 77.61106855
3 E_3 7.84971502 78.06949163
4 E_4 7.84864855 78.06949728
5 E_5 7.64478517 77.98962105
6 E_6 7.57362536 77.87103471
Sl.
No. Latitude North Longitude - East
Area
(Km2)
Zone F
1556
1 F_1 9.42557891 79.4311462
2 F_2 9.44021113 79.40904199
3 F_3 9.45625865 79.37006251
4 F_4 9.46900174 79.31130809
5 F_5 9.46734988 79.25245858
6 F_6 9.43690714 79.12317666
7 F_7 9.44540306 79.00671359
8 F_8 9.62108509 79.09614793
9 F_9 9.97753049 79.46502687
10 F_10 9.96245076 79.57150739
11 F_11 9.67202952 79.35854635
12 F_12 9.46631746 79.45551968

Location of the offshore structure at TAMIL NADU
Sl.
No. Latitude North Longitude - East
Area
(Km2)
Zone G
1602
1 G_1 7.73561858 77.21733623
2 G_2 7.98624941 77.27259677
3 G_3 7.99868805 77.33855289
4 G_4 8.0271178 77.38490044
5 G_5 8.01290318 77.47581294
6 G_6 7.98980334 77.50076931
7 G_7 7.98091844 77.60594259
8 G_8 7.57911968 77.57920362
9 G_9 7.6360351 77.36707446
Sl.
No. Latitude North Longitude - East
Area
(Km2)
Zone H
2116
1 H-1 9.98880055 79.49307308
2 H-2 10.17157923 79.6347302
3 H-3 10.17534676 79.83913476
4 H-4 10.22714565 79.93800953
5 H-5 10.26104574 79.96462966
6 H-6 10.55563199 79.93515737
7 H-7 10.58291159 80.06825802
8 H-8 10.22243701 80.26030324
9 H-9 10.10564028 80.07396233
10 H-10 9.97089392 79.6147651
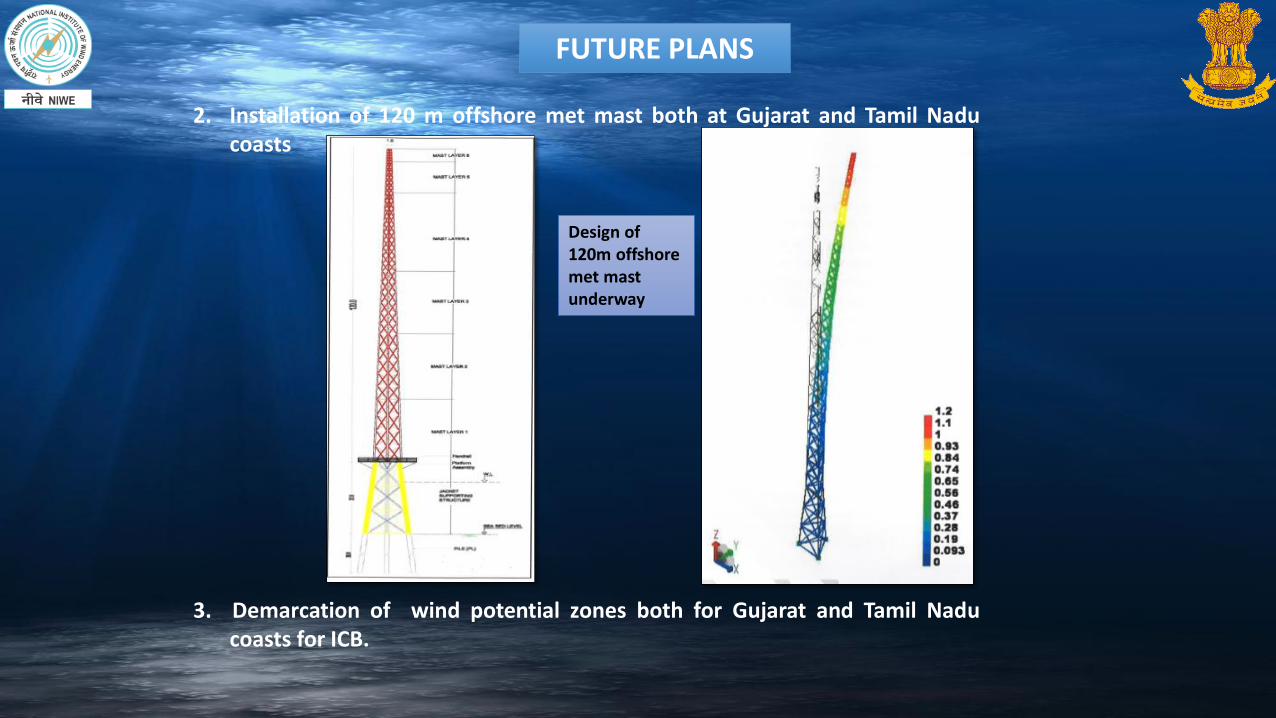
FUTURE PLANS
2. Installation of 120 m offshore met mast both at Gujarat and Tamil Nadu coasts
Design of 120m offshore met mast underway
3. Demarcation of wind potential zones both for Gujarat and Tamil Nadu coasts for ICB.