Offshore Revolution? Decoding the UK Offshore Wind ... · 3 The UK offshore wind strike prices...
12
29 September 2017 Offshore Revolution? Decoding the UK Offshore Wind Auctions and What the Results Mean for a “Zero-Subsidy” Future Overview In this paper, we review the outcome of the latest UK auction for “less established” low-carbon generation technologies, such as offshore wind. The auction resulted in record low costs, with prices paid for offshore wind in the mid-2020s now not much higher than the government’s expected wholesale price. The results are in line with other auctions in Europe, where the costs of renewable power have fallen sharply, owing to cost efficiencies. Such lower prices raise the prospect of a “zero subsidy” future, in which solar, onshore wind, and offshore wind compete directly against each other and against other forms of power generation. These developments will bring with them increasing costs of integration, and increased risk for both governments and investors—for example, the risk that projects will not be delivered, as well as the risks associated with greater exposure to market prices. The paper is set out in four parts. First, we describe the results of the UK auctions and consider the extent to which price outcomes for offshore wind projects imply that they are competitive with other technologies. Second, we compare UK auction prices for offshore wind with prices across Europe: we observe a broad downward trend in costs, but describe and analyse the significant variations between countries. Third, we assess the bid strategies observed in the auction—both the successful and the seemingly less successful. Finally, we consider what these results mean for offshore wind investors and governments, and the implications for market design as the transition to low-carbon energy sources continues. By Daniel Radov, Alon Carmel, and Clemens Koenig
Transcript of Offshore Revolution? Decoding the UK Offshore Wind ... · 3 The UK offshore wind strike prices...
29 September 2017
Offshore Revolution?Decoding the UK Offshore Wind Auctions and What the Results Mean for a “Zero-Subsidy” Future
Overview
In this paper, we review the outcome of the latest UK auction for “less established”
low-carbon generation technologies, such as offshore wind. The auction resulted in
record low costs, with prices paid for offshore wind in the mid-2020s now not much
higher than the government’s expected wholesale price. The results are in line with other
auctions in Europe, where the costs of renewable power have fallen sharply, owing to
cost efficiencies. Such lower prices raise the prospect of a “zero subsidy” future, in which
solar, onshore wind, and offshore wind compete directly against each other and against
other forms of power generation. These developments will bring with them increasing
costs of integration, and increased risk for both governments and investors—for example,
the risk that projects will not be delivered, as well as the risks associated with greater
exposure to market prices.
The paper is set out in four parts. First, we describe the results of the UK auctions and
consider the extent to which price outcomes for offshore wind projects imply that they
are competitive with other technologies. Second, we compare UK auction prices for
offshore wind with prices across Europe: we observe a broad downward trend in costs,
but describe and analyse the significant variations between countries. Third, we assess
the bid strategies observed in the auction—both the successful and the seemingly less
successful. Finally, we consider what these results mean for offshore wind investors and
governments, and the implications for market design as the transition to low-carbon
energy sources continues.
By Daniel Radov, Alon Carmel, and Clemens Koenig
www.nera.com 2
Is wind generation now competitive with other technologies? Renewable subsidy auctions are forcing down the cost of renewables at an astonishing rate,
bolstering hopes that some forms of low-carbon electricity will soon be able to compete
against gas-fired generation. The results of the latest UK auction for “less established
technologies” were published on 11 September, with subsidy contracts awarded to 3.2 GW
of offshore wind and 150 MW of bioenergy projects.1 The lowest clearing price, £57.50/
MWh, was approximately half the lowest bid in the 2015 auction (£114.39/MWh)—even
though the new projects will be delivered only four years later (for the delivery year
2022/23). These auctions are being hailed as a success for the government’s Contract for
Difference (CfD) and renewable auctions policy, as well as for the offshore wind industry,
which has exceeded expectations by moving down the cost curve so quickly. The successful
offshore wind projects of the 2017 auction are shown in Table 1 below.
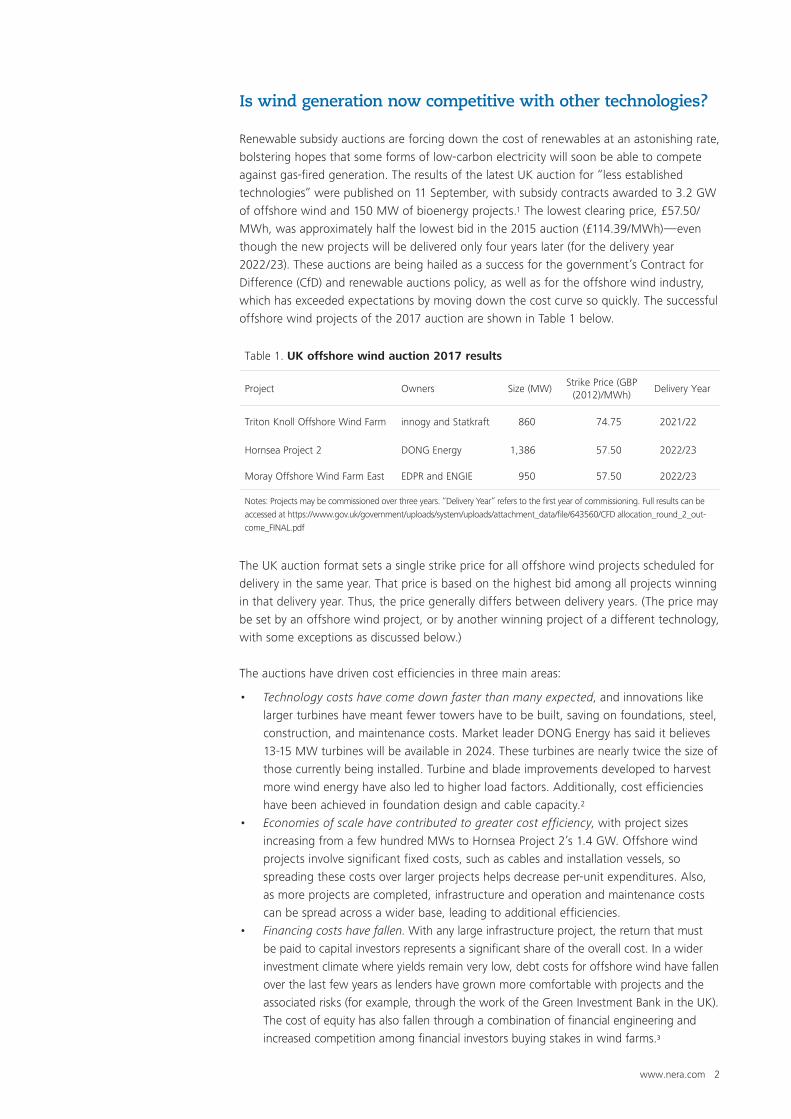
Table 1. UK offshore wind auction 2017 results
Project Owners Size (MW)Strike Price (GBP
(2012)/MWh) Delivery Year
Triton Knoll Offshore Wind Farm innogy and Statkraft 860 74.75 2021/22
Hornsea Project 2 DONG Energy 1,386 57.50 2022/23
Moray Offshore Wind Farm East EDPR and ENGIE 950 57.50 2022/23
Notes: Projects may be commissioned over three years. “Delivery Year” refers to the first year of commissioning. Full results can be
accessed at https://www.gov.uk/government/uploads/system/uploads/attachment_data/file/643560/CFD allocation_round_2_out-
come_FINAL.pdf
The UK auction format sets a single strike price for all offshore wind projects scheduled for
delivery in the same year. That price is based on the highest bid among all projects winning
in that delivery year. Thus, the price generally differs between delivery years. (The price may
be set by an offshore wind project, or by another winning project of a different technology,
with some exceptions as discussed below.)
The auctions have driven cost efficiencies in three main areas:
• Technology costs have come down faster than many expected, and innovations like
larger turbines have meant fewer towers have to be built, saving on foundations, steel,
construction, and maintenance costs. Market leader DONG Energy has said it believes
13-15 MW turbines will be available in 2024. These turbines are nearly twice the size of
those currently being installed. Turbine and blade improvements developed to harvest
more wind energy have also led to higher load factors. Additionally, cost efficiencies
have been achieved in foundation design and cable capacity.2
• Economies of scale have contributed to greater cost efficiency, with project sizes
increasing from a few hundred MWs to Hornsea Project 2’s 1.4 GW. Offshore wind
projects involve significant fixed costs, such as cables and installation vessels, so
spreading these costs over larger projects helps decrease per-unit expenditures. Also,
as more projects are completed, infrastructure and operation and maintenance costs
can be spread across a wider base, leading to additional efficiencies.
• Financing costs have fallen. With any large infrastructure project, the return that must
be paid to capital investors represents a significant share of the overall cost. In a wider
investment climate where yields remain very low, debt costs for offshore wind have fallen
over the last few years as lenders have grown more comfortable with projects and the
associated risks (for example, through the work of the Green Investment Bank in the UK).
The cost of equity has also fallen through a combination of financial engineering and
increased competition among financial investors buying stakes in wind farms.³
www.nera.com 3
The UK offshore wind strike prices imply levelised costs of energy (LCOE) in line with
or below new gas plants (once carbon cost are included).4 The strike prices are also
significantly below the roughly £80/MWh for onshore wind and solar awarded in the last
UK auction in 2015, though the costs of these technologies have also fallen since that
auction. (In Germany in 2017, onshore wind auctions awarded over 1 GW at an average
price of €43/MWh, or a mere £34/MWh in 2012 prices. The UK has not held an auction
for solar or onshore wind since 2015.) The offshore wind strike prices are also significantly
below the CfD strike price granted to the planned Hinkley Point C nuclear project’s £92.50/
MWh (awarded without competition, for 35 years).
However, a full comparison of the competitiveness of the different technologies must account
for the fact that wind-powered generation is not always available at times when power is
needed, and is therefore less able to capture market prices. System integration costs (SICs)
accounting for the need for back-up generation and higher balancing costs have been estimated
in several recent studies.5 Nevertheless, even adding SICs of £10-15/MWh, the strike prices of
the lowest-cost offshore wind CfDs are significantly below the price awarded to Hinkley Point C.
Drawing the conclusion that offshore wind is nearing “grid parity” and able to compete
with new gas plants on a merchant basis seems premature, however. Merchant plants bear
the risk that future prices turn out to be lower than expected, whereas CfD projects are
protected from this risk (by shifting it to the government and consumers). If CfD projects
were forced to bear the risk of uncertain and volatile power prices this would increase their
costs. (One way to deal with such risk would be to obtain a power purchase agreement
(PPA) with a fixed or “floor” price, but such price insurance would come at a cost.)
Figure 1 shows the strike prices awarded to each of the winning offshore projects alongside
the UK’s projected wholesale market price, which determines how much top-up support
the government expects to pay. The figure reveals that the difference between the strike
price awarded to Hornsea 2 and Moray and the BEIS wholesale price projection is very small.
However, as discussed above it is not just the expected level, but also the risk associated with
the power price that will determine when projects can compete on a truly unsubsidized basis.
Figure 1. Electricity wholesale prices and offshore wind strike prices
Source: NERA analysis based on BEIS UEP (2017) and CfD Allocation Framework 2017.
32
36
40
44
48
52
56
60
64
68
72
76
80
40
45
50
55
60
65
70
75
80
85
90
95
100
2015 2016 2017 2018 2019 2020 2021 2022 2023 2024 2025 2026 2027 2028 2029 2030
UK government wholesale electricity price projections (2017)
CfD strike price for Hornsea 2 and Moray
CfD strike price for Triton Knoll
EU
R(2
016)/
MW
h GB
P(2
012)/M
Wh
www.nera.com 4
Are UK offshore wind prices low compared to prices in other countries?
How do the UK results compare to recent outcomes in other EU countries, where the costs
of offshore wind have also been plummeting? Auctions in the Netherlands and Denmark
saw strike prices for offshore wind drop to €50-55/MWh in 2016 (around £40-45/MWh in
2012 prices). In Germany, the 2017 auctions produced some bids at “zero-subsidy” levels
(i.e., developers said they were willing to build their wind farm relying only on revenue from
wholesale electricity prices, though the cost of connecting to the electricity grid is paid by
the transmission operator and ultimately borne by consumers, which many consider a form of
subsidy).6 The UK auction prices are part of a downward trend across Europe, but there are
significant variations between countries.
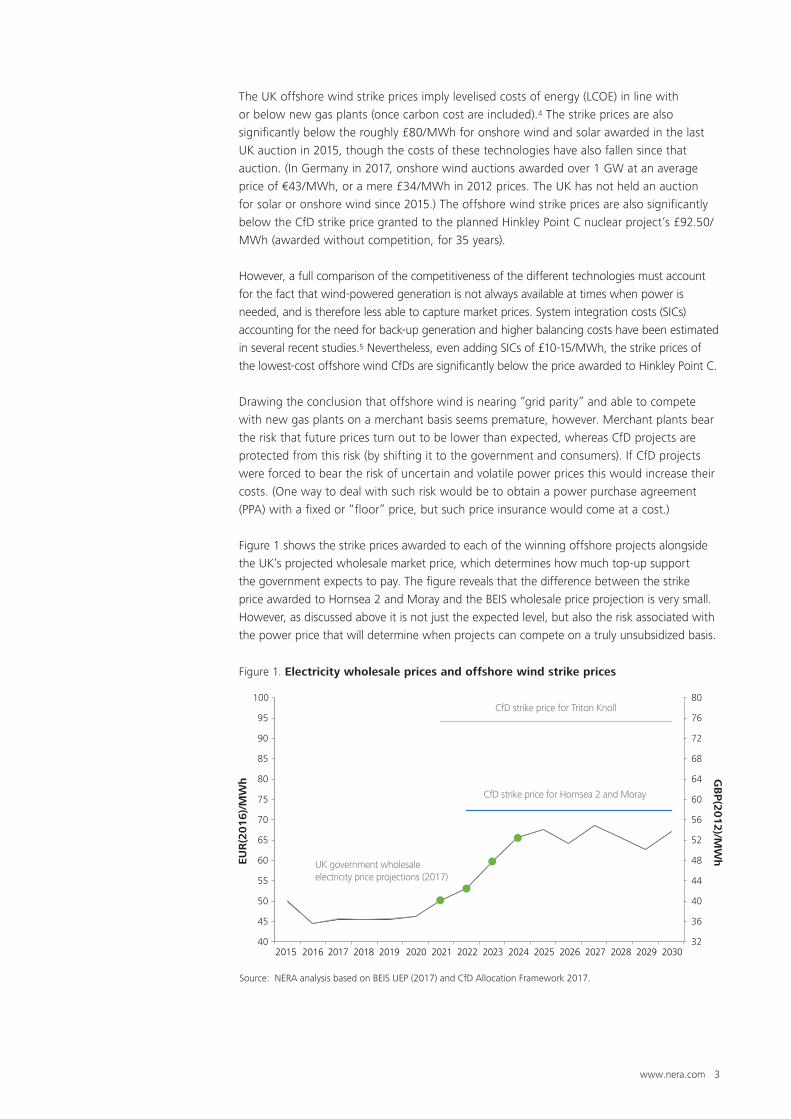
Figure 2 shows recent offshore wind auction prices in both euros and in pounds sterling. The
results are arranged in order of when the auctions were held. The figure shows the results
for the UK auctions (red bars) converted into 2016 euros for ease of comparison with the
euro-denominated auctions. The right-hand axis of the figure shows the equivalent values in
pounds (in real 2012 terms) to facilitate conversion of the euro-denominated results into the
terms used in the UK auctions.
Figure 2. Recent prices awarded in European offshore wind auctions
Source: NERA analysis.Notes: For illustration we have applied an exchange rate of 1.20 to convert GBP (2016) to EUR (2016). As discussedbelow, support regimes differ, so direct comparisons must be made with caution.
10
0
20
30
40
50
60
70
80
90
100
0
16
8
24
32
40
48
56
64
72
80
2016Borssele 1&2
(DONG)
NL
2016Vester Syd & Nord
(Vattenfall)
DK
2016Borssele3&4
(Shell Consortium)
NL
2017Gode Wind 3
(DONG)
DE
2017Hornsea 2
(DONG) & Moray (EPDR/ENGIE)
UK
2017Triton Knoll (innogy & Statkraft)
UK
2017HD (EnBW) & OWPW/BRW2
(DONG)DE
2017Kriegers Flak(Vattenfall)
DK
€ 63.8
€ 54.5€ 49.9
€ 59.2
€ 0.0
€ 94.0
€ 72.3€ 72.7
EUR
(2016)/
MW
hG
BP
(2012)/M
Wh
Comparing the strike prices in different regimes and using them to draw conclusions about
underlying project costs requires care for a number of reasons. First, different projects have
different characteristics—wind speeds, water depth, distance from shore—that influence cost
(and strike price required). Second, projects commissioning in later years are able to benefit
from continued technological progress and innovation. Third, there are differences between
subsidy regimes. For example, in the Netherlands, Denmark, and Germany, wind farms do not
pay the cost of transmission connection, so their bids do not reflect these costs. The Dutch and
Danish auctions are also for specific, pre-developed sites, so bidders do not need to cover any
development costs. Also in the Netherlands, Denmark, and Germany, the prices awarded are not
www.nera.com 5
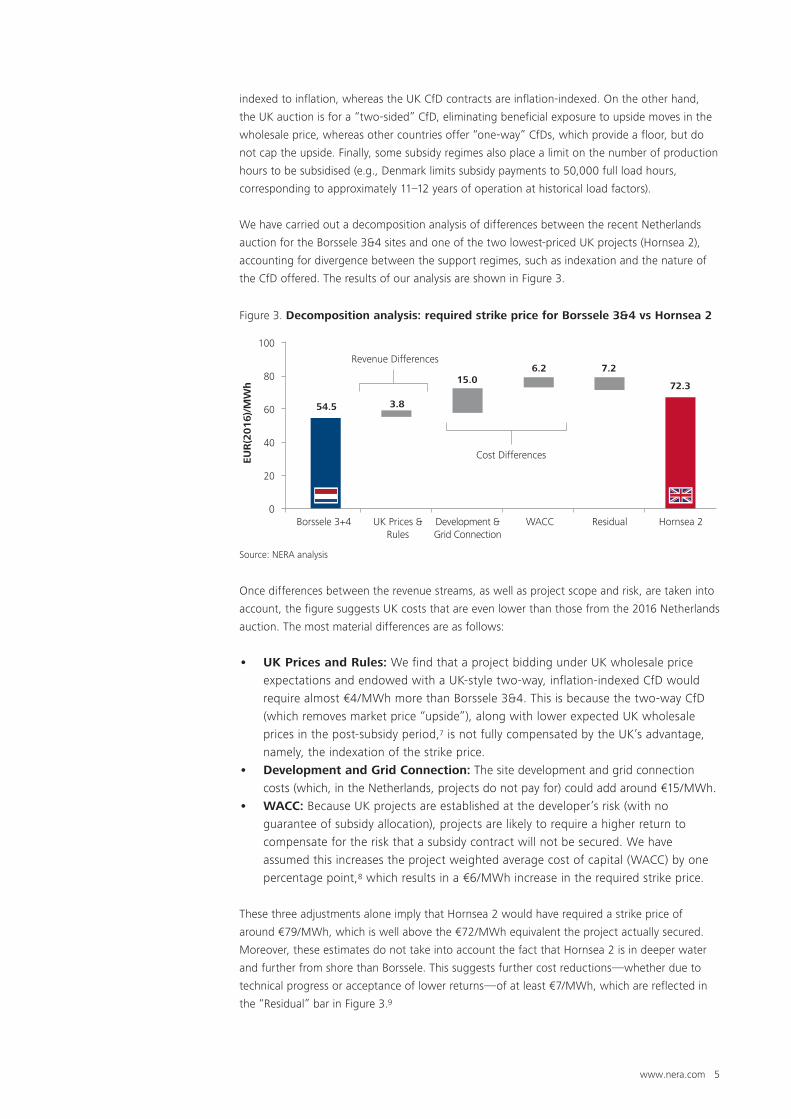
Figure 3. Decomposition analysis: required strike price for Borssele 3&4 vs Hornsea 2
Source: NERA analysis
indexed to inflation, whereas the UK CfD contracts are inflation-indexed. On the other hand,
the UK auction is for a “two-sided” CfD, eliminating beneficial exposure to upside moves in the
wholesale price, whereas other countries offer “one-way” CfDs, which provide a floor, but do
not cap the upside. Finally, some subsidy regimes also place a limit on the number of production
hours to be subsidised (e.g., Denmark limits subsidy payments to 50,000 full load hours,
corresponding to approximately 11–12 years of operation at historical load factors).
We have carried out a decomposition analysis of differences between the recent Netherlands
auction for the Borssele 3&4 sites and one of the two lowest-priced UK projects (Hornsea 2),
accounting for divergence between the support regimes, such as indexation and the nature of
the CfD offered. The results of our analysis are shown in Figure 3.
EUR
(2016)/
MW
h
0
20
40
60
80
100
Borssele 3+4 UK Prices & Rules
Development &Grid Connection
WACC Residual Hornsea 2
Revenue Differences
Cost Differences
3.854.5
15.06.2 7.2
72.3
Once differences between the revenue streams, as well as project scope and risk, are taken into
account, the figure suggests UK costs that are even lower than those from the 2016 Netherlands
auction. The most material differences are as follows:
• UK Prices and Rules: We find that a project bidding under UK wholesale price
expectations and endowed with a UK-style two-way, inflation-indexed CfD would
require almost €4/MWh more than Borssele 3&4. This is because the two-way CfD
(which removes market price “upside”), along with lower expected UK wholesale
prices in the post-subsidy period,7 is not fully compensated by the UK’s advantage,
namely, the indexation of the strike price.
• Development and Grid Connection: The site development and grid connection
costs (which, in the Netherlands, projects do not pay for) could add around €15/MWh.
• WACC: Because UK projects are established at the developer’s risk (with no
guarantee of subsidy allocation), projects are likely to require a higher return to
compensate for the risk that a subsidy contract will not be secured. We have
assumed this increases the project weighted average cost of capital (WACC) by one
percentage point,8 which results in a €6/MWh increase in the required strike price.
These three adjustments alone imply that Hornsea 2 would have required a strike price of
around €79/MWh, which is well above the €72/MWh equivalent the project actually secured.
Moreover, these estimates do not take into account the fact that Hornsea 2 is in deeper water
and further from shore than Borssele. This suggests further cost reductions—whether due to
technical progress or acceptance of lower returns—of at least €7/MWh, which are reflected in
the “Residual” bar in Figure 3.9
www.nera.com 6
Comparing the UK results to the April 2017 German “non-subsidy” bids requires similar analysis.
The viability of the German bids depends critically on assumptions about future power prices
and the extent to which these can be captured by the project, taking account of the revenue
“cannibalisation” that occurs when wind farms all generate at once and depress the wholesale
power price. It is also necessary to consider the significantly higher financing costs associated
with the increased exposure to merchant price risk (e.g., NERA (2013) suggested this could add
as much as 300 bps to the WACC).10
Exposure to merchant price risk will also affect capital structure, gearing levels, tenor, and other
lending conditions. Lenders are likely to require a PPA with some price protection and may still
reduce the debt shares they will accept. Equity providers will seek a premium on their return
requirements to reflect greater risk. DONG Energy’s press release following the publication of
the German results confirmed they had increased their hurdle rate to account for the greater risk
associated with full exposure to the market price,11 and market analysts are already discussing
implications for project financing structures. In theory, PPAs can be used to manage merchant
risk, but if someone is bearing the risk, they will ultimately need to be compensated. This will
increase project costs and reduce returns.
In both Germany and the UK, the question of non-delivery also looms large. The penalties for
not delivering projects are fairly low in both countries. In the UK, the project company would
simply be excluded from the next CfD auction round. In Germany, it would forfeit some portion
of a bid bond. With a low cost for non-delivery, the auction structures clearly incentivise very
competitive bidding. In the 1990s, the UK Non-Fossil Fuel Obligation (NFFO) scheme also
achieved very low per-MWh prices for renewable energy, but delivery levels for projects in the
final round were very low.12 Hopefully history will not repeat itself.
Smart bids, blind luck, and “winner’s curse”
The results of the UK auctions show there can be clear benefits to careful planning of bid
strategy based on competitor analysis and simulation modelling.13 By simulating the likely bids of
rival offshore wind projects and other bidders (in particular bioenergy projects), offshore wind
bidders can estimate the likelihood of winning, as well as the likelihood of benefitting when
more expensive projects set the price.
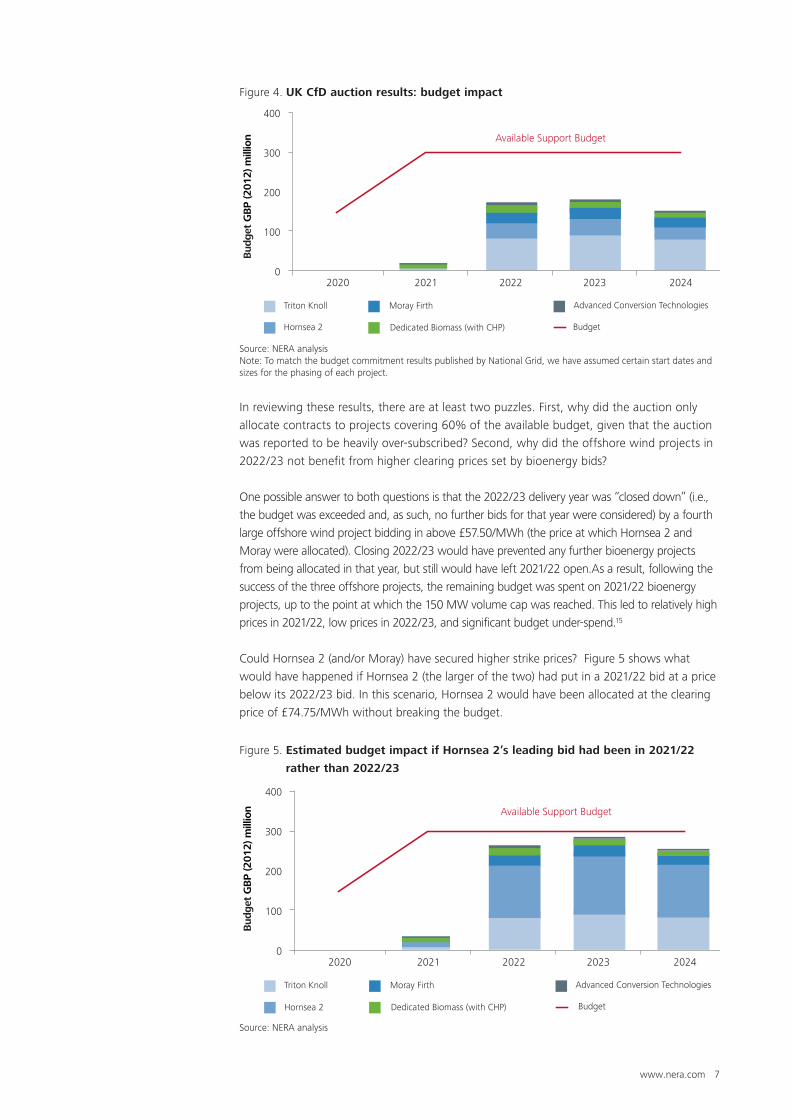
Figure 4 below shows the budget impact from successful projects in the 2017 auction. Due to
the 30% higher strike price it received by virtue of winning in 2021/22, Triton Knoll has a far
greater call on the support budget than Hornsea 2 or Moray, both of which won contracts to
deliver in 2022/23. Under UK auction rules, all projects had the option of submitting up to four
bids, varying their strike price, year of delivery, and capacity. The auction rules stipulate that bids
are ranked in order, from lowest to highest price, regardless of delivery year. Figure 4 also shows
there was a substantial amount of unused budget remaining.
Examination of the auction results makes it clear that Triton Knoll achieved a higher strike price
than the other offshore wind projects because the clearing price in 2021/22 was set by a higher-
cost bioenergy project. Although a single bioenergy project also secured a contract in the later
year alongside Moray and Hornsea 2, its bid was below those of the offshore projects, so it did
not set their price.14
www.nera.com 7
Figure 4. UK CfD auction results: budget impact
Source: NERA analysisNote: To match the budget commitment results published by National Grid, we have assumed certain start dates and sizes for the phasing of each project.
0
100
200
300
400
2020 2021 2022 2023 2024
Triton Knoll
Hornsea 2
Moray Firth Advanced Conversion Technologies
Available Support Budget
BudgetDedicated Biomass (with CHP)
Bud
get
GB
P (2
012) m
illio
n
In reviewing these results, there are at least two puzzles. First, why did the auction only
allocate contracts to projects covering 60% of the available budget, given that the auction
was reported to be heavily over-subscribed? Second, why did the offshore wind projects in
2022/23 not benefit from higher clearing prices set by bioenergy bids?
One possible answer to both questions is that the 2022/23 delivery year was “closed down” (i.e.,
the budget was exceeded and, as such, no further bids for that year were considered) by a fourth
large offshore wind project bidding in above £57.50/MWh (the price at which Hornsea 2 and
Moray were allocated). Closing 2022/23 would have prevented any further bioenergy projects
from being allocated in that year, but still would have left 2021/22 open.As a result, following the
success of the three offshore projects, the remaining budget was spent on 2021/22 bioenergy
projects, up to the point at which the 150 MW volume cap was reached. This led to relatively high
prices in 2021/22, low prices in 2022/23, and significant budget under-spend.15
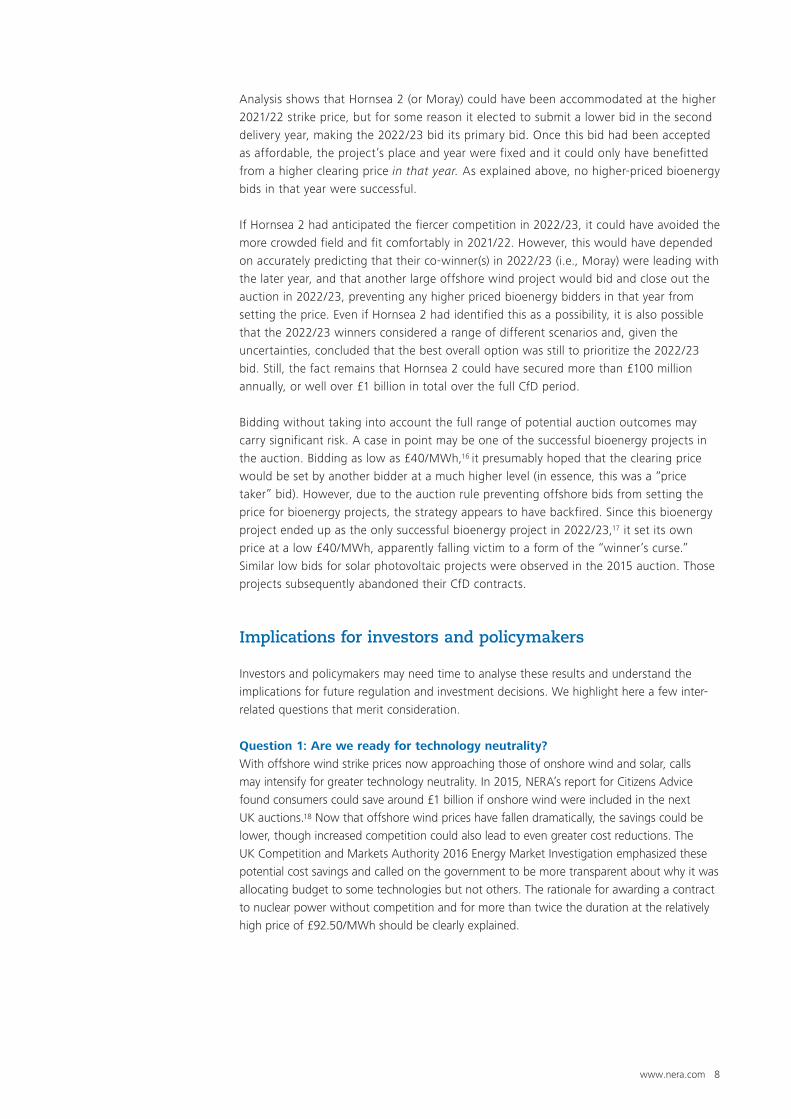
Could Hornsea 2 (and/or Moray) have secured higher strike prices? Figure 5 shows what
would have happened if Hornsea 2 (the larger of the two) had put in a 2021/22 bid at a price
below its 2022/23 bid. In this scenario, Hornsea 2 would have been allocated at the clearing
price of £74.75/MWh without breaking the budget.
Figure 5. Estimated budget impact if Hornsea 2’s leading bid had been in 2021/22
rather than 2022/23
Source: NERA analysis
0
100
200
300
400
2020 2021 2022 2023 2024
Bud
get
GB
P (2
012) m
illio
n
Triton Knoll
Hornsea 2
Moray Firth Advanced Conversion Technologies
BudgetDedicated Biomass (with CHP)
Available Support Budget
www.nera.com 8
Analysis shows that Hornsea 2 (or Moray) could have been accommodated at the higher
2021/22 strike price, but for some reason it elected to submit a lower bid in the second
delivery year, making the 2022/23 bid its primary bid. Once this bid had been accepted
as affordable, the project’s place and year were fixed and it could only have benefitted
from a higher clearing price in that year. As explained above, no higher-priced bioenergy
bids in that year were successful.
If Hornsea 2 had anticipated the fiercer competition in 2022/23, it could have avoided the
more crowded field and fit comfortably in 2021/22. However, this would have depended
on accurately predicting that their co-winner(s) in 2022/23 (i.e., Moray) were leading with
the later year, and that another large offshore wind project would bid and close out the
auction in 2022/23, preventing any higher priced bioenergy bidders in that year from
setting the price. Even if Hornsea 2 had identified this as a possibility, it is also possible
that the 2022/23 winners considered a range of different scenarios and, given the
uncertainties, concluded that the best overall option was still to prioritize the 2022/23
bid. Still, the fact remains that Hornsea 2 could have secured more than £100 million
annually, or well over £1 billion in total over the full CfD period.
Bidding without taking into account the full range of potential auction outcomes may
carry significant risk. A case in point may be one of the successful bioenergy projects in
the auction. Bidding as low as £40/MWh,16 it presumably hoped that the clearing price
would be set by another bidder at a much higher level (in essence, this was a “price
taker” bid). However, due to the auction rule preventing offshore bids from setting the
price for bioenergy projects, the strategy appears to have backfired. Since this bioenergy
project ended up as the only successful bioenergy project in 2022/23,17 it set its own
price at a low £40/MWh, apparently falling victim to a form of the “winner’s curse.”
Similar low bids for solar photovoltaic projects were observed in the 2015 auction. Those
projects subsequently abandoned their CfD contracts.
Implications for investors and policymakers
Investors and policymakers may need time to analyse these results and understand the
implications for future regulation and investment decisions. We highlight here a few inter-
related questions that merit consideration.
Question 1: Are we ready for technology neutrality?
With offshore wind strike prices now approaching those of onshore wind and solar, calls
may intensify for greater technology neutrality. In 2015, NERA’s report for Citizens Advice
found consumers could save around £1 billion if onshore wind were included in the next
UK auctions.18 Now that offshore wind prices have fallen dramatically, the savings could be
lower, though increased competition could also lead to even greater cost reductions. The
UK Competition and Markets Authority 2016 Energy Market Investigation emphasized these
potential cost savings and called on the government to be more transparent about why it was
allocating budget to some technologies but not others. The rationale for awarding a contract
to nuclear power without competition and for more than twice the duration at the relatively
high price of £92.50/MWh should be clearly explained.

www.nera.com 9
The CfD auctions could be reformed to be more technology-neutral, allowing greater
competition between technologies. The government should seriously consider the case
for allowing more technologies to compete against each other—or set out reasons for not
doing so, if it so chooses. They might even bid at strike prices below the long-term average
expected electricity price, giving the market and government a signal about the value
of revenue stabilization and possibly stimulating the further development of markets for
long-term PPAs. Others may advocate for a shift to a premium feed in tariff (FIT) system,
which would expose all generators to market price signals and would better account for
whole system costs, facilitating the development of projects with the highest net value to
consumers and society.
To move even further toward technology neutrality, the government could revert to
allowing carbon pricing to direct investments in generation technologies. At the start of
the Electricity Market Reform in 2010, a carbon price on its own (whether via emissions
trading or via a carbon tax) was not considered sufficiently bankable for long-term
infrastructure investments. However, there are ways in which the carbon price could, in
theory, be strengthened and made more bankable, including offering long-term carbon
price contracts. Upcoming reviews of the cost of energy for the UK government, and the
Clean Growth Plan, will need to address these issues.
Question 2: Should renewables pay for their integration costs (and if so, how)?
Integrating large amounts of variable renewable energy generators has significant cost
implications (e.g., costs for back-up capacity, balancing services, and network expansion
and reinforcement), which are largely socialised across electricity consumers. More
efficient integration of those renewable assets would mean exposing them to the SICs. In
many parts of the electricity system, this already happens (e.g., in the balancing market,
where recent reforms have sharpened the price faced by out-of-balance generators).
The falling cost of offshore wind will lead to calls from the industry to deploy greater
volumes. Unless projects are exposed to SICs, there will be a growing wedge between
what is good for projects and what is good for consumers and society as a whole.
In this context, it is important to understand the impact of greater penetration of variable
renewables on wholesale market dynamics and how this might affect the efficient
deployment of flexible generation (of all types) and storage (e.g., hydro, hydrogen,
batteries), as well as the role of demand response. Technological changes are increasing
the ability of wind and solar to respond to price signals. Clear market price signals will
help the deployment of storage and other forms of flexibility. Subsidy regimes that expose
generators to power prices (e.g., premium FITs, or simply changing the reference price
within the CfD) would provide greater incentives for renewables generators to respond to
market conditions and consumer demand.
Question 3: An end to subsidy… and an end to risk transfers?
Widespread deployment of offshore wind without subsidy in the UK would be a
revolutionary development. It would also loosen the control that government currently
has over the electricity technology mix. Exposure to merchant price risk, however,
weakens project economics by increasing projects’ cost of capital and potentially
affecting debt provision and conditions. Current financial and PPA markets are not set up
for such projects at scale, but would no doubt evolve to meet the challenge.
www.nera.com 10
As noted, the prospect of technology neutrality raises the question of whether—and
how—one can really compare the various low-carbon technologies. LCOE does not
take account of the full integration costs, nor does it reflect the difference between a
guaranteed, contracted revenue and exposure to market price risk. Being at “grid parity”
(i.e., with a cost at or below the expected wholesale price) or being cheaper than gas
CCGT in terms of LCOE is not the same as being competitive in the electricity market
without government contracts. If we really have entered an era of non-subsidy offshore
wind farms, there will need to be adjustments to wholesale and PPA markets, policy, and
among investors and financial markets.
Question 4: Is it time to sharpen delivery incentives?
In assessing the extent to which low auction bids represent a revolution in cost reduction
for offshore wind, we must also bear in mind that it will be a long time before these
projects are delivered. There were similar renewables auctions in the UK in the 1990s
(the NFFO auctions), which were very successful at producing low bids, but rather less
successful at producing actual projects. Due to bidders placing their bids at a very early
stage of project development, before planning permission had been secured, the vast
majority of projects in the later auction rounds fell victim to winner’s curse and only a small
proportion of the winning projects were actually built. In the German and Dutch auctions,
the authorities have required the posting of bid bonds, which will be forfeited in the event
of non-delivery of the project. In the UK, the non-delivery penalty is exclusion from further
auction participation for 24 months (although there are likely to be further incentives to
proceed once the first milestone is reached, 12 months after accepting the CfD). Time will
tell whether these sanctions are sufficient to deter over-aggressive bidding.
1 Winners in the auction (those who bid the lowest strike prices) receive a 15-year subsidy contract known as a “contract for difference”, or CfD. The “less established technologies” classification or “pot” contains offshore wind, advanced (waste) conversion technologies (ACT), biomass with CHP, wave and tidal, and other technologies. Projects with planning permission and grid connection agreement offers from all of these technologies compete against each other, bidding down the strike prices (subsidy) required in one of a number of future delivery years (for this auction, the delivery years were 2021/22 and 2022/23). The government sets the maximum budget for the auctions and other parameters, such as maximum strike prices for each technology.
2 See reports by ORE Offshore Wind Catapult: “Transmission Costs for Offshore Wind: Final Report,” Offshore Wind Programme Board, April 2016, https://ore.catapult.org.uk/wp-content/uploads/2016/05/Transmission-Costs-for-Offshore-Wind.pdf.
3 “The wind has changed,” Offshore Wind Industry 2017, http://www.offshorewindindustry.com/sites/default/files/owi_03_2017_the_wind_has_changed.pdf.
4 LCOE is based on new combined cycle gas turbine (CCGT) costs of £66-90/MWh reported in the UK government’s recent cost of electricity generation study: “BEIS electricity generation cost report,” Department for Business, Energy & Industrial Strategy, 9 November 2016, https://www.gov.uk/government/publications/beis-electricity-generation-costs-november-2016. Our financial modelling suggests an offshore wind strike price of £57.50/MWh is consistent with an LCOE of less than £50/MWh.
5 See Daniel Radov and Alon Carmel, “UK Renewable Subsidies and Whole System Costs: The Case for Allowing Biomass Conversion to Compete for a CfD,” 16 February 2016, http://www.nera.com/publications/archive/2016/NERA_Imperial_Feb_2016_Renewable_Subsidies_and_Whole_System_Costs_FINAL_160215.html; and Philip Heptonstall, Robert Gross, and Florian Steiner,“The costs and impacts of intermittency—2016 update,” UK Energy Research Centre, February 2017, http://www.ukerc.ac.uk/programmes/technology-and-policy-assessment/the-costs-and-impacts-of-intermittency-ii.html, or Clara F. Heuberger, Iain Staffell, Nilay Shah, et al., “A systems approach to quantifying the value of power generation and energy storage technologies in future electricity networks,” Computers & Chemical Engineering, 18 May 2017, http://www.sciencedirect.com/science/article/pii/S0098135417302119?via per cent3Dihub.
6 See Dominik Huebler, Daniel Radov, and Lorenz Wieshammer, “Method or Madness: Insights from Germany’s Record-Breaking Offshore Wind Auction and Its Implications for Future Auctions,” NERA, May 2017, http://www.nera.com/content/dam/nera/publications/2017/PUB_Offshore_EMI_A4_0417.pdf.
7 Because the wholesale price projections for the two markets come from different sources, they are not necessarily based on identical underlying assumptions.
8 This information is based on analysis set out in Richard Hern, Daniel Radov, Alon Carmel, et al., “Electricity Generation Costs and Hurdle Rates,” Department of Energy and Climate Change, 9 November 2015.
9 It is possible that grid connection costs for Hornsea 2 will actually be lower than typically estimated for offshore wind farms, given that it lies next to the Hornsea 1 offshore wind farm, which is currently under construction, allowing Hornsea 2 to benefit from economies of scale.
10 Richard Hern, Daniel Radov, Mauricio Bermudez-Neubauer, et al., “Changes in Hurdle Rates for Low Carbon Generation Technologies due to the Shift from the UK Renewables Obligation to a Contracts for Difference Regime,” Department of Energy and Climate Change, 9 December 2013, https://www.gov.uk/government/uploads/system/uploads/attachment_data/file/267606/NERA_Report_Assessment_of_Change_in_Hurdle_Rates_-_FINAL.pdf.
11 “DONG Energy awarded three German offshore wind projects,” DONG Energy, 14 April 2017, http://www.dongenergy.com/en/investors/company-announcements/company-announcement-detail?omxid=1557851.
12 Michael G. Pollitt, “UK Renewable Energy Policy since Privatisation,” EPRG Working Paper, University of Cambridge, January 2010.
13 For a discussion of simulation modelling as an important planning tool for bid strategy, see Daniel Radov, Alon Carmel, and Clemens Koenig, “Gale Force Competition? Auctions and Bidding Strategy for Offshore Wind,” NERA, 2016, http://www.nera.com/content/dam/nera/publications/2016/PUB_Offshore_Wind_A4_0916.pdf.
14 The auctioneer (National Grid) follows rules set by the government in calculating the auction clearing price and budget impacts. National Grid uses government-mandated assumptions about load factors and electricity wholesale prices to calculate the amount of subsidy implied under each CfD contract, and compare that to the total budget released (£295M per year for this auction, in 2012 prices). It is worth remembering that the actual budget impact, and impact on consumer bills, will depend on actual wholesale prices and load factors. In addition to the budget constraint, the government also imposed a cap (150 MW) on the amount of bioenergy capacity that could be awarded a CfD. To prevent capped bioenergy projects from securing high prices set by other technologies, bioenergy prices are allowed to set the price for other technologies, but not the reverse—as we discuss later in this paper. The bioenergy cap appears to have been binding in the auction, as nearly 150 MW of bioenergy projects were successful and significant amounts of budget remained unused.
15 This is not the only explanation for the auction outcome. Another possibility is that a bioenergy bid for 2022/23 in the low-to-mid £70/MWh range led to a budget breach that closed the 2022/23 commissioning year to further bidding, leaving 2021/22 free to accommodate more projects. This is consistent with the observed auction outcome as long as one is willing to assume that (i) there were no bioenergy bids for 2022/23 between £40/MWh and the budget-breaking bid and (ii) there was at least one bioenergy bid for 2021/22 slightly below the budget-breaking bid that caused the strike price for 2021/22 to be sufficiently high (thus setting up the broken budget constraint in 2022/23).
16 This project must have bid £40/MWh in 2022/23, as there are no other successful bioenergy projects, and bioenergy cannot benefit from the clearing price set by offshore wind.
17 As discussed above, it is likely that among the bidders for 2022/23 there was another large offshore project that could not be accommodated within the budget. Delivery year 2022/23 was therefore closed, preventing any other bioenergy projects from being awarded and setting the price for the project having bid £40/MWh.
18 See Daniel Radov, Alon Carmel, et al., “Modelling the GB Renewable Electricity CfD Auctions” NERA, October 2015. The cost savings for consumers of merging Pot 1 and Pot 2 into a single auction including onshore wind was estimated as £1bn (undiscounted over the lifetime of the CfD contracts), equivalent to £650m in net present value (NPV) terms.
Notes
About NERA
NERA Economic Consulting (www.nera.com) is a global firm of experts dedicated to
applying economic, finance, and quantitative principles to complex business and legal
challenges. For over half a century, NERA’s economists have been creating strategies,
studies, reports, expert testimony, and policy recommendations for government authorities
and the world’s leading law firms and corporations. We bring academic rigor, objectivity,
and real world industry experience to bear on issues arising from competition, regulation,
public policy, strategy, finance, and litigation.
NERA’s clients value our ability to apply and communicate state-of-the-art approaches
clearly and convincingly, our commitment to deliver unbiased findings, and our reputation
for quality and independence. Our clients rely on the integrity and skills of our unparalleled
team of economists and other experts backed by the resources and reliability of one of the
world’s largest economic consultancies. With its main office in New York City, NERA serves
clients from more than 25 offices across North America, Europe, and Asia Pacific.
Contacts For further information and questions, please contact the authors:
Daniel Radov
Director
+44 20 7659 8744
Alon Carmel
Senior Consultant
+44 20 7659 8628
Clemens Koenig
Economic Analyst
+44 20 7659 8876
The opinions expressed herein do not necessarily represent the views of NERA Economic Consulting or any other
NERA consultant. Please do not cite without explicit permission from the author.