Offshore Gas Gathering Network and Pipeline Analysis Using ...utpedia.utp.edu.my/10558/1/2011 -...
42
Offshore Gas Gathering Network and Pipeline Analysis Using PIPESIM By Mohd Farriz ljaz bin Noordin This dissertation is submitted in fulfillment of the requirements for the Bachelor of Engineering (Hons.) Universiti Teknologi PETRONAS Bandar Seri Iskandar 31750Tronoh Perak Darul Ridzuan. (Petroleum Engineering) April20ll 0
Transcript of Offshore Gas Gathering Network and Pipeline Analysis Using ...utpedia.utp.edu.my/10558/1/2011 -...

Offshore Gas Gathering Network and Pipeline Analysis Using PIPESIM
By
Mohd Farriz ljaz bin Noordin
This dissertation is submitted in fulfillment of
the requirements for the
Bachelor of Engineering (Hons.)
Universiti Teknologi PETRONAS
Bandar Seri Iskandar
31750Tronoh
Perak Darul Ridzuan.
(Petroleum Engineering)
April20ll
0

CERTIFICATION OF APPROVAL
Offshore Gas Gathering Network and Pipeline Analysis Using PIPESIM
By
Mohd Farriz Ijaz bin Noordin
A dissertation submitted to the
Petroleum Engineering Department
Universiti Teknologi PETRONAS
In fulfillment of the requirement for the
Bachelor of Engineering (Hon.)
(Petroleum Engineering)
s ----fF"~>..._L_::._~ (AP Kya~ng Kyaw
,_
~~R=-----Universiti TekndJ2l;'JihlfrloMJil~T~ronoll Bandar Seri Iskai't!IM Darul Rlcltuan, • •
31750Tronoh Perak Darul Ridzuan.
April2011
1

CERTIFICATION OF ORIGINALITY
This is to certify that I am responsible for the work submitted in this project, that the original
work is my own except as specified in the references and acknowledgements, and that the
original work contained herein have not been undertaken or done by unspecified sources or
persons.
2

Abstract
This project is about modeling and analyzing gas gathering network and pipeline to
obtain an optimize gas production from wells to the gas processing plant and to the pipeline.
The oil and gas company are looking for betterment in the gas gathering network in order to
achieve the best gas gathering design and to increase the production optimization. This
project will evaluate two different case studies which have different design criteria and
reservoir properties. Both case studies have specific objective to obtain at the end of the
project. For the first case study the main objective is to evaluate a looped gas gathering
network from three different wells data. In this case study, the last result will be the
deliverability of gas gathering network. In the second case study, the main objective is to
model a pipeline to transport condensate form a satellite platform to a processing platform.
The end result to be obtained in the second case study is to evaluate and select the pipeline
size and to evaluate the pipeline insulation requirement. Basically this project is utilizing the
PIPES 1M software as a medium to analyze both cases. Most of the modeling and graphs are
made from this software. Comparisons between the results are made between software and
theory. From this project I had increase my ability of analyzing and understanding the basic
principal of surface facilities and pipeline system. At the end of the project, there will be
discussion made to both cases in order to increase the deliverability of the gathering network
and pipeline systems.
3

ACKNOWLEDGEMENT
By completing this project, I manage to learn so many things regarding surface
facilities in offshore processing platform and pipeline facilities. I know that at the beginning
of this project I didn't have a clear idea of how all the processors and wells are connected to
each other. By doing this project I enhance my understanding from basic to a better level of
knowledge.
Thank you for all the supports that been given to me through completing this project. I
would like to take this advantage to thank my supervisor, AP Aung Kyaw for sharing
knowledge and guide me through this project. I would like to thank to all the lecturers who
are directly or indirectly involves in this project. Thank you for all the knowledge and
guidance. Last but not lease, I would like to thank to all my friends for the continuous
supports from the beginning of this project.
4
Table of Content
Content
Abstract
Acknowledgment
Table of Content
List of Figures
Chapter 1: Introduction
1.1 Background
1.2 Problem Statement
1.2.1 Case Study 1
1.2.2 Case Study 2
1.3 Objective
1.4 Scope of Study
Chapter 2: Literature Review
2.1 Background of Gas Gathering System
18
2.2 Network Boundary Condition
2.3 Network Tolerance
Chapter 3: Project Methodology
3.1 Case Study 1 Methodology
3.2 Case Study 2 Methodology
Chapter 4: Result and Discussion
4.1 Result and Discussion
Chapter 5: Conclusion and Recommendation
5.1 Conclusion
5
1
2
3-4
5
6
7
7
7
8
8
9-
18
19
22-23
24-26
27-33
34

5.2 Recommendation
References
Appendices
6
34
35
36-41

LIST OF FIGURES
Figure 1: Layout ofNetwork System ................................................................ .16
Figure 2: Pressure Profile ............................................................................... 17
Figure 3: Pipeline Modeling Layout of Condensate ................................................ 18
Figure 4: Hydrocarbon Phase Envelope .............................................................. .18
Figure 5: Phase Envelope ofHydrates ................................................................ l9
Figure 6: Pressure versus Total Distance .............................................................. 20
Figure 7: Temperature versus Total Distance ........................................................ 20
Figure 8: 1" Insulation ................................................................................... 21
Figure 9: 0.75" Insulation ................................................................................ 22
7
CHAPTER 1: INTRODUCTION
1.1 Background
The main key aims of a conceptual gas gathering network design is to confirm the project
is feasible and to direct the later design stages towards an optimal design. In order to
achieve this, numerous options must be analyze in different manners to select the
potential of the software technology and to screen out unworkable solution. It is important
to take a multidisciplinary approach to a conceptual design of gathering network such as
disciplines in drilling, well completion, flow assurance, process equipments and pipeline
design in order to accelerate the system design generally. In this project, I have decided to
use PIPESIM software to design and evaluate two different case study in order to achieve
an optimize gas gathering network design.
The case studies in this project consist of two different situations. For the ftrst case study
I plan to do a network analysis on a looped gas gathering network and ftnd the
deliverability of the system. On the other hand, the second case study is to model a
condensate pipeline structure and determine the pipeline size, pipeline insulation
requirement and to screen pipeline for severe riser slugging.
PIPESIM is a Steady State Multiphase Flow Simulation software develops by
Schlumberger for design and diagnostic analysis of oil and gas production. PIPESIM
simulation consists of six modules which are Pipeline & Facilities, Well Performance
Analysis, Network Analysis, Production Optimization (GOAL), Field Plarming (FPT) and
Multilateral (HoSim).
Each module can construct and analyze different area of production operation. It starts
from the reservoir up to the well head and continue with the surface facilities and lastly to
the main pipeline to transport the gas to consumer. PIPESIM allow users to enter real data
and simulate the behavior of the flow system and the deliverability of gas from reservoir
to consumer. This gives advantages to the users/engineers to critically design the best gas
gathering network system in order to achieve the best design.
8

1.2 Problem Statement
Currently, oil and gas company are trying to achieve for more effective conceptual design
by looking at more tie-backs, various gas properties, the minimal power supply for
processing equipments and looking at more technical details. This is the main challenges
the stage of conceptual design where the rate of changes are very high. With these issues,
conceptual design software, PIPESIM was developed to provide value to gas gathering
network development.
In this project, a gathering network will be simulate using PIPESIM and the main
evaluation is to improve the efficiency of the gas gathering network such as the
deliverability of gas and the optimization of pipeline and surface facilities. This project is
mainly to develop and analyze two different case studies and how to optimize the
production of these two case studies. The elaboration of each the case studies are as
below:
Case Study 1
In case study 1, the main objective is to determine the deliverability of a production
network of a looped gas gathering network. The network connects three producing gas
wells in a looped gathering system and delivers commingled product to a single delivery
point. The three well have different gas composition, gas from well I and well 2 have
same gas composition and well 3 have different composition. In this case study, I will
develop a network of three gas wells to a processing plant. There are several main steps in
this case study in order to achieve the end results. The main steps are as below:
a) Build a model of the network.
b) Specify the network boundary conditions.
c) Solve the network and establish the deliverability
CaseStudy2
In the second case study, a subsea pipeline is to be designed to transport condensate from
a satellite platform to a processing platform. Compositional analysis of the condensate
has been obtained (refer to appendices). In order to achieve the end results and to
9
detennine the pipeline size and the pipeline insulation requirement, the following tasks
need to perfonn:-
a) Develop a compositional model of the hydrocarbon phases.
b) Add the aqueous phase to the compositional model and identify the hydrate
envelope. Hydrates are to be avoided by operating the pipeline above the hydrate
fonnation temperature.
c) Select a pipeline size.
d) Detennine the pipeline insulation requirement.
e) Screen the pipeline for severe riser slugging. Severe riser slugging is to be avoided.
f) Size a slug catcher.
1.3 Objective
The main objective of this project is to know the best method of using PIPESIM in order to
design a gas gathering network. The objectives are as below:-
a) To build a gas gathering network base on the case study.
b) To specify the boundary conditions of reservoir and facilities.
c) To solve the network and establish the deliverability.
d) To select appropriate gas gathering and pipeline design.
1.4 Scope of Study
This project have various scope of study within the knowledge of Petroleum Engineering and
Production Engineering, the main scope involved in this project are :
a) PIPESIM simulation, how to use the software.
b) The gas properties
c) Pipeline design principles
d) Gas gathering design principles
10

CHAPTER 2: LITERATURE REVIEW
2.1 The background of gas gathering system
Gas Gathering lines are small-diameter pipelines move natural gas from the
wellhead to the natural gas processing plant or to an interconnection with a larger
mainline pipeline. Transporting natural gas from the wellhead to the final customer
involves several physical transfers of custody and multiple processing steps. A natural
gas pipeline system begins at the natural gas producing well or field. Once the gas
leaves the producing well, a gas gathering system directs the flow either to a natural
gas processing plant or directly to the mainline transmission grid, depending upon the
initial quality of the wellhead product.
The processing plant produces pipeline-quality natural gas. This gas is then
transported by pipeline to consumers or is put into underground storage for future use.
Storage helps to maintain pipeline system operational integrity and/or to meet customer
requirements during peak-usage periods.
Transporting natural gas from wellhead to market involves a series of processes and
an array of physical facilities. Among these are:
• Gas Processing Plant- This operation extracts natural gas liquids and
impurities from the natural gas stream.
• Mainline Transmission Systems- These wide-diameter, long-distance
pipelines transport natural gas from the producing area to market areas.
• Market Hubs/Centers - Locations where pipelines intersect and flows are
transferred.
• Underground Storage Facilities- Natural gas is stored in depleted oil and gas
reservoirs, aquifers, and salt caverns for future use.
• Peak Shaving - System design methodology permitting a natural gas pipeline
to meet short-term surges in customer demands with minimal infrastructure.
Peaks can be handled by using gas from storage or by short-term line-packing.
11

The Natural Gas Gathering System
A natural gas pipeline system begins at a natural gas producing well or field. In the
producing area many of the pipeline systems are primarily involved in "gas gathering"
operations. That is, a pipeline is connected to a producing well, converging with pipes
from other wells where the natural gas stream may be subjected to an extraction
process to remove water and other impurities if needed. Natural gas exiting the
production field is usually referred to as "wet" natural gas if it still contain significant
amounts of hydrocarbon liquids and contaminants.
Under certain conditions some or all of the natural gas produced at a well may be
returned to the reservoir in cycling, repressuring, or conservation operations and/or
vented and flared. At this stage it is a mixture of methane and other hydrocarbons, as
well as some non-hydrocarbons, existing in the gaseous phase or in a solution with
crude oil. The principal hydrocarbons normally contained in the natural gas mixture are
methane, ethane, propane, butane, and pentane. Typical non-hydrocarbon gases that
may be present in reservoir natural gas are water vapor, carbon dioxide, helium,
hydrogen sulfide, and nitrogen.
In proximity to the well are facilities that produce what is referred to as "lease
condensate", that is, a mixture consisting primarily of pentanes and heavier
hydrocarbons which is recovered as a liquid from natural gas. Other natural gas liquids,
such as butane and propane, are recovered at downstream natural gas processing plants
or facilities
Once it leaves the producing area, a pipeline system directs flow either to a natural
gas processing plant or directly to the mainline transmission grid. Non-associated
natural gas, that is, natural gas that is not in contact with significant quantities of crude
oil in the reservoir, is sometimes of pipeline quality after undergoing a
decontamination process in the production area, and does not need to flow through a
processing plant prior to entering the mainline transmission system.
12

The Natural Gas Processing Plant
The principal service provided by a natural gas processing plant to the natural gas
mainline transmission network is that it produces pipeline quality natural gas. Natural
gas mainline transmission systems are designed to operate within certain tolerances.
Natural gas entering the system that is not within certain specific gravities, pressures,
Btu content range, or water content level will cause operational problems, pipeline
deterioration, or even cause pipeline rupture.
Natural gas processing plants are also facilities designed to recover natural gas
liquids from a stream of natural gas that may or may not have passed through lease
separators and/or field separation facilities. These facilities also control the quality of
the natural gas to be marketed. Several types of natural gas processing plants,
employing various techniques and technologies to extract contaminants and natural gas
liquids, are used to produce pipeline quality "dry" gas. At many processing plants the
primary objective is the production of dry gas ( demethanizing). Any remaining natural
gas liquids extraction stream is directed to a separate plant to undergo what is referred
to as a "gas fractionation" process.
But a number of natural gas processing plants do include these gas
fractionation plants where saturated hydrocarbons are removed from natural gas and
separated into distinct parts, or "fractions," such as propane, butane, and ethane.
Essentially, natural gas is methane, a colorless, odorless, flammable hydrocarbon gas
(CHi). Also present in natural gas production, especially that in association with oil
production, are a number of petroleum gases. They include (in addition to ethane,
propane and butane) ethylene, propylene, butylene, isobutane, and isobutylene. They
are derived from crude oil refining or natural gas fractionation and are liquefied
through pressurization.
The Transmission Grid and Compressor Stations
The natural gas mainline (transmission line) is a wide-diameter, often-times long
distance, portion of a natural gas pipeline system, excluding laterals, located between
the gathering system (production area), natural gas processing plant, other receipt
points, and the principal customer service area(s). The lateral, usually of smaller
13

diameter, branches off the mainline natural gas pipeline to connect with or serve a
specific customer or group of customers.
A natural gas mainline system will tend to be designed as either a grid or a
trunkline system. The latter is usually a long-distance, wide-diameter pipeline system
that generally links a major supply source with a market area or with a large
pipeline/LDC serving a market area. Trunklines tend to have fewer receipt points
(usually at the beginning of its route), fewer delivery points, interconnections with
other pipelines, and associated lateral lines.
A grid type transmission system is usually characterized by a large number of
laterals or branches from the mainline, which tend to form a network of integrated
receipt, delivery and pipeline interconnections that operate in, and serve major market
areas. In form, they are similar to a local distribution company (LDC) network
configuration, but on a much larger scale.
Between the producing area, or supply source, and the market area, a number of
compressor stations are located along the transmission system. These stations contain
one or more compressor units whose purpose is to receive the transmission flow (which
has decreased in pressure since the previous compressor station) at an intake point,
increase the pressure and rate of flow, and thus, maintain the movement of natural gas
along the pipeline.
Gas compressors are used on a natural gas mainline transmission system are
usually rated at 1,000 horsepower or more and are of the centrifugal (turbine) or
reciprocating (piston) type. The larger gas compression stations may have as many as
10-16 units with an overall horsepower rating of from 50,000 to 80,000 HP and a
throughput capacity exceeding three billion cubic feet of natural gas per day. Most
compressor units operate on natural gas (extracted from the pipeline flow); but in
recent years, and mainly for enviromnental reasons, the use of electricity driven
compressor units has been growing.
Many of the larger mainline transmission routes are what is generally referred to
as "looped." Looping is when one pipeline is laid parallel to another and is often used
as a way to increase capacity along a right-of-way beyond what is possible on one line,
14

or an expansion of an existing pipeline(s). These lines are connected to move a larger
flow along a single segment of the pipeline system. Some very large pipeline systems
have 5 or 6 large diameter pipes laid along the same right-of-way. Looped pipes may
extend the distance between compressor stations, where they can transfer part of their
flow, or the looping may be limited to only a portion of the line between stations. In the
latter case, the looping often serves as essentially a storage device, where natural gas
can be line-packed as a way to increase deliveries to local customers during certain
peak periods.
To address the potential for pipeline rupture, safety cutoff meters are installed
along a mainline transmission system route. Devices located at strategic points are
designed to detect a drop in pressure that would result from a downstream or upstream
pipeline rupture and automatically stop the flow of natural gas beyond its location.
Monitoring the pipeline as a whole are apparatus known as SCADA which
means Supervisory Control and Data Acquisition. SCADA systems provide
monitoring staff the ability to direct and control pipeline flows, maintaining pipeline
integrity and pressures as natural gas is received and delivered along numerous points
on the system, including flows into and out of storage facilities.
Natural Gas Market Centers/Hubs
Natural gas market centers and hubs evolved, beginning in the late 1980s, as an
outgrowth of natural gas market restructuring and the execution of a number of
Federal Energy Regulatory Commission's (PERC) Orders culminating in Order 636
issued in 1992. Order 636 mandated that interstate natural gas pipeline companies
transform themselves from buyers and sellers of natural gas to strictly natural gas
transporters. Market centers and hubs were developed to provide new natural gas
shippers with many of the physical capabilities and administrative support services
formally handled by the interstate pipeline company as "bundled" sales services.
Two key services offered by market centers/hubs are transportation between and
interconnections with other pipelines and the physical coverage of short-term
receipt/delivery balancing needs. Many of these centers also provide unique services
that help expedite and improve the natural gas transportation process overall, such as
Internet-based access to natural gas trading platforms and capacity release programs.
15

Most also provide title transfer services between parties that buy, sell, or move their
natural gas through the center.
As of the end of 2008, there were a total of 33 operational market centers in the United
States (24) and Canada (9).
Underground Storage Facilities
At the end of the mainline transmission system, and sometimes at its beginning
and in between, underground natural gas storage and LNG (liquefied natural gas)
facilities provide for inventory management, supply backup, and the access to natural
gas to maintain the balance of the system. There are three principal types
ofunderground storage sites used in the United States today: depleted reservoirs in oil
and/or gas fields, aquifers, and salt cavern formations. In one or two cases mine
caverns have been used. Two of the most important characteristics of an underground
storage reservoir are the capability to hold natural gas for future use, and the rate at
which natural gas inventory can be injected and withdrawn (its deliverability rate).
Most underground storage facilities, 327 out of 399 at the beginning of 2008, are
depleted reservoirs, which are close to consumption centers and which were relatively
easy to convert to storage service. In some areas, however, most notably the
Midwestern United States, some natural aquifers have been converted to natural gas
storage reservoirs. An aquifer is suitable for natural gas storage if the water-bearing
sedimentary rock formation is overlaid with an impermeable cap rock. While the
geology of aquifers is similar to that of depleted production fields, their use in natural
gas storage usually requires more base (cushion) gas and greater monitoring of
withdrawal and injection performance. Deliverability rates may be enhanced by the
presence of an active water drive.
During the past 20 years, the number of salt cavern storage sites has grown
significantly because of its rapid cycling (inventory turnover) capability coupled with
its ability to respond to daily, even hourly, variations in customer needs. The large
majority of salt cavern storage facilities have been developed in salt dome formations
located in the Gulf Coast States. Salt caverns leached from bedded salt formations in
Northeastern, Midwestern, and Western States have also been developed but the
16

number has been limited due to a lack of suitable geology. Cavern construction is more
costly than depleted field conversions when measured on the basis of dollars per
thousand cubic feet of working gas capacity, but the ability to perform several
withdrawal and injection cycles each year reduces the per-unit cost of each thousand
cubic feet of natural gas injected and withdrawn.
Peak Shaving
Underground natural gas storage inventories provide suppliers with the means to
meet peak customer requirements up to a point. Beyond that point the distribution
system still must be capable of meeting customer short-term peaking and volatile swing
demands that occur on a daily and even hourly basis. During periods of extreme usage,
peaking facilities, as well as other sources of temporary storage, are relied upon to
supplement system and underground storage supplies.
Peaking needs are met in several ways. Some underground storage sites are
designed to provide peaking service, but most often LNG (liquefied natural gas) in
storage and liquefied petroleum gas such as propane are vaporized and injected into the
natural gas distribution system supply to meet instant requirements. Short-term
linepacking is also used to meet anticipated surge requirements.
The use of peaking facilities, as well as underground storage, is essentially a risk
management calculation, known as peak-shaving. The cost of installing these facilities
is such that the incremental cost per unit is expensive. However, the cost of a service
interruption, as well as the cost to an industrial customer in lost production, may be
much higher. In the case of underground storage, a suitable site may not be locally
available. The only other alternative might be to build or reserve the needed additional
capacity on the pipeline network. Each alternative entails a cost.
A local natural gas distribution company (LDC) relies on supplemental supply
sources (underground storage, LNG, and propane) and uses linepacking to "shave" as
much of the difference between the total maximum user requirements (on a peak day or
shorter period) and the baseload customer requirements (the normal or average) daily
usage. Each unit "shaved" represents less demand charges (for reserving pipeline
capacity on the trunklines between supply and market areas) that the LDC must pay.
17

The objective is to maintain sufficient local underground natural gas storage capacity
and have in place additional supply sources such as LNG and propane air to meet large
shifts in daily demand, thereby minimizing capacity reservation costs on the supplying
pipeline.
Prior to FERC Order 636 in 1992, many interstate pipeline companies had a
completely integrated supply system that was capable of delivering natural gas from the
wellhead to the ultimate retail gas consumer. But, following Order 636, which separated
gathering, marketing, and transmission operations, many pipeline companies reorganized
and broke up this system into discrete parts and assigned them to affiliated companies.
The facilities, functions, and services required for gathering, processing, and
transportation were placed in affiliated companies or were spun off or sold to other
companies. Since most gas prices were no longer regulated, gas gathering service charges
became subject to market forces and were a function of buyer/seller negotiation, isolated
from the transmission charges imposed by the pipeline transporter.
2.2 Network Boundary Conditions
In order to determine the network boundary condition the following definitions are used:
Lone Node: A lone node is a node with only one branch connected, i.e. a production well, an
injection well, a source or a sink.
Boundary conditions: The fluid pressure, temperature, and flowrate at each lone node in the
network. The following rules apply:
Rule for Temperatures: The fluid temperature at all sources and the static reservoir
temperature at all production wells must be specified by the user. The fluid temperature at all
sinks and injection wells are always calculated.
Rules for Pressures and Flowrates: There are two rules for specification of pressure and
flowrate boundary conditions:
Rule I - Degrees of Freedom. The total number of flowrates, pressures and PQ curves
specified must equal the total number of lone nodes.
18

Rule 2 - At Least one Pressure. A least one pressure must be specified at one of the lone
nodes.
2.3 Network Tolerance
A network has converged when the pressure balance and mass balance at each node is within
the specified tolerance. The calculated pressure at each branch entering and leaving a node is
averaged.
The tolerance of each pressure is calculated from the equation:
Ptol = I(P- Pave.)/Pave. x 100%1
If all Ptol values are within the specified network tolerance then that node has passed the
pressure convergence test. This is repeated for each node.
The total mass flowrate into and the total mass flowrate out of a node are averaged. The
tolerance is calculated from the equation:
Ftol = I(Tot. mass flowrate in -Tot. mass flowrate ave.)trot. mass flowrate ave. x 100%1
If the Ftol value is within the specified network tolerance then that node has passed the mass
convergence test. This is repeated for each node. When all of the above conditions are
satisfied, the network has coverage.
19

CHAPTER 3: PROJECT METHODOLOGY
3.1 Project Flow Chart
START
LITERATURE REVIEW
o Gas Gathering System
o Pipeline Selection
• Processing Plant
• Deliverability Analysis
• Gas Properties
MODELLING MODELLING
Case 1: Looped Gas Gathering
Network Analysis.
Case 2: Condensate
Pipeline
DISCUSSION/CONCLUSION
20

3.2 Project Gantt chart
No I Details
1 I Literature Review
2 I Data Preparation and Selection for both cases
4 I Modeling Case I: Looped Gas Gathering Network Analysis
5 I Modeling Case 2:
with
ofFinal Report (CD Softcopy & Softbound)
~DX 8 -
9 I Delivery of Final Report to External Examiner I Marking by
External Examiner
of
21
Weeks
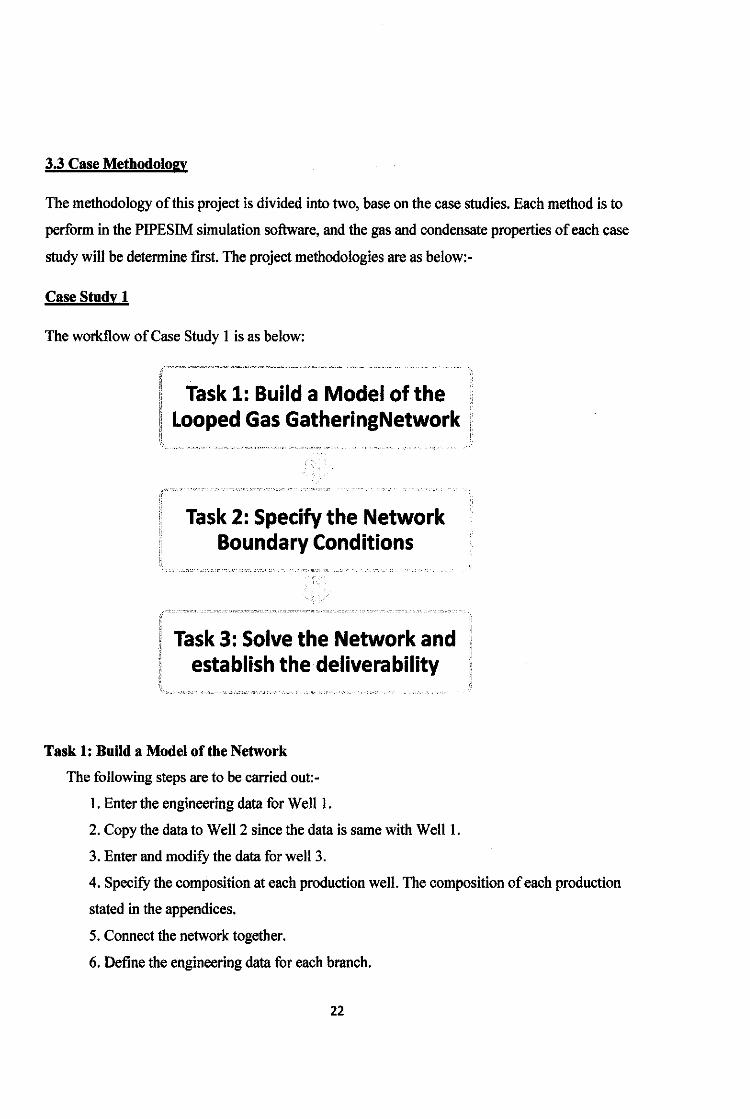
3.3 Case Methodology
The methodology of this project is divided into two, base on the case studies. Each method is to
perform in the PIPESIM simulation software, and the gas and condensate properties of each case
study will be determine first. The project methodologies are as below:-
Case Study 1
The workflow of Case Study 1 is as below:
Task 1: Build a Model of the Looped Gas GatheringNetwork
Task 2: Specify the Network Boundary Conditions
Task 3: Solve the Network and establish the deliverability
Task 1: Build a Model ofthe Network
The following steps are to be carried out:-
1. Enter the engineering data for Well 1.
2. Copy the data to Well2 since the data is same with Weill.
3. Enter and modifY the data for well3.
4. SpecifY the composition at each production well. The composition of each production
stated in the appendices.
5. Connect the network together.
6. Define the engineering data for each branch.
22

Task 2: Specify the Network Boundary Conditions
It is necessary to summarize the rules for specification of network boundary conditions. The
network solver solves the fluid pressures, temperatures, and flowrates around a network for a
user-specified set of boundary conditions.
Task 3: Solve the Network and establish the deliverability
First it is necessary to explain the network tolerance. A network has converged when the
pressure balance and mass balance at each node is within the specified tolerance.
In this case study, the following steps are required:
- Set the network tolerance.
- Run the model.
- View the tabular reports.
- View the graphical reports.
23
CaseStudy2
Work Flow Diagram for Case Study 2
Task 1: Develop a Compositional Model of the Hydrocarbon Phases
Task 2: Identify the Hydrate Envelope
Task 3: Select a Pipeline Size
Task 4: Determine the Pipeline Insulation Requirement
Task 5: Screen the Pipeline for Severe Riser Slugging
' I .
Task 6: Size a Slug Catcher
Task 1: Develop a Compositional Model of the Hydrocarbon Phases
The following steps are to be carried out:-
- Add the pure hydrocarbon components.
- Characterize and add a petroleum fraction.
- Generate the hydrocarbon phase envelope.
24

Task 2: Identify the Hydrate Envelope
Hydrate fonnation is to be avoided by operating above the hydrate fonnation temperature at all
times. The following steps are to be carried out:
-Add the aqueous component.
- Generate the hydrate envelope.
Task 3: Select a Pipeline Size
Find the smallest pipeline J.D. that will allow the design flowrate of 10,000 STB/d of condensate
to be transported from the satellite platfonn whilst maintaining an arrival pressure of not lower
than 1,000 psia at the processing platfonn. The pipeline sizes available are 8", 10", or 12" J.D. as
described in the data section in the appendices.
This can be detennined as follows:
-Use the pressure temperature profiles operation to calculate the pressure drop for each of
the three pipeline size options.
Task 4: Determine the Pipeline Insulation Requirement
Minimum arrival temperature is required to prevent the fonnation of hydrates. The insulation has
a thennal conductivity of0.15 Btulhr/ft/°F and a thickness of0.75" or 1" as describe in the
appendices. This can be detennined as follows:
- Use the pressure temperature profiles operation to calculate the temperature profile for the
design and turndown flowrate cases with 0. 75" thennal insulation thickness.
- Re-run the model with 1.0" thennal insulation thickness and compare the temperature
profiles.
Task 5: Screen the Pipeline for Severe Riser Slugging
Severe riser slugging is likely in a pipeline system followed by a riser under certain conditions.
The elements leading to severe riser slugging are:
1. The presence a long slightly downward inclined pipeline prior to the riser.
2. Fluid flowing in the "stratified" or "segregated" flow regime (as opposed to the usual "slug" or
"intennittent" flow regime).
3. A slug number (PI-SS) oflower than 1.0.
25
The PI-SS number can also be used to estimate the severe riser slug length from the equation:
slug length = riser height/PI-SS number.
Severe riser slugging is to be avoided in this case. The necessary information can be extracted
from the model as follows:-
- Configure the model output such that slug information, and flow regime maps are printed for
the fluid at the riser base.
Task 6: Size a Slug Catcher
Having established that normal slug flow is expected, it is now necessary to size a slug catcher.
The size will be determined by the largest of three design criteria:
I. The requirement to handle the largest slugs envisaged (chosen to be statistically the 1/1000
population slug size).
2. The requirement to handle liquid swept in front of a pig.
3. Transient effects, i.e. the requirement to handle the liquid slug generated when the production
flow is ramped up from 5,000 to 10,000 STB/d.
26

CHAPTER 4: RESULT
4.1 Case 1: Looped Gas Gathering Method
'UQLi§EM
p __ ,
p
ottld I> llil.rr r ,,
Figure 1: Layout of Network System
ma
·I §_
Above figure shows the layout in the model. The network show how the three wells are
connected and gathered to Sink 1. Base on PIPESIM software, when above figure have been
model its show that the network is completely connect and ready to evaluate. The data of each
well are provided in the appendices.
27
Pressure profile
3.000
2,1100
2,1100
2,400
2;110
{ 2.000
5 1,1100
I 1,1100 4:
1,400
I ;DO
1.000
eoo eoo
..... .......
Pressure profile from We/1_3 to the sink
·-···---·--. ..... ---........ l" to" to !fit to I" I~
s.aoo 10.000 1s.aoo 20.000 25.000 30.000 35.000 40.000 45.000 TtUI-.w.tftt
115
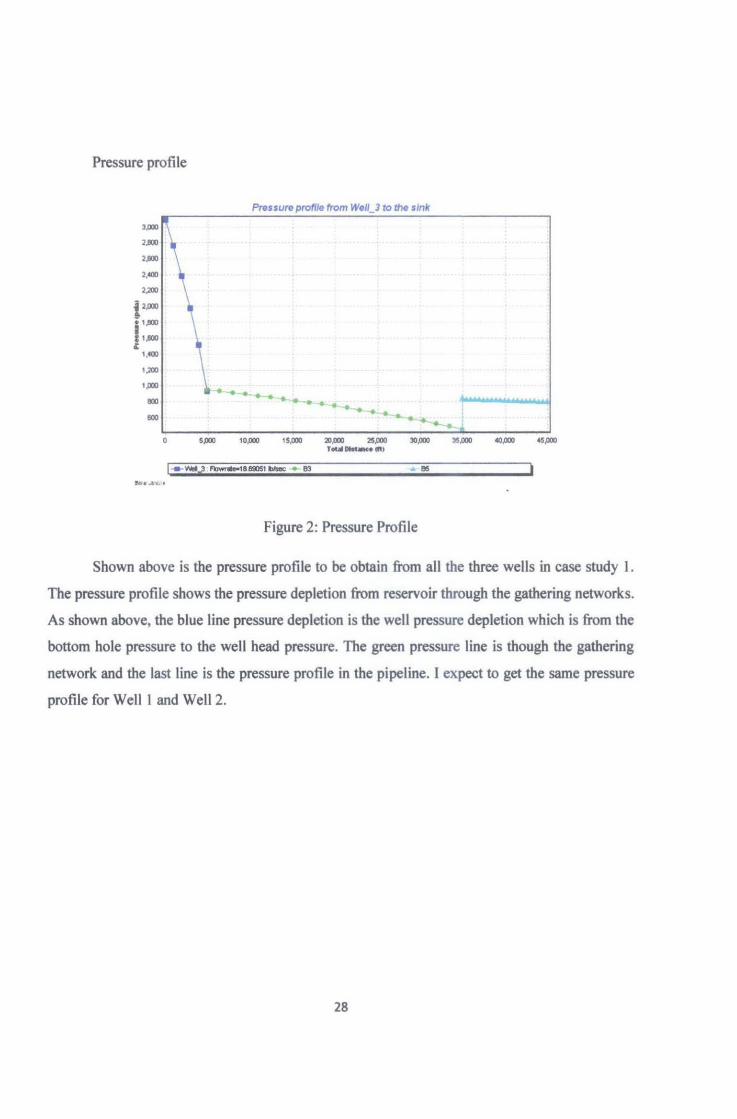
Figure 2: Pressure Profile
Shown above is the pressure profile to be obtain from all the three wells in case study I I
The pressure profile shows the pressure depletion from reservoir through the gathering networks.
As shown above, the blue line pressure depletion is the well pressure depletion which is from the
bottom hole pressure to the well head pressure. The green pressure line is though the gathering
network and the last line is the pressure profile in the pipeline. I expect to get the same pressure
profile for Well 1 and Well 2~
28

4.2 Case Study 2: Condensate Pipeline
~
T --$1
--· -.) J -I - -·
.r
Figure 3: Pipeline Modeling Layout of Condensate
In case 2, condensate gas is determined to be transported from a satellite platform to a gas
processing plant by using risers and pipeline. The riser is use to transport from wells to pipeline
by 400ft. The length of the pipeline is 5 miles. Base on the figure above, it shows the layout of
the whole transporting system of condensate gas .
..... ""'* --.. -
~ ~-~~~--------------------------------------~ PINis• EIIV~ Plot
·~r-------------~--~~~~~~~~------------,
.,.. ~ ..... .....
,,.. ... ... ... ,. ., 1CD ,. -r ..... ,.,,,,~
I •~OJD • OITICAI.K*T
I sr~_rr l!l e "' , "' · • •· • _. , .
Figure 4: Hydrocarbon Phase Envelope
29
Base from the PVT data, a phase envelope is detennined to get the phase envelope. This
is important to know the phase of the transported fluid either in one phase or two phase behavior.
The phase behavior of the fluid varies with pressure and temperature.
~ ~~0=~~~------------------------------------~
..... '""' •• ,..,. ,..,. ....
~= ~ UOD ! ..... : .....
t.a>O t.OOO .., .., ... ... .l
·Lu~~~~~~u.~~~~~~~=---~------~--_j ~ • s ~ ~ ... -r ..... , .... A
.. H'ttltATel ... a
~ r; e .., . .. .. . • . ~. • •. ,
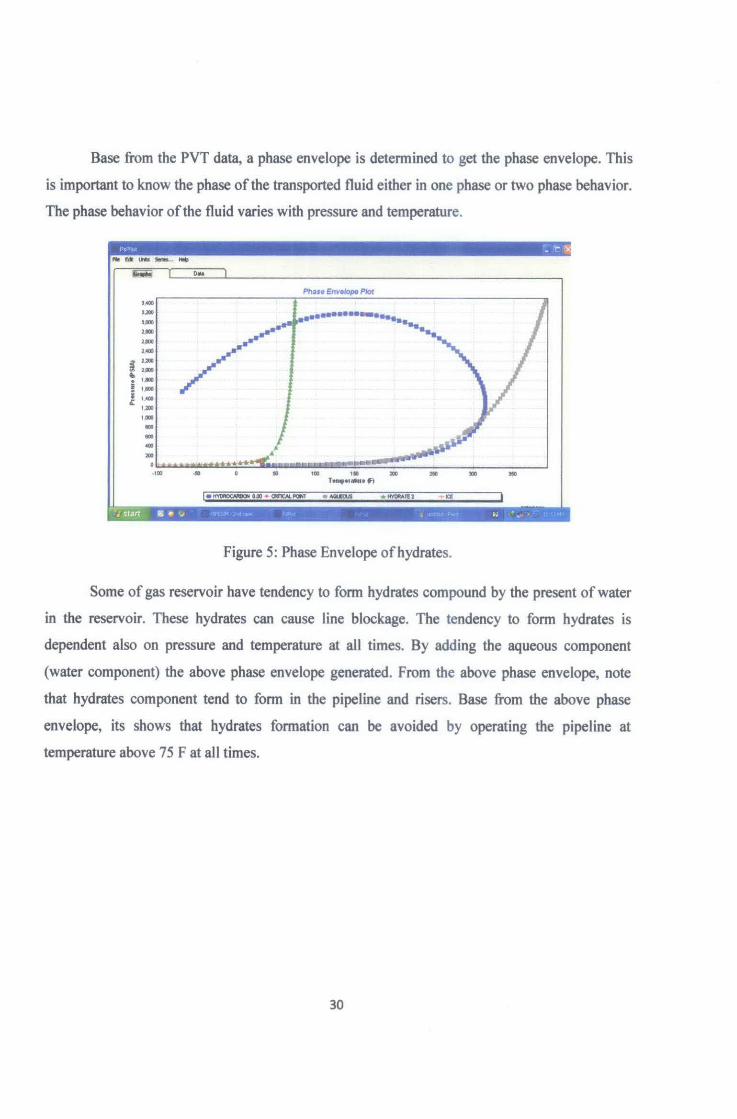
Figure 5: Phase Envelope of hydrates.
Some of gas reservoir have tendency to fonn hydrates compound by the present of water
in the reservoir. These hydrates can cause line blockage. The tendency to fonn hydrates is
dependent also on pressure and temperature at all times. By adding the aqueous component
(water component) the above phase envelope generated. From the above phase envelope, note
that hydrates component tend to fonn in the pipeline and risers. Base from the above phase
envelope, its shows that hydrates fonnation can be avoided by operating the pipeline at
temperature above 75 F at all times.
30
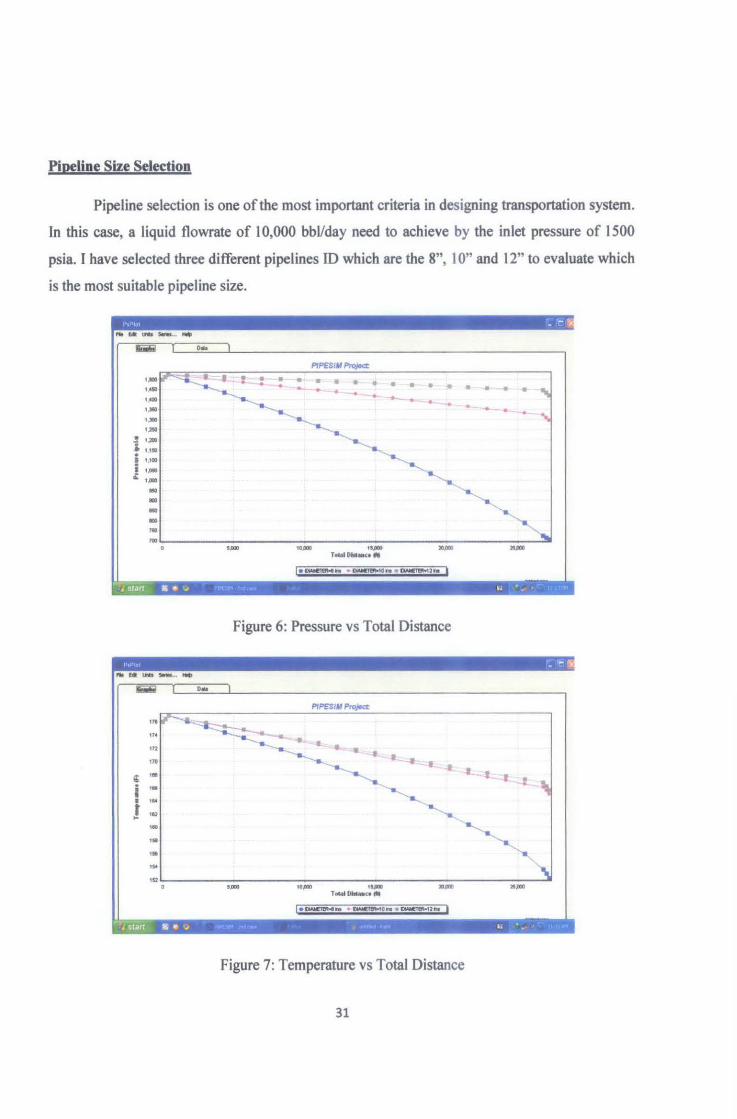
Pipeline Size Selection
Pipeline selection is one of the most important criteria in designing transportation system.
In this case, a liquid flowrate of 10,000 bbVday need to achieve by the inlet pressure of 1500
psia. I have selected three different pipelines ID which are the 8", 1 0" and 1 2" to evaluate which
is the most suitable pipeline size.
. ...
~ L--=~~-L------------------------------------------~
t,a l_..~~ ... - : _.! • .. • • e • ,. .. ...._ ...... tO • .... ..... ........_~
I;>Sl ,.,__,_
! IJDO ~ ' '"' . • 1,1011
i , • .. ..... ... ... -... ItO
• • --..
,,
• • • • • • "' .. . . • .. ...
•
"'---......, ~~------------------------------------------------3 ...... .....
J start & ~ 'J • •• • ... , ..
Figure 6: Pressure vs Total Distance
PIP61Irl Projecc
.t I -.t • .. :t_
t. .f. l
•
I •~N ~o .. ~2n. I
Figure 7: Temperature vs Total Distance
31
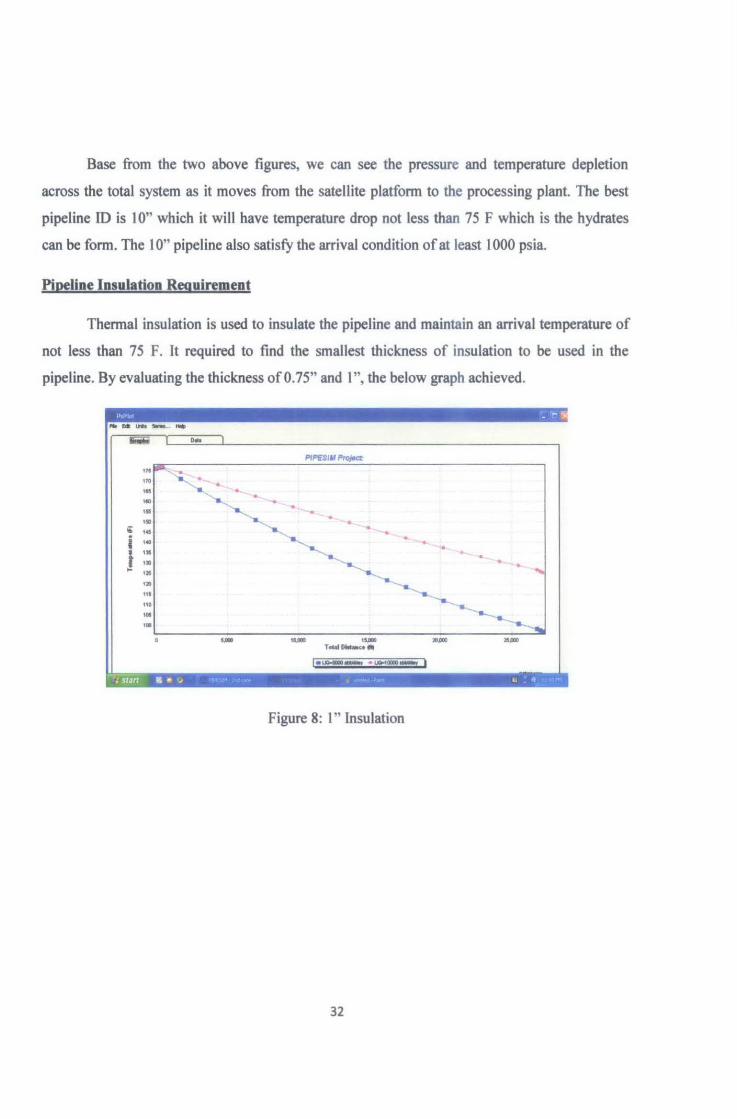
Base from the two above figures, we can see the pressure and temperature depletion
across the total system as it moves from the satellite platfonn to the processing plant. The best
pipeline ID is I 0" which it will have temperature drop not less than 75 F which is the hydrates
can be fonn . The 10" pipeline also satisfy the arrival condition of at least 1000 psia.
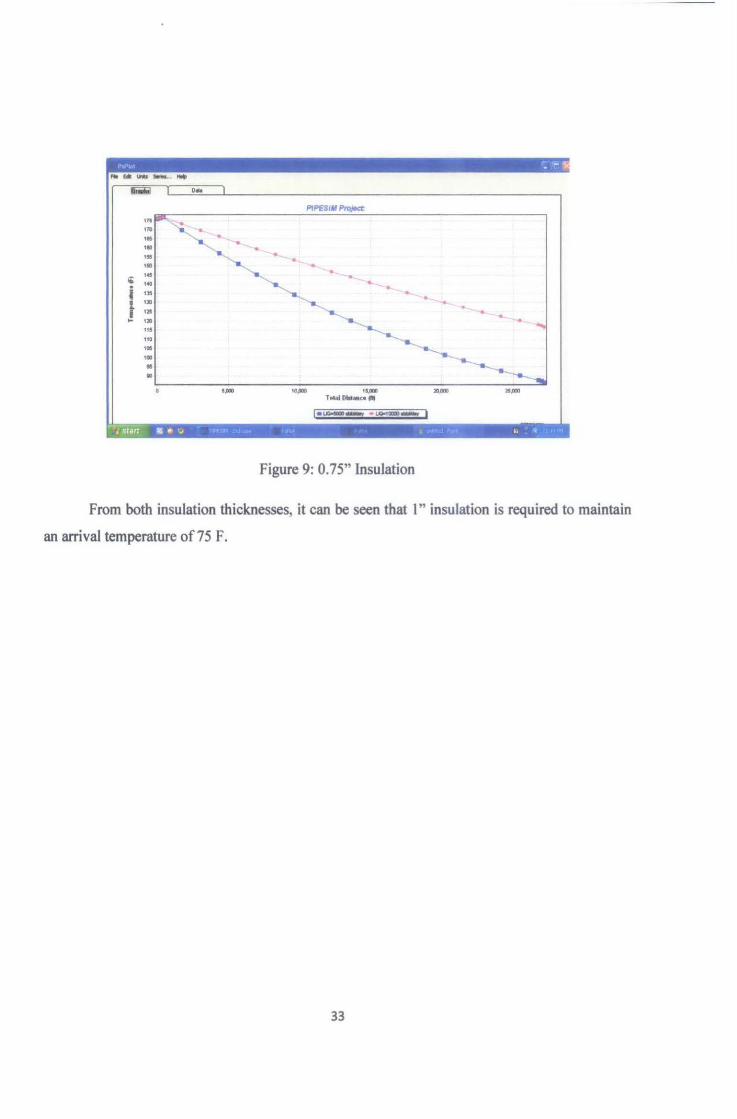
Pipeline Insulation Requirement
Thennal insulation is used to insulate the pipeline and maintain an arrival temperature of
not less than 75 F. It required to fmd the smallest thickness of insulation to be used in the
pipeline. By evaluating the thickness of 0. 75" and I", the below graph achieved .
• .. .. •• •• •• li ... •
i ... • .. ! •• . ....... ... • •• ,. .,.
ttl
ttO • ... ---... -IPJll IO.IIDO tSJIDO .,.,.
TM-.o •
l• l.D4DCIO....., •1..1Qoo100CIO==l 1 srJrt ~ ~ ~..~ · . · •" ... . ._ · ··
Figure 8: I" insulation
32
~ L-~0.=-~--------------------------------------------~
,. .. .. :=r~~ ,., . :: "'- ·~, ...
i:: ·~ .. i 135
.. 1 :: ,. 115
110
'" ,.., • •
-
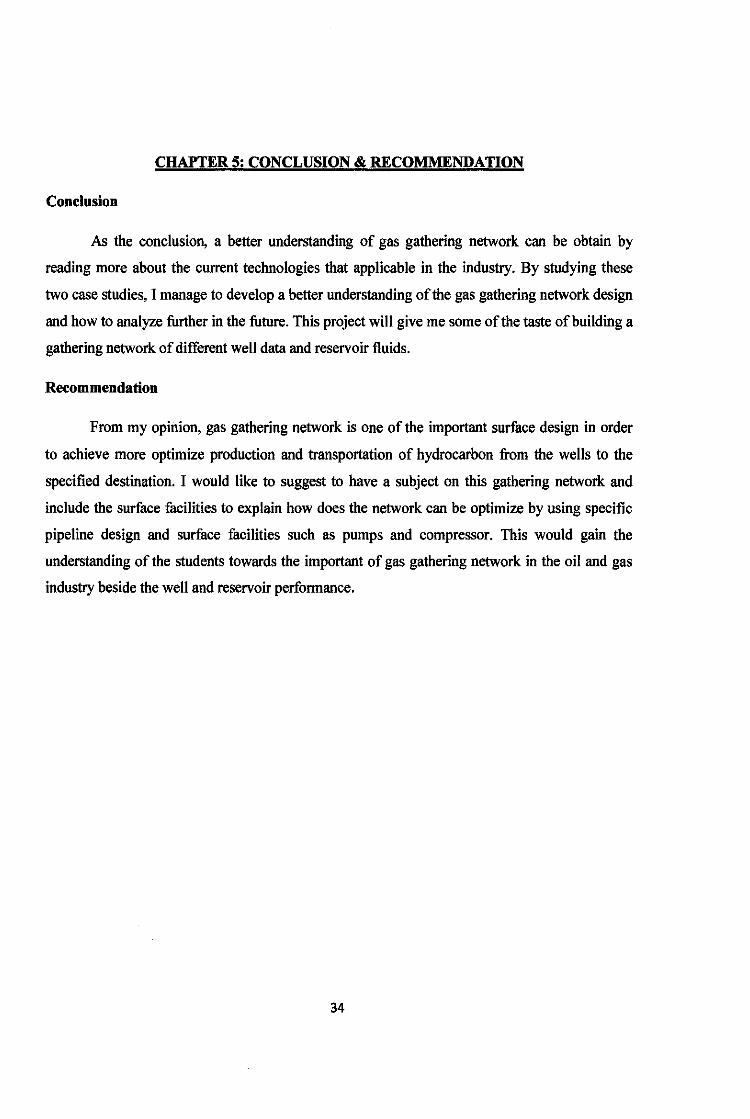
Figure 9: 0.75" Insulation
From both insulation thicknesses, it can be seen that I" insulation is required to maintain
an arrival temperature of75 F.
33
CHAPTER 5: CONCLUSION & RECOMMENDATION
Conclusion
As the conclusion, a better understanding of gas gathering network can be obtain by
reading more about the current technologies that applicable in the industry. By studying these
two case studies, I manage to develop a better understanding of the gas gathering network design
and how to analyze further in the future. This project will give me some of the taste of building a
gathering network of different well data and reservoir fluids.
Recommendation
From my opinion, gas gathering network is one of the important surface design in order
to achieve more optimize production and transportation of hydrocarbon from the wells to the
specified destination. I would like to suggest to have a subject on this gathering network and
include the surface facilities to explain how does the network can be optimize by using specific
pipeline design and surface facilities such as pumps and compressor. This would gain the
understanding of the students towards the important of gas gathering network in the oil and gas
industry beside the well and reservoir performance.
34

References
1. Aspects of Gas Gathering, by William Hurst, William C Goodson, Russell E Leeser.
2. An Efficient Model for Evaluating Field Gathering System Design, by J. R. Dempsey,
SPE-AIME,International Computer ApplicationsLtd, J. K. Patterson, SPE
AIME,International Computer ApplicationsLtd., K. H Coats, SPE
AIME,/nternationa/Computer ApplicationsLtd., J. P. Brill, SPE-AIME, U. of Tulsa
3. Natural Gas Production, by Chi U. Ikoku
4. Pipesim User Guide, by Schlumberger
5. Gas Gathering, Midstream Oil and Gas and Natural Gas, www.gasgathering.com
6. Natural Gas Engineering Handbook, by Boyun.
7. Using Intergrated Production Modelling (IPM) as an Optimization Tool for Field
Development Planning and Management, by E.A Ageh, SP E, A Adegoke. O.J Uzoh,
SPE, Shell Nigeria E&P.
8. Efliecient Conceptual Design of an Offshore Gas Gathering Network, by MJ
Watson, N.J Hawkers and P.F Pickering, FEESA Limited and L.D Brown,
ConocoPhillips Incorporated.
9. An Effective Method for Modelling Stagnant Liquid Columns in Gas Gathering
Systems
By R.G. MCNEIL, D.R. LILLICO, Fekete Associates Inc
35

Appendices
Data for Case Study 1
Completion and Tubing Data
Gas PI
Wellhead TVD
Mid Perforations TVD
Mid Perforations MD
Tubing I.D.
Wellhead Ambient Temp.
Mid Perforations Ambient
Temperature
Heat Transfer coefficient
Weill & 2
0.0004 mmscf/dlpsi2
0
4500 ft
4500 ft
2.4"
60 °F
130 °F
0.2 Btulhr/ft2/F
Pure hydrocarbon components (Weill and Weil2)
Component Moles
Methane 75
Ethane 6
Propane 3
Isobutane 1
Butane 1
Isopentane I
Pentane 0.5
Hexane 0.5
36
Weil3
0.0005 mmscf/dlpsi2
0
4900 ft
4900 ft
2.4"
60 °F
140 °F
0.2 Btu/hr/ft2/F

Petroleum Fraction (Weill and Weil2)
Name Boiling Point (F) Molecular Specific Gravity Moles
Weight
C7+ 214 115 0.683 12
Aqueous Component (Weill and Weil2)
Component Volume Ratio (%bbl/bbl)
Water 10
Pure Hydrocarbon Components (Weil3)
Component Moles
Methane 73
Ethane 7
Propane 4
Isobutane 1.5
Butane 1.5
Isopentane 1.5
Pentane 0.5
Hexane 0.5
Petroleum Fraction (Well3)
Name Boiling Point (F) Molecular Specific Gravity Moles
Weight
C7+ 214 115 0.683 10.5
37

Aqueous Component (Well 3)
Component Volume Ratio (%bbl/bbl)
Water 5
Data for looped Gathering Lines
Rate of undulations 10/1000
Horizontal distance 30000 ft
Elevation Difference Oft
Inner diameter 6"
Wall Thickness 0.5''
Roughness 0.001"
Ambient Temperature 60°F
Overall heat transfer coefficient 0.2 Btulhr/ft2/°F
Data for Deliver Line
Separator type Liquid
Separator efficiency 100%
Compressor Differential Pressure 400psi
Compressor efficiency 70%
Aftercooler delta P 15psi
Aftercooler outlet temperature 120 F
Flowline rate of undulation 10/1000
Flowline Horinzontal distance lOOOOft
Flowline Elevation Difference Oft
Flowline inner diameter 8"
Flowline wall thickness 0.5''
Flowline Roughness 0.001"
Flowline Ambient Temperature 60°F
38

Flowline Overal heat transfer coefficient 0.2 Btulhr/ft2fOF
Boundary Conditions
Node Pressure (psia) Temperature (F)
Weill 2900 130
Well2 2900 130
Well3 3100 140
Sink 1 800 (Calculated)
Data for Case Study 2
Layout Condensate flows down a 400 ft x 1 0" ID riser from the satellite platform to the seabed, along a 5 mile pipeline, and up a 400 ft x 1 0" ID riser to the processing platform.
Boundary Condition
Fluid inlet pressure at satellite platform 1500 psia
Fluid inlet temperature at satellite platform 176 °F
Design liquid flowrate 10000 STB/d
Minimum arrival pressure at processing platform 1000 psia
Minimum arrival temperature at processing platform 75 °F.
Pure Hydrocarbon Components
Component Moles
Methane 75
Ethane 6
Propane 3
Isobutane 1
Butane 1
39

Isopentane 1
Pentane 0.5
Hexane 0.5
Petroleum Fraction
Name Boiling Point (F) Molecular Specific Gravity Moles
Weight
C7+ 214 115 0.683 12
Aqueous Component
Component Volume Ratio (o/obbllbbl)
Water 10
Pipeline Size Available
I.D (") Wall Thickness (") Roughness (")
8 0.5 0.001
10 0.5 0.001
12 0.5 0.001
Pipeline Data
Height of undulations 10/1000
Horizontal distance 5 miles
Elevation difference 0
40

Wall thickness 0.5''
Roughness 0.001"
Ambient Temperature 50 op
Overall heat transfer coefficient 0.2 Btu/hr/ft" /°F
Pipe insulation study data
Pipe thennal conductivity 50 Btu/hr/fti°F
Insulation thennal conductivity 0.15 Btu/hr/ft/°F
Insulation thickness available 0.75" or 1.0"
Ambient fluid water
Ambient fluid velocity 1.64 ftlsec
Burial Depth 0 (half buried)
Ground Conductivity 1.5 Btu/hr/ft/°F
Data for Riser 1 & 2
Horizontal Distance 0
Elevation Difference (Riser 1) -400ft
Elevation Difference (Riser 2) +400ft
Inner Diameter 10"
Wall Thickness 0.5''
Roughness 0.001"
Ambient Temperature 50 op
Overall heat transfer coefficient 0.2 Btulhr/ft"/°F
41