
Office of the Director of Mental Health Annual Report 2016 · Nau mai ki tēnei tekau mā rua o...
86
2016 Office of the Director of Mental Health Annual Report health.govt.nz Released 2017
Transcript of Office of the Director of Mental Health Annual Report 2016 · Nau mai ki tēnei tekau mā rua o...

2016
Office of the Director of Mental HealthAnnual Report
health.govt.nzReleased 2017
Citation: Ministry of Health. 2017. Office of the Director of Mental Health Annual Report 2016. Wellington: Ministry of Health.
Published in December 2017 by the Ministry of Health
PO Box 5013, Wellington 6145, New Zealand
ISBN 978-1-98-853920-1 (print) ISBN 978-1-98-853921-8 (online)
HP 6723
This document is available at health.govt.nz
DisclaimerThe purpose of this publication is to inform discussion about mental health services and outcomes in New Zealand, and to assist in policy development.
This publication reports information provided to the Programme for the Integration of Mental Health Data (PRIMHD) (see Appendix 1) by district health boards (DHBs) and non-governmental organisations (NGOs). It is important to note that, because PRIMHD is a dynamic collection, it was necessary to wait a certain period before publishing a record of the information in it, so that it is less likely that the information will need to be amended after publication.
Although every care has been taken in preparing this document, the Ministry of Health cannot accept legal liability for any errors, omissions or damages resulting from reliance on the information it contains.
A note on the cover‘Resonance’ by Levi Coop Although Levi Coop holds a degree in art history, he says art-making rarely comes easily to him. This, however, does not stop him! Usually dance and music inform his work, abstraction is a new venture. He finds Vincents a treasure and cannot speak highly enough of the staff. Levi’s work ‘Resonance’ is acrylics and oil pastel on canvas.
Vincents Art Workshop is a community art space in Wellington established in 1985. A number of people who attend have had experience of mental health services or have a disability, and all people are welcome. Vincents Art Workshop models the philosophy of inclusion and celebrates the development of creative potential and growth.
Website: www.vincents.co.nz
This work is licensed under the Creative Commons Attribution 4.0 International licence. In essence, you are free to: share, ie, copy and redistribute the material in any medium or format; adapt, ie, remix, transform and build upon the material. You must give appropriate credit, provide a link to the licence and indicate if changes were made.
iiiOffice of the Director of Mental Health Annual Report 2016
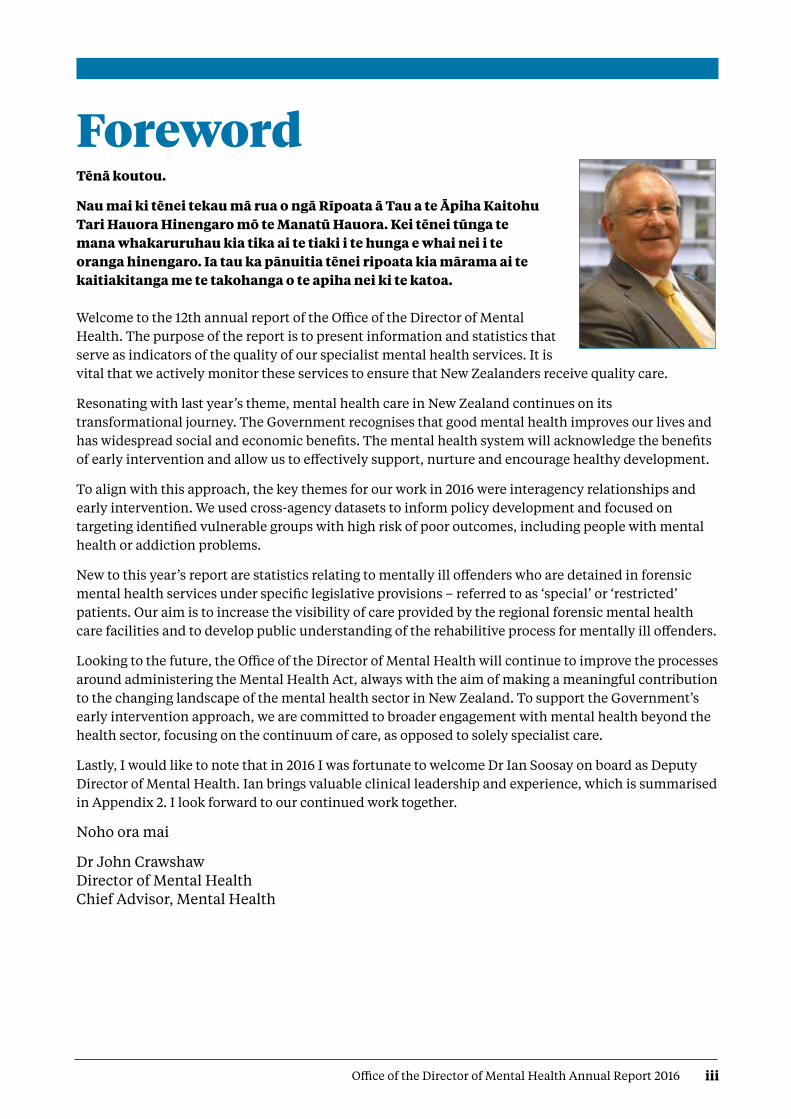
ForewordTēnā koutou.
Nau mai ki tēnei tekau mā rua o ngā Rīpoata ā Tau a te Āpiha Kaitohu Tari Hauora Hinengaro mō te Manatū Hauora. Kei tēnei tūnga te mana whakaruruhau kia tika ai te tiaki i te hunga e whai nei i te oranga hinengaro. Ia tau ka pānuitia tēnei ripoata kia mārama ai te kaitiakitanga me te takohanga o te apiha nei ki te katoa. Welcome to the 12th annual report of the Office of the Director of Mental Health. The purpose of the report is to present information and statistics that serve as indicators of the quality of our specialist mental health services. It is vital that we actively monitor these services to ensure that New Zealanders receive quality care.
Resonating with last year’s theme, mental health care in New Zealand continues on its transformational journey. The Government recognises that good mental health improves our lives and has widespread social and economic benefits. The mental health system will acknowledge the benefits of early intervention and allow us to effectively support, nurture and encourage healthy development.
To align with this approach, the key themes for our work in 2016 were interagency relationships and early intervention. We used cross-agency datasets to inform policy development and focused on targeting identified vulnerable groups with high risk of poor outcomes, including people with mental health or addiction problems.
New to this year’s report are statistics relating to mentally ill offenders who are detained in forensic mental health services under specific legislative provisions – referred to as ‘special’ or ‘restricted’ patients. Our aim is to increase the visibility of care provided by the regional forensic mental health care facilities and to develop public understanding of the rehabilitive process for mentally ill offenders.
Looking to the future, the Office of the Director of Mental Health will continue to improve the processes around administering the Mental Health Act, always with the aim of making a meaningful contribution to the changing landscape of the mental health sector in New Zealand. To support the Government’s early intervention approach, we are committed to broader engagement with mental health beyond the health sector, focusing on the continuum of care, as opposed to solely specialist care.
Lastly, I would like to note that in 2016 I was fortunate to welcome Dr Ian Soosay on board as Deputy Director of Mental Health. Ian brings valuable clinical leadership and experience, which is summarised in Appendix 2. I look forward to our continued work together.
Noho ora mai
Dr John CrawshawDirector of Mental HealthChief Advisor, Mental Health
Mā te rongo, ka mōhio; Mā te mōhio, ka mārama; Mā te mārama, ka mātau;
Mā te mātau, ka ora.Through resonance comes cognisance;
through cognisance comes understanding; through understanding comes knowledge;
through knowledge comes life and wellbeing.

vOffice of the Director of Mental Health Annual Report 2016
ContentsForeword iii
Executive summary ix
Introduction 1
Objectives 1
Structure of this report 1
Context 2
The Ministry of Health 2
Mental health care in New Zealand: A transformational journey 2
Specialist mental health services 4
The Mental Health Act 5
Activities for 2016 9
Mental health sector relationships 9
Cross-government relationships 9
Child and adolescent mental health services 10
Statutory changes to health practitioner status 10
Towards restraint-free mental health practice 11
A strategic approach to rural mental health and addiction 11
Office of the Auditor-General performance audit 12
Mental Health and Addiction Workforce Action Plan 13
New Zealanders returning from Australia 13
Substance Addiction (Compulsory Assessment and Treatment) Bill 14
Action 9(d) of the Disability Action Plan 2014–2018 14
Other investigations 14
Ensuring service quality 16
Specialist mental health services 16
Use of the Mental Health Act 19
Māori and the Mental Health Act 25
Family/whānau consultation and the Mental Health Act 30
Seclusion 33
Special and restricted patients 40
Mental health and addiction adverse event reporting 47
Death by suicide 49
Specialist treatment regimes 54
References 66
Appendix 1: Caveats relating to the Programme for the Integration of Mental Health Data 68
Appendix 2: Deputy Director of Mental Health: Dr Ian Soosay 69
Appendix 3: Additional statistics 70
Appendix 4: Developments in mental health and addiction reporting and improvement 75

vi Office of the Director of Mental Health Annual Report 2016
List of figuresFigure 1: Number of people engaging with specialist services each year, 2011–2016 4
Figure 2: Percentage of service users accessing only community services, 1 January to 31 December 2016 5
Figure 3: Responses to the statement ‘I would recommend this service to friends and family if they needed similar care or treatment’, 1 January to 31 December 2016 17
Figure 4: Percentage of people seen by mental health services within three weeks (left) and within eight weeks (right), 1 January to 31 December 2016 18
Figure 5: Percentage of people seen by addiction services within three weeks (left) and within eight weeks (right), 1 January to 31 December 2016 18
Figure 6: Percentage of service users with a transition plan, by DHB, 1 January to 31 December 2016 19
Figure 7: Average number of people per 100,000 on a given day* subject to a community treatment order (section 29 of the Mental Health Act), by DHB, 1 January to 31 December 2016 23
Figure 8: Average number of people per 100,000 on a given day* subject to an inpatient treatment order (section 30 of the Mental Health Act), by DHB, 1 January to 31 December 2016 23
Figure 9: Rate of people per 100,000 subject to compulsory treatment order applications (including extensions), by age group, 2004–2016 24
Figure 10: Rate of people per 100,000 subject to compulsory treatment order applications (including extensions), by gender, 2004–2016 24
Figure 11: Rate ratio of Māori to non-Māori subject to a community treatment order (section 29) under the Mental Health Act, by DHB, 1 January to 31 December 2016 27
Figure 12: Rate ratio of Māori to non-Māori subject to an inpatient treatment order (section 30) under the Mental Health Act, by DHB, 1 January to 31 December 2016 28
Figure 13: Age-standardised rates of Māori and non-Māori subject to community and inpatient treatment orders (sections 29 and 30) under the Mental Health Act, by gender, 1 January to 31 December 2016 29
Figure 14: Length of time spent subject to community and inpatient treatment orders (sections 29 and 30) under the Mental Health Act for Māori and non-Māori, 2009–2014 29
Figure 15: Average national percentage of family/whānau consultation for particular assessment/treatment events, 1 January to 31 December 2016 32
Figure 16: Average percentage of family/whānau consultation across all assessment/treatment events, by DHB, 1 January to 31 December 2016 32
Figure 17: Reasons for not consulting family/whānau, 1 January to 31 December 2016 33
Figure 18: Number of people secluded in adult inpatient services nationally, 2007–2016 35
Figure 19: Total number of seclusion hours in adult inpatient services nationally, 2007–2016 35
Figure 20: Number of people secluded across all inpatient services (adult, forensic, intellectual disability, and youth), by age group, 1 January to 31 December 2016 36
Figure 21: Number of seclusion events across all inpatient services (adult, forensic, intellectual disability, and youth), by duration of event, 1 January to 31 December 2016 36
Figure 22: Number of people secluded in adult inpatient services per 100,000, by DHB, 1 January to 31 December 2016 37
Figure 23: Number of seclusion events in adult inpatient services per 100,000, by DHB, 1 January to 31 December 2016 38

viiOffice of the Director of Mental Health Annual Report 2016
Figure 24: Seclusion indicators for adult inpatient services, Māori and non-Māori, 1 January to 31 December 2016 38
Figure 25: Percentage of people secluded in adult inpatient services, Māori and non-Māori males and females, 1 January to 31 December 2016 39
Figure 26: Number of Māori and non-Māori secluded in adult inpatient services, 2007–2016 39
Figure 27: Total number of special patients, by DHB, 1 January to 31 December 2016 42
Figure 28: Percentage of Extended Forensic Care, Short-term Forensic Care and ‘Other’ legal statuses, within each DHB, 1 January to 31 December 2016 43
Figure 29: Total number of special patients, by age-group, 1 January to 31 December 2016 44
Figure 30: Total number of special patients, by ethnicity, 1 January to 31 December 2016 44
Figure 31: Total number of special patients, by ethnicity and special patient type, 1 January to 31 December 2016 45
Figure 32: Age-standardised rate of suicide, by service use, people aged 10–64 years, 2001–2014 51
Figure 33: Age-specific rate of suicide, by age group, gender and service use, people aged 10–64 years, 2014 52
Figure 34: Number of opioid substitution treatment clients, by age group, 2008–2016 55
Figure 35: Number of people receiving opioid substitution treatment from a specialist service, general practice or prison service, 2008–2016 55
Figure 36: Percentage of people receiving opioid substitution treatment from specialist services and general practice, by DHB, 1 January to 31 December 2016 56
Figure 37: Percentage of withdrawals from opioid substitution treatment programmes, by reason (voluntary, involuntary or death), 2008–2016 57
Figure 38: Number of people prescribed Suboxone, 2008–2016 57
Figure 39: Number of people treated with electroconvulsive therapy per 100,000 service user population, 2005–2016 60
Figure 40: Rates of people treated with electroconvulsive therapy, by DHB of domicile, 1 January to 31 December 2016 62
Figure 41: Number of people treated with electroconvulsive therapy, by age group and gender, 1 January to 31 December 2016 64
List of tablesTable 1: Number of completed section 95 inquiry reports received by the Director of Mental Health, 2003–2016 7
Table 2: Average number of people per 100,000 per month required to undergo assessment under sections 11, 13 and 14(4) of the Mental Health Act, by DHB, 1 January to 31 December 2016 22
Table 3: Average number of people per 100,000 on a given day subject to sections 29, 30 and 31 of the Mental Health Act, by DHB, 1 January to 31 December 2016 22
Table 4: Age-standardised rates of Māori and non-Māori subject to community and inpatient treatment orders (sections 29 and 30) under the Mental Health Act, by gender, 1 January to 31 December 2016 28
Table 5: Seclusion indicators for forensic and intellectual disability services, by DHB, 1 January to 31 December 2016 40
viii Office of the Director of Mental Health Annual Report 2016
Table 6: Total number of special patients, by type and DHB, 1 January to 31 December 2016 43
Table 7: Number of long-leave, revocation and reclassification applications sent to the Minister of Health for special patients and restricted patients, 1 January to 31 December 2016 46
Table 8: Outcomes of reportable death notifications under section 132 of the Mental Health Act, 1 January to 31 December 2016 47
Table 9: Adverse events (relating to mental health behaviour) reported by DHBs to the Health Quality & Safety Commission, 1 January to 31 December 2016 48
Table 10: Mental health adverse events reported to the Health Quality & Safety Commission, by DHB, 1 January to 31 December 2016 49
Table 11: Number and age-standardised rate of suicide, by service use, people aged 10–64 years, 2014 50
Table 12: Number and age-standardised rate of suicide, by service use and gender, people aged 10–64 years, 2014 51
Table 13: Number and age-specific rate of suicide, by age group, gender and service use, people aged 10–64 years, 2014 52
Table 14: Number and age-standardised rate of suicide and deaths of undetermined intent, by ethnicity and service use, people aged 10–64 years, 2014 53
Table 15: Number of applications for detention and committal under the ADA Act, by application outcome, 2004–2016 58
Table 16: Number of granted orders for detention and committal, under the ADA Act, 2004–2016 59
Table 17: Electroconvulsive therapy indicators, by DHB of domicile, 1 January to 31 December 2016 61
Table 18: Indicators for situations in which electroconvulsive therapy was not consented to, by DHB of service, 1 January to 31 December 2016 63
Table 19: Number of people treated with electroconvulsive therapy, by age group and gender, 1 January to 31 December 2016 64
Table 20: Number of people treated with electroconvulsive therapy, by ethnicity, 1 January to 31 December 2016 65
Table A1: Outcome of Mental Health Act applications received by the Mental Health Review Tribunal, 1 July 2015 to 30 June 2016 70
Table A2: Results of inquiries under section 79 of the Mental Health Act held by the Mental Health Review Tribunal, 1 July 2015 to 30 June 2016 70
Table A3: Ethnicity of people who identified their ethnicity in Mental Health Review Tribunal applications, 1 July 2015 to 30 June 2016 71
Table A4: Gender of people making Mental Health Review Tribunal applications, 1 July 2015 to 30 June 2016 71
Table A5: Applications for compulsory treatment orders (or extensions), 2004–2016 72
Table A6: Types of compulsory treatment orders made on granted applications, 2004–2016 73

ixOffice of the Director of Mental Health Annual Report 2016
Executive summary• In the 2016 calendar year, a record number of people accessed specialist mental health and
addiction services. Most accessed services in the community.
• In 2016, consumer satisfaction with mental health and addiction services was rated around 80 percent.
• In 2016, a small proportion of all service users received compulsory assessment and/or treatment under the Mental Health (Compulsory Assessment and Treatment) Act 1992 (the Mental Health Act).
• Māori are over-represented under the Mental Health Act. Reducing the disparity in mental health outcomes for Māori is a priority action for the Ministry of Health and district health boards (DHBs).
• In 2016, the use of seclusion in adult inpatient units steadied in the context of a seven-year decline. Most services in New Zealand that use seclusion are now entering a re-planning phase, in which they are refining and refocusing seclusion reduction initiatives. Māori continue to be over-represented in the seclusion figures.
• In 2016, 251 people received electroconvulsive therapy (ECT) in mental health services. Females were more likely to receive ECT than males, and older people were more likely to receive ECT than younger people.
• In 2014,1 a total of 510 people died by suicide. Mental disorders are one of the factors that can increase the likelihood of suicidal behaviour.
1 Data from 2014 is used because it can take more than two years for a coroner’s investigation into a suicide to be completed.
x Office of the Director of Mental Health Annual Report 2016
Further readingThe New Zealand Mental Health and Addictions KPI Programme The New Zealand Mental Health and Addictions KPI Programme is a provider-led initiative designed to support quality and performance improvement across the mental health and addiction sector. Further information on the KPI Programme can be found at www.mhakpi.health.nz.
Other PRIMHD publicationsThe Ministry of Health publishes additional information provided to PRIMHD on mental health and addiction service use. Further information on these publications can be found at www.health.govt.nz/publications.

1Office of the Director of Mental Health Annual Report 2016
IntroductionObjectivesThe objectives of this report are to:
• provide information about specific clinical activities that must be reported to the Director of Mental Health under the Mental Health Act
• contribute to improving the standards of care and treatment for people with mental illness by actively monitoring services against targets and performance indicators set by the Ministry of Health
• inform mental health service users, their families/whānau, service providers and members of the public about the role, function and activities of the Office of the Director of Mental Health and the Chief Advisor, Mental Health
• report on the activities of statutory officers under the Mental Health Act (such as district inspectors and the Mental Health Review Tribunal).
Structure of this reportThis report is divided into three main sections. The first section (Context) provides an overview of the legislative and service delivery contexts in which the Office operates. The second section (Activities for 2016) describes the work carried out by the Office in 2016. The final section (Ensuring service quality) provides statistical information that covers the use of the Mental Health Act, seclusion, reportable deaths and specialist care regimes (such as electroconvulsive therapy (ECT) and alcohol and drug services) during the reporting period.

2 Office of the Director of Mental Health Annual Report 2016
ContextThe Ministry of HealthThe Ministry of Health (the Ministry) improves, promotes and protects the mental health and independence of New Zealanders by:
• providing whole-of-sector leadership of the New Zealand health and disability system
• advising the Minister of Health and the Government on mental health issues
• directly purchasing a range of important national mental health services
• providing health-sector information and payment services.
Ministry groups play a number of roles in leading and supporting mental health services. The Protection, Regulation and Assurance business unit monitors the quality of mental health and addiction services and the safety of compulsory mental health treatment, through the Office of the Director of Mental Health, Medicines Control and HealthCERT groups.
The Service Commissioning business unit supports the implementation of mental health policy. Clinical and policy leaders collaborate with the Strategy and Policy business unit to advise the Government on and implement mental health policy. The Service Commissioning business unit is also responsible for the funding, monitoring and planning of district health boards (DHBs), including the annual funding and planning rounds.
Mental health care in New Zealand: A transformational journeyOver the last 50 years, mental health and addiction services have moved from an institutional model of care to a recovery model of care. Compulsory inpatient treatment has largely given way to voluntary engagement with services in community settings. Mental health care in New Zealand has undergone a transformational journey. There has been significant investment in mental health, resulting in the establishment of a wide range of community, kaupapa Māori, specialist and acute services. Ringfenced funding for mental health services has increased from $1.1 billion in 2008/09 to approximately $1.4 billion in 2015/16. The Ministry has led and contributed to many cross-agency initiatives that seek to improve population-level mental health outcomes.2 Despite these achievements, the sector faces new and shifting challenges. In 2016 a record number of people accessed specialist mental health and addiction services. This increase is consistent with international trends and has occurred in the context of population growth, improved non-governmental organisation (NGO) reporting, growing social awareness and increasingly open discussion of mental health issues, as promoted by initiatives such as the Prime Minister’s Youth Mental Health Project and Like Minds, Like Mine. More New Zealanders are seeking and receiving specialist mental health care, which is positive. But services are experiencing increasing pressure.
The Ministry of Health improves, promotes and protects the mental health and independence of New Zealanders
2 More information on the Ministry of Health’s work in the areas of mental health, depression and suicide prevention is at www.health.govt.nz/our-work/mental-health-and-addictions.

3Office of the Director of Mental Health Annual Report 2016
We know that mental health outcomes continue to be inequitable in New Zealand. Māori, Pacific peoples, people with disabilities and refugees (among others) disproportionately experience mental health challenges. In addition, we know that there is a group of New Zealanders with moderate mental health needs who are not easily managed in primary care but who do not meet the threshold for specialist care. This can result in their needs not being fully met.
Rising to the Challenge: The Mental Health and Addiction Service Development Plan 2012–2017 (Ministry of Health 2012e) has provided a strategic direction for mental health services. It sets out 100 actions to enhance mental health service delivery, with the aim of improving wellbeing and resilience, expanding access and decreasing waiting times. In 2016, the Plan was on track with significant gains in service delivery. We must build on these gains by continuing to ensure that services are best placed to respond to their communities’ changing needs.
Commissioning Framework for Mental Health and AddictionThe Commissioning Framework for Mental Health and Addiction: A New Zealand guide was published in August 2016. The Commissioning Framework was created as part of a specific action in Rising to the Challenge and it provides national guidance to enable us to measure outcomes that make a real difference for people.
This Commissioning Framework describes a consistent approach to commissioning responses across New Zealand, using the relevant information to purchase responses to best meet the needs of the local population. It describes the components that are critical to successfully commissioning and the process that will be used by those responsible for commissioning mental health and addiction care. This includes planners, funders, contract managers, boards, groups, agencies and/or those in designated commissioning roles.
Implementing the Commissioning Framework requires a fundamental shift to an increased focus on measurable outcomes as part of evaluating results. Robust measures will need to be adopted that can capture the three parts of the ‘Triple Aim’:
• improved quality, safety and experience of care
• improved health and equity for all populations
• best value for public health system resources.
Current resources will need to be used differently and reinvested into improving outcomes for people with mental health and addiction issues.
Looking forwardThe Government and Ministry of Health are committed to providing high-quality mental health services to all New Zealanders.
Consistent with the people-powered theme of the New Zealand Health Strategy 2016–2026 (Ministry of Health 2016), people are at the heart of this work. The Ministry continues to engage with people throughout the health sector to understand the issues for those whose mental health and addiction needs are not currently well supported, the outcomes we hope to see for them and how we can work differently to achieve these outcomes.
The mental health sector faces new and shifting challenges
The mental health system of the future will need to focus on prevention and early intervention
4 Office of the Director of Mental Health Annual Report 2016
The mental health system of the future will need to focus on prevention and early intervention while meeting increasing demand and maintaining services for individuals who need more immediate support. A coordinated response to mental health and addictions across the health, education, justice and wider social sectors will also be needed.
Budget 2017 will invest an extra $224 million over four years in mental health services, including $124 million on new innovative approaches to transform the mental health and addiction services to help meet increasing demand.
Agencies across the health, education, justice (including Police and Corrections) and social sectors, alongside the Government’s Chief Science Advisors, have been investigating how New Zealanders’ mental health and wellbeing can be improved.
In August 2017, the previous Government announced a range of proposed initiatives to improve access to services and support, as well as initiatives focusing on early intervention for children and young people.
You can read the Science Advisor’s advice Toward a whole of government/whole of nation approach to mental health on the Office of the Prime Minister’s Chief Science Advisor’s website (www.pmcsa.org.nz).
The Mental Health and Addiction Workforce Action Plan 2017 to 2021 was also released in 2017. The Plan identifies the priorities for developing a competent and credible workforce for the mental health and addiction sector. The action plan is available on the Ministry of Health’s website (www.health.govt.nz).
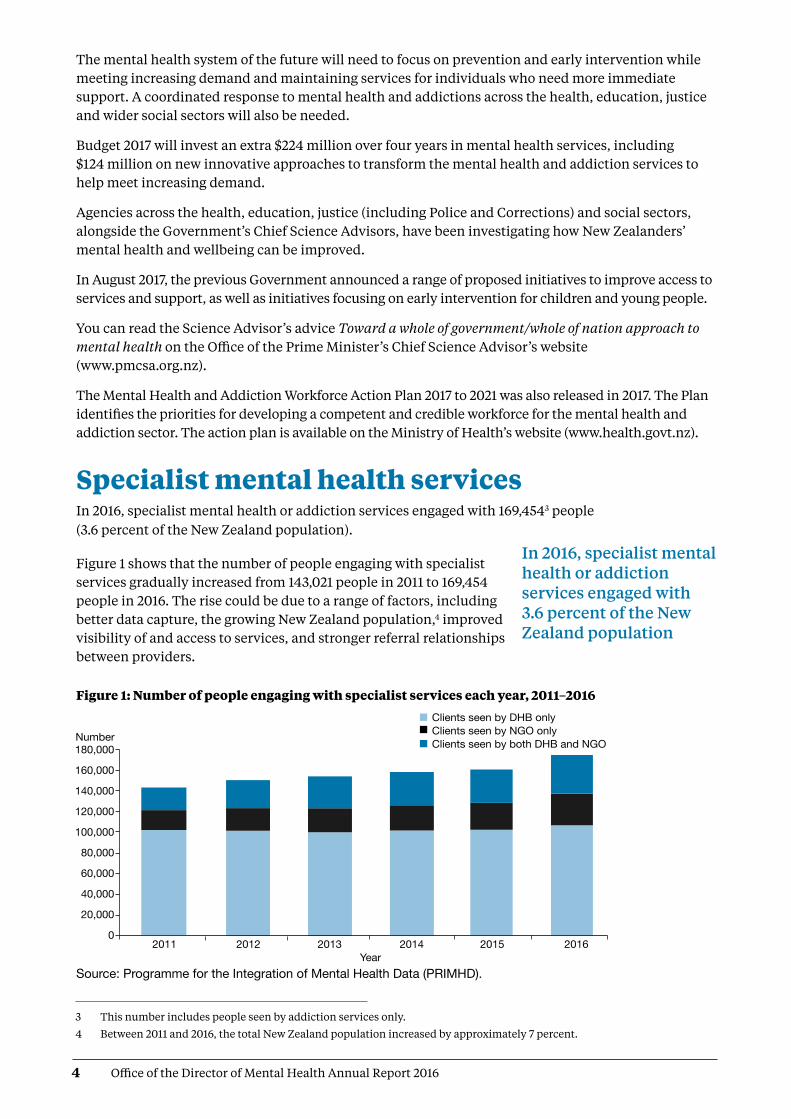
Specialist mental health servicesIn 2016, specialist mental health or addiction services engaged with 169,4543 people (3.6 percent of the New Zealand population).
Figure 1 shows that the number of people engaging with specialist services gradually increased from 143,021 people in 2011 to 169,454 people in 2016. The rise could be due to a range of factors, including better data capture, the growing New Zealand population,4 improved visibility of and access to services, and stronger referral relationships between providers.
Figure 1: Number of people engaging with specialist services each year, 2011–2016
Source: Programme for the Integration of Mental Health Data (PRIMHD).
In 2016, specialist mental health or addiction services engaged with 3.6 percent of the New Zealand population
Number 180,000
160,000
140,000
120,000
100,000
80,000
60,000
40,000
20,000
02011 2012 2013 2014 2015 2016 Year
Clients seen by DHB only Clients seen by NGO only Clients seen by both DHB and NGO
DirMHth2016 Fig 1
3 This number includes people seen by addiction services only.
4 Between 2011 and 2016, the total New Zealand population increased by approximately 7 percent.

5Office of the Director of Mental Health Annual Report 2016
Most people access mental health services in the community. In 2016:
• 91 percent of specialist service users accessed only community mental health services
• less than 1 percent accessed only inpatient services
• the remaining 9 percent accessed a mixture of inpatient and community services (see Figure 2).
The proportion of people who received treatment only in the community increased by 5 percent between 2002 (when it was 86%) and 2016.
Figure 2: Percentage of service users accessing only community services, 1 January to 31 December 2016
Note: Includes NGOs. Source: PRIMHD data
The Mental Health Act The Mental Health Act defines the circumstances in which people may be subject to compulsory mental health assessment and treatment. It provides a framework for balancing personal rights with public interest when a person poses a serious danger to themselves or others due to mental illness.
The long title of the Act states that its purpose is to:
redefine the circumstances in which and the conditions under which persons may be subjected to compulsory psychiatric assessment and treatment, to define the rights of such persons and to provide better protection for those rights, and generally to reform and consolidate the law relating to the assessment and treatment of persons suffering from mental disorder.
The ‘Ensuring service quality’ section of this report provides data on the use of the Mental Health Act.
Most people (91 percent of all specialist service users in 2016) access mental health services in the community
DirMHth2016 Fig 2
Inpatientonly <1%
Community andinpatient 9%
Communityonly 91%
6 Office of the Director of Mental Health Annual Report 2016
Administration of the Mental Health ActThe chief statutory officer under the Mental Health Act is the Director of Mental Health, appointed under section 91. The Director is responsible for the general administration of the Mental Health Act under the direction of the Minister of Health and Director-General of Health. The Director is also the Chief Advisor, Mental Health, and is responsible for advising the Minister of Health on mental health issues.
The Mental Health Act also allows for the appointment of a Deputy Director of Mental Health.
The Director’s functions and powers under the Mental Health Act allow the Ministry to provide guidance to mental health services, supporting the strategic direction of Rising to the Challenge and a recovery-based approach to mental health.
In each DHB, the Director-General of Health appoints a director of area mental health services (DAMHS) under section 92 of the Act. The DAMHS is a senior mental health clinician responsible for administering the Mental Health Act within their DHB area. They must report to the Director of Mental Health every three months regarding the exercise of their powers, duties and functions under the Mental Health Act (Ministry of Health 2012a).
In each area, the DAMHS appoints responsible clinicians and assigns them to lead the treatment of every person subject to compulsory assessment or treatment (Ministry of Health 2012a). The DAMHS also appoints competent health practitioners as duly authorised officers to respond to people experiencing mental illness in the community who are in need of intervention. Duly authorised officers are required to provide general advice and assistance in response to requests from members of the public and the New Zealand Police. If a duly authorised officer believes that a person may be mentally disordered and may benefit from a compulsory assessment, the Mental Health Act grants the officer powers to arrange for a medical examination (Ministry of Health 2012c).
Protecting the rights of people subject to compulsory treatmentAlthough the Ministry of Health expects each DAMHS to protect the rights of people under the Mental Health Act in their area, the Mental Health Act also provides for independent monitoring mechanisms. The Minister of Health appoints qualified lawyers as district inspectors under section 94 of the Mental Health Act to protect the rights of people under the Mental Health Act, investigate alleged breaches of those rights and monitor service compliance with the Mental Health Act process. The Mental Health Act requires district inspectors to inspect services regularly and report on their activities monthly to the Director of Mental Health. From time to time, the Director can initiate an investigation under section 95 of the Mental Health Act, in which case the Act grants a district inspector powers to conduct an inquiry into a suspected failing in a person’s treatment under the Mental Health Act or in the management of services (Ministry of Health 2012b). The Mental Health Act also provides for the appointment of the Mental Health Review Tribunal, a specialist independent tribunal comprising a lawyer, a psychiatrist and a community member. If a person disagrees with their treatment under the Mental Health Act, they can apply to the Tribunal for an examination of their condition and of whether it is necessary to continue compulsory treatment. Where the Tribunal considers it appropriate, it may release the person from compulsory status.
The Mental Health Act defines the circumstances in which people may be subject to compulsory mental health assessment and treatment
If a person disagrees with their treatment under the Mental Health Act, they can make an application to the Mental Health Review Tribunal

7Office of the Director of Mental Health Annual Report 2016
Statutory safeguardsDistrict inspectors
The Minister of Health appoints lawyers as district inspectors under section 94 of the Mental Health Act to ensure people’s rights are upheld during the compulsory assessment and treatment process.
District inspectors work to protect specific rights provided to people under the Mental Health Act, address concerns of family/whānau, and investigate alleged breaches of rights, as set out in the Act.
The Office of the Director of Mental Health’s responsibilities in relation to district inspectors include:
• coordinating the appointment and reappointment of district inspectors
• managing district inspector remuneration
• receiving and responding to monthly reports from district inspectors
• organising twice-yearly national meetings of district inspectors
• facilitating inquiries under section 95 of the Mental Health Act
• implementing the findings of section 95 inquiries.
The role of district inspectors
The Act requires district inspectors to report to the DAMHS in their area within 14 days of inspecting mental health services. It also requires them to report monthly to the Director of Mental Health (the Director) on the exercise of their powers, duties and functions. These reports provide the Director with an overview of mental health services and any arising problems.
Section 95 inquiries
The Director will occasionally require a district inspector to carry out an inquiry under section 95 of the Mental Health Act. Such inquiries are generally focused on systemic issues across one or more mental health services. These inquiries typically result in the district inspector making specific recommendations. The Director considers the recommendations and later audits the DHB’s implementation of them.
The Director also acts on any recommendations that have implications for the Ministry of Health or the mental health sector.
The inquiry process is not completed until the Director considers that the DHB concerned and, if appropriate, the Ministry and all other DHBs, have satisfactorily implemented the recommendations. Two section 95 inquiries were completed during 2016. Table 1 shows the number of completed section 95 inquiry reports received by the Director of Mental Health between 2003 and 2016.
Table 1: Number of completed section 95 inquiry reports received by the Director of Mental Health, 2003–2016
2003 2004 2005 2006 2007 2008 2009 2010 2011 2012 2013 2014 2015 2016
1 2 1 4 1 1 3 2 1 1 0 0 1 2
Source: Office of the Director of Mental Health records
Number of district inspectors
As at 31 December 2016, there were 33 district inspectors throughout New Zealand. A list of current district inspectors is available on the Ministry of Health’s website (www.health.govt.nz).
District inspectors work to protect specific rights provided to people under the Mental Health Act

8 Office of the Director of Mental Health Annual Report 2016
The Mental Health Review Tribunal
The Mental Health Review Tribunal is an independent tribunal empowered by law to review compulsory treatment orders, special patient orders and restricted patient orders. If a person disagrees with their legal status or treatment under the Mental Health Act, they can apply to the Tribunal for an independent review of their condition.
The Tribunal comprises three members, one of whom must be a lawyer, one a psychiatrist and one a community member.
A selection of the Tribunal’s published cases is available online (see www.nzlii.org/nz/cases/NZMHRT). The Tribunal has carefully anonymised these cases to respect the privacy of the individuals and family/whānau involved. The intention of publication is to improve public understanding of the Tribunal’s work and of mental health law and practice.
The main function of the Tribunal is to review the condition of people in accordance with sections 79 and 80 of the Mental Health Act. Section 79 relates to people who are subject to ordinary compulsory treatment orders, and section 80 relates to the status of special patients. During the year ending 30 June 2016, the Tribunal heard 62 cases of contested treatment orders. In six cases (10 percent), a person was deemed fit to be released from compulsory status.
The Tribunal has a number of other functions under the Mental Health Act, including reviewing the condition of restricted patients (section 81), considering complaints when people are dissatisified with the outcome of a district inspector’s investigation (section 75) and appointing psychiatrists authorised to carry out second opinions under the Mental Health Act (sections 59–61).
Under section 80 of the Mental Health Act, the Tribunal makes recommendations relating to special patients to the Minister of Health or the Attorney-General, who determine whether there should be a change to the patients’ legal status.
The Tribunal may also investigate a complaint if the complainant is dissatisfied with a district inspector’s investigation. If the Tribunal decides a complaint has substance, it must report the matter to the relevant DAMHS, with appropriate recommendations. The DAMHS must then take all necessary steps to remedy the matter.
For more information about the Tribunal’s activities for the year ending 30 June 2016, see Appendix 3.
A selection of the Tribunal’s published cases is available online to improve public understanding of mental health law and practice

9Office of the Director of Mental Health Annual Report 2016
Activities for 2016Mental health sector relationshipsThe Director of Mental Health visited most DHB mental health services at least once during the reporting year. These visits give the Director an opportunity to meet with the services and understand the particular types of challenges that local mental health services are facing, while offering Ministry support and oversight.
The Office of the Director of Mental Health also maintains relationships with many parts of the mental health sector, attending and presenting at a large number of mental health sector meetings each year.
Cross-government relationshipsThe Office of the Director of Mental Health maintains strong relationships with other government agencies, working to support good clinical practice and person-centred services for people with mental health and addiction problems.
In 2016, the Office of the Director of Mental Health worked with a number of agencies on a wide range of projects, including:
• the Youth Crime Action Plan
• the Vulnerable Children’s Action Plan
• the Ministry for Vulnerable Children Oranga Tamariki (Oranga Tamariki) model of care
• the Interagency High and Complex Needs Unit
• implementing the Autism Spectrum Guidelines and resolving mental health/disability support service interface issues
• the cross-agency response for children with conduct problems
• the Oranga Tamariki Gateway Assessment project and Direct Purchasing Trial
• the Fetal Alcohol Spectrum Disorder Action Plan
• achieving compliance with United Nations conventions such as the United Nations Convention on the Rights of the Child (UNCROC)
• improving Cross-Sector Responses for Children and Youth in Crisis project
• the Police-led Gap Analysis Project
• the Prime Minister’s Youth Mental Health Project
• the Suicide Prevention Action Plan 2013–2016
• the transfer of responsibilities for psychosocial welfare in emergencies from the Ministry of Social Development to the Ministry of Health and DHBs
• transferring accountabilities for psychosocial recovery in Canterbury from the Canterbury Earthquake Recovery Authority to the Ministry of Health and Canterbury DHB
• improving the interface between the youth justice system and mental health and addiction services.
The Office of the Director of Mental Health maintains strong relationships with other government agencies

10 Office of the Director of Mental Health Annual Report 2016
Relationship with the Department of CorrectionsThe Ministry works closely with the Department of Corrections to improve health services for people detained in prisons. Prisoners often have complex mental health needs that may require more intensive support than Corrections health services can give as providers of primary health care. Regional forensic psychiatry services support Corrections to access and treat prisoners with complex mental health needs. Prisoners may be transferred to a secure forensic mental health facility for treatment in a therapeutic environment.
Relationship with the New Zealand PoliceMental health services need to promptly see people who come to the attention of police because of possible mental health problems. Police often provide the initial response to events involving people whose mental illness may render them a danger to themselves or others. It is therefore important for Police and mental health services to maintain collaborative relationships. During 2016, the Office of the Director of Mental Health continued to work with New Zealand Police to ensure that police responded appropriately to people with mental illness and their families/whānau.
Victims of Crime interagency working groupForensic mental health services have a dual role to both facilitate special patients’ rehabilitative journeys and protect members of the public, including registered victims of the special patients’ offending. The Ministry of Health works with the Ministry of Justice, New Zealand Police, Oranga Tamariki, Department of Corrections, Ministry of Business, Innovation and Employment, Ministry of Social Development, Accident Compensation Corporation and WorkSafe New Zealand on the Victims of Crime interagency working group.
Child and adolescent mental health services In April 2016, Nga Taiohi, the national youth forensic inpatient unit, was opened at Kenepuru Community Hospital near Wellington. This 10-bed secure unit is the first dedicated youth forensic inpatient unit in New Zealand, providing specialist assessment and treatment for youth who are involved with the justice system and have mental health, alcohol and other drug problems. Nga Taiohi works closely with the regional youth forensic services and the Oranga Tamariki youth justice residences around the country.
Statutory changes to health practitioner status Important legislative changes have been made to enable suitably qualified health practitioners to carry out some activities that could previously only be performed by doctors. The aim of the changes is to make health services more flexible and available. These changes also acknowledge and make better use of the skills of qualified health practitioners.
Eight separate Acts will be amended to recognise new terminology, replacing the term ‘medical practitioner’ with ‘health practitioner’, as defined by the Health Practitioners Competence Assurance Act.5 The Mental Health (Compulsory Assessment and Treatment) Act 1992 and the Misuse of Drugs Act 1975 are among the eight Acts that are being amended.
5 www.health.govt.nz/our-work/regulation-health-and-disability-system/health-practitioners-competence-assurance-act.

11Office of the Director of Mental Health Annual Report 2016
The changes include:
• the Mental Health (Compulsory Assessment and Treatment) Act 1992 will allow nurse practitioners and registered nurses working in mental health to complete a health practitioner certificate for applications under that Act (section 8b)
• in some instances, a nurse practitioner will be able to conduct an assessment examination if approved by the Director of Mental Health. The Director can delegate this approval to the Director of Area Mental Health Services
• changes to section 24 of the Misuse of Drugs Act 1975 will allow nurse practitioners, registered nurse prescribers and pharmacist prescribers working in specialist addiction services to prescribe controlled drugs for the treatment of addiction.
Changes to these two Acts come into force on 31 January 2018. The Guidelines to the Mental Health (Compulsory Assessment and Treatment) Act 1992 and other related guidance will be updated accordingly. The Ministry is also working with the sector to implement the changes to section 24 of the Misuse of Drugs Act. Informing the sector is important. There are many people who need to be aware of the changes, including service users themselves.
For more information, visit the Ministry of Health’s website and search ’changes to health practitioner status’.
Towards restraint-free mental health practiceRising to the Challenge prioritises the aim to reduce and eliminate seclusion and restraint (Ministry of Health 2012e). The Ministry has funded Te Pou o Te Whakaaro Nui (Te Pou) to develop information, guidance and training on ways to reduce and prevent the use of personal restraint, which includes:
• a restraint prevention framework, including a rationale for, and frequency of, such events
• principles and objectives that will help services to plan for reducing and preventing the use of personal restraint.
See page 33 of this report for more information on seclusion and restraint in New Zealand’s mental health services.
Safe Practice Effective Communication training programme The Safe Practice Effective Communication (SPEC) training programme was launched in November 2016. Under the leadership of the National Directors of Mental Health Nursing (DOMHN), SPEC is a collaboration between all district health boards and key stakeholders, including service user groups, Māori, and Te Pou.
SPEC has been designed with service user input and has service users as trainers and members of the programme’s governing body. The new initiative aims to provide national consistency and best quality, evidence-based therapeutic interventions for effectively reducing restraint and seclusion. It is a quality improvement mechanism.
A strategic approach to rural mental health and addiction During 2016, the Rural Health Alliance Aotearoa New Zealand (RHĀNZ) developed a framework to provide strategic guidance to organisations working to improve mental health and addiction outcomes in rural New Zealand (the Framework). The Framework contains independent advice from RHĀNZ on key mental health issues identified by rural communities and recommends future areas of support to improve rural mental health outcomes.

12 Office of the Director of Mental Health Annual Report 2016
The Ministry of Health and the Ministry for Primary Industries were asked to consider the advice provided by the Framework and provide a joint briefing on next steps to Ministers in May 2017.
Actions put in place through the Rural Mental Health Funding Initiative were consistent with the Framework and are expected to continue. The Ministry of Health is revising its strategies for mental health and addiction and suicide prevention. The Framework will provide timely input into policy development for rural mental health services.
Office of the Auditor-General performance auditDuring 2016, the Office of the Auditor-General (the OAG) carried out a performance audit, the results of which contributed to their report Mental Health: Effectiveness of the planning to discharge people from hospital,6 which was published in May 2017.
The performance audit focused on the relatively few people who are most unwell with mental health problems and require a high level of care, including care in an inpatient unit. The audit considered whether:
• planning for these people’s discharge from an inpatient unit to community care was completed as intended
• the needs identified by discharge planning were followed up after discharge
• discharge planning was helping to improve outcomes for people with acute mental health problems.
The audit covered a cohort of 20,000 people aged 20–64 years who had at least one acute mental health admission to a hospital during the four years from 2011/12 to 2014/15. The audit did not include primary mental health services; services for children, youth and older people; forensic mental health services; or those who only accessed addiction services or community mental health services. Various techniques were used, including data analysis, 110 case file reviews, 150 interviews, a survey of DHB staff and a workshop with Canterbury DHB staff. The final report also drew on stories submitted to the People’s Mental Health Review (ActionStation 2017).
The OAG report recognised that there are pressures on parts of the mental health system and support services that demand urgent attention and, potentially, innovative solutions. The report made a set of recommendations regarding discharge planning.
The report recommended that district health boards:
1. urgently find ways for inpatient and community mental health teams to work together more effectively to prepare and implement discharge plans, ensuring that all relevant people (the person to be discharged, family, other carers, and all service providers) are appropriately involved and informed
2. help staff by improving the guidance and tools to support discharge planning (including information systems) so that the necessary information can be accessed and compiled efficiently
3. regularly review the standard of discharge planning and follow-up work to identify issues and make improvements.
The report further recommended that the Ministry of Health and district health boards:
4. quickly make improvements to how they use information to monitor and report on outcomes for mental health service users
5. use the information from this monitoring to identify issues and make service improvements.
6 www.oag.govt.nz/2017/mental-health/docs/mental-health.pdf/view

13Office of the Director of Mental Health Annual Report 2016
Mental Health and Addiction Workforce Action Plan During 2016, the Mental Health and Addiction Workforce Action Plan (the Action Plan) was developed to implement a specific action in Rising to the Challenge. It was released in February 2017.
The Action Plan uses an outcomes approach that contributes to achieving the vision of the New Zealand Health Strategy (Ministry of Health 2016). For the mental health and addiction sector, this means enabling people to thrive and experience wellbeing wherever they live and regardless of their circumstances.
Together with the Mental Health and Wellbeing Outcome Framework and the Commissioning Framework, it will help us reshape our system to focus on people and what matters to them.
Our workforce is our most valuable resource, and achieving our vision depends on a capable and motivated workforce that supports people and their families and whānau to get the best outcomes.
The Action Plan recognises the importance of a combined effort in addressing the social determinants of health. It proposes working across health, justice and social sectors to ensure equitable and positive outcomes for all New Zealanders. It includes actions to develop a workforce with the skills, knowledge, competencies and attitudes needed to design and deliver integrated and innovative responses.
The actions outlined in this Plan will support the primary health care, community and specialist workforce to be well equipped, integrated, competent and capable to focus on improving health and wellbeing. It will guide decisions about investment and resourcing for the next five years and is relevant to all people working to improve outcomes for those with mental health and addiction issues.
New Zealanders returning from AustraliaIn December 2014, the Australian Government passed legislative changes that set a lower threshold for mandatory cancellation of visas for non-citizens. The new threshold includes non-citizens who have a substantial criminal record, who have been found unfit to stand trial and/or who have been acquitted of a crime on grounds of insanity.
During 2016, the New Zealand Government and the Australian Government conducted their first annual review of the information-sharing arrangement with the Australian Government around removals and deportations between Australia and New Zealand. The Ministry of Health is an ‘approved agency’ under this arrangement: it may receive advance notice of New Zealanders being deported, including their health information, to identify significant mental or physical health needs that will require a health response on their return.
The Ministry of Health contracted Counties Manukau DHB, as the Ministry’s agent, to provide clinical review and triage of health information on deported New Zealanders to ensure that those with significant health issues would receive follow-up and referral to health services on their return.

14 Office of the Director of Mental Health Annual Report 2016
Substance Addiction (Compulsory Assessment and Treatment) BillThe Substance Addiction (Compulsory Assessment and Treatment) Bill was introduced to Parliament in December 2015, and subsequently referred to the Health Select Committee. In 2016, the Bill progressed through two readings and was presented to the Committee of the whole House in November 2016.
The Substance Addiction (Compulsory Assessment and Treatment) Act (‘the Act‘) was enacted by Parliament in February 2017 and will come into effect on 21 February 2018. The Act replaces the Alcoholism and Drug Addiction Act 1966.
The Act will provide a mechanism for the compulsory treatment of people with a severe substance addiction and with severely impaired capacity to make decisions about treatment for that addiction. The intention of the Act is to protect such people from serious harm, stabilise their health, protect and enhance their mana and dignity and restore their capacity to make informed decisions about further treatment and substance use. Most of these people are likely to be known to health services already. The Act provides for compulsory treatment as an option of last resort.
The Ministry is currently working with the sector to prepare for implementing the Act.
Action 9(d) of the Disability Action Plan 2014–2018In 2016, the Office of the Director of Mental Health, in partnership with Balance Aotearoa, led Action 9(d) of the Disability Action Plan 2014–2018, to ‘explore how the Mental Health Act relates to the NZ Bill of Rights Act and the Convention on the Rights of People with Disabilities’. Action 9(d) was completed, with reporting back to Ministers on the findings in July 2017.
The work was informed by an external reference group representing diverse perspectives, feedback from a targeted consultation process and analysis of the legal and rights issues. The Office of the Director of Mental Health and Balance Aotearoa were particularly interested in getting a tangata whaiora/service user perspective to better understand the impacts of the Mental Health Act on those who are subject to it.
Across the range of perspectives represented, some key issues and concerns were consistently raised, and priorities for action were identified. The feedback will inform existing work programmes as well as new work to ensure the rights of service users/tāngata whaiora are promoted. The work will involve ongoing engagement with tāngata whaiora/service users, the sector, independent monitoring agencies and other agencies.
Other investigations Report on Waikato District Health Board Mental Health and Addiction Services In April 2016, the Director of Mental Health released a report on the formal inspection of Waikato mental health services under section 99 of the Mental Health (Compulsory Assessment and Treatment) Act 1992.
The investigation was prompted by public concern following a series of serious events affecting the service in 2015: the suicide of one patient, the unplanned departures of three mental health patients in

15Office of the Director of Mental Health Annual Report 2016
two incidents over two months, and the employment of an overseas doctor as a psychiatrist who now faces Court charges related to identity fraud.
Apart from the employment of the overseas doctor, the inspection did not report specifically on those incidents that were being investigated separately. However, it did consider the overall organisation, governance and delivery of mental health services in the Waikato DHB area and examine whether there were any systemic issues impacting the service.
The inspection team acknowledged that there were families who had been distressed by these incidents and subsequent publicity. The inspection report found that, although the organisation, governance and delivery was generally sound, it had a number of recommendations for Waikato mental health services.
Mental health inquiry into care of special patient Manjit SinghAn external review into the treatment and management of a forensic mental health patient, Manjit Singh, by Auckland’s Mason Clinic was carried out in 2016.
Mr Singh was a special patient under the Mental Health Act after being found not guilty by reason of insanity of serious charges relating to a 2008 attack on his partner, when he breached the conditions of his leave and again attacked his former partner in November last year.
A summary of the inquiry report and its full recommendations have been released – other parts of the inquiry report, relating to the detailed clinical treatment of Mr Singh, have not been made publicly available, as they were assessed and deemed not to be in the public interest.
In July 2016, Mr Singh was sentenced to jail for seven years, and was to be detained in hospital as a special patient under the Mental Health Act while mentally unwell. The time spent in a secure mental health service counts towards his sentence.
More information regarding these investigations can be found on the Ministry of Health’s website www.health.govt.nz/news-media/media-releases/all-recommendations-accepted-mental-health-inquiry

16 Office of the Director of Mental Health Annual Report 2016
Ensuring service qualityAs a sector, we are working together to get better mental health care to more people sooner. Central government, DHBs, NGOs, international bodies (such as the United Nations and the World Health Organization (WHO)) and independent watchdogs (such the Office of the Ombudsman and district inspectors) all work in collaboration to achieve this goal.
Actively monitoring the performance of DHBs and NGOs is vital to ensuring service quality and safety. The Ministry of Health – and the wider government – set goals and targets for the sector that are aimed at improving outcomes for the people who use mental health services. Reporting from the sector is integral to this process, as it allows the Ministry to measure progress against these goals.
This section presents statistics on a number of mental health indicators concerned with general mental health service use, as well as compulsory care under the Mental Health Act.
Statistics cover consumer satisfaction, waiting times, transition plans, the Mental Health Act, Māori and the Mental Health Act, family/whānau consultation and the Mental Health Act, seclusion in inpatient units, special patients, serious adverse events, electroconvulsive therapy (ECT) and opioid substitution treatment (OST).
Specialist mental health services Consumer experience Since 2006, the Ministry has conducted national mental health consumer satisfaction surveys as one measurement of DHB service quality and consumer outcomes. Survey participants have received treatment from specialist mental health community services in DHBs around New Zealand.
In 2006, half of the DHBs in New Zealand participated in the survey, which gathered a total of 596 respondents. In 2015, there was a shift in method from paper-based survey to the MARAMA electronic real-time survey developed by the Health and Disability Commission. In the 2015/16 financial year, 10 DHBs participated in the paper-based survey, with 1317 valid responses. MARAMA, which is collated on a calendar-year basis, had 15 DHBs participating in real-time surveys with 6610 responses in the 2016 calendar year.7
Survey results
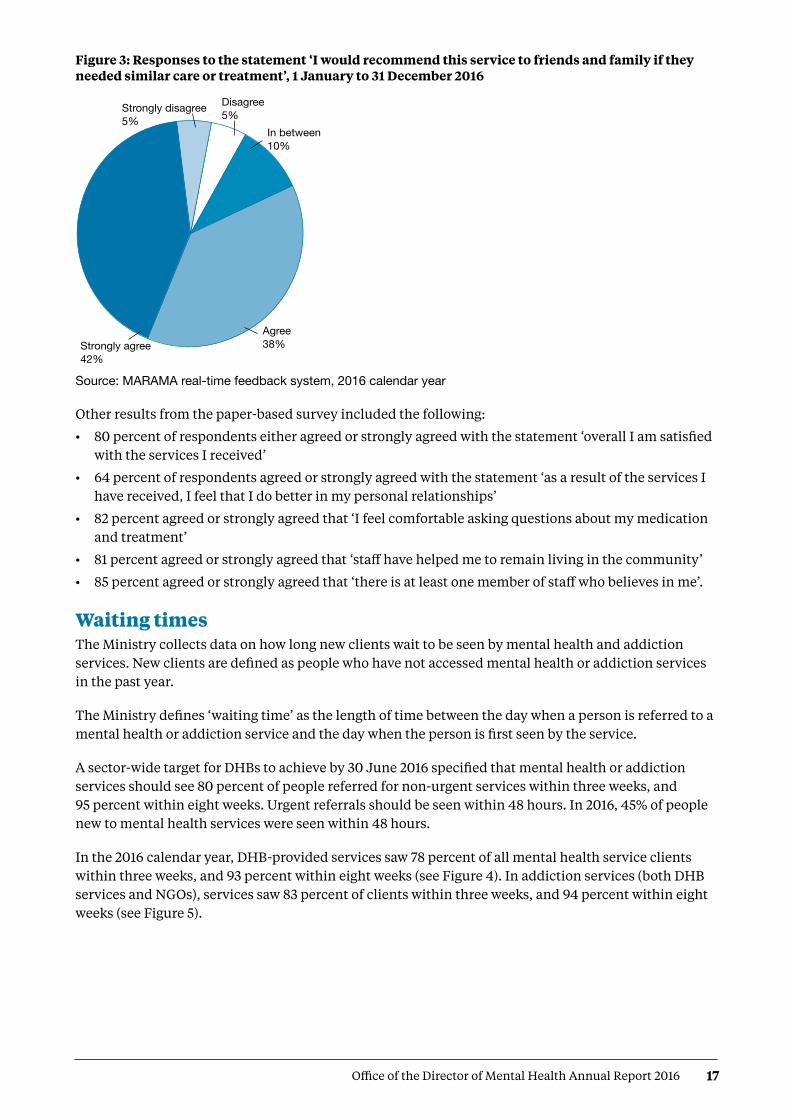
In the 2016 calandar year, 79 percent agreed or strongly agreed that they ‘would recommend the service to friends and family if they needed similar care or treatment’(see Figure 3).8
As a sector we are working together to get better mental health care to more people sooner
7 Some DHBs submitted responses to both surveys.
8 MARAMA real-time feedback system, 2016 calendar year.
17Office of the Director of Mental Health Annual Report 2016
Figure 3: Responses to the statement ‘I would recommend this service to friends and family if they needed similar care or treatment’, 1 January to 31 December 2016
Source: MARAMA real-time feedback system, 2016 calendar year
Other results from the paper-based survey included the following:
• 80 percent of respondents either agreed or strongly agreed with the statement ‘overall I am satisfied with the services I received’
• 64 percent of respondents agreed or strongly agreed with the statement ‘as a result of the services I have received, I feel that I do better in my personal relationships’
• 82 percent agreed or strongly agreed that ‘I feel comfortable asking questions about my medication and treatment’
• 81 percent agreed or strongly agreed that ‘staff have helped me to remain living in the community’
• 85 percent agreed or strongly agreed that ‘there is at least one member of staff who believes in me’.
Waiting timesThe Ministry collects data on how long new clients wait to be seen by mental health and addiction services. New clients are defined as people who have not accessed mental health or addiction services in the past year.
The Ministry defines ‘waiting time’ as the length of time between the day when a person is referred to a mental health or addiction service and the day when the person is first seen by the service.
A sector-wide target for DHBs to achieve by 30 June 2016 specified that mental health or addiction services should see 80 percent of people referred for non-urgent services within three weeks, and 95 percent within eight weeks. Urgent referrals should be seen within 48 hours. In 2016, 45% of people new to mental health services were seen within 48 hours.
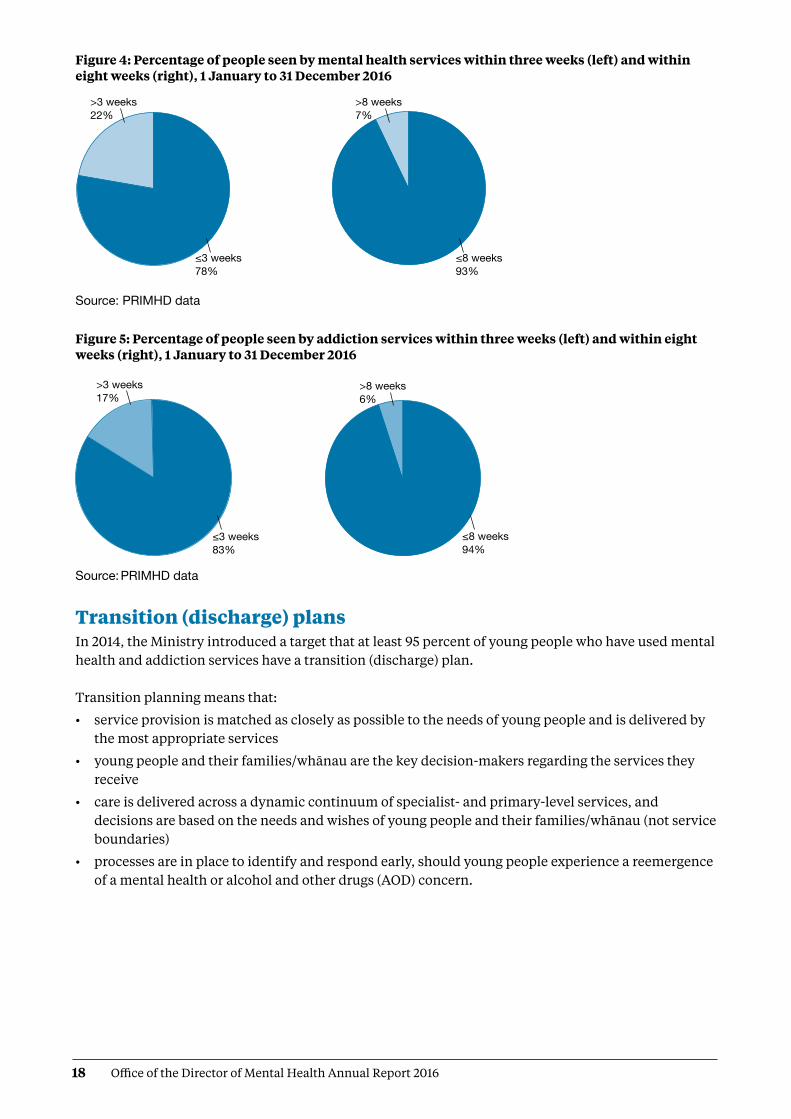
In the 2016 calendar year, DHB-provided services saw 78 percent of all mental health service clients within three weeks, and 93 percent within eight weeks (see Figure 4). In addiction services (both DHB services and NGOs), services saw 83 percent of clients within three weeks, and 94 percent within eight weeks (see Figure 5).
DirMHth2016 Fig 3
Strongly agree 42%
Agree 38%
In between10%
Strongly disagree 5%
Disagree 5%
18 Office of the Director of Mental Health Annual Report 2016
Figure 4: Percentage of people seen by mental health services within three weeks (left) and within eight weeks (right), 1 January to 31 December 2016
Source: PRIMHD data
Figure 5: Percentage of people seen by addiction services within three weeks (left) and within eight weeks (right), 1 January to 31 December 2016
Source: PRIMHD data
Transition (discharge) plansIn 2014, the Ministry introduced a target that at least 95 percent of young people who have used mental health and addiction services have a transition (discharge) plan. Transition planning means that:
• service provision is matched as closely as possible to the needs of young people and is delivered by the most appropriate services
• young people and their families/whānau are the key decision-makers regarding the services they receive
• care is delivered across a dynamic continuum of specialist- and primary-level services, and decisions are based on the needs and wishes of young people and their families/whānau (not service boundaries)
• processes are in place to identify and respond early, should young people experience a reemergence of a mental health or alcohol and other drugs (AOD) concern.
≤8 weeks 93%
≤3 weeks 78%
>3 weeks 22%
>8 weeks 7%
DirMHth2016 Fig 4
DirMHth2016 Fig 5
≤8 weeks 94%
≤3 weeks 83%
>8 weeks 6%
>3 weeks 17%

19Office of the Director of Mental Health Annual Report 2016
Figure 6 shows the percentage of all service users with a transition plan as at 31 December 2016.
Figure 6: Percentage of service users with a transition plan, by DHB, 1 January to 31 December 2016
Note: Lakes DHB data is based on Q2 data. Nelson Marlborough DHB did not report on transition plans for 2016.
Source: DHB quarterly reporting data
Use of the Mental Health ActThe Mental Health Act defines the circumstances under which people may be subject to compulsory mental health assessment and treatment. In 2016:
• 10,311 people (approximately 6.1 percent of specialist mental health and addiction service users) were subject to the Mental Health Act9 on the last day of 2016, approximately 5,163 people were subject to either compulsory assessment or compulsory treatment under the Mental Health Act
• use of the Mental Health Act varied across DHBs
• males were more likely to be subject to the Mental Health Act than females
• people aged 25–34 years were the most likely to be subject to compulsory treatment, and people over 65 years of age were the least likely
• Māori were more likely to be assessed or treated under the Mental Health Act than non-Māori.
The Mental Health Act processThe compulsory assessment and treatment process begins with a referral and an initial assessment by a psychiatrist. If the psychiatrist believes a person fits the statutory criteria, the person will become subject to the Act and will receive further assessment accordingly.
Target
DirMHth2016 Fig 6
Percentage 1009080706050403020100
DHB
Auck
land
Bay
of P
lent
y
Can
terb
ury
Cap
ital &
Coa
st
Cou
ntie
s M
anuk
au
Haw
ke’s
Bay
Hut
t Val
ley
Lake
s
Mid
Cen
tral
Nor
thla
nd
Sout
h C
ante
rbur
y
Sout
hern
Tairāwhiti
Tara
naki
Wai
kato
Wai
rara
pa
Wai
tem
ata
Wes
t Coa
st
Wha
ngan
uiIn 2016, 10,311 people in New Zealand were subject to the Mental Health Act
9 Mental Health Act sections 11, 13, 14(4), 15(1), 15(2), 29, 30 and 31. It should be noted that some legal status statistics for 2016 are over-counted due to a known data issue when reporting transfers between DHBs. This over count is estimated to affect less than 1% of the legal status records used to collate the statistics published in this report.
20 Office of the Director of Mental Health Annual Report 2016
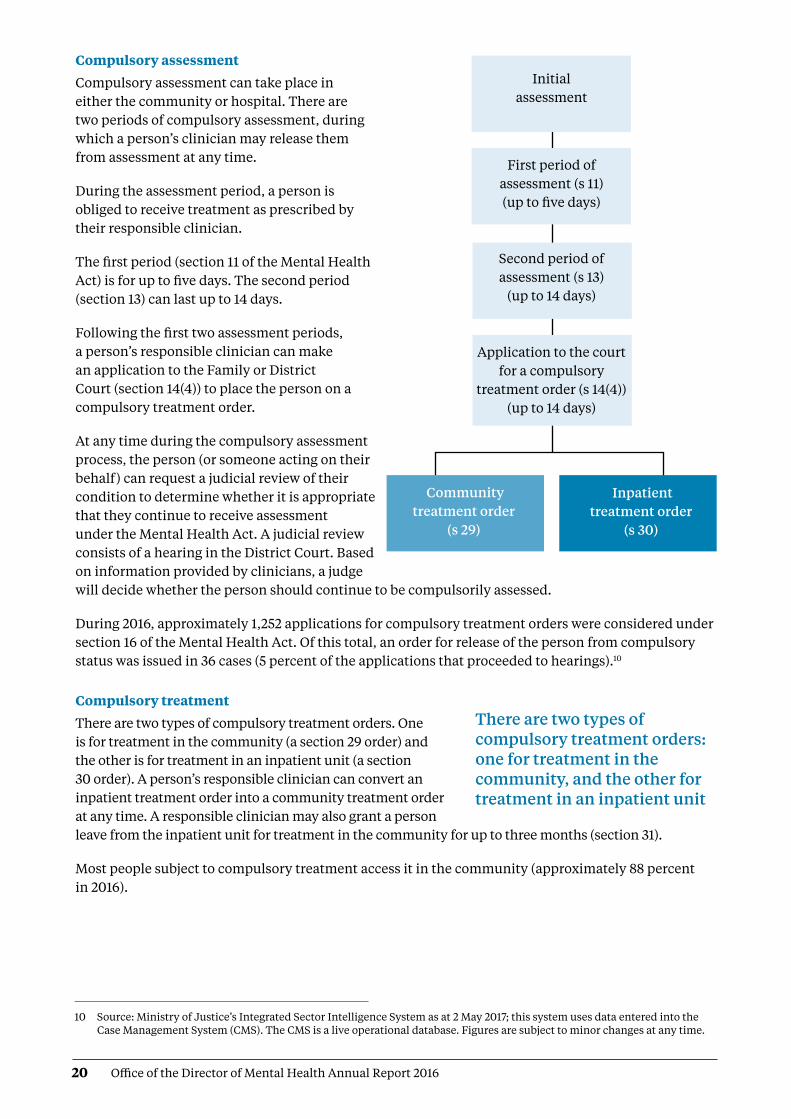
Compulsory assessment
Compulsory assessment can take place in either the community or hospital. There are two periods of compulsory assessment, during which a person’s clinician may release them from assessment at any time.
During the assessment period, a person is obliged to receive treatment as prescribed by their responsible clinician.
The first period (section 11 of the Mental Health Act) is for up to five days. The second period (section 13) can last up to 14 days.
Following the first two assessment periods, a person’s responsible clinician can make an application to the Family or District Court (section 14(4)) to place the person on a compulsory treatment order.
At any time during the compulsory assessment process, the person (or someone acting on their behalf) can request a judicial review of their condition to determine whether it is appropriate that they continue to receive assessment under the Mental Health Act. A judicial review consists of a hearing in the District Court. Based on information provided by clinicians, a judge will decide whether the person should continue to be compulsorily assessed.
During 2016, approximately 1,252 applications for compulsory treatment orders were considered under section 16 of the Mental Health Act. Of this total, an order for release of the person from compulsory status was issued in 36 cases (5 percent of the applications that proceeded to hearings).10
Compulsory treatment
There are two types of compulsory treatment orders. One is for treatment in the community (a section 29 order) and the other is for treatment in an inpatient unit (a section 30 order). A person’s responsible clinician can convert an inpatient treatment order into a community treatment order at any time. A responsible clinician may also grant a person leave from the inpatient unit for treatment in the community for up to three months (section 31).
Most people subject to compulsory treatment access it in the community (approximately 88 percent in 2016).
Initial assessment
First period of assessment (s 11) (up to five days)
Second period of assessment (s 13)
(up to 14 days)
Application to the court for a compulsory
treatment order (s 14(4)) (up to 14 days)
Community treatment order
(s 29)
Inpatient treatment order
(s 30)
There are two types of compulsory treatment orders: one for treatment in the community, and the other for treatment in an inpatient unit
10 Source: Ministry of Justice’s Integrated Sector Intelligence System as at 2 May 2017; this system uses data entered into the Case Management System (CMS). The CMS is a live operational database. Figures are subject to minor changes at any time.

21Office of the Director of Mental Health Annual Report 2016
2016 statisticsOn the last day of 2016, 5,163 people were subject to either compulsory assessment or compulsory treatment.11
In New Zealand in each month of 2016, on average, the assessment provisions of the Mental Health Act were applied as follows.12
In New Zealand on a given day in 2016, on average, the treatment provisions of the Mental Health Act were applied as follows.13
Compulsory assessment and treatment by district health board
Table 2 shows the average number of people per month in 2016 who were required to undergo assessment under the Mental Health Act, by DHB. Table 3 shows the average number of people subject to a compulsory treatment order on a given day in 2016, again by DHB. The figures that follow also present the average number of people subject to a compulsory treatment order on a given day, but focus specifically on community treatment orders (Figure 7) and inpatient treatment orders (Figure 8) respectively.
Section 11557
people were subject to an initial assessment
12 people per 100,000 population
Section 13572
people were subject to a second period of assessment
12 people per 100,000 population
Section 14(4)402
people were subject to an application for a compulsory treatment order
9 people per 100,000 population
Section 294,085
people were subject to a community treatment order
87 people per 100,000 population
Section 30589
people were subject to an inpatient treatment order
12 people per 100,000 population
Section 31157
people were on temporary leave from an inpatient unit
3 people per 100,000 population
11 Source: PRIMHD data, extracted on 26 July 2017.
12 Source: PRIMHD data, extracted on 26 July 2017, except for data from Southern DHB, which was supplied manually.
13 Source: PRIMHD data, extracted on 26 July 2017, except for data from Southern and Counties Manukau DHBs, which was supplied manually. ‘On a given day’ is the average of the last day of each month.

22 Office of the Director of Mental Health Annual Report 2016
Table 2: Average number of people per 100,000 per month required to undergo assessment under sections 11, 13 and 14(4) of the Mental Health Act, by DHB, 1 January to 31 December 2016
DHB s 11 s 13 s 14(4)
Auckland 14 17 13
Bay of Plenty 14 11 4
Canterbury 11 11 7
Capital & Coast 13 14 9
Counties Manukau 11 13 9
Hawke’s Bay 12 11 7
Hutt Valley 16 15 8
Lakes 12 11 7
MidCentral 14 12 14
Nelson Marlborough 9 8 8
DHB s 11 s 13 s 14(4)
Northland 14 18 14
South Canterbury 6 6 4
Southern 11 9 5
Tairāwhiti 12 14 14
Taranaki 14 10 4
Waikato 19 17 10
Wairarapa 7 4 4
Waitemata 9 10 8
West Coast 14 14 8
Whanganui 12 11 6
National 12 12 9
Source: PRIMHD data, extracted on 26 July 2017, except for data from Southern DHB, which was supplied manually
Table 3: Average number of people per 100,000 on a given day* subject to sections 29, 30 and 31 of the Mental Health Act, by DHB, 1 January to 31 December 2016
DHB s 29 s 30 s 31
Auckland 106 8 0
Bay of Plenty 46 16 6
Canterbury 64 17 5
Capital & Coast 113 27 4
Counties Manukau 84 11 3
Hawke’s Bay 141 15 16
Hutt Valley 72 5 1
Lakes 149 11 9
MidCentral 70 22 1
Nelson Marlborough 59 9 –
DHB s 29 s 30 s 31
Northland 158 8 6
South Canterbury 82 5 4
Southern 73 10 4
Tairāwhiti 153 7 4
Taranaki 70 2 2
Waikato 114 15 2
Wairarapa 79 – –
Waitemata 80 12 2
West Coast 74 6 4
Whanganui 85 24 3
National average 87 12 3
Note: * ‘On a given day’ is the average of the last day of each month.Source: PRIMHD data, extracted on 26 July 2017, except for data from Southern and Counties Manukau DHBs,
which was supplied manually

23Office of the Director of Mental Health Annual Report 2016
Figure 7: Average number of people per 100,000 on a given day* subject to a community treatment order (section 29 of the Mental Health Act), by DHB, 1 January to 31 December 2016
Notes: * ‘On a given day’ is the average of the last day of each month. Confidence intervals (for 99 percent confidence) have been used to aid interpretation. Where a DHB
region’s confidence interval crosses the national average, this means the DHB’s rate was not statistically significantly different to the national average.
Source: PRIMHD data, extracted on 26 July 2017, except for data from Southern and Counties Manukau DHBs, which was supplied manually
Figure 8: Average number of people per 100,000 on a given day* subject to an inpatient treatment order (section 30 of the Mental Health Act), by DHB, 1 January to 31 December 2016
Notes: * ‘On a given day’ is the average of the last day of each month. Confidence intervals (for 99 percent confidence) have been used to aid interpretation. Where a DHB
region’s confidence interval crosses the national average, this means the DHB’s rate was not statistically significantly different to the national average.
Source: PRIMHD data, extracted on 26 July 2017, except for data from Southern and Counties Manukau DHBs, which was supplied manually
National average
DirMHth2016 Fig 7
DHB
Rate250
200
150
100
50
0
Auck
land
Bay
of P
lent
y
Can
terb
ury
Cap
ital &
Coa
st
Cou
ntie
s M
anuk
au
Haw
ke’s
Bay
Hut
t Val
ley
Lake
s
Mid
Cen
tral
Nel
son
Mar
lbor
ough
Nor
thla
nd
Sout
h C
ante
rbur
y
Sout
hern
Tairāwhiti
Tara
naki
Wai
kato
Wai
rara
pa
Wai
tem
ata
Wes
t Coa
st
Wha
ngan
ui
DirMHth2016 Fig 8
National average
DHB
Auck
land
Bay
of P
lent
y
Can
terb
ury
Cap
ital &
Coa
st
Cou
ntie
s M
anuk
au
Haw
ke’s
Bay
Hut
t Val
ley
Lake
s
Mid
Cen
tral
Nel
son
Mar
lbor
ough
Nor
thla
nd
Sout
h C
ante
rbur
y
Sout
hern
Tairāwhiti
Tara
naki
Wai
kato
Wai
rara
pa
Wai
tem
ata
Wes
t Coa
st
Wha
ngan
uiRate50
45
40
35
30
25
20
15
10
5
0
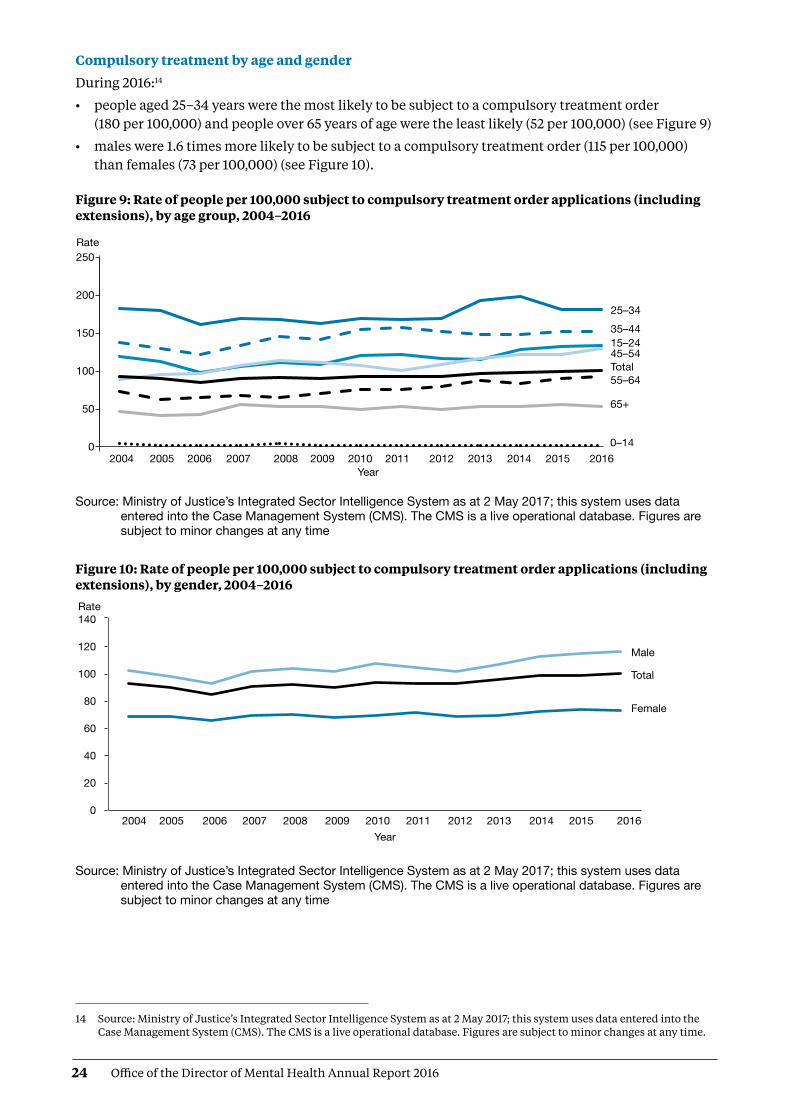
24 Office of the Director of Mental Health Annual Report 2016
Compulsory treatment by age and gender
During 2016:14
• people aged 25–34 years were the most likely to be subject to a compulsory treatment order (180 per 100,000) and people over 65 years of age were the least likely (52 per 100,000) (see Figure 9)
• males were 1.6 times more likely to be subject to a compulsory treatment order (115 per 100,000) than females (73 per 100,000) (see Figure 10).
Figure 9: Rate of people per 100,000 subject to compulsory treatment order applications (including extensions), by age group, 2004–2016
Source: Ministry of Justice’s Integrated Sector Intelligence System as at 2 May 2017; this system uses data entered into the Case Management System (CMS). The CMS is a live operational database. Figures are subject to minor changes at any time
Figure 10: Rate of people per 100,000 subject to compulsory treatment order applications (including extensions), by gender, 2004–2016
Source: Ministry of Justice’s Integrated Sector Intelligence System as at 2 May 2017; this system uses data entered into the Case Management System (CMS). The CMS is a live operational database. Figures are subject to minor changes at any time
DirMHth2016 Fig 9
Rate 250
200
150
100
50
0
25–3435–4415–2445–54Total55–64
65+
0–142004 2005 2006 2007 2008 2009 2010 2011 2012 2013 2014 2015 2016
Year
DirMHth2016 Fig 10
Rate140
120
100
80
60
40
20
02004 2005 2006 2007 2008 2009 2010 2011 2012 2013 2014 2015 2016
Year
Male
Total
Female
14 Source: Ministry of Justice’s Integrated Sector Intelligence System as at 2 May 2017; this system uses data entered into the Case Management System (CMS). The CMS is a live operational database. Figures are subject to minor changes at any time.

25Office of the Director of Mental Health Annual Report 2016
Māori and the Mental Health ActThis section of the report presents statistics on Māori subject to community treatment orders (section 29 of the Mental Health Act) and inpatient treatment orders (section 30) in 2016. These statistics further underline the need for the mental health sector to engage in meaningful action to address the disparity of mental health outcomes for Māori in New Zealand. 15
In summary, in 2016:
• Māori were 3.6 times more likely than non-Māori to be subject to a community treatment order, and 3.4 times more likely to be subject to an inpatient treatment order16
• Māori males were the population group most likely to be subject to community and inpatient treatment orders (compared to non-Māori males, and Māori and non-Māori females)
• the ratio of Māori to non-Māori subject to community and inpatient treatment orders varied by DHB
• on average, Māori and non-Māori remained on community and inpatient treatment orders for similar periods of time.
The high rate of Māori subject to compulsory treatment ordersThe high rate of Māori subject to compulsory treatment orders is a complex issue. Māori make up approximately 16 percent of New Zealand’s population, yet they account for 27 percent of all mental health service users.17
The national mental health prevalence study, Te Rau Hinengaro (Oakley Browne et al 2006), showed that Māori experience the highest levels of mental health disorder overall. They are also more likely to experience serious disorders and co-morbidities than non-Māori. In 2016, Māori access rates to services exceeded those of other groups (6.1 percent of Māori accessed mental health services in 2016, compared with 3.1 percent of non-Māori).18 These higher access rates are likely to be a contributing factor to higher rates of Māori under compulsory treatment orders.
Other demographic features relevant to the high rate of Māori service users include the youthfulness of the Māori population (approximately half of the population is under 25 years of age) and the disproportionate representation of Māori in low socioeconomic groups (two-thirds live in deprivation deciles 7–10).
Analysis has shown that these demographic factors do not completely account for the high rate of Māori with serious mental illness (ie, if Māori had the same age structure and level of socioeconomic privilege as people in other groups, their rates of mental disorder would still be higher) (Oakley Browne et al 2006).
The high rate of Māori subject to compulsory treatment orders is a complex issue
15 This is a specific action outlined in Rising to the Challenge (Ministry of Health 2012e). In addition, the number of Māori subject to section 29 of the Mental Health Act is now an indicator in the Māori Health Plans that the Ministry of Health requires every DHB to produce.
16 These ratios are based on the age-standardised rates of the Māori and non-Māori populations.
17 Source: PRIMHD data, extracted on 27 July 2017. This applies to both voluntary service users and those treated under the Mental Health Act.
18 Source: PRIMHD data, extracted 26 July 2017.
26 Office of the Director of Mental Health Annual Report 2016
What other factors are involved in the disparity?Elder and Tapsell (2013) emphasise that we need more research to better understand the Māori experience of the Mental Health Act and why Māori are over-represented in compulsory treatment. They suggest that the following are important questions for the sector to consider.
• Are Māori receiving differential treatment in the mental health system?
• How can we build a more culturally competent workforce and reduce cultural bias from formulations of mental illness?
• Are whānau of tāngata whaiora (people seeking wellness) being sufficiently engaged by mental health services?
Māori experiences of the Mental Health Act and acute mental health care In June 2015, Te Rau Matatini facilitated a one-day hui with 10 tāngata whaiora to better understand Māori experiences of the Mental Health Act and acute mental health care (Baker 2015).
Some tāngata whaiora described using the Act as a ‘bargaining tool’ to appease clinicians and more quickly gain release from the inpatient service in which they were receiving treatment. Others described the Act as providing a ‘false sense of security’ in terms of access to medication. Participants also talked of:
• not understanding the compulsory assessment and treatment process
• experiencing the opposite of what clinicians advised was going to happen under the Act
• experiencing overt discrimination in the community, such as disproportionately harsh treatment by Police and refusal of accommodation and employment, due to the stigma that continues to surround compulsory treatment orders
• struggling to be released from the Act.
With regard to acute mental health care, tāngata whaiora described its restrictive and disempowering nature, and their sense that the treatment they received was more closely aligned with the clinicians’ needs than their own. It is clear that the sector needs to actively address these issues in order to make mental health care for Māori as empowering an experience as possible. At the hui, tāngata whaiora identified a number of solutions to improve Māori experiences of mental health care, including:
• a holistic approach to service provision, incorporating tīkanga Māori (Māori customs), te reo Māori (Māori language), mātauranga Māori (Māori knowledge) and increased whānau involvement
• the provision of acute mental health care in alternative, less restrictive environments
• the formation of a national body of Māori with lived experience of mental health care to improve advocacy for tāngata whaiora, increase representation of Māori consumer advisors in mental health services and influence policy and decision-making.
Māori and compulsory treatment orders by district health boardFigures 11 and 12 show variation across New Zealand in terms of the disparities between Māori and non-Māori subject to compulsory treatment orders in 2016. With regard to community treatment orders, the Māori to non-Māori rate ratio ranged from 1.8:1 (in West Coast DHB) to 4.4:1 (in Auckland and Waikato DHBs). With regard to inpatient treatment orders, the rate ratio ranged from 1.3:1 (in Nelson Marlborough DHB) to 4.9:1 (in Waikato DHB).
Are Māori receiving differential treatment in the mental health system?
Tāngata whaiora called for the formation of a national body of Māori with lived experience of mental health care

27Office of the Director of Mental Health Annual Report 2016
These numbers are difficult to interpret, because it is hard to define an ideal rate ratio for a given population or DHB. However, for comparative purposes, a line of no difference has been included in the figures. The figures emphasise that we need in-depth, area-specific knowledge to understand the particular disparities around the country and what could be done at a local level to address them.
Figure 11: Rate ratio of Māori to non-Māori subject to a community treatment order (section 29) under the Mental Health Act, by DHB, 1 January to 31 December 2016
Notes: Rates per 100,000 are age-standardised to account for differences in the population structures of the DHBs. Confidence intervals (for 99 percent confidence) have been used to aid interpretation. Where a DHB
region’s confidence interval crosses the national average, this means the DHB’s rate was not statistically significantly different to the national average.
Because Counties Manukau, Southern and Tairāwhiti DHBs submitted data manually, the rate ratios for these DHBs were not able to be represented in the above graph. The (non-age standardised) rate ratios for Counties Manukau, Southern and Tairāwhiti DHBs were 3.6, 2.4 and 2.9 respectively.
Source: PRIMHD data, extracted on 26 July 2017, except for Counties Manukau, Southern and Tairāwhiti DHBs, which submitted data manually
8
7
6
5
4
3
2
1
0
DirMHth2016 Fig 11
Rate ratio
National average
No difference (1:1)
Auck
land
Bay
of P
lent
y
Can
terb
ury
Cap
ital &
Coa
st
Haw
ke’s
Bay
Hut
t Val
ley
Lake
s
Mid
Cen
tral
Nel
son
Mar
lbor
ough
Nor
thla
nd
Sout
h C
ante
rbur
y
Tara
naki
Wai
kato
Wai
rara
pa
Wai
tem
ata
Wes
t Coa
st
Wha
ngan
ui
DHB

28 Office of the Director of Mental Health Annual Report 2016
Figure 12: Rate ratio of Māori to non-Māori subject to an inpatient treatment order (section 30) under the Mental Health Act, by DHB, 1 January to 31 December 2016
Notes: Rates per 100,000 are age-standardised to account for differences in the population structures of the DHBs.
Confidence intervals (for 99 percent confidence) have been used to aid interpretation. Where a DHB region’s confidence interval crosses the national average, this means the DHB’s rate was not statistically significantly different to the national average.
Because Counties Manukau and Southern DHBs submitted data manually, the rate ratios for these DHBs were not able to be represented in the above graph. The (non-age standardised) rate ratios for Counties Manukau and Southern DHBs were 3.2 and 2.1 respectively.
Source: PRIMHD data, extracted on 10 June 2016, except for Counties Manukau and Southern DHBs, which submitted data manually
Gender, ethnicity and compulsory treatmentIn 2016, Māori males were the population group most likely to be subject to community and inpatient treatment orders. In particular, in 2016, Māori males were almost four times more likely to be subject to a community treatment order (section 29) than non-Māori males. Table 4 and Figure 13 present information on age-standardised rates of community and inpatient treatment orders by gender and ethnicity.
Table 4: Age-standardised rates of Māori and non-Māori subject to community and inpatient treatment orders (sections 29 and 30) under the Mental Health Act, by gender, 1 January to 31 December 2016
Community treatment orders Inpatient treatment orders
Male Female Male Female
Māori 460 205 143 69
Non-Māori 118 61 38 23
Rate ratio Māori: non-Māori 3.9:1 3.3:1 3.8:1 3.0:1
Note: Rates per 100,000 are age-standardised. Source: PRIMHD data, extracted on 26 July 2017
Rate ratio20
18
16
14
12
10
8
6
4
2
0
National averageNo difference (1:1)
DirMHth 2016 Fig 12
Auck
land
Bay
of P
lent
y
Can
terb
ury
Cap
ital &
Coa
st
Haw
ke’s
Bay
Hut
t Val
ley
Lake
s
Mid
Cen
tral
Nel
son
Mar
lbor
ough
Nor
thla
nd
Sout
h C
ante
rbur
y
Tairāwhiti
Tara
naki
Wai
kato
Wai
rara
pa
Wai
tem
ata
Wes
t Coa
st
Wha
ngan
ui
DHB
L

29Office of the Director of Mental Health Annual Report 2016
Figure 13: Age-standardised rates of Māori and non-Māori subject to community and inpatient treatment orders (sections 29 and 30) under the Mental Health Act, by gender, 1 January to 31 December 2016
Note: Rates per 100,000 are aged-standardised.Source: PRIMHD data, extracted on 26 July 2017
Length of time spent subject to compulsory treatment ordersOn average, Māori and non-Māori remain on compulsory treatment orders for a similar amount of time (see Figure 14). For community treatment orders commenced between 2009 and 2014, 80 percent of Māori and 81 percent of non-Māori were subject to the order for less than a year. For inpatient treatment orders commenced between 2009 and 2014, 96 percent of Māori and non-Māori were subject to the order for less than a year.
Figure 14: Length of time spent subject to community and inpatient treatment orders (sections 29 and 30) under the Mental Health Act for Māori and non-Māori, 2009–2014
Note: The data refers to treatment orders started between 2009 and 2014. 2014 is the most recent year referred to in this figure, as this analysis requires at least two years to have elapsed to determine the number of people who have remained on a treatment order for two or more years.
Source: PRIMHD data, extracted on 27 July 2017. Southern DHB supplied data manually
MaoriNon-Maori
ODMH2016 Fig13
Age-standardised rate500
450
400
350
300
250
200
150
100
50
0Males Females Males Females
s29 s30
DirMHth2016 Fig 14
Percentage(clients seen)
100
90
80
70
60
50
40
30
20
10
0 Less than 1 year 1–2 years 2+ years Length of time
s29 Maori
s29 Non-Maori
s30 Maori
s30 Non-Maori

30 Office of the Director of Mental Health Annual Report 2016
Future focusReducing the disparity of Māori mental health outcomes continues to be a priority for the Ministry of Health (Ministry of Health 2012e). Publishing data on the rate of Māori subject to compulsory treatment is just one aspect of what needs to be a wider conversation around Māori over-representation in compulsory assessment and treatment under the Mental Health Act.19
The Office of the Director of Mental Health will continue to work alongside DHBs and other Ministry and government groups to ensure that the best possible mental health outcomes are being sought for Māori in New Zealand.
Family/whānau consultation and the Mental Health ActIn 1999, Parliament made an amendment to the Mental Health Act that required clinicians to consult family/whānau at particular junctures of a person’s compulsory assessment and treatment under the Mental Health Act. Section 7A of the Act requires a mental health service to consult unless it is deemed not reasonably practicable, or not in the interests of the person.
In summary, in 2016:
• the average percentage of family/whānau consultation in Mental Health Act assessment/treatment events was 61 percent nationally
• of all the steps in the Mental Health Act treatment process, family/whānau were most likely to be consulted during a person’s initial assessment (section 10)
• family/whānau consultation varied by DHB
• the most common reason family/whānau were not consulted was that service providers deemed consultation not reasonably practicable in the given circumstance.
Purpose of family/whānau consultationThe purpose of family/whānau consultation is to:
• strengthen family/whānau involvement in the compulsory assessment and treatment process
• enhance family/whānau contribution to the person’s care
• address family/whānau concerns about information sharing and treatment options
• facilitate ongoing family/whānau involvement in Mental Health Act processes, such as clinical reviews of treatment or Court hearings (Ministry of Health 2012d).
In 2006, the Ministry of Health published a review of section 7A of the Mental Health Act, following concerns that mental health services were not adequately carrying out the required consultation (Ministry of Health 2006). The review made a number of recommendations, including:
• revision of the relevant section in the Mental Health Act Guidelines (Ministry of Health 2012d)
• better training and resources for clinicians
• development of information and opportunities to involve family/whānau in the compulsory assessment and treatment process
• the establishment of nationwide reporting on section 7A consultation.
Reducing the disparity of Māori mental health outcomes continues to be a priority for the Ministry of Health
Family/whānau involvement can be a vital component in a person’s journey of recovery
19 The Ministry’s leadership of Action 9(d) of the Disability Action Plan 2014–18, to ‘explore how the Mental Health Act relates to the NZ Bill of Rights Act and the Convention on the Rights of People with Disabilities’ is expected to meaningfully contribute to this conversation.

31Office of the Director of Mental Health Annual Report 2016
This is the third year that national data on the application of section 7A has been included in this report. We have included it in the hope that its publication will emphasise the importance of family/whānau consultation, bring greater transparency and accountability to DHB efforts to involve family/whānau, and further encourage a culture of family/whānau involvement in mental health treatment.
Definition of family/whānauDefinitions and understandings of family/whānau vary and are informed by different cultural backgrounds and practices. Almost always, the most important perspective for defining family/whānau is that of the person. Therefore, family/whānau is not limited to blood ties, but may include partners, friends and others in a person’s wider support network (Ministry of Health 2012d).
District health board reporting of family/whānau consultationThe Ministry requires DHBs to report on family/whānau consultation across five different assessment/treatment events in the Mental Health Act process, as follows.
Across all DHBs in 2016, the highest rate of family/whānau consulation occurred during the clinician’s initial assessment (67 percent). Figure 15 shows the percentage of cases in which family/whānau consultation occurred at this and other points in the process in 2016.
Family/whānau is not limited to blood ties, but may include partners, friends and others in a person’s wider support network
s 10
s 12
s 14
s 76
Release
Preliminary assessmentThe clinician makes a preliminary assessment, including as to whether the person should undergo the initial five-day period of assessment under s 11.
Further assessmentAfter an initial assessment period of five days, the clinician decides whether the person should undergo a further two-week period of assessment under s 13.
Final assessmentAfter the second period of assessment, the clinician decides whether the person should be placed on either an inpatient treatment order or a community treatment order.
ReviewIf a person has been placed on a compulsory treatment order, the clinician conducts a review no later than three months after it was put in place to see whether it should remain. Thereafter, the clinician reviews the order at intervals no longer than six months.
ReleaseIf at any time while the compulsory treatment order is in place the clinician considers that the person no longer requires compulsory treatment, they can direct release with immediate effect.

32 Office of the Director of Mental Health Annual Report 2016
Figure 15: Average national percentage of family/whānau consultation for particular assessment/treatment events, 1 January to 31 December 2016
Note: Waitemata DHB does not record section 7A family/whānau consultation data. Source: Office of the Director of Mental Health records
Nationally during 2016, the average percentage of cases in which family/whānau consultation occurred across all assessment/treatment events was 61 percent (see Figure 16). Wairarapa and Whanganui DHBs both had the highest rate of consultation, at 86 percent, and Hawke’s Bay had the lowest, at 42 percent.
Figure 16: Average percentage of family/whānau consultation across all assessment/treatment events, by DHB, 1 January to 31 December 2016
Note: Waitemata DHB does not record section 7A family/whānau consultation data.Source: Office of the Director of Mental Health records
Reasons for not consulting family/whānau During 2016, the most common reason DHBs gave for not arranging family/whānau consultation was that it was not reasonably practicable (60 percent). This was followed by ‘don’t know’ (28 percent), ‘not in the best interests of the person’ (6 percent) and ‘no for another reason’ (6 percent) (see Figure 17).
DirMHth2016 Fig 15
Percentage 100
90
80
70
60
50
40
30
20
10
0 s10 s12 s14 s76 Release from the Act Assessment/treatment event
DirMHth2016 Fig 16
National average
Percentage1009080706050403020100
DHB
Auck
land
Bay
of P
lent
y
Cap
ital &
Coa
st
Can
terb
ury
Cou
ntie
s M
anuk
au
Haw
ke’s
Bay
Hut
t Val
ley
Lake
s
Mid
Cen
tral
Nel
son
Mar
lbor
ough
Nor
thla
nd
Sout
h C
ante
rbur
y
Sout
hern
Tairāwhiti
Tara
naki
Wai
kato
Wai
rara
pa
Wes
t Coa
st
Wha
ngan
ui

33Office of the Director of Mental Health Annual Report 2016
Figure 17: Reasons for not consulting family/whānau, 1 January to 31 December 2016
Note: Waitemata DHB does not record section 7A family/whānau consultation data. Source: Office of the Director of Mental Health records
SeclusionStandards New Zealand (2008a) defines seclusion as a situation ‘where a consumer is placed alone in a room or area, at any time and for any duration, from which they cannot freely exit’. Seclusion should be an uncommon event, and services should use it only when there is an imminent risk of danger to the individual or others and no other safe and effective alternative is possible.
In summary, in adult inpatient services20 in 2016:
• the total number of people who experienced seclusion while receiving mental health treatment in an adult inpatient service had decreased by 25 percent since 2009
• the total number of hours spent in seclusion had decreased by 62 percent since 2009
• the use of seclusion had steadied in the context of a seven-year decline
• males were twice as likely to have been secluded as females
• people aged 20–24 years were more likely to have been secluded than those in any other age group
• Māori were more likely to have been secluded than non-Māori.
The Health and Disability Services (Restraint Minimisation and Safe Practices) Standards came into effect on 1 June 2009 (Standards New Zealand 2008b). Their intent is to ‘reduce the use of restraint in all its forms and to encourage the use of least restrictive practices’. In addition, reducing (and eventually eliminating) seclusion is one of the goals of the Ministry’s service development plan Rising to the Challenge (Ministry of Health 2012e).
Section 71 of the Mental Health Act covers seclusion. It states that seclusion can only occur where, and for as long as, it is necessary for the care or treatment of the person, or for the protection of other people.
ODMH 2016 Fig 17
Not in best interests 6%
Don’t know28%No for another
reason 6%
Not practicable60%
Seclusion should be an uncommon event, used only when there is an imminent risk of danger to the individual or others
20 Adult mental health services generally care for people aged 20–64 years. Adult inpatient services are distinct from forensic services, youth services, intellectual disability services and services for older people.
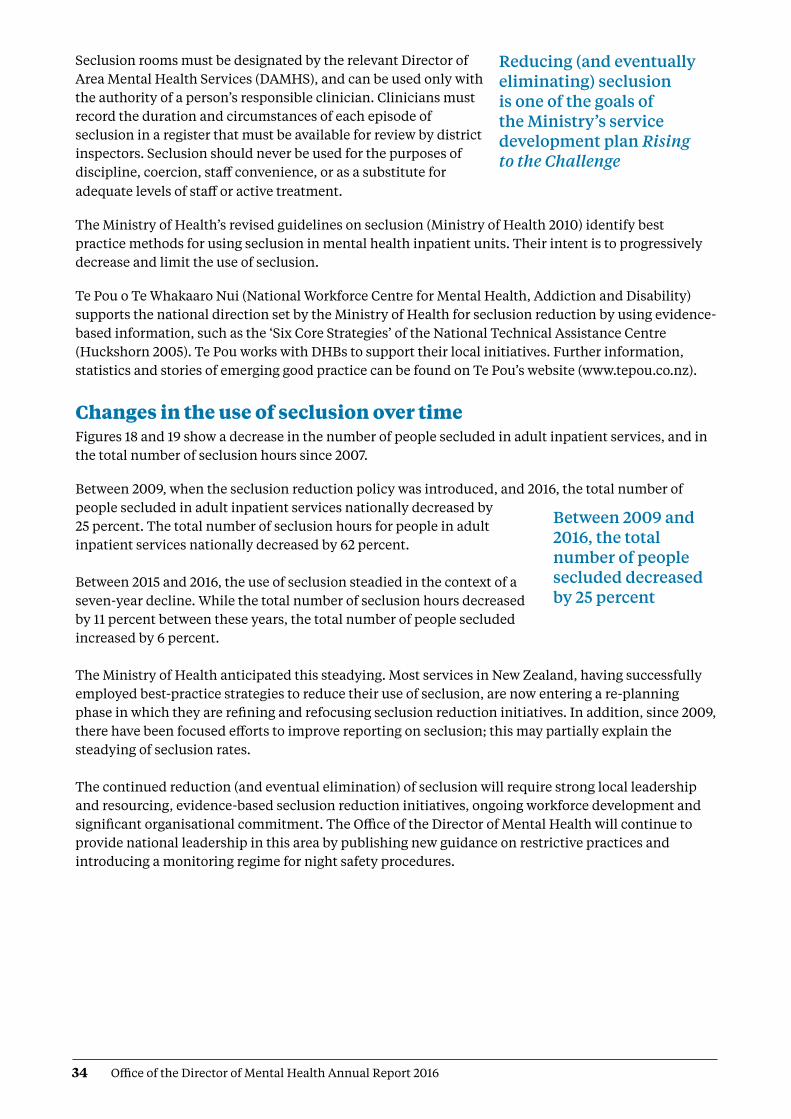
34 Office of the Director of Mental Health Annual Report 2016
Seclusion rooms must be designated by the relevant Director of Area Mental Health Services (DAMHS), and can be used only with the authority of a person’s responsible clinician. Clinicians must record the duration and circumstances of each episode of seclusion in a register that must be available for review by district inspectors. Seclusion should never be used for the purposes of discipline, coercion, staff convenience, or as a substitute for adequate levels of staff or active treatment.
The Ministry of Health’s revised guidelines on seclusion (Ministry of Health 2010) identify best practice methods for using seclusion in mental health inpatient units. Their intent is to progressively decrease and limit the use of seclusion.
Te Pou o Te Whakaaro Nui (National Workforce Centre for Mental Health, Addiction and Disability) supports the national direction set by the Ministry of Health for seclusion reduction by using evidence-based information, such as the ‘Six Core Strategies’ of the National Technical Assistance Centre (Huckshorn 2005). Te Pou works with DHBs to support their local initiatives. Further information, statistics and stories of emerging good practice can be found on Te Pou’s website (www.tepou.co.nz).
Changes in the use of seclusion over timeFigures 18 and 19 show a decrease in the number of people secluded in adult inpatient services, and in the total number of seclusion hours since 2007.
Between 2009, when the seclusion reduction policy was introduced, and 2016, the total number of people secluded in adult inpatient services nationally decreased by 25 percent. The total number of seclusion hours for people in adult inpatient services nationally decreased by 62 percent. Between 2015 and 2016, the use of seclusion steadied in the context of a seven-year decline. While the total number of seclusion hours decreased by 11 percent between these years, the total number of people secluded increased by 6 percent. The Ministry of Health anticipated this steadying. Most services in New Zealand, having successfully employed best-practice strategies to reduce their use of seclusion, are now entering a re-planning phase in which they are refining and refocusing seclusion reduction initiatives. In addition, since 2009, there have been focused efforts to improve reporting on seclusion; this may partially explain the steadying of seclusion rates. The continued reduction (and eventual elimination) of seclusion will require strong local leadership and resourcing, evidence-based seclusion reduction initiatives, ongoing workforce development and significant organisational commitment. The Office of the Director of Mental Health will continue to provide national leadership in this area by publishing new guidance on restrictive practices and introducing a monitoring regime for night safety procedures.
Reducing (and eventually eliminating) seclusion is one of the goals of the Ministry’s service development plan Rising to the Challenge
Between 2009 and 2016, the total number of people secluded decreased by 25 percent

35Office of the Director of Mental Health Annual Report 2016
Figure 18: Number of people secluded in adult inpatient services nationally, 2007–2016
Source: Office of the Director of Mental Health annual reports 2007–2015 and PRIMHD data for 2016, extracted on 27 July 2017. Auckland and Southern DHBs supplied data manually
Figure 19: Total number of seclusion hours in adult inpatient services nationally, 2007–2016
Source: Office of the Director of Mental Health annual reports 2007–2015 and PRIMHD data for 2016, extracted on 27 July 2017. Auckland and Southern DHBs supplied data manually
Seclusion in New Zealand mental health services Between 1 January and 31 December 2016, New Zealand adult mental health services (excluding forensic and other regional rehabilitation services) accommodated 7,411 people for a total of 185,475 bed nights. Of these people, 80221 (10.8 percent) were secluded at some time during the reporting period.
People who were secluded were often secluded more than once (on average 1.8 times). Therefore, the number of seclusion events in adult inpatient services (1,483) was higher than the number of people secluded.
DirMHth2016 Fig 18
Number1400
1200
1000
800
600
400
200
02007 2008 2009 2010 2011 2012 2013 2014 2015 2016 Year
Seclusion reduction policy introduced
!
Number100,000
90,000
80,000
70,000
60,000
50,000
40,000
30,000
20,000
10,000
0
DirMHth2016 Fig 19
2007 2008 2009 2010 2011 2012 2013 2014 2015 2016 Year
Seclusion reduction policy introduced
21 Source: PRIMHD data, extracted on 27 July 2017. Auckland and Southern DHBs supplied data manually.

36 Office of the Director of Mental Health Annual Report 2016
Across all inpatient services, including forensic, intellectual disability and youth services, 99022 people experienced at least one seclusion event. Of those secluded, 72 percent were male and 28 percent were female. The most common age group for those secluded was 20–24 years (see Figure 20). A total of 102 young people (aged 19 years and under) were secluded during the 2016 year in 323 seclusion events.23
Figure 20: Number of people secluded across all inpatient services (adult, forensic, intellectual disability, and youth), by age group, 1 January to 31 December 2016
Source: PRIMHD data, extracted on 27 July 2017. Auckland and Southern DHBs supplied data manually
The length of time spent in seclusion varied considerably. Most seclusion events (74 percent) lasted for less than 24 hours. Some (12 percent) lasted for longer than 48 hours. Figure 21 shows numbers of seclusion events by duration of the event.
Figure 21: Number of seclusion events across all inpatient services (adult, forensic, intellectual disability, and youth), by duration of event, 1 January to 31 December 2016
Source: PRIMHD data, extracted on 27 July 2017. Auckland and Southern DHBs supplied data manually
DirMHth2016 Fig 20
Number180
160
140
120
100
80
60
40
20
0 0–19 20–24 25–29 30–34 35–39 40–44 45–49 50–54 55–59 60–64 65+ Age group (years)
DirMHth2016 Fig 21
Duration (hours)
Frequency300
250
200
150
100
50
0
0–1
1–2
2–3
3–4
4–5
5–6
6–7
7–8
8–9
9–10
10–1
1
11–1
2
12–1
3
13–1
4
14-1
5
15–1
6
16–1
7
17–1
8
18–1
9
19–2
0
20–2
1
21–2
2
22–2
3
23–2
4
24–3
5
36–4
7
48+
22 Source: PRIMHD data, extracted on 27 July 2017. Auckland and Southern DHBs supplied data manually.
23 Of the 102 young people secluded, 38 were secluded in the country’s specialist facilities for children and young people (in Christchurch, Auckland and Wellington). Of the 323 seclusion events, 169 occurred in those specialist facilities.

37Office of the Director of Mental Health Annual Report 2016
Seclusion by district health boardAll DHBs except for Wairarapa (which has no mental health inpatient service) use seclusion.24
In 2016, the national average number of people secluded in adult inpatient services per 100,000 population was 29.1, and the average number of seclusion events per 100,000 population was 53.9.
As Figures 22 and 23 show, seclusion data varied widely across DHBs in 2016. Such variation is likely to be due to a number of factors, including:
• differences in seclusion practice
• geographical variations in the prevalence and acuity of mental illness
• ward design factors, such as the availability of intensive care and low-stimulus facilities
• staff numbers, experience and training
• use of sedating psychotropic medication
• the frequent or prolonged seclusion of a small number of people, distorting seclusion figures over the 12-month period.
Because it is difficult to measure and adjust for these factors, the Ministry recommends comparing an individual DHB’s performance over time in addition to considering the adjusted comparisons between DHBs in this report.
Figure 22: Number of people secluded in adult inpatient services per 100,000, by DHB, 1 January to 31 December 2016
Note: Confidence intervals (for 99 percent confidence) have been used to aid interpretation. Where a DHB region’s confidence interval crosses the national average, this means the DHB’s rate was not statistically significantly different to the national average.
Source: PRIMHD data, extracted on 27 July 2017. Auckland and Southern DHBs supplied data manually
DirMHth2016 Fig 22
Rate 160
140
120
100
80
60
40
20
0
National average
DHB
Auck
land
Bay
of P
lent
y
Can
terb
ury
Cap
ital &
Coa
st
Cou
ntie
s M
anuk
au
Haw
ke’s
Bay
Hut
t Val
ley
Lake
s
Mid
Cen
tral
Nel
son
Mar
lbor
ough
Nor
thla
nd
Sout
h C
ante
rbur
y
Sout
hern
Tairāwhiti
Tara
naki
Wai
kato
Wai
rara
pa
Wai
tem
ata
Wes
t Coa
st
Wha
ngan
ui
24 If a person in Wairarapa requires admission to mental health inpatient services, they are transported to Hutt Valley or MidCentral DHB; seclusion statistics in relation to these service users appear on the corresponding DHB’s database.
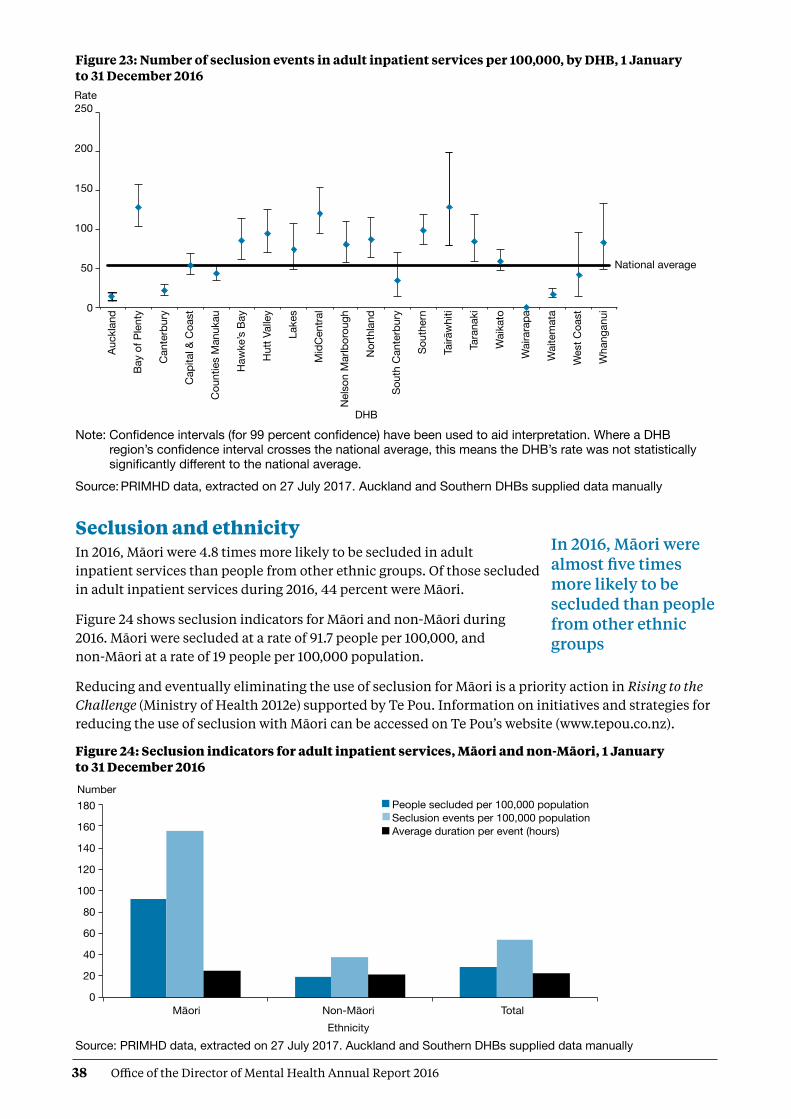
38 Office of the Director of Mental Health Annual Report 2016
Figure 23: Number of seclusion events in adult inpatient services per 100,000, by DHB, 1 January to 31 December 2016
Note: Confidence intervals (for 99 percent confidence) have been used to aid interpretation. Where a DHB region’s confidence interval crosses the national average, this means the DHB’s rate was not statistically significantly different to the national average.
Source: PRIMHD data, extracted on 27 July 2017. Auckland and Southern DHBs supplied data manually
Seclusion and ethnicityIn 2016, Māori were 4.8 times more likely to be secluded in adult inpatient services than people from other ethnic groups. Of those secluded in adult inpatient services during 2016, 44 percent were Māori.
Figure 24 shows seclusion indicators for Māori and non-Māori during 2016. Māori were secluded at a rate of 91.7 people per 100,000, and non-Māori at a rate of 19 people per 100,000 population.
Reducing and eventually eliminating the use of seclusion for Māori is a priority action in Rising to the Challenge (Ministry of Health 2012e) supported by Te Pou. Information on initiatives and strategies for reducing the use of seclusion with Māori can be accessed on Te Pou’s website (www.tepou.co.nz).
Figure 24: Seclusion indicators for adult inpatient services, Māori and non-Māori, 1 January to 31 December 2016
Source: PRIMHD data, extracted on 27 July 2017. Auckland and Southern DHBs supplied data manually
DirMHth2016 Fig 23
Rate 250
200
150
100
50
0
DHB
Auck
land
Bay
of P
lent
y
Can
terb
ury
Cap
ital &
Coa
st
Cou
ntie
s M
anuk
au
Haw
ke’s
Bay
Hut
t Val
ley
Lake
s
Mid
Cen
tral
Nel
son
Mar
lbor
ough
Nor
thla
nd
Sout
h C
ante
rbur
y
Sout
hern
Tairāwhiti
Tara
naki
Wai
kato
Wai
rara
pa
Wai
tem
ata
Wes
t Coa
st
Wha
ngan
ui
National average
In 2016, Māori were almost five times more likely to be secluded than people from other ethnic groups
DirMHth2016 Fig 24
Number 180
160
140
120
100
80
60
40
20
0Maori Non-Maori Total Ethnicity
People secluded per 100,000 populationSeclusion events per 100,000 population Average duration per event (hours)
Gender

39Office of the Director of Mental Health Annual Report 2016
Figure 25 shows the percentage of Māori and non-Māori male and female service users secluded in adult services in 2016. This figure indicates that a greater proportion of Māori were secluded than non-Māori and that across ethnicities males were more likely to be secluded (14 percent) than females (7 percent).
Figure 25: Percentage of people secluded in adult inpatient services, Māori and non-Māori males and females, 1 January to 31 December 2016
Source: PRIMHD data, extracted on 27 July 2017. Auckland and Southern DHBs supplied data manually
Figure 26 shows the proportion of Māori aged 20–64 years secluded in adult inpatient services from 2007 to 2016. Nationally over this time, the number of people secluded decreased by 30 percent. The number of people secluded who identified as Māori decreased by 9 percent over the same time.
Figure 26: Number of Māori and non-Māori secluded in adult inpatient services, 2007–2016
Source: PRIMHD data, extracted on 27 July 2017. Auckland and Southern DHBs supplied data manually
Seclusion in forensic units Five DHBs provide specialist inpatient forensic services: Canterbury, Capital & Coast, Southern, Waikato and Waitemata. There is a smaller inpatient forensic service in Whanganui.25 These services provide mental health treatment in a secure environment for prisoners with mental disorders, and for people defined as special or restricted patients under the Mental Health Act.
Percentage20
18
16
14
12
10
8
6
4
2
0Males Females Sex
MaoriNon-MaoriTotal
DirMHth2016 Fig 25
Number1,200
1,000
800
600
400
200
0
Non-MaoriMaori
2007 2008 2009 2010 2011 2012 2013 2014 2015 2016 Year
ODOMH 2016 Fig 26
!
25 The Whanganui inpatient unit comes under the Capital & Coast’s forensic services.

40 Office of the Director of Mental Health Annual Report 2016
Some forensic services also provide care for people defined as care recipients or special care recipients under the Intellectual Disability (Compulsory Care and Rehabilitation) Act 2003 (IDCC&R Act). These services are delivered in specialised intellectual disability units for people with intellectual disabilities who are subject to a compulsory care order under the IDCC&R Act.
Care recipients under the IDCC&R Act can also be subject to seclusion. As they often receive treatment in a forensic mental health service, seclusion indicators relevant to these service users is sometimes reported via PRIMHD and is indistinguishable from forensic mental health service user seclusion data. The Office is actively working with Disability Support Services and DHBs to amend this situation with the aim to report IDCC&R Act seclusion data separately from forensic mental health service user data in future reports.
In 2016, forensic services placed 112 people in seclusion in a total of 511 seclusion events. The average duration of a seclusion event in a forensic service was 30.9 hours in 2016.
Table 5 presents seclusion indicators for the 2016 calendar year. These indicators cannot be compared with adult service indicators because they do not reflect the same client base. The rates of seclusion for the relatively small group of people in the care of forensic services can be affected by individuals who were secluded significantly more often or for longer than others.
Table 5: Seclusion indicators for forensic mental health services*, by DHB, 1 January to 31 December 2016
DHB Number of clients secluded Number of events Average duration per event (hours)
Canterbury 18 140 35.3
Capital & Coast 9 30 14.5
Southern 19 67 70.2
Waikato 18 49 66.0
Waitemata 48 224 26.1
Whanganui 1 1 1.7
Total 112^ 511 30.9
Notes: * Some of the data included in this table includes seclusion information regarding care recipients under the IDCC&R Act who received treatment in a forensic service.
^ The total of 112 in this table is a unique count and not a sum of the column, as some clients may have been seen by more than one DHB.
Source: PRIMHD data, extracted on 27 July 2017. Southern and Capital & Coast DHBs supplied data manually
Special and restricted patientsNew Zealand legislation specifically allows for people who have been charged with or convicted of an offence and meet certain criteria in terms of their mental illness to be treated for that condition in hospital. Treating mental illness can be an important step towards helping an individual to address the reasons for their offending. In doing so, they can reduce their chances of future offending and significantly improve their wellbeing.
41Office of the Director of Mental Health Annual Report 2016
The terms ‘special patient’ or ‘restricted patient’ refer to mentally ill offenders detained in a forensic mental health service under specific legislative provisions.26
Special patients27 include:
• people charged with, or convicted of, a criminal offence and remanded to a hospital for a psychiatric report
• remanded or sentenced prisoners transferred from prison to a hospital
• defendants found not guilty by reason of insanity
• defendants unfit to stand trial
• people who have been convicted of a criminal offence and both sentenced to a term of imprisonment and placed under a compulsory treatment order.
Restricted patients are people detained by a court order because they pose a danger to others. Restricted patients are generally subject to the same leave provisions as those applying to special patients.
Forensic mental health servicesForensic mental health services are responsible for the care and treatment of special patients and restricted patients within the legislative framework of the Mental Health Act and the Criminal Procedure (Mentally Impaired Persons) Act 2003 (the CP (MIP) Act).
When managing special patients, forensic mental health services are required to balance the rights, treatment and rehabilitative needs of the individual patient against the safety of the public and the concerns of victims.
The clinical management of special patients lies with the patient’s responsible clinician. However, leave and change of legal status require consideration and approval by the Director of Mental Health and (depending on the legal status of the patient) the Minister of Health and/or the Attorney-General. This level of decision-making reflects the seriousness of special patients’ status and the need to ensure that a wide range of factors are considered when making decisions about such patients.
Special and restricted patients are detained in the care of one of five regional forensic psychiatry services throughout New Zealand under the jurisdiction of Waitemata, Waikato, Capital & Coast, Canterbury and Southern DHBs.28 These services develop management plans to progressively reintegrate people into the community as treatment improves their mental health.
During 2016, there were 378 people with special patient status. On any given day, there were approximately 196 people with special patient status.29
26 More detail of the legislative provisions used to define special or restricted patient status to inform the statistics used in this report is included in Appendix 3.
27 As per section 2(1) of the Mental Health (Compulsory Assessment and Treatment) Act 1992. For the purposes of this report, the data does not include those subject to section 191(2)(a) of the Armed Forces Discipline Act 1971 or section 136(5)(a) of the Intellectual Disability (Compulsory Care and Rehabilitation) Act 2003.
28 There is also a smaller inpatient forensic service in Whanganui that operates under the Capital & Coast’s forensic services. Additionally, in some circumstances certain special patient orders can enable a Court to direct treatment outside a regional forensic service.
29 Counts of people with a special patient legal status code current on 30 June 2016.

42 Office of the Director of Mental Health Annual Report 2016
Figure 27: Total number of special patients, by DHB, 1 January to 31 December 2016
Source: PRIMHD collection, extracted 26 July 2017
Extended Forensic Care (EFC) special patients‘EFC special patients’ refers to patients who have been detained in a forensic mental health service. These special patients have been found not guilty by reason of insanity or unfit to stand trial and have been remanded to one of the five forensic mental health facilities in New Zealand under section 24(2)(a) of the CP (MIP) Act. Also included in these statistics are patients subject to a restricted patient order (section 55 of the Mental Health Act). In 2016, there were a total of 130 EFC special patients.
Short-term Forensic Care (SFC) special patients‘SFC special patients’ refers to patients transferred to a forensic mental health service from prison for compulsory mental health assessment and treatment (including those under a ‘hybrid order’, see definition below). In 2016, there were a total of 195 SFC special patients.
Once a person has been sentenced to a term of imprisonment, any compulsory mental health treatment order relating to the prisoner ceases to have effect. Remand prisoners may remain on a pre-existing compulsory treatment order, but it is unlawful to enforce compulsory treatment in the prison environment. If a mentally disordered prisoner requires compulsory assessment and/or treatment, section 45 of the Mental Health Act provides for their transfer to hospital. Section 46 allows for voluntary admission to hospital with the approval of the prison superintendent. Services must notify the Director of Mental Health of all such admissions. On advice from services, the Director can direct their return to prison under section 47 of the Mental Health Act.
DirMHth2016 Fig 27
Total number of special patients0 20 40 60 80 100 110 120 140 160
Canterbury DHB
Capital & Coast DHB
Southern DHB
Waikato DHB
Waitemata DHB

43Office of the Director of Mental Health Annual Report 2016
Table 6: Total number of special patients, by type and DHB, 1 January to 31 December 2016
Forensic serviceEFC special
patientsSFC special
patientsOther special
patientsTotal special
patients
Canterbury District Health Board 13 23 14 41
Capital & Coast District Health Board 34 39 18 81
Southern District Health Board 13 6 10 28
Waikato District Health Board 24 44 42 98
Waitemata District Health Board 43 81 35 138
Note: Some people will be counted as special patients against more than one DHB if they have received treatment with more than one DHB. This means the total of this data is higher than the national total. Furthermore, certain special patient orders enable a Court to direct treatment outside a regional forensic service – this data has been excluded due to low numbers and to protect patient confidentiality.
Source: PRIMHD collection, extracted 26 July 2017
Figure 28: Percentage of Extended Forensic Care, Short-term Forensic Care and ‘Other’ legal statuses, within each DHB, 1 January to 31 December 2016
Note: Unlike previous data in this section, the data used in this figure is based on a count of legal statuses rather than people. One special patient may have many legal statuses in a period, which could be in different categories but each special patient legal status can only be in one category, EFC, SFC or ‘Other’. Please use caution when comparing the legal status counts with the counts of people with legal statuses.
Source: PRIMHD collection, extracted 26 July 2017
The CP (MIP) Act allows the Court to sentence a convicted offender to a term of imprisonment while also ordering their detention in hospital as a special patient (if mentally disordered). These orders are referred to as hybrid orders because they combine aspects of compulsory treatment and imprisonment. In 2016, there was one hybrid order made under section 34(1)(a)(i) of the CP (MIP) Act.
Gender, age and ethnicity of special patientsIn 2016, most people subject to a special patient legal status were male (87%). Special patients were seven times more likely to be male than female (13%).The most common age-group for special patients was 25–29 years old (see Figure 29).
DirMHth2016 Fig 28
Percent0 10 20 30 40 50 60 70 80 90 100
Percentage: EFC special patientsSFC special patientsOther special patients
Canterbury DHB
Capital & Coast DHB
Southern DHB
Waikato DHB
Waitemata DHB

44 Office of the Director of Mental Health Annual Report 2016
Figure 29: Total number of special patients, by age-group, 1 January to 31 December 2016
Source: PRIMHD collection, extracted 26 July 2017
As Figure 30 indicates, in 2016, the highest proportion of people subject to a special patient order were Māori (50 percent). However, the largest proportion of EFC special patients (those remanded to a forensic health facility) had an ethnicity classification of ‘other’,30 at 46 percent. Special patients classified as ‘other’ made up 27 percent of the SFC special patient population. Māori special patients made up 36 percent of EFC special patients and 58 percent of SFC special patients (see Figure 31). This difference in proportion is likely to reflect the high proportion of Māori in the prison population.
Figure 30: Total number of special patients, by ethnicity, 1 January to 31 December 2016
Source: PRIMHD collection, extracted 26 July 2017
DirMHth2016 Fig 29
Number
80
70
60
50
40
30
20
10
0 0–19 20–24 25–29 30–34 35–39 40–44 45–49 50–54 55–59 60–64 65+ Age group (years)
DirMHth2016 Fig 30
Asian 3%
Maori50%
Other36%
Pacific11%
30 ‘Other’ refers to any other ethnicity not otherwise specified in the data presented. This report uses prioritised ethnicity according to the ethnicity code tables on the Minsitry of Health website (http://www.health.govt.nz/nz-health-statistics/data-references/code-tables/common-code-tables/ethnicity-code-tables).

45Office of the Director of Mental Health Annual Report 2016
Figure 31: Total number of special patients, by ethnicity and special patient type, 1 January to 31 December 2016
Note: A patient may be represented in one or more categories in this graph.Source: PRIMHD collection, extracted 26 July 2017
Decisions regarding leave and change of legal status for special and restricted patientsThe Director of Mental Health has a central role in managing special patients and restricted patients. The Director must be notified of the admission, discharge or transfer of special and restricted patients, and certain incidents involving these people (section 43 of the Mental Health Act). The Director may direct the transfer of such patients between DHBs under section 49 of the Mental Health Act, or grant leave for any period not exceeding seven days for certain special and restricted patients (section 52).
Leave is an important part of a special patient’s rehabilitation and occurs in a careful stepwise manner. Patients usually begin by having walks on the hospital grounds escorted by forensic service staff. If appropriate, patients progress to unescorted ground leave and then to escorted and unescorted community leave. This leave is typically used to attend appointments, work, rehabilitation programmes or to visit family. After increasing periods of successful unescorted leave, it may be appropriate for some individuals to progress to a less secure setting. Individuals may move to an open hospital unit and eventually reside in the community, often in supported accommodation or with family. It is important to note that not all special patients will be eligible for leave, and that there is no requirement for progression towards less secure conditions if this is not supported by risk assessment or progress.
The Minister of Health grants periods of leave over seven days (section 50), which are available to certain categories of special patients. The Director briefs the Minister of Health when requests for leave are made. Initial ministerial section 50 leave is usually granted for a period of six months, with further ministerial leave applications of 12 months in duration.
While on leave, special patients are subject to leave conditions and regular monitoring by their treating team. If a special patient breaches their leave conditions or their mental state requires they return to hospital, leave may be revoked. If the patient is subject to ministerial long leave, the Director may recommend the Minister revoke leave.
DirMHth2016 Fig 31
Total number120
100
80
60
40
20
0Asian Maori Other Pacific
Number of: EFC special patientsSFC special patientsOther special patients
The Director of Mental Health has a central role in the management of special patients and restricted patients

46 Office of the Director of Mental Health Annual Report 2016
Special patients are subject to a high degree of oversight and are not able to exit forensic services or travel overseas without permission. During 2015, the Ministry of Health developed guidance on special patient safety (including public safety) and security. This work included a national incident process to be followed by health services and New Zealand Police, as well as updated guidance on actions that forensic services and the Ministry should take when a special patient becomes absent without leave. The Ministry also updated its guidance on preventing special patients from travelling overseas without permission. Part of this work involved putting border alerts in place for any special patient granted unescorted leave in the community.
Special patients found not guilty by reason of insanity may be considered for a change of legal status if it is determined that their detention as a special patient is no longer necessary to safeguard the interests of the person or the public. This will usually occur after several years of successfully living in the community on ministerial long leave. Services send applications for changes of legal status to the Director of Mental Health. After careful consideration, the Director makes a recommendation to the Minister about a person’s legal status.
Following a change of legal status, former special patients continue to be supported in the community by mental health services. Many remain under compulsory mental health treatment orders for an extended period of time. For further information about the management of special patients, refer to the publication Special Patients and Restricted Patients: Guidelines for Regional Forensic Mental Health Services on the Ministry of Health’s website.
Table 7 shows the numbers of section 50 long-leave, revocation and reclassification applications processed by the Office of the Director of Mental Health during 2016.
Table 7: Number of long-leave, revocation and reclassification applications sent to the Minister of Health for special patients and restricted patients, 1 January to 31 December 2016*
Type of request Number
Initial ministerial section 50 leave applications 4
Initial ministerial section 50 leave applications not approved 0
Ministerial section 50 leave revocations 0
Further ministerial section 50 leave applications 11
Further ministerial section 50 applications not approved 0
Change of legal status applications approved 6
Change of legal status applications not approved 0
Total 21
Note: * Numbers do not include the number of applications that were withdrawn before they were received by the Minister.
Source: Office of the Director of Mental Health records
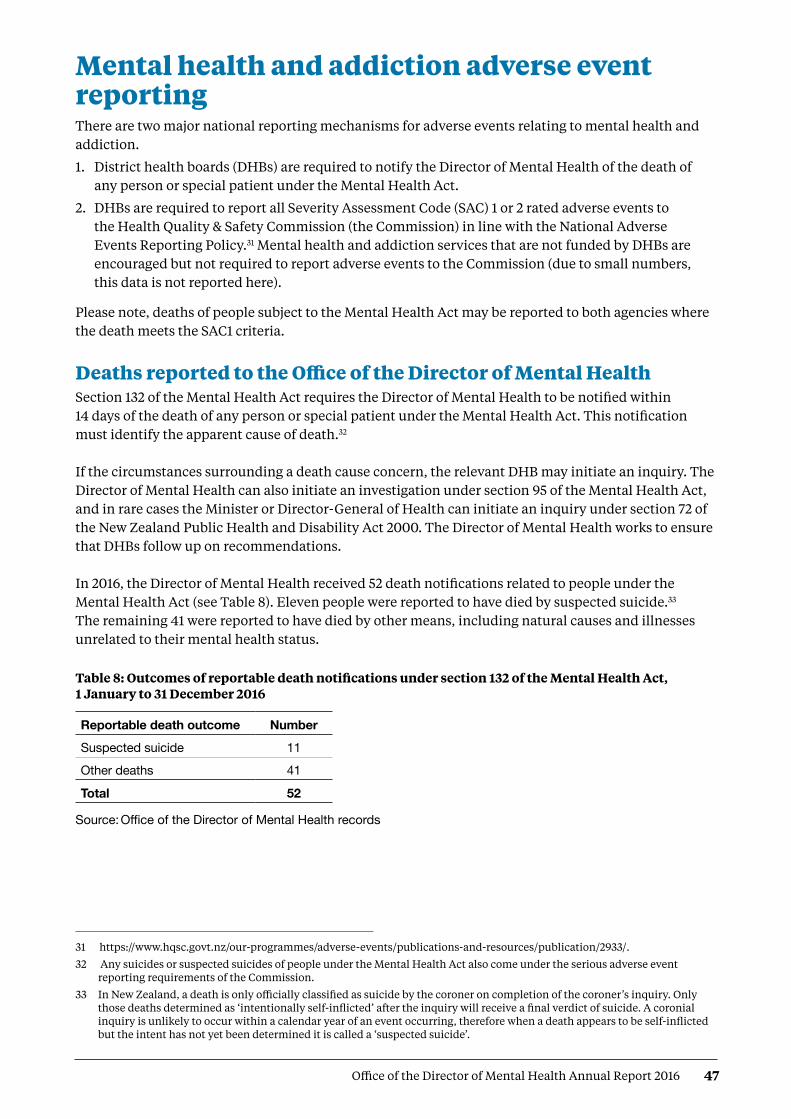
47Office of the Director of Mental Health Annual Report 2016
Mental health and addiction adverse event reporting There are two major national reporting mechanisms for adverse events relating to mental health and addiction.
1. District health boards (DHBs) are required to notify the Director of Mental Health of the death of any person or special patient under the Mental Health Act.
2. DHBs are required to report all Severity Assessment Code (SAC) 1 or 2 rated adverse events to the Health Quality & Safety Commission (the Commission) in line with the National Adverse Events Reporting Policy.31 Mental health and addiction services that are not funded by DHBs are encouraged but not required to report adverse events to the Commission (due to small numbers, this data is not reported here).
Please note, deaths of people subject to the Mental Health Act may be reported to both agencies where the death meets the SAC1 criteria.
Deaths reported to the Office of the Director of Mental Health Section 132 of the Mental Health Act requires the Director of Mental Health to be notified within 14 days of the death of any person or special patient under the Mental Health Act. This notification must identify the apparent cause of death.32 If the circumstances surrounding a death cause concern, the relevant DHB may initiate an inquiry. The Director of Mental Health can also initiate an investigation under section 95 of the Mental Health Act, and in rare cases the Minister or Director-General of Health can initiate an inquiry under section 72 of the New Zealand Public Health and Disability Act 2000. The Director of Mental Health works to ensure that DHBs follow up on recommendations. In 2016, the Director of Mental Health received 52 death notifications related to people under the Mental Health Act (see Table 8). Eleven people were reported to have died by suspected suicide.33 The remaining 41 were reported to have died by other means, including natural causes and illnesses unrelated to their mental health status.
Table 8: Outcomes of reportable death notifications under section 132 of the Mental Health Act, 1 January to 31 December 2016
Reportable death outcome Number
Suspected suicide 11
Other deaths 41
Total 52
Source: Office of the Director of Mental Health records
31 https://www.hqsc.govt.nz/our-programmes/adverse-events/publications-and-resources/publication/2933/.
32 Any suicides or suspected suicides of people under the Mental Health Act also come under the serious adverse event reporting requirements of the Commission.
33 In New Zealand, a death is only officially classified as suicide by the coroner on completion of the coroner’s inquiry. Only those deaths determined as ‘intentionally self-inflicted’ after the inquiry will receive a final verdict of suicide. A coronial inquiry is unlikely to occur within a calendar year of an event occurring, therefore when a death appears to be self-inflicted but the intent has not yet been determined it is called a ‘suspected suicide’.

48 Office of the Director of Mental Health Annual Report 2016
Adverse events reported to the Health Quality & Safety Commission Adverse event reporting encourages health and disability services to identify and review instances with the aim of preventing similar events in the future. Reporting requirements exist to promote a reflective process for dealing with adverse events, helping to ensure better and safer health care for New Zealanders.
In New Zealand, adverse events have been reported publically since 200634 Since reporting began, the number of adverse events reported by DHBs has increased. This is not necessarily because the frequency of adverse events has increased; we consider that DHBs have improved their reporting systems and cultures, reflecting a stronger culture of transparency and commitment to learning.
The reporting of adverse events is one part of a broader safety framework within New Zealand to ensure health care is as safe as possible.
Adverse events reported by DHB-funded mental health and addiction servicesTable 9 provides a breakdown of adverse events relating to mental health behaviour reported by DHBs to the Commission during 2016; Table 10 shows the number of events reported by DHBs.
Our ability to compare reports year-to-year is limited because the definition of adverse events has changed, as have the paramaters around service-user contact prior to adverse events. Initial reporting requirements for inclusion in adverse event reports was initially defined as occurring within seven days of contact with a service. In the 2012 National Reportable Events policy, this criterion was voluntarily amended by DHB mental health and addiction services to include cases that had occurred within 28 days of contact with the service, allowing lessons to be learned from a wider set of events. Some providers have taken this even further and now report serious adverse events for any current community mental health service user, irrespective of time since their last contact with the service.
It is also important to note that comparisons between individual DHBs are not straightforward. As noted above, high numbers can indicate that a DHB has a good reporting culture rather than a higher number of adverse events than other DHBs. DHBs that provide larger and more complex or regional mental health services may also report a higher number of adverse events.
Table 9: Adverse events (relating to mental health behaviour) reported by DHBs to the Health Quality & Safety Commission, 1 January to 31 December 2016
Type of event Outpatient Inpatient On approved leave Total
Suspected suicide 172 4 4 180
Serious self-harm 11 6 1 18
Serious adverse behaviour 6 6 0 12
Total 189 16 5 210
Source: Health Quality & Safety Commission adverse event data, 2017
Every adverse event is a tragedy for the person affected and their family and whānau. It is essential we respond by reviewing, learning, sharing and acting to reduce the risk of recurrence.
34 Reports published before the Commission’s first publication in 2010 were produced by the Quality Improvement Committee.

49Office of the Director of Mental Health Annual Report 2016
Table 10: Mental health adverse events reported to the Health Quality & Safety Commission, by DHB, 1 January to 31 December 2016
35 For more detailed information regarding deaths by suicide, please refer to the Suicide Facts: Deaths and intentional self-harm 2014 publication available on the Ministry of Health’s website.
36 Suicide is a death where evidence shows that the person deliberately brought about their own death as determined by coronial ruling. Death by undetermined intent is determined by a coroner in circumstances where intent was not determined or there was not enough information obtained about likely intent.
DHB Number of events
Auckland 19
Bay of Plenty 10
Canterbury 24
Capital & Coast 17
Counties Manukau 14
Hawke’s Bay 3
Hutt Valley 10
Lakes 8
MidCentral 22
Nelson Marlborough 5
DHB Number of events
Northland 7
South Canterbury 0
Southern 20Tairāwhiti 2
Taranaki 4
Waikato 20
Wairarapa 5
Waitemata 14
West Coast 3
Whanganui 3
New Zealand total 210
Source: Health Quality & Safety Commission adverse event data, 2017
Please see Appendix 4 for an update from the Commission on recent developments in adverse events reporting and service quality and improvement initiatives.
Death by suicide Suicide is a serious concern for New Zealand. Around 500 New Zealanders die by suicide every year. Suicide affects the lives of many – whānau, families, friends, colleagues and communities.
This section provides a brief overview of suicide deaths and deaths of undetermined intent, with a particular focus on people who had contact with specialist mental health services (including services treating people with alcohol and other drugs (AOD) addiction) in the year prior to their death.35 People with no history of mental health service use in the year prior to death are referred to as ‘non-service users’ here, although it is acknowledged that some non-service users may have used mental health or AOD services at some earlier time in their lives. This overview uses data from 2014 as it can take several years for a coroner’s investigation into a suicide to be completed.
In summary, in 2014:
• 510 people died by suicide. A further 22 deaths of undetermined intent36 were recorded in the mortality database
• approximately 46 percent of those who died by suicide or undetermined intent (among those aged 10–64) were mental health service users
• mental disorders are one of the factors that can increase the likelihood of suicidal behaviour
• males were more likely to die by suicide than females.
New Zealand’s national strategy to address suicide is the New Zealand Suicide Prevention Strategy 2006–2016 (Associate Minister of Health 2006). The New Zealand Suicide Prevention Action Plan 2013–2016 (Ministry of Health 2013a) implements this strategy and reflects the Government’s commitment to addressing New Zealand’s unacceptably high suicide rates.
Suicide affects the lives of many – families/whānau, friends, colleagues and communities

50 Office of the Director of Mental Health Annual Report 2016
The Government allocated $25 million over four years to implement the Action Plan, which sets out 30 actions, including expanding existing services to make them more accessible and able to support communities in preventing suicide.
Initial consultation to inform the new draft suicide prevention strategy occurred in 2016. The draft suicide prevention strategy was released for public consultation in 2017.
Prevalence of suicide in the populationAt the time the data was extracted, there were 510 suicides recorded in the mortality database for 2014.37 A further 22 deaths of undetermined intent were recorded and are included in this report. Of this initial total of 532 deaths, 64 involved people aged 65 years and over. The following discussion excludes these deaths.38
Table 11 sets out statistics on the remaining 468 deaths. Of these 468 people, 213 (46 percent) had had contact with specialist mental health services in the year prior to death.
Suicide has no single cause – it is usually the end result of interactions between many different factors that impact different people in different ways. Mental disorders (in particular, mood disorders, substance use disorders and antisocial behaviours) are one of the factors that can increase the likelihood of suicidal behaviour (Beautrais et al 2005).
Table 11: Number and age-standardised rate of suicide, by service use, people aged 10–64 years, 2014
Number Age-standardised ratea
Deaths due to intentional self-harm
Service usersb 204 136.2
Non-service users 244 6.3
Total 448 11.3
Deaths of undetermined intent
Service users 9 6.2
Non-service users 11 0.2
Total 20 0.5
Total deaths
Service users 213 142.4
Non-service users 255 6.5
Total 468 11.4
Notes: a Age-standardised rate is per 100,000, standardised to the WHO standard population aged 0–64 years. b Service user denominator excludes service users of unknown age. Source: Ministry of Health mortality database data, extracted on 17 July 2017
New Zealand’s national strategy to address suicide is the New Zealand Suicide Prevention Strategy 2006–2016
37 These numbers are subject to change. The mortality database is a dynamic collection, and changes can be made even after the data is considered nominally final.
38 This is because in the Central and Southern regions, older people’s mental health treatment was provided by health services for older people rather than mental health services, and was not necessarily recorded in PRIMHD. Each year, deaths of children under 10 years are also excluded because ‘undetermined intent’ deaths in this age group are unlikely to be caused by suicide. The data was drawn from information provided to the Ministry’s national mortality database and PRIMHD.

51Office of the Director of Mental Health Annual Report 2016
Changes in number of suicides over timeFigure 32 shows the changes in the rates of suicide by service users and non-service users between 2001 and 2014.
Figure 32: Age-standardised rate of suicide, by service use, people aged 10–64 years, 2001–2014
Notes: Age-standardised rate is per 100,000, standardised to the WHO standard population aged 0–64 years. The service user population is much smaller than the non-service user population, and will therefore
produce rates more prone to fluctuation from year to year.
Source: Ministry of Health mortality database data, extracted on 17 July 2017
Gender and age in relation to suicideAs Table 12 and Figure 33 show, 2.8 times more males than females died by suicide in 2014. Of the service users who died by suicide in 2014, 32 percent were female and 68 percent were male.
When considering these numbers, it is important to note that because these age-specific rates are derived from a small service-user population, they are highly variable over time.
Table 12: Number and age-standardised rate of suicide, by service use and gender, people aged 10–64 years, 2014
Gender Service users Non-service users Total
Number ASR Number ASR Number ASR
Males 145 181.6 200 10.4 345 17.2
Females 68 96.3 55 2.8 123 5.8
Total 213 142.4 255 6.5 468 11.4
Notes: ASR = Age-standardised rate. Includes deaths of undetermined intent. Age-standardised rate is per 100,000, standardised to the WHO
standard population aged 0–64 years.
Service user denominator excludes service users of unknown age.
Source: Ministry of Health mortality database data, extracted on 17 July 2017
DirMHth2016 Fig 32
Age-standardised rate per 100,000250
200
150
100
50
02001 2002 2003 2004 2005 2006 2007 2008 2009 2010 2011 2012 2013 2014 Year
Service users
Non-service users

52 Office of the Director of Mental Health Annual Report 2016
Figure 33: Age-specific rate of suicide, by age group, gender and service use, people aged 10–64 years, 2014
Source: Ministry of Health mortality database data, extracted on 17 July 2017
As Table 13 shows, the rate of suicide among female service users was highest for those aged 50–54 years, at 345.6 per 100,000. The rate of suicide among male service users was highest for those aged 60–64 years, at 478.3 per 100,000.
For female non-service users, the rate of suicide was highest in those aged 45–49 years, at 5.7 per 100,000 ASR. For male non-service users, the rate of suicide was highest in those aged 55–59 years, at 16.6 per 100,000 ASR.
Table 13: Number and age-specific rate of suicide, by age group, gender and service use, people aged 10–64 years, 2014
Service users Non-service users
Female Male Female Male
Age (years) Number ASR Number ASR Number ASR Number ASR
10-14 1 24.0 1 18.3 2 1.4 2 1.4
15–19 5 49.6 6 66.5 7 4.9 23 15.1
20–24 3 47.6 16 191.6 7 4.6 25 15.8
25–29 9 156.7 22 303.3 2 1.4 18 13.2
30–34 6 118.6 15 237.1 6 4.3 21 16.5
35–39 2 40.4 16 274.7 5 3.6 16 12.9
40–44 14 261.9 16 254.8 5 3.1 23 16.2
45–49 6 123.8 15 259.7 9 5.7 15 10.4
50–54 15 345.6 17 352.9 3 1.9 17 11.4
55–59 4 124.3 10 281.8 3 2.1 22 16.6
60–64 3 131.9 11 478.3 6 4.9 18 15.3
Note: Includes deaths of undetermined intent. Source: Ministry of Health mortality database data, extracted on 17 July 2017
DirMHth2016 Fig 33
10–19 20–24 25–29 30–34 35–39 40–44 45–49 50–54 55–59 60–64 Age group (years)
Rate600
500
400
300
200
100
0
Male service users
Female service users
Male non-service usersFemale non-service users

53Office of the Director of Mental Health Annual Report 2016
Ethnicity and suicideAs Table 14 indicates, among people using mental health services in 2014, the age-standardised rate of suicide was higher for Māori (87.6 per 100,000 service users) than for Pacific peoples (65 per 100,000 service users). The age-standardised rate of suicide for those in the category of other ethnicities was 164.3 per 100,000 service users. The suicide rate for non-service users in 2014 among Māori was higher than among non-Māori. It should be noted that the suicide rate for Pacific peoples is highly variable over time.
Table 14: Number and age-standardised rate of suicide and deaths of undetermined intent, by ethnicity and service use, people aged 10–64 years, 2014
Ethnicity Service users Non-service users Total
Number of deaths
ASR Number of deaths
ASR Number of deaths
ASR
Māori 39 87.6 58 10.5 97 18.9
Pacific 7 65.0 17 6.4 24 9.9
Other 167 164.3 180 5.5 347 10.3
Total 213 142.4 255 6.5 468 11.4
Note: ASR = Age-standardised rate.Source: Ministry of Health mortality database data, extracted on 17 July 2017
Service users who died by suicide during 2014During 2014, 213 service users died by suicide. Of this total, five died while inpatients,39 eight died within a week of being discharged40 and 61 died within 12 months of discharge.41
An overview of service users dying by suicide, 2001–2014Between 2001 to 2014, 2,415 service users died by suicide.42 Of this total, 49 service users (2 percent) died while inpatients, 166 (7 percent) died within a week of being discharged and 878 (36 percent) died within 12 months of discharge.
Of the 2,415 service user suicides, 2,380 people had received treatment from a specialist service community team in the 12 months before their death, and 563 had received treatment from a specialist AOD team in the 12 months before their death.
39 This figure is determined from the number of people who had an inpatient activity on the day they died; PRIMHD cannot determine the number of people who died at an inpatient unit. In addition to capturing suicide deaths that occurred in inpatient facilities, this figure may also capture: · people who received care in an inpatient facility, were discharged, and died by suicide in the community later that day · people who attempted suicide in the community and later died in hospital · people who died by suicide in the community while on leave from an inpatient facility.
Note that these figures should not be compared to those of previous annual reports, as the definitions of inpatient and community service users have been updated.
40 Excluding those who received treatment on the day of their death.
41 Excluding those who received treatment on the day of their death and those who died within a week of being discharged from an inpatient service.
42 Includes deaths of undetermined intent.

54 Office of the Director of Mental Health Annual Report 2016
Specialist treatment regimes Opioid substitution treatmentOpioid substitution treatment (OST) involves prescribing opioids such as methadone and buprenorphine with naloxone (Suboxone) as a substitute for illicit opioids. It is a well-established treatment that ensures that people with opioid dependence have access to comprehensive services to support them in their recovery. One of the key objectives of OST is to improve the physical and psychological health and wellbeing of the people who use opioids.
In summary, in 2016:
• the total number of people receiving OST was 5,314
• of people receiving OST, 78 percent were New Zealand European, 14 percent were Māori, 1 percent were Pacific peoples and 7 percent were of another ethnicity
• approximately 28 percent of people receiving OST were being treated by a GP in a shared-care arrangement.
The Director of Mental Health is responsible for approving qualified practitioners to prescribe controlled drugs for the treatment of drug dependence under section 24 of the Misuse of Drugs Act 1975. For this purpose the Director undertakes regular site visits, focusing on building relationships and improving service quality.
Service improvements
The Specialist Opioid Substitution Treatment Service Audit and Review Tool sets out clinical audit requirements to ensure best treatment and services for clients and their family/whānau. The Ministry of Health audits services based on indicators from two key documents:
• New Zealand Practice Guidelines for Opioid Substitution Treatment (Ministry of Health 2014)
• National Guidelines: Interim methadone prescribing (Ministry of Health 2007).
The Ministry of Health has initiated a rolling programme of OST service audits to support ongoing quality improvement. All services will have completed an audit by July 2018.
To ensure the best possible health outcomes for service users, the sector must place greater emphasis on managing coexisting medical and mental health problems and focus on integrating primary and specialist services (Ministry of Health 2012e).
The ageing population of OST clients
Opioid substitution treatment clients are an aging population; those over 45 years are the most likely to be receiving treatment. In 2016, the overall portion of clients over 45 years was 58.2 %, with only two services nationally with less than 50% of clients over 45 (see Figure 34).
OST is a well-established treatment that supports people with opioid dependence in their recovery

55Office of the Director of Mental Health Annual Report 2016
Figure 34: Number of opioid substitution treatment clients, by age group, 2008–2016
Source: Data provided by OST services in six-monthly reports
Shared care with general practice
Opioid substitution treatment in New Zealand is provided by specialist addiction services and primary health care teams. Transferring care to a shared-care arrangement with primary care offers a lot of benefits, including allowing specialist services to focus on those with the highest need and normalising the treatment process. Ensuring that services are delivered seamlessly across providers will be an important focus in the future.
Corrections opioid substitution treatment shared care model
When a person receiving OST goes to prison, Corrections ensures that they continue to receive OST services, including psychosocial support and treatment from specialist services. Figure 35 presents a comparison of the number of people receiving OST from a specialist service, general practice or prison service between 2008 and 2016.
Figure 35: Number of people receiving opioid substitution treatment from a specialist service, general practice or prison service, 2008–2016
Source: Data provided by OST services in six-monthly reports
DirMHth2016 Fig 34
Number3,000
2,500
2,000
1,500
1,00
500
02008 2009 2010 2011 2012 2013 2014 2015 2016 Year
.
19–29 years
30–44 years
45–59 years
60+ years
DirMHth2016 Fig 35
Specialist serviceGeneral practicePrison service
2016
2015
2014
2013
2012
2011
2010
2009
2008
Year
0 1000 2000 3000 4000 5000 6000Number
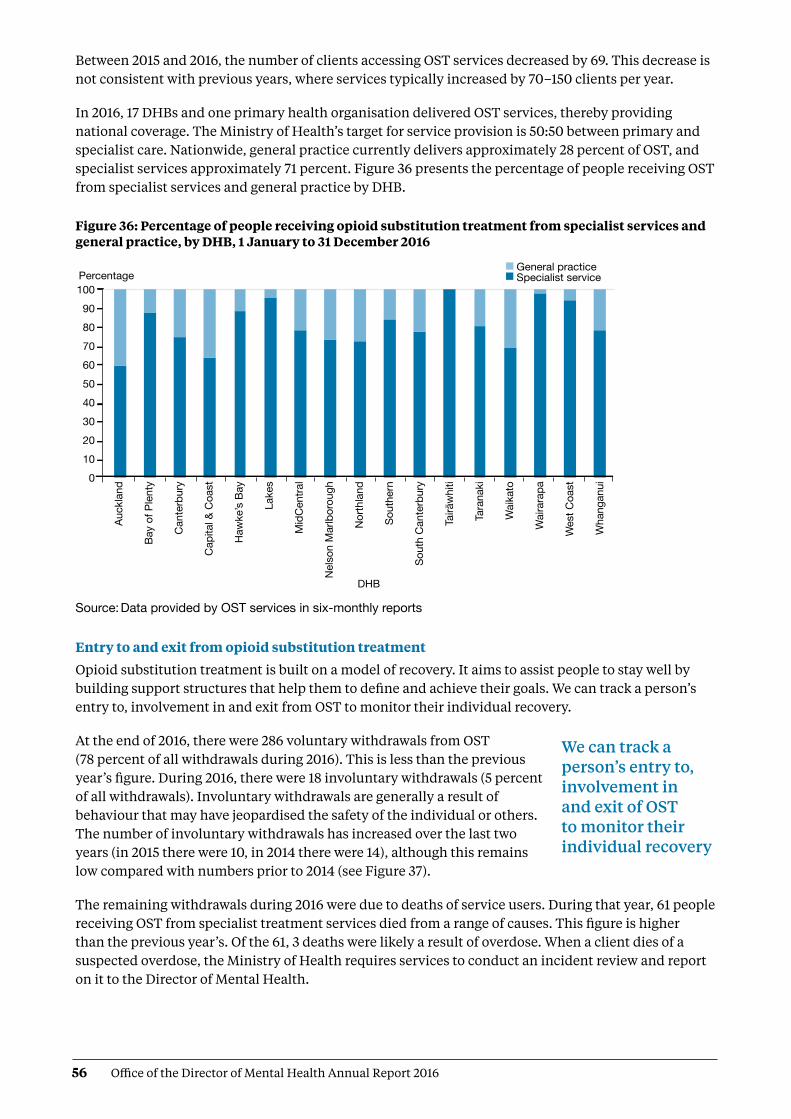
56 Office of the Director of Mental Health Annual Report 2016
Between 2015 and 2016, the number of clients accessing OST services decreased by 69. This decrease is not consistent with previous years, where services typically increased by 70–150 clients per year.
In 2016, 17 DHBs and one primary health organisation delivered OST services, thereby providing national coverage. The Ministry of Health’s target for service provision is 50:50 between primary and specialist care. Nationwide, general practice currently delivers approximately 28 percent of OST, and specialist services approximately 71 percent. Figure 36 presents the percentage of people receiving OST from specialist services and general practice by DHB.
Figure 36: Percentage of people receiving opioid substitution treatment from specialist services and general practice, by DHB, 1 January to 31 December 2016
Source: Data provided by OST services in six-monthly reports
Entry to and exit from opioid substitution treatment
Opioid substitution treatment is built on a model of recovery. It aims to assist people to stay well by building support structures that help them to define and achieve their goals. We can track a person’s entry to, involvement in and exit from OST to monitor their individual recovery.
At the end of 2016, there were 286 voluntary withdrawals from OST (78 percent of all withdrawals during 2016). This is less than the previous year’s figure. During 2016, there were 18 involuntary withdrawals (5 percent of all withdrawals). Involuntary withdrawals are generally a result of behaviour that may have jeopardised the safety of the individual or others. The number of involuntary withdrawals has increased over the last two years (in 2015 there were 10, in 2014 there were 14), although this remains low compared with numbers prior to 2014 (see Figure 37).
The remaining withdrawals during 2016 were due to deaths of service users. During that year, 61 people receiving OST from specialist treatment services died from a range of causes. This figure is higher than the previous year’s. Of the 61, 3 deaths were likely a result of overdose. When a client dies of a suspected overdose, the Ministry of Health requires services to conduct an incident review and report on it to the Director of Mental Health.
DirMHth2016 Fig 36
Percentage1009080706050403020100
DHB
Auck
land
Bay
of P
lent
y
Can
terb
ury
Cap
ital &
Coa
st
Haw
ke’s
Bay
Lake
s
Mid
Cen
tral
Nel
son
Mar
lbor
ough
Nor
thla
nd
Sout
hern
Sout
h C
ante
rbur
y
Tairāwhiti
Tara
naki
Wai
kato
Wai
rara
pa
Wes
t Coa
st
Wha
ngan
ui
General practiceSpecialist service
We can track a person’s entry to, involvement in and exit of OST to monitor their individual recovery

57Office of the Director of Mental Health Annual Report 2016
Figure 37: Percentage of withdrawals from opioid substitution treatment programmes, by reason (voluntary, involuntary or death), 2008–2016
Source: Data provided by OST services in six-monthly reports.
Methadone and Suboxone prescribing
Since July 2012, PHARMAC43 has funded Suboxone for OST. Since then, there has been a steady increase in the number of people prescribed it. Suboxone lowers the risk of diversion and its misuse is lower than that associated with methadone. In addition, Suboxone can be given in cumulative doses that last several days, rather than the daily dosing regimen that is required with methadone.
Figure 38: Number of people prescribed Suboxone, 2008–2016
Source: Data provided by OST services in six-monthly reports
The Alcoholism and Drug Addiction Act 1966The Alcoholism and Drug Addiction Act 1966 (the ADA Act) provides for the compulsory detention and treatment of people with severe substance dependence for up to two years at certified institutions.
In summary, in 2016:
• the Family Court granted 45 orders for either detention or committal under the ADA Act
• 24 of the granted orders were for voluntary detention (under section 8) and 21 were for involuntary committal (under section 9).
DirMHth2016 Fig 37Client deathsInvoluntaryVoluntary
100
90
80
70
60
50
40
30
20
10
02008 2009 2010 2011 2012 2013 2014 2015 2016 Year
Percentage
DirMHth2016 Fig 38
Number800
700
600
500
400
300
200
100
0 2008 2009 2010 2011 2012 2013 2014 2015 2016 Year
43 PHARMAC is the New Zealand government agency that decides which pharmaceuticals to publicly fund in New Zealand.
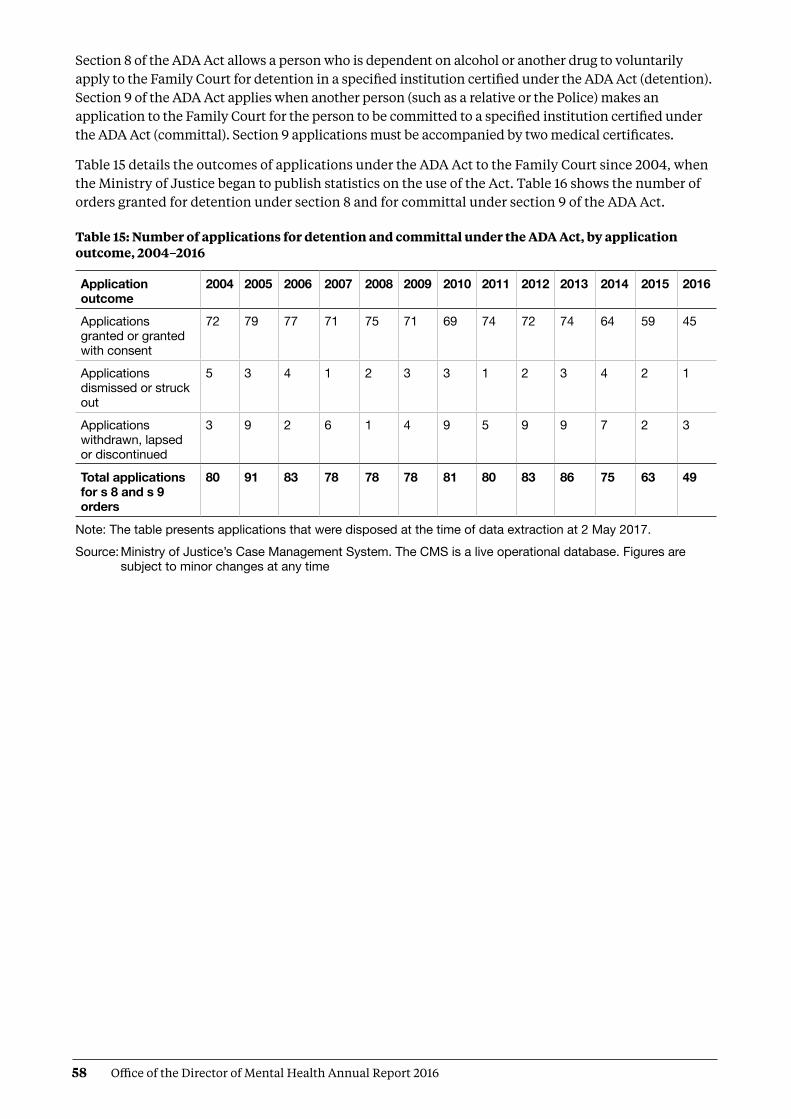
58 Office of the Director of Mental Health Annual Report 2016
Section 8 of the ADA Act allows a person who is dependent on alcohol or another drug to voluntarily apply to the Family Court for detention in a specified institution certified under the ADA Act (detention). Section 9 of the ADA Act applies when another person (such as a relative or the Police) makes an application to the Family Court for the person to be committed to a specified institution certified under the ADA Act (committal). Section 9 applications must be accompanied by two medical certificates.
Table 15 details the outcomes of applications under the ADA Act to the Family Court since 2004, when the Ministry of Justice began to publish statistics on the use of the Act. Table 16 shows the number of orders granted for detention under section 8 and for committal under section 9 of the ADA Act.
Table 15: Number of applications for detention and committal under the ADA Act, by application outcome, 2004–2016
Application outcome
2004 2005 2006 2007 2008 2009 2010 2011 2012 2013 2014 2015 2016
Applications granted or granted with consent
72 79 77 71 75 71 69 74 72 74 64 59 45
Applications dismissed or struck out
5 3 4 1 2 3 3 1 2 3 4 2 1
Applications withdrawn, lapsed or discontinued
3 9 2 6 1 4 9 5 9 9 7 2 3
Total applications for s 8 and s 9 orders
80 91 83 78 78 78 81 80 83 86 75 63 49
Note: The table presents applications that were disposed at the time of data extraction at 2 May 2017.Source: Ministry of Justice’s Case Management System. The CMS is a live operational database. Figures are
subject to minor changes at any time

59Office of the Director of Mental Health Annual Report 2016
Table 16: Number of granted orders for detention and committal, under the ADA Act, 2004–2016
YearNumber (and percentage) of section 8 applications
granted for detention
Number (and percentage) of section 9 applications granted
for committal
Total number of applications
granted
2004 44 (92%) 28 (85%) 72
2005 49 (96%) 30 (79%) 79
2006 60 (98%) 17 (77%) 77
2007 52 (100%) 19 (76%) 71
2008 63 (98%) 12 (86%) 75
2009 49 (98%) 22 (81%) 71
2010 55 (96%) 14 (58%) 69
2011 59 (97%) 15 (75%) 74
2012 61 (97%) 11 (58%) 72
2013 58 (94%) 16 (64%) 74
2014 50 (94%) 14 (64%) 64
2015 36 (100%) 23 (85%) 59
2016 24 (100%) 21 (81%) 45
Note: The table presents applications that were disposed at the time of data extraction on 2 May 2017.Source: Ministry of Justice’s Case Management System. The CMS is a live operational database. Figures are
subject to minor changes at any time
In October 2009, the Prime Minister announced a review of the ADA Act as part of a range of initiatives to reduce harm from methamphetamine. The Law Commission released its report Compulsory Treatment for Substance Dependence: A review of the Alcoholism and Drug Addiction Act 1966 in October 2012 (New Zealand Law Commission 2012). In 2012, Parliament introduced a Bill to repeal and replace the ADA Act.
The Substance Addiction (Compulsory Assessment and Treatment) Bill was introduced to Parliament in December 2015, intended to replace the ADA Act. It is expected that implementation of the Substance Addiction (Compulsory Assessment and Treatment) Act 2017 will begin in 2018. For more information on this, see page 14 of this report.
Electroconvulsive therapyElectroconvulsive therapy is a therapeutic procedure in which a brief pulse of electricity is delivered to a person’s brain in order to produce a seizure. It can be an effective treatment for various types of mental illness, including depressive illness, mania, catatonia and other serious neuropsychiatric conditions. It is often effective as a last resort in cases where medication is contraindicated or is not relieving symptoms sufficiently. It can only be given with the consent of the person receiving it, other than in certain carefully defined circumstances.
In summary, in 2016:
• 251 people received ECT (5.3 people per 100,000)
• services administered a total of 2,746 treatments of ECT
• those treated received an average of 10.9 administrations of ECT over the year
• females were more likely to receive ECT than males
• older people were more likely to receive ECT than younger people.

60 Office of the Director of Mental Health Annual Report 2016
Medical staff administer ECT under anaesthesia in an operating theatre, making use of muscle relaxants. The person who has received ECT wakes unable to recall the details of the procedure. The most common side effects of ECT are confusion, disorientation and memory loss. Confusion and disorientation typically clear within an hour, but memory loss can be persistent and in some cases even permanent (American Psychiatric Association 2001; Ministry of Health 2004).
Significant advances have been made in improving ECT techniques and reducing side effects over the last 20 years. Despite these improvements, ECT remains a controversial treatment. In 2003, in response to petition 1999/30 of Anna de Jonge and others regarding ECT, the Health Select Committee recommended that a review be carried out, independent of the Ministry of Health, on the safety and efficacy of ECT and the adequacy of regulatory controls on its use in New Zealand. The review concluded that ECT continues to have a place as a treatment option for consumers of mental health services in New Zealand, and that banning its use would deprive some seriously ill people of a potentially effective and sometimes life-saving means of treatment (Ministry of Health 2004).
In 2009, the Ministry of Health created a consumer resource on ECT as part of the 2003 Government response to the review (Ministry of Health 2009).
Changes in the use of ECT over time
The number of people treated with ECT in New Zealand has remained relatively stable since 2006. Around 200 to 300 people receive the treatment each year. When the increase in mental health service use during that time is taken into account, the rate of people treated with ECT can be seen to have declined (see Figure 39).
Figure 39: Number of people treated with electroconvulsive therapy per 100,000 service user population, 2005–2016
Source: PRIMHD data, extracted on 27 July 2017, except for Northland and Southern DHBs, which submitted data manually
A total of 251 people received ECT during the year ending 31 December 2016. Table 17 shows the total number of people who received ECT in 2016 by DHB of domicile.44 The total number of treatments administered over this period was 2,746, representing a mean of 10.9 treatments per person.
Although ECT is controversial, a 2004 independent review found that it continues to have a place as a mental health treatment option in New Zealand
DirMHth2016 Fig 39
Rate8.0
7.0
6.0
5.0
4.0
3.0
2.0
1.0
02005 2006 2007 2008 2009 2010 2011 2012 2013 2014 2015 2016 Year
44 The table presents data by DHB of domicile; that is, the area where a person lives. This takes account of the fact that some DHBs do not perform ECT; people who live in such areas are referred to other DHBs for ECT treatment. Other ECT statistics are presented by DHB of service.

61Office of the Director of Mental Health Annual Report 2016
Table 17: Electroconvulsive therapy indicators, by DHB of domicile, 1 January to 31 December 2016
DHB of domicile Number of people treated with ECT
Number of treatments
Mean number of treatments per person (range)
Auckland 21 217 10.3 (1–27)
Bay of Plenty 13 196 15.1 (1–54)
Canterbury 29 278 9.6 (2–34)
Capital & Coast 18 199 11.1 (1–19)
Counties Manukau 25 231 9.2 (1–20)
Hawke’s Bay 12 55 4.6 (1–16)
Hutt Valley 9 102 11.3 (3–22)
Lakes 12 77 6.4 (1–32)
MidCentral 11 93 8.5 (4–13)
Nelson Marlborough 6 77 12.8 (3–27)
Northland 6 119 19.8 (2–46)
South Canterbury – – –
Southern 26 306 11.8 (1–52)
Tairāwhiti 4 14 3.5 (1–10)
Taranaki 2 18 9.0 (7–11)
Waikato 38 472 12.4 (2–31)
Wairarapa 3 41 13.7 (10–16)
Waitemata 18 248 13.8 (1–39)
West Coast 1 3 3.0 (3–3)
Whanganui – – –
New Zealand 251 2746 10.9 (1–54)
Notes: In 2016, 22 people were treated out of area, as follows. Auckland DHB saw one person from Bay of Plenty, one from Taranaki and one from Waitemata. Bay of Plenty DHB saw one person from Lakes and one from Tairāwhiti. Canterbury DHB saw one person from Southern and one from West Coast. Capital & Coast DHB saw one person from Auckland and two from Hutt Valley. Counties Manukau DHB saw two people from Auckland Hutt Valley DHB saw two people from Capital & Coast, and three from Wairarapa. MidCentral DHB saw one person from Wairarapa. Southern DHB saw one person from Canterbury and one from overseas. Waikato DHB saw one person from Auckland. Waitemata DHB saw one person from Auckland.Source: PRIMHD data, extracted on 27 July 2017, except for Auckland, Northland and Southern DHBs, which
submitted data manually

62 Office of the Director of Mental Health Annual Report 2016
If a person was seen while living in two DHB areas they were counted under each DHB. The New Zealand total of 253 is a unique count and not a sum of this column in the table, as the New Zealand total excludes one individual who was treated by more than one DHB.
The national rate of people receiving ECT treatment in 2016 was 5.3 per 100,000. Figure 40 presents the rate of people treated with ECT by DHB of domicile. As Figure 40 shows, the rate of ECT treatments varies regionally. Several factors contribute to this. First, regions with smaller populations are more vulnerable to annual variations (according to the needs of the population at any given time). In addition, people receiving continuous or maintenance treatment will typically receive more treatments in a year than those treated with an acute course. Electroconvulsive therapy is indicated in older people more often than in younger adults because older people are more likely to have associated medical problems contraindicating medication. Finally, populations in some DHBs have better access to ECT services than others.
Figure 40: Rates of people treated with electroconvulsive therapy, by DHB of domicile, 1 January to 31 December 2016
Notes: As the numbers of people receiving ECT by DHB are so small, it is difficult to make meaningful comparisons between DHBs using rates per 100,000 population.
Confidence intervals (for 99 percent confidence) have been used to aid interpretation. Where a DHB region’s confidence interval crosses the national average, this means the DHB’s rate was not statistically significantly different to the national average.
Source: PRIMHD data, extracted on 27 July 2017, except for Northland and Southern DHBs, which submitted data manually
Consent to treatment
Section 60 of the Mental Health Act describes the process required for obtaining consent for ECT. Either the consent of the person themselves or a second opinion from a psychiatrist appointed by the Mental Health Review Tribunal is required.45 In the latter case, the psychiatrist must consider the treatment to be in the interests of the person.
This process allows for the treatment of people too unwell to consent to treatment. Clinicians should decide whether ECT is in the interests of the person after discussing the options with family/whānau and considering any relevant advance directives the person has made.46
DirMHth2016 Fig 40
DHB
National average
Auck
land
Bay
of P
lent
y
Can
terb
ury
Cap
ital &
Coa
st
Cou
ntie
s M
anuk
au
Haw
ke’s
Bay
Hut
t Val
ley
Lake
s
Mid
Cen
tral
Nel
son
Mar
lbor
ough
Nor
thla
nd
Sout
h C
ante
rbur
y
Sout
hern
Tairāwhiti
Tara
naki
Wai
kato
Wai
rara
pa
Wai
tem
ata
Wes
t Coa
st
Wha
ngan
ui
Rate30
25
20
15
10
5
0
45 This psychiatrist must be independent of the person’s clinical team.
46 Refer to the Guidelines to the Mental Health (Compulsory Assessment and Treatment) Act 1992 (Ministry of Health 2012d).

63Office of the Director of Mental Health Annual Report 2016
During 2016, 10 people were treated with ECT who retained decision-making capacity and refused consent. The total number of ECT treatments not able to be consented to increased from 576 in 2015 to 954 in 2016, which may be attributable to focused efforts by the Office of the Director of Mental Health during 2015 to improve reporting on non-consensual ECT. Table 18 shows the number of treatments administered without consent during 2016.
Table 18: Indicators for situations in which electroconvulsive therapy was not consented to, by DHB of service, 1 January to 31 December 2016
DHB of service Number of people given ECT who did not have
the capacity to consent
Number of administrations not able
to be consented to
Number of people given ECT who had capacity
and refused consent
Auckland 9 123 0
Bay of Plenty 5 66 0
Canterbury 9 56 0
Capital & Coast 2 20 0
Counties Manukau 10 101 1
Hawke’s Bay 0 0 0
Hutt Valley 4 27 2
Lakes 2 5 0
MidCentral 4 7 2
Nelson Marlborough 0 0 0
Northland 4 61 1
South Canterbury 0 0 0
Southern 11 124 0
Tairāwhiti 5 21 4
Taranaki 1 7 0
Waikato 13 136 0
Wairarapa – – –
Waitemata 13 200 0
West Coast – – –
Whanganui – –- –-
New Zealand 92 954 10
Notes: The data in this table cannot be reliably compared with the data in Table 17 above, as it relates to DHB of service rather than DHB of domicile.
A dash (–) indicates the DHB does not perform ECT. In this case, the DHB sends people to other DHBs for treatment.
Source: Manual data from DHBs (the Ministry of Health is currently unable to provide this data from PRIMHD)
Age and gender of patients treated with electroconvulsive therapy
Table 19 and Figure 41 present information on the age and sex of people treated with ECT in 2016. For this data, age group was determined by the individual’s age at the beginning of the reporting period. The majority of people (64 percent) treated with ECT were aged over 50 years in 2016.
In 2016, of the 251 people who received ECT treatment, 156 (62 percent) were female and 95 (38 percent) were male. The main reason for the gender difference is that more females present to mental health services with depressive disorders. This ratio is similar to that reported in other countries.

64 Office of the Director of Mental Health Annual Report 2016
Table 19: Number of people treated with electroconvulsive therapy, by age group and gender, 1 January to 31 December 2016
Age group (years) Female Male Total
15–19 2 3 5
20–24 12 5 17
25–29 3 3 6
30–34 8 5 13
35–39 10 8 18
40–44 9 6 15
45–49 11 6 17
50–54 14 6 20
55–59 17 11 28
60–64 13 14 27
65–69 18 7 25
70–74 19 14 33
75–79 10 3 13
80–84 6 4 10
85–89 3 0 3
90–95 1 0 1
Total 156 95 251
Source: PRIMHD data, extracted on 27 July 2017, except for Northland and Southern DHBs, which submitted data manually
Figure 41: Number of people treated with electroconvulsive therapy, by age group and gender, 1 January to 31 December 2016
Source: PRIMHD data, extracted on 27 July 2017, except for Northland and Southern DHBs, which submitted data manually
DirMHth2016 Fig 41
Number35
30
25
20
15
10
5
0
0–14
15–1
9
20–2
4
25–2
9
30–3
4
35–3
9
40–4
4
45–4
9
50–5
4
55–5
9
60–6
4
65–6
9
70–7
4
75–7
9
80–8
4
85–8
9
90–9
5
95+
Age group (years)
MaleFemale
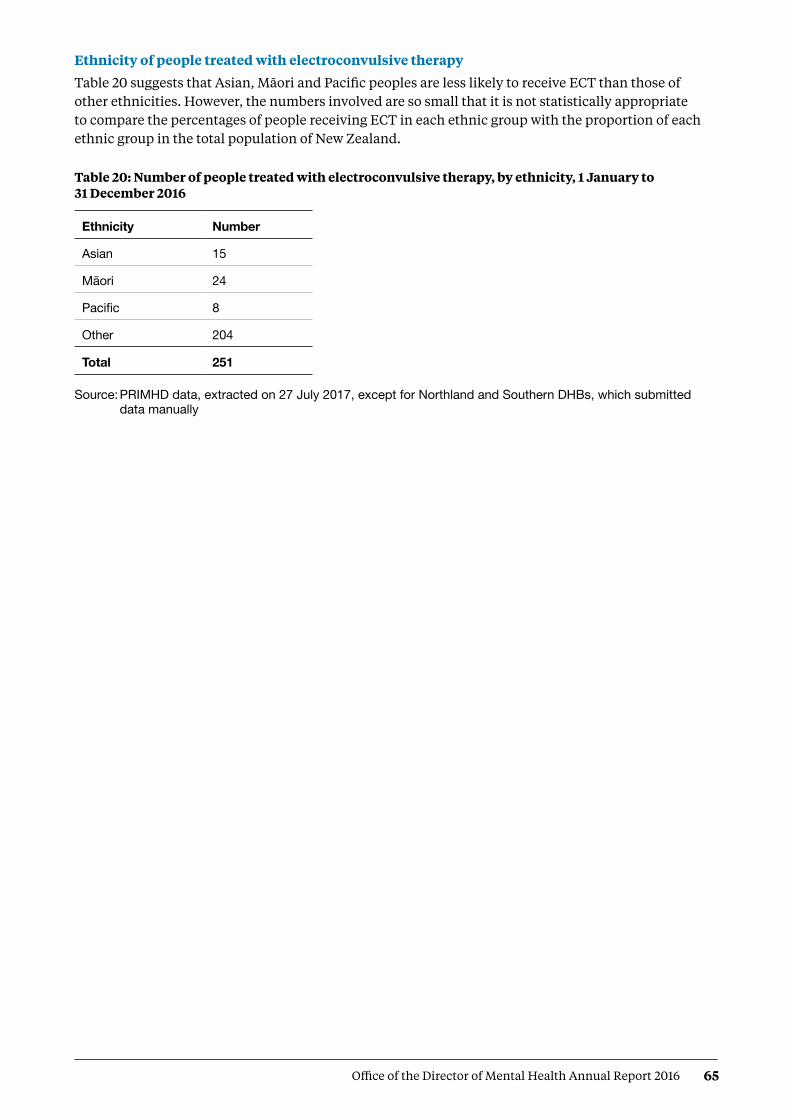
65Office of the Director of Mental Health Annual Report 2016
Ethnicity of people treated with electroconvulsive therapy
Table 20 suggests that Asian, Māori and Pacific peoples are less likely to receive ECT than those of other ethnicities. However, the numbers involved are so small that it is not statistically appropriate to compare the percentages of people receiving ECT in each ethnic group with the proportion of each ethnic group in the total population of New Zealand.
Table 20: Number of people treated with electroconvulsive therapy, by ethnicity, 1 January to 31 December 2016
Ethnicity Number
Asian 15
Māori 24
Pacific 8
Other 204
Total 251
Source: PRIMHD data, extracted on 27 July 2017, except for Northland and Southern DHBs, which submitted data manually

66 Office of the Director of Mental Health Annual Report 2016
ReferencesActionStation. 2017. The People’s Mental Health Report: A crowdfunded and crowdsourced story-based inquiry into the public mental health system in Aotearoa New Zealand. URL: www.peoplesmentalhealthreport.com/
American Psychiatric Association. 2001. The Practice of ECT: A task force report (2nd ed). Washington, DC: American Psychiatric Association.
Associate Minister of Health. 2006. New Zealand Suicide Prevention Strategy 2006–2016. Wellington: Ministry of Health.
Baker M. 2015. He Kai i nga Rangatira: He korero o nga whānau whaiora. Wellington: Te Rau Matatini Ltd.
Beautrais AL, Collings SCD, Ehrhardt P, et al. 2005. Suicide Prevention: A review of evidence of risk and protective factors, and points of effective intervention. Wellington: Ministry of Health.
Elder H, Tapsell R. 2013. Māori and the Mental Health Act. In J Dawson and K Gledhill (eds). New Zealand’s Mental Health Act in Practice. Wellington: Victoria University Press.
Huckshorn KA. 2005. Six Core Strategies to Reduce the Use of Seclusion and Restraint Planning Tool. Alexandria, VA: National Association of State Mental Health Program Directors.
Ministry of Health. 2004. Use of Electroconvulsive Therapy (ECT) in New Zealand: A review of efficacy, safety, and regulatory controls. Wellington: Ministry of Health.
Ministry of Health. 2006. Review of the Application of Section 7A of the Mental Health (Compulsory Assessment and Treatment) Act 1992. Wellington: Ministry of Health.
Ministry of Health. 2007. National Guidelines: Interim methadone prescribing. Wellington: Ministry of Health.
Ministry of Health. 2009. Electroconvulsive Therapy (ECT) in New Zealand: What you and your family and whānau need to know. Wellington: Ministry of Health.
Ministry of Health. 2010. Seclusion under the Mental Health (Compulsory Assessment and Treatment) Act 1992. Wellington: Ministry of Health.
Ministry of Health. 2012a. Guidelines for the Role and Function of Directors of Area Mental Health Services. Wellington: Ministry of Health.
Ministry of Health. 2012b. Guidelines for the Role and Function of District Inspectors Appointed under the Mental Health (Compulsory Assessment and Treatment) Act 1992. Wellington: Ministry of Health.
Ministry of Health. 2012c. Guidelines for the Role and Function of Duly Authorised Officers under the Mental Health Act 1992. Wellington: Ministry of Health.
Ministry of Health. 2012d. Guidelines to the Mental Health (Compulsory Assessment and Treatment) Act 1992. Wellington: Ministry of Health.
Ministry of Health. 2012e. Rising to the Challenge: The Mental Health and Addiction Service Development Plan 2012–2017. Wellington: Ministry of Health.
Ministry of Health. 2013a. New Zealand Suicide Prevention Action Plan 2013–2016. Wellington: Ministry of Health.
Ministry of Health. 2013b. PRIMHD: Mental health data. URL: www.health.govt.nz/nz-health-statistics/national-collections-and-surveys/collections/primhd-mental-health-data (accessed 8 September 2016).

67Office of the Director of Mental Health Annual Report 2016
Ministry of Health. 2014. New Zealand Practice Guidelines for Opioid Substitution Treatment. Wellington: Ministry of Health.
Ministry of Health. 2015a. Suicide Facts: Deaths and intentional self-harm hospitalisations 2012. Wellington: Ministry of Health.
Ministry of Health. 2016. New Zealand Health Strategy 2016–2026. Wellington: Ministry of Health.
New Zealand Law Commission. 2012. Compulsory Treatment for Substance Dependence: A review of the Alcoholism and Drug Addiction Act 1966. Wellington: New Zealand Law Commission.
Oakley Browne MA, Wells JE, Scott KM (eds). 2006. Te Rau Hinengaro: The New Zealand Mental Health Survey. Wellington: Ministry of Health.
Standards New Zealand. 2008a. Health and Disability Services (General) Standard. Wellington: Standards Council.
Standards New Zealand. 2008b. Health and Disability Services (Restraint Minimisation and Safe Practices) Standards. Wellington: Standards Council.

68 Office of the Director of Mental Health Annual Report 2016
Appendix 1: Caveats relating to the Programme for the Integration of Mental Health Data The Programme for the Integration of Mental Health Data, or PRIMHD (pronounced ‘primed’), is the Ministry of Health’s national collection for mental health and addiction service activity and outcome data for mental health consumers. PRIMHD data is used to report on what services are being provided, who is providing the services, and what outcomes are being achieved for health consumers across New Zealand’s mental health sector. These reports enable mental health and addiction service providers to carry out better service planning and decision-making at the local, regional and national levels (Ministry of Health 2013b). PRIMHD reports are invaluable for facilitating important conversations and debates about mental health issues in New Zealand.
In 2008, it became mandatory for DHBs to report to PRIMHD. In addition, from this date an increasing number of non-governmental organisations (NGOs) began reporting to the PRIMHD database. As of December 2016, 210 NGOs were reporting to PRIMHD.
Because of both its recent introduction and the enormous complexities of creating and maintaining a national data collection, the following caveats need to be kept in mind when reviewing statistics generated using PRIMHD data.
• Shifts or patterns in the data after 2008 may reflect the gradual adaptation of service providers to the PRIMHD system, in addition to, or instead of, any trend in mental health service use or consumer outcomes.
• PRIMHD is a living data collection that continues to be revised and updated as data reporting processes are improved. For this reason, previously published data may be liable to amendments.
• Statistical variance between services may reflect different models of practice and different consumer populations. However, inter-service variance may also result from differences in data entry processes and information management.
• To function as a national collection, PRIMHD requires integration with a wide range of person management systems across hundreds of unique service providers. As the services adjust to PRIMHD, it is expected that the quality of the data will improve.
• The quality and accuracy of statistical reporting relies on consistent, correct and timely data entry by the services that report to PRIMHD. The Ministry of Health is actively engaged in an ongoing project to review and improve the data quality of PRIMHD. This project is considered a priority given the importance of mental health data in providing information about mental health consumption and outcomes, and in generating conversations and public debate about how to improve mental health care for New Zealanders.

69Office of the Director of Mental Health Annual Report 2016
Appendix 2: Deputy Director of Mental Health: Dr Ian SoosayDr Ian Soosay joined the Ministry of Health in November 2016 as Deputy Director of Mental Health from his role as a Senior Lecturer at the University of Auckland.
Ian attended medical school in Edinburgh and went on to train in psychiatry in Edinburgh, Cambridge and London. Since moving to Auckland in 2009, he has worked in clinical roles across all three metropolitan DHBs in early intervention, general adult psychiatry and maternal mental health. Ian was also the Clinical Director for Raukura Hauora o Tainui PHO, which gave him valuable experience in primary care. Ian has been the psychiatrist responsible for Niue since 2010, which has aided his understanding of the mental health needs of Pasifika communities. In addition to his experience in the UK and New Zealand, Ian has worked for WHO in Indonesia in the aftermath of the 2004 tsunami and conducted mental health research in East Timor in 2004.
Ian is a Fellow of the Royal College of Psychiatrists. He has masters degrees in Social Epidemiology from University College London and in Mental Health Policy and Service Development from University Nova in Lisbon. He is based in Auckland, where he lives with his wife and daughter.
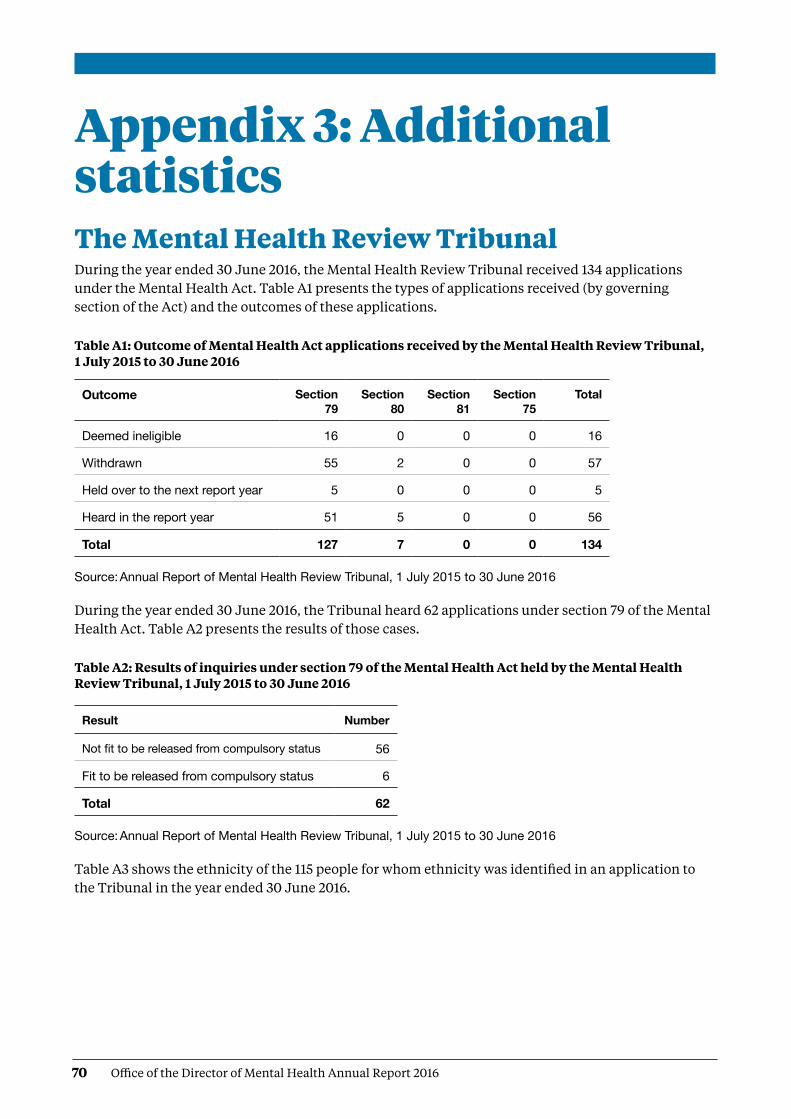
70 Office of the Director of Mental Health Annual Report 2016
Appendix 3: Additional statisticsThe Mental Health Review Tribunal During the year ended 30 June 2016, the Mental Health Review Tribunal received 134 applications under the Mental Health Act. Table A1 presents the types of applications received (by governing section of the Act) and the outcomes of these applications.
Table A1: Outcome of Mental Health Act applications received by the Mental Health Review Tribunal, 1 July 2015 to 30 June 2016
Outcome Section 79
Section 80
Section 81
Section 75
Total
Deemed ineligible 16 0 0 0 16
Withdrawn 55 2 0 0 57
Held over to the next report year 5 0 0 0 5
Heard in the report year 51 5 0 0 56
Total 127 7 0 0 134
Source: Annual Report of Mental Health Review Tribunal, 1 July 2015 to 30 June 2016
During the year ended 30 June 2016, the Tribunal heard 62 applications under section 79 of the Mental Health Act. Table A2 presents the results of those cases.
Table A2: Results of inquiries under section 79 of the Mental Health Act held by the Mental Health Review Tribunal, 1 July 2015 to 30 June 2016
Result Number
Not fit to be released from compulsory status 56
Fit to be released from compulsory status 6
Total 62
Source: Annual Report of Mental Health Review Tribunal, 1 July 2015 to 30 June 2016
Table A3 shows the ethnicity of the 115 people for whom ethnicity was identified in an application to the Tribunal in the year ended 30 June 2016.

71Office of the Director of Mental Health Annual Report 2016
Table A3: Ethnicity of people who identified their ethnicity in Mental Health Review Tribunal applications, 1 July 2015 to 30 June 2016
Ethnicity Number Percentage
New Zealand European 70 61%
Māori 23 20%
Pacific 3 3%
Asian 12 10%
Other 7 6%
Total 115 100%
Source: Annual Report of Mental Health Review Tribunal, 1 July 2015 to 30 June 2016
Of the 134 Mental Health Act applications received by the Tribunal during the year ended 30 June 2016, 88 (66%) were from males and 46 (34%) from females. Table A4 presents these figures.
Table A4: Gender of people making Mental Health Review Tribunal applications, 1 July 2015 to 30 June 2016
Subject of application Total number (percentage)
Gender Number
Community treatment order 97 (72%) FemaleMale
3760
Inpatient treatment order 30 (22%) FemaleMale
921
Special patient order 7 (5%) FemaleMale
07
Restricted person order 0 (0%) FemaleMale
0 0
Source: Annual Report of Mental Health Review Tribunal, 1 July 2015 to 30 June 2016

72 Office of the Director of Mental Health Annual Report 2016
Ministry of Justice statisticsTable A5 presents data on applications for a compulsory treatment order from 2004 to 2016. Table A6 shows the types of orders granted over the same period.
Table A5: Applications for compulsory treatment orders (or extensions), 2004–2016
Year
Number of applications
for a CTO, or extension to a
CTO
Number of applications granted, or
granted with consent
Number of applications
dismissed or struck out
Number of applications withdrawn,
lapsed or discontinued
Number of applications
transferred to the High Court
2004 4,443 3,863 100 460 0
2005 4,298 3,682 100 520 0
2006 4,254 3,643 109 515 1
2007 4,535 3,916 99 542 0
2008 4,633 3,969 103 485 0
2009 4,562 4,038 54 494 0
2010 4,783 4,156 74 523 1
2011 4,780 4,215 70 516 0
2012 4,885 4,343 71 443 0
2013 5,062 4,607 68 411 0
2014 5,227 4,632 47 575 0
2015 5,367 4,746 52 550 0
2016 5,602 4,921 70 544 0
Notes: The table presents applications that had been processed at the time of data extraction on 2 May 2017. The year is determined by the final outcome date.
CTO = Compulsory treatment order.Source: Ministry of Justice’s Integrated Sector Intelligence System, which uses data entered into the Case
Management System. The CMS is a live operational database. Figures are subject to minor changes at any time

73Office of the Director of Mental Health Annual Report 2016
Table A6: Types of compulsory treatment orders made on granted applications, 2004–2016
Year Number of granted
applications for orders
Number of compulsory community
treatment orders (or extension)
Number of compulsory
inpatient treatment orders
(or extension)
Number of orders recorded as
both compulsory community and
inpatient treatment orders (or extension)
Number of applications where type
of order not recorded
2004 3,863 1,832 1,534 117 368
2005 3,682 1,576 1,439 92 565
2006 3,643 1,614 1,384 91 540
2007 3,916 1,716 1,336 116 725
2008 3,969 1,841 1,430 120 565
2009 4,038 2,085 1,564 106 268
2010 4,156 2,253 1,625 111 158
2011 4,215 2,255 1,677 90 185
2012 4,343 2,437 1,684 78 141
2013 4,607 2,640 1,765 71 130
2014 4,632 2,659 1,784 83 105
2015 4,746 2,802 1,791 66 86
2016 4,921 2,888 1,722 63 245
Notes: The table presents applications that had been processed at the time of data extraction on 2 May 2017. The year is determined by the final outcome date.
Where more than one type of order is shown, it is likely to be because new orders are being linked to a previous application in the CMS.
Source: Ministry of Justice’s Integrated Sector Intelligence System, which uses data entered into the Case Management System. The CMS is a live operational database. Figures are subject to minor changes at any time

74 Office of the Director of Mental Health Annual Report 2016
Special patient legal status types
Act Section Special patient type
CP(MIP) Act Section 38(2)(c) Other
CP(MIP) Act Section 24(2)(a) (Unfit to stand trial) EFC
CP(MIP) Act Section 24(2)(a) (Found to be insane) EFC
CP(MIP) Act Section 44(1) Other
CP(MIP) Act Section 34(1)(a)(i) SFC
CP(MIP) Act Section 23 Other
CP(MIP) Act Section 35 Other
MH (CAT) Act Section 55, Restricted EFC
MH (CAT) Act Special Patient, Sections 45 and 11 SFC
MH (CAT) Act Sections 45 and 13 SFC
MH (CAT) Act Section 46 SFC
MH (CAT) Act Sections 45 and 30 Extension SFC
MH (CAT) Act Sections 45 and 14 SFC
MH (CAT) Act Sections 45 and 30 SFC
MH (CAT) Act Sections 45 and 15(1) SFC
MH (CAT) Act Sections 45 and 15(2) SFC
MH(CAT) Act = Mental Health ActCP(MIP) = Criminal Procedure (Mentally Impaired Persons) Act
75Office of the Director of Mental Health Annual Report 2016
Appendix 4: Developments in mental health and addiction reporting and improvementUpdated National Adverse Events Reporting Policy 2017 The Health Quality & Safety Commission’s (the Commission’s) Adverse Events Learning Programme continues to focus on learning from reviews of adverse events, including those in mental health and addiction services. Following broad consultation, the Commission released the updated National Adverse Events Reporting Policy on 1 July 2017 (the 2017 Policy), with a number of associated guidance documents and resources.47
The 2017 Policy supports a shift so that adverse events within mental health and addiction services will follow the same reporting and review processes as non-mental health and addiction events. Since 2013, adverse events relating to users of DHB-funded mental health and addiction services have been reported to the Commission, in line with the Policy, but publicly reported by the Office of the Director of Mental Health (ODMH). Historically, most adverse events occurring in mental health and addiction services were reviewed using the London Protocol,48 as this methodology was deemed by the sector to be more suitable than the root cause analysis approach more commonly used in the wider health and disability sector.
In the updated Policy, separate reporting and review processes specific to mental health and addiction services have been removed. The 2017 Policy allows for use of a broader range of review methodologies, including those more suited to mental health and addiction services. The Commission is working with the ODMH to determine how the learnings from these reviews will be reported and shared in the future. In the meantime, numbers of events will continue to be shared through the ODMH annual report, and learnings from reviews will be shared through the Commission’s Open Book reports and other learning forums.
The 2017 Policy covers all adverse events, including those occurring in mental health and addiction services, and offers flexibility for providers to select the most appropriate review methodology when undertaking review of adverse events.
47 https://www.hqsc.govt.nz/our-programmes/adverse-events/national-adverse-events-policy/
48 http://www.imperial.ac.uk/media/imperial-college/medicine/surgery-cancer/pstrc/londonprotocol_e.pdf
76 Office of the Director of Mental Health Annual Report 2016
49 Based on the Collaborative Breakthrough Series Methodology, by the Institute for Healthcare Improvement. The Breakthrough Series: IHI’s Collaborative Model for Achieving Breakthrough Improvement. IHI Innovation Series white paper. Boston: Institute for Healthcare Improvement; 2003. (Available at http://www.ihi.org/resources/Pages/IHIWhitePapers/TheBreakthroughSeriesIHIsCollaborativeModelforAchievingBreakthroughImprovement.aspx).
50 The wording of these five priority areas may change slightly when the mental health and addictions quality improvement programme is finalised, but the topic themes will remain the same.
51 http://www.health.govt.nz/publication/new-zealand-suicide-prevention-action-plan-2013-2016
52 www.hqsc.govt.nz/our-programmes/mrc/sumrc/publications-and-resources/publication/2471/.
National mental health and addiction quality improvement programmeOn 1 July 2017, a new five-year national mental health and addiction quality improvement programme, led by the Commission, was launched by the Minister of Health. This programme will see the Commission work with consumers, their families/whānau and service providers to continue to improve the quality of mental health and addiction services in New Zealand.
The programme will use improvement science49 to test evidence-based changes and interventions locally, to measure the impact of these changes and, if they are successful, to work with other services to implement the changes more widely. It will focus on five priority areas.50
1. Minimising restrictive care
2. Improving medication management and prescribing
3. Improving service transitions
4. Maximising the physical health of people with mental health and addiction problems
5. Learning from serious adverse events and consumer experience.
As well as leading this work, the Commission will also support leadership in the sector to deliver quality improvement initiatives and to build quality improvement capability within mental health and addiction services.
Suicide Mortality Review CommitteeSuicide is a major cause of death in New Zealand and the most common cause of death for young people. In September 2013, the Ministry of Health contracted the Commission to trial a suicide mortality review, an action set out in the New Zealand Suicide Prevention Action Plan 2013–16.51 This resulted in establishing the Suicide Mortality Review Committee (SuMRC) within the Commission and the Suicide Mortality Review Feasibility Study.
The Commission published the resulting reports, including recommendations, in May 2016.52
Following the successful SuMRC trial, the Minister of Health announced in July 2017 that SuMRC will receive funding for ongoing work. The SuMRC will provide vital knowledge about factors and patterns of suicide to guide new suicide prevention activities and reinforce and strengthen existing activities. The first meeting of the SuMRC took place in September 2017.