Annual Register Verification Training 0 Presented by the Office of Auditor General.

THE REPUBLIC OF UGANDA
OFFICE OF THE AUDITOR GENERAL
ANNUAL REPORT OF THE AUDITOR GENERAL
FOR THE YEAR ENDED 30TH JUNE 2008
VOLUME 5
VALUE FOR MONEY AUDITS

i
TABLE OF CONTENTS
Page
LIST OF ABBREVIATIONS ……………….………………………………………………….… iii
1.0 OVERVIEW ………………….…….…………………………………………………….. 1
1.1 Mandate ……………………………………………………………………………………………….…….. 1
1.2 Vision ……………………………………………………………………………………………………….... 2
1.3 Scope of Auditor Generals Work in Relation to VFM Audits …………………………….… 2
1.4 Performance of VFM Unit ……………………………………………………………………………… 4
2.0 NATIONAL AGRICULTURAL AND ADVISORY SERVICES PROGRAMME ….. 7
ADVISORY AND INFORMATION SERVICES COMPONENT
2.1 Background …….………………………………………………………………………………………….. 7
2.2 Findings ………………………………………………………………………………………………….….. 10
2.3 Conclusions …………………………………………………………………………………………….….. 17
2.4 Recommendations ……………………………………………………………………………………..… 19
3.0 DISTRIBUTION OF WATER TO URBAN AREAS BY NATIONAL ……………... 23
WATER AND SEWERAGE CORPORATION
3.1 Introduction …………………………………………………………………………………………….…. 23
3.2 Findings …………………………………………………………………………………………………….. 26
3.3 Conclusions ………………………………………………………………………………………………… 39
3.4 Recommendations …………………………………………………………………………………….…. 40
4.0 IMPLEMENTATION OF NORTHWEST SMALLHOLDER AGRICULTURAL …... 43
DEVELOPMENT PROJECT (NSADP) - MINISTRY OF AGRICULTURE
ANIMAL INDUSTRY AND FISHERIES
4.1 Introduction ……………………………………………………………………………………………..…. 43
4.2 Findings ……………………………………………………………………………………………………... 47
4.3 Conclusions ……………………………………………………………………………………………….… 60
4.4 Recommendations ……………………………………………………………………………………….. 61
5.0 PREVENTION AND CONTROL OF LIVESTOCK DISEASES BY THE ………..… 64
DEPARTMENT OF LIVESTOCK HEALTH AND ENTOMOLOGY IN THE
MINISTRY OF AGRICULTURE ANIMAL INDUSTRY AND FISHERIES
5.1 Introduction ………………………………………………………………………………………………... 64
5.2 Findings ………………………………………………………………………………………………….…. 69
5.3 Conclusions …………………………………………………………………………………………………. 91
5.4 Recommendations ……………………………………………………………………………………….. 94
ii
6.0 PROVISION OF WATER AND MAINTENANCE OF WATER FACILITIES 98
IN DISTRICT LOCAL GOVERNMENTS BY THE DIRECTORATE OF
WATER DEVELOPMENT, MINISTRY OF WATER AND ENVIRONMENT
6.1 Introduction ….……………………………………………………………………………………………. 98
6.2 Findings ………….………………………………………………………………………………………….. 101
6.3 Conclusions …………………………………………………………………………………………….…… 111
6.4 Recommendations ………………………………………………………………………………………… 111
7.0 UGANDA AIDS CONTROL PROJECT ………………………………………………. 114
7.1 Introduction ………………………………………………………………………………………………… 114
7.2 Findings ………………………………………………………………………………………………………. 118
7.3 Conclusions …………………………………………………………………………………………………. 130
7.4 Recommendations ……………………………………………………………………………………….. 131
8.0 MANAGEMENT OF HEALTH PROGRAMMES IN THE HEALTH ……………….. 133
SECTOR MINISTRY OF HEALTH
8.1 Introduction …………………………………………………………………………………………………. 133
8.2 Findings ………………………………………………………………………………………………………. 137
8.3 Conclusions …………………………………………………………………………………………………. 169
8.4 Recommendations ……………………………………………………………………………………….. 172
9.0 UNIVERSAL PRIMARY EDUCATION PROGRAMME ……………………………. 176
9.1 Introduction ………………………………………………………………………………………………… 176
9.2 School Facilities Grant ………………………………………………………………………………….. 182
9.3 Funds Flow and Management of Capitation Grant …………………………………………… 206
9.4 SFG: Technical Appraisal Review …………………………………………………………………… 215
GLOSSARY OF TERMS …………………………………………………………………………. 226

iii
LIST OF ABBREVIATIONS
ACP Animal Check Point
ADB African Development Bank.
ADF African Development Fund
AFROSAI-E African Organization of Supreme Audit Institutions (English speaking)
AG Auditor General
AHG Animal Holding Ground
AHO Animal Husbandry Officer
AI Avian Influenza
AIDS Acquired Immune Deficiency Syndrome
ANC Ante Natal Care/Ante Natal Clinic
AQN Audit Question
AQS Animal Quarantine Station
ARDC Agriculture Research Development Center
ARRIS Animal Resources Research Information system
ASC Assessment Criteria
ASF African Swine Fever
AWPB Annual Work Plan and Budget
AWPBs Annual Work Plan and Budgets
BEMOC Basic Emergency Obstetric Care
bn Billion
BOU Bank of Uganda
BP Blood Pressure
CAO Chief Administrative Officer
CAOs Chief Administrative Officers
CBMS Community Based Maintenance System
CBO Community Based Organization
CBPP Contagious Bovine Pleuro pneumonia
CCPP Contagious Caprine Pleuro pneumonia
CDD Control of Diarrhea Diseases
CEMOC Comprehensive Emergency Obstetric Care
CFO Chief Finance officer
CG Capitation Grants

iv
CHOGM Commonwealth Heads of Governments Meeting
CIA Chief Internal Auditor
CITES Convention on International Trade in Endangered Species of Wild Fauna
and Flora
COCTU Coordinating Office for the Control of Trypanosomiasis in Uganda
CSO Civil Society Organisation
DANIDA Danish International Development Agency.
DDHS District Director of Health Services
DDP District Development Plan.
DDSP District Development Support Programme
DE District Entomologist
DEO District Education Officer
DFID Department for International Development
DFIs District Farm Institutes
DIM District Implementation Manual.
DLG District Local Government.
DPCs District Project Coordinators
DSC District Service Commission
DTACs District Technical Advisory Committees
DTB District Tender Board
DVO District Veterinary Officer
DWD Directorate of Water Development
DWO District Water Officer.
DWSCG District Water and Sanitation Conditional Grant.
EAC East African Community
ECF East Coast Fever
EMOC Emergency Obstetric Care
ESIP Education Strategic Investment Programme
EU European Union
FAO Food and Agriculture Organization
FBO Faith Based Organizations.
FB-PNFP Facility Based Private Not for Profit
FDS Fiscal Decentralization System
FEWs Field Extension Workers
FH Fire Hydrant
v
FITCA Farming in Tsetse Control Areas of East Africa
FMD Foot and Mouth Disease
FMS Fixed Monitoring Sites
FTD Flies per Trap per day
FY Financial Year
GDP Gross Domestic Product
GoU Government of Uganda
HBMF Home Based Management of Fever
HCs Health Centers
HIPC Highly Indebted Poor Countries
HIV Human Immunodeficiency Virus
HMIS Health Management Information System
HPM Hand Pump Mechanic.
HSC Health Service Commission
HSD Health Sub District
HSSP Health Sector Strategic Plan
IDA International Development Association
IDAMC Internally Delegated Area Management Contract
IDP Internally Displaced People
IEC Information, Education and Counseling
IFMS Integrated Financial Management System
IMCI Integrated Management of Childhood Illnesses
IMF International Monetary Fund
IMR Infant Mortality Rate
INTOSAI International Organisation of Supreme Audit Institutions
ISO International Standards Organisation
IT Information Technology
ITNs Insect Treated Nets
IWA International Water Association
JRM Joint Review Missions
LC Local council
LCA Local Currency Account
LG Local Government
LGDP Local Government Development Programme
LSD Lumpy Skin Disease
vi
M&E Monitoring and Evaluation
MAAIF Ministry of Agriculture Animal Industry and Fisheries
MDG Millennium Development Goals
MMR Maternal Mortality Rate
MOD Ministry of Defence
MOE Ministry Of Energy
MoES Ministry of Education and Sports
MOFA Ministry of Foreign Affairs
MoFPED Ministry of Finance, Planning and Economic Development
MOGLSD Ministry of Gender, Labour and Social Development.
MOH Ministry of Health
MOJCA Ministry of Justice and Constitution Affairs
MoLG Ministry of Local Government
MOPS Ministry Of Public Service
MoU Memorandum of Understanding
MoWE Ministry of Water and Environment
MoWHC Ministry of Works, Housing and Communications
MSCL Micro Finance Support Centre Limited
NF Non-Functional
NAA National Audit Act
NAADS National Agricultural Advisory Services
NAGRC&DB National Animal Genetic Resource Centre and Data Bank
NALIRRI National Animal Livestock Resources Research Institute
NARO National Agriculture Research Organisation
NCD New Castle Disease
NDA National Drug Authority
NGO’s Non-Governmental Organisations
NHP National Health Policy
NLPIP National Livestock Productivity Improvement Project
NMS National Medical Stores
NPA National Planning Authority
NPC National Project Coordinator
NPCU National Project Coordination Unit
NPSC National Project Steering Committee
NRW Non-Revenue Water

vii
NSADP North-West Smallholders Agricultural Development Project
NSR National Stock Routes
NUSAF Northern Uganda Social Action Fund
NWSC National Water and Sewerage Corporations
O&M Operation and Maintenance.
OAG Office of the Auditor General
OIE World Organization for Animal Health
OOP Office of the President.
OPD Outpatients Department
ORT Oral Rehydration Therapy
PA Project Accountant
PACE Pan African Program for the Control of Epizootics
PAF Poverty Action Fund
PAP Possible Audit Problem
PATTEC Pan African Tsetse and Trypanosomiasis Eradication Campaign
PE Project Engineer
PEAP Poverty Eradication Action Plan
PFAA Public Finance and Accountability Act
PHC Public Health Care
PMA Plan for Modernization of Agriculture
PMTCT Prevention of Mother to Child Transmission
PPDA Public Procurement and Disposal of Public Assets
PPR Peste des Petits Ruminats
PRA Participatory Rural Appraisal
PS Permanent Secretary
PVI Principal Veterinary Inspector
PVO Principal Veterinary Officer
QMS Quality Management System
RDC Resident District Commissioner
RH Reproductive Health
RPV Rinderpest Virus
RVF Rift Valley Fever
RWSS Rural water Supply and Sanitation.
SA Special Account
SACCOS Savings and Credit Cooperative Societies

viii
SAI Supreme Audit Institutions
SC Statutory Corporations
SFG School Facilitation Grant
Shs Shillings
SMC School Management Committee
SMS Subject Matter Specialist
SVI Senior Veterinary Inspector
SVO Senior Veterinary Officer
SWAP Sector Wide Approach
TA Technical Advisor
TAD Trans-boundary Animal Diseases
TBA Traditional Birth Attendant
TBD Tick Borne Diseases
ToT Training of Trainers
TSU Technical Support Unit.
UA Unit of Account (ADF)
UBOS Uganda Bureau of Statistics
UCB Uganda Commercial Bank
UCDA Uganda Coffee Development Authority
Ug. Shs Uganda Shillings
UIA Uganda Investment Authority
UMHCP Uganda Minimum Heath Care Package
UN United Nations
UNBS Uganda National Bureau of Standards
UNCS&T Uganda National Council for Science and Technology
UNDP United Nations Development Programme
UNFA Uganda National Farmers Association
UNICEF United Nations International Children’s Emergency Fund
UPE Universal Primary Education
UPHOLD Uganda Programme for Human and Holistic Development
URA Uganda Revenue Authority
US $ United States Dollar
USAID United States Agency for International Development
UVA Uganda Veterinary Association
UVB Uganda Veterinary Board

ix
UVRI Uganda Virus Research Institute
UWA Uganda Wildlife Authority
VFM Value for Money
VO Veterinary Officer
WHO World Health Organization
WUC Water User Committee.
www World wide web

1.0 OVERVIEW
This is Volume 5 of the Auditor General’s annual report to Parliament. It contains summarised
reports of nine Value for Money (VFM) audit detailing findings, conclusions and recommendations
made for each of the VFM studies. The full reports are available upon request form the Office of
the Auditor General.
1.1 MANDATE
The 1995 Constitution of the Republic of Uganda and the National Audit Act, 2008 require the
Auditor General to undertake Financial and Value for Money Audits and report to Parliament as
set below:
The Constitutional provisions are as follows: -
1.1.1 Article 163 (3) of the Constitution requires the Auditor General to:
(a) Audit and report on the public accounts of Uganda and of all public offices including the
courts, the central and local government administrations, universities and public
institutions of like nature, and any public corporation or other bodies or organizations
established by an Act of Parliament; and
(b) Conduct Financial and value for money audits in respect of any project involving public
funds.
1.1.2 Under Article 163 (4) the Auditor General is required to submit to Parliament
annually a report of the accounts audited by him or her or under clause (3) of this article.
1

1.1.3 The National Audit Act, 2008 (NAA)
The NAA, under section 21, gives powers to the Auditor General to carry out Value for Money
audits for purposes of establishing economy, efficiency and effectiveness of the operations of any
department or ministry, local government councils and any Public organization.
1.2 VISION
The vision of the office of the Auditor General is “To be an Effective and Efficient Supreme Audit
Institution (SAI) in promoting public Accountability in the use of Resources in the enhancement
of good governance”.
1.2.1 Mission
The mission of the office of the Auditor General is “To audit and report to the Public and there by
make an effective contribution in improving public accountability”.
1.2.2 Core Values
The office of the Auditor General is run on three (3) specific core values which motivate and
guide staff in their endeavours to achieve the vision and mission of the office. These core values
are:-
• Integrity
• Objectivity and
• Professional Competence
1.3 SCOPE OF AUDITOR GENERAL’S WORK IN RELATION TO VFM AUDITS.
1.3.1 The Audit
A VFM audit is an examination which provides an objective and constructive assessment of the
extent to which the audited body has used its resources in carrying out its responsibilities with
2

due regard to economy, efficiency and effectiveness. VFM audits endeavor to evaluate if
activities, programmes or projects involving public funds in ministries, departments, local
government councils and any public organizations have been managed with respect to those
criteria of economy, efficiency and effectiveness and the extent to which they might have not
been met. In precise terms economy, efficiency and effectiveness can be defined as follows:-
• Economy- Minimizing the cost of resources used for an activity, having regard to the
appropriate quality
• Efficiency- The relationship between the outputs, in terms of goods, services and results,
and the resources used to produce them
• Effectiveness- The extent to which objectives are achieved and the relationship between
the intended impact and the actual impact of an activity.
Value for Money audits are conducted in accordance with International Organization of Supreme
Audit Institutions (INTOSAI) standards. Those standards require that a performance audit should
be planned, conducted and reported on in a manner, which ensures that an audit of high quality
is carried out in an economic, efficient and effective way and in a timely manner.
In carrying out such an audit, the auditor takes an in-depth look at the way a particular Ministry,
Project or Public Institution has planned the task undertaken and whether good management
practices and sound judgment were applied.
A VFM audit attempts to determine if the initial objectives set at the beginning of an undertaking
were achieved. As a consequence of that, it is deduced as to whether due regard for efficiency,
effectiveness and economy is present and recommendations for improvement are made in
those areas where it is felt that deficiencies have occurred.
1.3.2 Reporting Period:
Financial audits refer to a fixed reporting period and attract an annual certificate of “fitness” on
those Financial Statements. Value for Money Audits are not necessarily time bound or defined
and do not attract a certificate as part of the report. The VFM reports have therefore been
tailored to the statutory reporting time frame of the OAG which is 9 months after the financial
3
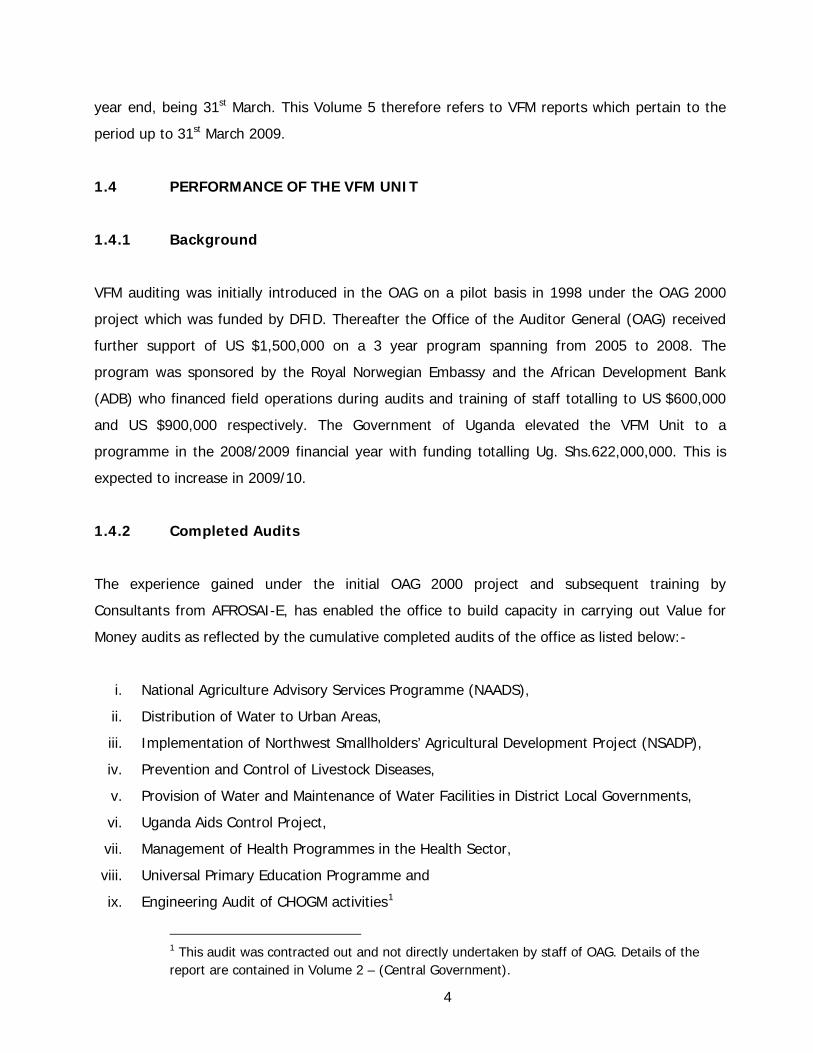
year end, being 31st March. This Volume 5 therefore refers to VFM reports which pertain to the
period up to 31st March 2009.
1.4 PERFORMANCE OF THE VFM UNIT
1.4.1 Background
VFM auditing was initially introduced in the OAG on a pilot basis in 1998 under the OAG 2000
project which was funded by DFID. Thereafter the Office of the Auditor General (OAG) received
further support of US $1,500,000 on a 3 year program spanning from 2005 to 2008. The
program was sponsored by the Royal Norwegian Embassy and the African Development Bank
(ADB) who financed field operations during audits and training of staff totalling to US $600,000
and US $900,000 respectively. The Government of Uganda elevated the VFM Unit to a
programme in the 2008/2009 financial year with funding totalling Ug. Shs.622,000,000. This is
expected to increase in 2009/10.
1.4.2 Completed Audits
The experience gained under the initial OAG 2000 project and subsequent training by
Consultants from AFROSAI-E, has enabled the office to build capacity in carrying out Value for
Money audits as reflected by the cumulative completed audits of the office as listed below:-
i. National Agriculture Advisory Services Programme (NAADS),
ii. Distribution of Water to Urban Areas,
iii. Implementation of Northwest Smallholders’ Agricultural Development Project (NSADP),
iv. Prevention and Control of Livestock Diseases,
v. Provision of Water and Maintenance of Water Facilities in District Local Governments,
vi. Uganda Aids Control Project,
vii. Management of Health Programmes in the Health Sector,
viii. Universal Primary Education Programme and
ix. Engineering Audit of CHOGM activities1
1 This audit was contracted out and not directly undertaken by staff of OAG. Details of the report are contained in Volume 2 – (Central Government).
4

1.4.3 VFM Audits under progress
A total of a further twelve (12) VFM audits have been initiated by the VFM unit and are at
different stages of execution. They are planned to be completed and a report submitted to
Parliament in the following year. They are:-
i. Garbage Collection in Kampala City Council,
ii. Rural Roads Maintenance,
iii. National Planning Authority,
iv. Northern Uganda Social Action Fund (NUSAF),
v. Passport production time by the Passport Control Office,
vi. Management of Prison Services,
vii. Management of Pension,
viii. Inspection of Schools,
ix. Debt Management,
x. Distribution of Relief Items by the Office of the Prime Minister,
xi. Regulation and Enforcement of Standards by Uganda National Bureau of Standards
(UNBS) and
xii. Distribution of drugs by National Medical Stores (NMS).
1.4.4 Training
A total of fifty (50) OAG staff have completed specialist training in conducting VFM audits under a
program funded by Development Partners as mentioned in Paragraph 1.4.1. The office has
planned to carry out more training of the VFM staff in other areas such as data collection
methods and analysis, Training of Trainers (ToT) course and use of the OAG VFM Audit Manual
to enhance their performance.
In addition to training, the office plans to carry out stakeholders’ awareness campaigns. The
campaigns will target staff of OAG who undertake other types of audits, Members of Parliament,
Donors, Councillors of Local Governments, Accounting Officers, media groups, Civic Society and
other Government officials.
5

1.4.5 Future Developments
The VFM Unit is proposing to undertake the following strategic activities to improve its
performance:-
a) Transforming the VFM unit into a fully fledged Directorate,
b) Strengthening the new Directorate by Identifying trained staff to fill the vacant positions,
b) Creating an effective training unit,
c) Establishing manpower planning procedures,
d) Establishing effective quality assurance review mechanisms,
e) Moving VFM processes onto an IT Platform.
6

2.0 NATIONAL AGRICULTURAL AND ADVISORY SERVICES
(NAADS) PROGRAMME: ADVISORY AND INFORMATION
SERVICES COMPONENT – (ISSUED NOVEMBER 2008)
2.1 BACKGROUND
2.1.1 Introduction
The National Agricultural Advisory Services (NAADS) Programme is a Government project
which specifically undertakes new approaches to Agriculture extension delivery conceived
under the Plan for Modernization of Agriculture (PMA) to redress shortcomings and incorporate
best practice features to make Agriculture extension delivery systems more efficient and
effective. It was designed taking in account with Government policies of decentralization,
liberalization, privatization, empowerment of the people in decision making for development
processes, and increasing public sector coordination and accountability. This study has been
undertaken to assess the efficiency and effectiveness of the Agricultural Advisory Services.
2.1.2 Motivation
The national economy of Uganda has been growing at an average of 5% per annum for the
last decade while the monetary sector has grown by 9%. However Uganda’s population
remains largely poor with GDP per capita averaging US$ 330, with up to 40% of the people
living in absolute poverty. The rural poor have not benefited from the economic growth and
remain outside the monetary economy mainly producing for subsistence.
Food crop production still accounts for at least 65% of agriculture GDP and agriculture
continues to be characterized by low productivity despite the Governments response to these
challenges in 1997 by way of Poverty Eradication Action Plan (PEAP), whose main goal is to
raise small holder farm incomes. Under the PEAP, government directed funds from the debt
relief from the donor community under the Highly Indebted Poor Countries (HIPC) initiative
estimated at US$ 650 million through a special fund, the Poverty Action Fund (PAF) to social
development particularly rural transformation and modernization of agriculture to cover a
period of 25 years. The Plan for Modernization of Agriculture (PMA) which falls under PEAP
provides a framework for coordinated implementation of agriculture reform from subsistence
7
farming to commercially oriented production. NAADS is a core programme of PMA and is
designed to contribute to the realization of the agricultural sector objectives.
Between July 2001 and June 2006, a total of US$ 107 million was spent on agricultural
activities by the NAADS Programme. However agricultural productivity remains low despite
the interventions. The low productivity has been attributed to poor advisory and information
services, poor technology development and linkages with markets, Lack of quality assurance
regulations and technical auditing of services, lack of private sector institutional development
and poor programme management and monitoring.
There have been complaints and press reports about poor quality of Advisory services, poor
tendering process, lack of monitoring, political interference and lack of quality reports from
the districts.
2.1.3 Design of the Study
Scope and Limitations
This study focused on the advisory services component of the National Agricultural Advisory
Services (NAADS) Programme.
The study covered the period of five years from July 2001 when project activities
commenced to June 2006 and eleven districts were stratifically and randomly selected. The
selected districts were, Kamuli, Mbale, Nakapiripirit, Hoima, Iganga, Lira, Wakiso,
Nakasongola, Arua, Kitgum, and Tororo.
2.1.4 Audit Objective
The audit aims at assessing the factors that have affected the effectiveness of the NAADS
advisory services as well as the impact on the intended goals of the programme.
2.1.5 Methodology
We used well tested, integrated methodology where we worked closely with the programme
staff, and solicited substantial input and observations from farmers and policy makers. The
methodology is built on inter-relating records, observations, each necessary for valid studies.
8

We used observations and interviews to verify records. Records and interviews were used to
verify observations and interviews. Each group of people was an important part of the
process.
2.1.6 Description of the Audit Area
Reducing poverty is an urgent priority for the Government of Uganda with the target of
reducing the number of people below the poverty line to fewer than 10% by 2017. The
overall framework guiding these intentions is the Poverty Eradication Action Plan (PEAP),
whose goal is the social transformation of Uganda through a multi-sectoral approach that
includes raising the incomes of small holder farmers. Under PEAP, the Plan for Modernization
of agriculture (PMA) provides a framework for coordinated implementation of agricultural
sector reforms aimed at the transformation of smallholder agriculture from subsistence
farming to commercially oriented production.
One of the core programes under PMA is the National Agricultural Advisory Services
(NAADS). NAADS is designed to be a decentralized, farmer owned and private sector-
serviced extension system contributing to the realization of the agricultural sector objectives.
It was created by an Act of Parliament in 2001 to specifically address constraints of access to
agricultural information, knowledge and improved technology among rural poor farmers in
the country. The programme began in 6 districts and 24 sub-counties in 2001 but has since
expanded to 49 districts and 344 sub counties benefiting about 393,000 farm households
directly by 2005/2006 financial year.
NAADS invests in :-
• Developing farmer capacity to demand and manage advisory services,
• Developing farmer knowledge and skills,
• Developing farmer institutions,
• Capacity enhancement of the private sector,
• Increasing farmer access to technologies especially foundation technologies,
• Developing information, communication and marketing systems for farmers and
• Participatory planning, monitoring and evaluation of service delivery.
9
2.1.8 Activities
To achieve the above objectives NAADS carries out the following activities:
• Provision of advice and information services to farmers,
• Supports technology and linkages to farmers,
• Monitor and ensure the quality appropriateness and affordability of advisory services,
• Support private sector and farmer institutional development,
• Provide Program management, monitoring and
• Ensure that research and extension needs of farmers are identified and answered by
the service providers.
2.1.9 Financing
The NAADS programme is funded by the Government of Uganda and seven donors who
deposit money in a “basket” These funds are deposited on an account in Bank of Uganda
before they are transferred into the consolidated fund.
The seven donors are:
• The World Bank International Development Agency (IDA),
• The European Union (EU),
• The Netherlands,
• Department for International Development (DFID),
• Development Cooperation Ireland (DCI),
• The International Fund for Agricultural Development (IFAD) and
• DANIDA.
2.2 FINDINGS
This chapter presents finding of the study. The findings relate to the following aspects:
disbursement of funds, matching funds, identification and prioritization of enterprises,
technology development sites, quality of advisory services, reporting, farmer attendance at
trainings, monitoring and supervision.
2.2.1 Timeliness of funds flow
Funds are disbursed from MOFPED by telegraphic transfer to the General funds account in
the districts. Transfer of funds to recipient districts is supposed to be made once every
quarter in the first month of the quarter.
10

However, it was noted that most disbursements to the Districts sampled delayed for up to
two months on average. From the district, funds are transferred to sub-county accounts.
Clearance and approval are obtained from offices of the CAO and internal auditor. If all these
officials are available the process could take 2-3 days, otherwise delays sometimes exceed
two weeks.
Poor planning that does not take into consideration administrative bureaucracy within the
programme and the Ministry of Finance and Planning have contributed to the delays in
disbursement of funds to recipients.
Delayed disbursements have in some instances resulted in planned activities not being
implemented in time. For example it was noted that sometimes the funds are received and
farmers are trained after the planting time this denies them the opportunity to practice what
they have learnt The seeds that are procured after the planting season do not benefit the
farmers as they cannot utilize them immediately, and sometimes they end up getting spoilt
before the next planting season due to lack of or poor storage facilities. The planting season
also occupies the farmers, leaving them with no time to attend trainings hence reducing the
attendance at trainings.
2.2.2 Matching funds from Districts/Sub county and farmers
The MOU between GOU and the participating partners provide for the various beneficiaries
to make contributions of matching funds. Districts are expected to contribute 5%, sub
counties 5% and farmers 2% of the budget allocations. The contributions are considered as
part and parcel of the annual budgets for implementing LG’s. Failure to comply with the
requirements is supposed to lead to suspension of release of funds to the Districts/sub-
county in question.
At the time of audit in 2007, the contribution from districts, sub counties and farmers was
20%, 30%, and 50% respectively of what they are supposed to have contributed. Whereas
some districts like Arua had contributed 100%, districts like Nakapiripirit had contributed 0%.
Substantial portion of funding is provided by the programme but farmer groups and sub
counties still find it difficult to make their contributions. The audit also noted that most
farmers are small scale, and resource constrained people who are involved in subsistence
11

farming and depend solely on crops for their livelihood and are unable to save. The
programme aims at empowering farmers to improve their livelihood, yet the same farmers
are asked to contribute towards the cost.
The audit also noted that farmers are always willing to contribute even though with difficulty
if they are expecting technology development, however it also takes long for them to come
up with the required funds. The inability of the farmers and sub counties to come up with
their contribution in good time is affecting the timely implementation of programme
activities.
2.2.3 Identification and prioritization of Enterprises
According to NAADS revised implementation guidelines, chapter 3.4 para 3 selection of
potentially profitable farming enterprises by farmers through their groups, is the starting
point for advisory service provision under NAADS. The underlying hypothesis being that the
use of productivity enhancing technologies and appropriate advice in farming activities,
whose products have a ready market, will make farming profitable and create opportunities
for increased household incomes. Farmers will continue to invest in such technologies if they
are profitable, and lead to income generation, and capital accumulation.
The preliminary identification of enterprises is done by farmer groups who propose the
enterprises they believe is suitable for them. This is done with the assistance of contracted
NGO’s. The 3 prioritized enterprises are then ranked with the others from the other parishes
from which the best 3 are selected for the sub county.
However the programme does not provide information on the market availability for the
various crops. This has led to farmer groups selecting enterprises which had succeeded in
neighbouring areas in the previous seasons. This has also resulted in most farmers in areas
that are close to each other growing the same crops, leading to over production of some
crops that end up not being bought or whose prices go down because of excess supply.
For example in Arua district in the year 2006 most farmers selected groundnuts without
adequate market information. This resulted in overproduction of groundnuts which could not
be sold, this discouraged farmers from growing groundnuts, and from the programme
12

activities as well. All the farmers interviewed agreed that they usually choose their
enterprises based on information they get from other farmers within the village and in the
surrounding areas.
In addition to selecting enterprises without ready market farmers in some areas tend to
select the same enterprises year after year. This results in funds being spent on training in
the same enterprises year after year. This leads to waste of funds. Training in same
enterprises year after year discourages farmers from attending trainings as they get bored
learning the same things every year. Growing crops that have minimal market opportunities
is discouraging farmers from participating in programme’s activities and the funds so far
invested risk being wasted if the advisory services provided are not practiced. Under NAADS,
the transformation of subsistence farming, through market orientation, to commercial
agriculture and the management of farming as a business is emphasized.
2.2.4 Technology Development Sites
According to the revised NAADS implementation manual chapter 5.8.1, the TDS belongs to
the farmer group participating in the technology development. The farmer group is supposed
to form a technology development committee to over see the management of the site. A
farmer to have overall responsibility for the day today management of the site is identified
and specific terms for his responsibility clearly spelt out.
In all the sites visited the committees were not in place. The day today management of the
site is left in the hands of the host farmer. Allocating roles to the farmers is difficult and, and
as a result the sites are not maintained. 58%.of the sites visited were bushy and hence were
not serve the purpose for which they were established to serving as demonstration gardens.
According to the implementation manual para 5.4, demonstrations are supposed to create
farmer awareness and demand for a previously unknown technology. With demonstration
sites that are not cared for the programme risks failing to meet its objective of creating
awareness and demand for “unknown technology”.
13

2.2.5 Quality of Advisory services, end user satisfaction
The factor aimed at finding out if farmers are happy with the advisory services. It was
entirely dependent on the response of the people.
According to the NAADS implementation manual annex 2.5viia service providers should have
relevant academic qualifications, relevant expertise to accomplish the TOR and experience of
individual expertise in the relevant area. In all the districts the service providers meet the
minimum qualifications but in districts like Nakapiripirit the service providers did not have any
experience in the areas where they were providing advisory services. The minimum
qualification of a service provider is the possession of at least a Diploma in agriculture or
agriculture related field.
According to the NAADS act 2001 section 24 (4) the farmers who are the recipients of the
services of the service providers shall have a duty to assess the quality of service provided by
a service provider while the technical audit of the quality of service provider shall be carried
out by the relevant technical department at the sub county and District.
However 68% of the 600 farmers interviewed were not satisfied with the trainings. They
claimed the trainers did not have experience in what they were training, that the training
take long sometimes lasting about three hours of theoretical work and that, no reference
materials were availed to the farmers to refer to later. Only 32% of the farmers interviewed
expressed satisfaction with the farmers trainings. Although all the advisory service providers
meet the minimum requirements, they are not meeting the user satisfaction in terms of
quality. There was no evidence to show that the programme was undertaking any quality
analyses.
2.2.6 Reporting
It is requirement of the programme implementation manual annex 2.5 iii Chapter 3 and 5
that service providers write reports which address the terms of reference after the farmer
trainings.
14
However the quality of reports submitted by service providers varied across the districts, with
districts like Arua having reports that were clear and addressing all terms of reference, while
Nakapiripirit had the worst reports that were not addressing the terms of reference.
The reports did not contain vital information concerning the advisory services and as a result
verification of some of the work done was rather difficult. This shows that the sub county
and district coordinators were not reading the reports before sanctioning payments to service
providers.
This affects future planning as the reports cannot be used to ascertain the extent of
coverage and the set backs in the trainings cannot be used in the design of future training.
Without clearly written reports, it becomes difficult to assess and establish the output of the
advisory services.
2.2.7 Farmer attendance at trainings
All farmers in groups that have been registered for a particular training are supposed to
attend trainings conducted by private service providers.
We noted that farmer attendance at trainings is on average 37.1%.
Farmers interviewed indicated that they miss trainings because, sometimes the trainings
conflict with their work schedules. Farmer attendance is lowest when training takes place
during the ploughing and planting seasons and highest during field visits. As a matter of fact
attendance during field visits is on average 100%. This implies that farmers are more
interested in practical training compared to class trainings.
Low farmer attendance means that the programme is losing money paid to train a given
number of farmers, and yet only about 37.1% attend. Efficiency aims at minimum resources
input with optimum utilization of the service providers in order to achieve value for money.
The number of farmers who attend training represents the percentage efficiency, given that
the same resources could have been used to train more farmers. The efficiency also confirms
the fact that 62.9% of the resources were wasted, since only an efficiency ratio of 37.1%
was achieved. The programme also risks failing to achieve its objective of training farmers
in modern farming skills.
15

2.2.8 Monitoring and supervision
The Project implementation manual requires that subject matter specialist and district
internal auditors monitor programme activities at least once a quarter. In all the districts
visited, monitoring is done quarterly and reports submitted to CAO. However, monitoring by
internal auditors is still weak because some internal auditors combine monitoring of
programme activities with other district monitoring and combine the reports.
No standard internal audit verification reports have been designed to aid the internal auditors
in their work and to help them come up with reports that can be useful for decision making.
There is no verifiable indicator to show that monitoring and supervision were carried out.
Reports produced are based on their own observations and verbal reports from those who
carry out the monitoring and supervision. The monitoring by internal auditors concentrates
on financial accountabilities without the review of the actual implementation of activities in
the field; internal audit reviews do not add value in ensuring service delivery.
2.2.9 Achievements
2.2.9.1 Farmer groups
The programme took on a pro active stance as regards using farmer groups as service
delivery avenues by employing NGO’s to help farmers form farmer groups. We noted that
the group approach eased the provision of services and reached out to a big number of
farmers. In addition some farmers were selected as group mobilizers to help in the
mobilization and follow up on the training to ensure that farmers practice what they are
taught and clarify where farmers do not understand.
2.2.9.2 Planning
The programme adopted a bottom up planning approach, where the farmers through their
groups within their respective villages prioritized enterprises which were re prioritized at the
sub county level and consolidated into sub county work plans and later reviewed and
16

consolidated into the district work plans. At national level, the programme carries out annual
joint planning meetings to guide the implementation of programme activities and after
approval; funds are disbursed by MoFPED for programme implementation on a quarterly
basis. Discussion with farmers and district leaders revealed that the programme planning
process was participatory and informative.
2.2.9.3 Monitoring
The programme has a monitoring plan and strategy to guide the overall monitoring function
during programme implementation. The programme also holds annual review meetings in
which the annual programme progress is reviewed, implementation gaps identified, solutions
generated and up coming issues prioritized.
At the district level teams of subject matter specialists, district and sub county coordinators
and internal auditors monitor programme activities quarterly, while farmer monitoring is
regularly carried out by local leaders and farmer mobilizers.
2.3 CONCLUSION
2.3.1. Timeliness of funds flow
It is evident that the delay in disbursement of funds has greatly affected the implementation
of programme activities. Funds are received late thus affecting the training of farmers and
management of technology development sites.
2.3.2 Matching funds from Districts/Sub county and farmers
Although the programme releases all the funds that it is supposed to disburse, to
implementing districts, some districts and sub counties have not been able to meet their
obligation under the programme. Some farmers groups have not been enthusiastic about co
funding while others just cannot afford. Interestingly, farmers are always willing to co-fund if
they are expecting benefits in form of new technology. This suggests that the farmers have
not yet appreciated the importance of advisory services.
17
2.3.3 Identification and prioritization of Enterprises
The programme has not empowered farmers to select enterprises that have ready market.
So many farmers in areas like Kitgum are involved in growing sorghum which has a very low
price and limited uses. The resources used to grow sorghum could have been used to grow
higher value crops if the farmers were well informed about the prices and markets for the
different crops.
2.3.4 Technology Development sites
It is clear that technology sites are not serving the purpose they were intended to serve. The
programme has not been adequately monitoring the sites to ensure that they are in good
order and to encourage farmers to put them to good use. New ways of dealing with the sites
need to be devised.
2.3.5 Quality of Advisory services, end user satisfaction
The quality of advisory services in many areas is very low. Very little effort has been put in
by the programme to use service providers who can do a good job. Monitoring by the district
subject matter specialists takes place once a quarter and sometimes after the training has
taken place. Most farmers expressed dissatisfaction with the quality of training.
The reports written by service providers just like the quality of service are wanting. Many of
them do not show the work done, the strength and weaknesses. This means the reports are
not used in improving the implementation of the programme.
The NAADS programme was designed on the premise that government extension staff would
be restructured and laid off. They are supposed to have formed the core team to provide
private advisory services given their qualifications and experience in extension services.
However to to-date the Government has not laid off the staff. This resulted in the
programme using the few qualified and experienced service providers to carry out the work.
This has left so many districts with qualified but inexperienced service providers resulting in
poor quality services hence wide spread complaints from the farmers. This certainly affected
the programmes ability to achieve its objective of increasing agricultural productivity. The
inexperienced service providers should have been trained in provision of extension services
before being deployed and the monitoring teams should have closely followed them up to
ensure quality service delivery.
18
2.3.6 Farmer attendance at trainings
The farmer attendance at trainings is very low. The programme has not made efforts to
address this problem and yet it greatly affects the programme outcome as it may not be able
to achieve its intended objective of modernizing and commercializing agriculture in the
country.
2.4 RECOMMENDATIONS
2.4.1 Timeliness:
The process of disbursing funds to the implementers needs to be reviewed to avoid any
delays and where possible administrative bureaucracy should be relaxed. The Programme
should look at the possibility of releasing funds according to seasons rather than quarterly
based on the financial year. This would ensure that funds are received just in time for the
activities to take place.
According to NAADS management, all NAADS stakeholders have been pressing for
programme funds to be released twice based on the agricultural seasons of the country.
Some progress has been made in this direction. NAADS secretariat will also issue a circular to
all CAO’s in the participating districts to ensure timely release/transfer of programme funds.
2.4.2 Monitoring and Supervision.
The programme should develop checklists for use during monitoring and supervision and the
district should develop a performance indicator to show and confirm that monitoring took
place. The supervision tool should have a provision for a third party confirmation of the
supervision and field visits such as LC I office. This should provide an additional control to
deter fictitious field visits. The work of internal auditors should be extended to the review
of the actual implementation of activities in the field to clearly assess value for money.
According to management, NAADS is undertaking regional training workshops for district
internal auditors, accountants and sub county NAADS coordinators (SNCs) on financial
guidelines to address not only this issue but also other financial and accountability issues.
19

The internal Audit Department at NAADS secretariat has also designed an internal audit
report template to be distributed to all districts. The template will guide the district auditors
on what to look out for when undertaking quarterly audits. It will also ensure that
comprehensive reports are filed with NAADS secretariat to enable management get informed
of the operations of the NAADS programme in the district.
NAADS needs to put emphasis on disseminating information through practical and well
looked after demonstration gardens that serve as a good examples to the farmers. The
programme should also collaborate with Agricultural Research Institutions that can advise on
the most recent technologies and how the technology sites can be effectively put to use.
2.4.3 Matching Funds from Districts/Sub-County and Farmers.
There is need to ensure that the local Governments budget for programme activities. The
districts that are reluctant to co-fund should be penalized. The programme should also come
up with a programme of assisting poor and vulnerable farmers who cannot afford to co-fund
programme activities. Farmers through their existing farmers groups should be encouraged
to form saving and cooperative societies (SACCO’) that can assist them to save and are at
hand to provide credit to the farmers when they need funding.
Management has indicated that, NAADS secretariat has introduced the rewards and sanctions
strategy that is meant to reward good performing districts while taking sanctions on those
not performing. Contributions to the programme are key performance indicator. Management
has also resolved that while the 1st and 2nd quarter releases can be made to the districts
without conditions, release of 3rd quarter funds will be dependent on districts having met at
least three quarters of their contribution.
2.4.4 Identification and prioritisation of Enterprises.
Farmers should be provided with well researched information to guide them in selecting
enterprises that have ready market. The programme should also strengthen and consolidate
the farmers groups to undertake marketing and processing. The programme should lobby
20

and link the farmers to other organizations which can set up ware houses and storage
facilities for easy bulking.
According to management the programme is involved in a number of efforts together with
other agencies to generate, collate and disseminate market information to farmers. The
partnership strategy being vigorously promoted is meant to link the NAADS farmers to the
market. Under the new NAADS, Agro processing is emphasized as a means of value addition.
Reasonable resources have been provided by the programme in this area.
2.4.5 Technology Development Sites.
The programme should come up with lead farmers to house technology development sites
and be responsible for their maintenance and the benefits accruing there from. The lead
farmers should be people who can explain to other farmers about a new technology. They
should also be acceptable to majority of the farmers.
The Secretariat has promised that, through the Districts shall ensure that capacity of farmer
groups to plan and identify TDSs and their maximum utilization is built. Service providers
shall be held accountable if no knowledge dissemination is undertaken at the TDSs.
2.4.6 Quality of Advisory Services.
The programme should make experience a condition for one to provide advisory services.
They should also identify good service providers and black list poor performers. The
programme should also provide some training in extension services. The programme should
also put to use the district extension service staff. The district extension service staff are
more qualified and experienced than the private service providers, they can be facilitated to
carry out extension services where quality service providers cannot be readily available.
According to management, quality of service is of concern to NAADS and a number of
strategies are being used to address this. These include:
a. Utilization of public extension workers under the New NAADS,
b. Utilization of Community Based Facilitatators (CBO) to ensure continuity of service,
21

c. The New NAADS include strategy to enhance farmer satisfaction through usage of
demonstration farmers, lead farmers, model farmers, and Nucleus farmers,
d. The subject matter specialists based at the districts should ensure that technical audit
is undertaken.
2.4.7 Reporting.
The programme should come up with a standard format of writing advisory service progress
reports. Well written reports should be availed to the sub county programme coordinator
before the service providers are paid and it should strictly be enforced.
According to management, the programme has a component of training service providers.
The training has however delayed because of the slow pace of registering service providers,
and identification of training needs of service providers. NAADS however, will identify all
training needs of the service providers, which certainly includes reporting and include them
in the training curriculum. The Programme is also in touch with the faculty of agriculture,
Makerere University to make an input in the curriculum.
2.4.8 Farmer Attendance at Trainings.
The programme should ensure sure that all trainings are carried out at the time that is
acceptable to the farmers. It should also come up with a training manual that emphasizes
practical training and less of theoretical classroom teaching. Training should also be carried
out when the planting season is just about to start so that farmers can practice what they
have learnt and can get clarifications from the service providers when they are still available.
There should be provision for follow ups after the trainings by service providers.
Management has promised that, the Programme will ensure that in future, service providers
and extension workers make training programmes in consultation with farmers, and agree on
timing, venue, topics and other relevant areas of concern for farmers in as far as they are
consistent with the terms of reference given to the service providers.
22

3.0 DISTRIBUTION OF WATER TO URBAN AREAS BY NATIONAL
WATER AND SEWERAGE CORPORATION – (ISSUED
FEBRUARY 2009)
3.1 INTRODUCTION
3.1.1 Background to the Audit:
This Value for Money audit on the Distribution of Water to Urban areas in Uganda by the
National Water and Sewerage Corporation (NWSC) has been conducted in accordance with
Article 163(3) of the Constitution of the Republic of Uganda. This mandate was amplified
under Section 21(1) of the National Audit Act 2008 which requires the Auditor-General to
carry out value for money audits for purposes of establishing economy, efficiency and
effectiveness in the operations of any department or ministry.
3.1.2 Motivation:
The study was motivated by public concern about provision of clean water to the urban
population in Uganda as highlighted in media reports and the general public outcry. There is
a high concentration of people living in urban areas who do not have access to clean water.
Supply of clean drinking water is estimated to have risen from an average of 54% in 20022 to
70% in 20063 against the national set target of 100% by the year 2000 in urban areas4.
Provision of safe drinking water is one of the millennium development goals adopted by the
UN member countries in 2000. The Government of Uganda has made the water sector one of
the priority areas of its development strategy (PEAP) because safe and clean water is
considered to be a major factor in social economic development. Providing water services to
the informal urban poor settlements is a major objective of National Water and Sewerage
Corporation (NWSC).
2 NWSC Corporate Plan 2003 - 2006 page x
3 NWSC Corporate Plan 2006 - 2009 page xi
4 National Water Policy 1999 page 15
23

The population in urban centres is currently growing at a faster rate than water supply in the
major towns of Uganda. There has been an outcry from potential water customers who
expect water services, while those already connected to the system spend long periods
without water despite Government and development partners’ support to the Corporation’s
development initiatives in providing water to the population.
This audit was conducted to assess the operations of NWSC urban water distribution and
provide possible recommendations that will improve the operations of NWSC in addressing
the challenges undermining the urban water distribution system.
3.1.3 Description of the Audit Area:
The Ministry of Water and Environment is responsible for the planning, management and
provision of water and sanitation services in Uganda.
The two key agencies under the Ministry of Water and Environment which are responsible for
the implementation of the water sector activities are the National Water and Sewerage
Corporation, which is responsible for the Large Urban Centres, and the Directorate of Water
Development (DWD) which provides water to small towns and the rural centres.
NWSC is an autonomous public corporation while DWD is a department under the Ministry of
Water and Environment.
At the national level, the MoWE is responsible for policy issues and political direction to the
water sector in Uganda. The NWSC is mandated to provide water and sanitation services to
urban centres.
3.1.4 Statutory Mandate:
The National Water and Sewerage Corporation is a public Corporation wholly owned by
Government. It was established by Decree No. 34 of 1972 to improve water and sanitation
services in the major Urban centres of Uganda.
The NWSC Act, 1995 was enacted to give the corporation more autonomy to provide water
services on a commercial and viable basis.
24

3.1.5 Major Activities:
The principal business of the corporation as defined by the NWSC Act, 1995 is to operate and
provide water and sewerage services to 19 urban areas of Kampala, Entebbe, Masaka,
Mubende, Jinja/Njeru, Lugazi, Mbale, Tororo, Soroti, Lira, Gulu, Arua, Masindi, Hoima,
Mbarara, Kabale, Bushenyi/Ishaka, Kasese, Fort-Portal. The major activities include:
• To manage the water resources in ways which are most beneficial to the people of
Uganda,
• To provide water supply services for domestic, stock, horticultural, industrial,
commercial, recreational, environmental and other beneficial uses,
• To provide sewerage services in an area in which it may be appointed to do so under
the Act or the Water Act, to the extent and standards that may be determined by its
corporate plan, any performance contract, and regulations made under the Act or the
Water Act and
• To develop the water and sewerage systems in urban centres and big national
institutions throughout the country.
3.1.6 Financing:
National Water and Sewerage Corporation is funded by internally generated revenue,
Government of Uganda, and development partners who include the German Government,
World Bank, European Union, French Government, Belgian Government and the Austrian
Government.
The table below shows the different sources of funding over three years 2004/05 – 2006/07.
NWSC Source of funds 2004/05 to 2006/07:
Financial Year/Source
2004/05 Shs (billion)
2005/06 Shs (billion)
2006/07 Shs (billion)
Revenue:
Internally Generated 52.44 57.98 69.16
GoU Funds 0.099 - -
Donor Funds 1.25 0.56 1.24
Total Income 53.78 58.54 70.40
Source: NWSC Accounts Division
25
(Allocation of the above funds to different systems like distribution and production could not
be easily identified).
3.1.7 Scope:
This report covers Three and a half Years from July 2004 to December 2007. The focus of
the audit is on water distribution in urban areas of Uganda by the National Water and
Sewerage Corporation. The areas were selected to cover the Northern region towns of Arua
and Gulu; Central region covering Kampala, Masaka and Mubende; Eastern region covering
Soroti, Tororo, Jinja and Mbale; and Western region covering Masindi, Mbarara, Bushenyi
and Kasese. Kampala area was selected because the main water plant and the NWSC
headquarter are located there. For the other towns, a mixture of non-viable towns (Mubende
and Masindi) and those operating fairly well were selected in order to create a balanced
opinion.
3.1.8 Methodology:
The audit was carried out in accordance with International Organisation of Supreme Audit
Institutions (INTOSAI) Auditing Standards and guidelines. Those Standards require that the
Performance Audit should be planned, conducted and reported on in a manner, which
ensures that an audit of high quality is carried out in an economic, efficient and effective way
and in a timely manner. In collecting data from the field, the team carried out interviews,
reviewed documents and physical inspection/observation of the facilities.
3.2 FINDINGS
3.2.1 Leakages and bursts:
Each area office of NWSC is required to set a minimum standard for addressing leaks and
bursts as an operational indicator in accordance with IDAMC of each area ranging from 3 to
8 hours.
We noted that in different area offices, response time for addressing leaks and bursts on
mains and service lines is at an average of 2 hours to 50 hours based on available data as
shown in the graph below.
26

Time of Addressing Leaks and Bursts
0
10
20
30
40
50
60
Kasese Mbarara Bushenyi Masaka Mubende Kampala
Area Office
Tim
e (H
ours
)
Target TimeActual Response Time
Source: OAG analysis
While it takes on average 10 hours or less in areas like Kasese and Bushenyi, in bigger
operational areas like Mbarara, Masaka and Kampala it takes on average 20 hours or more to
rectify these faults.
The delays are mainly caused by shortage of repair materials like delays caused by the
centralized procurement system and Area offices storing materials for addressing simple
leakages while materials for major repairs would be requisitioned from headquarters. To
mitigate this bottleneck, management of NWSC has now given the autonomy to areas to
procure all repair materials under the IDAMC.
Buried valves also take long to excavate and in the process this increases water losses.
Besides, locations of the valves are in many cases known to only few staff members. For
performance efficiency, management is training area technical staff under the QMS [ISO
certification programme], to improve on network operations and maintenance activities.
27

Water gushes out along Busega round-about FH on 21st January 2008 3:38pm.
These delays translate into huge amounts of water losses especially on the water mains
which distribute substantial amounts at high pressure (like the picture above). NRW for all
areas stood at an average of 35.6% as at 31st December 2007 while in Kampala area alone,
NRW was at an average of 42.45. This is considered high compared to 20% acceptable for
developing countries and the Corporations target of 28.7%.
3.2.2 Rehabilitation of the distribution network:
In execution of the routine maintenance/rehabilitation work, it is good practice that NWSC
staff are guided by documented policies/procedures.
NWSC also has a policy which requires replacing the distribution network system ranging
from 10 to 33 years6.
We noted that there is lack of clear policy/procedures to guide staff Corporation-wide in
applying standard procedures to carry out maintenance and rehabilitation work.
5 NWSC Performance Reports
6 NWSC Corporate Plan July 2003 – June 2006 page 40
28
During the course of the audit however, NWSC management informed us that the manuals
are being developed under the QMS (ISO certification for each area) and are in advanced
stages of completion.
We also noted that part of the Corporation’s distribution network was installed more than 50
years ago. These systems have exceeded their economic life and are currently too small and
inadequate to satisfy the ever increasing urban and peri-urban population in view of the high
per capita water use. These assets are not being replaced after expiry of their
economic/useful lives as per depreciation policies.
Key aspects of Asset management remain a responsibility of the headquarters. Area offices
carry out rehabilitation work only after their budgets are approved by the head office.
The old pipe network receives water from sections of recently improved, new and expanded
state of the art facilities with higher pressure.
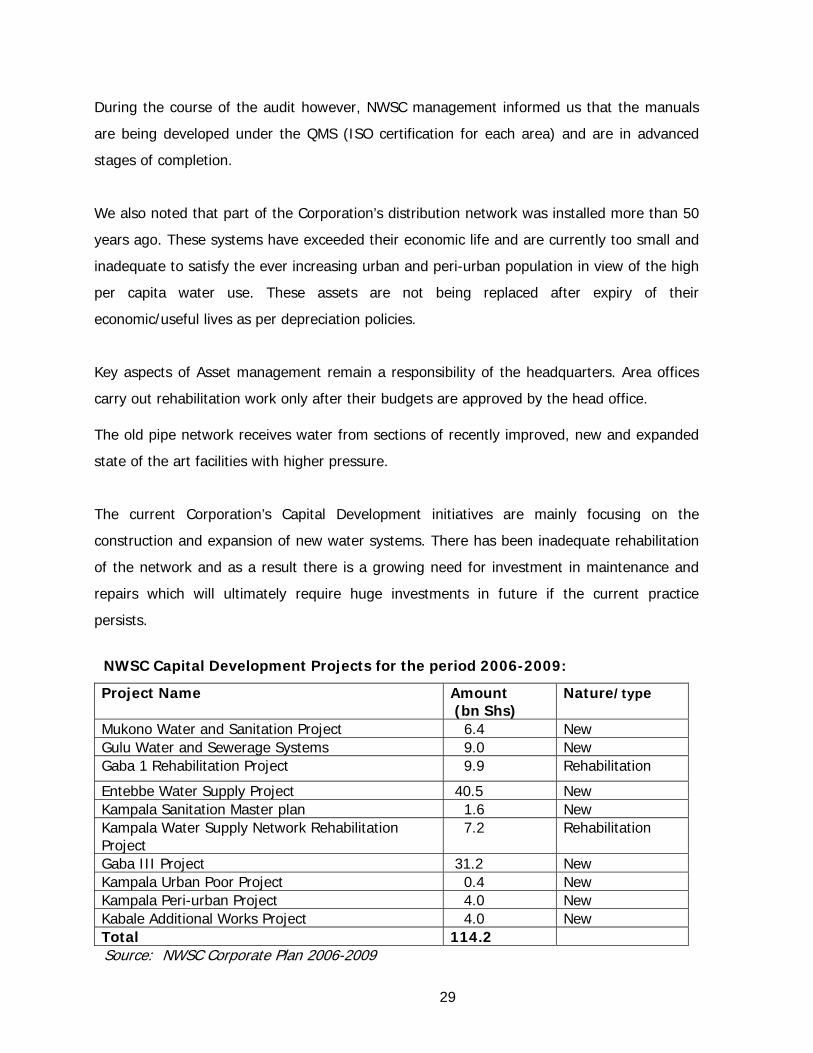
The current Corporation’s Capital Development initiatives are mainly focusing on the
construction and expansion of new water systems. There has been inadequate rehabilitation
of the network and as a result there is a growing need for investment in maintenance and
repairs which will ultimately require huge investments in future if the current practice
persists.
NWSC Capital Development Projects for the period 2006-2009:
Project Name Amount (bn Shs)
Nature/type
Mukono Water and Sanitation Project 6.4 New Gulu Water and Sewerage Systems 9.0 New Gaba 1 Rehabilitation Project 9.9 Rehabilitation
Entebbe Water Supply Project 40.5 New Kampala Sanitation Master plan 1.6 New Kampala Water Supply Network Rehabilitation Project
7.2 Rehabilitation
Gaba III Project 31.2 New Kampala Urban Poor Project 0.4 New Kampala Peri-urban Project 4.0 New Kabale Additional Works Project 4.0 New Total 114.2 Source: NWSC Corporate Plan 2006-2009
29

From the above table, of the Shs 114.2bn earmarked for capital projects in the 3 year period,
only Shs 17.1bn (9.9+7.2) was planned for rehabilitation works. Management also indicated
that 6% of its operating budget is allocated for repair of assets in addition to annual
provisions for depreciation.
The existing old facilities like outdated pipe network and old storage tanks have continued to
deteriorate and are a major source of water losses contributing to the problem of overall
NRW in the Corporation.
Failure to rehabilitate the old facilities has resulted into interruptions by some customers who
experience low pressure since the amount of water received by the customers is determined
by the size, age and type of the facility.
3.2.3 Payment/Collection of Water Bills (Arrears):
When meter readings are taken by Commercial Division staff, bills are supposed to be
generated and sent to customers within 2 weeks of the following month after billing7. In
order to direct efforts towards collecting all bills, NWSC set a target collection/Billing ratio
including arrears of 100%. Once bills are delivered, Area staff are required to continuously
carry out door to door follow-up of payments from customers on a monthly basis.
With regard to, Government ministries and departments, a Memorandum of Understanding
(MoU) signed between the Government (represented by the MoFPED) and NWSC to address
arrears requires NWSC to furnish MoFPED and the Auditor-General with monthly and
quarterly status reports, procurement of appropriate pre-paid metering technology, and take
remedial measures for non-compliance.
It was established that collection takes a period of between 1 day to more than 3 years.
The audit also established that NWSC furnished MoFPED with quarterly reports since the
signing of the MoU. However the money released was not sufficient to cover outstanding
7 NWSC Commercial Manual paragraph 6.5.1
30

Government arrears. This is attributed to under-provision for water bills by MoFPED in the
annual budgets for the Ministries and the fact that MoFPED releases money quarterly, which
releases do not sufficiently take care of actual billing and arrears.
The possibility of using pre-paid meters to reduce arrears by Government
departments/Ministries had not been considered by NWSC at the time of audit. Management
of NWSC was piloting pre-metering among the small income earning category (urban poor)
in Kisenyi I, Kisenyi II and Ndeeba after which pre-paid metering shall be scaled up to
include ministries. As a result, arrears for the Ministry category of customers have continued
to accumulate from Shs 8.1bn in June 2005 to Shs 15.8bn in December 2007.
For other category of customers, NWSC hired debt collectors during the first half of
FY2007/2008 to pursue customers who have failed to pay water bills, to complement efforts
within the Corporation of collecting arrears.
In the areas visited, the study revealed that non-payment of the bills from other categories
other than ministries was mainly attributed to low willingness to pay by customers.
The Corporation does not encourage the practice of disconnecting customers as a method of
collecting/recovering outstanding debts. Follow-up of payment agreements, billing errors and
the time taken to address these problems ultimately affect the customers in deciding when to
settle water bills, usually after their concerns have been rectified. In the process, revenue is
tied thus affecting cash-flow.
Delay in collecting payments has consequently increased the arrears portfolio from Shs 26
billion at 30th June 2005 to Shs 32.6bn as at 31st December, 2007. The status of arrears by
different consumers as at 31st December 2007 is shown in the chart below.
31
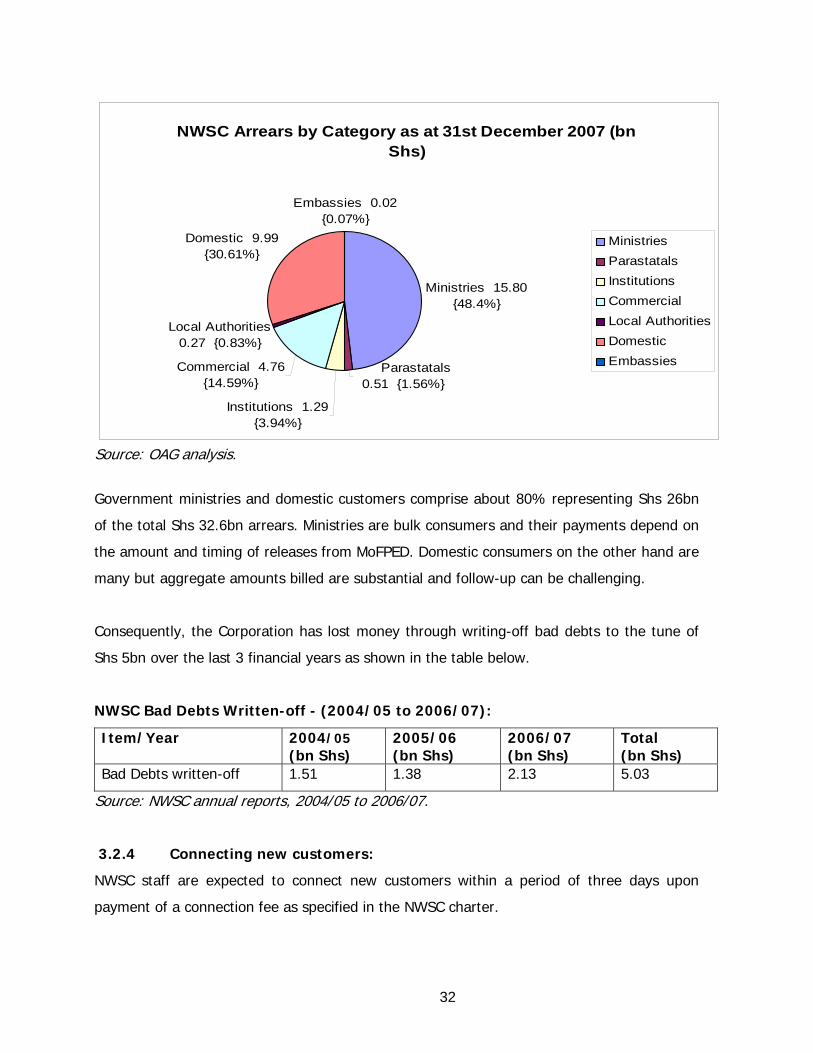
NWSC Arrears by Category as at 31st December 2007 (bn Shs)
Domestic 9.99 {30.61%}
Local Authorities 0.27 {0.83%}
Commercial 4.76 {14.59%}
Institutions 1.29 {3.94%}
Parastatals 0.51 {1.56%}
Ministries 15.80 {48.4%}
Embassies 0.02 {0.07%}
MinistriesParastatalsInstitutionsCommercialLocal AuthoritiesDomesticEmbassies
Source: OAG analysis.
Government ministries and domestic customers comprise about 80% representing Shs 26bn
of the total Shs 32.6bn arrears. Ministries are bulk consumers and their payments depend on
the amount and timing of releases from MoFPED. Domestic consumers on the other hand are
many but aggregate amounts billed are substantial and follow-up can be challenging.
Consequently, the Corporation has lost money through writing-off bad debts to the tune of
Shs 5bn over the last 3 financial years as shown in the table below.
NWSC Bad Debts Written-off - (2004/05 to 2006/07):
Item/Year 2004/05 (bn Shs)
2005/06 (bn Shs)
2006/07 (bn Shs)
Total (bn Shs)
Bad Debts written-off 1.51 1.38 2.13 5.03
Source: NWSC annual reports, 2004/05 to 2006/07.
3.2.4 Connecting new customers:
NWSC staff are expected to connect new customers within a period of three days upon
payment of a connection fee as specified in the NWSC charter.
32

We noted however that connecting new customers takes a period ranging from 4 days to
114 days. Details are shown in the graph below.
Average Time Taken to Connect New Customers
0
20
40
60
80
100
120
Mbarara Kasese Masaka Bushenyi Jinja Mubende
Area Offices
Aver
age
Tim
e
Average Time
Source: OAG Analysis
From the above graph, Areas like Kasese, Bushenyi and Mubende takes less than ten days to
connect new customers. This is mainly because the towns are relatively smaller than
Mbarara, Masaka and Jinja where the customer applications are relatively more.
The reasons advanced for the delays in connecting new customers through interviews and
review of documents were lack of meters, delays in getting connection materials and delay of
funds from head-office as well as difficulties in accessing or locating customer premises.
These delays deny the customers timely access to clean water. NWSC on the other hand
loses revenue due to delayed new connections.
3.2.5 Stakeholder Coordination:
The Water Act requires providers of water and sewerage services to provide their services in
consultation with appropriate public authorities and relevant community groups. It is good
33

practice to involve relevant stakeholders in planning and implementation of service delivery
to the urban population.
We noted that there was lack of coordination and understanding between the Corporation
and various stakeholders like municipal/urban authorities, telecom companies, road
contractors and individuals when laying infrastructure of different projects which require
excavation work. Even Development Committees in Local Authorities that used to coordinate
infrastructure development [roads, railways, water works, and telecom facilities] are
currently non-functional.
This arises partly due to limited sensitization of stakeholders about the location of water
infrastructure and access of premises during expansion of the distribution network.
Inadequate coordination is evidenced by delays in connecting new customers because of
failure by the Corporation staff to access premises.
Above: A 6 inch pipe on the mains at Wairaka (Jinja-Iganga Road destroyed during road construction). Taken on 14th November, 2007 at 11:35am
34

The Corporations’ existing facilities have also been damaged by new excavations by other
utility and service providers such as when road works, telecom and electricity cabling are
taking place. The Corporation ultimately loses a lot of water when water mains are cut
resulting into water shortages in urban areas like the example of Wairaka above.
The open points can expose the distribution network to contamination and cross-
contamination with changing pressure levels, which ultimately affects the quality of the
water.
Besides, the Corporation suffers road reinstatement costs, (shown in the table below) where
the new pipe network crosses an existing road. With better coordination however, these
costs could be shared with other stakeholders.
Road reinstatement costs for Kampala Area for the period 2004/05 – 2006/07
Financial Year Amount (Million Shs)
2004/05 144.4
2005/06 206.5
2006/07 162.2
Source: NWSC Finance and Accounts Division.
3.2.6 Access to water at fire hydrants:
The Water Act requires NWSC to erect fire hydrants and standpipes for supply of water for
extinguishing fires in convenient places and at distances that they consider appropriate and
in an effective manner. The Act also requires them to provide services efficiently and
economically. It is good practice that the department furnishes NWSC with accountability for
the water used in extinguishing fires.
We noted that the Corporation has designated various points in different towns and Kampala
city where the Police Fire Brigade can obtain water for fire fighting. The water consumed at
fire hydrants is given to the police free of charge.
35

Through interviews, it was established that because of unlimited access, some of the water
was being misused by the police, construction companies and private operators who access
water from un-metered fire hydrants.
The Corporation has no mechanism in place to monitor the use of water for fire fighting
purposes.
Misuse of water was caused by unlimited access to un-metered points by the police fire
brigade and other illegal users and private water operators. In Kampala alone, 1751 fire
hydrants exist but only 8 of these are metered, making it difficult to control the amount of
water used at these locations.
This increases NRW which consequently denies genuine customers water services. The
Corporation also loses revenue.
3.2.7 Supply of Water to Consumers:
Areas with hilly terrain require the use of booster pumps, re-enforcing the mains and
restructuring the pumping and distribution network to improve the distribution of water uphill
in order to sustain a 24hour water supply.
NWSC has invested resources in extending infrastructure and pipe network in several areas
up to individual homes which occupy a hilly terrain in various urban areas within the country.
A number of customers in these areas either do not receive water at their premises or in
some instances the pressure is so low that it takes long to receive meaningful
quantities/volumes of water to satisfy an individuals’ domestic water requirements.
We noted for example, that in the suburbs of Kampala city like Kawempe, Nansana,
Nabbingo-Buddo, Kalinabiri, Kulambiro, Kanyanya, Namugongo, Ntinda and Seeta-Mukono,
residents take over 6 hours a day without water against NWSC target of 24hour supply.
Consumers in these areas either take long periods without water or water supply is erratic,
insufficient and unreliable.
36

Installation of boosters and bigger pipes for water distribution on the existing network has
not been adequate in areas experiencing low pressure to meet the customer expectations.
Because of the inadequacies along the mains and the distribution network, long queues are
evident at public standpipes, a clear manifestation of insufficient water supply within urban
areas. People resort to use of alternative sources. Water in some of these sources is
contaminated and not suitable for human consumption.
The infrastructure put in place in the process of expanding the networks remains
underutilized because of the dry pipes besides attracting a lot of criticism and public outcry.
3.2.8 Non-Revenue Water (NRW):
The International Water Association (IWA) has set an average of 20% as an acceptable level
of NRW for developing countries.
The NWSC Corporate Plans 2003-2006 and 2006-2009 set targets of NRW (shown in the
graphs below) as a percentage of water produced. The first graph shows the performance of
NRW for all areas while the second graph highlights the performance of Kampala alone.
NWSC Target and Actual NRW for the period 2004/05 - 2007/08 [All Areas]
29303132333435363738
2004/05 2005/06 2006/07 2007/08
Financial Year
Per
cent
age
of N
RW
NRW Target All AreasNRW Actual All Areas
Source: [Figures for 2004/05-2006/07 were extracted from Annual reports and those of 2007/08 from Performance reports]
37

While NWSC achieved the set targets, the actual NRW performance is gradually increasing
and by the end of December 2007, it had reached the level of the set standard.
For Kampala Area, the set targets were not being achieved for the period 2006/07 and 2007/08
as shown below.
NWSC Actual Target and Actual NRW for the period 2004/05 - 2007/08 [Kampala Area]
30354045
tage
)
05
10152025
2004/05 2005/06 2006/07 2007/08
Financial Year
NR
W (P
erce
n NRW Target for KampalaNRW Actual for Kampala
Source: [Figures for 2004/05-2006/07 were extracted from Annual reports and those of
2007/08 from Performance reports]
The amount of water lost through NRW is still high and exceeds IWA acceptable standards
for developing countries.
The above losses are mainly caused by leakages and bursts, illegal connections, under-
registering meters, water used for fire fighting, old distribution network and overload on
service lines.
This has resulted into loss of revenue to the Corporation and overall water shortage to
consumers.
Positive steps taken to reduce NRW include the creation of an illegal use reduction unit in
Kampala and conducting a study which revealed that an average of 20% losses occur due to
meter under registration after two year of use.
38
3.3 CONCLUSIONS
From the audit findings above, the following conclusions were made to highlight opinions
observed during the course of the audit.
3.3.1 Technical Aspects:
NRW through leaks and bursts reduces the amount of water available for distribution to
the final consumer, increases the problem of water scarcity in urban areas and loss of
income to the Corporation. The time taken in long queues to collect water reduces the
population quality time for productive work. Consumers spend highly as water prices
from these alternative sources escalate affecting customers’ spending patterns and
payment of water bills.
The Corporation facilities are not adequately maintained, which further compounds the
problem of leaks and bursts and increases water losses.
Stakeholder coordination has been inadequate resulting in disruption of the distribution
network, leading to poor service delivery, water losses and water scarcity in urban
areas. The ability of NWSC to expand and provide water services to prospective
customers is also impaired.
Failure to put in place monitoring and accountability mechanisms of water use at fire
hydrants increases the problem of NRW and loss of revenue to the Corporation.
3.3.2 Commercial Aspects:
NWSC takes long to disconnect customers with overdue water bills. This has greatly
increased the level of uncollected debts.
While management has put in place possible methods of collecting arrears like direct
debits, direct payment at financial institutions and other cash payment incentives, the
amount tied in arrears still appears to be quite high compared to the financial needs
and set targets of the Corporation. This growth in arrears impairs the ability of the
Corporation to effectively expand the distribution network and curb water shortage due
to the reduced cash-flow. It may also affect the long term financial sustainability of the
company. Billing errors also translate into customer complaints and delayed payments
which further increase the accumulation of arrears and bad debts.
39
Delay in connecting new customers ultimately leads to customer dissatisfaction in
NWSC services. These delays may also affect the image of the Corporation.
3.4 RECOMMENDATIONS
After conducting the audit and in light of the findings and conclusions, we wish to make the
following recommendations which are aimed at improving the deficiencies observed in the
distribution of water in urban areas.
3.4.1 Improvement in Water Distribution (Technical Aspects):
A map of all key points like valves should be availed to staff in charge of
operations/maintenance to ease their work. Staff should be regularly inducted and
trained to acquaint themselves with the locations of valves.
Illegal Use Reduction service should be extended to all areas in country. Officers from
area offices can be attached to the unit in Kampala to gain essential skills required in
fighting illegal water use.
Management of NWSC should regularly review the policies on maintenance and
replacement of worn out assets and implementation of these policies should be
adhered to. Rehabilitation of existing old infrastructure is vital in view of the water
losses. The Corporation should balance the needs of undertaking new capital
development projects with routine maintenance and rehabilitation of existing
infrastructure taking into consideration other factors like the age of the pipe network
and other facilities, soil type, pipe diameter and traffic load where the network is laid.
Management should also ensure that the process of compiling the manuals is
completed for a proper maintenance plan and clear operations procedures.
Where appropriate NWSC should request prospective customers to obtain authority
from neighbors when applying for new connection. Sensitization of existing and
potential customers, local leaders, and landlords is vital in enhancing the distribution
network and supply of water to the urban population.
Measures aimed at improving stakeholder coordination at planning and implementation
of NWSC development projects should be put in place to ensure that the roles of the
various players are properly executed and expectations are met. In this regard, NWSC
should play a leading role in steering coordination and liaising with urban authorities
40

and other stakeholders to ensure that a coordinated plan for all developments is
discussed and understood by all players to minimize damages to the infrastructure.
There should be proper coordination and improved relationship between NWSC and the
Fire brigade to identify the location of the fire hydrants and assess their viability. A
map of these points should be made and reviewed periodically to establish the
appropriateness, adequacy and convenience in order to reduce misuse of water. A
mechanism of recognizing private water operators using water at fire hydrants with an
option of licensing them should be considered. Designated points for this purpose alone
should be identified to enhance monitoring and revenue collection.
The social/mandatory obligation of providing water for fire fighting should be
streamlined without compromising the Corporation’s mandate of operating as a viable
commercial enterprise in an effort to reduce overall NRW. NWSC should also put in
place a reporting mechanism to ensure proper accountability of water consumed at fire
hydrants.
NWSC should develop a comprehensive master plan for both water and Sewerage
Systems to enable it execute long-term capital development projects and distribution
network.
NWSC should prioritise re-enforcing of the mains and restructuring the pumping and
distribution capacity of the network to improve on water distribution and curb the
effects of low pressure. Enhancing education and incentive programs for customers to
use water saving methods is essential in supplementing NWSC efforts of providing
water to the urban population.
3.4.2 Improving Revenue Collection (Commercial Aspects):
We recommend that the practice of contracting out collection of arrears to debt
collectors be regularly reviewed and applied consistently countrywide in line with NWSC
mandate, to reduce the high level of arrears. Efforts towards implementing the MoU
between Government of Uganda and the Corporation should be strengthened to
recover arrears from government ministries and departments.
The Corporation should assess the benefit of acquiring pre-paid meters against the
costs of bad debt write-off, engaging debt collectors and the time value of money, with
a view of mapping a clear strategy to eliminate arrears.
41
It is also recommended that disconnection of defiant customers be re-enforced to
recover arrears.
There should be close supervision of commercial/Billing staff to minimize billing errors.
Monitoring of set standards should be employed to assess performance.
42

4.0 IMPLEMENTATION OF NORTHWEST SMALLHOLDER
AGRICULTURAL DEVELOPMENT PROJECT (NSADP) -
MINISTRY OF AGRICULTURE ANIMAL INDUSTRY AND
FISHERIES – (ISSUED MARCH 2009)
4.1 INTRODUCTION
4.1.1 Background
Following the civil strife for two decades, many people in Northwestern Uganda went to exile
in Congo and other neighboring countries. This resulted in decline of agricultural sector and
break down in infrastructure. The region was declared by G.O.U to be lagging behind the
national average economic growth indicators as characterized by high poverty levels, food
insecurity and low household incomes. The economic growth indicators in the region at the
inception of the project (1999/2000) are summarized in the table below:
Indicator North-West Region Uganda
Infant mortality per 1000 140 122
Child mortality per 1000 235 203
Maternal mortality per 1000 500 505
Stunted children under 5 years (5%) 50 38.6
Source: Uganda Bureau of Statistics.
It is for this reason that G.O.U with the help of ADB designed NSADP to address the
problems of high poverty levels, food insecurity, low household income and low agricultural
productivity faced by the people in the region.
Northwest Smallholder Agricultural Development Project (NSADP) is a multi-sector five-year
Project in MAAIF jointly funded by the African Development Fund (ADF) and Government of
Uganda (GOU). The project started in January 2001 and was expected to end on 31
December 2005.
43
However, due to delayed implementation, the project life was extended by another three
years ending 31 December 2008. The project was designed to train farmers in improved
agricultural practices with a view of increasing their agricultural output. The increased
agricultural output would give farmers enough food supply for their homes and the surplus
sold in markets to generate household income.
The project also envisaged that in order for the farmers to practice improved agricultural
methods, there was need to provide farmers with subsidized agricultural loans to enable
them buy farm inputs such as hoes, pangas, improved seeds, chemicals and apply
appropriate farming technology and meet other agricultural overhead costs.
The project further envisaged that with increased agricultural productivity farmers would
need proper access to markets to sell the surplus output. It is from this background that the
project also planned to develop the agricultural infrastructure in the region. A number of
roads and bridges were selected for construction and rehabilitation to allow easy accessibility
to constructed markets by farmers. District farm institutes (DFIs) were also to be constructed
and others rehabilitated to help in the training of farmers.
4.1.2 Reasons for the Audit
The Government’s efforts towards alleviating the high levels of poverty, low agricultural
productivity and food insecurity in the region have yielded low results despite the
intervention by the NSADP project. The audit sought to ascertain whether the loan utilization
has been efficient in reducing poverty levels, increasing agricultural productivity and food
security in the region. The audit also sought to make recommendations that would help
management bring about improvements in project implementation.
4.1.3 Mandate
Under the loan agreement, between Government of Uganda (GOU) and African Development
Bank (ADB), the Ministry of Agriculture, Animal Industry and Fisheries (MAAIF) through
NSADP was mandated to implement the project.
44

4.1.4 Project Activities
The project activities can also be categorized under the following project components:
Production Enhancement Component
i. Provide improved seeds and seed distribution system,
ii. Introduce and operate animal traction teams for hire,
iii. Fund 3-months short-term training expert on traction/draught power,
iv. Provide effective extension service and training,
v. Introduce and implement agro-forestry practices,
vi. Training farmers in improved practices and
vii. Strengthen capacity of staff at the district.
Rural Infrastructure Component
i. Rehabilitate 200 kilometers of priority roads,
ii. Routine manual maintenance of 1600 kilometers of community roads,
iii. Recurrent maintenance of 1600 kilometers of community roads,
iv. Periodic maintenance of 200 kilometers of priority roads,
v. Construct and rehabilitate building structures at DFIs and
vi. Improve water supply and sanitation in priority markets.
Micro Credit Component
i. Establish a micro credit scheme and
ii. Promote a micro credit scheme.
4.1.5 Project Funding
The Project is funded by a loan secured from ADB of UA 17,600,000 (US $24.146 million) or
Shs.35.012 billion and G.O.U counter funding of UA 2,000,000 (US $2.743 million) or
Shs.3.984 billion giving a total project amount of UA 19,600,000 (US $26.889 million) or
shs.39.026 billion. At the time of the study a total UA 11,428,098 (US $17.051 million) or
Shs.29.764 billion had been released by the Project.
45

Funds Released By ADB By Currency Categories
Years 2001/ 2002
2002/ 2003
2003/ 2004
2004/ 2005
2005/ 2006
2006/ 2007
2007/ 2008
Total
Currency: (UA)
378,523
814,869
639,551
481,050
1,760,355
1,980,432
5,373,318
11,428,098
Currency: (US $)
479,869
1,154,742
920,723
718,938
2,526,163
2,964,141
8,286,135
17,050,711
Currency: (UG.SHS)’000
821,175
2,111,578
1,729,388
1,222,103
4,315,505
5,063,642
14,500,736
29,764,127
Source: Compiled by OAG from Projects annual progress reports, cash books, bank statements Audited Financial Statements
4.1.6 Scope
The study was conducted on NSADP which is a project under the Ministry of Agriculture,
Animal Industry and Fisheries (MAAIF). The study focused on three major components out of
the five which included; Production Enhancement, Rural Infrastructure development and
Micro Credit Components which form 69% of the total project funding (Production
enhancement 22%, Rural Infrastructure 40% and Micro Credit 7%).
The audit covered five out of the six project districts of Arua, Nebbi, Yumbe, Adjumani and
Moyo in Northwestern region of the country for a period covering four financial years of
2003/04, 2004/05, 2005/06 and 2006/07 to December 2007.
The overall audit objective was to assess how the project components of Production
Enhancement, Infrastructure development and Micro Credit had been implemented. The
specific objectives of the audit were:
• To assess whether farmers were adequately trained in accordance with Project plan.
• To assess whether farmers were mobilized to access micro credit support as planned in
the project.
• To assess whether roads, markets, and bridges were constructed and completed on time
to benefit farmers as planned in the project.
• To make recommendations that will help management bring about improvements in
project implementation.
46
4.1.7 Methods of Data Collection
The audit was conducted in accordance with International Organization of Supreme Audit
Institutions (INTOSAI) standards. Those standards require that performance audit should be
planned, conducted and reported on in a manner, which ensures that an audit of high quality
is carried out in an economic, efficient and effective way and in a timely manner. Data was
collected through field observations, interviews and document review.
4.2 FINDINGS
4.2.1 Training Farmers
Training of farmers was a major activity under the Production enhancement component of
the project. Farmers were trained in multiplication and use of improved seeds, animal
traction technology, agro-forestry practices and general improved farming practices.
The trainings were conducted through workshops, demonstration farms and through field
visits by Field Extension Workers (FEWs). The Project was successful in the introduction of
animal traction and agro-forestry practices and strengthening capacity of district personnel.
However, training of farmers did not meet the expected performance level.
According to project monitoring and evaluation manual, Annex 2, Logical Framework, 51,000
farmers were to be reached directly by FEWs through out the project life. Another 20,000
farmers (10,000 women) were to be trained, according to the project implementation
manual.
Districts in their annual and quarterly work plans set target numbers of farmers to be trained
and directly reached by FEWs. In the period ranging from 2003/4 to 2007/8 December, a
total of 31,794 farmers were planned for training and by districts as per table below:-
47
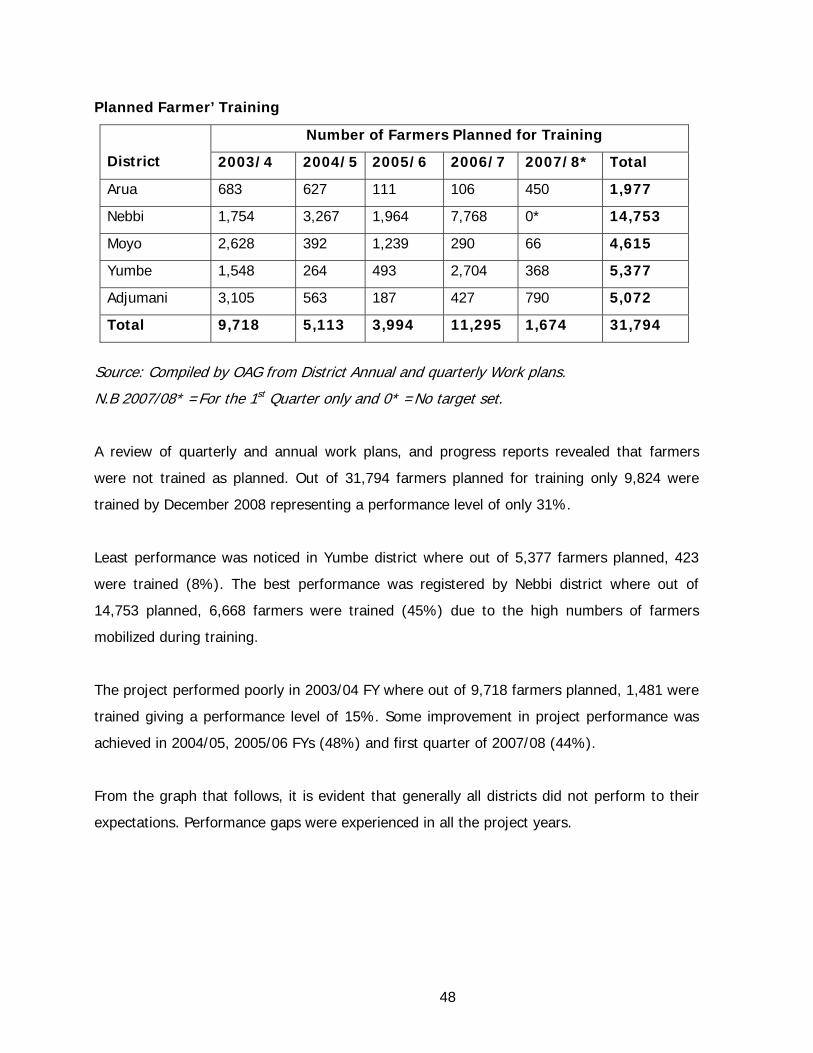
Planned Farmer’ Training
District
Number of Farmers Planned for Training
2003/4 2004/5 2005/6 2006/7 2007/8* Total
Arua 683 627 111 106 450 1,977
Nebbi 1,754 3,267 1,964 7,768 0* 14,753
Moyo 2,628 392 1,239 290 66 4,615
Yumbe 1,548 264 493 2,704 368 5,377
Adjumani 3,105 563 187 427 790 5,072
Total 9,718 5,113 3,994 11,295 1,674 31,794
Source: Compiled by OAG from District Annual and quarterly Work plans.
N.B 2007/08* =For the 1st Quarter only and 0* =No target set.
A review of quarterly and annual work plans, and progress reports revealed that farmers
were not trained as planned. Out of 31,794 farmers planned for training only 9,824 were
trained by December 2008 representing a performance level of only 31%.
Least performance was noticed in Yumbe district where out of 5,377 farmers planned, 423
were trained (8%). The best performance was registered by Nebbi district where out of
14,753 planned, 6,668 farmers were trained (45%) due to the high numbers of farmers
mobilized during training.
The project performed poorly in 2003/04 FY where out of 9,718 farmers planned, 1,481 were
trained giving a performance level of 15%. Some improvement in project performance was
achieved in 2004/05, 2005/06 FYs (48%) and first quarter of 2007/08 (44%).
From the graph that follows, it is evident that generally all districts did not perform to their
expectations. Performance gaps were experienced in all the project years.
48

Graph Showing number of Farmers Trained per District in Different Years
Source: Compiled by OAG from District Quarterly plans and progressive reports.
The inadequacy in training farmers was attributed to delayed delivery of planting materials
by suppliers which hindered a wide involvement of farmers on the ground and fewer field
visits conducted by FEWs who were inadequately supervised by district project coordinators
as discussed in details below:-
Delivery of Planting Materials
The training of farmers was affected by the delays in the delivery of seeds which are used for
training by FEWs. Due to delayed seed delivery, limited number of farmers was involved on
the exercise.
A review of delivery notes and goods received notes revealed that seeds were not delivered
within the expected fourteen days after issuance of the purchase orders. Most delays were
noted in 2005/06 FY where all the five districts registered an average delay of 132 days.
Shorter delays were noted in 2003/04 FY (25.8), 2004/05 FY (23.6) and the first quarter of
2007/08 FY (18) on average. Moyo, Nebbi and Arua districts registered the longest average
delays of 98, 78 and 63 days respectively. Details in table that follows:-
49

Delays in the Delivery of Seeds (Days)
District 2003/4 2004/5 2005/6 2006/7 2007/8 Total Average
Arua 21 13 264 5 14 317 63.40
Nebbi 108 32 39 135 76 390 78.00
Moyo 0* 73 337 81 0* 491 98.20
Yumbe 0* 0* 3 70 0* 73 14.60
Adjumani 0* 0* 15 45 0* 60 12.00
Total 129 118 658 336 90 1,331 266.20
Average 25.8 23.6 131.6 67.2 18 266.2 53.24
Source: Compiled by OAG from District procurement records. NB 0* means no information on delivery provided.
During interviews with all five DPCs and five SMSs (Agronomy and Forestry) they all
attributed the delays to lack of capacity of the local suppliers to supply seeds forcing them to
source supplies from Kampala based suppliers. They further explained that Kampala based
suppliers take longer to deliver due to the long distance involved from Kampala and the poor
state of the road net work in the region.
It was also observed that beans, maize and sorghum seeds worth Ush.11,580,000 supplied
in Arua district were not distributed to farmers due to late delivery. The seeds were planned
for distribution to farmers in the rain season of August/September 2007. Seeds were
delivered at the end of October 2007 after the rains forcing the DPC to keep them in stores.
The DPC stated that the seeds would be distributed to farmers in the next rainy season of
March/April 2008 (4 months later) and this delay could affect the germination capability of
the seeds.
Extension Field Visits and Supervision
The training of farmers was further affected by fewer field visits conducted by FEWs than
planned. Out of 1,819 visits planned, only 419 (23%) were conducted. See table below.
50
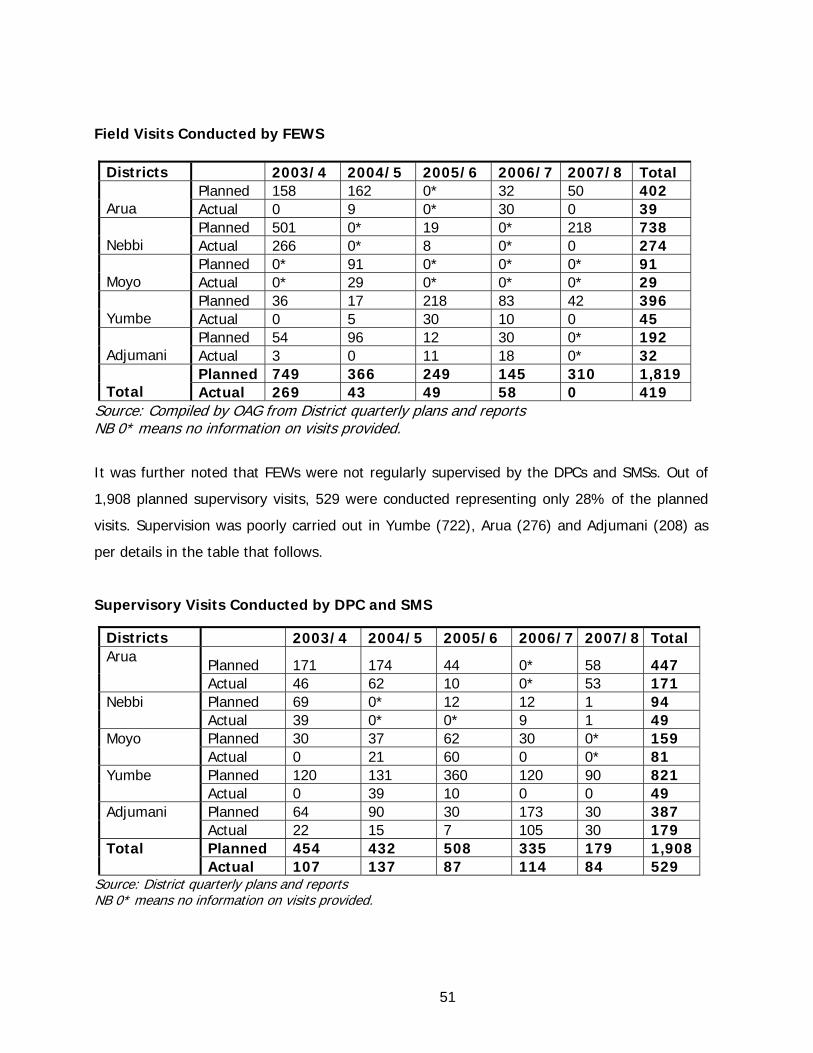
Field Visits Conducted by FEWS
Districts 2003/4 2004/5 2005/6 2006/7 2007/8 Total Arua
Planned 158 162 0* 32 50 402 Actual 0 9 0* 30 0 39
Nebbi
Planned 501 0* 19 0* 218 738 Actual 266 0* 8 0* 0 274
Moyo
Planned 0* 91 0* 0* 0* 91 Actual 0* 29 0* 0* 0* 29
Yumbe
Planned 36 17 218 83 42 396 Actual 0 5 30 10 0 45
Adjumani
Planned 54 96 12 30 0* 192 Actual 3 0 11 18 0* 32
Total
Planned 749 366 249 145 310 1,819Actual 269 43 49 58 0 419
Source: Compiled by OAG from District quarterly plans and reports NB 0* means no information on visits provided.
It was further noted that FEWs were not regularly supervised by the DPCs and SMSs. Out of
1,908 planned supervisory visits, 529 were conducted representing only 28% of the planned
visits. Supervision was poorly carried out in Yumbe (722), Arua (276) and Adjumani (208) as
per details in the table that follows.
Supervisory Visits Conducted by DPC and SMS
Source: District quarterly plans and reports
Districts 2003/4 2004/5 2005/6 2006/7 2007/8 Total Arua Planned 171 174 44 0* 58 447 Actual 46 62 10 0* 53 171 Nebbi Planned 69 0* 12 12 1 94 Actual 39 0* 0* 9 1 49 Moyo Planned 30 37 62 30 0* 159 Actual 0 21 60 0 0* 81 Yumbe Planned 120 131 360 120 90 821 Actual 0 39 10 0 0 49 Adjumani Planned 64 90 30 173 30 387 Actual 22 15 7 105 30 179 Total Planned 454 432 508 335 179 1,908 Actual 107 137 87 114 84 529
NB 0* means no information on visits provided.
51

Late delivery of seeds, the fewer extension visits by FEWs and limited supervision of DPCs
and SMSs led to the training of fewer farmers in improved agricultural practices than planned
by the project.
4.2.2 Infrastructure Development
Under the infrastructure development component of the Project, the following activities were
supposed to be implemented:-
i. Rehabilitation of 200 kilometers of priority roads,
ii. Routine manual maintenance of 1600 kilometers of community roads,
iii. Recurrent maintenance of 1600 kilometers of community roads,
iv. Periodic maintenance of 200 kilometers of priority roads,
v. Construction and rehabilitation of building structures at DFIs and
vi. Improve water supply and sanitation in priority markets.
The project has successfully managed to periodically maintain 1600 kilometers of selected
community roads in the districts. Communities are involved in maintaining the roads and
funds are released on a quarterly basis to districts to carry out the activities. However the
project registered some set backs in the construction and rehabilitation of 200 kilometers of
roads and bridges, the construction and rehabilitation of district farm institutes, markets and
provision of water points. Construction works are not on schedule as stated in the project
implementation plan.
According to project implementation plan, Paragraphs 6.2.4 and 7.2 (i) pages 19- 21,
construction of roads, bridges, markets and District Farm Institutes (DFI) were expected to
be completed within the first two years of project implementation up to December 2002.
The causes of the delay were identified to include the following:-
Production of Technical Designs:
It was noted that the technical consultant, did not accomplish the task of designing technical
drawings for the construction of roads, bridges, markets and DFIs despite the payment of US
$ 180,000 (Ushs.306, 000,000) to the contractor by the project.
In its efforts to avert the situation, NPCU in consultation with ADB, contacted the Ministry of
works and transport engineers for technical drawings at an additional cost of
52

Shs.87,000,000. The technical designs were completed after six years in 2006 and contracts
awarded in November 2006 and July 2007.
Heavy Rainfall And Distant Source Of Construction Materials:
Interviews with site engineers, DPCs and district engineers/ works supervisors attributed the
delay to heavy rainfall which disrupted construction works and transportation of materials.
They also expressed concern that most of the construction materials are procured from
Kampala which is very distant from construction sites in the districts hence the delay in the
delivery of materials.
Lack of Capacity By Some Contractors:
The audit however attributes the delay to lack of capacity by some contractors to finance
construction works using their own funds. Some contractors have been awarded more than
one contract in the districts thereby straining their capacity further.
We noted that although districts some times delayed to process and pay certified works of
contractors, all submitted certificates were paid. The contractors were not injecting back the
funds into the projects, but instead using it for other purposes.
Limited Supervision:
The delay in construction works is also attributed to irregular supervision by NPCU staff who
are located in Entebbe contrary to the resolution in one of the aide memoir reports of
relocating to the regional headquarters for effective supervision.
We also noted that the supervision by district engineers was not effective. District engineers’
reports could not express pertinent issues concerning the projects because their
independence was compromised by the fact that their supervisory allowances were paid by
contractors. District engineers may find it difficult to query certificates as this would lead to
delayed payment of the contractors and subsequently their allowances.
53
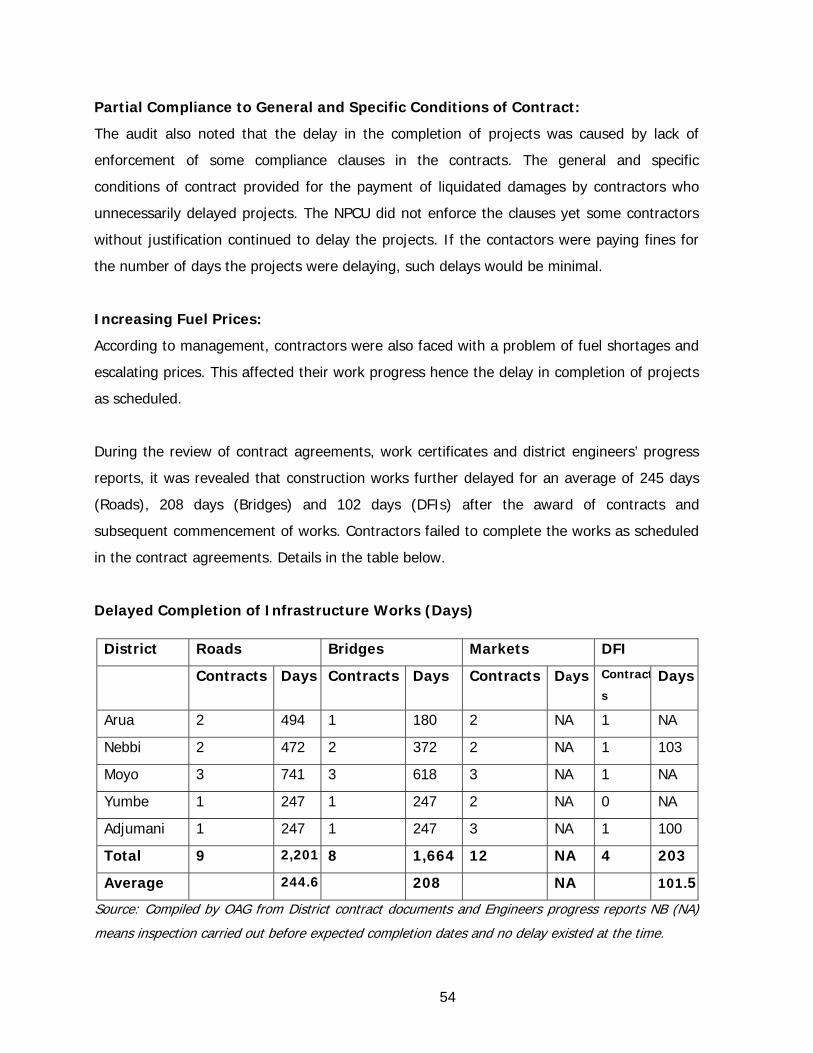
Partial Compliance to General and Specific Conditions of Contract:
The audit also noted that the delay in the completion of projects was caused by lack of
enforcement of some compliance clauses in the contracts. The general and specific
conditions of contract provided for the payment of liquidated damages by contractors who
unnecessarily delayed projects. The NPCU did not enforce the clauses yet some contractors
without justification continued to delay the projects. If the contactors were paying fines for
the number of days the projects were delaying, such delays would be minimal.
Increasing Fuel Prices:
According to management, contractors were also faced with a problem of fuel shortages and
escalating prices. This affected their work progress hence the delay in completion of projects
as scheduled.
During the review of contract agreements, work certificates and district engineers’ progress
reports, it was revealed that construction works further delayed for an average of 245 days
(Roads), 208 days (Bridges) and 102 days (DFIs) after the award of contracts and
subsequent commencement of works. Contractors failed to complete the works as scheduled
in the contract agreements. Details in the table below.
Delayed Completion of Infrastructure Works (Days)
Source: Compiled by OAG from District contract documents and Engineers progress reports NB (NA)
means inspection carried out before expected completion dates and no delay existed at the time.
District Roads Bridges Markets DFI
Contracts Days Contracts Days Contracts Days Contract
s Days
Arua 2 494 1 180 2 NA 1 NA
Nebbi 2 472 2 372 2 NA 1 103
Moyo 3 741 3 618 3 NA 1 NA
Yumbe 1 247 1 247 2 NA 0 NA
Adjumani 1 247 1 247 3 NA 1 100
Total 9 2,201 8 1,664 12 NA 4 203
Average 244.6 208 NA 101.5
54

Markets
During field inspections, out of 17markets, 13 were inspected (76%). It was observed that
12 of the 13 (92%) markets were not completed and were at foundation level. Only one
market (Ofua) in Adjumani district was found at ring beam level.
Roads
Out of 16 roads in the five districts, 10 (62.5%) were physically inspected. Road inspection
revealed that all the 10 roads were not completed. Opening of roads was done but they have
become bushy again. Some culverts were poorly installed at some points and at others
completely not installed. Road works at Arivu-Jayia-Opia road (Arua) and Obilokongo-Moinya
road (Adjumani) were found abandoned by contractors.
Bridges
Out of 15 bridges in the five districts, 10 (67%) were visited. In all the 10 bridges inspected,
work was on going. Five bridges in Yumbe and Nebbi districts had minor works to be
completed. Works at Moinya bridge in Adjumani district was abandoned. The contractor at
Airo bridge, Moyo district, was fully paid before work was completed.
Delayed award of contracts was caused by the lack of production of technical designs by the
technical consultant who, from explanations of district engineers, lacked capacity to handle
the task. There was also laxity by NPCU to avert the problem in time as the decision to use
ministry engineers came up late.
4.2.3 Release of Funds
According to project implementation procedures, funds are released from the Special Account
(SA) to the Local Currency Account (LCA) of the Project and then transferred to the district
project accounts at the beginning of the first month of every quarter.
During the review of the district cash books, monthly bank statements and accountability
returns it was revealed that districts were not regularly receiving funds in accordance with
the project procedures governing funds disbursement. There was a general delay in the
release of funds to the districts of 55 days on average per quarter. The districts of Arua,
Yumbe and Moyo were mostly affected with average quarterly delays of 62, 58 and 57 days
respectively. The districts experienced most delays in 2004/05 FY, 2006/07 FY and 2003/04
FY of 77, 65 and 53 days on average per quarter respectively. Shortest delay of 28 days was
55

noted in the first quarter of 2007/08 FY. Details of the delay are shown in the table that
follows.
Average Quarterly Delays in the Release of Funds (Days)
District 2003/4 2004/5 2005/6 2006/7 2007/8 Total Average
Arua 65 83 61 77 28 314 62
Nebbi 54 83 37 56 28 256 51
Moyo 45 83 60 70 28 285 57
Yumbe 50 72 58 70 28 277 58
Adjumani 54 68 37 56 28 242 48
Total 266 387 252 327 141 1373 275
Project 53 77 50 65 28 275 55
Source: Compiled by OAG from District Cash books and Bank statements.
The interviews with the NPC and the project accountant, however, attributed the delay to
also late submission of accountabilities by the districts since funds can not be released to
districts before accounting for previous releases.
During a review of accountability returns prepared by districts it was noted that
accountabilities were not submitted to NPCU in time. Districts did not account for funds
released to them at the end of the quarter as required due to laxity of district coordinators
and some times due to delayed implementation of activities.
Accountabilities delayed for an average of 33 days per quarter in all the districts in the period
under review. Moyo district registered the poorest performance with an average quarterly
delay of 61 days.
Worst performance in this area was noted during 2003/04 FY (102 days per Quarter) with
Moyo district again contributing highly. Better performance was registered in the first quarter
of 2007/08 FY (8 days) where the three districts of Arua, Yumbe and Adjumani took only 4
days on quarterly average to account for the funds. Details are presented in the table
below:-
56

Average Quarterly Delays in Submission of Accountabilities (Days)
2003/4 2004/5 2005/6 2006/7 2007/8 Total Average
Arua 2 31 2 0 4 39 8
Nebbi 139 15 13 15 0 182 36
Moyo 221 12 14 31 29 307 61
Yumbe 43 43 0 0 4 90 18
Adjumani 103 22 66 6 4 200 40
Total 508 122 95 52 41 817 163
Average 102 24 19 10 8 163 33
Source: Compiled by OAG from District accountability returns (NB 0* means no information on delivery provided)
The above observation would have been different had all accountability returns been provided
for review. Accountability returns for the Shs.840,746,468 were not provided for review due to
poor record keeping at both NPCU and district headquarters caused by lack of record keeping
skills by the in charge of records, the table below refers.
Missing Quarterly Accountabilities
2003/4 2004/5 2005/6 2006/7 2007/8Total (Nos) Total (Shs)
Arua 1 0 2 2 0 5 391,634,618Nebbi 0 0 2 1 0 3 226,656,000Moyo 0 0 0 0 0 - 0 Yumbe 0 0 2 1 0 3 222,455,850Adjumani 0 0 0 0 0 - 0
Total (Nos) 1 0 6 4 0 11 840,746,468
Source: Compiled by OAG from District Cash books and bank statements (NB (0) Accountabilities seen)
During interviews with all the DPCs and district accounts assistants, it was confirmed that
delays in accountabilities is caused by delayed implementation of activities which drag on,
sometimes spilling over to the next quarters. They also attributed the delay in the
implementation of activities to delayed release of funds by NPCU.
Delayed release of funds has led to insufficient or lack of funds at the disposal of districts for
implementation of project activities in accordance with project implementation plans. District
57

project activities like procurement of seeds and training of farmers were affected by delayed
release of funds as discussed in paragraph 3.2 of this report.
4.2.4 Farmers Joining Savings and Credit Cooperative Societies
Under the Micro Credit component of the project, the following objectives were implemented
by the project:-
i. To provide micro-credit support for farm input purchase and off-farm credit.
ii. To provide micro-credit support to finance worthwhile marketing activities.
In order to attain the above objectives, NSADP entered into an understanding with Micro
Finance Support Centre Limited (MSCL) to manage the component and subsequently
released a sum of US $1,038,889 (equivalent of Shs.1, 302,000,000 at the time of
disbursement in 2005) for the benefit of Savings and Credit Cooperative Societies (SACCOS).
According to project implementation plan, paragraph 8.0 page 24, farmers are mobilized to
register with SACCOS to enable them access agricultural loan facilities for off-farm, marketing
and crop production activities.
Priority was focused on project target groups and the most poverty stricken areas. To ensure
the achievement of the above, NSADP in its Monitoring and Evaluation manual, Annex 2, the
logical framework paragraph 3.0 (C), targeted 10,000 farmers, 6,000 of whom are women to
access farm credit.
In addition, 550 marketers and 2,000 house holds dealing in agro-business were targeted. It
was noted that the Project failed to reach the target number of beneficiaries as planned and
this was attributed to the following factors:
Mobilizing Farmers:
The poor mobilization efforts by MSCL is attributed to lack of coordination with districts in the
implementation of the micro credit component of the project and lack of follow up
mechanism on MSCL activities by NPCU.
Interviews carried out with all the five DPCs and SMSs (Marketing Opportunities) revealed
that mobilization of farmers in matters of loan accessibility is an activity handled by MSCL
58
and SACCOS. They further explained that MSCL and SACCOS do not report their activities to
the districts, but directly to NPCU.
A review of NPCU records revealed that MSCL had not prepared any report showing its
performance contrary to section 5 of the Memorandum of Understanding (MOU) signed
between GOU and MSCL dated 12/08/2002. However, management asserted during
discussions that MSCL started reporting its performance in 2006 to-date, but the reports
provided for review do not indicate the number of farmers given loans by their gender and
other categories as specified in the project M&E manual.
During discussions with the regional MSCL branch manager (West Nile region), it was noted
that mobilization programmes are aired out on various FM radio stations in the region, but he
could not provide evidence to that effect and how often this was done. Copies of
returns/reports the Arua MSCL regional office forwards to their headquarters in Kampala did
not show evidence of mobilization.
Interviews carried out with managers of all the six registered SACCOS in the five districts
visited revealed that mobilization of farmers is a sole responsibility of MSCL and that SACCOS
are only visited by MSCL to monitor their loan performance. It is expected, however, that
farmers who benefit from the loans pass over the information to others. Ayivu SACCO in Arua
district took some initiative to mobilize farmers through a weekly radio programme that ran
for six months in 2007. We further noted that the managers of SACCOS do not differentiate
their sources of funding and as a result agricultural loans from MSCL are not specifically
treated and would go to their clients whether you are a farmer or not.
It was also noted that MSCL runs radio mobilization programmes in general terms without
focusing on farmers who were/are targeted by the project.
During field inspections, all 8 farmer groups and 7 farmers visited showed ignorance of the
existence of such loan facilities under the project with an exception of two farmers from
Nebbi district that had received the information from their respective SACCOS and acquired
loans to the tune of Shs.3, 450,000. It was further noted that mobilization efforts of MSCL
were not reaching the target groups.
59
High Interest Rates Charged by SACCOS:
It was also noted that farmers have failed to access the loans due to the high interest rates
charged by SACCOS and other stringent requirements like minimum savings one should hold
in a SACCO before qualifying for a loan facility.
Poor Project Design:
It was noted during discussion with management, that during project design it was assumed
that farmers would automatically join SACCOS and be able to access agricultural loans. In
districts where there was limited number of SACCOS farmers could automatically not access
loans. Management cited that the loan component of the project performed very well in
Nebbi district due to the existence of 3-4 SACCOS at project inception.
4.3 CONCLUSIONS
4.3.1 Training Farmers
The project objective of improving farmers’ incomes in the region through increased
agricultural production obtained from the application of improved agricultural practices was
not achieved due to failure by districts to train the target farmers. The number of farmers
trained in the period is far below the targeted figures.
4.3.2 Infrastructure Development
The project has not achieved its target of completion of construction works in the second
year of project implementation hence farmers have not benefited from the use of
infrastructure development to support marketing of their farm produce. Most construction
works will not be completed in the near future given the pace of construction.
The overall performance of the project has been affected by poor implementation of the
infrastructure component which accounts for Shs.15.49 billion which is 40% of the project
funding excluding physical and price contingency of Shs.7.38 billion (19%).
4.3.3 Release of Funds
The districts have had a poor culture of accounting for funds released to implement project
activities. Submission of accountabilities takes longer than the expected period hence
60

affecting the disbursement processes. Project activities like training of farmers have not been
satisfactorily implemented due to lack of funds as shown by performance gaps in all project
disciplines.
4.3.4 Farmers Joining Savings and Credit Cooperative Societies
There was inadequate mobilization of farmers to join SACCOS and as a result many project
trained farmers have not joined SACCOS hindering them to access agricultural loan facilities.
The high interest rates charged by SACCOS have also hindered farmers from accessing loan
facilities. Farmers trained by the project do not meet the above conditions and as a result the
loan facilities have been extended to other beneficiaries not targeted by the project.
4.4 RECOMMENDATIONS
4.4.1 Training Farmers
The project should increase its efforts of training farmers in seed multiplication to build local
capacity that will enable sourcing of improved seeds from farmers within the districts. This
will reduce further on the time required to deliver seeds from distant suppliers.
The district accounting officers should invoke the provision for penalties specified in the Local
Purchase Orders regarding late delivery of goods and services to ensure that suppliers who
fail to adhere to terms and conditions of contract are penalised.
Subject matter specialists and district project coordinators should strengthen their
supervisory mechanism to ensure that field extension workers carry out their field visits as
planned in the quarters.
4.4.2 Infrastructure Development
NPCU should increase on its supervisory visits and the project engineer together with other
headquarters staff should relocate from Entebbe to Arua project offices as recommended in
one of the aide memoir reports by ADB. The above will enable regular supervision and
monitoring of the progress of construction works.
61
It is recommended that district engineers should not be paid by the contractors for
supervision work as this undermines their independence in reporting on the progress of
construction works.
It is further recommended that payments of US $ 180,000 (Ushs.306,000,000) be recovered
since no technical designs were produced by the firm and any payments be halted.
The General and Special conditions of contracts governing performance security and
liquidated damages stated in individual contracts should be invoked to ensure that the errant
contractors immediately finish the works without further delay.
4.4.3 Release of Funds
District project coordinators should speed up the accountability process to ensure that
implementing officials account for funds released to them immediately after the completion
of a project activity. This will in turn enable NPCU to release funds on time. NPCU should
also improve on its record keeping system to allow immediate identification of defaulting
districts and ensure that an effective follow up mechanism is put in place.
4.4.4 Farmers Joining Savings and Credit Cooperative Societies
It is recommended that the procedures in the implementation of the micro credit component
of the project be revisited to involve districts staff who are always in contact with farmers on
the ground.
Micro finance Support Center Limited (MSCL) should increase its mobilization activities to
bring more farmers on board and these activities should be rigorously supervised and
monitored by NPCU.
MSCL should prepare progress reports in accordance with section 5 of the Memorandum of
Understanding (MOU) which should consistently be reviewed by NPCU for proper monitoring
of the component.
SACCOS should properly brand their loan products to distinguish agricultural loans from
others and ensure that funds from MSCL are strictly applied for the intended purpose.
62

In addition, MSCL and Savings and Credit Cooperative Organizations (SACCOS) should follow
the guidelines in the project implementation plan and MOU signed between Government and
MSCL which govern loan disbursement and accountability to ensure that farmers access
agricultural loan facilities.
63

5.0 PREVENTION AND CONTROL OF LIVESTOCK DISEASES BY
THE DEPARTMENT OF LIVESTOCK HEALTH AND
ENTOMOLOGY IN THE MINISTRY OF AGRICULTURE ANIMAL
INDUSTRY AND FISHERIES – (ISSUED MARCH 2009)
5.1 INTRODUCTION
This audit report is about the prevention and control of livestock diseases and it is aimed at
coming up with recommendations to help the department of Livestock health and
Entomology improve the way the major activities in prevention and control of livestock
diseases are carried out. This audit was conducted in accordance with Article 163(3) of the
Constitution of the Republic of Uganda.8 This mandate is amplified under Section 21(1) of
the National Audit Act 20089 which requires the Auditor-General to carry out value for money
audits for purposes of establishing economy, efficiency and effectiveness in the operations of
any department or ministry.
5.1.1 Background to the study
MAAIF is responsible for supporting, promoting, guiding and regulating the production of
Livestock, Fisheries and Crops in order to ensure improved quality, quantity of the produce and
their products for local consumption, food security and export. This function is carried out by
MAAIF in the two Directorates of Crop Resource and Animal Resources and Fisheries. The
department of Livestock Health and entomology which is under the Directorate of Animal
Resources and Fisheries is charged with preventing, controlling and eradicating where possible,
livestock diseases.
5.1.2 Reasons for the audit
The audit was motivated by the public outcry over the increased infection and death of livestock.
Furthermore, there have been press reports about pastoralists moving livestock in and out of the
country in an uncontrolled manner and occupying land illegally for grazing livestock. These
8 Constitution of the Republic of UGANDA (1995) as amended by Article 165.
64

reported illegal movements and land occupations have contributed to the increased spread of
livestock diseases and livestock deaths because livestock epidemic diseases are frequently spread
by the movement of infected animals.
“The movement of animals and their products which do not meet mandatory standards put man
and animals at risk of infectious diseases, vectors, pests and or contaminants. Such sub-standard
activities whenever they occur put households who depend on animal industry at food security
and economic risks.’’10. This has put both animal and man at health and economic risk. Epidemic
diseases inhibit export trade opportunities for livestock and livestock products. Beside food
security and household incomes, the livestock industry contributes significantly to the economy of
Uganda by about 9% of the Gross Domestic Product and about 17 % of the Agricultural Gross
Domestic Product. About one third of all farm related households in Uganda are estimated to
derive their livelihoods from the animal sub sector11.
A review of exports and imports of livestock products from 2003 to 2007 established that the
country has been exporting more livestock products than it imports as shown in Table 1 below,
Imports and Exports of livestock and livestock products in Uganda (2003-2007)
Year Exports (Ushs ) Imports (Ushs)
2003 11,492,233,503 6,621,662,621
2004 12,962,449,653 4,833,286,911
2005 15,217,745,316 4,011,878,476
2006 16,153,873,257 5,707,728,587
2007 39,969,438,330 8,368,208,260
Cumulative Totals since 2003 95,795,740,059 29,542,764,855
Source: OAG analysis of data from URA’s Ascuda generated reports
Despite MAAIF’s interventions through government finance and projects such as PACE, FITCA,
NLPIP and Creation of Tsetse and Tripanosomiasis free areas, livestock disease trends have
not significantly reduced in the past three years. There has been no significant reduction in the
9 National Audit Act 2008 10 Veterinary technical manual for animal movement control in Uganda- First Edition October 2007 11 Veterinary technical manual for animal movement control in Uganda- First Edition October 2007 page 4
65
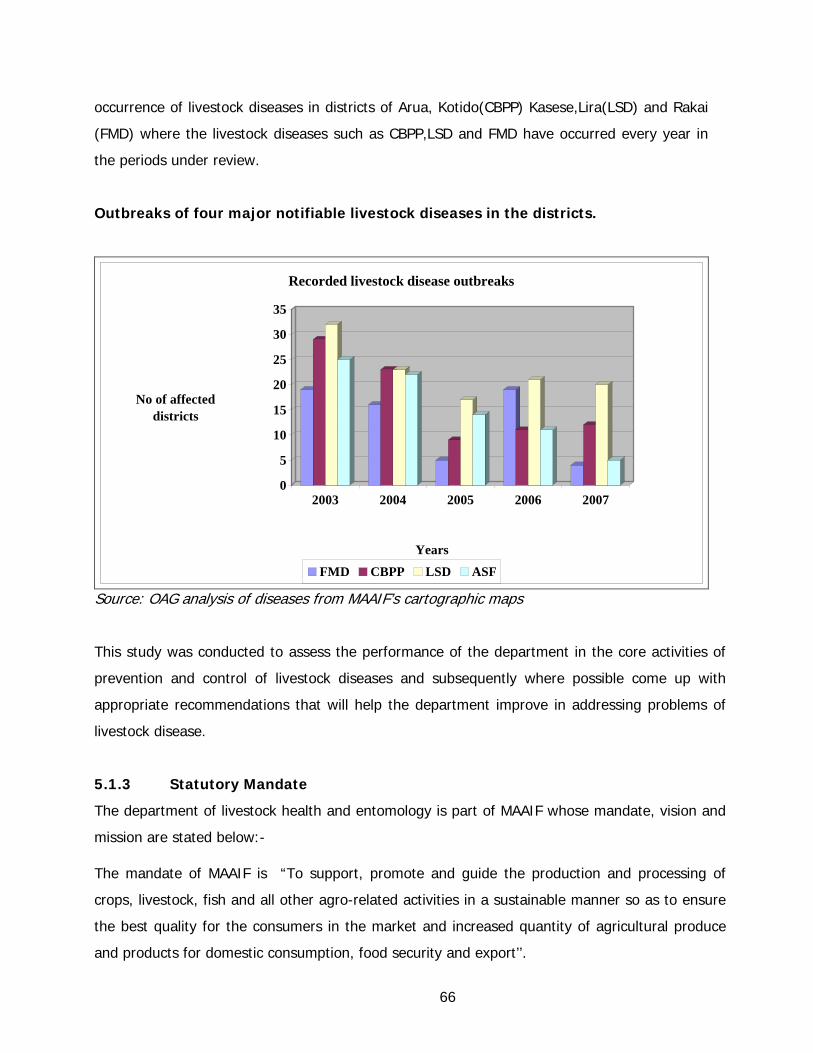
occurrence of livestock diseases in districts of Arua, Kotido(CBPP) Kasese,Lira(LSD) and Rakai
(FMD) where the livestock diseases such as CBPP,LSD and FMD have occurred every year in
the periods under review.
Outbreaks of four major notifiable livestock diseases in the districts.
0
5
10
15
20
25
30
35
No of affected districts
2003 2004 2005 2006 2007
Years
Recorded livestock disease outbreaks
FMD CBPP LSD ASF
Source: OAG analysis of diseases from MAAIF’s cartographic maps
This study was conducted to assess the performance of the department in the core activities of
prevention and control of livestock diseases and subsequently where possible come up with
appropriate recommendations that will help the department improve in addressing problems of
livestock disease.
5.1.3 Statutory Mandate
The department of livestock health and entomology is part of MAAIF whose mandate, vision and
mission are stated below:-
The mandate of MAAIF is “To support, promote and guide the production and processing of
crops, livestock, fish and all other agro-related activities in a sustainable manner so as to ensure
the best quality for the consumers in the market and increased quantity of agricultural produce
and products for domestic consumption, food security and export’’.
66

5.1.4 Major Activities of the Department
The major activities of the department are;
a) Formulating strategies for preventing and controlling animal diseases and disease
epidemics.
b) Monitoring outbreaks and prevalence of diseases, importation and exportation of animals
and their products in and out of the country. Monitoring performance of the entomology
division and livestock health activities in the Local Governments (LG’s) to ensure that they
are in conformity with national policies, standards, legislation and plans.
c) Carrying out surveillance of diseases and obtaining samples from the districts for diagnosis
and examination.
d) Prompt collection, collation and dissemination of epidemiological data.
e) Advising the district authorities and the decision makers on disease control strategies.
f) Collaborating with neighboring countries, research and international organizations on
disease control.
g) Availing and administration of vaccines, advising on importation, distribution and marketing
of drugs and chemicals in collaboration with National Drug Authority (NDA) for use on
livestock.
h) Enforcement of laws and regulations pertaining to prevention of disease spread from
animals to humans.
i) Carrying out sensitization / awareness campaigns on animal disease control.
5.1.5 Sources of funding
The major funding of the department is from the Government of Uganda (G.O.U). However it is
also funded by donors from time to time through various initiatives e.g. FITCA, NLPIP, PACE, Pan
African Tsetse and Trypanosomiasis eradication campaign (PATTEC) and Creation of Tsetse and
trip free areas. These initiatives are sometimes co-funded by the GOU, with the Memorandum of
Understanding specifying the various duties and responsibilities of the parties involved.
67

Livestock health and entomology funding from 2004/05 to December 2007.
Source of Funding 2004/05 2005/06 2006/07 Jul 07-Dec 07
GOU Recurrent 467,206,005 586,342,764 542,074,387 269,752,455
GOU Development 1,193,671,570 3,045,469,720 5,683,092,514 653,294,000
Donors-NLPIP 626,631,840 430,386,690 436,804,096 698,245,000
-FITCA 85,529,446 129,745,461 210,430,416 338,080,000
-Creation of Tsetse and trip free area
44,501,000 44,380,000
TOTAL FINANCING 2,373,038,861 4,191,944,635 6,916,902,413 2,003,751,455
Source: OAG analysis of financial data from Integrated Financial Management System (IFMS)
NB: 2003/2004 Financial data was not readily available because the IFMS system was not in
place then.
5.1.6 Audit scope
The audit focused on the management of prevention and control of livestock diseases by the
livestock health and entomology department in MAAIF.The study covered 13 selected districts
namely, Arua, Lira, Gulu, Tororo, Soroti, Kotido, Nakapiripirit, Nakasongola, Mukono, Rakai,
Mbarara, Ntungamo and Kasese which are involved in prevention and control of livestock
diseases. It further involved visiting and assessing the operations and controls at the livestock
border entry points of Paidha, Vurra, Oraba, Mutukula, Mirama hills, Malaba, and Mpondwe. The
team also visited Lake Mburo and Queen Elizabeth National Parks and obtained information from
Murchison falls and Kidepo National parks under Uganda Wild Authority (UWA) in order to assess
the coordination between UWA and the neighbouring districts on the control and prevention of
livestock diseases. The audit covered the period July 2003 to December 2007.
The audit objective was to assess the performance of the department and come up with suitable
recommendations based on the findings so that the department may make improvements in
prevention and control of livestock diseases.
5.1.7 Audit methodology
The audit was conducted in accordance with International Organization of Supreme Audit
Institutions (INTOSAI) Performance Auditing Standards. These standards require that
68

performance audit should be planned, conducted and reported on in a manner which ensures
that an audit of high quality is carried out in an economic, efficient and effective way and in a
timely manner. Data was collected through conducting interviews, review of documents and
physical observations.
5.2 FINDINGS
This chapter presents audit findings. The findings relate to; notable achievements, vaccinations,
sensitizations, surveillance, diagnosis, enforcement, coordination collaboration between MAAIF
and Key stakeholders and Vector control.
5.2.1 Notable Achievements
Some of the achievements of the department of Livestock Health and Entomology include:-
5.2.1 .1 Eradication of Rinderpest
The Pan African Control of Epizootics (PACE) which began in 2001 laid down a suitable
foundation for the pathway to freedom from the Rinderpest disease. This programme which
emphasized surveillance for early detection and determination of infection resulted in a
provisional declaration of freedom from the disease in Uganda in 1999 on a Zonal basis and in
2002 the whole country was provisionally declared free from the Rinderpest disease. MAAIF is
commended on this achievement.
The progressive decline in sero-positivity levels from 3.3% in 2003 to 0.0037% in 200612 and
fulfillment of all other requirements for freedom from the disease culminated in the submission of
a dossier to the OIE requesting for accreditation of Uganda as a country free from Rinderpest
disease. In accordance with the provisions of article 2.2.12.2 of the OIE Terrestrial Code, Uganda
was officially recognized as a Rinderpest free country by the OIE in 2008.
5.2.1.2 Control of the outbreak of Anthrax in Queen Elizabeth National Park
Anthrax is an infectious, febrile disease caused by bacteria. This disease is often characterized by
its sudden onset and rapidly fatal course. In August 2004, incidents of hippos dying in the waters
of Kazinga Channel, Lakes George and Edward within Queen Elizabeth National Park (QENP)
12 Pathway of freedom from Rinderpest disease in Uganda.
69

were reported to UWA. As at 21st October 2004 about 186 hippos had died. There was a risk of
infection to humans and livestock in the surrounding areas.13
The outbreak was controlled through a multidisciplinary National Task Force with MAAIF and
UWA taking the lead. It also involved the community and private companies. This incident was a
confirmation that collaboration between MAAIF and UWA is very important in preventing and
controlling livestock diseases.
However the audit also revealed some weaknesses in the activities of prevention and control of
livestock diseases as shown below:-
5.2.2 Surveillance
5.2.2.1 Passive Surveillance
Disease surveillance is a major and integral component of all government veterinary services.
This is vital for early warning of diseases, planning and monitoring of disease prevention and
control programmes, provision of sound animal health advice to farmers. It is particularly
important for animal disease emergency preparedness.
In order to accomplish the surveillance function, OIE terrestrial Health code requires countries to
make available to other countries, through OIE, whatever information is necessary to minimize
the spread of important animal diseases and to assist in achieving better world wide control.
MAAIF requires districts to avail monthly epidemiological data not later than the 15th day of the
subsequent month. MAAIF set a standard of at least 10 reports submitted annually by every
district. These reports should capture all information on livestock disease prevention and control
activities like disease outbreaks, vaccinations carried out, vaccine stocks and meat inspections,
laboratory activities, veterinary inspection services and animal movements. This information is
gathered by the VOs and AHOs at the lower local governments while the DVOs monitor their
activities.
13 UWA report on disposal of Hippo carcases from Queen Elizabeth National Park following outbreak of Anthrax in 2004
70

Epidemiological Reports submitted by Districts from 2003 to 2007
Source: OAG analysis of epidemiological reports from districts
DISTRICTS YEARS 2003 2004 2005 2006 2007
Arua 11 11 8 4 8 Gulu 12 11 12 11 10 Kasese 10 12 12 12 12 Kotido 10 5 0 12 7 Lira 12 12 12 8 9 Mbarara 12 12 12 12 7
ukono 12 10 8 4 6 Nakapiripirit 10 4 3 9 11 Nakasongola 11 12 12 11 11 Ntungamo 10 12 12 10 7 Rakai 12 9 12 9 11 Soroti 12 11 12 11 11 Tororo 11 12 8 10 11
Note: *Districts should submit at least 10 reports per annum
The analysis of the epidemiological report submission of the thirteen districts visited showed that
all districts submitted at least ten epidemiological reports in 2003. In the period under study
(2003-2007), only Gulu, Kasese, Nakasongola and Soroti submitted at least ten epidemiological
reports per annum while the districts of Mukono, Nakapiripirit Arua and Kotido failed to submit
the required number of reports in three out of the five years. All districts did not submit
epidemiological reports by the 15th day of the subsequent month; but did so after two months on
average.
We reviewed 50% of the epidemiological reports and noted that, a third of them were incomplete
thereby making them inadequate as they lacked some vital information needed for surveillance
purposes.
The failure by districts to submit the required number of reports on time per annum was
attributed to the failure by MAAIF to identify effective methods of encouraging submission and
enforcing this requirement.
Failure to submit fully completed and timely reports was attributed to the failure of the DVOs to
effectively monitor and supervise the activities of the VOs and AHOs at the lower local
governments so as to ensure that all livestock information is collected. Insufficient transport
means also contributed to the late submission.
71
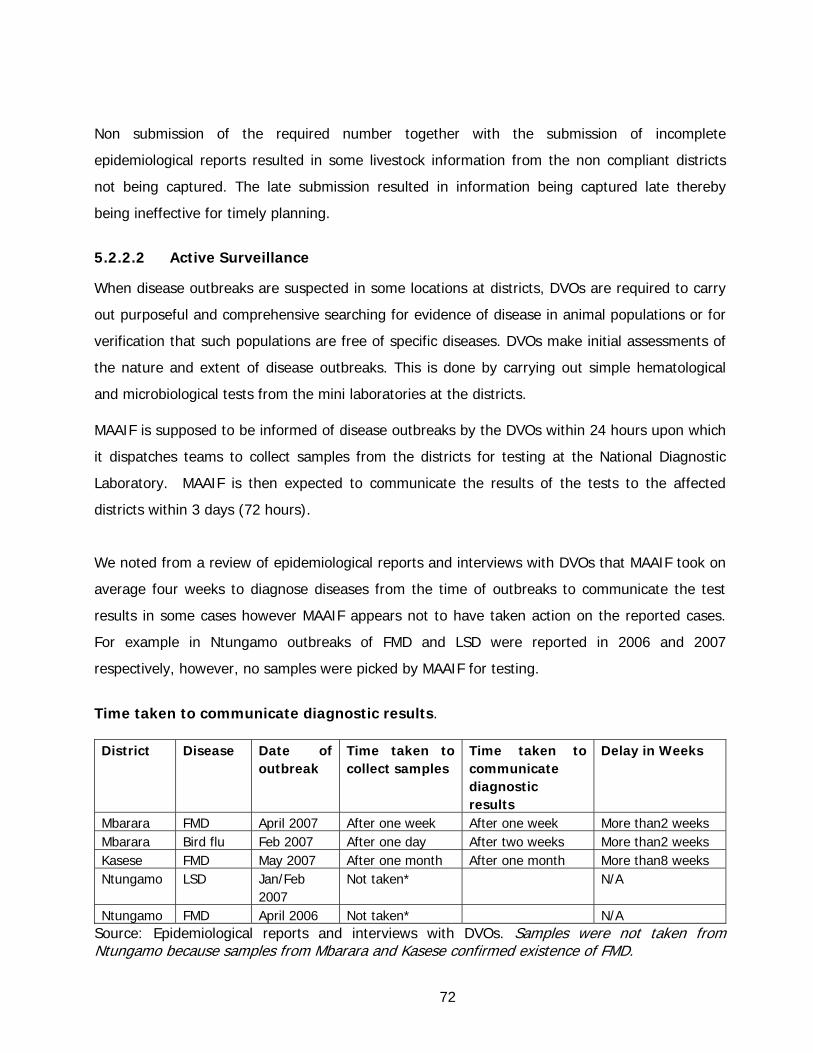
Non submission of the required number together with the submission of incomplete
epidemiological reports resulted in some livestock information from the non compliant districts
not being captured. The late submission resulted in information being captured late thereby
being ineffective for timely planning.
5.2.2.2 Active Surveillance
When disease outbreaks are suspected in some locations at districts, DVOs are required to carry
out purposeful and comprehensive searching for evidence of disease in animal populations or for
verification that such populations are free of specific diseases. DVOs make initial assessments of
the nature and extent of disease outbreaks. This is done by carrying out simple hematological
and microbiological tests from the mini laboratories at the districts.
MAAIF is supposed to be informed of disease outbreaks by the DVOs within 24 hours upon which
it dispatches teams to collect samples from the districts for testing at the National Diagnostic
Laboratory. MAAIF is then expected to communicate the results of the tests to the affected
districts within 3 days (72 hours).
We noted from a review of epidemiological reports and interviews with DVOs that MAAIF took on
average four weeks to diagnose diseases from the time of outbreaks to communicate the test
results in some cases however MAAIF appears not to have taken action on the reported cases.
For example in Ntungamo outbreaks of FMD and LSD were reported in 2006 and 2007
respectively, however, no samples were picked by MAAIF for testing.
Time taken to communicate diagnostic results.
District Disease Date of
outbreak Time taken to collect samples
Time taken to communicate diagnostic results
Delay in Weeks
Mbarara FMD April 2007 After one week After one week More than2 weeks Mbarara Bird flu Feb 2007 After one day After two weeks More than2 weeks Kasese FMD May 2007 After one month After one month More than8 weeks Ntungamo LSD Jan/Feb
2007 Not taken* N/A
Ntungamo FMD April 2006 Not taken* N/A Source: Epidemiological reports and interviews with DVOs. Samples were not taken from Ntungamo because samples from Mbarara and Kasese confirmed existence of FMD.
72

Mean while some Districts do not have diagnostic information due to poor record keeping, while
others could not have data on the time taken to collect samples and time taken to communicate
diagnostic results.
Delays in the time taken to carry out diagnosis at the National Animal Disease and Diagnostic
Laboratory was mainly attributed to insufficient reagents and diagnostic equipments and also to
inadequate staffing (17 personnel instead of the established number of 34). Late communication
of diagnostic results leads to spread of livestock diseases. For instance the FMD out break in
Kasese in May 2007 originated from the purchase of sick animals by a farmer from cattle traders
in Isingiro district which were later transported to Kasese. This particular incident was attributed
to a breakdown in law enforcement.
5.2.3 Cross Border passive Surveillance of Trans Boundary Animal Diseases (TAD)
In collaboration with neighbouring countries, MAAIF is mandated to carry out cross border
passive surveillance in border districts. This is necessary for early detection of diseases
originating from neighboring countries. This cross border passive surveillance on TADs was
intended to cover Rinderpest, FMD, and Rift valley fever, PPR, CBPP, Rabies and African swine
fever (ASF).
We noted that the department had been carrying out surveillance mainly on Rinderpest along the
Northern and North Eastern border areas adjacent to Kenya and Sudan and other districts along
Tanzania, Rwanda and Congo borders. The focus and response to outbreaks of other diseases
such as FMD, CBPP, and PPR had been minimal yet these diseases were prevalent in the border
districts of Rakai, Arua and Kotido/Nakapiripirit.
The reason for not responding to outbreaks of other diseases apart from Rinderpest in the
districts neighboring border areas was mainly due to the project design which focused on only
Rinderpest and inadequate funding.
The weaknesses and/or delays in response led to spread of TADs which in effect led to loss of
revenue in the affected districts due to the closure of several livestock markets.
73
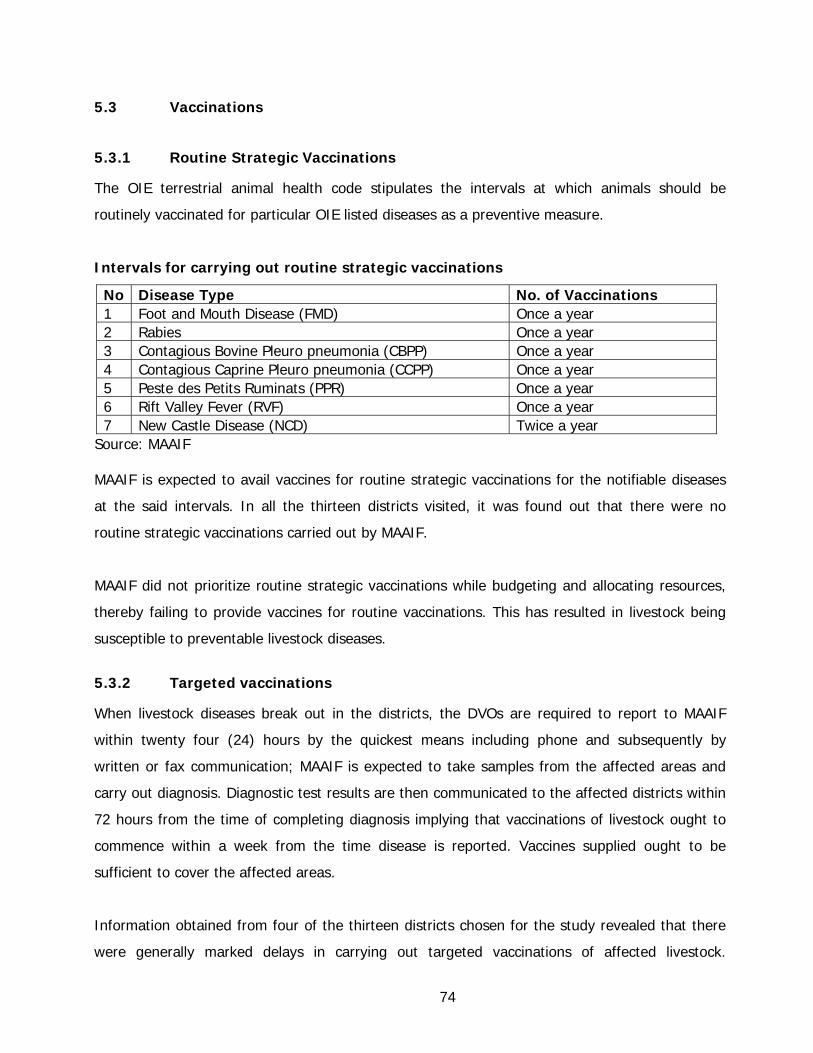
5.3 Vaccinations
5.3.1 Routine Strategic Vaccinations
The OIE terrestrial animal health code stipulates the intervals at which animals should be
routinely vaccinated for particular OIE listed diseases as a preventive measure.
Intervals for carrying out routine strategic vaccinations
No Disease Type No. of Vaccinations 1 Foot and Mouth Disease (FMD) Once a year 2 Rabies Once a year 3 Contagious Bovine Pleuro pneumonia (CBPP) Once a year 4 Contagious Caprine Pleuro pneumonia (CCPP) Once a year 5 Peste des Petits Ruminats (PPR) Once a year 6 Rift Valley Fever (RVF) Once a year 7 New Castle Disease (NCD) Twice a year
Source: MAAIF
MAAIF is expected to avail vaccines for routine strategic vaccinations for the notifiable diseases
at the said intervals. In all the thirteen districts visited, it was found out that there were no
routine strategic vaccinations carried out by MAAIF.
MAAIF did not prioritize routine strategic vaccinations while budgeting and allocating resources,
thereby failing to provide vaccines for routine vaccinations. This has resulted in livestock being
susceptible to preventable livestock diseases.
5.3.2 Targeted vaccinations
When livestock diseases break out in the districts, the DVOs are required to report to MAAIF
within twenty four (24) hours by the quickest means including phone and subsequently by
written or fax communication; MAAIF is expected to take samples from the affected areas and
carry out diagnosis. Diagnostic test results are then communicated to the affected districts within
72 hours from the time of completing diagnosis implying that vaccinations of livestock ought to
commence within a week from the time disease is reported. Vaccines supplied ought to be
sufficient to cover the affected areas.
Information obtained from four of the thirteen districts chosen for the study revealed that there
were generally marked delays in carrying out targeted vaccinations of affected livestock.
74

Information from the other nine districts was not available because of poor record keeping. For
instance in Rukoni sub County in Ntungamo District, where an outbreak of FMD occurred in April
2006, vaccinations commenced in May 2006, a delay of one month. The vaccines that were
received could only cover 40% of the ring vaccinations of the affected areas.
Delays in carrying out targeted vaccinations were caused by delays in taking samples, diagnosing
and availing vaccines to affected areas by MAAIF. In instances where insufficient vaccines were
availed to affected areas, it was attributed to non availability of vaccines at MAAIF. Delays at the
districts were attributed to insufficient logistical support in form of transport and facilitation to
personnel to carry out vaccinations.
Delayed targeted vaccinations resulted in the death of some livestock and spread of diseases to
unaffected herds.
5.2.4 Laboratory Diagnosis
5.2.4.1 Diagnostic capacity at the National Animal Disease Diagnostic Laboratory.
The national animal disease diagnostics and epidemiology laboratory is expected to have
diagnostic capabilities (both technical and logistical) for all notifiable livestock diseases in the
country.
The study noted that from 2003 to 2005 the technical and logistical (test kits) capacity at the
national laboratory was inadequate. In 2006 and 2007 the situation was strengthened by
improving the technical and logistical capacity, however the ability to undertake diagnostic tests
of the notifiable diseases like LSD, Rift Valley Fever, Newcastle disease, rabies, CCPP, and
infectious Bursal Disease (Gumboro) was still limited due to lack of kits.
Lack of test kits for undertaking diagnostic tests was attributed to lack of prioritization, evidenced
in the adequate capacity for diseases. In case of suspected outbreaks of such diseases there will
be failure to confirm the disease strain and effectively respond to contain them in time.
75

5.2.4.2 Diagnostic Capacity at the Districts.
Given the speed at which infectious diseases spread, the key to controlling an outbreak is to
detect and diagnise the disease at the earliest possible stage. If a new disease can be recognized
while it is still localized and prompt action taken to contain it early, chances of controlling it are
markedly enhanced at a low cost with minimum damage to the livestock industry. In order to do
this, districts must have capacity to undertake clinical diagnosis of all diseases and to carry out
simple haematological and microbiological tests. This can only be possible with the availability of
mini laboratories which should have basic minimum laboratory equipment such as centrifuges,
fridges, reagents, light microscopes and glass ware (test tubes, beakers, specimen bottles).
Of the 13 districts studied, only Tororo, Rakai, Mbarara and Soroti had functional mini
laboratories with all the basic requirements for carrying out tests. Ntungamo district had a
laboratory in place which was non functional. It was also established that the districts of Kasese,
Arua and Kotido lacked laboratory space, although they had some basic minimum equipment.
Lack of mini laboratories at some districts was attributed to the failure to provide laboratory
space (building) by the districts which would then be equipped with the basic mini laboratory
equipments by MAAIF.
This resulted in most diagnostic tests (both simple and complex) being referred to the National
animal laboratory at MAAIF leading to delays in diagnosis of livestock diseases.
5.2.5 Sensitizations
Sensitizations should be suited to target groups. To achieve this best practice requires that the
people targeted should have some input in the development of sensitization materials. For
sensitization to achieve the desired results, the language, timing, medium of transmission and
the places where sensitizations materials are hanged/ pinned should be appropriate. Sensitization
materials should have a local touch and should depict what is suitable to the local settings.
Messages in posters ought to be explained to all concerned especially livestock farmers and
traders by extension workers (VOs and AHOs) during distribution. Sensitization in addition to
other initiatives like vaccinations, and quarantining should always be carried out when there are
disease outbreaks.
76

We noted that MAAIF carried out sensitizations through conducting seminars and workshops
involving the DVOs, VOs, AHOs and other district veterinary staff. It was however noted that
posters were not hanged in some public places like community centres and abattoirs. Besides the
messages in some of the posters was not clear and had not been explained to livestock farmers
by the extension workers in all the districts during distribution. It was also established that the
pre-testing of sensitization material in the districts was not extensive.
In Kasese, sensitization materials were last received in April 2005, yet there were other disease
outbreaks reported in May 2007, like the FMD outbreak in Lake Katwe Sub-county at Queen
Elizabeth National Park.
Although the VOs of Mbarara, Rakai, Ntungamo and Kasese, stated that they carried out some
sensitizations concurrently with the surveillance activities, there were no activity reports to
corroborate this information.
Failure by the extension workers to explain the messages in posters was attributed to districts’
failure to prioritize the veterinary and entomological activities thereby allocating inadequate funds
for extension services. Failure by MAAIF to develop adequate and appropriate sensitization
materials and carryout extensive pre-testing in the districts was attributed to limited funding and
conditionalities of the funding organizations who dictated which materials to procure and districts
to target.
The weaknesses in sensitizations resulted in limited awareness in the prevention and control of
livestock diseases by livestock farmers, cattle traders and local leaders.
5.2.6 Animal movement control
5.2.6.1 Enforcement of Veterinary regulations at Animal Check Points (ACPs) along
NSR’s
MAAIF is required to operate Animal Check Points (ACPs) in high animal disease risk areas and
along the NSRs. ACPs operated are strategic, mobile or fixed. ACPs are operated in order to
inspect animals for health status, verify authenticity of movement permits and guarantee animal
welfare standards. Only animals and livestock products inspected and scientifically proven to be
disease and contaminant free are permitted to be moved. ACPs are required to have basic
77

infrastructure like sheds to be used as offices, road barriers, chairs, tables and nearby facilities
like AHGs where suspect animals and animal products are withheld for investigation and
appropriate action. Such facilities require security, water, feeds, disinfectants and animal health
and storage facilities like crushes and dips.
We noted that MAAIF operated fixed ACPs in the districts of Soroti, Kasese, Rakai and Arua and
mobile ones in Mukono, Mbarara, Kotido, Arua and Ntungamo. The district of Tororo did not
operate ACPs. A part from Mukono, Kasese and Rakai, the rest of the districts neither had AHGs
nor AQSs and therefore held impounded livestock in unsuitable places like police stations which
lacked adequate water and pasture. The conditions in such places made the authorities to
sometimes release impounded livestock before action could be taken against the culprits. We
were informed that there was rampant movement of livestock by cattle traders during the night a
long the NSRs when the ACPs are not operating.
Absence of ACPs in some districts was attributed to both MAAIF’s and districts’ failure to allocate
sufficient funds for operating the ACPs. Lack of animal holding infrastructure was due to failure
by districts to avail land with titles to MAAIF to be developed for AHGs and AQSs. Rampant
movement of livestock during the night was mainly attributed to obsolete veterinary laws
especially those regarding fines for defaulters, which were non deterrent and operation of ACPs
only during the day.
5.2.6.2 Animal movement control at Border entry points
MAAIF is supposed to have at least one VO stationed at any border entry point to ensure legal
importation and exportation of livestock and livestock products. The border entry points are also
required to have nearby AHGs or AQSs for screening animals for pests and diseases before they
are allowed into the country. Suspected animals are kept for a period of not less than 14 days for
observation and testing.
We noted that only 4 out of 28 border entry points namely Entebbe International Airport, Malaba,
Busia and Mutukula had VOs stationed and the rest did not. Of the four that had VOs, only
Entebbe International Airport and Mutukula had AQSs.
78

The absence of VOs was attributed to shortage of qualified staff. Absence of AQS was due to
failure by districts to avail land with titles to MAAIF to develop and equip as AHGs and AQSs.
Lack of VOs at some entry points enabled livestock farmers and cattle traders to move livestock
in and out the country through the official border points without permit verifications and
mandatory veterinary inspections. Lack of AHGs and or AQSs encouraged the entry of suspected
animals into the country without isolating and holding them for a period of more than 14 days for
the mandatory observation and testing for diseases.
It is worth noting that from 2003 to 2007 livestock and livestock products worth shs 95billion and
shs29 billion were exported and imported respectively through Uganda’s border entry points.
Malaba border point handled the bulk of exports with livestock and livestock products valued at
shs 54billion during the period, although most of the livestock and livestock products exported
were not processed, processed hides and skins accounted for most of the export revenue.
5.2.7 Coordination between MAAIF and the districts
Section 97 of the Local Government Act 1997 states that for the purposes of implementation of
national policies and adherence to performance standard by Districts, line ministries shall inspect,
monitor and where necessary offer technical advice, support supervision and training in their
respective sectors.
Section 98 requires a government line ministry to;
a) Monitor and co-ordinate government initiatives and policies as they apply to Local
Governments.
b) Co-ordinate and advise persons and organizations in relation to projects involving direct
relations with local governments; and
c) Assist in the provision of technical assistance to local governments.
5.2.7.1 Implementation of Livestock activities at Districts
It was was revealed from interviews with DVOs during audit that MAAIF did not have effective
control over the DVOs with regard to implementation of MAAIF livestock programs and activities
at the Districts. The DVOs further asserted that MAAIF does not offer adequate technical
assistance, monitoring and supervision of activities carried out in the districts. DVOs cited failure
to rehabilitate dip tanks; de-silt valley dams and tanks as examples of MAAIF’s failure to offer
technical support. This was evidenced through field visits which confirmed the poor state of
79
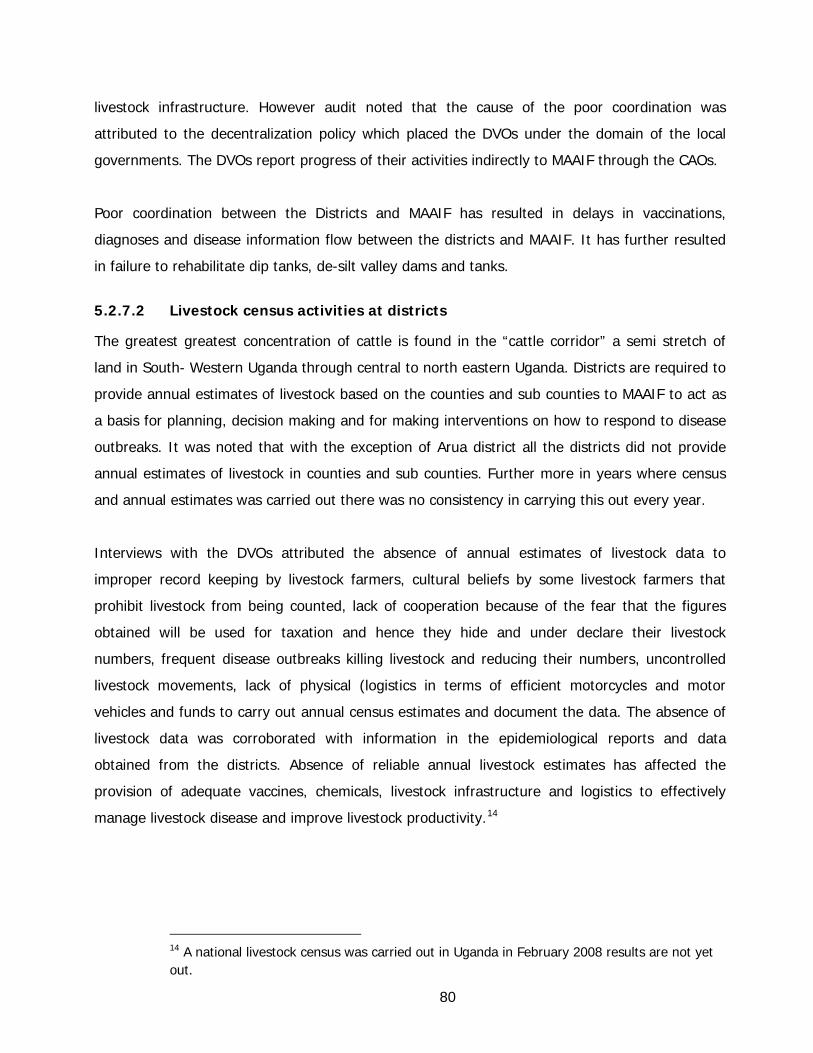
livestock infrastructure. However audit noted that the cause of the poor coordination was
attributed to the decentralization policy which placed the DVOs under the domain of the local
governments. The DVOs report progress of their activities indirectly to MAAIF through the CAOs.
Poor coordination between the Districts and MAAIF has resulted in delays in vaccinations,
diagnoses and disease information flow between the districts and MAAIF. It has further resulted
in failure to rehabilitate dip tanks, de-silt valley dams and tanks.
5.2.7.2 Livestock census activities at districts
The greatest greatest concentration of cattle is found in the “cattle corridor” a semi stretch of
land in South- Western Uganda through central to north eastern Uganda. Districts are required to
provide annual estimates of livestock based on the counties and sub counties to MAAIF to act as
a basis for planning, decision making and for making interventions on how to respond to disease
outbreaks. It was noted that with the exception of Arua district all the districts did not provide
annual estimates of livestock in counties and sub counties. Further more in years where census
and annual estimates was carried out there was no consistency in carrying this out every year.
Interviews with the DVOs attributed the absence of annual estimates of livestock data to
improper record keeping by livestock farmers, cultural beliefs by some livestock farmers that
prohibit livestock from being counted, lack of cooperation because of the fear that the figures
obtained will be used for taxation and hence they hide and under declare their livestock
numbers, frequent disease outbreaks killing livestock and reducing their numbers, uncontrolled
livestock movements, lack of physical (logistics in terms of efficient motorcycles and motor
vehicles and funds to carry out annual census estimates and document the data. The absence of
livestock data was corroborated with information in the epidemiological reports and data
obtained from the districts. Absence of reliable annual livestock estimates has affected the
provision of adequate vaccines, chemicals, livestock infrastructure and logistics to effectively
manage livestock disease and improve livestock productivity.14
14 A national livestock census was carried out in Uganda in February 2008 results are not yet out.
80

5.2. 8 Collaboration between MAAIF and key stakeholders
5.2.8.1 NALIRRI
This is the sole livestock resources research institute in the country mandated to carry out
research on livestock diseases and technologies. It develops technologies for livestock
management which are passed on to MAAIF for adoption and implementation. Some of the
research programs planned by NALIRRI include vaccine development, disease strain isolation and
research into determining the timing of vaccinations.
We noted that NALIRRI does not have the human resource expertise and technical facilities to
develop vaccines for livestock disease strains prevalent in Uganda. This was due to limited
development of the research institute over the years.
As a result MAAIF has continued to rely on the importation of vaccines and consequently failed to
undertake routine strategic and adequate targeted vaccinations.
5.3.8.2 Uganda Wilde life Authority (UWA)
Some epizootics attack both livestock and wildlife. Therefore wildlife disease surveillance must
not be overlooked due to the vulnerability of adjacent livestock populations. Close cooperation is
therefore required between veterinary and wildlife authorities.
In this regard, MAAIF signed a Memorandum of Understanding (MoU) under the PACE project,
with UWA in March 2002 to collaborate on the control of and monitoring of Epizootic diseases.
MAAIF was to encourage and facilitate involvement of UWA staff in PACE epidemiological
surveillance work. All districts were to send summarized monthly disease surveillance reports to
MAAIF within seven days of the end of the month, to be consolidated by MAAIF and sent to
UWA. Emphasis of this surveillance was to be placed on Rinderpest, Rabies, CBPP and FMD
diseases. The study revealed that sero surveillance in wildlife, involving UWA and MAAIF staff
was carried out in all the major National Parks and wildlife reserves. However the surveillance of
wildlife diseases focused on only Rinderpest.
We noted from the PACE 1st annual report that although MAAIF was expected to submit
summarized disease surveillance reports from the districts, to UWA on quarterly basis, this was
81

not being complied with fully. Out of 627 filled formats expected by end of 2005, only 486 had
been received at the epidemiology unit. This was an outturn of 77.5% compared to 72.4% in
2004. Failure by MAAIF to submit quarterly reports to UWA was affected by the delayed
installation of the ARRIS (Animal Resources Research Information System) programme at the
districts. Under this programme, computers were to be given to the districts to ease collection,
collation and dissemination of disease information to MAAIF. However, the implementation of the
programme got delayed due to insufficient training of PACE coordinators at the districts. This
impacted negatively on MAAF’s ability to submit quarterly reports to UWA.
The failure by MAAIF to submit copies of summarized disease surveillance reports from all
districts to UWA on a quarterly basis resulted in un-coordinated prevention and control activities
between MAAIF and UWA. Besides focusing only on Rinderpest surveillance, increases the risk of
spread of other diseases like Rabies, CBPP and FMD.
5.28.3 East African Community
Diseases do not know boundaries. OIE, WHO and FAO encourage collaboration between
countries in order to enjoy benefits that can be derived when countries cooperate in livestock
development activities including emergency livestock disease preparedness planning. Countries
are expected to devise mechanisms for information sharing, joint research on transboundary
diseases, coordinating emergency responses and where necessary implementing joint disease
prevention and control programmes.
MAAIF has been collaborating with neighboring countries like Kenya, Tanzania and Rwanda in
control of TADs. We noted that meetings were held between MAAIF and the neighbouring
countries on a number of initiatives like the prevention and control of Rift Valley Fever,
Rinderpest, and Avian Influenza.
A visit to Rakai and Ntungamo districts also confirmed the occurence of consultative meetings,
between the leaders of the two districts and the local leaders of Rwanda and Tanzania. These
meetings were held so as to control the outbreak of FMD in 2006. It was noted however, that
these joint initiatives were carried out mainly when there were outbreaks of diseases.
82

Limited resources was the reason advanced by both MAAIF and the districts as to why the
collaborative initiatives with neighboring countries were only carried out during disease outbreaks
and not on a regular basis.
The effect of limited collaboration with neighboring countries has been the failure of MAAIF to
obtain adequate reliable information on livestock diseases from neighboring countries thus
affecting its timely response to disease out breaks originating from the borders of Uganda and
spreading into the country.
5.2.9 Vector Control measures
5.2.9.1 Entomological Monitoring
MAAIF is mandated to carry out entomological monitoring and produce or update vector
distribution and prevalence maps annually. Over the period covered by this report there was a bid
to control tsetse flies which spread nagana and sleeping sickness.
MAAIF through FITCA project carried out a baseline survey in twelve districts of South Eastern
Uganda to establish the levels of tsetse and disease challenge. The target of the project was to
reduce the tsetse infestation by 75% in the designated high risk sub counties. 1040 parishes were
tsetse surveyed in the district of (Busia, Kayunga, Mayunge, Mukono, Jinja, Iganga, Pallisa, Bugiri,
Kamuli, Tororo, Mbale, Soroti). Out of the 1040 parishes 103 were graded high risk, 265 medium
risk and 672 low risk.
After a risk analysis of parishes in the above districts which were tsetse surveyed using the flies
per trap per day (FTD) as a measure, fixed monitoring sites (FMS) were established which were
then followed by the deployment of tsetse traps in the high risk Sub counties. A total of 27,278
insecticide treated tsetse traps were subsequently deployed in 42 sub counties (22,520 pyramidal
and 4,758 monoscreen) with an estimated area of 4158 sq km under trap deployment.
83

Traps originally deployed at start of FITCA selected districts District No of
community workers
No of pyramidal traps deployed.
No of monoscreen traps deployed
No of sub counties Under tsetse control
Approximate area under tsetse control (sq Km).
Mukono 18 2,310 0 3 213 Tororo 18 1,491 318 3 175
Source: FITCA Summary Final Report MAAIF
In the 12 districts which were identified as high risk a specific intervention called Farming in
tsetse controlled areas (FITCA) project was designed to reduce the tsetse infestation by 75% in
the designated high risk sub counties and monitor the tsetse flies in these districts.
The FITCA districts were also required to submit monthly entomological monitoring reports to
MAAIF
FITCA districts
We selected 3 FITCA districts out of the twelve namely Soroti, Tororo and Mukono for review and
it was established that all of them submitted entomological monitoring reports to MAAIF.
However we noted that the formats of these reports varied in the district of Soroti despite
agreement by MAAIF and the districts to use agreed formats as Tsetse survey format and
Entomological monitoring format during the field harmonization meetings.
Non FITCA districts
With the exception of Mbarara, Ntungamo, Lira and Arua, no entomological monitoring for tsetse
is carried out in the districts. Only FITCA districts submitted monthly reports to MAAIF on vector
and tsetse control activities with no evidence of reports submitted to MAAIF by the other
districts. Meanwhile only Ntungamo compiled a report on entomological activities but the report
remained at the district. It was also noted that there was lack of uniformity in the information
submitted to MAAIF in accordance to the set standards.
84

The failure by Soroti district to submit harmonized reports on tsetse monitoring was due to
failure by MAAIF to effectively supervise and monitor the agreed reporting format.
While for non FITCA districts Failure of entomological monitoring was mainly attributed to lack of
staff in most districts and failure by the districts to prioritize entomology as an important activity
and the existing system under decentralization were districts were supposed to buy their own
logistics for Vector Control with no MAAIF support.
It was noted that MAAIF notified that any district which buys traps will be given insecticide to
treat the traps but because of the low priority given by the districts the traps are rarely bought
this has led to the resurgence of tsetse fly densities in some sub counties.
Lack of qualitative and timely information on vectors such as tsetse flies affects proper planning
and delays interventions by MAAIF to reduce the tsetse infestation in the affected areas and
prevention and control of trypanosomiasis in livestock
5.2.9.2 Vector control Measures in FITCA Districts
a) Fixed Monitoring Sites (FMS) and deployment Tsetse traps
A review of FITCA project work plans and annual reports and field visits to the districts of
Mukono, Tororo and Soroti established that these vector control measures were successful in
reducing the tsetse infestation and control of trypanosomiasis. Except for Soroti district, the
tsetse traps deployed in the FMS ie Mukono and Tororo showed that tsetse population had
reduced significantly. Mukono last deployed tsetse control traps in 2004 while Tororo had only 42
traps deployed at the time of audit this was attributed to the small district budgets to buy traps
for the districts. Active trap deployment under FITCA ended in 2004 and local governments were
supposed to carry on however this was observed not to have happened.
85
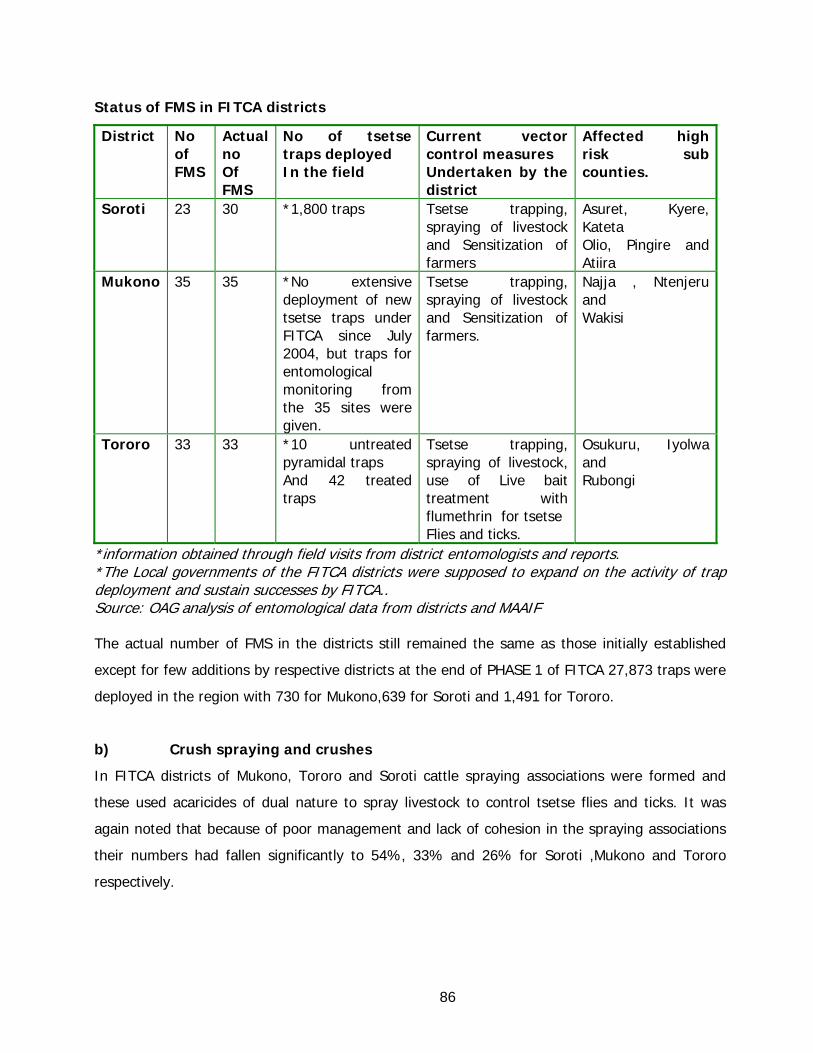
Status of FMS in FITCA districts
District No of FMS
Actual no Of FMS
No of tsetse traps deployed In the field
Current vector control measures Undertaken by the district
Affected high risk sub counties.
Soroti 23 30 *1,800 traps
Tsetse trapping, spraying of livestock and Sensitization of farmers
Asuret, Kyere, Kateta Olio, Pingire and Atiira
Mukono 35 35 *No extensive deployment of new tsetse traps under FITCA since July 2004, but traps for entomological monitoring from the 35 sites were given.
Tsetse trapping, spraying of livestock and Sensitization of farmers.
Najja , Ntenjeru and Wakisi
Tororo 33 33 *10 untreated pyramidal traps And 42 treated traps
Tsetse trapping, spraying of livestock, use of Live bait treatment with flumethrin for tsetse Flies and ticks.
Osukuru, Iyolwa and Rubongi
*information obtained through field visits from district entomologists and reports. *The Local governments of the FITCA districts were supposed to expand on the activity of trap deployment and sustain successes by FITCA.. Source: OAG analysis of entomological data from districts and MAAIF
The actual number of FMS in the districts still remained the same as those initially established
except for few additions by respective districts at the end of PHASE 1 of FITCA 27,873 traps were
deployed in the region with 730 for Mukono,639 for Soroti and 1,491 for Tororo.
b) Crush spraying and crushes
In FITCA districts of Mukono, Tororo and Soroti cattle spraying associations were formed and
these used acaricides of dual nature to spray livestock to control tsetse flies and ticks. It was
again noted that because of poor management and lack of cohesion in the spraying associations
their numbers had fallen significantly to 54%, 33% and 26% for Soroti ,Mukono and Tororo
respectively.
86

Status of cattle spraying associations in selected FITCA districts
District No of established Crush spray associations
No of existing Crush spray associations
Percentage of active Crush spraying associations
No of crushes
Soroti 28 15 54% No information availed Mukono 33 10 33% 17 Tororo 28 10 26% 22
Source: FITCA project MAAIF
ii) Vector control in Non FITCA districts
District entomological activities did not exist in Kasese, Kotido,Nakapirpirit, Rakai, Nakasongola,
Gulu and Lira., except in Arua, Mbarara and Ntungamo on a limited scale.
Tsetse Traps
We noted that very few districts deployed tsetse traps in sub counties to make any serious
impact on trapping of tsetse flies and other nuisance biting flies and most of these traps were not
treated. The Majority of the districts did not deploy traps altogether. In Ntungamo the small
number of untreated traps deployed in the field was attributed to limited number of traps in the
stores, few trap attendants to monitor the traps and theft of traps deployed in the field. The
district administration did not provide chemicals to treat traps nor did MAAIF send chemicals.
Non existent district entomological vector activities was attributed to lack of staff (entomologists
and entomological assistants) in the districts, lack of prioritization and funding by the districts of
entomological activities, and very limited support from MAAIF due to decentralization of vector
control to the districts.
DVOs stated that they only carried out an advisory role of telling the livestock farmers to spray
livestock using approved and recommended acaricides, the DVOs also encouraged livestock
farmers to treat livestock with trypanomicides.
87

5.2.9.3 Vector control infrastructure
i) Cattle dips and dip wash testing
DVOs and MAAIF recommend regular dipping of livestock in dip tanks to control ticks and other
nuisance biting flies. Dip wash testing for acaricide use by the districts is required once a year to
establish the strength of the acaricdes and the results communicated to the DVO and MAAIF
The government function is limited to regulatory functions of inspections, monitoring and
diagnosis of TBDs. MAAIF monitors tick resistance in acaricde use and conduct on spot checks on
acaricides on the market to ensure that adultered and substandard products are not sold to
unsuspecting livestock farmers.
Dip wash testing for acaricides was not being done in all the selected districts except in Rakai
and Mbarara where decatix and supona respectively were tested for acaricide strength. Dip wash
testing is carried out by companies supplying the acaricides to livestock farmers independently
and not by the districts or MAAIF.
Dipping of livestock in dip tanks as a practice to kill off ticks and nuisance flies is no longer
undertaken in most districts. The communal dips have either collapsed or are neglected except
for private dips. Where livestock farming practice is not communal, livestock farmers owning
private farms as in Mbarara, Ntungamo and Kasese spray livestock using bucket pumps to
counter the none operational dips. The presence of many non functional dip tanks in the districts
was attributed to failure by the districts to rehabilitate and maintain the communal dips.
Meanwhile livestock farmers do not have adequate funds to operate private dips opting to use
bucket pumps instead as an alternative.
Very few functional community based animal health workers (CBAHW) are available to monitor
and maintain dips, private dips are very few except for in Mbarara district with 96 private dips in
Kashari County 12 private dips in Rwampara County; The position of dips for the selected
districts is shown in the table below;
88

Status of Communal and Private Dips District Communal dips Private dips Total Total Percentage Functional
dips Non functional dips
Functional dips
Non functional dips
Expected Functional dips
Actual Functional dips
% of actual Functional dips
Ntungamo 0 46 3 13 62 3 4.8% Kasese 1 4 1 0 6 2 50% Tororo 0 11 2 8 21 2 9.5% Soroti 2 17 1 7 27 3 11.1% *Kotido 5 5 5 0 *Nakapiripirit 0 8 0 0 8 0 0 Arua 0 11 0 5 16 0 0 Nakasongola 0 0 7 0 7 7 100% Rakai 0 6 10 10 26 10 38.5% *Mukono
Source: OAG analysis district data and interviews Note: *Kotido has 2 dips still under construction financed by NUSAF
*Nakapiripirit two dips under construction. July 2007 epi report *Mukono all communal dips have broken down the current dips are private
A neglected Cattle Dip in Arapai Soroti district. December 2007
89

5.2.9.4 Registration and approval of acaricides by MAAIF
Under the NDA statute, NDA is mandated to approve, authorize and regulate the type of
acaricides to be imported and used in the country. This is done in collaboration with MAAIF
through the commissioner and the Director General of National Agricultural Research
Organization (NARO) to ensure that only safe and efficacious acaricides are registered.
Approval and registration of acaricides for use takes a long time. So far 19 candidate acaricides
have been tested and recommended to MAAIF for use. Of these 6 are registered, 2 in the
process of being registration and 9 pending registration.
Acaricides tested and recommended for use by MAAIF Acaricide Year tested Status Delays in
registration Bayticol 2% pour -on 2001 Registered None Triatix 2001 Registered ” Ektoban 2001 Not Known ” Ecotic 2002 Registered ” Protaid 2002 Registered ” Cyperthion 2002 Registered ” Alfapor 2002 Registered ” Dominex 2003 In process of registration 5years Butox 2003 In process of registration 5years Delete 2003 Test results withheld due to
Non- payment of test fee 5years
Deltamethrin 10% EC 2005 Pending registration 3 years Alphacypermethrin 5% EC 2005 Pending registration 3 years Cypermethrin 10% EC 2005 Pending registration 3 years Paratryn 2005 Pending registration 3 years Paratraz 2005 Pending registration 3 years Alfacyp 2006 Pending registration 2 year Tickbuster 2006 Pending registration 2 year Deltatick Dip 2006 Pending registration 2 year Deltatick pour-on 2006 Pending registration 2 year
Source: MAAIF
The acaricides Deltamethrin 1 %( Pour on), Deltamethrin 5 %( Dip/spray) and Tsetse tick have
also been recommended for use by MAAIF. MAAIF is unable to effectively monitor, regulate and
90
enforce proper use of acaricides for vector control because the vector control section in MAAIF
has only two officers a Principal entomologist and a senior entomologist for the whole country.
This technical capacity is grossly inadequate for the whole country.
5.3 CONCLUSIONS
5.3.1 Surveillance
• Non, incomplete and/or late submission of epidemiological reports has impeded MAAIF‘s
epidemiological unit from performing its role of providing up to date and timely information
to the department and OIE.
• Delays in carrying out diagnostic tests and communicating test results to affected districts
led to increased risk of spread of livestock diseases due to delays in combating the disease.
5.3.2 Vaccinations
• Lack of routine vaccinations of livestock in the country has resulted in loss of livestock
through diseases which would otherwise have been prevented.
• Delays in taking samples, diagnosing and communicating test results to the affected areas
by MAAIF impacted on the timing and availing vaccines and delayed commencement of
actual vaccinations.
• Inadequate and delayed targeted vaccinations resulted in diseases spreading to
surrounding areas there by risking more livestock to get infected.
• Well-planned, comprehensive vaccination programmes, supplemented by other disease
control measures, can go a long way towards controlling many epidemic livestock diseases.
5.3.3 Laboratory Diagnosis
Control of livestock diseases is extremely difficult and costly if suspected diseases are not
quickly diagnosed and appropriate actions taken to either prevent outbreaks or spread. Given the
inadequate capacity to diagnose livestock diseases at the districts, there is bound to be delayed
confirmation of diseases, strains of causative agents and required vaccinations thereby leading to
disease spread and possible loss of livestock.
91

5.3.4 Sensitisation
The limited pre testing of sensitization materials in the districts and inadequate sensitization
materials developed by MAAIF contributed to limited knowledge and awareness of information on
prevention and control of livestock diseases..
5.3.5 Animal movement control
• Lack of basic infrastructure and AHGs with security, water, feeds, disinfectants and animal
health facilities have abetted illegal movement of livestock.
• Non availability of VOs in some border entry points coupled with the lack of AHGs and AQSs
has made it difficult to isolate, observe and screen livestock for diseases during exports and
imports.
• Increased cross border trade heightens the risk of introducing livestock diseases.
5.3.6 Coordination between MAAIF and the Districts
• Following the decentralization policy of government, MAAIF lost direct control over the
Districts Veterinary activities, thereby making veterinary infrastructure that had been built
neglected and out of use mainly due to lack of maintenance and no prioritization by the
districts.
• The poor state of livestock infrastructure (without adequate basic facilities in the districts
like cattle dips, abattoirs and inadequate enforcement facilities as such AHGs, AQS and
ACP) has greatly affected the extent to which the department has been able to effectively
prevent and control livestock diseases.
• Absence of accurate, reliable and timely data on livestock activities in the districts impedes
effective decision making and planning by MAAIF in responding to livestock disease control
• MAAIF’s inadequacy in monitoring and inspecting livestock activities in the districts resulted
in delays in carrying out disease prevention and control activities as well as the dilapidation
of livestock infrastructure.
92
5.3.7 Collaboration between MAAIF and key stakeholders
NALIRRI
• Research in vaccine developments would go along way in easing the economic burden in
vaccine procurements for some vaccines.
UWA
• Inadequate surveillance activities between MAAIF and UWA increases the risk of spread of
diseases from the game parks/reserves to livestock and vice versa.
• Close collaboration between MAAIF and UWA is paramount in order to ensure effective
prevention and control of spread of livestock diseases from the National parks to the
surrounding communities and vice versa.
East African Community
• Collaboration with neighboring countries eases the burden on all countries in the
Community and results in harmonized plans and initiatives for prevention and control of
animal disease emergencies in the region.
• A regional approach to prevention and control of livestock diseases is more likely to
succeed and it will reduce the subsequent risks for all countries to a greater extent than if
countries acted independently.
• A number of activities could be carried out in combination to prevent and control epidemic
livestock diseases. The weight to be given to the different activities will be determined by
the nature of the disease in question, the epidemiological circumstances and their
acceptability and cost.
5.3.8 Vector Control
• The existing manpower capacity for entomological monitoring in place at MAAIF is not
adequate to address vector control in the Country. In addition the decentralization of
entomological activities at the districts has not been effective in vector control.
93

5.4 RECOMMENDATIONS
We recommend the following to be carried out;
5.4.1 Surveillance
i) MAAIF should identify methods of encouraging report submission and enforce the
requirement by the districts to submit timely epidemiological reports monthly such that
livestock disease information is effectively captured and analysed.
ii) MAAIF should also make more effort in guiding and strengthening the DVOs in completing
the epidemiological forms in addition to monitoring and supervision of VOs and AHOs at the
lower local governments so that timely collection, collation and dispatch of all
epidemiological data to districts is carried out.
iii) MAAIF should liaise with the Ministry of Public Service so as to address the staff shortage at
the department.
iv) The department should continue with cross border surveillance which the PACE project had
initially targeted.
5.4.2 Vaccinations
Routine strategic vaccinations
i) Basing on a risk analysis MAAIF should identify areas prone to disease outbreaks and carry
out routine strategic vaccinations.
ii) MAAIF should also enter into contracts with vaccine manufactures to keep some vaccine
stocks readily available for delivery following disease outbreaks. This arrangement has been
used by some countries/ organisations and found to be effective.
iii) MAAIF should make funds readily available for emergency procurement of vaccines
following disease out breaks.
94
Targeted vaccinations
iv) Emphasis should be put in timely collection of samples, diagnoses and communication of
diagnostic test results to affected areas following disease outbreaks so as to ensure timely
vaccinations.
v) Build Buffer stocks of all types of vaccines to cater for unforeseen outbreaks of livestock
diseases to enable adequate coverage during vaccinations.
vi) Avail transport facilities to the districts to ease transportation and vaccine delivery to
disease affected areas
5.4.3 Laboratory Diagnosis
National animal disease diagnostics laboratory.
i) The laboratory should be fully equipped with reagents test kits and equipment to handle
multiple disease diagnosis on samples collected during surveillance.
ii) Address the staff shortage at the laboratory in order to ensure prompt diagnosis of
livestock diseases and communication of test results.
Districts
iii) Urge the districts to avail secure land with titles so that MAAIF builds laboratories and
equips them adequately to perform basic diagnostic tests.
iv) Fully equip the districts with sample collection kits for the common livestock diseases.
5.4.3 Sensitisation
i) MAAIF in developing sensitization materials should increase the level of pre-testing to cover
more districts and actively involve other stakeholders like local governments in order to
ensure that the materials are suited to the local settings of the targeted groups.
ii) MAAIF should also ensure that NAADS incorporates livestock health sensitization in the
extension services.
5.4.5 Animal movement control
i) Districts should be urged to avail land with titles to establish AHGs and AQSs for holding
livestock impounded from ACPs and border entry points.
95

ii) Adequate funding should be availed by MAAIF to the districts to operate ACPs
iii) Strengthen support to districts which do not have movement control infrastructure by
providing facilities and equipment.
iv) MAAIF should strengthen livestock and livestock products movement control systems at the
border entry points by stationing VOs at each entry point to ensure legal exportation and
importation of livestock. In addition all other illegal cross points should be regulated by all
stakeholders with support from MAAIF and the Police.
v) MAAIF should identify all the land of veterinary interest in the districts so as to secure land
titles and lease offers for subsequent development of AHG and AQS.
5.4.6 Coordination between MAAIF and the districts
MAAIF should;
i) Strengthen inspection and monitoring of livestock disease initiatives and programs in the
districts and improve coordination of livestock activities between MAAIF and the Districts.
ii) Sensitize livestock farmers on record keeping of livestock data and empower DVOs to
obtain annual estimates of livestock data to enable effective planning by MAAIF in
prevention and control of livestock diseases.
5.4.7 Collaboration between MAAIF and Key stakeholders
i) MAAIF in collaboration with NALIRRI should ensure that the research agenda at the
livestock institute addresses National requirements. The inadequate technical staff and
facilities for carrying out research should also be addressed.
ii) MAAIF should speed up the training of district personnel meant to implement the IRIS
programme so as to enable exchange of epidemiological information between UWA and
MAAIF.
iii) Following the eradication of Rinderpest, emphasis should forthwith be directed to other
diseases as Rabies, FMD, CBPP, CCPP, RVF, LSD, PPR and ASF.
iv) Closer collaboration at local and regional level should be encouraged with EAC and
extended to other neighboring countries outside the East African Community such as Congo
and Sudan.
96

5.4.8 Vector control
Entomological monitoring
i) MAAIF should monitor all districts for entomological activities and come up with standard
forms on entomological activities which should be reported upon by the districts.
ii) Support the districts by availing them transport logistics as motorcycles for field staff and
bicycles for trap attendants.
iii) MAAIF should liaise with Districts and ensure that they prioritize veterinary and
entomological activities by allocating adequate funds.
Vector control measures
i) MAAIF should undertake a comprehensive review of the effectiveness and efficiency of
vector control measures and their appropriateness to the local circumstances in the districts
and where possible recentralize vector disease control.
ii) MAAIF together with NARO and NDA should speed up the testing, approval and registration
of acaricides.
iii) There is need to strengthen the capacity of Nalirri to undertake acaricide tick resistance
testing and confirmation.
Vector control infrastructure
i) Carry out a comprehensive review of the status of all vector control infrastructure in the
districts in order to effectively plan how and where to provide technical and logistical
support.
ii) Enhance capacity of the entomological technical staff at the districts.
97

6.0 PROVISION OF WATER AND MAINTENANCE OF WATER
FACILITIES IN DISTRICT LOCAL GOVERNMENTS BY THE
DIRECTORATE OF WATER DEVELOPMENT, MINISTRY OF
WATER AND ENVIRONMENT – (ISSUED MARCH 2009)
6.1 INTRODUCTION
6.1.1 Background to the Audit
This Performance audit on the Provision of Water and Maintenance of water facilities in rural
areas by District Local Governments, has been conducted in accordance with Article 163 (3) of
the Republic of Uganda, and section 21(1) of the National Audit Act 2008. The audit focused on
the management of the Rural Water Supply and Sanitation programme in providing and
maintaining water facilities in rural communities and to ascertain whether the programme has
been effective in providing safe water to the rural communities.
6.1.2 Reasons for the Audit
Since the implementation of the Rural water supply sanitation programme in 1991, the
government of Uganda, has spent a substantial amount of money in this area. For example,
during the three (3) financial years from 2004/05 to 2006/07, an amount of 96 billion, was spent
by the Ugandan government with support from Development partners, towards the provision of
water and sanitation facilities in rural areas.
Despite these efforts, only 57% access to rural water supply was achieved in the year 2005
against the PEAP target of 65%, and 63% instead of 67% in the year 2007.
Improved access to water supply has two potential benefits; improved health and saving in time
wasted collecting water. However there is increased concern that valuable time is still being
spent by the rural community in walking long distances to collect water, instead of carrying out
other productive activities such as farming.
98

It was also noted that the number of people served by one water source is more than 500
against the required target of 300 people.
This audit was conducted to identify the major challenges to the programme and to make
recommendations to address the bottlenecks.15
6.1.3 Description of the Audit Area
The Programme was first implemented in 1991, by the Ministry of Water and Environment
through the Directorate of Water Development. Funding for the programme is in form Conditional
grants from the Government of Uganda with support from Development partners.
The Rural Water and Sanitation programme is one of the services in the PEAP, under taken by
the Government of Uganda. It is aimed at reducing poverty levels and increasing the standard of
living of people living in rural areas. The target set by the PEAP was to provide sustainable safe
water supply and sanitation facilities to 65% of the rural population by the year 2005 with an
80%-90% effective use and functionality of facilities. This was expected to eventually rise to
100% of the rural population by the 2015.
At the districts level, the grant is primarily used for hard and software activities. Hardware
activities include, drilling and rehabilitation of deep boreholes, construction of shallow wells,
spring protection, piped water schemes, Gravity flow schemes and Valley tanks. On the other
hand Software activities include supervision and monitoring, training of water user committees
and hand pump mechanics, community mobilization, water quality analysis among others.
6.1.4 Statutory Mandate
The Directorate Water Development operates under the Ministry of Water and Environment; its
mandate is derived from the Constitution of Uganda 1995 (as amended), the Local Government
Act 2000 and the Water Act 1995. The mandate requires the MWE to manage and develop the
water resources of Uganda in an integrated and sustainable manner, in order to provide water of
adequate quantity and quality for all social and economic needs for the present and future
generations. 16
15 The Rural Water Supply and Sanitation operation Plan 16 The Local Government Act 1997 The water Act 1995
99

6.1.5 Activities
The main activities of the Directorate of Water Development are;
• Allocation of funds to various districts according to the work plans submitted, and in
consultation with local government finance commission.
• Capacity building in local governments through training of staff in various districts.17
• Providing technical support to the local governments through the Technical support units
established in various regions.
6.1.6 Financing
The Rural water supply and sanitation programme is financed under the Poverty Alleviation Fund
(PAF). The programme is a comprehensive strategy for poverty eradication through
implementation of water projects in the rural areas. Funding for this programme is in form of
conditional grants released to districts on quarterly basis by the MOFPED. In order to achieve
the objective of poverty alleviation Government has injected over 96 billion towards this activity
in the last 3 years.
District Water and Sanitation Conditional Grant
Financial Year Amount (shillings)
2004/2005 27,956,307,000
2005/2006 27,646,383,000
2006/2007 40,659,970,917
Total 96,262,660,917
Source: OAG analysis from MoFPED data on release of funds.
6.1.7 Audit scope
This Audit report focuses on provision of water and maintenance of water facilities, by the RWSS
programme under Directorate of Water Development in the Ministry of water and Environment.
The RWSS operation Plan –OP5 17 Ministerial Policy statement 2006/07
100
The period audited covered 1st July 2004 to 30th June 2007.
Ten (10) out of Eighty two (82) Districts in Uganda were sampled for the Audit. The districts
include; Arua and Nebbi in the West Nile region, Gulu and Lira in the Northern Region; Masaka
and Luwero in the central region; and Mbarara and Hoima in the western region.
6.1.8 Audit methodology:
The audit was conducted in accordance with International Organization of Supreme Audit
Institutions standards. Those standards require that performance audit should be planned,
conducted and reported on in a manner, which ensures that an audit of high quality is carried out
in an economic, efficient and effective way and in a timely manner.
The following were the data collection methods used. Interviews Document Review and
Physical Inspection.
6.2 FINDINGS OF THE AUDIT.
Since its inception in 1991, the Rural Water Supply and Sanitation Programme has made
significant achievements in providing rural communities with improved water sources. The
rural water coverage has increased from 20% in 1991 to 61% in 2005 and to 63% in 2007.
The Programme aims at attaining the national target of 100% rural water coverage by 2015.
However challenges still exist that need to be addressed. Below are some of the Challenges.
6.2.1 Disbursement of conditional grants.
The water and sanitation sector guidelines require the release of funds to the District for the
quarter to be made by the 5th day of the first month of the quarter. The District water Officers
are supposed to submit quarterly reports to the line Ministry by 30th of the month ending the
quarter.
We noted that release of the Conditional grants to the districts is not done by the 5th day of the
first month of the quarter, but it is done on average 6 weeks after that date.
101
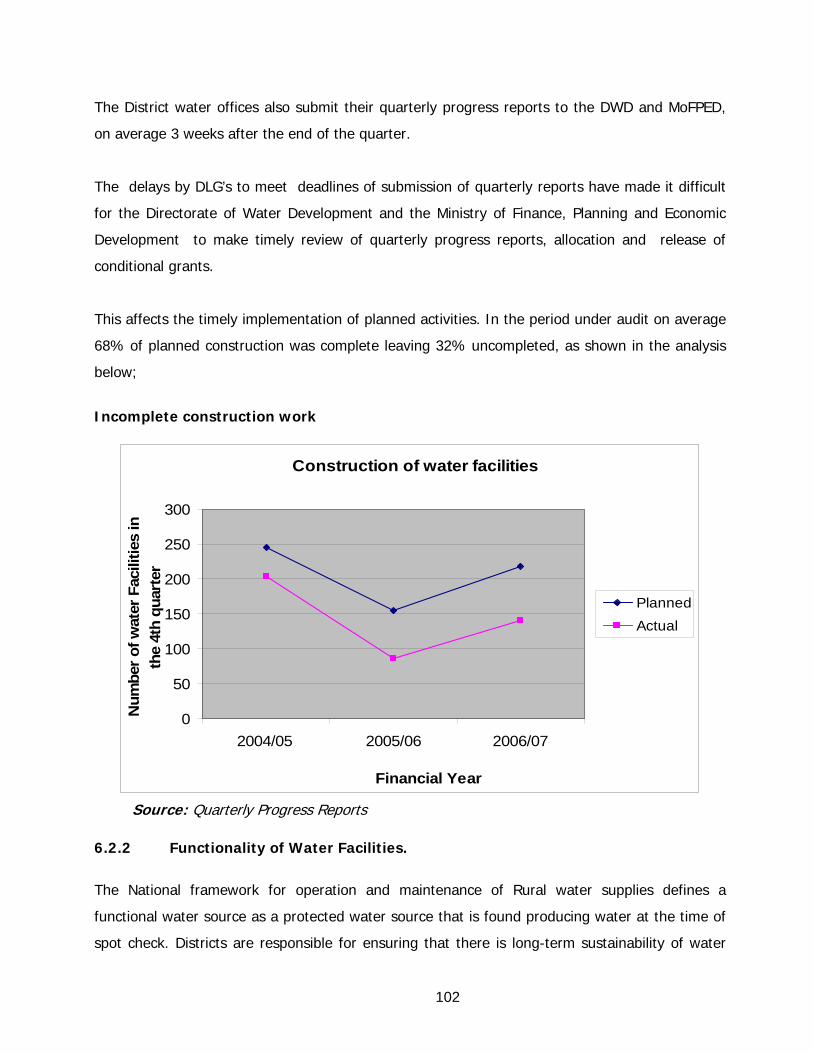
The District water offices also submit their quarterly progress reports to the DWD and MoFPED,
on average 3 weeks after the end of the quarter.
The delays by DLG’s to meet deadlines of submission of quarterly reports have made it difficult
for the Directorate of Water Development and the Ministry of Finance, Planning and Economic
Development to make timely review of quarterly progress reports, allocation and release of
conditional grants.
This affects the timely implementation of planned activities. In the period under audit on average
68% of planned construction was complete leaving 32% uncompleted, as shown in the analysis
below;
Incomplete construction work
Construction of water facilities
0
50
100
150
200
250
300
2004/05 2005/06 2006/07
Financial Year
Num
ber o
f wat
er F
acili
ties
in
the
4th
quar
ter
PlannedActual
Source: Quarterly Progress Reports
6.2.2 Functionality of Water Facilities.
The National framework for operation and maintenance of Rural water supplies defines a
functional water source as a protected water source that is found producing water at the time of
spot check. Districts are responsible for ensuring that there is long-term sustainability of water
102
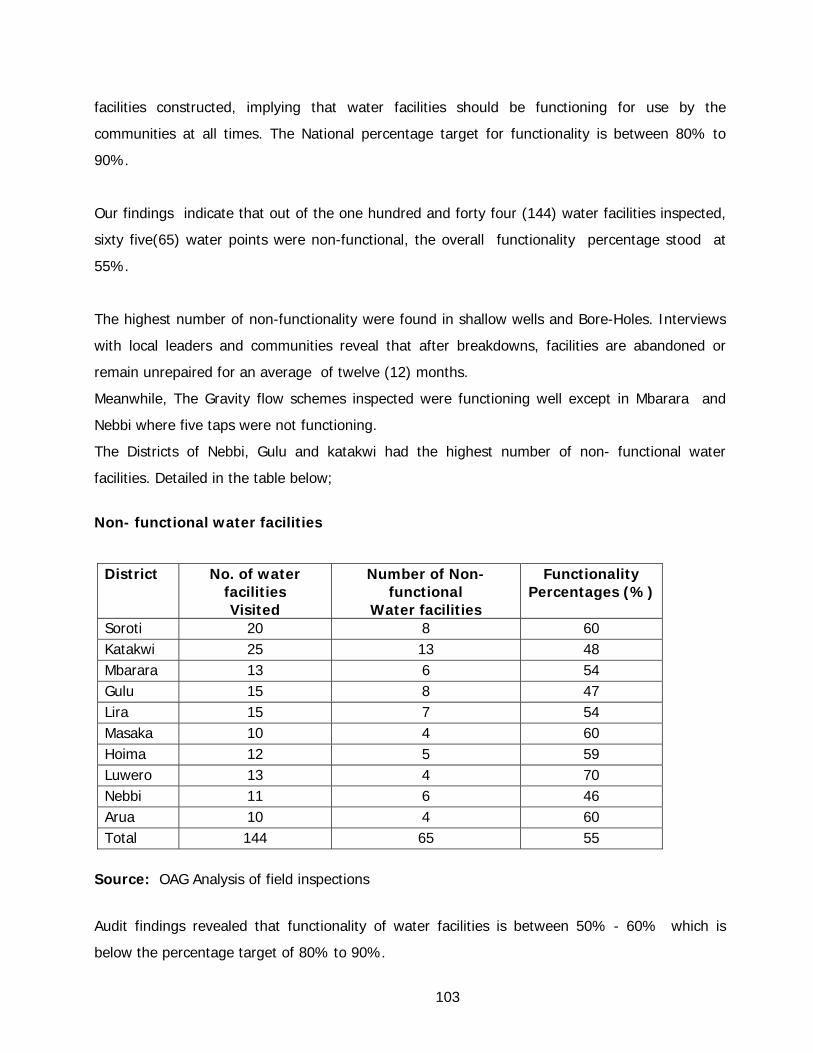
facilities constructed, implying that water facilities should be functioning for use by the
communities at all times. The National percentage target for functionality is between 80% to
90%.
Our findings indicate that out of the one hundred and forty four (144) water facilities inspected,
sixty five(65) water points were non-functional, the overall functionality percentage stood at
55%.
The highest number of non-functionality were found in shallow wells and Bore-Holes. Interviews
with local leaders and communities reveal that after breakdowns, facilities are abandoned or
remain unrepaired for an average of twelve (12) months.
Meanwhile, The Gravity flow schemes inspected were functioning well except in Mbarara and
Nebbi where five taps were not functioning.
The Districts of Nebbi, Gulu and katakwi had the highest number of non- functional water
facilities. Detailed in the table below;
Non- functional water facilities
District
No. of water facilities Visited
Number of Non- functional
Water facilities
Functionality Percentages (%)
Soroti 20 8 60 Katakwi 25 13 48 Mbarara 13 6 54 Gulu 15 8 47 Lira 15 7 54 Masaka 10 4 60 Hoima 12 5 59 Luwero 13 4 70 Nebbi 11 6 46 Arua 10 4 60 Total 144 65 55
Source: OAG Analysis of field inspections
Audit findings revealed that functionality of water facilities is between 50% - 60% which is
below the percentage target of 80% to 90%.
103

While the Water and Sanitation Performance Report 2007, indicates the following factors, as
affecting functionality of rural water sources;
Poor Siting and Quality of Construction
Lack of Policy to regulate Shallow well contractors
Technology choice not appropriate.
Loopholes in Community Based Maintenance System(CBMS) Policy.
Audit findings reveal that Out of the one hundred and forty four (144) water facilities inspected,
Sixty five(65) were non-functional, out of which 35% were non functional because communities
could not carry out minor repairs, 15% were due to lack of major repairs by District Authorities,
20% due to unavailability of spares while poor quality construction work constituted 30%. (See
graph below);
Factors affecting Functionality of Water Sources
Functionality of Water Facilities
35%
15%20%
30%
N.F due to minor repairs
N.F due to major repairsUn availability of pump Spares
Poor Quality Construction Work
Source: OAG Analysis of Field Inspections
104

6.2.2.1 Water User Committees.
According to the water statute 1995 Section 50 (1), - A set of individuals or Households forms a
water user group and collectively plans and manages a water point source in their area. A Water
User Group(WUC) comprising of nine members, is expected to collect revenue from persons
using the water supply system for the maintenance of the system and the tariffs to be collected
under this section are set with the approval of the director.
The water user group or committee formed is expected to meet once a month with members of
the community to discuss how to plan for new water sources, mobilize community cash
contributions, and report cases of water facility breakdowns to District Authorities.
Interviews conducted at the districts visited revealed that out of the 144 water points visited, 23
water facilities did not have WUCs. And yet at the time of completion and handover of the water
source to the communities, WUCs constituting of nine (9) members were supposed to be formed
and trained.
Findings also indicate that, out of one hundred and forty four(144) water sources visited,
thirteen (13) had all nine (9) members, while one hundred and eight(108) water facilities visited
did not have all nine (9) members constituting the water user committee, the water sources had
an average of only three(3) members, making it difficult for WUCs to manage water points.
Members of water user committees and caretakers for water sources expect payment for their
services from the district authorities, absence of the remuneration has hindered WUC members
from performing their duties.
Interviews carried out in the communities, indicates that out of one hundred and twenty
one(121) WUCs formed ninety five (95) committees do not hold meetings at all, twenty six(26)
committees hold meetings once in six(6) months on average to discuss matters regarding,
collection of cash contributions when a facility has broken down. However, minutes of the
meetings were not available in the districts visited. Lack of sense of ownership has hindered
water user communities from holding meetings.
105

Findings indicate that out of the one hundred and forty four (144) water sources visited, 80% of
the communities did not have evidence of making cash contributions. It was noted that,
community members are not committed towards making cash contribution.
Interviews carried out with members of the communities in the districts visited, shows that 75%
of the water users were not involved in planning for new water sources in their area, this has led
to lack of ownership of facilities by the communities.
Inadequate involvement of community members in planning for new water sources, lack of
adequate sensitization and follow up by district officials has led to inactive Water user
committees making it difficult for community members to report cases of facility breakdown in
case of major repairs or mobilize cash contributions towards minor repairs of water facilities.
Below is a photograph of an abandoned shallow well in one of districts visited.
An abandoned non functional shallow well in Amach sub county Lira district, inspected on 22.11.2007, 2:00 pm.
Source: OAG Field inspection
106

6.2.2.2 Supervision and Monitoring of Water Facilities.
According to the National framework for operation and maintenance of Rural water supplies, the
District water officer has a responsibility of ensuring, long-term sustainability of water facilities
constructed and to monitor their performance on operation and maintenance, taking remedial
actions to address shortcomings. Supervision is supposed to be on quarterly basis.
Interviews with water user communities and local leaders of areas visited, revealed that
supervision and monitoring carried out by the water department staff is not done on quarterly
basis.
This was confirmed by the supervision and monitoring reports in the ten (10) districts visited,
which indicated that four(4) out of ten(10) District water officers carry out supervision and
monitoring on average, twice a year(12) months, instead of once a quarter (3) months.
The failure to carry out quarterly supervision and monitoring is attributed to the staffing gaps in
District Water Departments.
Inadequate quarterly supervision and monitoring by district water officers has made it difficult for
the DLGs to get information on the status of water facilities to enable immediate corrective
action, including carrying out major repairs of broken down water facilities.
6.2.2.3 Availability of Hand Pump Spares
The Directorate of water development, initiated a supply chain system in 2004, designed to
enable private sector suppliers to be awarded contracts by government to supply hand pumps. In
turn these suppliers were to set up outlets through out the country, in order to avail pump spares
to rural communities at affordable prices.
Thirty seven (37) hand pumps spares outlets were opened in four regions in the country, by
private suppliers to avail hand pump spares to rural communities at subsidized prices.
At the time of audit, we noted that out of 37 out lets opened only four(4) outlets in the regions
remained operational, as shown in the table below;
107

Pump Spare Out Lets
Region
Supplier Out lets Opened up in 2004
Operational Out Lets
Eastern Uganda Victoria Pumps Ltd 13 3 Northern Uganda Victoria Pumps Ltd 13 0 Central Uganda Buyaya Technical Services Ltd 4 1
Western Uganda Multiple Industries Ltd 7 0 Total 37 4
Source: OAG Analysis of Field Inspection. Insurgency in northern Uganda, caused outlets that had opened in the districts to close. In the
central region challenges were faced in dealing with unreliable Agents and stiff competition from
bigger firms.
In Western Uganda the initiative was hampered by low demand resulting from construction of
GFS systems and protected springs.
Consequently, failure to provide subsidized pump spares in rural areas has led to many water
facilities being left un-repaired, since pump spares on the market are very expensive, and the
rural communities cannot afford to buy them.
6.2.3 Monitoring and Supervision of Work Under Construction.
According to the District Implementation Manual, the District water officer is responsible for
technical Supervision and to ensure the contractor complies with the provisions of the contract.
Technical supervision is done as per schedule of contract work. She/he should also review on a
monthly basis the contractors status report and carry out critical analysis of construction work.
Inspection of water facilities revealed that out of one hundred and forty (144) water facilities
visited 40% of water facilities visited were not adequately supervised during construction, Thirty
seven (37) water facilities had cracked platforms, eight (8) had pedestals that were not firmly
installed and Thirteen(13) water facilities had dried up after months of producing water.
108

Interviews with local leaders and communities, further revealed that during construction,
supervision by District water staff is not done per stage of work.
Audit findings also reveal that District water Officers did not have reports regarding technical
monitoring and supervision of water facilities under construction. Out of the ten (10) districts
visited, only two (2) districts had reports showing critical analysis of construction work under
progress.
Verification of the relevant documents revealed that reports by consultants hired to supervise
and monitor construction of deep boreholes were available. The districts also had final inspection
forms attached to the payment certificate of completion, which describe the water facility after
construction but not during construction.
The inadequate monitoring and Supervision of water facilities under construction is attributed to
the low staffing levels in the District water departments.
It was also noted that Technical support units established in various regions of the country,
carry out capacity building for staff in district water departments.
These units according to the Rural Water and Sanitation Operational Plan2002-2007,are
supposed to support DLGs fulfill their Water Supply and Sanitation mandate, through capacity
building of staff in the water departments and offer technical advice to the water officers where
necessary. The TSUs are expected to prepare monthly monitoring reports and submit them to
DWD.
However a sample of thirty(36) monthly monitoring reports prepared by the units, Indicates
that six(6) of the monitoring had issues pertaining to supervision of water facilities under
construction, implying that support by TSUs on technical monitoring of facilities under
construction is not effective.
The Water and sanitation sector guidelines, requires a fully fledged Water Department in a DLG,
comprising 1 DWO with a minimum degree, plus 3 years experience.1 Senior Engineer / Senior
water Officer,1 Hygiene education / sanitation officer,1 Assistant DWO mobilization 1 Technical
Officer (minimum Diploma in water engineering) in each county and1 Borehole maintenance
supervisor.
109
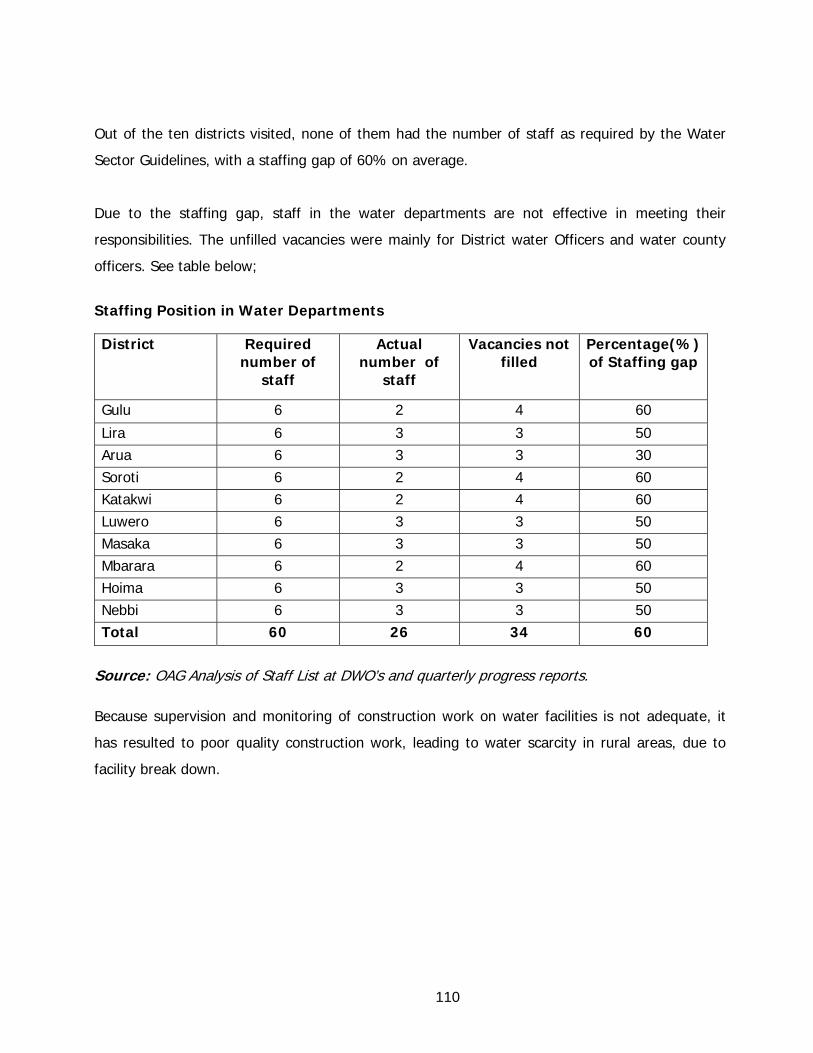
Out of the ten districts visited, none of them had the number of staff as required by the Water
Sector Guidelines, with a staffing gap of 60% on average.
Due to the staffing gap, staff in the water departments are not effective in meeting their
responsibilities. The unfilled vacancies were mainly for District water Officers and water county
officers. See table below;
Staffing Position in Water Departments
District Required number of
staff
Actual number of
staff
Vacancies not filled
Percentage(%) of Staffing gap
Gulu 6 2 4 60
Lira 6 3 3 50 Arua 6 3 3 30 Soroti 6 2 4 60 Katakwi 6 2 4 60 Luwero 6 3 3 50 Masaka 6 3 3 50 Mbarara 6 2 4 60 Hoima 6 3 3 50 Nebbi 6 3 3 50 Total 60 26 34 60
Source: OAG Analysis of Staff List at DWO’s and quarterly progress reports. Because supervision and monitoring of construction work on water facilities is not adequate, it
has resulted to poor quality construction work, leading to water scarcity in rural areas, due to
facility break down.
110
6.3 CONCLUSIONS
From the audit findings above, the following conclusions have been made to highlight observations made
from the audit.
6.3.1 Transfer of funds.
Late disbursement of funds, means that annual work plans can not be implemented on time,
while planned construction of water facilities are delayed, consequently limiting the facilities in
place and water coverage in those periods
6.3.2 Functionality of Water Facilities.
Non- functional water facilities, implies that a number of water facilities constructed are not being
used by the communities, resulting into inadequate water supply in rural arrears
6.3.3 Monitoring and Supervision
The inadequate monitoring and supervision of facilities under construction, implies non detection
of poor quality construction work of water facilities, consequently affecting the ability of a facility
to function for a long period of time. Hence, inadequate water supply in rural areas.
6.4 RECOMMENDATIONS
In light of the above findings and conclusions the following recommendations have been made,
to sustain and improve upon the achievements of the Rural Water Supply and Sanitation
Programme.
6.4.1 Monitoring and Supervision
It is recommended that the Directorate water Development strengthens monitoring and
supervision of the implementation of the RWSS Programme. TSUs should increase efforts in
carrying out support supervision and monitoring of DLG’s, by providing technical advice on
supervision of water facilities under construction.
111
The District should ensure that water office departments carry out frequent and effective
Supervision and monitoring of water facilities during and after construction.
DWOs should produce technical evaluation reports of work in progress. Both district and sub-
county officials should be involved in carrying out post construction monitoring. Standard forms
or checklists with third party confirmations from WUCs, LC 1 office, or sub county chiefs office
should also be developed and used during the supervision and monitoring.
6.4.2 Staffing
District local governments should ensure that vacancies in the water departments are all filled as
required by the water sector guidelines and staffing structures set by the District service
commissions. This is to ensure effective implementation of activities in the district water
departments.
6.4.3 Submission of Quarterly Reports
It is recommended that the Directorate of Water Development through districts institutes
measures to ensure that DWO’ s make timely submission of quarterly reports so as to speed up
the review of work plans and transfer of funds.
6.4.4 Water User Committees
The Directorate of water Development through district local governments should strengthen the
community based maintenance systems in place. Rural communities should be continuously
mobilized and sensitized on their responsibilities regarding O&M. frequent Follow up visits should
be made to the water user committees that have been formed.
There is need for involvement of community members in the planning and implementation of the
water project. DWD through the district local governments should emphasize the need for
communities to make an initial capital contribution towards construction of a facility. This would
in turn motivate the community to own the facility and makes it easy for them to contribute
towards its operation and maintenance.
6.4.5 Hand Pump Spares
The MWE/DWD should re-design the supply Chain System to address the weaknesses of phase
one of the supply chain. Reliable suppliers/agents should set up outlets through out the country
112

and in the relatively peaceful districts in the Northern regions of the country. District Local
Governments should also utilize the suppliers in providing spares for rehabilitation of existing
facilities so as to increase demand and keep the Agents in business.
113
7.0 UGANDA AIDS CONTROL PROJECT
(ISSUED OCTOBER 2007)
7.1 INTRODUCTION
7.1.1 Background to the Audit
Reducing the prevalence of HIV/AIDS is a high priority for the Government of Uganda as
defined in the National Strategic Framework (NSF) 2000/2001-2005/2006. The leading
agency in the fight against HIV/AIDS is the Multi country AIDS Project (MAP).
MAP was designed to support the operationalization of the NSF specifically meant to increase
the national response. It implements a set of interventions with funding from the World
Bank.
The Uganda AIDS Control Project is a Government project, which aims at meeting the goals
of the National Strategic Framework for HIV/AIDS. This study was undertaken to assess the
effectiveness of the Uganda AIDS Control Project (UACP) in achieving its goals of combating
the economic and social erosion by HIV/AIDS.
7.1.2 Motivation
HIV/AIDS is a major public health problem in Uganda. The most affected population is the
reproductive age group of 15 – 49 years. Since the 1990s, HIV/AIDS has slowly but
progressively attained alarming levels and the pandemic at one point registered an average
prevalence rate of 30%. Due to focused interventions the AIDS prevalence rate had reduced
to 6% by 2000. This was through a multi-sectoral and multi-disciplinary approach supported
by both civic and political commitment. However, since 2000 the AIDS prevalence stagnated
at 6% until 2004 when it rose to 7% as shown in the graph below:
114

National Prevalence of HIV in Uganda
0
5
10
15
20
1992 1994 1996 1998 2000 2002 2004 2006
Years
HIV
Pre
vale
nce
(%)
Series1
Source: MOH
Over the years, HIV/AIDS has eroded and continues to erode not only the human and social
economic development but also national productivity. Uganda experiences a 0.8% loss to GDP
annually due to death from AIDS. About one million (1,000,000) people are estimated to be
living with HIV/AIDS while eight hundred forty thousand (840,000) have died. The cumulative
number of orphans due to AIDS in Uganda is about two million (2,000,000). The UACP has
been at the centre of mitigating the effects of the pandemic. From July 2001 to September
2005, a total of US$ 48.6 million was spent on HIV/AIDS activities by the Uganda HIV/AIDS
Control Project. However, complaints have arisen from the public regarding poor dissemination
of information about HIV/AIDS, lack of condoms in most areas, poor facilities for VCT and
untrained health workers in VCT in many HCs.
It is alleged that the UACP campaign on prevention and behavioral change has not been
effective; many people have not accessed the IEC messages and the facilities for VCT and
PMTCT. This value for money audit was conducted to establish the reasons why and to
recommend appropriate measures on how improvements can be made.
115

7.1.3 Design of the audit
7.1.3.1 Scope
This audit was conducted on the activities of UAC with focus on UACP. The study focused on
the economy and efficiency with which the agencies utilized the funds that they received and
their impact on the timely achievement of reducing prevalence by 25%.
7.1.3.2 Time scope
The study covers the period from July 2001 when project activities commenced to June 2006.
7.1.3.3 Geographical scope
The study was carried out in (11) districts randomly selected from each of the four regions of
Uganda. Districts selected in each region are as follows;
Central Region East Region West Region North Region
Mukono Mbale Kabarole Lira
Masaka Soroti Hoima Arua
Kampala Mbarara Nakapiripirit
7.1.4 Audit Objective
The aim of the audit was to assess the economy, efficiency and the effectiveness of the
UACP's preventive and behavioral change campaign as well the impact it has had on the
reduction of AIDS prevalence. As a result of the audit, recommendations have been made
which may be considered to improve on the efficient and effective delivery of service in this
area.
7.1.5 Audit methods
This audit was carried out in accordance with the INTOSAI auditing standards and guidelines.
We are required by the standards to plan the audit and report on the economy and efficiency
with which resources are acquired and used, and the effectiveness with which objectives are
met.
116

The audit methods employed included interviewing various stakeholders, reviewing
documents at the project office and at the implementing agencies and physical inspection of
facilities at the districts to assess compliance with national guidelines.
7.1.6 Description of the audit objective
UACP supports the goals of NSF for HIV/AIDS and is the biggest government project in this
area. It is a multi-Disciplinary and Multi-Sectoral project.
UACP was a five year project which was commissioned in May 2001 and commenced
operations in July 2001.Guided by the multi sectoral and decentralization policies, UACP
sought to increase the response to the HIV/AIDS epidemic by supporting line ministries,
Faith based organizations (FBOs), Civil society Organizations (CSOs), District local
Governments and communities and implementing interventions relevant to their mandates
and in line with the objectives.
7.1.7 Statutory Mandate.
UAC was established by statute No. 2 of 1992, UACP on the other hand is a project under the
UAC.
An agreement was signed on 15th February 2001 between the Republic of Uganda and the
International Development Association (IDA) for SDR 37.3million equivalent to US $
47.5million to support HIV/AIDS related activities. UACP is the implementing agency of UAC
under this program. The project is part of the Multi country HIV/AIDS program for Africa
region.
7.1.8 Activities
To achieve the above goals the UACP carries out the following activities
• Institutional capacity building
• Community mobilization
• Appraisal and Approval of community proposals
• Training
• Program management, monitoring and evaluation
117

7.1.9 Financing
Total funding for the project for a five year term (July 2001 to June 2006) was US $50
million of which IDA financing was US $ 47.5 Million while GOU counterpart funding was US $
2.5 Million.
As at 30th Sept 2005, arising from an appreciation of SDR against US dollar a cumulative
exchange gain of US $ 4.5 Million was realized. The total expenditure on project activities as
at 30th September 2005 was $US 48.6M.
7.2 FINDINGS
This chapter presents the audit findings. The findings relate to;
Disbursement of funds, Access to IEC messages, Availability and adequacy of HCT and
PMTCT facilities, Compliance with HIV/AIDS national guidelines on facilities, and Sufficiency
of trained health workers in HIV/AIDS counseling.
7.2.1 Disbursement of funds
Replenishments to the special account (PMR basis) are expected to be made quarterly based
on project management reports that integrate project accounting, procurement, contract
management, disbursement and audit with physical progress of project implementation.
Replenishments are made under two different arrangements. Those made on the basis of
SOE method, are made for specific defined expenditure items and ceilings and are supported
by SOE forms as the only supporting documentation. On the other hand, replenishments
under the direct payments method are made against withdrawal applications which are
accompanied by relevant supporting documents such as copies of the contract, contractor’s
invoices and appropriate certifications.
Funds are disbursed by the project to the district for both the district initiative and the sub
projects which include the CSOs and CHAIs. The districts then disburse to the CSOs and
CHAIs as specified in each release.
118

7.2.1.1 Disbursements to the Special Account
It was noted that total disbursements to the special account during the period were expected
to be US $ 53,062,227.09 comprising of; Initial deposit, Replenishments, Special
Commitments and Direct payments. Out of this sum however, withdrawal applications
totaling to US$ 5,292,392.96 had not been credited to the special account by 30th June 2006.
Besides, there was an unspent balance on the account of US$ 3,276,062.78, implying that a
total sum of US$ 8,568,455.74 was not disbursed to the implementers during the project
period.
This was attributed to delay in disbursing funds to the project which eventually resulted into
extending the project term by six months.
7.2.1.2 Disbursement to districts
Release of funds by the project to recipient districts is normally done every quarter in the
first month of the quarter. However, it was noted that many times most disbursements to
the Districts for the District initiative delay by more than 9 months as shown in Table II
below.
District No. of
disbursements
Delay in disbursing of funds ( No. of disbursements
Delayed)
1-3 Mths 3-6 Mths 6-9 Mths 9-12 Mths More than 12
months
Lira 20 2 5 2 1 1
Hoima 12 3 1 2 2 2
Arua 18 4 3 2 1 2
Mbale 21 5 3 1 2 2
Soroti 15 2 1 1 1 1
Masaka 21 4 3 4 1 2
Mukono 19 2 1 1 3 2
Mbarara 13 2 1 2 1 0
Kabarole 12 3 1 2 1 1
Nakapiripirit 1 1 3 1 1
119

The delay is attributed to, among other reasons inadequate monitoring and supervision by the
project monitoring unit. The staffing of the project monitoring unit is thin comprising only one
internal auditor, who cannot regularly visit the districts and other implementing agencies to
ensure that they implement their activities and submit their accounts timely.
The district focal persons in charge of the project operations in the district are usually
transferred without the knowledge of the project coordination unit and transfers among the
accountants handling project funds in the districts are frequent. Some accountants are
transferred soon after training in handling project funds before the project benefits from the
training. These factors also contribute to delayed implementation of project activities in the
districts.
7.2.1.3 Disbursements to implementing CHAIs
Districts are expected to disburse funds to CHAIs in two equal annual instalments. The first
instalment is made in the first quarter of the year and the second instalment is expected to be
made in the third quarter but after submission of accountability for at least 30% of the first
instalment.
We noted that on average more than 50% of the approved CHAI work plans in the districts
were partly funded as a result of delays in disbursement of funds.
We established that the delays in disbursement of funds were caused by the delay in
submission of accountabilities by the implementing agencies. CHAIs lack qualified personnel to
compile and submit their accounts on time.
According to the DFPs, some CHAIs that were partly funded were unable to utilize the first
instalments within the first period of the year and as a result the second release could not be
made within that year. This could probably have been caused by inadequate supervision and
monitoring of CHAIs by the districts as well as by the project. In districts like Masaka and
Mukono, the number of CHAIs was very big which made supervision and monitoring all of
them very difficult.
120

Delayed disbursements have resulted in planned activities not being implemented on time.
Activities, especially those involving sensitization and behavioral change communication
targeting students were greatly affected by delayed disbursements. Example in Mukono
district, delayed disbursements affected schools sensitization programs. Funds were disbursed
after the school terms had closed and when the targeted students had left for holidays. This
meant that fresh programs had to be drawn up at an extra cost.
Delay in implementing project activities results into more administrative costs to the project.
The UACP was supposed to wind up its activities on 30th June, 2006, however the closure was
postponed to December 2006. As a result extra administrative costs were incurred for the
extra 6 months by the project.
The extra administrative expenses reduce funds available for budgeted activities which in the
end are not implemented.
The delay in implementing some activities affects the objectives of the project.
7.2.2 IEC materials
The national guidelines on HIV/AIDS prevention require all people between the ages of 15 to
59 to have access to information on prevention. To achieve this, the project is expected to
support key activities necessary to lead to an expected behavioral change, and these are:-
i) Development and dissemination of a multi-sectoral Behavior Change communication
strategy.
ii) Production, translation and distribution of HIV/AIDS information flip chart to districts/line
ministries/national, CSO/Secondary schools.
iii) Community AIDS education through CHAIs.
7.2.2.1 Posters
It was noted that in 80% of the districts, many HCs did not have posters with HIV/AIDS
prevention messages in strategic places. Out of the 12 districts visited, only the HCs in
Mukono and Mbarara districts had posters strategically placed for clients to see both in English
121

and the local languages. Of the HC IIIs and IVs inspected in the remaining districts, only Oli
HC III in Arua district had a poster in English which had been financed by the project. There
were no posters in the local language, Lugbara. 80% of the HCs did not have any posters.
Examples of posters in English and Luganda at one HC
Effective monitoring by the project implementation would have identified lack of posters in
strategic places and directed effort thereto. The project did not make sufficient provision to
ensure that posters are availed to all strategic places where people could read them and
access the messages.
7.2.2.2 Flip Charts
It was observed that although the districts have translated and produced materials such as flip
charts for communicating the IEC messages, 40% of the districts had not distributed these
materials to the users. In the districts visited, it was noted that over 60% of them did not
have trained community educators to pass the messages across to the people.
This is attributed to poor planning. For instance in Mukono district the reason for not
distributing flip charts was that distribution costs were not budgeted for, hence funds were not
available to finance distribution. As a result, the IEC messages do not reach the intended
audience and this has greatly affected the campaigns in the prevention of HIV/AIDS.
122

7.2.2.3 Drama shows
It was noted that drama shows are used mostly during VCT outreaches. These are organized
by the HCs especially at the health sub-district level. The CHAIs that carry out sensitization
through plays facilitate during such out reaches. It is therefore expected that districts would
provide these groups with IEC materials to assist them to focus the plays on BCC.
Statistics, however, show that in all the districts, the highest numbers for VCT were recorded
during the out reaches. People’s responses after the shows towards VCT were very positive.
7.2.3 HCT and PMTCT infrastructure
The national guidelines on HIV/AIDS require that all health facilities from HC III to National
Referral Hospitals have VCT/HCT and PMTCT facilities.
It was noted that out of the 104 HCs inspected, only 47% have HCT facilities. This is quite
low, meaning that the people who are sensitized and want to access the facilities to establish
their sero status cannot access them. The project has funded a few HCs with facilities such as
buildings for counseling and laboratories while the remaining HCs still provide these services in
the existing structures.
A building for HCT that was constructed through funding by UACP in Mukono District
123
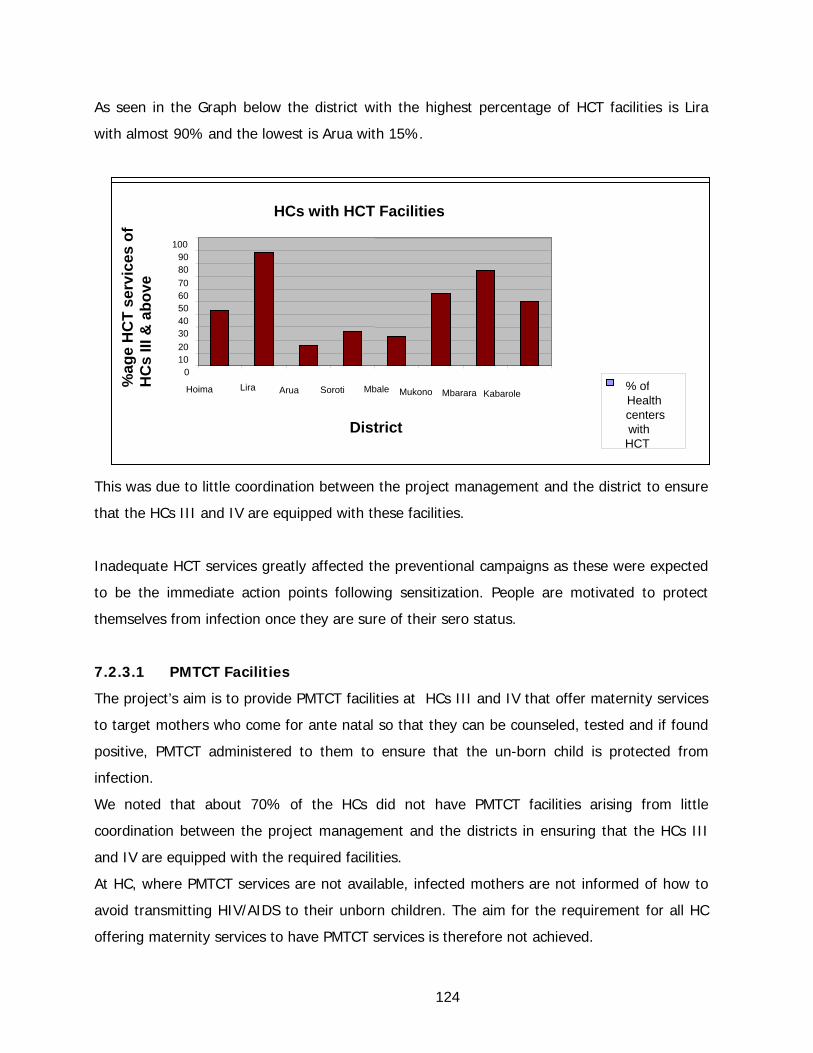
As seen in the Graph below the district with the highest percentage of HCT facilities is Lira
with almost 90% and the lowest is Arua with 15%.
HCs with HCT Facilities
0102030405060708090
100
Hoima Lira Arua Soroti Mbale Mukono Mbarara Kabarole
District
% of Healthcenterswith HCT
%ag
e H
CT
serv
ices
of
HC
s III
& a
bove
This was due to little coordination between the project management and the district to ensure
that the HCs III and IV are equipped with these facilities.
Inadequate HCT services greatly affected the preventional campaigns as these were expected
to be the immediate action points following sensitization. People are motivated to protect
themselves from infection once they are sure of their sero status.
7.2.3.1 PMTCT Facilities
The project’s aim is to provide PMTCT facilities at HCs III and IV that offer maternity services
to target mothers who come for ante natal so that they can be counseled, tested and if found
positive, PMTCT administered to them to ensure that the un-born child is protected from
infection.
We noted that about 70% of the HCs did not have PMTCT facilities arising from little
coordination between the project management and the districts in ensuring that the HCs III
and IV are equipped with the required facilities.
At HC, where PMTCT services are not available, infected mothers are not informed of how to
avoid transmitting HIV/AIDS to their unborn children. The aim for the requirement for all HC
offering maternity services to have PMTCT services is therefore not achieved.
124

7.2.3.2 Testing Kits
It was noted that some of the HCs that offer these services are plagued by frequent run-out of
testing kits. All the HCs visited had experienced an average of one month testing kits stock
out.
The anomaly is attributed to little coordination between the project management and the
district in ensuring that the HCs III and IV are equipped with the required facilities.
7.2.4 Training of health workers in HIV/AIDS
The National guidelines on HCT require all health workers to be trained in VCT and PMTCT.
HCT providers are expected to have training of at least 2 weeks of classroom instruction and 1
week of practical experience and must regularly update their knowledge. Non medical HCT
providers are expected to receive 24 hours of refresher training per year. All HCT providers are
required to complete 3 months of supervised practice with endorsement by a counselor
supervisor.
HCs that offer maternity services should be able to provide PMTCT services as well, hence
should have trained health workers in PMTCT.
7.2.4.1 Health Workers Trained in PMTCT
It was noted that on average only 21% of health workers in HCs III and above in the districts
are trained in PMTCT. This implies that 79% of the health workers cannot effectively carry out
counseling of mothers that attend PMTCT and assist to prevent the un-born child from being
infected by the mother.
As seen in graph III below, the percentage of health workers trained in PMTCT is highest in
Mbarara District which is still below 50% and lowest in Arua district which is slightly above
5%.
125
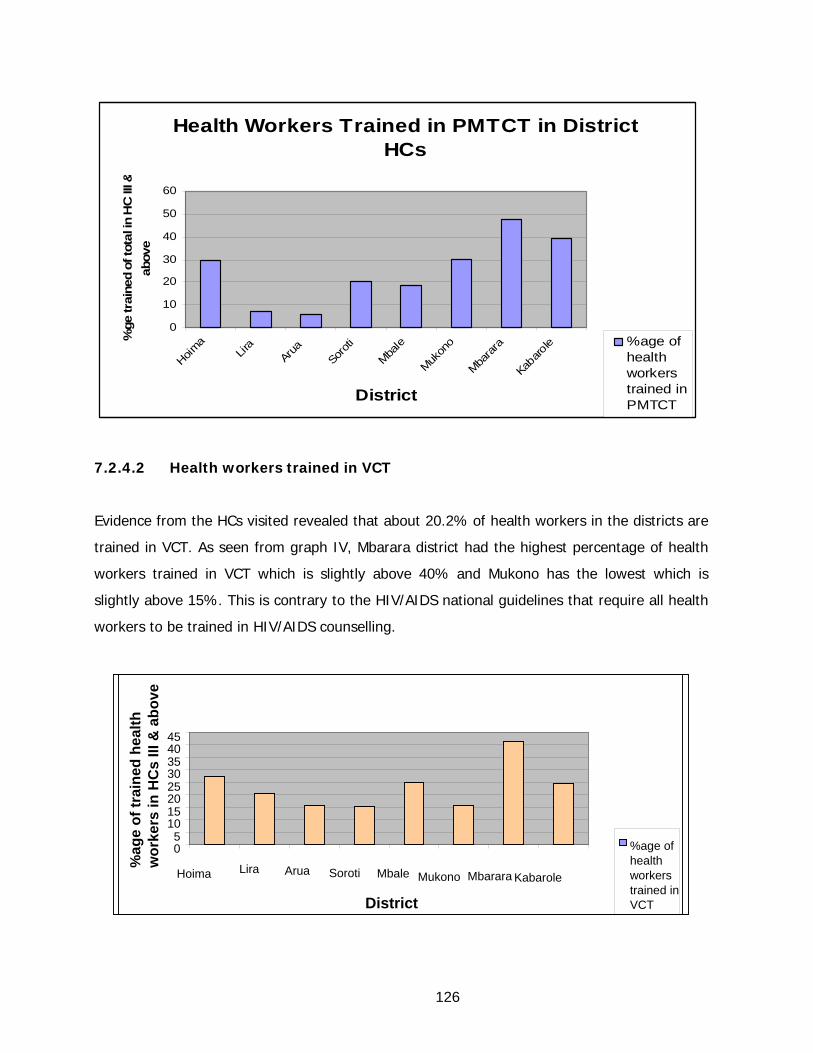
Health Workers Trained in PMTCT in District HCs
0
10
20
30
40
50
60
Hoima
Lira
Arua
Soroti
Mbale
Mukon
o
Mbara
ra
Kabaro
le
District
%ge
trai
ned
of to
tal i
n H
C II
I &ab
ove
%age ofhealthworkerstrained inPMTCT
7.2.4.2 Health workers trained in VCT
Evidence from the HCs visited revealed that about 20.2% of health workers in the districts are
trained in VCT. As seen from graph IV, Mbarara district had the highest percentage of health
workers trained in VCT which is slightly above 40% and Mukono has the lowest which is
slightly above 15%. This is contrary to the HIV/AIDS national guidelines that require all health
workers to be trained in HIV/AIDS counselling.
0 5
1015202530354045
Hoima Lira Arua Soroti Mbale Mukono Mbarara Kabarole
District
%age ofhealthworkerstrained inVCT
%ag
e of
trai
ned
heal
th
wor
kers
in H
Cs
III &
abo
ve
126

Poor planning and lack of monitoring has resulted in fewer health workers being trained in
HIV/AIDS counseling. For example, Shs13.2 Million was used to train 10 health workers from
Arua district in counseling and testing. The training was carried out in Gulu although TASO
which was providing the trainers had given the district the option of training 20 people at the
same cost in Arua which was a much cheaper option but the focal person opted for training
only 10 which was an expensive option. \
It was observed that in instances where training was centralized at the districts, very few
people were able to train contrary to training programmes which are organized by the health
sub districts. For example, in Mbarara district, the training of health workers in counselling and
testing is organized at the sub district level. This is to enable easy identification of training
needs and supervision at the HCs.
People avoid untrained health workers from testing them because they believe that they lack
the necessary skills to carry out proper counselling. Consequently, this weakness affects the
project’s objective of promoting safe sexual living.
7.2.4.3 Supervision of HCT Providers
It was noted that there was very minimal supervision of HCT providers contrary to what is
required by the National Guide-lines. Health workers who had been trained in VCT and PMTCT
but found themselves posted to HCs that did not have VCT and PMTCT services felt under
utilized and they expressed fear that the skills they had acquired could easily be lost for lack of
practice.
In addition there was no refresher training for the health workers providing HCT services.
According to the district health department, this is attributed to the small number of workers
that have been trained. As a result, instead of re-training those trained before, they train the
ones not yet trained at all. This, they explain is attributed to little funding for training.
7.2.5 Provision of HCT and PMTCT services
According to the national guidelines on HIV/AIDS Programs, all HCs, including the private
sector offering HIV counselling and Testing must conform to national standards for delivery of
services. At a minimum HCT service providers must have personnel, space for confidential
counseling and laboratory or materials for conducting HIV testing.
127

7.2.5.1 Personnel
It was noted that all the HCs providing HCT and PMTCT services had specific personnel
particularly in charge of offering these services.
7.2.5.2 Counselling rooms
i) It was established that out of the 104 HCs inspected, only 18 (17%) had counseling
rooms that complied with national guidelines as shown in the table below.
District No of HCs Inspected
HCs with HCT
% of HCs with HCT No of ideal counseling rooms
Hoima 7 3 42.8 0
Lira 9 8 88.8 1
Arua 26 4 15.3 1
Soroti 15 4 26.6 1
Mbale 9 2 22.2 1
Masaka 8 3 0 Mukono 16 9 56.2 7
Mbarara 8 6 75 6
Kabarole 6 3 50 1 TOTAL 104 42 18
In many HCs, the consultation rooms also serve as counseling rooms while in others, the
rooms lack privacy and therefore discourage potential clients.
This has been caused by failure by the implementers in the HIV/AIDS campaign to enforce the
standards of counseling rooms.
An example of HC with an appropriate waiting room in the HCT unit
128

ii) The HCs have also not been assisted in setting up counseling rooms that comply with
the national guidelines. Many HCs have never expanded their facilities to accommodate
the rising demand for handling HIV/AIDS related activities. Whereas many HCs were set
up to provide the traditional health services, they have not been expanded hence the
need to improvise space using the available facilities to accommodate both consultation
and counseling services.
The inappropriate rooms hinder service delivery and are bound to discourage people who
would be willing to take the HIV/AIDS tests.
A counseling session in an improvised space
7.2.5.3 Laboratories
It was noted that all HCs that provide HCT and PMTCT have laboratories for testing. However,
in a few cases the laboratory technicians were not always available at the HCS which forces
counselors to request clients who accept to return for testing afterwards, after accepting
testing following counseling sessions. In some of such cases, the clients never return.
Absence of laboratory technicians also results from frequent testing kits stock outs and a small
number of people who come for testing.
129

It was noted, however, that HCs that provide laboratory services for ART patients were
attracting more people even for the HCT services. This was particularly noted in St. Francis
Clinic in Mukono district, Mayanja Memorial Hospital in Mbarara district and Virika hospital in
Kabarole district.
7.2.6 Submission of Accounts Statements
The Project implementation manual requires that accounts Statement be submitted quarterly
within one month after the end of the quarter. The CHAIs are required to submit their
accounts for at least 50% of the first release before the last release can be processed.
7.2.6.1 It was established that the delay in submitting accountabilities by most of the
CHAIS ranges from a few days to many months in many districts surveyed.
7.2.6.2 There is high turnover of accountants in charge of the project in the districts.
Besides, sometimes the accounts staff are required to assist with other district accounts
duties. Some of the accountants do not know on how to compile the accountabilities.
There is little support supervision provided to the CHAI implementers at the district resulting
into them failing to submit their accountabilities in time.
7.2.6.3 Delay in submitting accountabilities results in delays in the disbursement of funds
to implementing agencies. Consequently planned activities are not implemented in time or not
implemented at all.
7.3 CONCLUSIONS
7.3.1 Funds Disbursement
The UACP has not provided sufficient guidance and monitoring during project implementation.
This is very crucial as the project involves stakeholders from different sectors of the economy.
Implementers especially at district and community levels have not been able to meet the
requirements of the project. This has mainly been caused by late disbursement of funds to
them.
130

7.3.2 IEC Materials
The project has been able to design a strategy for behavioural change and produced materials
to assist implementing the strategy. It has, however not been effectively utilized by the
different players in the communities because of poor distribution of the materials produced.
7.3.3 Training of Health workers
It is evident that very few health workers have so far been trained in VCT and PMTCT. The
project withdrew from PMTCT during the project period. The project has not liaised well with
the districts to ensure that the National guide lines on HIV/AIDS prevention are supported.
7.3.4 HCT and PMTCT Facilities
The project has been able to equip very few HCs with HCT facilities. Many HCs are struggling
to offer these services within the limited available space. Consequently the standards are not
met especially in the provision of space for confidential counselling and testing. The personnel
available are again responsible for the usual clinical duties sometimes leaving little time for
handling HCT services effectively.
7.4 RECOMMENDATIONS
7.4.1 Disbursement of Funds:
The project should speed up the process of disbursing funds to the implementers to avoid
delay.
7.4.2 IEC Materials:
The project should increase distribution of IEC materials to strategic places. This could save a
number of people from contracting HIV/AIDS especially the 30% who do not have access to
radios. The project should also train people who will communicate the messages in the IEC
materials (which were developed by the project) to the community.
131

7.4.3 HCT and PMTCT Infrastructure:
All HCs from HC III and HC IV should be provided with HIV/AIDS counseling and Testing
facilities such as counseling rooms and laboratory. The project coordination unit should ensure
that these health facilities have sufficient testing kits to ensure continuity of providing HCT
services.
7.4.4 Training of Health Workets in HIV/AIDS:
Proper planning for training of health workers should be carried out and the cheapest possible
training should be undertaken.
The project coordination unit should monitor and find out the number of health workers who
have not undergone training in HIV/AIDS counseling and PMTCT in the participating districts
and ensure that district plans incorporate filling the training gaps in the participating HCs and
hospitals.
7.4.5 Provision of HCT and PMTCT Services:
All HCs providing HIV/AIDS counseling and testing should be advised to provide counseling
rooms that allow confidentiality to raise people’s confidence while seeking VCT services.
7.4.6 Submission of Accounts Statements:
Project accounts staff should regularly monitor the operations of the district project accounts
staff and should write reports thereon. Project accountants in the districts should be equipped
with skills necessary to handle project work more efficiently. The project should discourage the
districts from transferring the district accounts staff in charge of the projects.
132

8.0 MANAGEMENT OF HEALTH PROGRAMMES IN THE
HEALTH SECTOR MINISTRY OF HEALTH – (ISSUED
DECEMBER 2006)
8.1 INTRODUCTION
I have reviewed the management of the health programmes with specific interest to child
health and maternal health programmes of MOH which are run by the department of
Community Health. The Department of Community Health is responsible for provision of health
services to keep the population healthy to enable it to effectively contribute to economic
development.
This report focuses on the delivery of health services within the child health and maternal
health programmes. Provision of services to the general well being of children is conducted in
a holistic approach under IMCI which handles the treatment of the major childhood disease
symptoms and signs such as fever, cough, difficult breathing, diarrhea and malnutrition. It
also handles the assessment of child immunization status and feeding practices of children
under 2 years. These diseases accounted for about 70% of all child illness in Uganda (MOH-
Annual Health Performance report 2001/2002).
The overall goal of IMCI is to reduce morbidity and mortality caused by common childhood
illnesses in children under five years of age.
Maternal health interventions on the other hand are run under the general provision of sexual
and reproductive health services such as Ante Natal Care, Family planning, Post Natal Care,
Post Abortion Care, Essential and Surgical Obstetric Care and life skills development. The
interventions are geared at reducing infant and under 5 mortality rates as well as maternal
and peri-natal mortality and morbidity.
The primary objective of this audit was to evaluate the economy, efficiency and effectiveness
of these programmes using the HSSP performance indicators of; ANC attendance, deliveries in
health units, number of users of family planning methods, immunization rates, OPD
utilization, GoU budget allocated to health sector, PHC funds released on time to the sector,
health expenditure per capita, PHC funds that are expended, districts submitting complete
HMIS monthly returns to the MOH in time, HCs without essential drug stocks, accessibility of
133

the population to health facilities, children under one year completing immunization doses,
proportion of approved posts filled by trained health workers, and malaria fatality rate among
children over the age of 5 years.
8.1.1 Background
Uganda has been implementing reforms in the health sector since the early 1990’s to reduce
mortality and morbidity. These reforms are operationalized through the Health Sector Strategic
Plans, focusing on reducing morbidity and mortality from major illnesses under the National
Health Policy (NHP). The NHP contains the Minimum Health Care Package (MHCP) to all
Ugandan households using the most cost effective interventions.
The burden of disease among maternal, newborn and children is high in Uganda and this is
constraining economic development because of the severe impact on the family and society in
general. Investment in child health is not only a priority for saving lives but is also critical to
advancing other goals related to human welfare, equity and poverty reduction. Almost 90% of
all deaths among children under 5 years are attributable to just 6 conditions (acute neonatal
conditions, mainly from pre-birth, birth asphyxia and infections, lower respiratory infections
mostly pneumonia, diarrhea, measles, malaria and HIV / AIDS). Most of these diseases are
preventable through existing interventions that are simple, affordable and effective. These
include oral rehydration therapy, antibiotics, anti-malarial drugs and insect treated nets,
vitamin A and other micronutrients, promotion of breast-feeding, immunization and skilled
care during pregnancy and childbirth.
There is therefore a need to take an integrated view to the reproductive, maternal, newborn
and child health as one process from pregnancy through childhood. This is an approach also
adopted by the GoU in the PEAP.
8.1.2 Financing
The provision of health services is funded by GoU and Development Partners. The majority of
the population in Uganda lives below the poverty line with 31.1% (2006), 38.8% (2003) and
44% (2000) of the population living in absolute poverty.
With a population of 27.7 million which is expected to double to 55 million by 2025 and a life
expectancy of 46 years (2003), the country faces a challenge of providing quality health
134
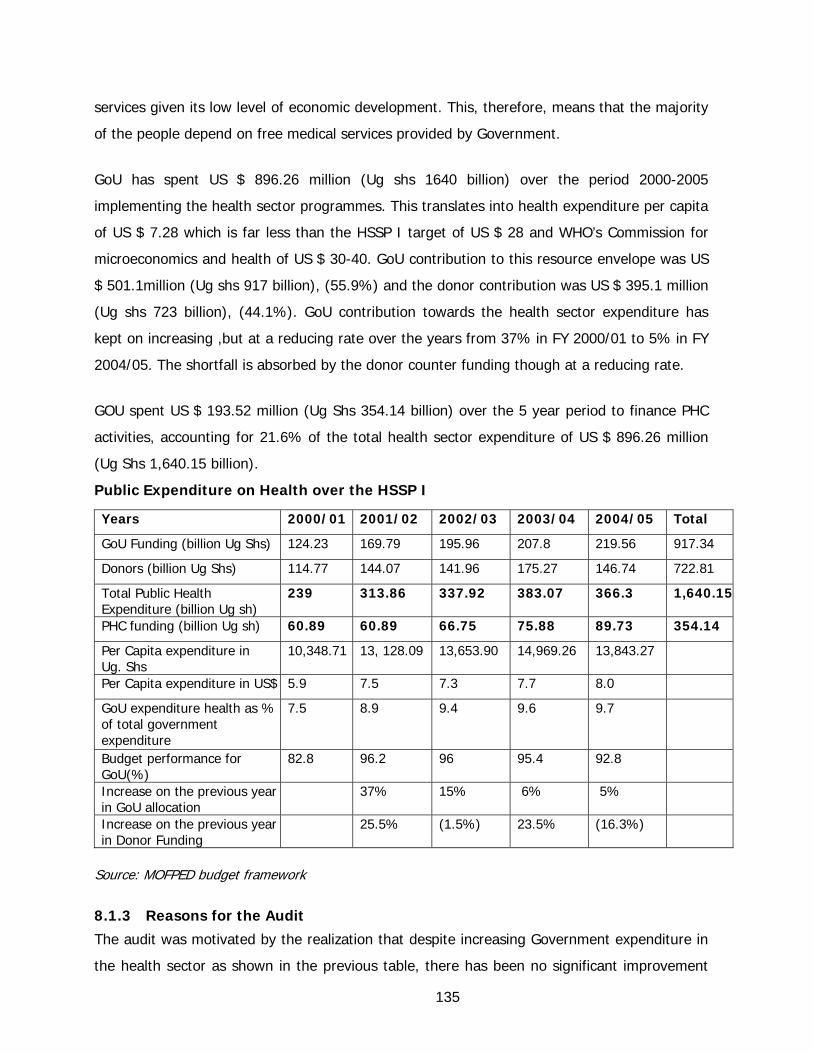
services given its low level of economic development. This, therefore, means that the majority
of the people depend on free medical services provided by Government.
GoU has spent US $ 896.26 million (Ug shs 1640 billion) over the period 2000-2005
implementing the health sector programmes. This translates into health expenditure per capita
of US $ 7.28 which is far less than the HSSP I target of US $ 28 and WHO’s Commission for
microeconomics and health of US $ 30-40. GoU contribution to this resource envelope was US
$ 501.1million (Ug shs 917 billion), (55.9%) and the donor contribution was US $ 395.1 million
(Ug shs 723 billion), (44.1%). GoU contribution towards the health sector expenditure has
kept on increasing ,but at a reducing rate over the years from 37% in FY 2000/01 to 5% in FY
2004/05. The shortfall is absorbed by the donor counter funding though at a reducing rate.
GOU spent US $ 193.52 million (Ug Shs 354.14 billion) over the 5 year period to finance PHC
activities, accounting for 21.6% of the total health sector expenditure of US $ 896.26 million
(Ug Shs 1,640.15 billion).
Public Expenditure on Health over the HSSP I
Years 2000/01 2001/02 2002/03 2003/04 2004/05 Total
GoU Funding (billion Ug Shs) 124.23 169.79 195.96 207.8 219.56 917.34
Donors (billion Ug Shs) 114.77 144.07 141.96 175.27 146.74 722.81
Total Public Health Expenditure (billion Ug sh)
239 313.86 337.92 383.07 366.3 1,640.15
PHC funding (billion Ug sh) 60.89 60.89 66.75 75.88 89.73 354.14
Per Capita expenditure in Ug. Shs
10,348.71 13, 128.09 13,653.90 14,969.26 13,843.27
Per Capita expenditure in US$ 5.9 7.5 7.3 7.7 8.0
GoU expenditure health as % of total government expenditure
7.5 8.9 9.4 9.6 9.7
Budget performance for GoU(%)
82.8 96.2 96 95.4 92.8
Increase on the previous year in GoU allocation
37% 15% 6% 5%
Increase on the previous year in Donor Funding
25.5% (1.5%) 23.5% (16.3%)
Source: MOFPED budget framework
8.1.3 Reasons for the Audit
The audit was motivated by the realization that despite increasing Government expenditure in
the health sector as shown in the previous table, there has been no significant improvement
135

particularly community health, “maternal and infant mortality rates” have instead remained
high as shown in the table below:
Years 2001 2002 2003 2004
IMR(ADB Report) 88/1000 86/1000 84/1000 83/1000
MMR
8.1.4 Audit Design
Scope
The study was conducted in 81 HCs in 14 out of 56 districts. The districts were drawn from all
the five major regions. Stratification of the country into regions and judgmental sampling were
the methods used in selecting the districts as shown in the table below.
Region Districts Reason for Selection
Central Kampala This is the district in which the city is located. It is very urbanized.
Mubende This also is not very far away from the audit office.
Eastern Katakwi/Amuria This has been affected by insurgency and has IDP camps
Busia This is a boarder district with cross-boarder population.
Soroti, This is a model district selected by MOH for promotion of maternal and child health.
Western Bushenyi This is highly populated district and shares same health conditions with neighboring districts out side the study.
Kamwenge This is one of the new districts and has poor health indicators and lacks medical infrastructure.
Kabarole This is highly populated district and shares same health conditions with neighboring districts out side the study.
Kisoro This is very highly populated and with a unique Landscape (mountainous).
Northern Gulu This is highly populated with IDPs
Lira This is one of the safe districts in the war zone.
Southern Kalangala This is an Island district with unique health conditions and temporary settlements.
Rakai This is a district that was highly affected by AIDS scourge.
Masaka This is one of the highly populated districts.
136
The audit covered five (5) financial years from 1st July 2000 to 30th June 2005. The data
collection methods used in carrying out this audit review included interviews with the various
stakeholders, review of financial and non-financial reports, observations and physical
inspection of the health facilities.
8.1.5 Description of the Audit Object
The health sector comprises government agencies, NGO’s, private and community health
providers and various Development Partners. The central authority is MOH, which formulates
policies for the sector and oversees the implementation of health programmes. MOH
comprises five technical departments namely; National Disease Control, Community Health,
Clinical Services, Planning and Quality Assurance. The Department of Community Health is
responsible for provision of health services to keep the population healthy so that it effectively
contributes to economic development. It comprises five divisions namely:-
• Child Health,
• Sexual and Reproductive health,
• Environmental Health,
• Veterinary Public Health and
• Vector born diseases.
This study focuses on maternal and Child Health.
8.2 FINDINGS
8.2.1 Progress
During the period under review, there was remarkable progress in some areas of the health
sector against set targets as follows:-
• Polio has been eradicated and Uganda was declared polio free in November 2006,
• DPT3 Immunization coverage increased from 48% (2001) to 89% (2005) against 85%
target,
• OPD utilization increased from 0.43 (2001) to 0.9 (2005) against 0.7 target and
137

• Dramatic decline in cases of guinea worm from 126,639 cases in 1992 to less than one
case in 2006.
8.2.2 Funding
8.2.2.1 Under Funding
It was noted that the overall health sector budget performance over the period of 5 years has
been at an average of 92.6% with the exception of Busia district which experienced a poor
budget performance of 60% in FY2004/05 because MOFPED did not remit funds on time in
the FY. This created a funds gap in the district budget thus affecting its ability to implement
health activities such as immunization, family planning and the purchase of drugs.
It was also noted that PHC activities in the districts mainly depend on funding by the central
Government with less or no contribution from the local governments as a result of the
abolition of graduated tax which was among the major sources of local government revenue.
Disbursements from only the central government are overwhelmed by the demand for the
delivery of health services.
8.2.2.2 Delayed Disbursement
MOFPED is required to release funds to districts on a quarterly basis without delay to match
the districts’ quarterly plans. It was generally noted that MOFPED delays to release funds at
the beginning of every FY. The delay is because MOFPED operates on Vote on Account before
the Appropriation Act is passed by Parliament in the first quarter. Therefore, the releases to
districts in the 1st and 2nd Quarters of each FY by MOFPED do not match expenditure
projections in the Quarters.
The poor budget performances in the 1st and 2nd Quarters are later compensated in the 3rd and
4th quarters.
For example during FY2003/04 only 59%and 82% of Quarter 1 and 2 funds were released
compared to 103% and 111% of Quarter 3 and 4 national wide.
It was observed in Busia and Kampala districts that there was a delay in disbursement of
development grants. It was observed in Kamwenge district, that capital development funds
released were insufficient leading to non-completion of structures. In the districts of Soroti and
138

Katakwi, it was established that funds take between 3 and 7 weeks before they are received
by the HSDs due to delayed processing of payments by districts accounts staff. Delays are also
caused by health units. For example, in Kabarole district some cheques were found lying in the
DDHS office uncollected due to delayed accountabilities from recipient health units.
Delayed disbursement of funds leads to funding deficits during the periods which result into
lower performance of the health sector interventions like immunization of children, PMTCT,
family planning, Emergency obstetric care, Child nutrition and procurement of logistics such as
drugs and medical sundries.
8.2.2.3 Budgeting
MOH has designed guidelines governing the budgeting process at each level of health
facilities. These guidelines require full participation of all HC levels from I to IV during
budgeting. Area teams have also been deployed to help districts in budgeting techniques.
Health sector programmes are activity driven and districts are expected to adhere to strict
budget discipline. However, under the Fiscal Decentralization System (FDS), districts are
allowed to make re-allocations within programmes up to a 10% limit for under or un funded
programmes.
Basing on the budget ceiling for the district, the DDHS in collaboration with the HSDs draw up
budget estimates for their respective districts. However, the lower HCs (HC III and HC II) do
not participate in the drawing up of these budgets and as a result some of the lower HC
activities like security, compound cleaning, building and equipment maintenance are not
adequately budgeted for, yet they are essential to delivery of quality health service.
8.2.2.4 Allocation of Funds
There is a systematic and logical formula drawn by MOH for use in allocating funds equitably
to both GoU and NGO health units. This formula uses the weighing index that takes into
consideration the burden of disease, epidemiological indicators, and intensity factor for
averting a loss of life, project funding and hospital coverage. MOFPED disburses funds to
districts basing on the advice of MOH.
Districts, however, use different methods of allocating funds to HCs. Each district has its own
method of funds allocation basing on the level of the HC, population served, terrain or any
139

other method. In Mubende district, the basis of allocations is only known to the DDHS. In Gulu
and Lira districts, funds are not released to the HCs but are centrally managed by the DDHS.
It was also noted that MOFPED disburses funds to districts and regional hospitals on advice of
MOH on the basis of bed capacity as one of the variables. However the actual bed capacities
of these hospitals far exceed the official number with some patients sleeping on floors. It was
further noted that the district and regional hospital budgets are capped to allow the growth of
budgets at lower HCs.
Failure by the Districts to use a systematic and logical formula when allocating funds to lower
HCs has led to insufficient funds allocated to these HCs for delivery of quality health services.
8.2.2.5 Funding to NGO HCs
GoU approved a policy of partnership with the private sector where by Government and
Development Partners agreed to provide funds to FB-PNFP health facilities. This is intended to
subsidize the user fees charged by NGO hospitals to enable a higher number of people to
access health services and thus improving on the preventive and promotive aspects of health
service delivery.
Under this arrangement, GoU disburses funds to NGO hospitals on a quarterly basis through
the districts. Disbursements are made after previous ones have been accounted for. It was
noted during the study that although central government significantly funds NGO hospitals/
health facilities, most of them do not offer free health services but instead levy user charges.
During FYs 2000/01 to 2004/05, central government spent US $ 40.47 million
(Ug Shs74.06 billion) on NGO hospitals and health units which represented 18.5% of the total
funds disbursed to districts with the exception of referral hospital as shown below:
YEAR 2000/01 2001/02 2002/03 2003/04 2004/05 TOTAL
NGO Funding in (billion
shs)
11.59 11.59 16.12 17.04 17.72 74.06
District hospitals +PHC
(billion shs)
69.76 69.76 75.39 86.32 99.97 401.2
% of NGO funds 16.6% 16.6% 21.4% 19.7% 17.7% 18.5%
Source: MOH- Annual Health Sector performance Reports
140

Some of these NGO health units are near government HCs and from interviews with some
hospital administrators and DDHS, it was noted that majority of the people prefer government
HCs since these provide free health services.
It was also noted that accountabilities from these NGO hospitals are not made in time and as
a result their subsequent funding is withheld. For example, in Kabarole district, cheques for
some of the NGO hospitals had not been dispatched because previous accountability had not
been forwarded. In some districts like Mubende district, funds are released to NGO health
units without checking the correctness of accountabilities for the previous releases.
NGO hospitals have continued to charge high user fees despite the government subsidy
forcing communities to go to government facilities. As a result, the number of patients
accessing health services from NGO hospital has remained low due to incapacity of the poor to
pay user fees.
8.2.2.6 Diversion of Funds
GoU Treasury Accounting Instructions and the PFAA require the utilization of public funds in a
manner that is authorized by Parliament.
It was noted that Kasilo HSDs in Soroti district was allocated US $ 41,967 (Ug shs 76.8 million)
for the purchase of drugs in two FYs (2004/05 and 2005/06) but only US $ 22,623 (Ug shs
41.4 million) was paid for drugs leaving an un-utilized balance of US $ 19,344 (Ug shs 35.4
million). Further investigations revealed that only US $ 5,738 (Ug shs 10.5 million) of the un-
utilized balance was still on the account of the HSD. The balance of US $ 13,607 (Ug shs 24.9
million) could not be explained by management.
In a related development Tirir HSD also in Soroti district diverted US $ 2,186 (Ug shs 4 million)
meant for drug procurement to financing administrative expenses contrary to drug
expenditure guidelines issued by MOH.
141

Non adherence to the Treasury Accounting Instructions and PFAA led to the diversion of funds
earmarked for the procurement of drugs and medical sundries for health sector interventions
like immunization of children, PMTCT, family planning, EMOC and Child nutrition.
8.2.2.7 Accumulation of Funds at the HSD Accounts
It is a good budgetary practice to ensure that programme activities are carried out in the
stipulated period. This calls for the utilization of funds released according to the budget
allocations.
It was noted, however, that districts and HSDs do not undertake programme activities in
accordance with the budgets and leave large unutilized balances on their bank accounts.
Delayed transfer of funds from the districts towards the end of the FY to HCs, under staffing in
accounts and other delays while processing payments led to accumulation of account
balances.
This problem was very acute in FY2000/01 where US $ 1.75 million (Ug shs 3.2 billion)
remained unspent on district accounts only to be spent in the following year (Annual Health
sector performance report, 2001/02).
Failure by the districts to utilize funds in implementation of health programmes may lead to
inadequate drugs being procured hence affecting the delivery of health services.
8.2.3 Accountability and Bookkeeping methods
It is a good accounting practice for entities in the same sector to have a uniform accounting
and book keeping system to enable comparison and reporting on activities for decision making
purposes. It is also a requirement under PFAA for every officer to account for public funds
entrusted to him and the accountability shall be subjected to independent verification.
It was noted, however, that two different methods of book keeping are used by different
districts which impacts negatively on the accountability process. These are centralized and
decentralized bookkeeping. In a centralized bookkeeping system, funds are received and spent
at the district and accountability made by the district. In the decentralized system on the other
hand, funds are received by the district and disbursed to the HSDs which either transmit the
142

funds to the lower HCs or spend at the HSD on their behalf. Where HSDs spend on behalf of
the lower HCs, accountability will be found at the HSD and where the funds are transmitted to
the lower HCs, accountability will be made by the respective HC and submitted to the HSD.
Districts which were centrally maintaining HCs books of accounts had their accountabilities
verified by the district internal audit departments regularly whereas accountabilities for those
using a decentralized system of book keeping were not subjected to independent verification
on a regular basis.
As a result, accounting records in the decentralized system were not up to date because the
health workers charged with this responsibility lacked accounting skills.
Due to lack of a standard system of accountability and book keeping in all districts, different
districts have employed different methods and this may lead to poor accountability and
misappropriation of funds which could in turn have a negative effect on health service
delivery.
8.2.4 Equipment
Effective health care delivery requires a network of functional health facilities that are
adequately equipped. Health facilities work as an interface between the health system and the
community. The MOH national medical equipment policy provides guidelines on standard
equipment expected for each HC II to IV, district and regional referral hospitals. MOH directly
specifies the type of equipment to be distributed to specific HCs.
Most of the equipment used in the HCs is procured directly from the suppliers by MOH while
others are donated by projects and NGOs depending on their work plans. The equipment is
delivered to the districts for further distribution to earmarked HCs. There are circumstances
when general equipment is procured by MOH for districts. On receipt of equipment, the DDHS
allocates them to HCs according to the HC assessed needs. In addition, MOH has set up
regional workshops to service and repair HC equipment to which districts and referral hospitals
contribute funds to meet operational costs. Specialized and/or sophisticated equipment are
maintained through supplier maintenance contracts.
143

8.2.4.1 Recording/tracking of HC equipment
An asset register is designed to provide information about the assets in respect of location,
condition, quantity, cost and date of purchase.
It was observed that in some HCs asset registers/inventory records are either non-existent or
are poorly maintained. Out of 81HCs visited, only 52 (64.2%) had asset registers/inventory
records. It was also noted that HCs that maintained asset registers are mostly the higher level
centers like the district and regional hospitals. Given the average population of 27,632 HCs,
9,892 HCs on a national level may be lacking assets/inventory records.
Lack of assets/inventory registers was due to limited management skills exhibited mainly by
lower level administrators who in most cases were pre-occupied with actual delivery of health
services.
The absence of asset/inventory registers can easily lead to difficulty in identification of
equipment gaps thus leading to inadequate planning for the procurement of equipment
required in the delivery of quality health services.
8.2.4.2 Maintenance of HC equipment
MOH set up regional maintenance workshops to ensure that health facilities are equipped with
well maintained equipment.
It was observed that the condition of equipment at HCs was not satisfactory and maintenance
is not regularly done. Equipment like refrigerators, solar systems, microscopes, CD4 count
machine and vehicles were found to have broken down. In some districts, the equipment take
over a year without servicing and maintenance. In Gulu hospital, it was observed that
equipment like sterilizers/boilers, theatre equipment, power generator, beds, trolleys and
stretchers are very old and constantly break down.
The reasons for the above are failure by management at HCs to identify and report mechanical
problems in time and limited technical skills of personnel at the mechanical workshops. For
example, a CD4 count machine at Fort portal regional referral hospital was not working and
the staff at the mechanical workshop had failed to repair it due to the limited technical skills.
144

It was also discovered that the budget provisions of HSDs in Mubende district do not provide
for vehicle maintenance and as a result management is unable to obtain resources to meet
these unbudgeted expenses.
Failure by management to maintain equipment leads to constant break down which disrupts
health service delivery. For example, treatment of HIV-AIDS patients has become difficult in
hospitals where CD4 count machines have broken down. HCs with broken down solar systems
are unable to preserve immunization vaccines and this affects their out reach activities. Broken
down ambulance vehicles affect the delivery of EMOC services in HCs.
8.2.4.3 Utilization of HC equipment
In order to deliver sufficient health services, MOH constructed theaters at each HC IV and
district hospital.
Out of 33 theaters visited, only 28 were found operational. 5 theaters were fully equipped but
due to the absence of medical personnel were not operating. Some laboratories were also
equipped but not operating due to lack of medical personnel.
Each HSD is given an ambulance vehicle – a double cabin pick-up to handle emergency cases
in the HSDs. It was observed that these vehicles are ordinary pick-ups which are not designed
as ambulances. As a result management is using them for other duties such as staff transport
and administrative work like collecting drugs from suppliers.
It was noted in Bukuku HC IV in Kabarole district that the solar battery charging system in the
theatre was used to charge private mobile phones.
145

Theatre battery charging system used to charge private phones, Bukuku HC IV, Kabarole district.
Insufficient utilization of equipment has led to inadequate service delivery. Non functional
laboratories lead to treatment of diseases without first examining samples from patients. Some
theaters are not offering EMOC services to mothers with difficulties in delivery, exposing them
and their babies to high risk of maternal and infant mortality.
THEATER EQUIPMENT AT KIGANDA HC IV NOT INSTALLED, MUBENDE DISTRICT
146

8.2.4.4 Inadequate and/or missing HC equipment
As already mentioned above, MOH is responsible for equipping HC II to IV, district and
regional referral hospitals with necessary equipment to enable delivery of health services.
It was generally noted that all the 81 (100%) health facilities visited, lacked equipment of one
type or another. The magnitude of shortage of equipment is more acute in lower HCs
compared to district and regional hospitals. On the basis of this finding, it is reasonable to
conclude that all the 27,632 health facilities in the country lack equipment of one type or
another.
Most of the HCs lack laboratory equipment, delivery kits, testing kits, Oxygen cylinders BP
machines, drip stands, scanners, examination screens, weighing scales, communication
equipments, beds and mattresses. It was also noted that due to poor or lack of
communication equipment like radio calls, HC IIIs are not able to communicate with HC IVs
and HC IVs can not communicate with district and regional hospitals. It was further noted that
due to lack of scan and ultra sound equipment in HC IVs around Kampala district, Mulago
national referral hospital was overwhelmed with patients lining up for these services.
Lack of equipment is, apart from limited funding, attributed to the following:
• Weaknesses in identifying equipment gaps at HCs to enable proper planning and
budgeting by MOH,
• Weaknesses in maintenance of equipment that leads to constant equipment break down
and
• Overwhelming number of patients that has exerted enormous pressure on a few
equipment leading to break down
8.2.4.5 Laboratory equipment
It was noted that most of the health units lack laboratories and laboratory equipment leading
to treatment to be done symptomically. For example, between the years 2002 and 2005, out
of a yearly average of 9 million malaria cases treated, 7.5million (83%) were not tested in
laboratories as per table below:
147

Malaria Treatment (2002-2005)
Year
Malaria tests done
Malaria positive slides
Malaria cases Diagonised
Malaria cases treated, but not tested
% of treated Malaria not tested
2002 1,097,562 555,990 8,008,481 6,910,919 86%
2003 1,566,474 801,784 9,276,944 7,710,470 83%
2004 1,859,780 879,032 10,681,645 8,821,865 83%
2005 1,583,795 842,594 8,188,525 6,604,730 81%
Average 1,526,903 769,850 9,038,899 7,511,996 83%
Source: MOH- Health Management Information System (HMIS)
8.2.4.6 Delivery and EMOC equipment
There has been a remarkable improvement in the number of babies delivered from health
facilities as shown by percentage deliveries of 25% (2002) and 50% (2005).
It was, however, noted that fewer deliveries take place in health facilities which may be due to
lack of equipment, among other reasons, despite the good ANC attendance. Table below
refers.
Annual Deliveries
Year 2002 2003 2004 2005 Average
NO.of deliveries in HCs 214,083 262,633 303,799 354,856 283,843
Total deliveries* 854,853 835,672 1,012,038 755,533 864,524
% deliveries in HCs 25% 31.4% 40.2% 50% 33%
ANC attendance 1,021,530 1,136,652 1,190,148 857,630 1,051,490
Source MOH- Health Management Information System (HMIS)
*Total deliveries approximated to 1st year measles immunization
Lack of equipment among other factors has hampered the provision of EMOC services that
play an important role in the mitigation of the Maternal Mortality rate which is currently
standing at 506/100,000 live births, this is below the targeted 354/100,000 (2005). For
148

example, a study carried out by MOH during FY2002/03 revealed that 4% of HC III was
offering BEMOC services, 6% of HC IV while 65% of district and regional hospitals were
offering CEMOC services.
There was a slight improvement in FY2003/04 as 9.5% of HC IVs offered BEMOC and 70% of
district and regional hospitals offered CEMOC service.
8.2.5 Drugs
Drugs are an important component of a health system. Availability of drugs is one of the major
indicators of quality health delivery. MOH in collaboration with the National Drug Authority,
National Medical Stores and Professional Councils provide overall co-ordination and guidance
on procurement of pharmaceuticals, other medical supplies, logistics and instructions on their
rational use.
We noted that under the decentralization system, actual procurement of drugs in the districts
is done using either the credit line method or direct purchases by the districts and HSDs.
Under the credit line, a Memorandum of Understanding is signed between GoU and NMS.
Funds are allocated to each HC’s account with the NMS by the MOH and drugs delivered to the
district by NMS on the basis of drug requisition orders from HCs. There is a standard delivery
schedule issued by NMS every year showing the order and delivery date deadlines.
Under the direct purchases method, at least 50% of PHC funds released by central
government must be used to purchase drugs. These drugs must be purchased from NMS as a
first priority and it is only upon issuance of a certificate of non availability by NMS that the
district may purchase from any other supplier.
The method of distribution of the drugs purchased is determined by the method of book
keeping used by the districts as explained above. In a centralized system of book keeping,
drugs are distributed by the districts to HSDs which later distribute them to HCs under their
jurisdiction. In a decentralized system of book keeping, drugs are distributed by the HSDs. The
method of drug distribution will also depend on the method of drug procurement. Credit line
drugs are distributed by NMS to the districts and then collected by the HSDs for later
distribution to HCs. Drugs directly purchased under the 50% PHC funds are distributed by the
149

authority responsible for the purchase. If drugs are purchased by HSD, then they will be
distributed by HSD and those purchased by the district, are distributed by the district.
Under the new ‘Pull system’ of drug procurement, NMS has a logical accounting system that
links all credit lines of health facilities. Orders are supposed to be made within specified
ordering schedules and deliveries expected within a period of 2 months from the ordering
date.
8.2.5.1 Procurement Procedure
The PFAA requires officers to comply with established procedures/regulations when utilizing
public funds.
It was noted that under the credit line method, HCs do not have knowledge of how much has
been credited on their accounts with NMS. Although MOH informs the districts of how much
funds have been budgeted under the credit line in a given FY, districts are not notified of how
much credit each HC has been allocated and actual debit by NMS in a given period.
It was again noted that although NMS operates a computerized invoicing and accounts
system, drug accounts statements of individual HCs were not regularly given to them, but HCs
only receive them on request.
Furthermore, it was noted that NMS does not deliver drugs to HSDs, but to the districts and
HSDs take long to collect the drugs from the district stores causing delays. In order to reduce
delays on the delivery time by NMS, it was noted that Kampala and Bushenyi districts have
resorted to purchasing drugs from other suppliers without waiting to attain certificates of non
availability from NMS.
Lack of transparency in the procurement process may lead to misappropriation of funds and
drugs. Furthermore failure by NMS to deliver drugs to HCs causes drug shortages at these
centers. For example, a number of HCs were found lacking children syrups and family planning
supplies.
8.2.5.2 Record Keeping
The PPDA Act requires proper recording of stores procured.
150

It was noted that 19 HCs (23.5%) out of 81 HCs visited did not have proper drug records. It
was also noted that stock cards and dispensing records are either not kept or are not updated,
reconciliations between stock records and physical stock verifications are not carried out. On a
national level, the above finding deduces that 6,482 HCs do not have proper drug records.
The reasons for not keeping proper stores records include lack of skills and time by health
workers to regularly post stores transactions.
When store records are not maintained, it is possible for drug leakages to go un-noticed, it
could also lead to delay in the identification of drug stock outs and expired drugs. The
resultant effect would be drug shortages that would disrupt health service delivery.
8.2.5.3 Drug Stock Levels; Stock-outs:
Out of 81 HCs visited, 31 (38.3%) lacked essential drugs and sundries required by the medical
personnel of the HCs in carrying out their duties; extrapolated to the HC population, this
indicates that 10,583 HCs national wide lack essential drugs.
For example at Olwal HC II, Pabbo HC II, Awer HC II in Gulu district, the drug store was
virtually empty; and as at the time of the visit in July 2006, Olwal HC II had last received
drugs in Jan/Feb 06; Mutukula HC III in Rakai district had not been supplied drugs in the last
three months and Kalongo HC III in Mubende district had last received drugs six months ago.
The causes of drug shortages is attributed to limited funds, delayed deliveries, overwhelming
number of patients, delivery of drugs by NMS which are not ordered for by HCs, bureaucratic
procurement procedures and poor stock management skills.
In Kamwenge HC III, Kamwenge district, the officer in charge was forced to discharge
patients who were admitted while still in poor condition due to lack of drugs.
Further analysis of data from the HMIS also indicated drug stock outs in a number of HCs. On
average out of 27,632 reporting HCs, 1,189 lack the first line drugs for family planning and
treatment of malaria.
151

YEAR
Chloroquine tabs
Cotrimoxazole tabs ORS sachets Measles
vaccine Fansidar Depo-Provera
Average No. of HCs lacking drugs
No. of HCs in Districts
2002 436 569 483 302 447 492
455 24,934
2003 1,085 1,986 1,933 486 1,271 1,848
1,435 29,455
2004 1,410 2,501 1,965 576 1,110 2,004
1,594 32,398
2005 1,649 2,469 1,401 348 564 1,199
1,272 23,740
Average 1,145 1,881 1,446 428 848 1,386
1,189
27,632
Source MOH- Health Management Information System (HMIS)
It was also noted that the persistent shortage of reproductive health supplies may lead to the
poor performance of RH interventions. The cause of the poor performance is limited budget
allocations given to these interventions by districts, HSDs and HCs.
This is further confirmed by the low levels of family planning users and the contraceptive
prevalence rate that has stagnated at 23%.
Family planning Users (calendar years)
YEAR New users % increase/decreasein New users
Revisits % increase/decrease
in Revisits 2002 534,113 528,283
2003 522,969 -2% 496,392 -6%
2004 639,809 22% 617,362 24%
2005 358,424 -44% 349,403 -43%
Average 513,829 -8% 497,860 -8%
Source MOH- Health Management Information System (HMIS)
Drug stock outs have led to poor delivery of health services as patients are asked to purchase
their own drugs from private clinics at exorbitant prices and those who can not afford to buy
drugs go home untreated. This has also increased the number of referrals to HSDs, district
hospitals and regional hospitals.
152

8.2.5.4 Expired Drugs
MOH has a system of identifying, collecting and disposing expired drugs in line with the NDA
guidelines.
Expired drugs were noted in 17 Health Units as shown in the table below.
District HC II HC III HC IV District Hospital
Regional Hospital
Gulu Olwal, Pabbo
- - - Gulu
Lira - Apala - Lira Soroti - Diana
Memorial, Gweri
Tirir, Apapai
- -
Katakwi Akoboi, Bisiina
Toroma, Ngariam
- - -
Bushenyi - Bushenyi - - - Kabarole - - - - Fort-Portal Mubende - Kalongo - Mubende - Total 4 7 2 2 2
Source MOH- Health Management Information System (HMIS)
Poor stock management was also noted at the National Medical Stores, who are the major
medical suppliers of health units where 42,555 packs of ARVs valued at an approximate of Ug.
Shs 936 million (US $468,000) expired. It was noted that one of the causes of drugs expiring
was poor stock management resulting in procurement of large quantities of slow moving drugs
like vaccines.
NDA guidelines have not been followed and some expired drugs were still in stores at HCs at
the time of the study.
It was further noted that MOH replaced HOMAPAK as a drug for treatment of malaria with
COARTEM and as a result some HCs were found with large stocks of HOMAPAK which will
expire if not put to use.
Expired drugs do not add value to the delivery of health services and can be misused by
unscrupulous persons causing undesirable health conditions to the public.
153

HOMAPAK: Malaria Drug, Bot Distributed at KCC Stores
8.2.5.4 Drug Stock Storage Facilities
MOH and NDA guidelines require proper storage of drugs in health facilities in order to protect
them from harmful climatic and physical conditions.
It was observed during inspection of HC stores, that 7 HCs out of 81 visited lacked or had
improper drug and sundries stores implying that about 2,388 HCs on a national level lack
proper drug storage facilities. Some of these stores are not well arranged, dusty, not well
ventilated, are very small and lacked shelves. Some HCs do not have stores and instead
improvised a section in the dispensing or examination room as a store. It was also noted that
the drugs are kept in boxes or piled on top of each other instead of shelves which make
dispensing cumbersome. In some cases, expired drugs were not separated from unexpired
drugs.
HCs have no proper storage facilities thus making drugs vulnerable to destruction and theft.
154

8.2.6 IEC Materials
IEC materials are designed and developed to increase awareness in the prevention and control
of diseases, increase public participation and involvement in the delivery of health care and
increase demand and utilization of health services. IEC materials are used for dissemination of
preventive and curative information. Methods used to disseminate information include posters,
leaflets, mass media including press, radio, TV, video and drama shows.
It was noted that MOH develops and designs IEC materials while districts translate the
developed IEC materials into local languages of the communities in the district.
IEC materials are procured by MOH and distributed to districts or collected by participants
during national workshops. The district health educators are then charged with physical
distribution of these materials to HCs.
We noted that the practice of translating IEC materials is to change to involve districts in the
development of the IEC materials. In Soroti district, it was noted that some of the posters
translated into Ateso in Apapai HSD had spelling mistakes. It was observed that Busia districts
has a multi-lingual society, but the IEC materials displayed were not translated in all the local
languages in the district. In the districts of Rakai, Kalangala ,Bushenyi, Fortportal, Kamwenge,
most of the IEC materials were in English and not in the local languages.
Posters are commonly used IEC materials; however, leaflets were noted in Masaka and
Bushenyi districts. It was also observed that video tapes and TV monitors are used in Soroti
and Katakwi districts.
Most of the IEC materials are displayed at the HCs premises; in some cases, posters and
leaflets were still lying in stores. On enquiry, we were told that they are not displayed in other
public places for fear of destruction and/or removal by some community members.
155

IEC Materials just being kept in Office at Ntara HC IV, Kamwenge District
Designing and development of IEC materials at the MOH headquarters does not bring out the
intended message properly for the target groups since words and symbols may have different
meaning in different local languages. This creates low coverage IEC materials leading to less
awareness and participation of the communities in preventing and controlling diseases. For
example immunization and family planning campaigns may fail due the failure by IEC materials
to disseminate information to the right people in the right places.
8.2.7 HC Buildings
HC buildings are expected to be constructed following standard specifications developed by
the health infrastructure development and management department of MOH. These
specifications determine how laboratories, theaters, maternity wards and other medical and
non medical buildings should be constructed.
Most of the construction of HC facilities is funded by the central government using PHC
development and LGDP funds. In some districts, constructions are also done by Development
Partners through projects and NGOs. Previously, local governments used to help in the
construction of some health facilities but have since stopped citing financial constraint
following the abolition of graduated tax which was their major source of local funds.
According to the last inventory count taken in FY 2003/04 out of 2,734 heath facilities in the
country, GoU owned 1,855 (68%) facilities, an increase of 7.8% over the previous year.
156

Maternity Ward at Kyabugimbi HC IV Constructed Using LGDP funds, Bushenyi
District.
8.2.7.1 Non-operational completed structures
The objective of constructing medical and non medical buildings at HCs is to facilitate the
delivery of health services to the community.
It was noted, however, that 9 HCs had well completed structures that were not being utilized.
The reason given for non utilization of structures was lack of medical personnel and
equipment.
This has affected the implementation of national health programmes. For example operations
can not be carried out on mothers with birth complications at Kibito, Bukuku, Atiak, Busia and
Ogur HC IVs. New born babies and mothers share the general wards with other patients thus
putting them at risk since they can be infected with diseases.
8.2.7.2 Incomplete Structures
Construction is expected to be carried out as per annual plans of entities and completed within
specified time frame.
157
It was observed during the study that 16 HCs out of 81 visited had incomplete structures.
These structures included maternity wards, doctors’ houses, staff houses, theaters, OPDs. This
translates to 5,458 HCs in the country that may be having incomplete structures.
We were informed that this is due to limited funding, shoddy work by contractors and also the
fact that districts continue to requisition for funds to construct new facilities without first
completing existing ones.
Scrutiny of MOH Annual Sector performance reports attributed the problem of incomplete
structures to:
• Inadequate funding because unspent budgeted funds are returned at the end of the FY
to MOFPED and are not recouped,
• Slow and bureaucratic process of tendering construction works at districts and
• Inadequate monitoring and supervision of construction works.
Incomplete structures are not useful to government in its effort to improve on the provision of
health services. New born babies and their mothers lack maternity wards, districts have failed
to attract qualified medical personnel due to lack of accommodation among other reasons and
many minor medical cases have continued to be referred to district and regional referral
hospitals.
8.2.7.3 Unsatisfactory Constructions
As stated above, construction of medical and non medical buildings is expected to be done in
accordance with the standard specifications set by MOH under its department of health
infrastructure development and management. These specifications are communicated to all
districts which supervise these constructions.
It was observed that some of the constructions at the HCs though complete have been poorly
constructed and the following defects were noted:
• Sagging ceiling,
• Big cracks in the walls and
• Incomplete ceilings in the theatre allowing free entry of vermin like bats.
Unsatisfactory works can be attributed to inadequate supervision by both the districts and the
MOH supervisory units, poor selection of contractors by the districts and laxity of managers at
the HCs to report poor works to higher authorities.
158

Buildings that have been poorly constructed have not been put to use pending additional
works thus leading to wasteful expenditure. Some of these buildings that have been put to use
are a security risk to patients and medical staff.
8.2.7.4 Maintenance and security of HC buildings
Buildings should be maintained regularly if they are to be effectively used through out their
expected useful life. It is also important to keep these facilities secure from any damage, theft
or misuse.
A number of building structures in some of the HCs need to be renovated. Most of the walls
require painting; floors are cracked, sewerage systems broken and rooms infested with vermin
including bats and rats.
The security of especially lower HCs is compromised as most health centers have no fences
around them and security guards. Some of the stores and laboratory rooms are not burglar
proofed compromising the security of equipment and drugs.
Buildings have not been maintained due to insufficient budget allocations to carry out
renovations, fencing and recruitment of guards at the HCs.
A Placenta Pit Cracking and Water Logged at Bukuku HC IV, Kabarole District
The placenta pit was built at a site with a low water table causing it to be water logged
159

A review of the results of the last survey on the medical buildings carried in FY 2003/04 and
summarized in the table below indicated that 32.3% and 31.6% of HC III and HC IV
respectively require renovation.
National Building Status as at FY 2003/04
HC III Buildings A B C D N Total OPD 266 75 66 1 12 420 Maternity 210 43 37 0 130 420 General Ward 101 30 23 0 266 420 Total 577 148 126 1 408 1260 HC IV Buildings . A B C D N Total OPD 65 18 19 1 0 103 Maternity 59 19 17 0 8 103 General Ward 49 18 14 0 21 102 OP Theatre 87 6 3 0 7 103 Mortuary 17 7 6 0 73 103 Total 277 68 59 1 109 514 KEY: A Good condition only needed routine maintenance C Major renovations B Minor renovations D Recommended for demolition N Buildings not available Source: MOH- Annual Health Sector Performance Report 2003/04
8.2.8 Staffing
8.2.8.1 Staff Training
In-service training plays an essential part in the development of the Human Resource for
Health (HRH). A trained and skilled health sector work force contributes to achieving the
National Health Policy through the implementation of HSSP. It is important that training is
systematically planned and implemented with less disruption of health service delivery.
It was noted that most training programmes organized by MOH are adhoc i.e when there are
disease outbreaks or national campaigns.
In some districts staff identify their own training needs and solicit for funding privately while in
other districts like Rakai, the staff have had training on an annual basis in different fields of
specialization. In Kalangala and Gulu districts, there was no evidence of training in the last 5
years.
160

Staff training has mainly been on job training, workshops and seminars and a few staff going
for long courses in the field of medicine.
Health workers commonly train in PMTCT, VCT and immunization courses because these
interventions are adequately funded by donors.
It was noted that districts do not properly provide for staff training in their annual budgets by
making regular reviews of the manpower requirements to identify training gaps. Training by
the MOH is also not properly organized; It is in most cases adhoc and skewed to particular
programmes.
Lack of systematic training programmes has resulted in most staff remaining untrained in
required medical disciplines and duplication of training efforts which results in wastage of
resources. Some health interventions like administration of ARVs, Family planning
programmes, child nutrition campaigns have not been implemented in some HCs due to lack
of required skills by medical workers.
8.2.8.2 Job Rotation and Transfers
It is a good human resource management practice to transfer and rotate staff regularly in
order to improve their performance levels. This is a key requirement in the human resource
management policy.
It was noted that districts do not have a policy on transfer and rotation of staff. The current
practice is that staff are transferred or rotated when a need is identified in a particular HC and
not on a routine basis. Thus, health workers in hard to reach areas are not rotated as was
noted in Kabarole district.
According to the national medical staff survey carried out in FY2003/04 the staffing levels in
the districts countrywide varied from 40% to 265%. This means that some districts attract
more health workers than others.
Unclear resource management policies in districts have affected the development of guidelines
on staff rotation and transfer. This has in turn led to concentration of staff in urbanized areas
161

of districts causing staffing gaps in rural HCs. The delivery of health services in the rural areas
is affected more by insufficient staff numbers among other reasons.
8.2.8.3 Staff Appraisal and Supervision
Public service guidelines require confirmed public servants to be individually appraised once a
year while those on probation are to be appraised half yearly.
A sample of appraisal forms seen in personnel files for medical staff in the districts of Soroti,
Katakwi and Masaka were up to date but those of Gulu, Lira, Busia, Bushenyi, Kamwenge,
Kabarole, Kalangala and Mubende districts were not. In some districts, medical staff were last
appraised in 2002.
Some supervisors complained that a lot of information is requested in the appraisal forms yet
it is not linked to staff performance and that recommendations on some staff are not
implemented.
The delay in the regular appraisal of staff was attributed to the fact that staff do not submit
their forms in time and that they only do so for promotional interviews.
When staff are not regularly appraised their performance levels can not be ascertained and
this may cause staff to relax and fail to meet their targets. The level of staff commitment will
determine the level of health service delivery. For example, the efficient and effective
extension of out reach services on immunization, family planning, counseling and public health
education requires a motivated staff force.
162

Patients Waiting for Medical Workers at Rukunyu HC IV, Kamwenge District
The audit team reached Rukunyu HC IV at 10.00 am and there were no medical workers present
8.2.8.4 Staffing Gaps
The availability of qualified health workers and other service providers is very crucial for the
attainment of better service delivery to the people. The number of staff to be recruited at each
level of HC is determined by the staffing requirements in the HSSP and district ceilings.
Because of the decentralization policy, recruitment, appraisal and deployment of health
workers for HCs and district hospitals are carried out by the respective DSC, with the staff
ceiling given by MOH. The DSC therefore advertises, shortlists, interviews and selects the
suitable medical staff. Recruitment of health workers in Regional and National referral
hospitals is done by the HSC.
All 81(100%) HCs and hospitals visited had manpower shortages. The number of staff
deployed at the HCs and hospitals is not per recommended staffing guidelines and HSSP
norms issued by the MOH stated above. This would also indicate that there is a staffing
problem in all the 27,632 health facilities in the country.
It was noted that in some HCs, mothers deliver without the help of midwives, laboratories do
not function due to lack of lab technicians, nursing assistants dispense drugs, records
163
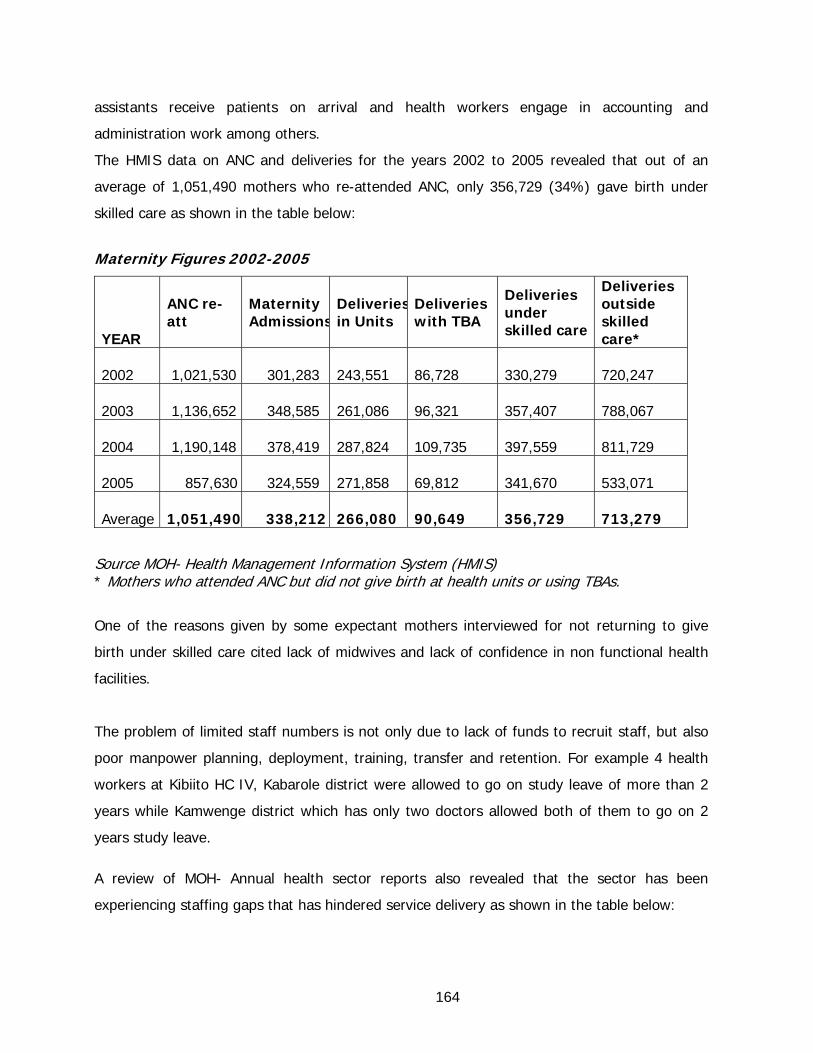
assistants receive patients on arrival and health workers engage in accounting and
administration work among others.
The HMIS data on ANC and deliveries for the years 2002 to 2005 revealed that out of an
average of 1,051,490 mothers who re-attended ANC, only 356,729 (34%) gave birth under
skilled care as shown in the table below:
Maternity Figures 2002-2005
YEAR
ANC re-att
Maternity Admissions
Deliveriesin Units
Deliveries with TBA
Deliveries under skilled care
Deliveries outside skilled care*
2002 1,021,530 301,283 243,551
86,728 330,279
720,247
2003 1,136,652 348,585 261,086
96,321 357,407
788,067
2004 1,190,148 378,419 287,824
109,735 397,559
811,729
2005 857,630 324,559 271,858
69,812 341,670
533,071
Average 1,051,490 338,212
266,080
90,649 356,729
713,279
Source MOH- Health Management Information System (HMIS) * Mothers who attended ANC but did not give birth at health units or using TBAs.
One of the reasons given by some expectant mothers interviewed for not returning to give
birth under skilled care cited lack of midwives and lack of confidence in non functional health
facilities.
The problem of limited staff numbers is not only due to lack of funds to recruit staff, but also
poor manpower planning, deployment, training, transfer and retention. For example 4 health
workers at Kibiito HC IV, Kabarole district were allowed to go on study leave of more than 2
years while Kamwenge district which has only two doctors allowed both of them to go on 2
years study leave.
A review of MOH- Annual health sector reports also revealed that the sector has been
experiencing staffing gaps that has hindered service delivery as shown in the table below:
164

Minimum staffing norms MOH
YEARS 2001/2002 2002/03 2003/04 2004/05* NORM 3,712 9,919 13,232 3,860 ACTUAL 2,867 8,371 11,389 2,453 GAP 845 1,548 1,843 1,407 % of filled posts 77.2% 84.4% 86% 63.5%
Source: MOH- Annual Health Sector performance Reports. * Figures only include MOH headquarters and Regional referral Hospitals
8.2.9 Monitoring and Evaluation
8.2.9.1 Monitoring and Supervision:
MOH is expected to carry out monitoring visits in all districts on a quarterly basis in accordance
with the national supervision guidelines. It sets up monitoring area teams to visit all the
districts. An area of focus is set for these teams and because it is understaffed, it at times
seeks assistance from the medical staff at regional hospitals and co-opts medical interns to be
part of the teams. The districts also deploy health teams to carry out monitoring of the HSDs
and lower HCs every month.
Under the referral system, hospitals are expected to carry out support supervision and
mentoring visits. National referral hospitals visit Regional referral hospitals which in turn visit
General hospitals (District hospitals). District hospitals also visit HC IVs. This arrangement
helps to fill the medical skills gaps at the lower levels and allows sharing of experience among
the medical staff.
It was noted that monitoring and supervisory visits that are undertaken are much less
compared to those required by the guidelines. The few visits that are carried out lacked a wide
coverage in terms of HCs visited.
It was also noted that the monitoring reports are not always forwarded to the districts but
instead the findings and recommendations are discussed generally at Joint Review Mission
workshops. Implementation of the recommendations is normally done if it is within the budget
and if funds are available.
The findings and recommendations of the district monitoring teams on HCs are also discussed
at district forum in general terms.
165

It was also established that districts which receive funding from UPHOLD project have a
support supervision mechanism under the theme “Yellow Star” i.e quality assurance in which
Pre-designed forms with standard variables are used to conduct the supervision. Findings are
immediately communicated to the HC.
For example in Kalangala district, Kyamuswa and Bujjamba HSDs were visited twice in the last
5 years by MOH.
Monitoring and supervision system does not only depend on sufficient funding, but also on
effective planning at different political and administrative levels. Also, insufficient staff
numbers has overwhelmed the few staff with other health interventions.
Inadequate monitoring and supervision affects the quality health of service delivery. Staff tend
to relax if they know that their performance is not constantly monitored and it might be
difficult for health sector management to identify areas of weakness for improvement.
8.2.9.2 Performance Evaluation System
MOH has developed a good computerized monitoring and evaluation system- HMIS. This
system captures all the variables needed in assessing the performance of the health sector at
all levels of implementation and they include:- OPD attendance, maternity attendance, family
planning usage, child health care, financial data, support supervision data, drug stock outs.
These variables are used in setting performance indicators for measuring the extent to which
the set health goals and objectives are met.
It is a requirement under the HMIS for all levels of HCs, HSDs and districts to complete HMIS
forms every month and submit them to the MOH headquarters. The HMIS is designed to
produce monthly and annual reports at every HC level and private hospitals. These reports are
consolidated at the district level and forwarded to MOH which consolidates district reports to
form national reports. It is from the national report that the national annual performance
report is made.
It was noted that the system is not being fully implemented by all the HCs visited. For
example the average number of HCs using the system for the last five years was 24,095 out of
a total of 27,632. This represented an average of 89% compliance as per table below:
166

Number of HCs reporting
YEAR HCs in Districts Units reporting % Units reporting
2002 24,934 20,622 86% 2003 29,455 25,898 89% 2004 32,398 28,589 90% 2005 23,740 21,271 91%
Average 27,632
24,095
89%
Source MOH- Health Management Information System (HMIS)
It was further noted that some of the HCs using the system leave out some important
information and some of the reports are not submitted in time. Information on number of
visits by support supervision teams, planned and actual out reaches, funds budgeted, released
and spent and drug shortages was found missing from a sample of the HMIS forms seen.
Most of the HMIS assistants interviewed stated that they lacked sufficient skills to use the
system while others complained of inadequate stationery.
It was also noted that enforcement of compliance at lower HCs is weak.
Some districts manually run the system, making it difficult to enter and summarize data while
others with computers lacked competent personnel.
Incomplete and delayed reports do not help management address health challenges in time
and this negatively impacts on the quality of health service delivered.
For example, health campaigns on immunization, family planning, child nutrition, VCT and
PMTCT could be emphasized in areas that show poor performance indicators. This would help
in efficient utilization of the much limited resources.
Status of HMIS Reports Submitted by Districts
Characteristic 2001/2002 2002/2003 2003/2004 2004/05 Average
Completeness 95% 86% 85% 85% 87.75%
Timeliness 77% 70% 90% 90% 81.75%
Source: MOH- Annual Health Sector performance Reports.
167

8.2.10 Accessibility
8.2.10.1 Basis of Location and Coverage of HCS
This is carried out by districts on the basis of guidelines provided by MOH as follows:- HC II
per parish, HC III per sub-county, HC IV per constituency, general hospital for every 500,000
people and a regional referral hospital for every 2,000,000 people. MOH also provide that
ideally, a HC should be within a radius of 5km of the community it is serving.
After decentralization, the responsibility of allocation of HCs was passed to districts. It was
noted that some HCs were not distributed in accordance with the guidelines set by MOH. As a
result some HC are located near each other, near established hospitals including NGO
hospitals or far away from the large communities as shown in the table below:
District Health Facility Remarks
Busia 2 HC IV 2 HC IV in one constituency contrary to
MOH guidelines.
Kabarole Bukuku HC IV, Karambi HC III
And Nyabuswa HC II
All the 3 facilities located near Fort-Portal
Regional hospital.
Mubende Buwekula HC IV Located in the district hospital.
Kalongo HC III Located near Kiganda HC IV
Soroti Diana Memorial HC III Located near Soroti District hospital and
Tirir HC IV
It was also noted that the health workers in some of these HCs have taken advantage of the
short distance and keep referring even minor cases to the main hospitals. This may render
them less relevant as patients always prefer well established hospitals to lower HCs.
There is still a low coverage of HCs compared to the national guidelines as shown below:-
• Bushenyi district has 89 parishes out of 170 accessing health services within a radius of
5 km. This represents coverage of 52.35%,
• Kabarole district has 45 parishes out of 58 accessing health services giving coverage of
77.5%,
• Kamwenge districts has 25 parishes out of 51 accessing health services giving a
coverage of 49%,
168

• Mubende district has 35 parishes out of 91 accessing health services giving coverage of
35.5%.
The poor accessibility to health facilities has caused among other factors the low levels of
immunization of babies and mothers. Mothers find it difficult to travel long distances with
babies and also the medical workers encounter difficulties when extending out reach services.
The level of completion of immunization by mothers and children is on average 19% and 77%
respectively. Children are expected to finish their immunization before the age of 1 year, but
many still receive it late. For example, between 2002 and 2005, on a yearly average, 101,560
and 209,472 Children received BCG and Measles dosages respectively very late as shown in
the table below:
Year
TT Dose 1 TT Dose 5
% of completion of TT Dose
BCG under 1yr
BCG 1 - 4yrs
Measles under 1yr
Measles 1 - 4yrs
% of children complete dosage in time
2002 448,599
83,649 19% 1,098,266
135,985
854,853
250,783 78%
2003 456,136
85,403 19% 1,129,474
115,751
835,672
216,177 74%
2004 510,053
99,580 20% 1,284,942
96,950
1,012,038
214,651 79%
2005 416,028
80,947 19% 953,907
57,553
755,533
156,275 79%
Average 457,704
87,395 19% 1,116,647
101,560
864,524
209,472 77%
Source: MOH- Annual Health Sector Performance Reports.
8.3 CONCLUSIONS
8.3.1 Funding
• Delivery of health services is largely funded by central Government and Development
Partners with minimal/nil contribution by local governments.
• There are delays in the release of funds at MOFPED and district levels due to delays in
notification, under staffing in the accounts departments, delays in processing of payment
and late accountabilities.
169
• Disbursement of funds is irregular and inadequate installments disrupt the districts and
HSD plans designed to achieve HSSP objectives like timely completion of constructions.
• Lower HCs do not participate in the budgeting process and this has resulted in some
requirements at HCs lacking adequate funding, for example, maintenance of buildings
and cleaning of compounds.
• Whereas the MOH uses a standard formula when allocating funds to districts, there is no
formula used by districts and HSDs to allocate funds to lower health units leading to
inequitable allocation and utilization of resources.
• The formula used by MOH in allocating funds to district and referral hospitals is
unrealistic because hospitals have since surpassed their official bed capacities.
• The objective of funding NGO health units to decongest government HCs has not been
achieved because of the user fees charged.
• Accountabilities of funds released to NGO hospitals are not checked and submitted in
time.
• Diversion of funds in some HC affects service delivery and increases the acute drug stock
outs experienced.
• Accumulation of funds on bank accounts pending utilization in some HCs may lead to
delay or suffocation of service delivery especially when health activities are not financed
and it can also lead to misappropriation of funds.
8.3.2 Equipment
• The absence of asset/inventory registers can easily lead to asset misappropriation and
difficulties in verifying and identifying equipment gaps.
• Low level of equipment maintenance leads to constant breakdowns which hamper health
service delivery.
• The level of equipment utilization was found not satisfactory thus affecting health service
delivery.
• The vehicles given to HSDs as ambulances are not well designed and can therefore, not
satisfactorily be used as ambulances.
• Delivery of emergency and referral services is affected by poor or lack of communication
equipment and ambulances.
• Lack of equipment at lower HCs has led to minor cases being referred leading to
congestion of patients in district and regional hospitals.
170

8.3.3 Drugs
• Lack of information sharing amongst the MOH, districts and HCs concerning drug
allocation under the credit line method has led to poor stock management.
• Non-compliance with the drug delivery procedure and schedule issued by NMS has led to
late delivery of drugs.
• Delayed collection of drugs from the districts by HSDs leads to drug shortages.
• Reconciliation of drugs procured under the credit line between NMS and districts, HSD
and HCs are not prepared to monitor drug utilization and account balances.
• Drug stores records in some HCs are not kept and this coupled with limited segregation
of duties can lead to drug leakages going unnoticed.
• Poor stores management skills lead to inappropriate store records which in turn causes
delayed identification of drug stock outs and expired drugs.
• HCs lack proper drug storage facilities which results in exposure of drugs to bad weather
conditions and theft.
8.3.4 IEC Materials
• The development and design of IEC materials is centralized at the MOH headquarters and
may lead to the intended message not getting to the target groups since words and
symbols may mean different things when translated in different languages.
• There is low coverage of IEC materials leading to less awareness and participation of the
communities in preventing and controlling disease.
• IEC materials are not developed in all local languages and symbols leading to ineffective
delivery of the intended message.
8.3.5 HC Buildings
• Districts have completed health structures that have not been put to use thus denying
the communities access to health services.
• Districts have incomplete structures which do not add value to health service delivery and
continued construction of both new and old structures puts pressure on the already
limited funds.
• Districts have some poorly constructed structures which will require more funds to put
them to effective use.
171

8.3.6 Staffing
• Decentralized recruitment of staff leads to staffing gaps and poor deployment of staff and
this compromises the delivery of health services.
• Districts do not have a clear policy on training and mainly depend on adhoc workshops,
conferences and training organized by MOH.
• Lack of a clear policy on staff transfer and rotation has led to congestion of health
workers in urban areas and acute staffing gaps in rural and remote areas.
• Irregular appraisal and supervision of staff has led to less commitment by staff in delivery
of health services.
8.3.7 Monitoring and Evaluation
• There is a break down in supervision visits under the referral hospital system.
• Monitoring and evaluation is not regularly carried out in accordance with guidelines
leading to laxity by districts and HCs in providing quality health service.
• The HMIS is not used properly causing delays and lack of sufficient information for
decision making.
8.3.8 Accessibility
The distribution of some HCs was not in accordance with national guidelines and this affected
the delivery of health services.
8.4 RECOMMENDATION
8.4.1 Funding
• The activity based budgeting system used by MOH should be operationalized at HSD and
lower level HCs.
• There is need to enforce MOH Standard guidelines on the disbursement and
accountability of funds at districts, HSDs and HCs.
• Funding to NGO HCs should be limited to those offering free health services.
• There is need to enforce adherence to the terms and conditions set in the MOU between
GoU and NGO hospitals.
172

• MOFPED should be encouraged to disburse funds as and when needed by districts with
minimal variations between quarters to enable districts, HSD and HCs implement their
health programmes without delay.
• There should be a clear and standard method of book keeping in all districts, HSDs and
HCs and which should be regularly reviewed.
8.4.2 Equipment
• A system of keeping the inventory and detailed status of equipment should be maintained
in all HCs so as to provide information needed for planning, budgeting, procurement and
maintenance of equipment.
• MOH engineering department in collaboration with the regional workshops should carry
out routine checks on the equipment to avoid eventual break-downs.
• Procurement contracts of specialized equipment should include a clause for after-sales
service.
• The vehicles should be re-designed as ambulances to reduce on their misuse.
8.4.3 Drugs
• The credit line method of drug procurement should be made more transparent to allow
districts, HCs, politicians and health management committees access information on how
much has been allocated and for reconciliation purposes.
• If NMS can not meet increasing demands of the HCs, the districts should be allowed to
buy drugs from the other approved suppliers without hindrance (certificate of non
availability) and MOH should have more pre-qualified companies added on its list.
• The system of recording drugs at the HCs should be improved to ensure proper
management of stock levels and utilization of drugs.
• The drug ordering system should be automated and centrally controlled at the HSDs to
reduce ordering time.
• MOH should devise a mechanism such that drugs with short shelf life or those about to
expire are exchanged for other drugs from other HCs to avoid incidences of some HCs
having expired drugs yet others experience stock-outs for the same drugs.
• Delivery time of drugs to health facilities should be improved.
8.4.4 IEC Materials
• The districts should be involved in the design and development of IEC materials to
173
increase local acceptability.
• The provision and continuous distribution of IEC materials for the various maternal and
child health programmes in local languages should be encouraged.
• IEC materials should also be put in other public places apart from premises at HCs.
• There is need to develop IEC materials for all health interventions and not concentrate on
a few health programmes.
8.4.5 HC Buildings
• The practice of districts budgeting for new constructions before first completing the older
ones should be discouraged.
• The districts should require contractors who provide unsatisfactory constructions to
compensate them.
• District engineers who certify unsatisfactory works should be disciplined.
• HCs should be encouraged to include routine maintenance and security of facilities in
their budgets.
• Regular and effective supervision of construction of health facilities should be encouraged
by MOH through its Health Infrastructure Division and the district engineering
departments.
• There is need to improve on the selection process of contractors at the districts and early
development of tender documents for civil works.
8.4.6 Staffing
• There is need for more comprehensive and coordinated human resource planning
involving districts, HSDs, HCs and MOH.
• The recruitment system of health workers should be centralized i.e recruitment adverts
should be for the country and not specific districts. Also, clear policies on transfer and
rotation of staff in order to retain staff in hard to reach areas should be developed.
• District staff ceilings should be arrived at by the MOH after a thorough staff needs
assessment of each district.
• Districts should develop clear policies on training of the medical staff and also carry out
training needs assessment for its staff.
• Staff appraisal forms should be regularly updated to include relevant information and
174

recommendations of supervisors should be taken into consideration to aid decision
making.
• Organizational structures of HSDs should be enriched to accommodate the post of an
administrator to relieve doctors from administrative work which hinders them from
concentrating on health duties.
8.4.7 Monitoring and Evaluation
• In addition to the discussion of the monitoring reports in general terms at workshops and
seminars, each district, HSD and HCs should receive feedback on their respective reports
to enable them implement the recommendations specifically applicable to them.
• MOH should develop a mechanism to ensure accurate and timely completion of HMIS
forms by districts, HSDs and HCs to improve on the quality of reports and decisions made
on the basis of HMIS.
• Districts, HSDs and HCs should be encouraged to generate reports from the HMIS and
use them to improve on their performance.
• All information assistants in the districts, HSDs and HCs should be adequately trained to
input data and should be provided with the necessary tools to enable them generate
accurate and reliable reports.
• District administrators and politicians should be encouraged to conduct multi-sectoral
monitoring of all government programs.
• The referral hospital support supervision system and consultants out reach programme
should be re-activated to improve health service delivery at HCs.
8.4.8 Accessibility
• MOH guidelines on distribution of HCs should be followed and districts which do not find
it practical, should inform MOH so that where justifiable, authority is given for a deviation
to avoid deviations which could lead to over concentration of HCs in particular areas at
the expense of others.
• Districts and HSDs should plan to increase the number of out-reach activities in maternal
and child health programmes like child immunization and family planning to overcome the
low coverage in remote and difficult to reach areas.
175

9.0 UNIVERSAL PRIMARY EDUCATION PROGRAMME
(ISSUED 2005)
9.1 INTRODUCTION
The management of the Capitation Grants (CG) and the School Facilities Grants (SFG), which
are the main components of the Universal Primary Education programme have been reviewed
by me. This report focuses on the following aspects of the programme:
• Management of the construction and completion of classrooms, latrines and teachers’
houses under the School Facilities Grant.
• Funds flow and management of Capitation Grants.
The primary objective of this audit was to evaluate the economy, efficiency and effectiveness
with which these grants have been utilized.
9.1.1 Background information on the Universal Primary Education Programme
The Government of Uganda (GoU), in a bid to ensure that all children in the country received
some basic education, declared free primary education in 1997. Initially the programme was to
cover 4 children per family but was later extended to all children of primary school going age.
The MoES is charged with the implementation of this policy. GOU extends grants to all
government aided schools and until the financial year 2002/03, to some private schools. These
grants are; the CG which is used for maintenance and general upkeep of the pupils at school
and the SFG which is extended to schools for construction and completion of classrooms,
teachers’ houses, latrines and acquisition of furniture. Both grants are conditional and releases
are made upon satisfaction of accountability requirements for previous disbursements. By
achieving universal primary education, GoU would be fulfilling its mission of eradicating
illiteracy while equipping every individual with the basic skills and knowledge with which to
exploit the environment for both self and national development.
176

9.1.2 Financing
The UPE programme is financed from the Poverty Action Fund (PAF) which is a comprehensive
strategy for alleviation of poverty through grass root projects. The UPE, like other PAF
activities, is financed by Government of Uganda, HIPC debt relief savings, general aid and
specific donor funding. The main donors for the UPE programme are; The Netherlands,
Sweden, United Kingdom, Ireland and Belgium. The EU, USAID, IMF, IDA and UNICEF also
substantially contribute to the programme.
From its inception until June 2001, over 250 billion Uganda Shillings was spent on this
programme as shown in the table below.
Amounts Released in Uganda Shillings for each grant per Financial Year
Financial Year Capitation Grants School Facilities Grant
Total Amounts Released
1996-1997 14,180,619,449 - 14,180,619,449
1997-1998 26,220,673,559 - 26,220,673,559
1998-1999 31,663,139,112 26,463,827,255
58,126,966,367
1999-2000 38,407,522,000 34,225,974,500
72,633,496,500
2000-2001 46,740,000,000 46,110,176,977
92,850,176,977
TOTAL 157,211,954,120 106,799,978,732 264,011,932,852
.
177
U P E R E L E A S E S
01 02 03 04 05 0
96-19
97
97-19
98
98-19
99
99-20
00
00-20
01
AM
OU
NTS
IN B
ILLI
ON
SHS.
19 19 19 19 20
F IN A N C IA L Y E A R
C a p i ta t i o nG r a n t s S c h o o lf a c i l i t i e s g r a n t
9.1.3 Reasons for the Value for Money Audit
The audit was motivated by public concern about the programme and hence the need to assess
whether there has been value for the money spent so far on the UPE programme. As
demonstrated from the graph above, the trend of releases has been increasing and by 2000/01
over 69% of the education sector budget was allocated to primary education. Despite this,
there have been repeated complaints by stakeholders about the poor quality of classroom
constructions and compromised delivery of other educational services under this programme. If
these funds are not put to the intended use, there is a risk of failure to achieve the UPE
programme objectives.
In addition, under the Education Strategic Investment Programme (ESIP), the year 2003 is a
milestone by which UPE will have been achieved and it is therefore timely to conduct this audit
to assess whether value for money has been achieved over this 5-year period.
9.1.4 Scope of the Audit
The audit focused on two major aspects of the Universal Primary Education programme, the
Capitation Grant (CG) and School Facilities Grant SFG. Our review covered the period July 1997
to June 2001 and focused on 10 of the 56 districts in Uganda. No schools were selected from
the Northern Region due to the insecurity in that region at the time of the audit.
School Facilities Grant
Our work was carried out with the objective of determining if;
i) The school construction programme had been properly planned at the beginning of the
programme by the Ministry of Education and Sports,
ii) The design of the schools was acceptable and the drawings produced adequate to attain
the objectives of the SFG,
iii) The quality of the schools and classrooms built is acceptable and meets the requirement
that the facilities will have a useful life of at least 30 years,
178
iv) The monitoring of the construction process was carried out properly and in an effective
manner,
v) The tendering process was followed,
vi) The Capitation Grants are efficiently managed.
Approach
Given that the schools and classrooms are the main focus of the SFG, we used the total
population of classrooms constructed during the period under review as our sample population.
We then used a statistical approach called monetary unit sampling to select a representative
sample to audit. Ten districts were chosen at random from the 56 districts. We excluded the
northern region due to insecurity in the area at the time of our audit. A computer programme
designed to extract samples of this nature was utilized on the data provided by the Ministry and
140 schools were identified to be visited from the 10 districts selected. An added bonus to this
sampling method is that it allows us to project the monetary value of the defects of the schools
in the sample over the total number of classrooms built nation-wide to arrive at an estimated
loss to the national treasury from the deviations from the accepted norms of construction and
monitoring.
In those instances where we found other problems outside of our statistical sample, they were
also considered but do not form part of the monetary evaluation of the sample.
9.1.5 Districts selected for the sample
The table below summarises the data utilised to select the sample and the resulting sample
areas
179
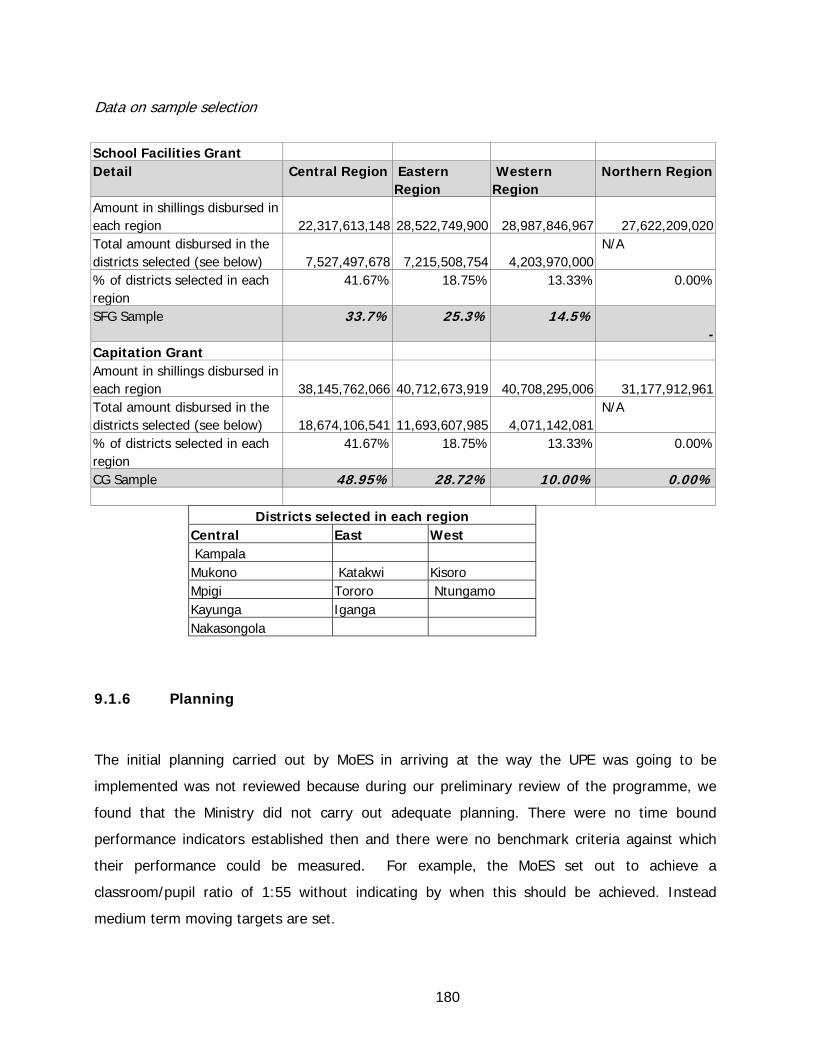
Data on sample selection
School Facilities Grant Detail Central Region Eastern
Region Western Region
Northern Region
Amount in shillings disbursed in each region 22,317,613,148 28,522,749,900
28,987,846,967 27,622,209,020
Total amount disbursed in the districts selected (see below) 7,527,497,678 7,215,508,754
4,203,970,000
N/A
% of districts selected in each region
41.67% 18.75% 13.33% 0.00%
SFG Sample 33.7% 25.3% 14.5% -
Capitation Grant Amount in shillings disbursed in each region 38,145,762,066 40,712,673,919
40,708,295,006 31,177,912,961
Total amount disbursed in the districts selected (see below) 18,674,106,541 11,693,607,985
4,071,142,081
N/A
% of districts selected in each region
41.67% 18.75% 13.33% 0.00%
CG Sample 48.95% 28.72% 10.00% 0.00%
Districts selected in each region Central East West Kampala Mukono Katakwi Kisoro Mpigi Tororo Ntungamo Kayunga Iganga Nakasongola
9.1.6 Planning
The initial planning carried out by MoES in arriving at the way the UPE was going to be
implemented was not reviewed because during our preliminary review of the programme, we
found that the Ministry did not carry out adequate planning. There were no time bound
performance indicators established then and there were no benchmark criteria against which
their performance could be measured. For example, the MoES set out to achieve a
classroom/pupil ratio of 1:55 without indicating by when this should be achieved. Instead
medium term moving targets are set.
180

9.1.7 Capitation Grant
The objective of the Capitation Grant is to improve equitable access to basic education by
providing the resources necessary to run primary schools. Our review was focused on;
a) Review of the timeliness of the disbursements of funds to the schools by the Ministry of
Education and Sports,
b) Review of the funds disbursement procedures put in place by the ministry,
c) Monitoring of the disbursements by the Ministry,
d) Use of funds by the districts once the funds have been disbursed.
9.1.8 Performance of UPE Programme
Since inception in 1997, the UPE programme has produced the following results in the areas of
enrolment, number of primary schools, classrooms constructed and increased number of
teachers.
Below is the summary of these achievements
Indicator 1996 (Before UPE) 1997 2001
Enrolment 3 Million 5.3 Million 6.9 Million
Primary schools 8,500 10,000 12,280
Classrooms No reliable statistics No reliable statistics 66,300
Teachers 81,564 89,247 127,038
Number of children
entitled to free Education
N/A 4 per family All children of school going age
181
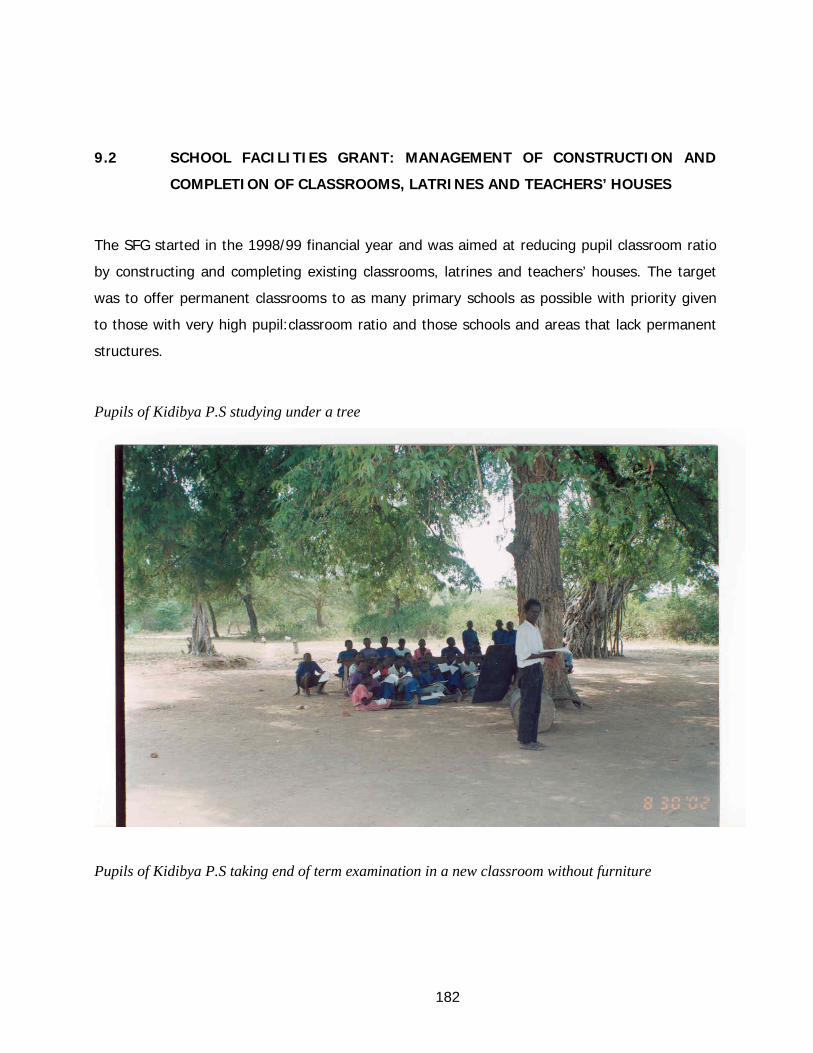
9.2 SCHOOL FACILITIES GRANT: MANAGEMENT OF CONSTRUCTION AND
COMPLETION OF CLASSROOMS, LATRINES AND TEACHERS’ HOUSES
The SFG started in the 1998/99 financial year and was aimed at reducing pupil classroom ratio
by constructing and completing existing classrooms, latrines and teachers’ houses. The target
was to offer permanent classrooms to as many primary schools as possible with priority given
to those with very high pupil:classroom ratio and those schools and areas that lack permanent
structures.
Pupils of Kidibya P.S studying under a tree
Pupils of Kidibya P.S taking end of term examination in a new classroom without furniture
182
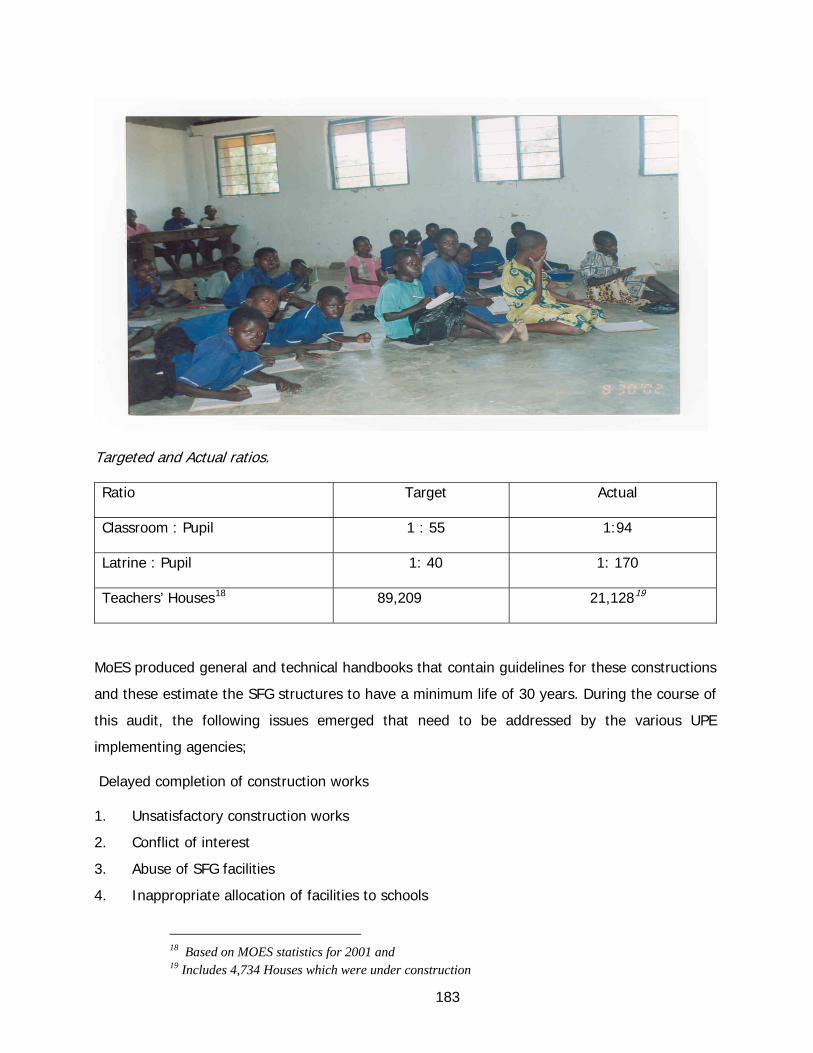
Targeted and Actual ratios.
Ratio Target Actual
Classroom : Pupil 1 : 55 1:94
Latrine : Pupil 1: 40 1: 170
Teachers’ Houses18 89,209 21,12819
MoES produced general and technical handbooks that contain guidelines for these constructions
and these estimate the SFG structures to have a minimum life of 30 years. During the course of
this audit, the following issues emerged that need to be addressed by the various UPE
implementing agencies;
Delayed completion of construction works
1. Unsatisfactory construction works
2. Conflict of interest
3. Abuse of SFG facilities
4. Inappropriate allocation of facilities to schools
18 Based on MOES statistics for 2001 and 19 Includes 4,734 Houses which were under construction
183

5. Too much bureaucracy in commissioning completed structures.
6. Other observations
• Wide variation in sizes of classrooms for completion under SFG
• Inappropriate basis for allocation of monitoring funds
• Non-deduction of Withholding tax
9.2.1 DELAYED COMPLETION OF CLASSROOM CONSTRUCTION
Funds for construction of classrooms in a particular quarter are often released in advance on
the basis of a District/municipality work plan that is agreed with and approved by the MoES.
Contracts are then awarded and a contract is signed between the SMC and the contractor. All
constructions are supposed to be completed within 3 months from the commencement date
specified in the contract. The following were noted;
9.2.2 Delay in payment of contractors
The agreement between the district and the school community requires that certificates for
works completed should be settled within one week of presentation.
It was established that many districts take more than one week to settle certificates and there
are extreme cases like Tororo district, which took over 4 months to process some certificates.
Furthermore many contracting firms/persons had little financial ability to pre-finance more than
one stage of the contract and were therefore dependant on payments of certified works to
finance subsequent stages. For such contractors, delays in settlement of certificates resulted in
delay in completion.
9.2.3 Delays in award of tenders
Some districts receive SFG funds and take up to 3 months before awarding tenders for
construction works. This affects the number of classrooms constructed in a given quarter and
impacts on the attainment of the overall targeted classroom : pupil ratio.
184

9.2.4 Influence peddling
The SFG tender agreement requires that payments will only be made for a stage of construction
that has been satisfactorily completed and approved by the standard SFG certificate of works
issued by the district. In addition retention money is to be paid after the defects period of 6
months. Furthermore, sites are supposed to be completed within 3 months of commencement.
It was established that many contractors obtained certificates for stages not completed and
went ahead to get full payments in advance inclusive of retention fees. This irregular practice
removes the incentive for the contractors to complete the works in time and as a result many of
these sites overran time in some cases by over two years. Examples of such cases are shown in
the table below.
Extreme examples of payments for incomplete works in sampled districts.
District School Contractor Contract amount
Amount
Paid
Status of works on inspection
Expected completion Date
Ntungamo Rwanda P.S Mutunzi C 35,000,000 34,443,825 Roofing incomplete Nov 2001
Ntungamo Bujuzya P.S Mubangizi H
35,000,000 34,443,825
Latrine collapsed before completion & classroom Finishing not complete
Nov 2001
Iganga Bulunguli P.S “SMC” 24,760,000 23,522,000 Done up to roofing Aug 2001
Iganga Busuyi (1) P.S 8,578,000 8,149,100
Done up to roofing Mar 2000
Iganga Busuyi (2) P.S 8,578,000 8,149,100
Done up to roofing Mar 2000
Iganga Bugomba P.S 8,578,000 8,149,100
Done up to roofing Mar 2000
Katakwi Abwanget Kuju P.S
Pioneer co. of Amuria 11,708,000 11,708,000
Partly roofed Mar 2002
Katakwi
Angatuny P.S Larry Stationers
25,418,000 25,418,000
Water System not done valued at 2,314,242/= and several deviations from Technical. Specs.
Nov 2001
Katakwi Odiding P.S Pioneer co. of Amuria 20,616,000 20,616,000
Partly roofed Dec 2001
Tororo Kachonga P.S: Classrooms
Ludo Enterprises 17,156,000 17,156,000
Partly plastered Feb 2001
Kachonga P.S: Furniture
Welfare Agencies (Ally Hamya) 2,700,000 2,700,000
Not delivered after 2 years
Feb 2001
185
It was also observed that SFG classrooms at Bulunguli P.S had been commissioned by MOES
officials as complete yet the walls were not plastered, the window bars were smaller than those
recommended and the classrooms neither had a concrete floor nor a blackboard. These classes
were in use at the time of inspection. Such gestures compromise the efficiency and
effectiveness of SFG contractors.
Conclusion
The objective of achieving the targeted classroom: pupil ratio could not be achieved because of
these weaknesses.
Recommendations
a) District Tender Boards must endeavour to award SFG tenders during the first 2 weeks of
the quarter if not, immediately the District receives funds.
b) Districts must adhere to the SFG guidelines that require release of funds to SMC within
one week from certification of stages completed.
c) District administration and leadership must only make payments for stages completed and
certified; engineers who certify stages as complete when they are not, exhibit
professional dishonesty and appropriate action may be considered by the respective
District Service Commissions.
9.2.5 Delayed commissioning of complete structures
On completion of SFG sites, a final certificate is supposed to be issued confirming that a site is
ready for use and it is then officially handed over to the district which commissions and hands
the classrooms to the school for use.
It was observed that some structures though complete, are not in use because they have not
been officially commissioned. For example in Mukono district, over 24 SFG sites were completed
by 31st July 2002 but were not in use 4 months after completion because they had not been
commissioned. This was also the case at Wera P.S in Katakwi district.
Conclusion
Delayed commissioning of SFG structures works against the programme since it delays use of
completed facilities and this delays reduction of congestion in classes.
186

Recommendation
It is recommended that commissioning be done immediately on issue of the completion
certificate provided that the structures are proved to be completed.
Latrine at Jinja Misindye delayed by over 6 Months
9.2.6 Unsatisfactory Construction of SFG Structures
Classrooms completed under the SFG programme are expected to have a minimum life of 30
years and conform to the quality and design contained in the technical handbook.
Construction works physically inspected on the sampled schools with the assistance of
engineers from the MOWHC20 and engineering assistants from MoES revealed that many of the
construction works are not to the standards set in the technical guidelines and can not stand
the 30-year test. In extreme cases structures collapsed before they were completed.
1. 20 Ministry of Works, Housing and Communication
187
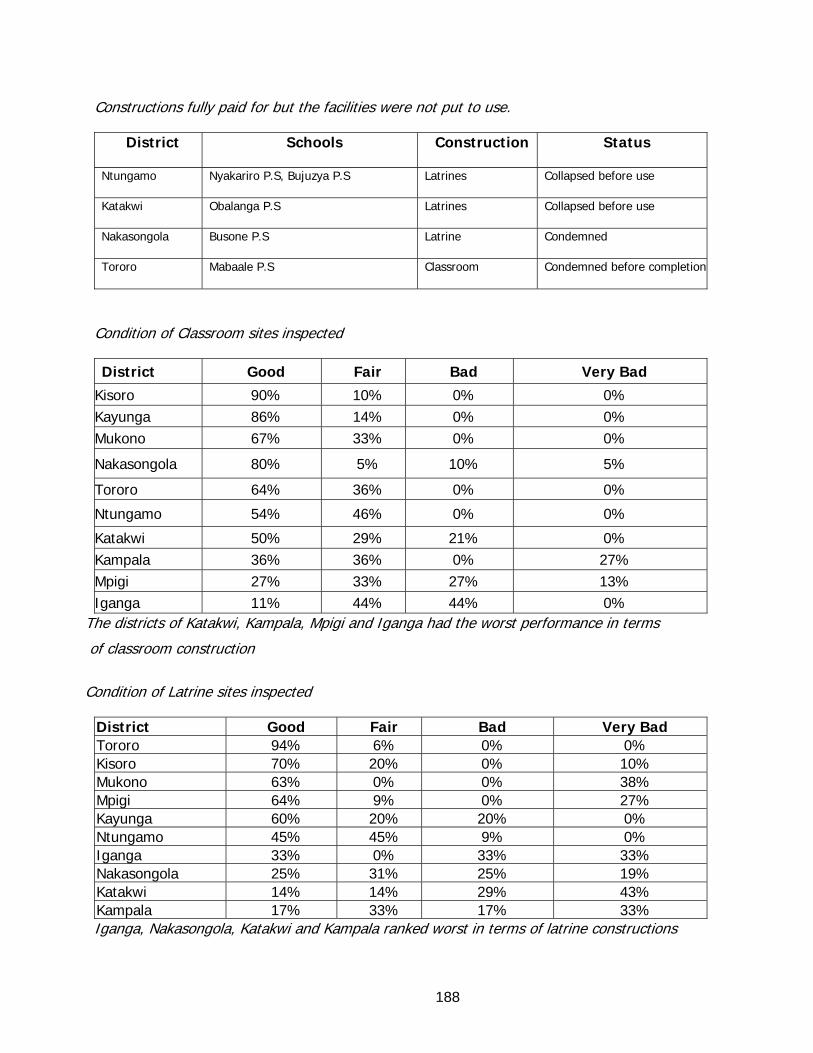
Constructions fully paid for but the facilities were not put to use.
District Schools Construction Status
Ntungamo Nyakariro P.S, Bujuzya P.S Latrines Collapsed before use
Katakwi Obalanga P.S Latrines Collapsed before use
Nakasongola Busone P.S Latrine Condemned
Tororo Mabaale P.S Classroom Condemned before completion
Condition of Classroom sites inspected
District Good Fair Bad Very Bad
Kisoro 90% 10% 0% 0% Kayunga 86% 14% 0% 0% Mukono 67% 33% 0% 0%
Nakasongola 80% 5% 10% 5%
Tororo 64% 36% 0% 0%
Ntungamo 54% 46% 0% 0%
Katakwi 50% 29% 21% 0% Kampala 36% 36% 0% 27% Mpigi 27% 33% 27% 13% Iganga 11% 44% 44% 0%
The districts of Katakwi, Kampala, Mpigi and Iganga had the worst performance in terms
of classroom construction
Condition of Latrine sites inspected
District Good Fair Bad Very Bad Tororo 94% 6% 0% 0% Kisoro 70% 20% 0% 10% Mukono 63% 0% 0% 38% Mpigi 64% 9% 0% 27% Kayunga 60% 20% 20% 0% Ntungamo 45% 45% 9% 0% Iganga 33% 0% 33% 33% Nakasongola 25% 31% 25% 19% Katakwi 14% 14% 29% 43% Kampala 17% 33% 17% 33% Iganga, Nakasongola, Katakwi and Kampala ranked worst in terms of latrine constructions
188

From the site inspections it was established that there was an estimated overall loss of about
16% (UShs.4.5 billion) in the sampled districts over the 3 year period. If this is extrapolated it
translates into a countrywide loss of value of about Ushs.15 billion
These unsatisfactory works are mainly attributed to the following
• Ineffective supervision and monitoring
• Commencements of sites before tenders are awarded or before contracts are signed
• Payments made to contractors without full certification
• Incompetent contractors
• Inequitable appropriation of monitoring funds
• Use of inferior materials by contractors to achieve savings
• Poor technical appraisal of schools for completion
9.2.7 Ineffective supervision and monitoring
SFG guidelines highlight the SMCs, District Technical Supervisors and district political leaders as
the principal monitors of the SFG programme. It further states that Shs 400,000 will be availed
per SFG site to technical supervisors while the political supervisors will be funded from the
multi-sectoral PAF Monitoring and Accountability Grant. The guidelines also give a standardised
format for reporting expenditure on district monitoring (Form 9). This form is signed by all the
concerned inspectors to attest to their inspection and visit. This is to be submitted upon
inspection of each site. For the SMCs a site supervision form was designed and is included in
the technical handbook.
It was established that in all cases funds were paid to the various monitoring teams and in
many districts Form 9 was attached to payment vouchers as part of the accountability but out
of all the sites inspected in sampled districts 45 % had unsatisfactory work.
This is evidence that Form 9 may merely be used as a formality rather than proof of actual
monitoring and as a result it appears that many certificates are issued without sites being
inspected.
189

It was also established that there is insufficient sensitisation of SMCs on what they are
supposed to do and how they are supposed to do it and they hardly make use of the technical
handbook when undertaking supervision. As a result the benefit of monitoring by SMCs appears
not to have been realised.
Conclusion The supervision and monitoring were not effective resulting into unsatisfactory work being
certified and approved for payment.
Recommendation
• MOES and district authorities must conduct effective monitoring of SFG sites rather than
the current accountability oriented supervision. MOES should also monitor the monitors to
ensure that they do carry out their work in a professional manner
• SMCs should be sensitised on what they are supposed to do and how they are supposed
to do it.
9.2.8 Commencement of sites before tenders are awarded/contracts are signed
The District Tender Board awards SFG tenders to successful contractors and then contracts are
signed between the SMC of the beneficiary school and the contractor. Upon signing, the
contractor is supposed to commence construction.
It was established that occasionally contractors start constructions before tenders are awarded
or before contracts are signed. In such cases the technical supervisors are unaware of such
constructions and therefore do not supervise the work done. In some cases it was too late to
recommend re-works, as was the case in Kyayi P.S and Kewerimidde P.S in Mpigi district and
Nyada P.S and Adepar P.S in Katakwi district.
190
Conclusion
This irregularity erodes the benefit of stage-by-stage monitoring prescribed for SFG sites and
yields unsatisfactory works.
Recommendations
It is recommended that no payment should be made in respect of unsupervised work and any
commencement of construction before award of tenders or before the contract is signed must
not be paid for from public funds.
9.2.9 Payments made without full certification
On completion of each stage of construction, the District Engineer/Supervisor issues a
certificate. The, Sub-county Chief and the Head Teacher are required to sign the certificate. In
addition, an Engineering Assistant from MoES (who is independent of the district) is supposed
to certify all stages of SFG constructions. Payments are supposed to be based on fully signed
certificates.
A review of paid certificates revealed that some contractors are paid against certificates that are
not fully signed. This practice was common in Tororo Municipality and Katakwi District.
Although MoES issued several circulars to districts urging them to restrain from this practice,
most of the sampled districts ignored it.
Conclusion
In my opinion, certificates that are not signed by all signatories put to doubt the quality of the
construction works and reduces the value for money assurance given by these certificates.
Recommendation
Since SFG is a conditional grant, it is recommended that MOES establishes a disciplinary
mechanism for officials who make payments for works not fully certified.
191

9.2.10 Incompetent contractors
The SFG guidelines require SMCs, assisted by the District Engineer to identify, appraise and
nominate three qualified contractors to the technical evaluation committee of the District. The
committee then evaluates and recommends them to the District Tender Board for consideration
and award. The successful contractors are supposed to follow the specifications in the technical
handbook.
From works inspected, it was established that many of these contractors were unable to
interpret technical specifications. As a result, basic technical omissions and commissions were
made such as fixing doors inside out, ramps being built out of proportion, and door hinges for
latrines being placed on the wrong side of the frames making their access very difficult.
The selection of incompetent contractors was attributed to disregard by the tender board of
technical committee evaluations and the SFG contractor procurement system prescribed by the
guidelines.
9.2.11 Disregard of technical evaluations
While S.80 of the Local Government Act allows the District Tender Boards to deviate from
recommendations of the technical evaluation committee if their decision does not cause
financial loss, many tenders awarded this way often resulted in unsatisfactory works. In Katakwi
district this practice resulted into a few contractors dominating although their previous quality
of works was poor. Some of these contractors exhibited incompetence and were often defiant in
making good the defects as instructed by the engineers.
192
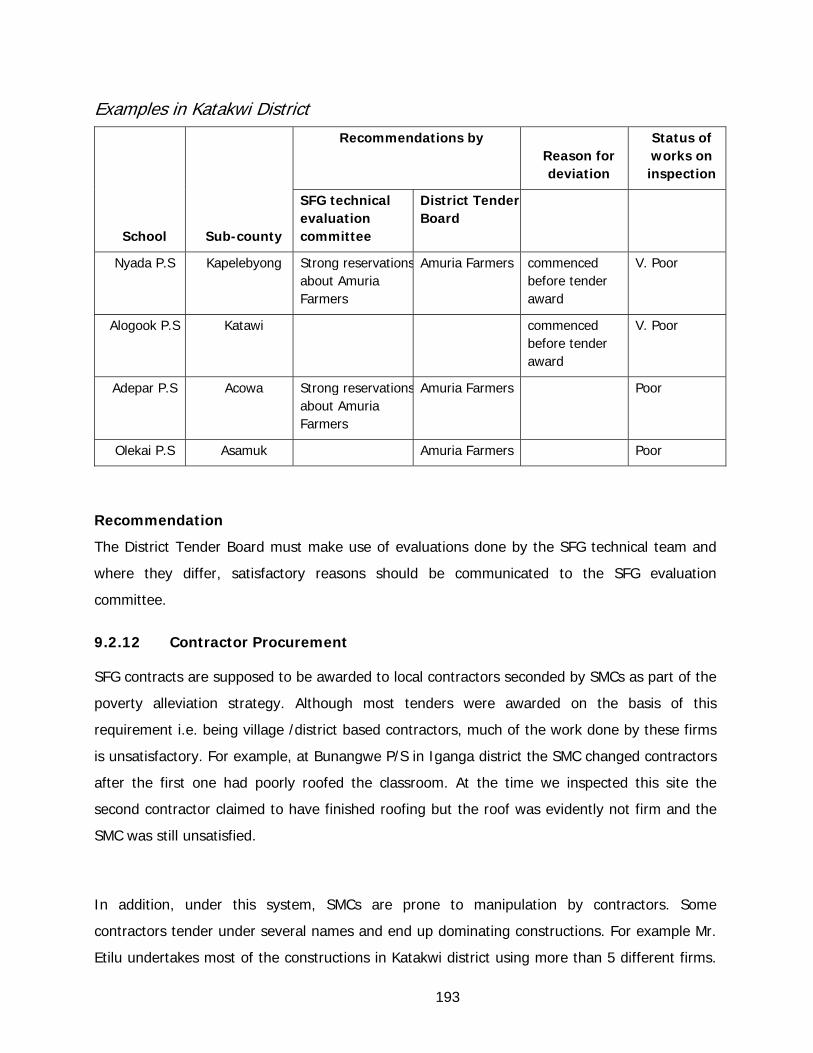
Examples in Katakwi District
School Sub-county
Recommendations by Reason for deviation
Status of works on inspection
SFG technical evaluation committee
District Tender Board
Nyada P.S Kapelebyong Strong reservationsabout Amuria Farmers
Amuria Farmers commenced before tender award
V. Poor
Alogook P.S Katawi commenced before tender award
V. Poor
Adepar P.S Acowa Strong reservationsabout Amuria Farmers
Amuria Farmers Poor
Olekai P.S Asamuk Amuria Farmers Poor
Recommendation
The District Tender Board must make use of evaluations done by the SFG technical team and
where they differ, satisfactory reasons should be communicated to the SFG evaluation
committee.
9.2.12 Contractor Procurement
SFG contracts are supposed to be awarded to local contractors seconded by SMCs as part of the
poverty alleviation strategy. Although most tenders were awarded on the basis of this
requirement i.e. being village /district based contractors, much of the work done by these firms
is unsatisfactory. For example, at Bunangwe P/S in Iganga district the SMC changed contractors
after the first one had poorly roofed the classroom. At the time we inspected this site the
second contractor claimed to have finished roofing but the roof was evidently not firm and the
SMC was still unsatisfied.
In addition, under this system, SMCs are prone to manipulation by contractors. Some
contractors tender under several names and end up dominating constructions. For example Mr.
Etilu undertakes most of the constructions in Katakwi district using more than 5 different firms.
193

This weakness coupled with the inability of SMCs to vet and verify applicants was noted at
Angatuny P.S in the same district. It was observed that the SMC nominated 3 contractors to the
District Tender Board but subsequently another contractor submitted another set of SMC
minutes recommending him as the ‘second’ contractor. It was later established that these
minutes were fraudulent with many signatures differing from those of the genuine SMC
members and many names included were not SMC members but PTA members. In addition, the
minutes were signed by the LCII chairman as the secretary instead of the Head teacher. A
review of other documents revealed that a tender was awarded to this contractor for Abota P.S
but payments were made to Amuria Farmers which also demonstrates the issue of using
pseudo names when in substance it is the same contractor undertaking the works.
Conclusion
Although the policy of selecting village/district based contractors has good intentions, strict
adherence to it may not necessarily result in value for money being achieved in matters
requiring technical competence and expertise and may instead yield many classrooms without
due regard to their quality.
Recommendations
Given the weaknesses in this policy, it is recommended that MoES considers reviewing the
tender award guidelines by uplifting the criteria for selection of contractors from merely being
district based to also include minimum competencies.
Management’s Response
New guidelines, which address most of the issues related to procurement of SFG contractors
and monitoring were issued and became effective January 2003.
9.2.13 Inequitable appropriation of monitoring funds
In order to facilitate monitoring of SFG constructions by the District technical supervisors
(District Engineer, DEO, CAO & CIA), Shs 400,000 is provided per site as part of the SFG
quarterly releases.
194

It was established that in some cases the Engineering department, which is the technical
department, is inadequately facilitated. For example, in Iganga, the CFO (Chief Finance officer)
who is not part of the monitoring team got the same amount as the Works Supervisor who
issues all certificates of works. We also found that 74% of the monitoring funds go to the
ineligible supervisors and only 36% is spent on the eligible officials of the district. In some
districts, contractors offer transport to the District Engineer to visit their sites. These anomalies
are attributed to the absence of guidelines on appropriating monitoring funds to the various
supervisors which leaves a lot of discretion to the CAO and DEO as to who gets how much.
Conclusion
Value for money is not achieved as a result of ill facilitation of technical monitors. This situation
also raises questions on the use of monitoring funds disbursed as part of the SFG and if not
addressed, may not only constrain but will also compromise the objectivity of the monitoring
teams.
Recommendations
• The MoES should come up with guidelines on the appropriation of monitoring funds
amongst the various monitoring supervisors.
• The MoES must recover the funds paid out to ineligible officials.
Management’s Response
The new guidelines specify clearly how the Shs.400,000 per site are distributed amongst the
district officials.
9.2.14 Poor appraisal of schools for completion
SFG guidelines require that ‘the District/Municipal engineer will check the site, soil and
building conditions especially the safety and the durability of the unfinished
buildings to be completed.’ Also the Application form for primary school requires
that a building for completion must have foundations made of stone or
concrete………….” It was noted however that almost all classrooms for completion neither
had concrete nor stone foundations. An extreme case was Mabale P.S. in Tororo District where
19 million (92% of the contract sum) was spent on completion of dangerously weak classrooms
195

that were condemned even before completion. This is primarily caused by inappropriate
appraisals done prior to completion of the structures and as a result of this many classrooms
under the classroom completion grant are not of the quality specified by the technical
handbook.
Conclusion
Little value for money was obtained from the classroom completion grant because of poor
appraisal and as a result most structures under this grant will not last the minimum 30 years. In
addition, remedial and maintenance costs are likely to be high.
Recommendation
• Engineers, who appraise and certify works as fit for completion when they are not, or that
stages are complete when they are not, exhibit professional dishonesty and the District
Service Commissions should consider disciplinary action.
• Legal action should be considered by GoU against the culprit engineers for causing
financial loss.
Management’s Response
The Classroom completion programme was phased out with effect from 2002/2003 for the
same reasons given in this report.
9.2.15 Remittance of unused funds to Treasury
MoFPED requires that any unused amounts by 30th June must be remitted back to treasury
even when they are committed. In some cases SFG funds are received by districts within June
and are expected to use all this money within one month. Because of this, all SFG sites for the
4th Quarter in Ntungamo district and Olekai P.S in Katakwi were started and completed within
one month. In my opinion, these rushed constructions may result into weak and substandard
structures.
196

It was also noted that sites which had not been completed by the close of the financial year had
to wait for clearance from MOFPED21 before settlement of unpaid interim certificates. As a
result, work stalled for over 4 months as in the case of NTURO P.S. in Kisoro.
Recommendations
If MoFPED is to take advantage of the merits of this system, it should release SFG funds for the
4th quarter early enough to allow Districts at least 3 months for construction before the 30th of
June or if released late, allow 3 months to enable completion of works. Alternatively funds
meant for the 4th quarter may be released as part of the following quarter’s release to avoid the
tight deadline of 30th June.
9.2.16 Failure by Districts to evoke the penalty clauses
The SFG contract provides that in case of default by contractors, agreed penalties should be
imposed for each day delayed from the agreed completion date. It was observed that apart
from Ntungamo, no other district sampled takes strong action against inefficient and
incompetent contractors. This encourages laxity and delays in constructions and may be one of
the reasons for delayed completion works.
Recommendation
District authorities must strictly adhere to and evoke the penalty clauses contained in the
contract agreements.
21 Ministry Of Finance Planning and Economic Development
197

A teachers’ house, Kitchen and latrine at Kagongi P.S in Ntungamo district
7.2.17 Use of inferior materials / non-adherence to SFG technical specifications
MOES produced the technical handbook to guide contractors and the monitoring teams as SFG
constructions are undertaken. It was established that many contractors made unapproved
deviations from the technical specifications intended to achieve savings on their part.
These deviations compromised the quality and resulted in loss of value in these constructions.
198

Examples of significant deviations from technical specifications.
District School Facility Variation from guidelines
Tororo Aguruguru P.S Teachers’ house Used plain iron sheets instead of Pre-painted Iron
sheets
Kisoro Sanuriro P.S Teachers’ house Used plain iron sheets instead of Pre-painted Iron
sheets
Katakwi Angatuny P.S Teachers’ house Water harvesting system with 10,000 Ltr Tank worth
2,314,242/= was totally omitted
Mpigi Kyabagamba P.S New construction of
classrooms
Bricks laid stretcher (140mm thickness) instead of
header to achieve wall thickness of at least 200mm
Kampala Shimoni Dem. Sch.
Kibuye & Bukoto P.S
Latrines Used 4 stance pit to congest 8 stances
Kayunga Kidibya & many others
in Galiraya
New construction of
classrooms
Bricks laid stretcher (140mm thickness) instead of
header to achieve wall thickness of at least 200mm
Iganga Butende P.S Classroom
completion
2 bars instead of 4 used in ring beam; 32mm gauge
iron
sheets instead of 28mm
Mpigi Most SFG classrooms 70% of the classrooms used 8 – 10mm bars instead
16mm iron bars for window frames
Katakwi Most classrooms
completed / constructed
95% of the classrooms completed / constructed used
8 – 12mm bars instead of 16mm iron bars for window
frames
Katakwi Furniture / Desks All desks inspected in Katakwi fell short of these
dimensions (1500X300X25mm)
Tororo Kachonga Pit Latrines Width is 2ft. instead of 3 ft.
Iganga Pit latrines under SFG
in many schools
Parents compelled to dig the pit before allocation of Pit
Latrine construction to school. Instead of contractor.
199
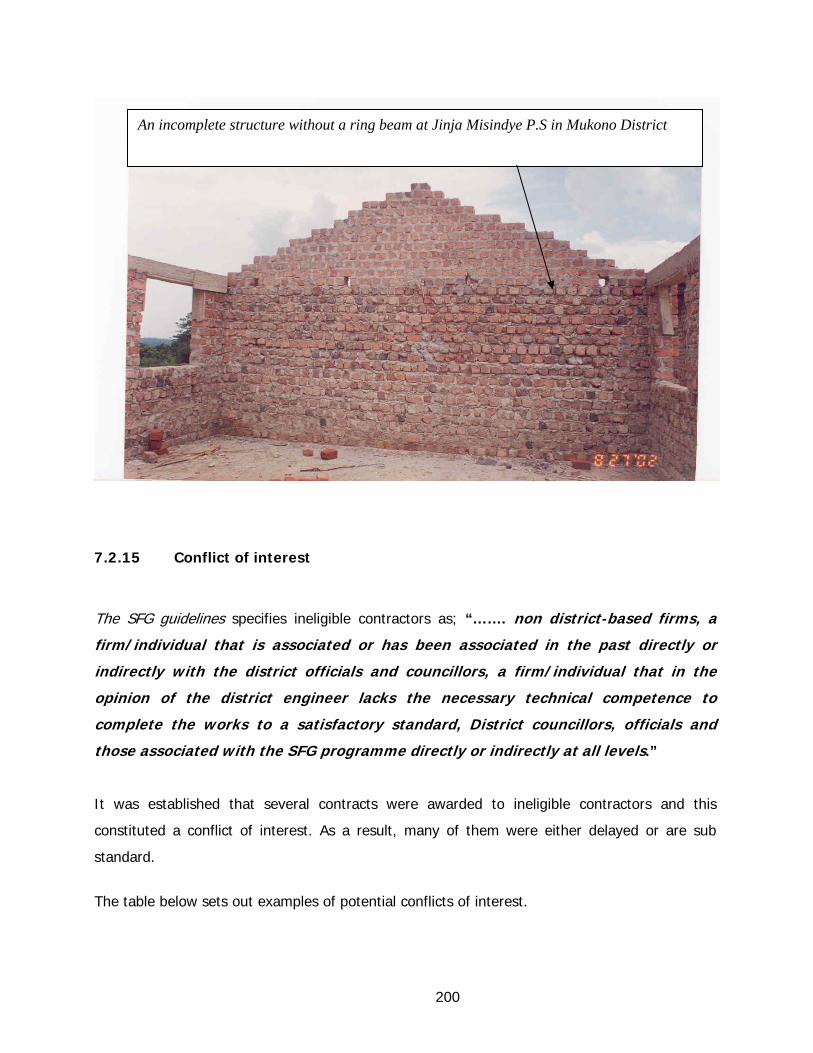
An incomplete structure without a ring beam at Jinja Misindye P.S in Mukono District
7.2.15 Conflict of interest
The SFG guidelines specifies ineligible contractors as; “……. non district-based firms, a
firm/individual that is associated or has been associated in the past directly or
indirectly with the district officials and councillors, a firm/individual that in the
opinion of the district engineer lacks the necessary technical competence to
complete the works to a satisfactory standard, District councillors, officials and
those associated with the SFG programme directly or indirectly at all levels.”
It was established that several contracts were awarded to ineligible contractors and this
constituted a conflict of interest. As a result, many of them were either delayed or are sub
standard.
The table below sets out examples of potential conflicts of interest.
200

Examples of possible conflicts of interest
District School Contractor Relationship Comments
Tororo Kachonga P.S Hamya Ally c/o
Welfare agencies
36 desks
Kachonga Sub-county
councillor to the district
Desks not delivered after 2 years
Tororo Kachonga P.S Ludo Enterprises Area MP Classrooms delayed for over 2 years
Tororo Mabaale P.S,
Butaleja sub-county
Tom Daka C/O
Eseri Contractors
Husband to Nagongera
Councillor
Structure condemned at roofing
stage but 92% payments made
Tororo Manafa P.S in
Mazimasa sub-
county
Mazimasa sub county
councillor
Unsatisfactory work; floor
completely peeled
Mukono Jinja Masindye P.S Chairman SMC Done up to wall plate &
delayed completion /abandoned
for over one month in
September 2002
Iganga Bulunguli P.S Hon Kirunda
Kivejinja / SMC
Contract was signed
between SMC & SMC!
Done up to roofing but fully paid for
and is indicated as commissioned by
P.S MOES
Iganga Mpiita P.S Hon Kirunda
Kivejinja / SMC
Contract was signed
between SMC & SMC!
Several omissions & weak structure
Iganga Kizuba P.S
Councillor at the time of
tender award
Site abandoned
7.2.16 Abuse of facilities
The main intention of classroom construction was to reduce the Classroom: pupil ratio. It was
however noted that in Katakwi District several completed classrooms are used as teachers’
houses. For example in Alogook Primary School two classrooms were being used for teachers’
accommodation yet there were 265 pupils in the P1 class and the teacher’s movement in the
class was inevitably restricted. In addition some pupils were studying under trees. It was also
noted that several other schools are taking up this undesirable practice. This practice is
primarily a result of laxity in school inspection by District officials.
Other schools used the new facilities as stores for grain and charcoal among other things.
201

Conclusion
If this practice goes unchecked, it may frustrate the SFG programme by not improving the
Classroom: Pupil ratio in the beneficiary schools as evident from above.
Recommendation
• It is recommended that the district officials identify the need for teachers’ accommodation
in some schools but in the meantime these classroom should be used for the purpose for
which they were meant and the district monitoring team should always ensure that such
incidences do not recur since this and other such practices delay the achievement of the
desired classroom: pupil ratio.
• MoES should sensitise users on maintenance arrangements after hand over of facilities.
7.2.17 Irrational Allocation of SFG facilities to schools
As earlier pointed out the MoES targets to achieve a classroom : pupil ratio of 1:55 and latrine :
pupil ratio of 1:40 . It was however established that while most schools have not yet achieved
this target, several schools have Latrine: pupil ratio of as low as 1: 25. This may be an
indication that the district officials are not aware of these targets when undertaking the
appraisal. In one case at Butawuka UMEA P.S in Mpigi district, which had 24 latrines, the 2-
stance SFG Latrine was evidently unused and isolated.
It was also noted that schools in Tororo municipality are over built and appear congested with
classrooms. The district administration explained that it was because they receive SFG funds
and yet MoES takes long to approve opening of sites for new schools.
Conclusion
The decision to allocate latrines and classrooms to schools that are not in need is wasteful and
it would have been more effective if these facilities were allocated to more needy schools within
the respective District.
202

Recommendation
• The District appraisal team should always take into account the MoES targets when
recommending allocation of facilities to schools.
• MoES should consider approval of sites identified by Tororo Municipality for construction
of new schools to avoid over congestion.
7.2.18 Diversion of SFG funds
Some schools like Nateete Muslim diverted SFG funds to finance other schools activities and
some funds were misappropriated by the headmaster without any accountability. This is
attributed to ineffective monitoring and laxity by supervisor.
Conclusion:
Such diversions frustrate the SFG programme and offer no value for money
Recommendations
Monitoring should be enhanced and where there are diversions to personal/other use,
appropriate action should be taken by the District Service Commission.
7.2.19 Irrational allocation of monitoring funds per site
A flat figure of Shs 400,000 is released per SFG site in respect of monitoring and supervision
irrespective of the distance covered and conditions endured by the supervisors. As a result
supervisors for schools in municipalities, most of which are within walking distance, are
allocated the same amount of money per site, as those for schools in districts like Kayunga
where some schools are over 100 Km from the District headquarters. Despite the distance,
most roads leading to schools in these remote counties are almost impassable and can only be
accessed using a four-wheel drive vehicle. Naturally these would require more funds for
monitoring than municipalities.
203

Recommendation:
This uniform allocation does not reflect the span and coverage of supervision and MoES should
rationalise the release of monitoring funds to take into account nature and conditions faced by
the respective monitors.
9.2.20 Wide Variations in SFG classrooms for Completion
The classrooms recommended for completion must have a minimum of 33.0Sq. metres. During
this review it was established that sizes of classrooms varied widely as demonstrated in the
table below:
Varied Classroom sizes
School District Dimensions Total Area
Minimum class Size 5.5M X 6M 33.0 Sq. Mts.
St. Ponsiano Kyamula Kampala 4.9M X 6.0M 29.4 Sq. Mtrs.
Ibulanku P.S. Iganga 5.65M X 6.6M 37.29Sq. Mts.
Kachonga Tororo 6.63M X 8.76M 58 Sq. Mts.
Ddegeya P.S Mpigi 4.5M X 5.9M 26.55 Sq. Mts.
Bukoyo Muslim P.S. Iganga 62.9Sq. Mts.
While the minimum area of a classroom for completion was set at 33.0 sq. metres some
structures fell far below this size. For example, at Ddegeya P.S rooms were as small as
26.55Sq. meters and St. Ponsian Kyamula classrooms are as small as 29.4Sq. metres. Not
withstanding the small size of classrooms, the construction works were very unsatisfactory and
value for money was significantly compromised at these sites.
Another observation was in Iganga District where at the same cost per classroom, the work
done at Ibulanku P.S. was of poorer quality than Bukoyo Muslim P.S. yet the classrooms in the
latter are 25.61 Sq. meters larger.
204
Recommendation
Funds committed to completion of facilities should take account of the size rather than the flat
rate that was used irrespective of size. This way, savings would be realised from the very small
structures and channelled to other constructions.
7.2.21 Non-Deduction of Withholding Tax
It is an income tax requirement that districts deduct 4% from all payments above 1 million
shillings in respect of goods and services rendered to districts and this includes SFG contractors.
It was established that in Ntungamo district, Kayunga district and at times Kampala district, this
tax was not deducted. Through this tax evasion, these districts pay more to contractors than
those districts that comply with income tax requirement. This could partly account for the
relatively good work in Ntungamo among other reasons.
Conclusion
In the absence of guidelines on taxes associated with SFG constructions, all districts are
supposed to deduct withholding tax and non-deduction amounts to tax evasion which is illegal.
Recommendation
MoES should explicitly guide districts on the 4% withholding tax
SFG: Conclusion
With the current classroom:pupil ratio of 1:94 against the targeted ratio of 1: 55 the MOES is
far from achieving its targets in this regard. If the above inefficiencies and inadequacies are not
addressed, the MOES objective of providing permanent classrooms with a minimum life of 30
years to as many primary schools as possible will still be unattainable. Furthermore if corrective
action is not taken, a lot of money will continue to be wasted under this programme.
205

9.3 Funds Flow and Management of Capitation Grants
The Capitation Grant is aimed at improving equitable access to basic education by removing the
burden of paying school fees from the parents and enhancing the quality of primary education
by providing resources necessary to run primary schools. This grant is supposed to be provided
to schools for all the 9 school months. The funds flow processes and the eventual expenditure
at schools were examined and it was found that the main threats to better performance in this
area are;
1. Delayed disbursement of funds to schools
2. Inflated enrolments
3. Retention and diversion of funds by districts and schools
9.3.1 Delayed Disbursement of Funds to Schools
It was established that most schools receive funds very late and this inevitably disrupts school
activities. In some cases schools take up to 3 months before schools receiving funds. This is
attributed to either central government that at times delays to make releases to the districts, or
delay by districts to disburse funds to the beneficiary schools.
9.3.2 Delays by Central Government
The capitation grant guidelines require that, “Releases will be made twice in every
quarter: One ninth (1/9th) of the annual budget of UPE grant will be released in the
first month of the quarter to cover implementation during the first month when the
District is compiling the required reports for submission to MoES. The balance for
the quarter will be released in the second month of the quarter”
Despite this guideline, MoFPED delays to release capitation grants to Districts. For instance, the
November 2001 release for Iganga district was transferred to the District grants account on
23/1/02, which is a delay of 2 months. Such delays affect planning at the District and also
trickle down to disrupt school programmes. It is worth noting that many schools either receive
CG towards the end of the school term or long after the school term has ended.
206

9.3.3 Delays attributed to Districts
Delays at the districts are two fold; one is where districts take too long to disburse funds to
schools. For instance, Iganga District received funds in May 2000 but did not disburse them to
schools until 28th August 2000 a delay of 3 months at the district. The second is where districts
fail to submit work plans and progress reports as required by the CG guidelines and therefore
sanctions are imposed on the respective district.
9.3.3.1 Bureaucratic processing of funds at the Districts:
Although S.5.(3).d of the Planning and Implementation Guidelines (Capitation Grant) requires
that Districts should release UPE funds to schools within the first week of receipt from the
central government, most of the Districts / municipalities reviewed do not adhere to this
requirement and often release funds after several weeks or even months. This has resulted in
schools operating on credit and in some cases the few credit suppliers charge them highly for
scholastic materials to compensate for the delay in receiving payments.
Extremes delays from sampled Districts
District Release for the
month of
Date Received
from Central
Government
Date of
disbursement to
schools
Days taken by
District to
remit funds to
schools
Delay
(Allow Max.
7 days)
Ntungamo November 2001 12th Dec 2001 22nd Jan 2002 41 34
Tororo April 2002 5th May 2002 20th June 2002 46 39
Katakwi March 2002 20th Mar 2002 22nd April 2002 33 26
Iganga May 2000 18th May 2000 28th August 102 95
9.3.3.2 Delayed submission of work plans and progress reports by districts.
It was established that some Districts delay to submit the annual UPE workplans, quarterly and
cumulative progress reports and quarterly workplans / budget requests as required by the
guidelines. This automatically leads to delay by MoES to place their financial requests to
MoFPED. As a result of this, some districts have had releases withheld/delayed. For example by
207

10th September 2002 Bundibugyo district had not filed accountability for the 4th quarter 2001/02
(April – June 2002) and its 2nd release of the 1st quarter of 2002/03 was withheld pending
satisfactory accountability. Similarly, the Feb 2002 release for Iganga was withheld until March
2002.
Conclusion
This, in my opinion, is inefficiency on the part of the districts and could be avoided to hasten
the flow of funds from central government to the schools.
Recommendation:
• The current policy of putting sanctions on districts eventually affects schools more than
the District officials who are inefficient in filing accountability documents. It is therefore
recommended that individual accounting officers be sanctioned/held responsible using
disciplinary channels instead of imposing sanctions on districts.
• Districts should endeavour to submit required returns on time.
9.3.4 Inappropriate funds disbursement processes
Whereas there are guidelines on transfer of funds from Central Government to the district,
during this audit it was established that there are no guidelines on how districts should transfer
funds to beneficiary schools. As a result districts use different methods some of which are so
elaborate and delay transfer of funds as demonstrated below.
9.3.5 Mode of transfer of funds to schools
Most Districts reviewed use direct bank transfers to school accounts while others like Kampala
District and Tororo Municipality issue cheques to schools.
In my opinion the practice of using cheques is not only uneconomical in terms of stationery and
bank charges but is also inefficient since it takes schools longer to have these funds available
for their use.
9.3.6 Use of distant banks by Schools
Capitation grants flow from MoFPED (BOU) then to district UCB bank accounts from which they
are transferred to school bank accounts mainly in UCB branches. It was observed that some
schools opt to use banks in other districts when there are nearer UCB branches within their area
208

of location. This makes the transfer process longer and is uneconomical since it increases
transport costs and reduces the amounts available for other administrative activities of the
schools. The table below shows examples of schools in Mukono District that use UCB Nkrumah
road branch yet they have nearer banks within the district.
Examples of schools using distant banks in Mukono District
School Subcounty Bank used
Mugomba P/S Ntenjeru UCB Nkrumah Road – Kampala
Butera P/S Ntenjeru UCB Nkrumah Road – Kampala
St. Posiano Mubanda Ntenjeru UCB Nkrumah Road – Kampala
Namasubi Islamic Kyampisi UCB Nkrumah Road – Kampala
Recommendation
• MoES should advise all districts to adopt the good practice of using direct transfers to
school bank accounts rather than issue of individual cheques to schools since this is faster
and more economical.
• Schools should whenever possible use nearer banks. This will lead to faster processing
and savings on transport.
9.3.7 Allocations to administrative costs
The CG guidelines provide 10% of a school’s CG to meet administration costs which includes
imprest, hire of transport, allowances on official travel, electricity, water, telephones, posters,
head teacher’s official travel and emergencies (e.g. sickness).
It was noted that there are districts without any UCB branch e.g. Kayunga and Katakwi
Districts; all schools receive their capitation grants through UCB Mukono branch and UCB Soroti
branch respectively. This inevitably increases transport costs and in some cases the 10%
provision meant for administration is inadequate to even cover the transport costs alone. For
example, Kiwenda P.S in Kayunga District received Shs.55,000 as CG for the month of June
2002, travel costs alone to UCB Mukono branch is Shs.15,000 to and fro. In comparison there
are schools located within say Mukono town council that do not even incur any transport costs.
209
Another peculiar case was in Kisoro where each school has 3 signatories to the account and in
some cases they are all required to travel to the bank from as far as Nteko P.S in Nyabwishente
sub-county to Kisoro town which is about 60Km. They spend over Shs 30,000 in transport alone
which is over 15% of the CG release.
Recommendation
MoES / District should address these exceptional cases since they deprive the programme of a
lot of money on transport costs and reduce the amounts available for other school activities.
9.3.8 Inadequate/Ineffective monitoring
The planning and implementation guidelines require that MoES, MoFPED and MoLG are
responsible for the monitoring and evaluation of UPE implementation at the national level while
the DEO/MEO, DIS/MIS and the CIA must carry out supervision and monitoring visits to schools
to assess compliance with guidelines, value for money and financial accountability.
It was established that monitoring is still lacking and this has resulted into the following
situations;
9.3.8.1 Inflated enrolments
Districts are supposed to release capitation grants to schools based on the number of pupils at
the beginning of the first term. It was established that some schools had inflated enrolments as
deduced from two anomalies;
• The first is where the enrolment submitted to the District was far higher than the highest
attendance recorded in the registers at the schools
• The second anomaly is where releases to schools from the District exceeded the schools’
entitlement given its enrolment.
The table below shows schools that had possible inflated enrolments since the pupil attendance
registers and funds received were not in line with the enrolment.
210

Possible inflated enrolments
Districts School Pupil
Enrolment
at District
Pupil Enrolment at
school
Entitlement
due as per
enrolment
Amount
received from
District in
2002
Overpaid
amounts
Kayunga Wabwoko P.S
P1-P3 = 857
P4-P7= 610
Total: 1,467 Pupils
1,024,635 Feb =1,376,285
Mar: 1,376,285
Apr: 1,175,000
Feb : 351,650
Mar: 351,650
Apr: 150,365
Kayunga Namatala P.S
468 Highest Attendance=
303
P1-P3 = 200
P4 – P7 = 103
281,000 Feb = 614,630
Mar = 614,630
Apr = 504,816
June = 431,005
Feb: 333,630
Mar: 333,630
Apr: 223,816
June: 150,005
Katakwi Odiding P.S 331 No evidence of
pupils
Nil Feb, Mar & Apr
= 689,585
Feb, Mar &
April: 685,585
This practice of inflating enrolments and subsequent release of funds to schools in respect of
non-existent pupils is wasteful and no value for money is realised.
9.3.9 Retention of UPE funds at the District
S.3.3.vii of the guidelines on policy, roles and responsibilities of stakeholders in the
implementation of UPE requires that District authorities should ensure that all the UPE funds
reach schools without retaining any at District headquarters. This is amplified by S.5.3(e) of the
UPE capitation grant guidelines which require that “ …… no credits will mix up two or
more UPE funds releases. No balances should be retained on any UPE release (to be
mixed up with the subsequent release) without the express written authority from
MoES.” During this review it was established that most of the Districts sampled did not release
to schools all funds received from MoFPED. This part retention of releases implies that schools
receive less funds than allocated to fund their budgeted activities.
In some months, Tororo and Ntungamo Districts received CGs before disbursing the previous
release to schools (Mixing of releases). Management explained that funds received are
211

sometimes too little to be disbursed to schools thus the need to wait for another release so that
schools receive substantial amounts. This explanation was however not satisfactory because
any release however small would enable the schools offset some of their obligations given the
fact that schools often take credit for scholastic materials due to delays in receiving funds. The
main cause of this anomaly is ineffective monitoring by MOES as this would ensure compliance
with guidelines and generate more accurate enrolments.
9.3.10 Diversion of UPE funds by the Districts/Schools
Under S.4.3 of the guidelines on policy, roles and responsibilities of stakeholders, it is the
responsibility of the RDC, CAO and head of inspectorate to monitor and ensure proper use of
UPE grants.
During the course of this audit, probable cases of diversion and unauthorised reallocation were
noted. In Ntungamo District, capitation grants for the month of November 2001 were
transferred to the SFG account on 12/12/01 and diverted to SFG activities. These funds were
reimbursed to the UPE account in January 2002 and schools took two months before receiving
this money. Diversion at school level was noted at Muhanga P.S in Kisoro District where the
head-teacher received a block release of four months i.e. March – June 2002 and arrears for
July 2001 amounting to Shs 1,992,309. The head-teacher duly made accountability for all the
funds. On verification however, it was established that many of the items indicated as
purchased were not delivered. On the contrary, items delivered were not part of the budget
approved by the finance committee and most receipts in support of these purchases had
inflated prices.
These diversions and unauthorised reallocations are mainly attributed to ineffective monitoring
by the relevant officials and deprive schools of much needed resources.
9.3.11 Financial Management at schools
S.5.6(a) of the CG guidelines and S.9.7(a) of the SFG guidelines require that each of these
grants must have a separate bank account as a precondition for a school to benefit from these
212

grants. In most schools visited, a separate account was maintained for SFG while a single
account was maintained for handling CG and teachers’ salaries and all other financial
transactions. There were a few extremes like Olekai P.S in Katakwi District where a single
account was maintained for SFG, CG, Teachers’ salaries and all financial transactions of the
school. As a result, funds meant for SFG may be used for capitation grants or other non- SFG
activities.
In my opinion, the existence of these anomalies is attributed to inadequate appraisal of schools
before they benefit from these grants and the ineffective monitoring by district officials.
9.3.12 Unfacilitated Monitoring
Kampala District decentralised the education office to division level, Division Education Officers
were duly appointed by the District and tasked among others with monitoring UPE funds. Part
of their work is to verify and certify accountabilities submitted by schools.
During the course of this audit, it was established that these division education officers hardly
go to the schools to confirm procurements that would be a basis for certifying accountabilities.
They explained that no funds are availed by the District to the divisions for monitoring and any
monitoring done is at the initiative of the division from the divisional revenue, which is often
limited. In addition Division Education Officers are neither involved in selection of SFG
beneficiary schools nor in the monitoring of sites within their divisions.
Conclusion
The achievement of UPE objectives is largely dependant on good financial discipline by both
schools and Districts. Any diversion or reallocation of UPE funds would directly affect beneficiary
schools, which would not be in position to obtain the necessary scholastic materials and
facilities in time. Without effective and adequate monitoring, the above anomalies will continue
to hamper the UPE programme.
213

Recommendations
• The Districts and MoES should conduct more effective monitoring of the UPE programme
as specified in the planning and implementation guidelines as well as in the guidelines on
policies, roles and responsibilities of stakeholders. It should be result oriented rather than
the current accountability oriented system. This will enable capture of more accurate
enrolment information, control and prevent diversions and unnecessary retentions as well
as offer financial management support to districts and schools.
• Given their proximity to schools, Division Education Officers in Kampala District are likely
to be more effective and economical if facilitated to do the monitoring of CG and SFG
sites, which is currently done by the District officials.
• Punitive action may be considered against school / district officials who deliberately inflate
enrolments since no value for money accrues to stakeholders from funds spent on non-
existent pupils.
• MoES should offer guidance to districts where shortfalls in release are experienced.
9.3.13 Capitation Grants released to Private schools
On inception of the UPE programme, there was an increase in enrolment in primary schools and
in a bid to cope with this enrolment, GOU approved CG support to private schools that accepted
to take on pupils under the UPE scheme. This however ceased at the beginning of financial year
2002/03.
During this VFM audit review, it was established that this arrangement was difficult for MoES to
administer since the pupils were still required to pay fees and these schools hardly accounted
for capitation grants. In addition the UPE component received by these schools was too small
and they could afford to disregard this government contribution. As a result some schools in
Kampala District left their cheques uncollected until they went stale.
Conclusion:
In my opinion, this scheme was not effective and little value was achieved from this
arrangement since it did not guarantee free education for pupils enrolled in these schools.
214

Funds would have been more effectively used if they were allocated to the more needy
government aided schools.
Recommendation
In future MoES should undertake comprehensive appraisal of its partners before committing
funds to activities that may not be effective in achieving its intended objectives.
9.4 SCHOOL FACILITATION GRANT: TECHNICAL APPRAISAL REVIEW
9.4.1 Introduction
This section contains findings from review of the SFG general and technical guidelines and the
evaluation done on the various sites inspected with the objective of assessing whether;
a) The school construction programme had been properly planned at the beginning of the
programme by the Ministry of Education and Sports
b) The design of the schools was acceptable and the drawings produced adequate to attain
the objectives of the SFG
c) The quality of the schools and classrooms built was of acceptable quality and met the
requirement that the facilities have a useful life of at least 30 years
A technical team undertook this evaluation by reviewing documents/guidelines used for the
execution of the works and carrying out physical inspection and on site physical tests of
materials used for construction at the 140 randomly selected sample schools in 10 districts.
9.4.2 Methodology
The following methods were used when undertaking this review:
a. A general review of the available documentation from the Consultants to ascertain
completeness, consistency and compliance to the established standards and by-laws.
b. A three–way interaction between the Engineering Assistants from Ministry of Education
and Sports, based at the various Districts; the local community at the sites visited and the
technical review team.
215

c. An in-depth examination and review of the documentation from the different disciplines,
namely Architectural, Structural, Electrical and Quantity Surveying to ensure compliance
to the set building standards.
d. Analysis of the collected information.
e. Conclusions and Recommendations based on the findings by the team.
9.4.3 AUDIT FINDINGS
9.4.3.1 Soil and site Investigations
a. Documentation Review
A review of the drawings indicates that there may not have been thorough investigations prior
to producing the designs. This can be observed when one looks at the design for the foundation
where a single design is provided for the whole country with the exception of the earthquake
prone areas. Whereas districts have different soil types, this appears to have been overlooked
at the design stage in which case sample site investigations should have been carried out
before coming up with the foundation designs.
b. Site Investigation
This is an all embracing term covering every aspect of the sites under investigations. The
consultant should have collected and recorded all the necessary data needed to help in the
design and construction process of the proposed works.
c. Soil Investigation
The purpose of carrying out soil investigation is to:
• Determine the suitability of the various sites for the proposed project.
• Determine the adequate and economic foundation designs.
• Determine the difficulties that may arise during the construction process.
• Determine the occurrence and / or cause of changes in soil conditions.
9.4.3.2 Observation
There is no evidence that the investigations in (b) and (c) above were carried out. The
foundations and all other components of the structures are uniformly designed for all places
with exception of the earthquake prone areas as can be noted from the Technical Handbooks.
The absence of proper structural designs has resulted into the structures developing multiple
cracks especially at the windows and other parts of the walls, including the gable ends. In
216

several cases, cracks were noted running from the top of the walls to the foundations. The
cause of this in some cases is certainly due to differential settlement, which was not properly
addressed. This problem is best witnessed in Nakasongola District at Busoona Primary School,
which is in a swampy area near the shores of Lake Kyoga. Here the walls for classrooms are
excessively cracked and are failing making the classrooms unsafe to be used by pupils. The pit
latrines on the same site failed completely. The sides of the excavation collapsed into the pit
and the hanging slab and walls are cracked all over and stand condemned.
Another typical structural failure was noted in Kisoro District where the soils are of volcanic
origin and lack substantial amount of clay to bind the soil particles together. At Kibugu Primary
School two pit latrines failed with pit sides collapsing. In these cases the design should have
provided for wider foundations for the classroom blocks and the pit latrines should have been
lined with block work from the bottom. Whereas the soil types were ignored for classrooms and
the pupils’ latrines, this to some extent was taken into account when designing the teachers’
houses and latrines.
Since this project involves colossal sums of money, The Ministry of Education and Sports should
have ensured that the bearing capacities of soils from the various locations are checked. (N.B:
Facilities for such tests are available at The Central Materials Laboratory in Kireka under the
Ministry of Works, Housing and Communication). This would enhance the quality and safety of
the structures.
9.4.3.3 Classroom Designs
a. Earthquake Zones
The structures in these areas are designed to have reinforced concrete columns. One peculiar
case of vertical cracks was noted at Rubona Primary School in Kisoro District where cracks even
run through a purportedly reinforced concrete column. Technically this is not possible and one
could not tell exactly whether there was truly reinforcement or not. Such failures can only be
clarified by carrying out further detailed investigations.
217

b. Floors and Verandas
i) Ground Floor slabs.
The floor slab was designed with a thickness of 75mm and reinforced with BRC mesh as shown
on the drawings. A look at the materials schedule shows that the BRC mesh is not allowed for
(not costed), except for earthquake prone areas. The standard thickness of a ground floor slab
should be 100mm if it is not reinforced. The 75mm thick unreinforced slab is therefore one of
the causes for the rampant cracking of the floors noted. Furthermore, there is inconsistency in
the documents and non-compliance with building standards in this respect.
ii) Floor Concrete
Secondly, the drawings indicate 5mm thick screed on the floor concrete. This is far thinner than
the minimum recommended thickness of 25mm, unless the designer wanted this screed to be
done monolithically, which was not specified in the guidelines. This inadequate thickness is also
another cause of the excessive cracking and peeling off of floor screed at the schools visited. It
should be noted that such final finishing of the floor cannot be done before walling if it is to be
done monolithically, since it would be damaged by the end of the construction.
iii) Verandas and Splash Aprons
The technical handbook gives two options of constructing the splash apron. One peculiar option
requires the use of stone chipping on compacted murram without concrete / screed. Such an
apron is not durable and will not last the recommended minimum of 30 years and in addition it
does not prevent grass from growing around the building. In our opinion this is not viable and
should not be given as an option.
Another irregularity noted was that the guidelines do not require use of hard core at the
verandah below the concrete (ref. To drawing PP/MOE – 3A). This is a major cause of cracking
of verandas as the concrete slab settles as noted on several classroom blocks inspected.
d) Walls
The walls are designed to have height from ground floor level to the top of ring beam of 2.6m
and this is also the roof level. This is contrary to the standards, which recommend a roof level
height to be at least 3.0 m for classrooms. Such low roof levels have led to poor ventilation and
218
darkening of the inside of classrooms. This is worsened by providing a wide verandah
recommended by the technical handbook. In some cases contractors misinterpreted the
drawings and provided eaves of over 1.2 m wide at the rear of the buildings.
The low roofs also lead to overheating inside the classrooms, since no ceiling is provided. Due
to this, some districts like Ntungamo raise the level of the wall plates to a height of 3.2 m.
Although this is good, it has cost implications, which have not been catered for by the
guidelines. This has forced contractors to do substandard work in other aspects of the
construction like poor mortar mixes to compensate for the extra work on the higher walls and
this compromises the strength of the walls. This is possibly one of the reasons for the
substandard works and such constructions are prone to failure and expose the pupils to risk of
injury.
e) Windows
Quite a good number of windows are provided and according to the specification they have
rebates for future fixing of shutters. In some districts like Kisoro, due to strong winds and rains,
shutters had to be introduced immediately to safeguard the roofs from being blown off.
However, these windows are designed with no vents on top as part of the window frame or as
permanent vents over since immediately above the window frame is a ring beam onto which,
the roof is anchored. This certainly cuts off ventilation and it is in violation of Schedule 1 of the
Building Regulations. This poor ventilation will later cause dry rotting to the roof timbers
especially during periods when the schools are closed for holidays.
f) Roofs
According to the drawings, roof trusses are supposed to be at 2000mm centre to centre. This
means that a two-classroom block would have 6 trusses while a two-classroom block with an
office and store would have 7 trusses. However the schedule of materials makes no distinction
between the two types of classroom blocks and indicates 6 trusses for both. Whereas the
schedule of materials shows same number of trusses for the two structures, it gives different
cost estimates for the trusses. This therefore is an inconsistency in the technical guidelines.
219
g) Roof Overhangs
Roofs are designed to have roof overhang supports, which are presumably for providing extra
lateral support to the roof. Whereas the guidelines require these overhang supports to be
bolted to the walls, no details are shown for the bolting and no cost estimate is allowed for and
where they have been provided they are merely nailed to the adjacent roof trusses and not
bolted. This therefore means that they are not offering the extra support intended and
compromise the durability of the roof.
h) Gussets
Gussets are mentioned and costed in the schedule of materials but no details of them are
shown on the drawings as to how and where they are supposed to be fixed or used.
i) Lightening Protection
Unlike for staff houses, the Technical Handbook for classrooms makes no provision for
lightening protection and this puts the children’s lives at risk. For instance, at Kawoomya R/C
P.S in Mukono District, a classroom block under construction was struck by lightening and as a
result the wall had developed multiple cracks. These conductors should be provided even for
classrooms.
j) Soft Boards
The Technical Handbook provides for only one soft board (pin board) for a two-classroom block
without mention of where it is supposed to be fitted. Is it for one of the classrooms? Or outside
the classroom? Is it for the whole school? Or is it for the office? If it is supposed to be per
classroom then this should be reflected in the costing.
k) Cost Estimates and Availability of Materials
The sources of local materials like bricks, sand timber, etc are presumed to be readily available
at the respective localities, but this is not actually the case. Another fact that was over looked
during the design stage was that some locally produced materials are even more expensive
than those that are manufactured elsewhere. This is exemplified in a District like Nakasongola
where one finds it cheaper to use a solid steel door than one made out of timber.
220

l) Choice of Materials
It was noted that some districts like Nakasongola are heavily infested by termites, which have
devastated vegetation and buildings. In such areas, it is important to substitute wooden
windows and doors with metallic ones, since those fixed are already being eaten away. For this
reason, some materials recommended in the guidelines cannot be used in some localities,
hence the need for use of alternative materials. Although an anti termite projection is provided,
this was done only for new constructions and the treatment of termites was not considered for
the structures started by the parents and completed under SFG.
m) Accessibility of Sites
The SFG guidelines require that sites selected for construction should be easily accessible to
vehicular traffic. However, it was noted that quite a good number of schools in the remote and
mountainous districts like Kisoro do not even have Community roads for access to the schools.
At Kibugu Primary School the team had to walk for at least 10km to and from the school, using
footpaths through gardens.
In this place not even a bicycle can be used as a means of transporting materials to the site.
This therefore implies that the contractor has to employ labourers to carry the materials over
that distance to the site. This turns out to be costly in terms of time and money, yet such
allowances are not catered for in the cost estimates and in some cases are much higher than
the contingency provided.
n) Title Block
A review of the Title block does not give the following responsible signatories; “designed by”,
“checked by” and “approved by”. We could therefore not ascertain whether these drawings
were checked and approved by competent authorities.
9.4.3.4 Latrines
i. Pit Latrine Drawings.
The drawing of a five-stance pit latrine shows a urinal and its outlet. The details for the drain
and soak pit are not given nor are their costs included. In many cases the urinals drain in the
221

open, which constitutes a health hazard. In other cases the contractors construct the urinal
such that it drains into the pit latrine. No wire netting is provided for the inlet pipe into the
latrine. This means that the inlet would also serve as an access for houseflies, which are
supposed to be eliminated. It was also observed that no urinals are provided on a two-stance
latrine and in our opinion this is where it is more needed than where there are five-stances.
ii. Latrine Costing
a. Schedule of materials
The team established that there was no costed schedule of materials recommended for the
pupils’ latrine but instead a fixed sum of Shs 700,000 per stance is allocated irrespective of the
region. This in our opinion was a major omission since it left a lot of discretion to the
contractors. This to some extent limited the scope of analysis in this area. It is recommended
that the technical guidelines be revised to include this schedule.
b. Cost Estimates
A close look at the cost estimates for a two-stance pit latrine for the teachers’ house in Zone
One is Shs.3,101,306 while, the cost estimate for a 2-stance pit latrine for the pupils costs
Shs.1,400,000. If the bills of quantities were derived on the same basis there should be no
reason for this wide discrepancy in the total cost estimates for the two types of latrines.
c. Hand Washing Facilities
Whereas the technical handbook for teachers’ houses provided for hand wash facilities during
these inspections we did not come across any teachers’ house with the hand wash facilities yet
these are provided for and costed.
In addition there was no provision for hand washing facilities for the pupils, yet they are more
vulnerable to diseases and need more facilitation to enhance good sanitation.
222

d. Costs for Teachers’ latrine
The schedule of materials and costs for the teachers’ latrine implies that the estimates are for a
2-stance latrine yet the grand total is for 5-stances. Such inconsistencies mislead users as to
whether the costs are for 2 or 5 stances.
e. Drop Hole Cover
In order for vent pipes to protect against houseflies, drop holes should be covered. In almost all
the schools inspected, the drop holes were not covered allowing houseflies easy access in/out.
This is worsened by use of cowls instead of wire netting on the vent pipes since these have big
gaps and offer easy access for the houseflies.
f. Vent Pipe
Some of the drawings show one vent pipe for a 5-stance latrine block while one drawing
provides a vent pipe per stance i.e. 5 pipes for a five-stance latrine. This is a conflict in the
drawings and during this inspection we did not come across any latrine that had a vent pipe per
stance. Inevitably contractors chose the drawing that would minimise costs and in the absence
of any bills of quantities of the pit latrine, we were unable to establish what the drawings
intended.
In addition, the cost of the vent pipe is not reflected anywhere and there is no specification at
all for it. So at some schools, contractors used very light gauge, which can even be deformed
with a hand and some are already damaged.
g. Disabled Facility
The details for the disabled facility are not shown on the drawing for teachers’ latrine, yet a
cost estimate can be sited in the materials schedule. This is another inconsistency in the
documents.
h. Latrine Walkway
The section through the latrine shows that there is no hardcore to be placed below the concrete
for the walkway. This therefore is one of the causes for the numerous cracks noted on many of
the latrines visited, where the concrete slab at the walkways is failing.
223
i. Estimation of Materials
There is under estimation of some materials. For example the exact length of the fascia board
for a two-classroom block is 53.8 m long but the materials schedule gives 50.4m long. This
means a full length of a piece of timber was left out. Such omissions lead to shortfalls in the
overall costs.
Wrong dimensions are also given for the 5-stance latrine drawing, for the side width where the
overall dimension should be 2800 mm, but the drawing shows it as 5600 mm, twice as big.
Similarly the length of the front elevation for a teachers’ latrine is given as 6.65m instead of
2.25m. In both these cases costs may have been overestimated.
9.4.3.5 TEACHERS’ HOUSES
The staff houses have not yet developed very serious defects as most of those inspected were
still under construction. However, the defects similar to those identified on the classroom blocks
were noted on the teachers’ house at Agururu P.S in Tororo District, which had developed
cracks at the gable ends.
The following were noted that need urgent attention and review.
a. Kitchen
A look at the spacing of roof trusses indicates that there is one truss along gridline B-B that is in
the middle of the chimney. This truss is definitely exposed to the risk of fire and so is the entire
kitchen. This can be verified at the teachers’ house at Agururu P.S in Tororo Municipality.
b. Rain Water Harvesting Tank
The technical handbook gives a detailed drawing of a 10,000-litre water tank. However in the
cost estimates the amount given is for a 5,000-litre tank. This is yet another inconsistency in
the documentation.
9.4.4 CONCLUSIONS
The above observations represent inconsistencies in the technical guidelines, oversights,
omissions and inappropriate designs. All these point to inadequate planning of the programme
at inception. As a result of inappropriate designs and compromised quality at implementation
many of these structures will not last the expected minimum life of 30 years.
224

9.4.4 RECOMMENDATIONS
• It is recommended that MOES reviews the technical guidelines to address the
inadequacies noted above and such reviews be carried out, reviewed and checked by
competent authorities. This will ensure that some emphasis is put to the quality rather
than the numbers of structures constructed under the programme.
• There is urgent need to address some defects that render the structures risky for the
occupants. For instance the teachers’ house at Amagoro P.S whose lightening conductor
passes inside the house. Also there is need to revise the drawings for the timber trusses
in the teachers’ kitchens to ensure that none is placed in the chimney.
• It is also recommended that training of contractors should be done to enhance better
interpretation of guidelines and as well build capacity in line with PAF objectives.
• Contractors who exhibit incompetence and put up substandard structures should be
obliged to correct all defects at their own cost and be excluded from any future
contracts.
225
GLOSSARY OF TERMS:
Abattoir/slaughter house
Means premises used for the slaughter of animals for consumption or for feeding animals, these premises should be approved by the veterinary administration.
Active Surveillance
Means purposeful and comprehensive searching for evidence of disease in animal populations or for verification that such populations are free of specific diseases. Active disease surveillance programmes may be of a catch-all nature to detect any significant disease occurrences, targeted against specific high-threat diseases or designed to monitor the progress of individual disease control or eradication campaigns.
Animal Means a mammal, bird or bee.
Animal Check point
Means examination posts or barriers marked with signs bearing letter “Q” placed on highways also known as National Stock Routes in high animal disease risk areas. The animal check points operated are either fixed or mobile.
Animal for slaughter
Means an animal intended for slaughter within a short time, under the control of the relevant veterinary authority.
Animal Holding Ground
Means a place for isolation and quarantine for animals.
Animal Quarantine station
Means a facility under the control of the veterinary authority where animals are maintained in isolation with no direct or indirect contact with other animals to prevent the transmission of specified pathogen(s) while the animals are undergoing observation for a specified length of time and if appropriate, testing and treatment.
Arrears: Means and refers to (NWSC) accounts receivables of more than 30 days.
Border post Means any airport, or railway station or road check point open to international trade of commodities, where import veterinary inspection can be performed.
Breeding birds Means birds kept for the purpose of producing hatching eggs.
Case Means an individual animal infected by a pathogenic agent, with or without clinical signs.
Commissioner Means the commissioner for livestock health and entomology.
Control programme
Means a programme which is approved and managed or supervised by the department in MAAIF for the purpose of controlling a vector, pathogen or disease by specific measures applied throughout the country, or within a zone or in Uganda.
Crushes Means strongly built stall or cage for holding cattle safely while they are examined, marked, given veterinary treatment or calves are fed.
Day old birds (poultry)
Means birds aged not more than seventy two hours after hatching.
226
Department Means the department of Livestock Health and Entomology in the Ministry of Agriculture Animal Industry and Fisheries.
Diagnosis Means the systematic identification and investigation of a disease from its signs and symptoms.
Disease Means the clinical and /or pathological manifestation of an infection.
Disease free zones Means a zone in which the absence of the disease under consideration has been demonstrated by the requirements specified in the terrestrial code for free status being met within the zone and its borders, appropriate official veterinary control Is effectively applied for animals and animal products and their transportation.
Disinfection Means the application, after thorough cleansing, procedures intended to destroy the infectious or parasitic agents of animal diseases, including zoonosis; this applies to premises, vehicles and different objects which may have been directly or indirectly contaminated.
Disinfestations Means the application of procedures intended to eliminate arthropods which may cause disease or are potential vectors of infectious agents of animal diseases including zoonoses.
Early detection system
Means a system under the control of the veterinary services for the timely detection and identification of animal diseases characteristics of the system include:
a) Representative coverage of target animal population by field services.
b) Ability to undertake effective disease investigation and reporting
c) Access to laboratories capable of diagnosing and differentiating relevant
d) a training programme for Veterinarians and Para Veterinarians for detecting and reporting unusual disease occurrences.
Epizootic Means a disease that appears in animal populations.
Eradication Means the elimination of a pathogenic agent from a country or zone.
Fire Hydrant: This is a connection that provides access to a water supply for purposes of fighting fires.
Incidence Means the number of new cases or outbreaks of a disease that occur in a population at risk in a particular geographical area within a defunct time interval.
Infected zone Means a zone in which the absence of the disease under consideration has not been demonstrated by the requirements specified by the terrestrial code or veterinary authorities as being met.
Infection Means the presence of the pathogenic agent in the host.
Laboratory Means a properly equipped institution or family staffed by technically competent personnel under the control of a specialist in veterinary diagnostic methods who is responsible for the validity of the results.
227
228
Livestock Is defined by the department as all animals of veterinary interest that have economic value other than Wild life. For the purpose of this audit, Livestock is limited to cattle, goats, sheep, pigs and poultry.
Livestock markets Means place designated and approved by authorities. For trade in livestock and livestock products, under the control of a veterinary authority.
Monitoring Means the continuous investigation of a given population or subpopulation and its environment, to detect changes in the prevalence of a disease or characteristics of a pathogenic agent.
Non-Revenue Water:
Means and refers to the ratio between non-billed water to water produced (m3).
Notifiable disease Means a disease listed by the commissioner. As soon as it is detected or suspected, it must be brought to the attention of the commissioner in accordance with the Animal Disease Act.
Notification Means the procedure by which the commissioner is informed about the occurrence of an outbreak of disease or infection, according to the provision of the Animal Disease Act.
Outbreak of disease or infection
Means the occurrence of one or more cases of a disease or an infection in an epidemiological unit.
Passive Surveillance
Means the routine gathering of information on disease incidents from sources such as requests for assistance from farmers, reports from field veterinary officers and livestock officers, submission of diagnostic specimens to laboratories and the results of laboratory investigations. Routine disease reports may also come from other sources such as abattoirs and livestock markets.
Prevalence Means the total number of cases or outbreak of disease that are present in a population at risk, in a particular geographical area at one specified time or during a given period.
Ring Vaccination Means the rapid creation of an immune belt around an infected area.
Routine Strategic Vaccinations
Means a vaccination of a high risk area based on a risk analysis.
Suppressed Accounts:
Accounts off-supply.
Surveillance Means the investigation of a given population or sub-population to detect the presence of pathogenic agent or disease. The frequency and type of surveillance will be determined by the epidemiology of the pathogenic agent or disease and the desired output.
Vaccinations Means the successful immunisation of susceptible animals through the administration of a vaccine comprising antigens to the disease to be controlled.
Valley Dams Means big open water reservoirs found between valleys.
Zoonosis means any disease or infection which is naturally transmissible from animals to humans.