OFFICE OF THE ACTUARY The Impact of the Affordable Care Act on Health Care Spending John D. Shatto,...
40
OFFICE OF THE ACTUARY The Impact of the Affordable Care Act on Health Care Spending John D. Shatto, FSA October 8, 2010
-
Upload
esmond-rodgers -
Category
Documents
-
view
214 -
download
0
Transcript of OFFICE OF THE ACTUARY The Impact of the Affordable Care Act on Health Care Spending John D. Shatto,...
OFFICE OF THE ACTUARY
The Impact of the Affordable Care Act on Health Care Spending
John D. Shatto, FSAOctober 8, 2010
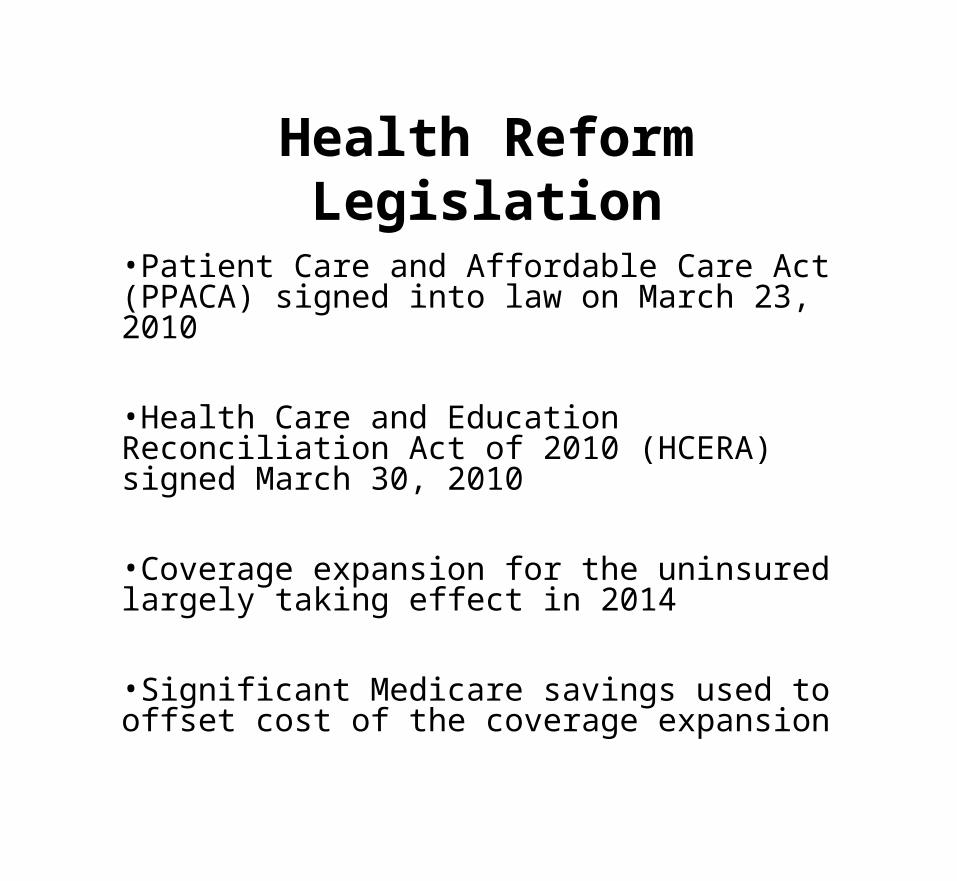
Health Reform Legislation
•Patient Care and Affordable Care Act (PPACA) signed into law on March 23, 2010
•Health Care and Education Reconciliation Act of 2010 (HCERA) signed March 30, 2010
•Coverage expansion for the uninsured largely taking effect in 2014
•Significant Medicare savings used to offset cost of the coverage expansion
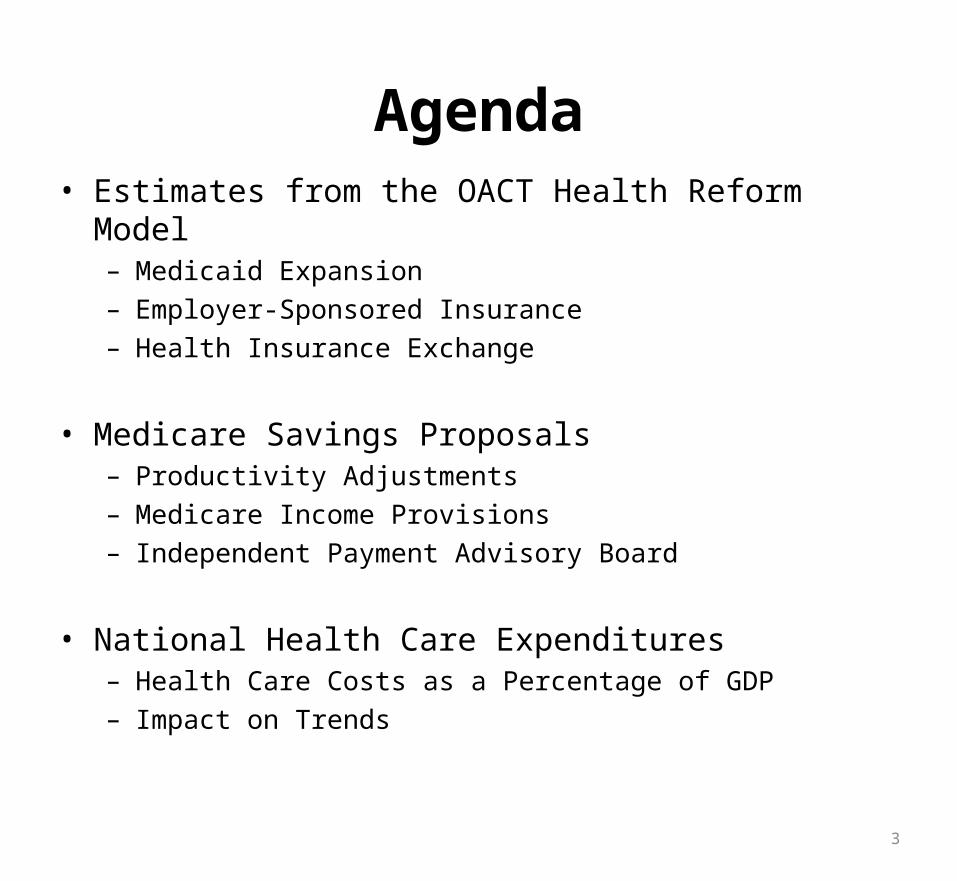
Agenda• Estimates from the OACT Health Reform Model
– Medicaid Expansion
– Employer-Sponsored Insurance
– Health Insurance Exchange
• Medicare Savings Proposals– Productivity Adjustments
– Medicare Income Provisions
– Independent Payment Advisory Board
• National Health Care Expenditures– Health Care Costs as a Percentage of GDP
– Impact on Trends
3
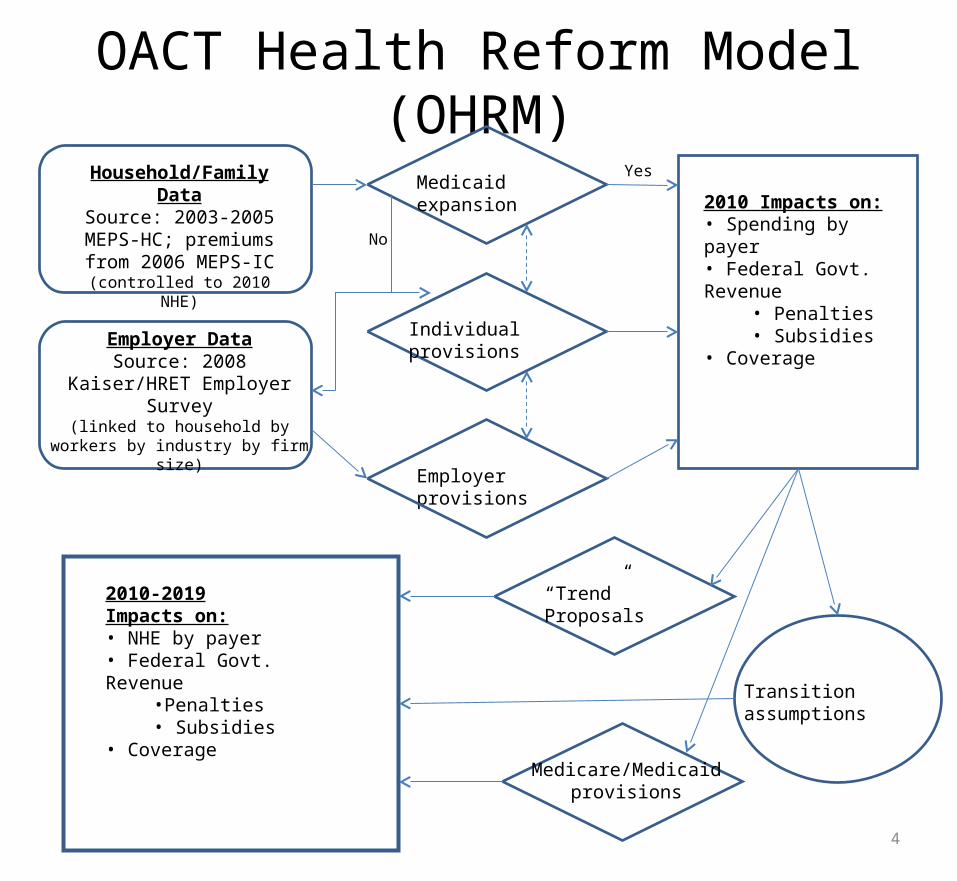
OACT Health Reform Model (OHRM)
4
Household/Family DataSource: 2003-2005 MEPS-HC; premiums from 2006 MEPS-IC
(controlled to 2010 NHE)
Employer DataSource: 2008 Kaiser/HRET
Employer Survey(linked to household by workers by
industry by firm size)
2010 Impacts on:• Spending by payer• Federal Govt. Revenue
• Penalties• Subsidies
• Coverage
Medicaid expansion
Individual provisions
Employer provisions
Yes
No
“Trend” Proposals
Transition assumptions
2010-2019 Impacts on:• NHE by payer• Federal Govt. Revenue
•Penalties• Subsidies
• Coverage
Medicare/Medicaid provisions
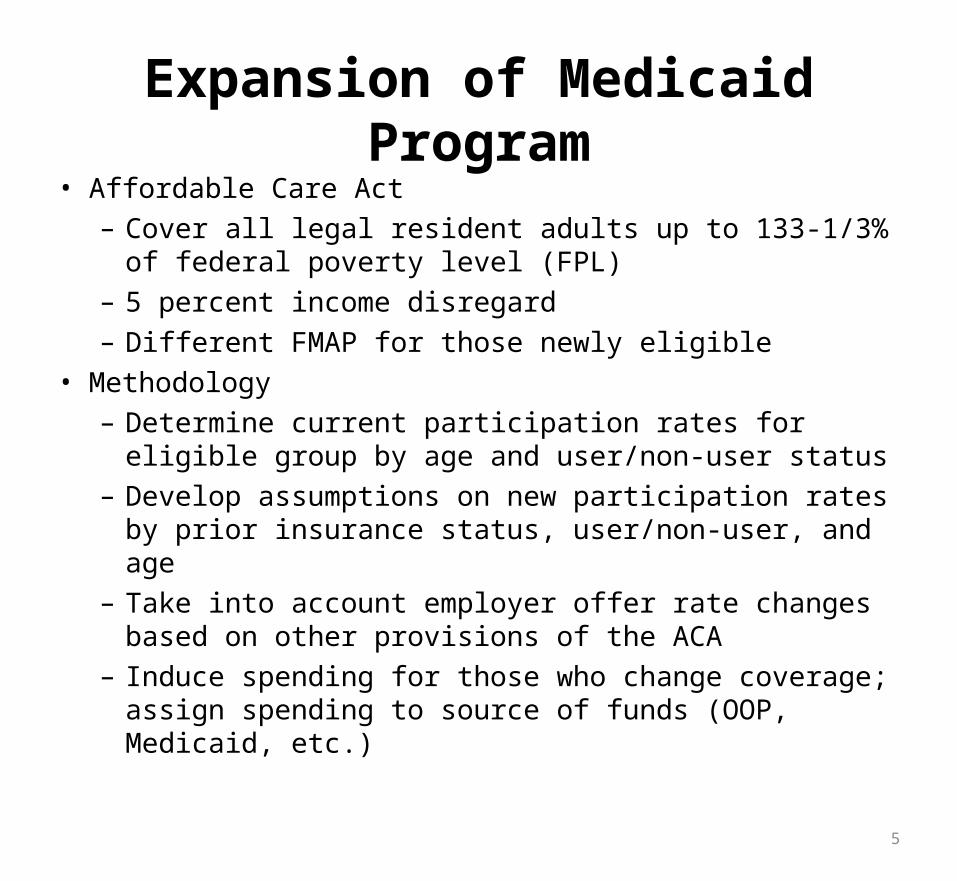
Expansion of Medicaid Program• Affordable Care Act
– Cover all legal resident adults up to 133-1/3% of federal poverty level (FPL)
– 5 percent income disregard
– Different FMAP for those newly eligible
• Methodology
– Determine current participation rates for eligible group by age and user/non-user status
– Develop assumptions on new participation rates by prior insurance status, user/non-user, and age
– Take into account employer offer rate changes based on other provisions of the ACA
– Induce spending for those who change coverage; assign spending to source of funds (OOP, Medicaid, etc.)
5
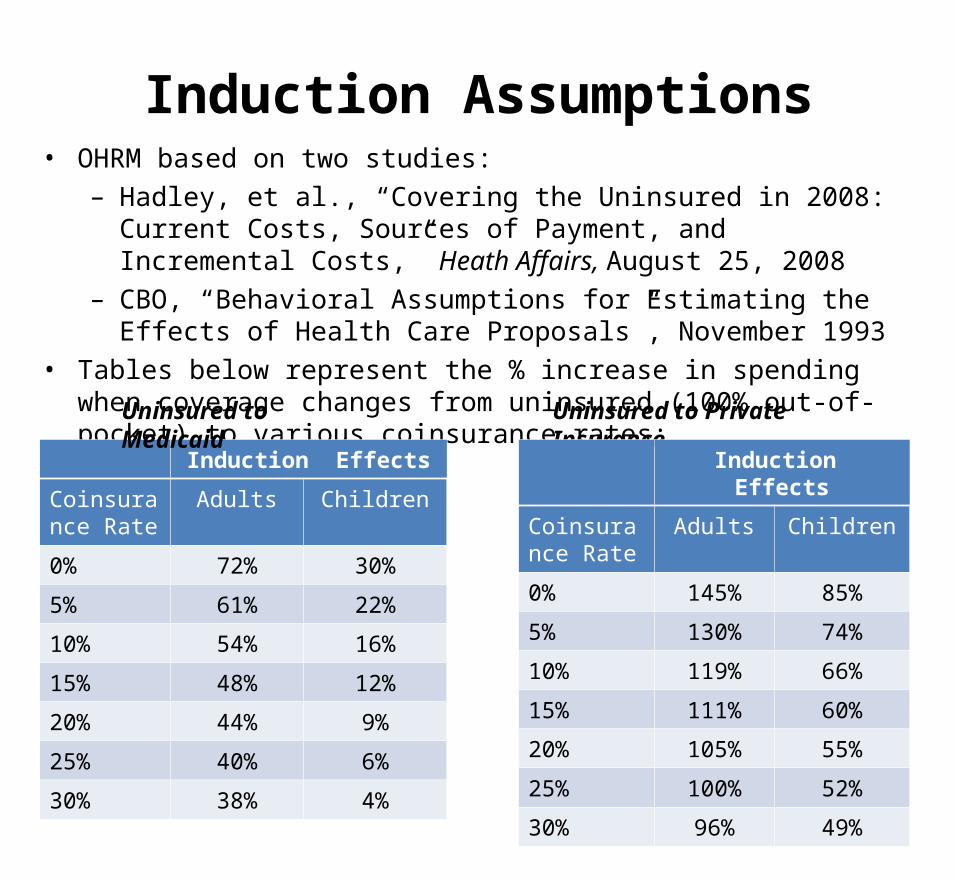
Induction Assumptions• OHRM based on two studies:
– Hadley, et al., “Covering the Uninsured in 2008: Current Costs, Sources of Payment, and Incremental Costs,” Heath Affairs, August 25, 2008
– CBO, “Behavioral Assumptions for Estimating the Effects of Health Care Proposals”, November 1993
• Tables below represent the % increase in spending when coverage changes from uninsured (100% out-of-pocket) to various coinsurance rates:
6
Induction Effects
Coinsurance Rate
Adults Children
0% 72% 30%
5% 61% 22%
10% 54% 16%
15% 48% 12%
20% 44% 9%
25% 40% 6%
30% 38% 4%
Uninsured to Medicaid Uninsured to Private Insurance
Induction Effects
Coinsurance Rate
Adults Children
0% 145% 85%
5% 130% 74%
10% 119% 66%
15% 111% 60%
20% 105% 55%
25% 100% 52%
30% 96% 49%
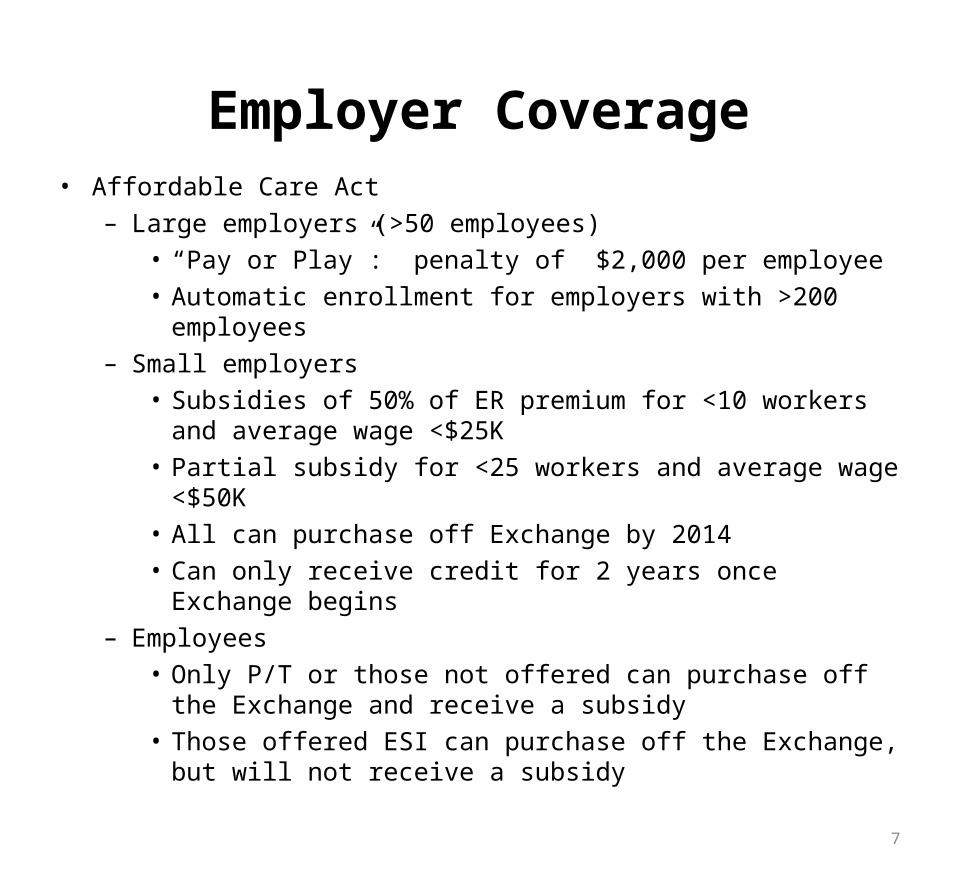
Employer Coverage• Affordable Care Act
– Large employers (>50 employees)
• “Pay or Play”: penalty of $2,000 per employee
• Automatic enrollment for employers with >200 employees
– Small employers
• Subsidies of 50% of ER premium for <10 workers and average wage <$25K
• Partial subsidy for <25 workers and average wage <$50K
• All can purchase off Exchange by 2014
• Can only receive credit for 2 years once Exchange begins
– Employees
• Only P/T or those not offered can purchase off the Exchange and receive a subsidy
• Those offered ESI can purchase off the Exchange, but will not receive a subsidy
7
Employer Coverage• Methodology
– Employer Offer Rates• Use 2008 Kaiser/HRET survey to segment current offer & take-up rates
into 3 industry groupings by 4 firm size groupings• Develop assumptions on offer rates given “pay or play”
– Applies only to large employers– Estimated offer rate depends on size of penalty and firm size– Assume employer decisions remain in place for balance of 10-year
period (halts downward trend in employer coverage)• Develop assumptions on offer rates given subsidies and options for
employees– Assume some large employers with low wage workers would drop
offer
– Employee Take-up Rates• Develop assumptions on take-up rates of employer coverage given an
individual mandate– Based on penalty, income, spending, and family type
• Assumptions reflect consideration of tax effects• Apply new take-up rates to Household model
– Assume a 3-yr transition with most of the impact in 2014
8
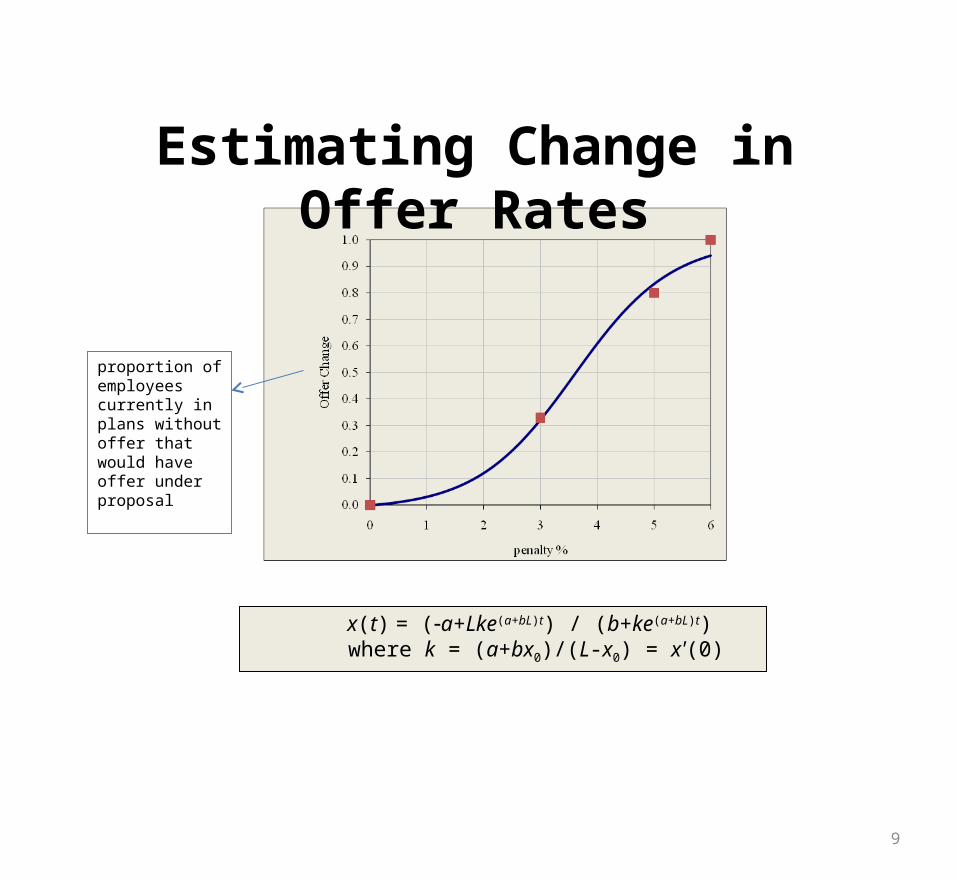
x(t) = (a+Lke(a+bL)t) / (b+ke(a+bL)t) where k = (a+bx0)/(L-x0) = x'(0)
Estimating Change in Offer Rates
proportion of employees currently in plans without offer that would have offer under proposal
9

Employer Assumptions• Overall Offer Assumptions with “Pay or Play” and Exchange
– Individual industry/firm size groupings differ in impact
– Impact of large employers dropping offer assumed to slowly transition to full effect in 2017
• Overall Employee Take-up Assumptions– Formula based on size of penalty, income, health spending, and family type
10
Firm Size
Offer Rate- baseline
Offer Rate - proposed
<10 47% 36%
10-24 78% 75%
25-49 91% 95%*
50+ 98% 96%*
*Change is net effect of increase due to employer penalty and decrease due to low wage, large employers drop

Household/Individual Coverage• Affordable Care Act
– Individual mandate• Penalty is greater of 2.5% of income in excess of minimum taxable income, $695
– Health Insurance Exchange• 4 Levels of Coverage
– Platinum – 90% Actuarial Value
– Gold – 80% Actuarial Value
– Silver – 70% Actuarial Value
– Bronze – 60% Actuarial Value
• Maximum Out-of-Pocket roughly $6,000 Individual / $12,000 Family
– Indexed to Growth in Premium Costs
11
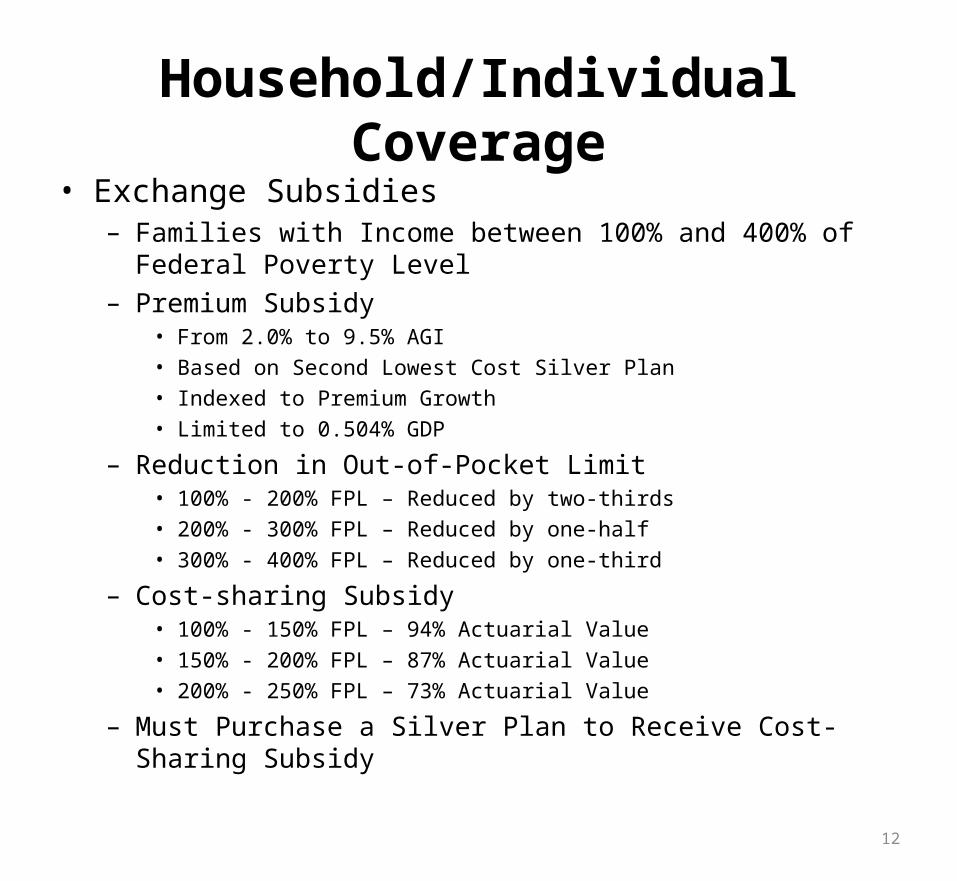
Household/Individual Coverage• Exchange Subsidies
– Families with Income between 100% and 400% of Federal Poverty Level
– Premium Subsidy • From 2.0% to 9.5% AGI
• Based on Second Lowest Cost Silver Plan
• Indexed to Premium Growth
• Limited to 0.504% GDP
– Reduction in Out-of-Pocket Limit• 100% - 200% FPL – Reduced by two-thirds
• 200% - 300% FPL – Reduced by one-half
• 300% - 400% FPL – Reduced by one-third
– Cost-sharing Subsidy• 100% - 150% FPL – 94% Actuarial Value
• 150% - 200% FPL – 87% Actuarial Value
• 200% - 250% FPL – 73% Actuarial Value
– Must Purchase a Silver Plan to Receive Cost-Sharing Subsidy
12
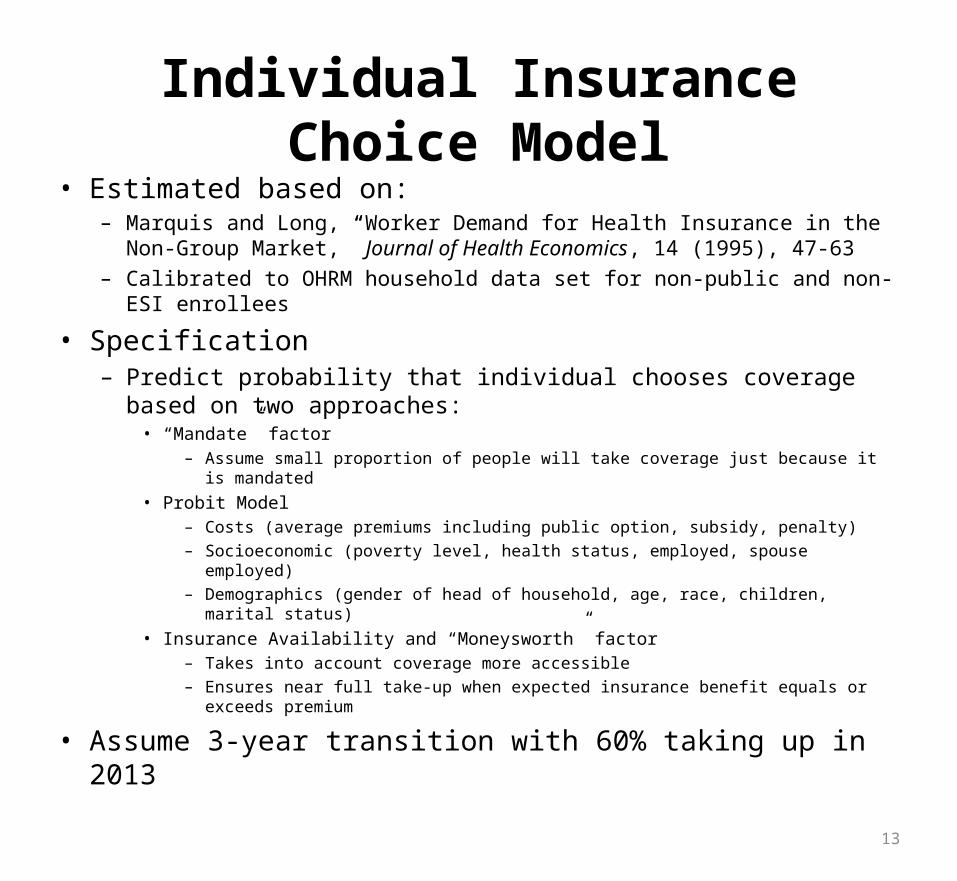
Individual Insurance Choice Model• Estimated based on:
– Marquis and Long, “Worker Demand for Health Insurance in the Non-Group Market,” Journal of Health Economics, 14 (1995), 47-63
– Calibrated to OHRM household data set for non-public and non-ESI enrollees
• Specification– Predict probability that individual chooses coverage based on two
approaches:• “Mandate” factor
– Assume small proportion of people will take coverage just because it is mandated
• Probit Model– Costs (average premiums including public option, subsidy, penalty)
– Socioeconomic (poverty level, health status, employed, spouse employed)
– Demographics (gender of head of household, age, race, children, marital status)
• Insurance Availability and “Moneysworth” factor– Takes into account coverage more accessible
– Ensures near full take-up when expected insurance benefit equals or exceeds premium
• Assume 3-year transition with 60% taking up in 2013
13
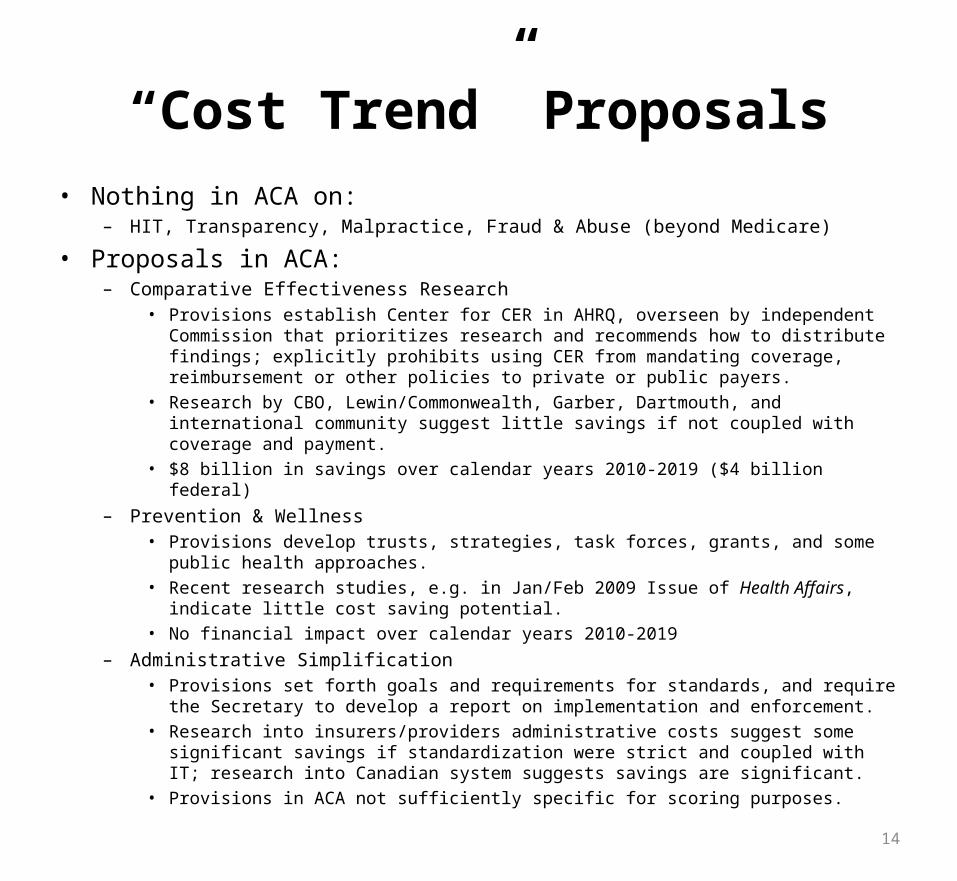
“Cost Trend” Proposals
• Nothing in ACA on:– HIT, Transparency, Malpractice, Fraud & Abuse (beyond Medicare)
• Proposals in ACA:– Comparative Effectiveness Research
• Provisions establish Center for CER in AHRQ, overseen by independent Commission that prioritizes research and recommends how to distribute findings; explicitly prohibits using CER from mandating coverage, reimbursement or other policies to private or public payers.
• Research by CBO, Lewin/Commonwealth, Garber, Dartmouth, and international community suggest little savings if not coupled with coverage and payment.
• $8 billion in savings over calendar years 2010-2019 ($4 billion federal)
– Prevention & Wellness• Provisions develop trusts, strategies, task forces, grants, and some public health approaches.
• Recent research studies, e.g. in Jan/Feb 2009 Issue of Health Affairs, indicate little cost saving potential.
• No financial impact over calendar years 2010-2019
– Administrative Simplification• Provisions set forth goals and requirements for standards, and require the Secretary to develop a
report on implementation and enforcement.
• Research into insurers/providers administrative costs suggest some significant savings if standardization were strict and coupled with IT; research into Canadian system suggests savings are significant.
• Provisions in ACA not sufficiently specific for scoring purposes.
14
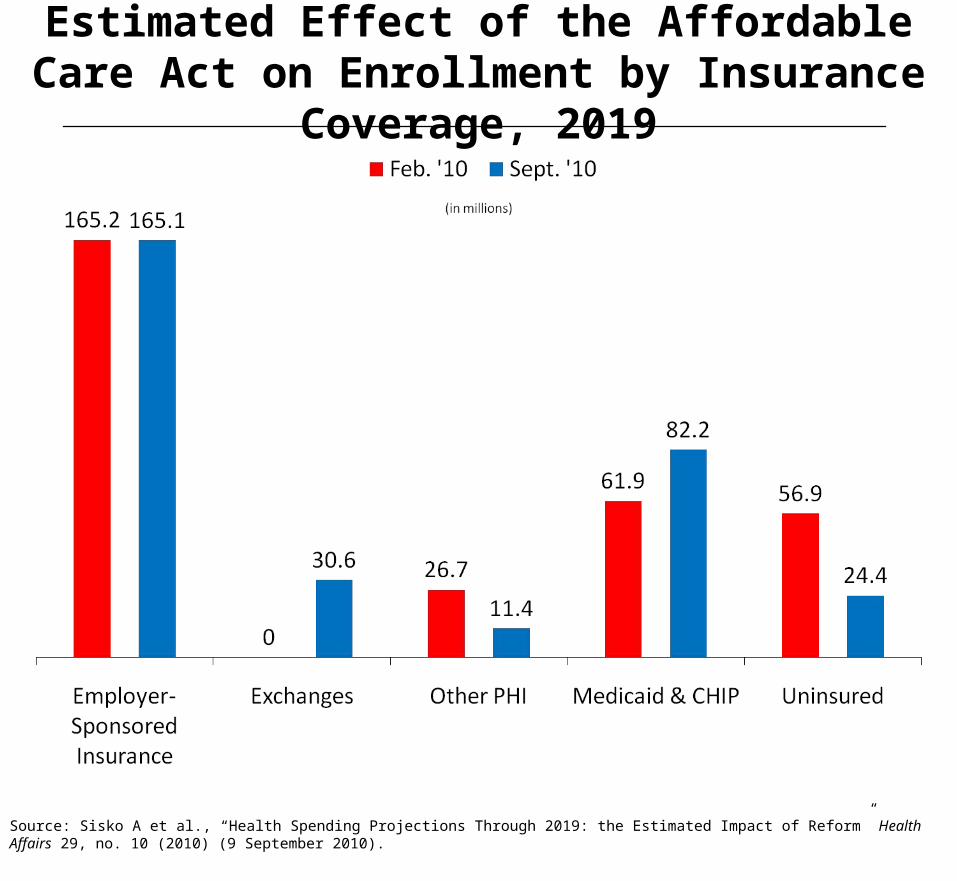
Estimated Effect of the Affordable Care Act on Enrollment by Insurance Coverage, 2019
Source: Sisko A et al., “Health Spending Projections Through 2019: the Estimated Impact of Reform” Health Affairs 29, no. 10 (2010) (9 September 2010).
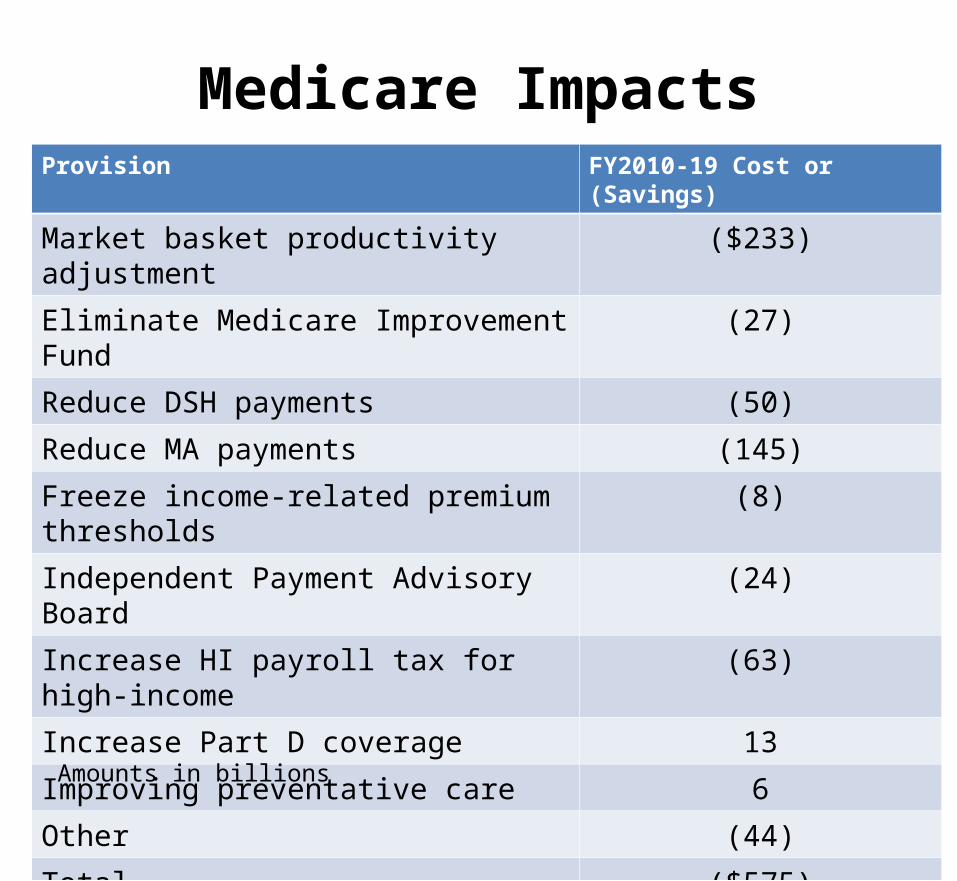
Medicare ImpactsProvision FY2010-19 Cost or (Savings)
Market basket productivity adjustment ($233)
Eliminate Medicare Improvement Fund (27)
Reduce DSH payments (50)
Reduce MA payments (145)
Freeze income-related premium thresholds
(8)
Independent Payment Advisory Board (24)
Increase HI payroll tax for high-income (63)
Increase Part D coverage 13
Improving preventative care 6
Other (44)
Total ($575)
Amounts in billions

Productivity and Other Adjustments
•40% of Medicare savings or $233B
•All Part A and Part B providers and suppliers subject to market basket or CPI updates will be reduced by private non-farm mutifactor productivity each year
•Additional reductions FY 2011-2013
•Home Health Agencies: 14% cut due to rebasing phased-in CY 2014-2017, 2.5 percent cut in 2011, 10% cap on outliers 2011+
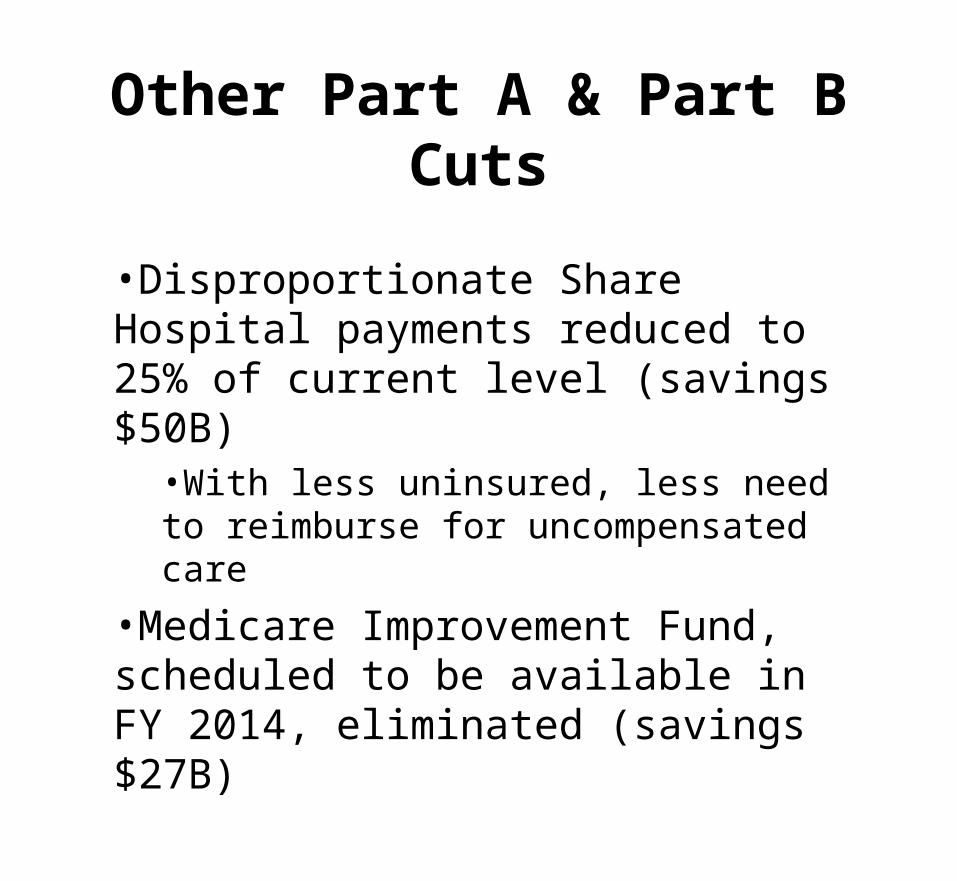
Other Part A & Part B Cuts
•Disproportionate Share Hospital payments reduced to 25% of current level (savings $50B)
•With less uninsured, less need to reimburse for uncompensated care
•Medicare Improvement Fund, scheduled to be available in FY 2014, eliminated (savings $27B)
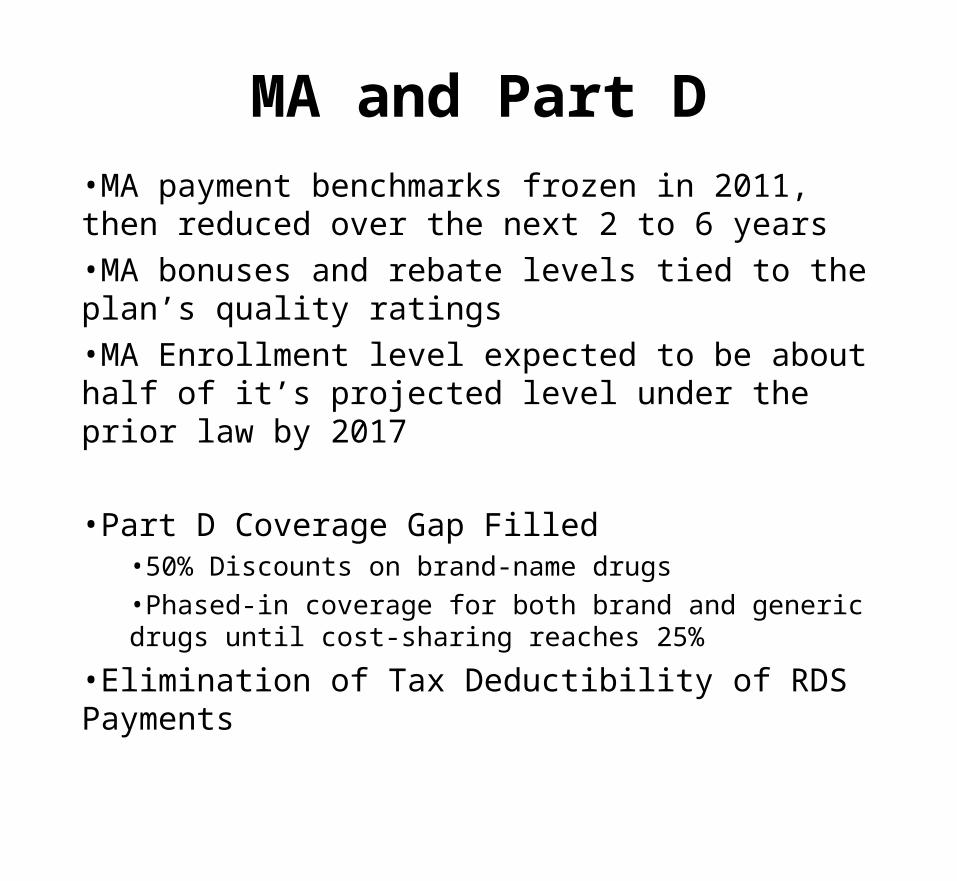
MA and Part D•MA payment benchmarks frozen in 2011, then reduced over the next 2 to 6 years
•MA bonuses and rebate levels tied to the plan’s quality ratings
•MA Enrollment level expected to be about half of it’s projected level under the prior law by 2017
•Part D Coverage Gap Filled•50% Discounts on brand-name drugs
•Phased-in coverage for both brand and generic drugs until cost-sharing reaches 25%
•Elimination of Tax Deductibility of RDS Payments
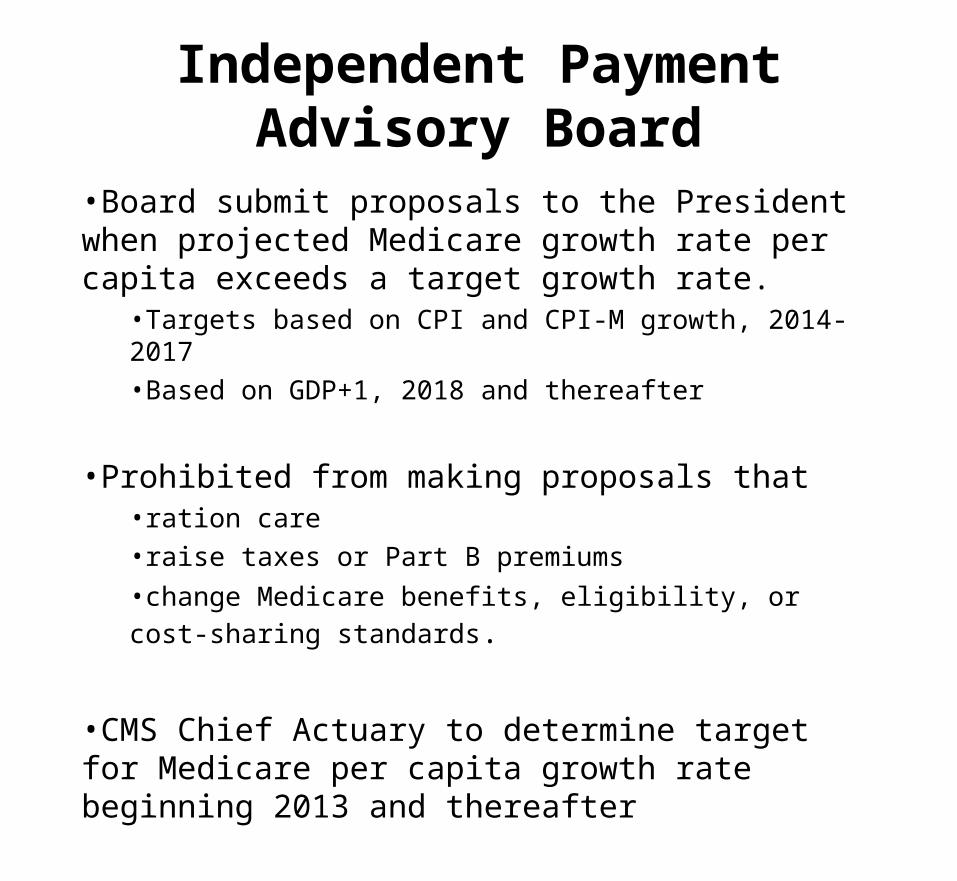
Independent Payment Advisory Board
•Board submit proposals to the President when projected Medicare growth rate per capita exceeds a target growth rate.
•Targets based on CPI and CPI-M growth, 2014-2017
•Based on GDP+1, 2018 and thereafter
•Prohibited from making proposals that •ration care
•raise taxes or Part B premiums
•change Medicare benefits, eligibility, or cost-sharing standards.
•CMS Chief Actuary to determine target for Medicare per capita growth rate beginning 2013 and thereafter
•Savings $24B
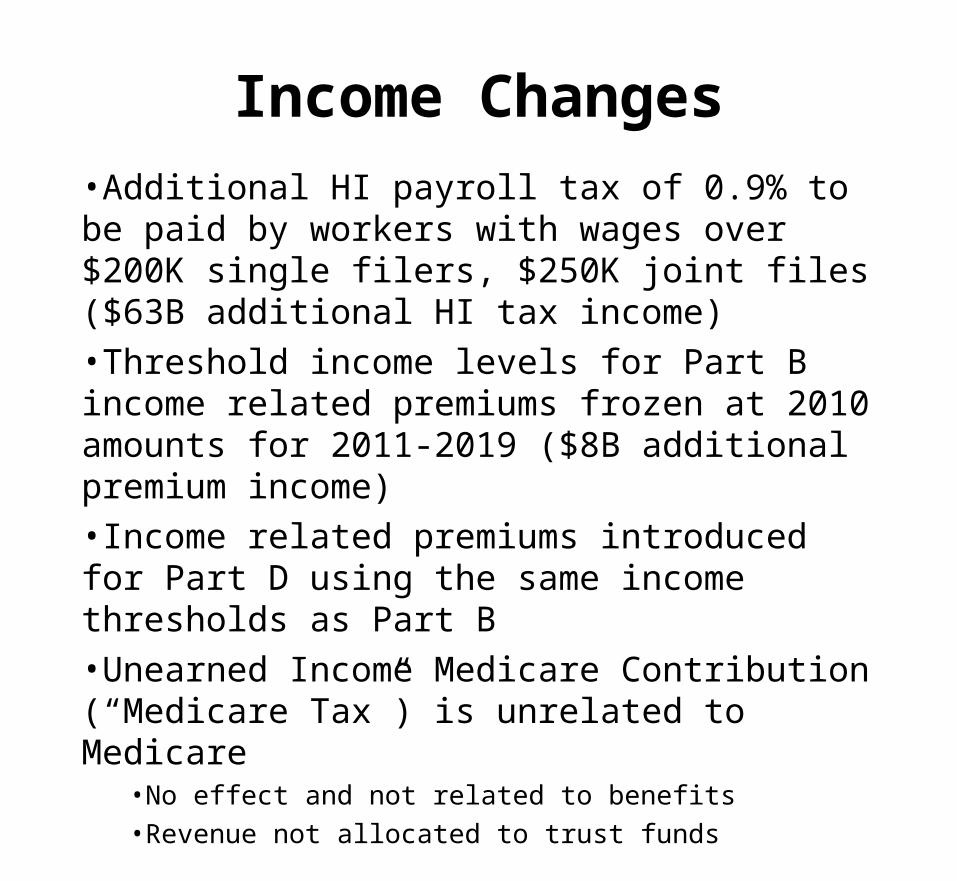
Income Changes•Additional HI payroll tax of 0.9% to be paid by workers with wages over $200K single filers, $250K joint files ($63B additional HI tax income)
•Threshold income levels for Part B income related premiums frozen at 2010 amounts for 2011-2019 ($8B additional premium income)
•Income related premiums introduced for Part D using the same income thresholds as Part B
•Unearned Income Medicare Contribution (“Medicare Tax”) is unrelated to Medicare
•No effect and not related to benefits
•Revenue not allocated to trust funds
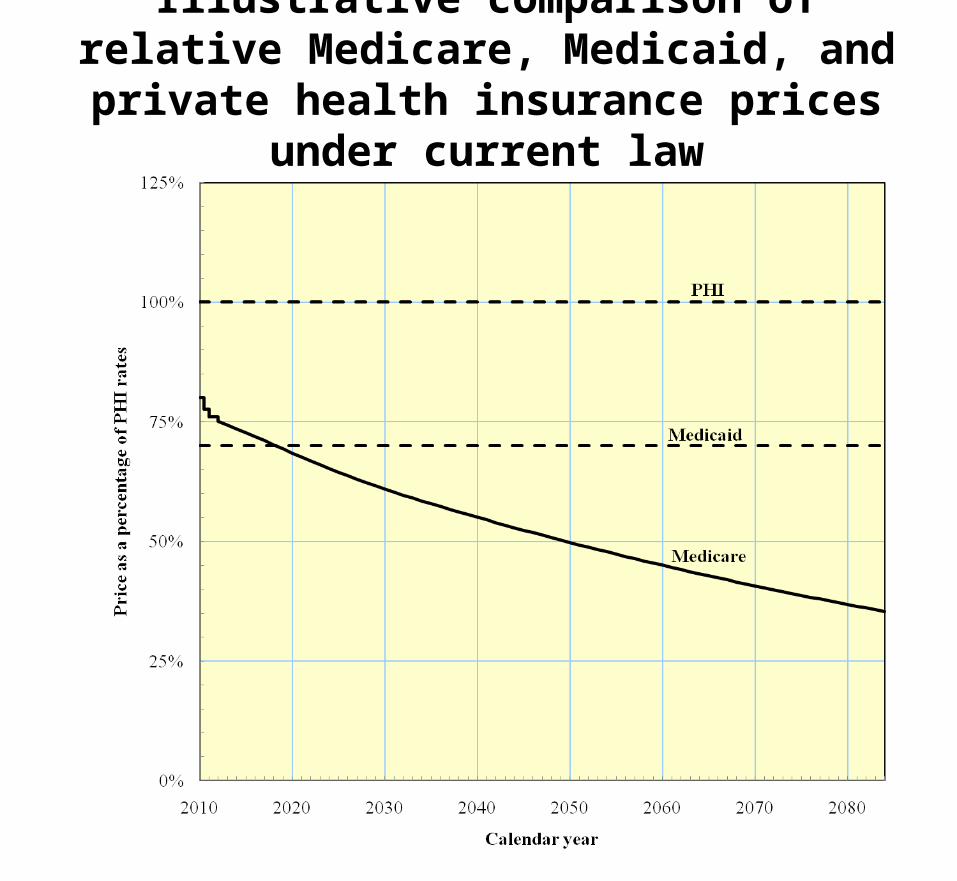
Illustrative comparison of relative Medicare, Medicaid, and private health insurance prices
under current law
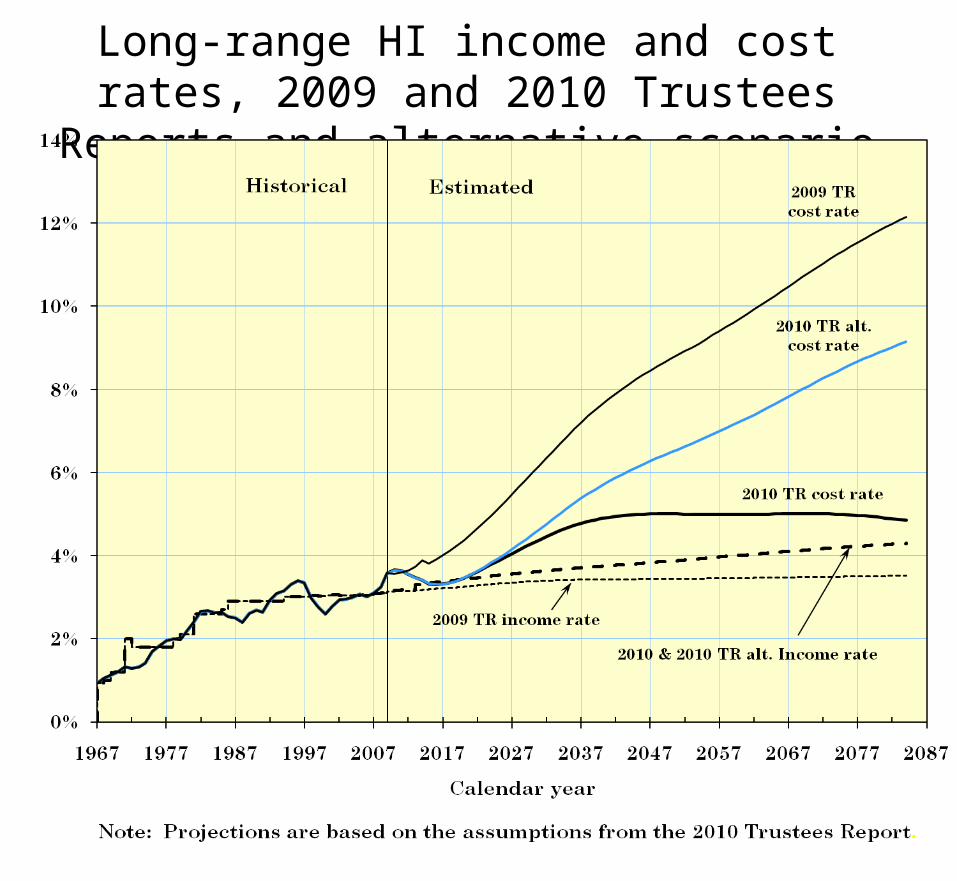
Long-range HI income and cost rates, 2009 and 2010 Trustees Reports and alternative scenario
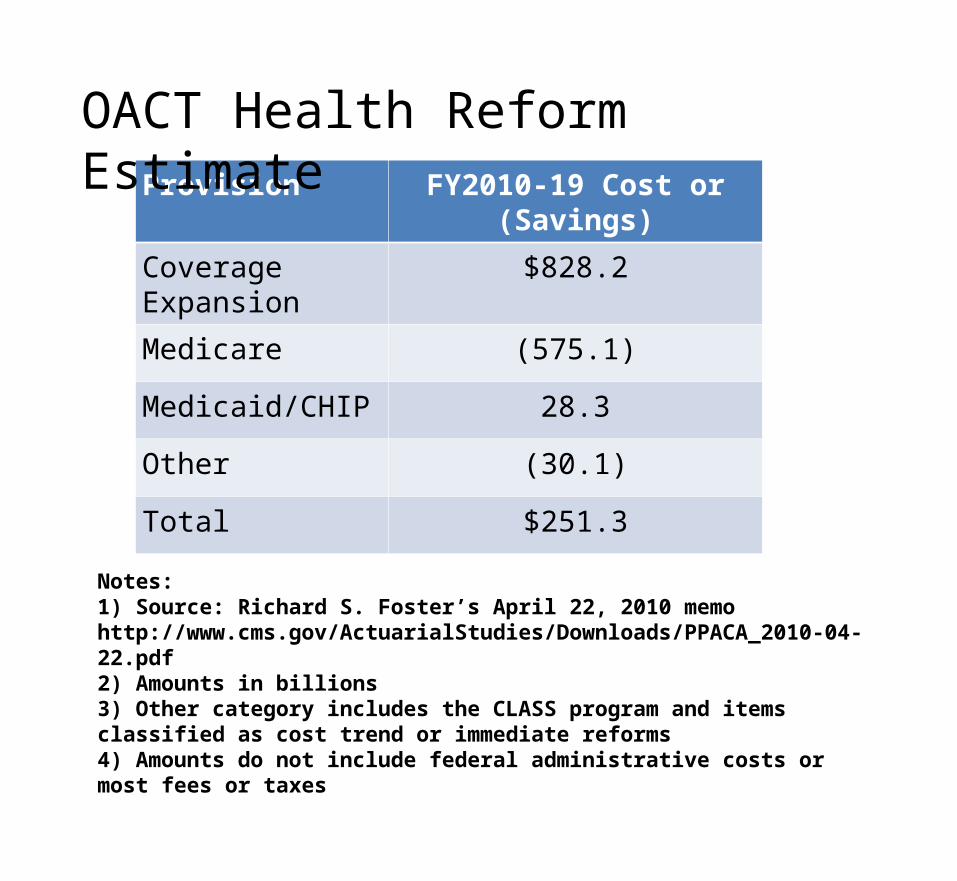
Notes:1) Source: Richard S. Foster’s April 22, 2010 memo http://www.cms.gov/ActuarialStudies/Downloads/PPACA_2010-04-22.pdf 2) Amounts in billions3) Other category includes the CLASS program and items classified as cost trend or immediate reforms4) Amounts do not include federal administrative costs or most fees or taxes
Provision FY2010-19 Cost or (Savings)
Coverage Expansion
$828.2
Medicare (575.1)
Medicaid/CHIP 28.3
Other (30.1)
Total $251.3
OACT Health Reform Estimate
0.0
5.0
10.0
15.0
20.0
1980 1984 1988 1992 1996 2000 2004 2008 2012 2016
Sh
are
of
GD
P (
%)
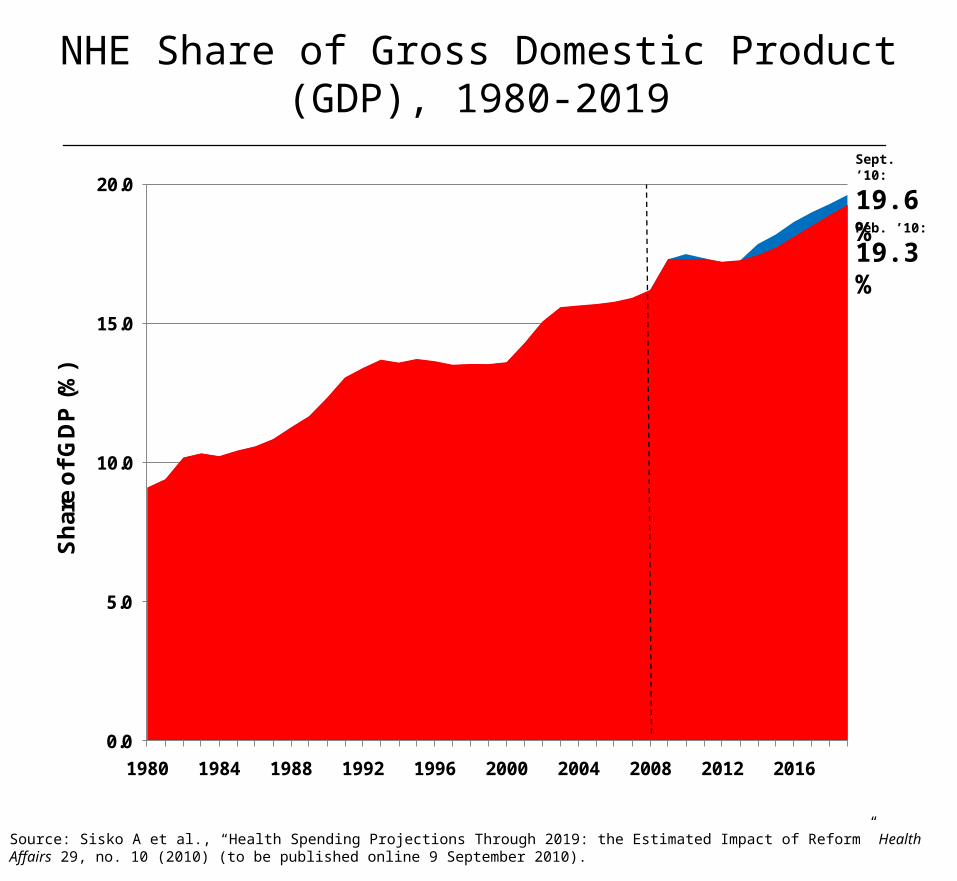
NHE Share of Gross Domestic Product (GDP), 1980-2019
Source: Sisko A et al., “Health Spending Projections Through 2019: the Estimated Impact of Reform” Health Affairs 29, no. 10 (2010) (to be published online 9 September 2010).
Feb. ’10:
19.3%
Sept. ’10:
19.6%
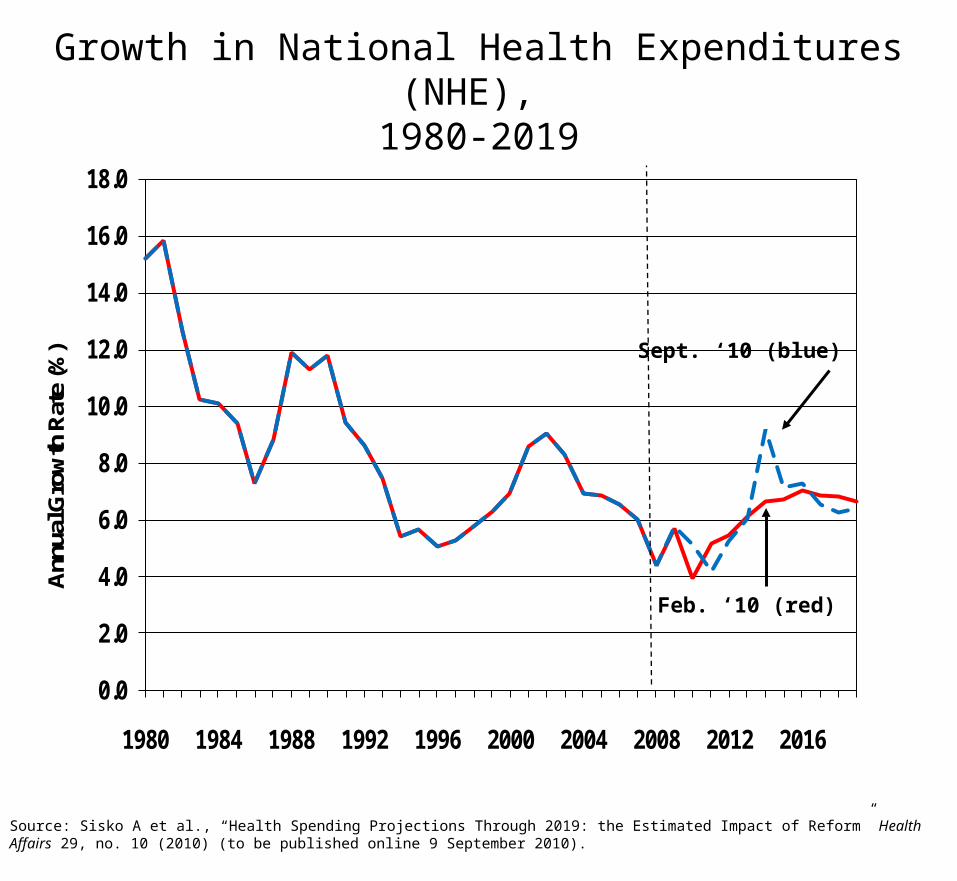
Growth in National Health Expenditures (NHE), 1980-2019
0.0
2.0
4.0
6.0
8.0
10.0
12.0
14.0
16.0
18.0
1980 1984 1988 1992 1996 2000 2004 2008 2012 2016
Ann
ual G
row
th R
ate
(%) Sept. ‘10 (blue)
Feb. ‘10 (red)
Source: Sisko A et al., “Health Spending Projections Through 2019: the Estimated Impact of Reform” Health Affairs 29, no. 10 (2010) (to be published online 9 September 2010).
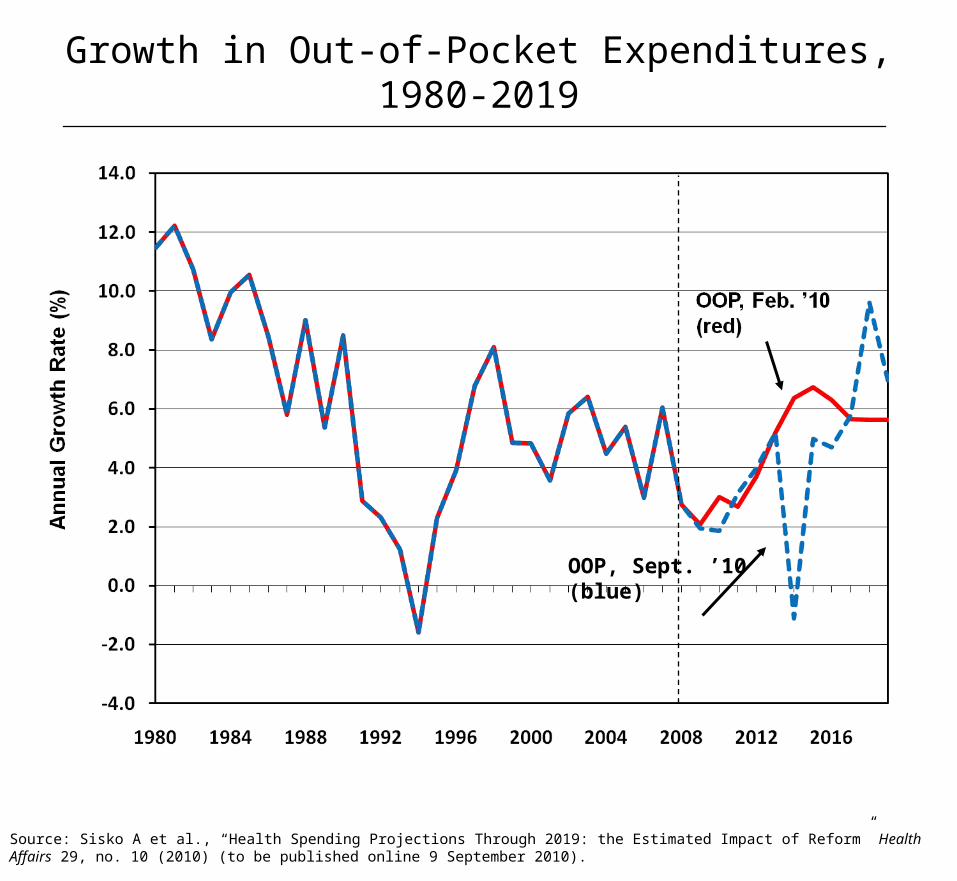
Growth in Out-of-Pocket Expenditures, 1980-2019
Source: Sisko A et al., “Health Spending Projections Through 2019: the Estimated Impact of Reform” Health Affairs 29, no. 10 (2010) (to be published online 9 September 2010).
OOP, Sept. ’10 (blue)
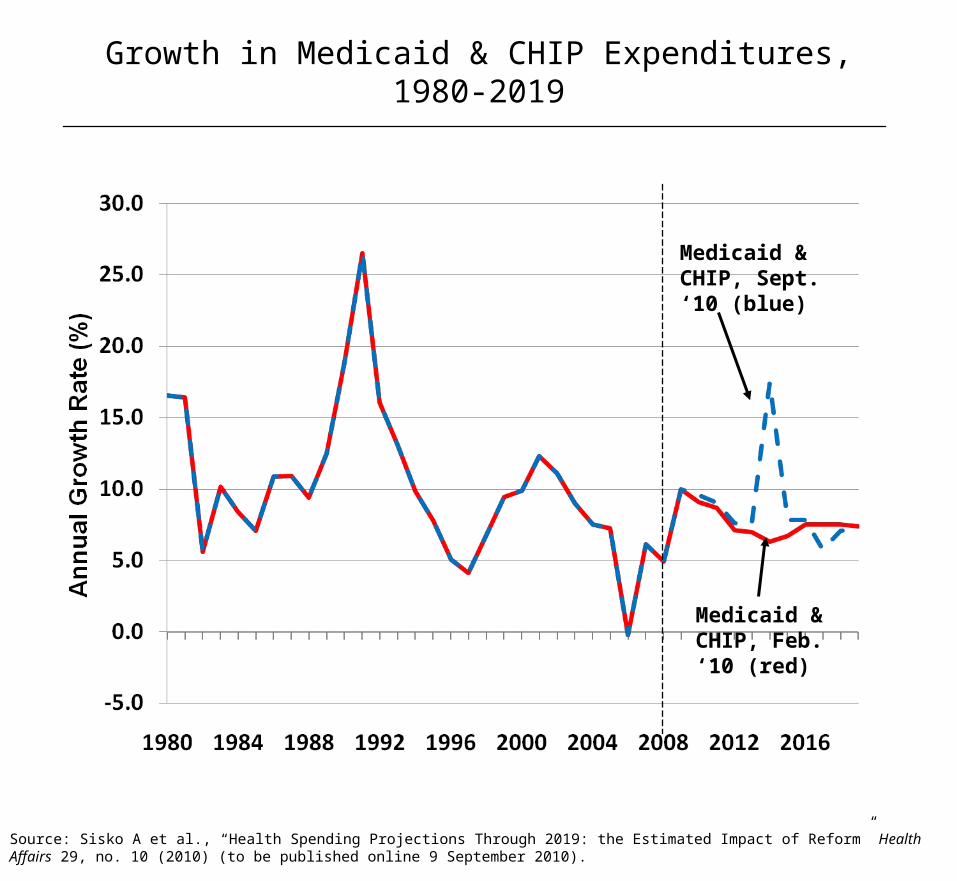
Growth in Medicaid & CHIP Expenditures,1980-2019
Medicaid & CHIP, Sept. ‘10 (blue)
Medicaid & CHIP, Feb. ‘10 (red)
Source: Sisko A et al., “Health Spending Projections Through 2019: the Estimated Impact of Reform” Health Affairs 29, no. 10 (2010) (to be published online 9 September 2010).
0.0
5.0
10.0
15.0
20.0
25.0
1980 1984 1988 1992 1996 2000 2004 2008 2012 2016
Ann
ual G
row
th R
ate
(%)
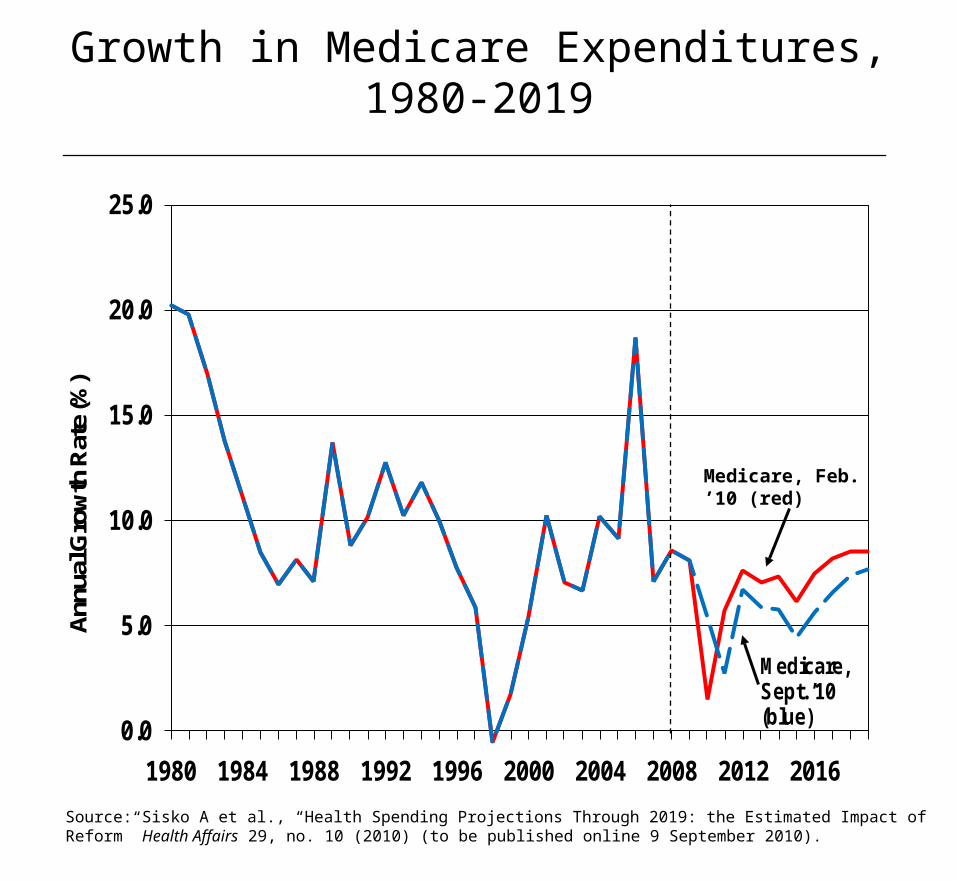
Medicare, Sept. ’10 (blue)
Growth in Medicare Expenditures, 1980-2019
Source: Sisko A et al., “Health Spending Projections Through 2019: the Estimated Impact of Reform” Health Affairs 29, no. 10 (2010) (to be published online 9 September 2010).
Medicare, Feb. ’10 (red)
Our favorite uses and misuses of OACT’s health reform estimates
30
OACT Top Ten List
10. Medicare actuary goes rogue? (Politico)
31
OACT Top Ten List
OACT Top Ten List
9. “Foster works for the Center for Medicare and Medicaid Services, an agency within HHS that would lose funding under health care reform.” (Slate)
32
OACT Top Ten List
8. “One of the most serious indictments” of Democrats' approach to health care, adding it should “put the dagger in the heart of the Reid bill.” (Senator McCain)
33
OACT Top Ten List
7. “That assessment was of previous versions of the legislation, so it's completely wrong.” (Senator Dodd)
34
OACT Top Ten List
6. “This report once again discredits Democrats’ assertions that their $1.3 trillion government takeover of health care will lower costs, and it confirms that this bill violates President Obama’s promise to ‘bend the cost curve.’ It’s now beyond dispute that their bill will raise costs, which is exactly what the American people don’t want.” (Representative Boehner)
35
OACT Top Ten List5. “Medicare Report Confirms Health Care
Takeover Plan is a Fiscal Disaster” (AOL News headline)
36
OACT Top Ten List
4. “It’s a long, somewhat dry document…but it is an interesting read (assuming the reader is adequately caffeinated).” (Mike the Actuary’s Musings)
37

OACT Top Ten List
3. “This is not something they normally do. It is an interesting analysis but it is pretty speculative though of what the impact will be on providers and beneficiaries. Our recent experience would indicate something quite different.” (Nancy-Ann DeParle)
38
OACT Top Ten List
2. “The CMS report is a blow to the White House and House Democrats who have vowed that healthcare reform would curb the growth of healthcare spending.” (Capitol Hill)
39

OACT Top Ten List1. “Actuaries sure know how to ruin a
good time” (Capitol Watch Blog headline)
40