Office Of internatiOnal ecOnOmic relatiOns...Office Of internatiOnal ecOnOmic relatiOns leo m....
34
Transcript of Office Of internatiOnal ecOnOmic relatiOns...Office Of internatiOnal ecOnOmic relatiOns leo m....


Office Of internatiOnal ecOnOmic relatiOns
leo m. Herrera-limAssistant Secretary
Jesusa susana V. PaezExecutive Director
ecOnOmic DiPlOmacy Unit
edgar tomas Q. auxilianDirector
Dan erwin c. BagaporoPrincipal Assistant
aerra e. Del rosarioAssistant
antonio fernando s. OcampoAssistant
Diane Khrystene m. OclarinoAssistant
ecOnOmic researcH Unit
margarita r. songcoHead
Joermine elaine P. robredoAssistant
traDe POlicy negOtiatiOns Unit
noemi t. DiazDirector
anthony s. aguirrePrincipal Assistant
evelina marie B. saldariegaAssistant
Publication Team
aPec natiOnal secretariat
eric gerardo e. tamayoDirector
Oliver G. DelfinAssistant Director
frangelin Dianne l. sarabiaConsultant
muammar a. HassanAssistant
larisse isabel P. lausingcoAssistant
Jonel y. mendozaAssistant
cOntriBUtOrs:
maria louella c. DuarteSpecial Assistant
mary fides a. QuintosForeign Service Officer
michelle Kathlene s. reyesAssistant
aDministratiVe Unitmildred BacarroAdministrative Officer
Vivian m. PascuaAssistant/Special Disbursement Officer
ma. chynna lyn s. abaigarAssistant
Jessie B. llaneta Assistant
Victor m. atanganAssistant
Julito c. BabatlaAssistant
martin a. VicencioCommunications Assistant
sPecial tHanKs:
Dr. ceferino s. rodolfoUndersecretary, Department of Trade and Industry

teodoro l. locsin Jr.Secretary of Foreign AffairsRepublic of the Philippines
Foreword
Economic opportunities around the world, due to their sheer number, complexity, and dynamic nature can prove difficut to harness. This is especially true for those tasked with promoting Philippine economic interests abroad. As global market conditions evolve, Philippine economic agents are expected to respond by properly matching what the world needs with what the Philippines can offer, and vice versa.
To ensure that economic diplomacy initiatives are reflective of the country’s priorities and realties, the appropriate information must be readily available. However, while facts about the Philippine economy can be obtained from a plethora of available sources, the most common question for those in the frontlines of economic diplomacy is “how to identify what to promote, and to whom?”
The Philippine International Economic Outlook 2019 is the first in an annual series of reports that aims to provide stakeholders with an evidence-based perspective on the Philippine economy and its standing in the international community. Designed as both an academic and operational reference, this report aims to stimulate discussions on international economic matters, with the end goal of collaboratively crafting a long-term strategy for the Second Pillar of the Philippines’ Foreign Policy, “The Promotion and Attainment of Economic Security.” As such, this report can be viewed as a starting point where Foreign Service Posts and other economic agents can derive priorities for their economic intelligence reporting and economic diplomacy initiatives.
I wish to congratulate the Office of International Economic Relations for its efforts in undertaking this initiative. Likewise, I enjoin the different Offices and Foreign Service Posts under the Department of Foreign Affairs to fully utilize the information contained herein and express their views on how such information applies to different contexts and purviews.
iDFA - Office of International Economic Relations |
phIlIppInE IntERnAtIOnAl EcOnOmIc OutlOOk 2018

The philippine International Economic Outlook 2019 is a modest attempt to provide Philippine economic agents and practitioners a comprehensive, impactful, and easily understandable outlook on Philippine international economic realities. This outlook is in response to the felt need by Philippine Foreign Service Posts (FSPs) and other stakeholders for a reflective view on international economic matters.
This report is divided into four sections: Section I provides a snapshot of the Philippine market by summarizing key government plans and priorities and relevant economic performance measures, while highlighting the progress made through the Duterte Administration’s 10-Point Socioeconomic Agenda. The succeeding sections provide insights on the Philippine market’s relationship with the global community. In particular, Section II outlines selected key information on foreign trade and global trading blocks, foreign direct investments, tourism, and foreign aid. Sections III and IV, respectively, provide an initial perspective on several emerging bilateral and multilateral trade partners, and feature special topics on international economics. Section V outlines several key references for reference and further study.
Given the complexity and volume of information available on the global market, this report is not meant to be exhaustive. Topics were selected based on academic research and the assessed needs of the Department’s Economic Diplomacy program. While the authors of this report underscore the primacy of evidence-based discussions, inputs from those responsible for operationalizing the Philippines’ foreign policy and other stakeholders will be very much critical in strengthening future editions. Thus, readers are very much encouraged to give their feedback or recommend future subjects, which, based on their assessment, warrants further attention and discussion. The authors hope that this publication will eventually be an institutionalized product of the Department.
Executive Summary
phIlIppInE IntERnAtIOnAl EcOnOmIc OutlOOk 2018
ii | DFA - Office of International Economic Relations

Table of Contentsforewordexecutive summarytable of contentssection i: the Philippine economyAmbisyon Natin 2040Philippine Development PlanHighlights and Achievements of the Duterte Administration 1. Macroeconomic Fundamentals 2. Progressive Tax Reform 3. Increasing Competitiveness 4. Improving Infrastructure 5. Agriculture and Rural Enterprise 6. Land tenure, titling and Investments 7. Health, Education, and Human Capital 8. Science, Technology and Innovation 9. Social Protection and Poverty Alleviation 10. Responsible Parenthood and Reproductive Health
iii
iii1
12
section ii. international economic relationsII.A Foreign TradeII.B Foreign InvestmentII.C TourismII.D Foreign Aid (Official Development Assistance)II.E Asia Pacific Economic Cooperation (APEC)II.F European Union (EU) and GSP Plus II.G European Free Trade Association (EFTA)
13
20
section iii. emerging economic relationsIII.A 10 Emerging Trade PartnersIII.B AfricaIII.C South AsiaIII.D Scandinavia
21
22
section iV. special topics in international economicsIV.A Multilateral Trading SystemIV.B Trade TensionsIV.C Inflation
section V. Useful references and linksV.A Data and InformationV.B Government Plans and PrioritiesV.C Other References
23
24
25
iiiDFA - Office of International Economic Relations |

philippine international economic outlook 2018
1 | DFA - Office of International Economic Relations
I. The Philippine Economy
ambisyon natin 2040Duterte Administration’s goals are aligned with the Ambisyon Natin 2040, a long-term development vision for the Philippines
Contains the results of a nation-wide study on what Filipinos wish to achieve for themselves by the year 2040.
Most (79%) Filipinos aspire for a simple and comfortable life, some (17%) an affluent one, and few (4%) a rich one, as defined in the succeeding table.
The long term goal is for the Philippines to become a high income country by 2040 (GNI per capita of not less than USD 12,506).1
PH in 2017: uSD 3,660
Source: National Economic Development Authority (2016)
FORPHILIPPINES
A LONG-TERM
THE
Philippine
Development Plan
2017-2022
ABRIDGED VERSION
Philippine Development Plan (PDP) 2017 to 2022The government’s medium-term development plan
Official guide on all matters pertaining to the country’s socioeconomic development
Operationalizes Ambisyon Natin 2040 through various indicators and targets that different agencies use to align their socioeconomic development initiatives.2
PDP Key targets By 2022
1. economic expansion by around 50%
2. Per capita income increase to USD 5,000 from USD 3,550 in 2015
3. Poverty rate Decline from 21.6% (2015) to 14.0%
4. High level of human development
5. unemployment decrease from 5.5 to 3.5%
6. Top 1/3 of Global Innovation Index 2018 rank is 73rd/124

2DFA - Office of International Economic Relations |
phIlIppInE IntERnAtIOnAl EcOnOmIc OutlOOk 2018
Drivers of Growth moderators of Growth
Increased infrastructure spending
Chronic underperformance of agricultural sector
Increased investments in equipment and construction
Moderation in global demand of electronics (largest PH exports)
Strong private consumption
Global monetary tightening
Inflow of OFW remittances
High Inflation
Steady Job market
Duterte Administration’s 10-pOInt SOcIOEcOnOmIc AGEnDAThe Economic Reform Initiatives of the Duterte Administration
A list of top priority areas that operationalize the Philippines’ vision to triple per capita income in 25 years, to achieve a “high-income country” status
Outline 10 priority areas of development and highlight the Philippines’ economic progress through selected key performance indicators.
Agenda 1. continue and maintain current macroeconomic policies, including fiscal, monetary, and trade policies.
The Duterte administration has built on the economic gains of the previous administrations by continuing and improving macroeconomic policies. It has adopted the strategies and targets highlighted in the Ambisyon Natin 2040, and PDP 2017 to 2022.
1 National Economic Development Authority (2016). Ambisyon Natin 20402 National Economic Development Authority (2018). 2017 Socioeconomic development report. Retrieved from: 3 Philippine Statistics Authority (2018). National accounts of the Philippines4 Philippine Statistics Authority (2018). National accounts of the Philippines5 Philippine Statistics Authority (2018). National accounts of the Philippines6 World bank (2018).GDP per capita PPP. Retrieved from: https://data.worldbank.org/indicator/NY.GDP.PCAP.PP.CD?year_high_desc=true on 11-03-18
tHe PHiliPPine ecOnOmy in nUmBers
GDP at current (2017) prices3:
UsD 313.6 BThe Philippine has one of the fastest
growing economies in Asia in 20175
GDP at constant 2000 prices4:
171.9 BPhilippines GDP per capita is
6th largest in ASEAN6
*Projected (World Bank)
Developing EA&P includes: Cambodia, China, Fiji, Indonesia, Lao PDR, Malaysia, Papua New Guinea, Philippines, Solomon Islands, Thailand, Timor-Leste, and Vietnam
Source: The World Bank (2018)
economic growth rates and Projections7
Fastest Growing Economies in Asia
Real GDp Growth Rates
2017 per capita GDp (uSD)
India
8.0%
6.5
6.96.7 6.76.5
6.36.36.6
6.6
6.1
‘15 ‘16 ‘17 ‘18* ‘19* ‘20*
66.1
7.1%
93,905
78,836
29,43217,871 12,284 8,342 7,032 6,775 6,139
4,002
6.8% 6.7%
5.2%
Vietnam China Philippines
Philippines Developing East Asia and Pacific
Singapore
Brunei D
.
Malaysia
Thailand
Indonesia
Philippin
esLaos
Vietnam
Myanm
ar
Cambodia
Indonesia
Gro
wth
Rat
e (2
016
to 2
017)
Gro
wth
Rat
es
per
capi
ta G
Dp
in u
SD
9.0%
8.0%
7.0%
6.0%
5.0%
4.0%
3.0%
2.0%
1.0%
0.0%
7.0
6.5
6.0
5.5
100,00090,00080,00070,00060,00050,00040,00030,00020,00010,000
0
World: 3.2%

philippine international economic outlook 2018
3 | DFA - Office of International Economic Relations
size by industry (agriculture, industry, services)8
Services still comprise the largest industry share of the economy.
Industry experienced the highest growth from 2016 to 2017.
inDUstry % sHare Of gDP
industry size and % share of gDP
growth rate(2016 to 2017)
inDUstry grOwtH rate (2016-2017)
AGRIcultuRE
30.2B(9.7%)
AGRIcultuRE
4.0%
InDuStRy
95.5B(30.5%)
InDuStRy
7.2%
SERvIcES
187.8B(59.9%)
SERvIcES
6.8%
Agriculture10%
Industry30%
Services60%
Industry Growth Rate (2016 - 2017)
4.0%
7.2% 6.8%
Agriculture Industry Services
Gro
wth
Rat
e
8.0%
6.0%
4.0%
2.0%
0.0%
PhP to UsD exchange rate9 Inflation11
2009 2010 2011 2012 2013 2014 2015 2016 2017
Phili
ppin
e Pe
so p
er U
SD
52
50
48
46
44
42
40
38
47.6
45.1
43.342.2 2.6%
3.6%
0.7% 1.3%2.9%
5.2%4.0%4.0%
42.4
44.4
47.2
49.850.4
Inflation Rate (headline)
Infl
atio
n R
ate
10.0%
5.0%
0.0%‘13 ‘14 ‘15 ‘16 ‘17 ‘18* ‘19* ‘20*
Inflation Rate BSP Upper Threshold
7 The World Bank. (2018).Philippines Economic Update: Staying the Course Amidst Global Uncertainty. Retrieved from: http://documents.worldbank.org/curated/en/209201538533339474/pdf/130421-PEU-October-2018-WEB3.pdf
8 Philippine Statistics Authority (2018). National accounts of the Philippines9 Bangko Sentral ng Pilipinas (2018). Pesos per us dollar rate. Retrieved from: http://www.bsp.gov.ph/statistics/

4DFA - Office of International Economic Relations |
phIlIppInE IntERnAtIOnAl EcOnOmIc OutlOOk 2018
The country’s GIR decreased slightly in 2018 but are still adequate to cover imports of goods and payments of services for 6.8 months.15
Fiscal DeficitFiscal Deficit (total government revenue minus expenditure) in 2017 was -2.3% of GDP, below the government ceiling of 3.0%.
Uptick in inflation recorded in 2018
BSP raised benchmark interest rates several times resting at 4.75% in November, from 3.0% from the start of the year.12
external Debt to gDP ratio
in 2017: 23.313
medium term outlook: Peso to remain stable10
Some Key Effects of Currency Fluctuation
Key Policies of the administration for macroeconomic stability16
Factors to Stability Factors to Instability
OFW Remittances, BPO revenues, high investment grade, FDI, tourism income
Protectionism, rise in US interest rates, faster credit growth in China, weak global demand
appreciation Depreciation
More Expensive imports Less Expensive
Less competitive exports More competitive
Less buying power remittances More buying power
Decrease Inflation Increase
Inflow capital (Portfolio) Outflow
credit rating (2017)PH Credit Rating remains stableStandard & Poor’s: BBB Fitch’s: BBBMoody’s: BAA2
Fiscal (Government Spending)
monetary (money Supply)
Increase infrastructure spending
Reform Tax Scheme
Maintain fiscal deficit within 3% of GDP
Maintain flexible exchange rate
Inflation targeting (2-4%)
Management of Foreign Currency Reserves
2. Institute progressive tax reform and more effective tax collection, indexing taxes to inflation
One of the leading thrusts of the Duterte Administration is reforming the tax system by introducing four (4) successive legislations.17
Gross International Reserves (GIR)
Fiscal DeficitDeficit Ceiling: 3.0%
88.0
86.0
84.0
82.0
80.0
78.0
76.0
74.0
72.0
70.0
68.0
4.0%
2.0%
0.0%
In b
illio
n u
SD
‘13
Jan
‘8 ‘9 ‘10 ‘11 ‘12 ‘13 ‘14 ‘15 ‘16 ‘17 ‘18
‘14
Jan
‘15
Jan
‘16
Jan
‘17
Jan
‘18
Jan
Apr
Apr
Apr
Apr
Apr
AprJu
l
Jul
Jul
Jul
Jul
Jul
Oct
Oct
Oct
Oct
Oct
Oct
0.9%
3.5%
2.0%2.3%
1.4%
0.6%0.9%
2.3%
3.7%
2.4% 2.2%
Signed into law (Dec 2017) Approved by House Submitted to Congress Submitted to CongressSource: Department of Finance
11 Bangko Sentral ng Pilipinas (2018). The Exchange Rate. Retrieved from: http://www.bsp.gov.ph/downloads/Publications/FAQs/exchange.pdf10 Bangko Sentral ng Pilipinas (2018). Inflation Rates. Retrieved from: http://www.bsp.gov.ph/statistics/spei_new/tab34_inf.htm12 Bangko Sentral ng Pilipinas. (2018). Monetary Policy Decisions. http://www.bsp.gov.ph/monetary/monetary.asp13 Bangko Sentral ng Pilipinas (2018). Selected external debt ratios. Retrieved from: http://www.bsp.gov.ph/statistics/14 Department of Finance (2018). Economic Bulletin. Retrieved from: https://www.dof.gov.ph/index.php/data/economic-bulletin/15 Department of Trade and Industry. (2018). Gross international reserves. Retrieved from: https://www.dti.gov.ph/resources/statistics/gross-international-reserves16 The World Bank. (2018). Philippines Economic Update: Staying the Course Amidst Global Uncertainty. Retrieved from: http://documents.worldbank.org/curated/
en/209201538533339474/pdf/130421-PEU-October-2018-WEB3.pdf17 Department of Finance. (n.d.). Tax reform. Retrieved from: https://www.dof.gov.ph/taxreform/

philippine international economic outlook 2018
5 | DFA - Office of International Economic Relations
Summary Package 1: trainRepublic Act 109633 (Tax Reform for Acceleration and Inclusion [TRAIN] Law) was signed in December 2017. Objectives: maximize tax revenues, eliminate deadweight losses from tax system inefficiencies, and appropriately adjust tax income brackets.18
Package 2: traBaHO BillSecond set of tax reforms which aims to cut corporate income taxes from 30 percent to 25 percent and take away redundant fiscal incentives.19
Source: Department of Finance
Proposed Key reforms:1. Reduce Corporate Income Tax (CIT) Rate from 30% to 25%
by 2022
2. Rationalize investment tax incentives 2.A Broaden Tax Base by consolidating 123 special laws on
investment tax incentives into a single omnibus law
2.B Consolidate governance of incentives under the Department of Finance (Currently, there are 14 Investment Promotion Agencies)
*More on TRAIN 2/TRABAHO Bill can be found in the link at the end of this report.
3. Increase competitiveness and ease of doing businessThe government is poised on sharpening the Philippines’ competitiveness in the international market by implementing measures to increase the ease of doing business and capacitate local industries. Below are some indicators to monitor for progress: World Economic Forum (WEF) Global competitiveness Index (GcI) 4.0 Ranking (2018): The GCI 4.0 is a “composite indicator” with 98 indicators distributed across 12 Pillars. The Philippines ranked 56th overall out of 140 countries included, a double-digit jump from its 68th ranking in the previous year.
18 DOF (2018). DOF Briefer on the Tax Reform Acceleration and Inclusion (TRAIN) Law.19 DOF (2018). DOF Briefer on the Tax Reform Acceleration and Inclusion (TRAIN) Law.20 World Economic Forum. (2018). Global Competitiveness Ranking 2018. Retrieved from: http://reports.weforum.org/global-competitiveness-report-2018/
competitiveness-rankings/21 Department of Trade and Industry. (2018). PH scores big in the 2018 Global competitiveness report

6DFA - Office of International Economic Relations |
phIlIppInE IntERnAtIOnAl EcOnOmIc OutlOOk 2018
-ph 5th out of the 9 covered ASEAn countries22:
LA 112th KHM 110th VN 77th BN 62nd ph 56th ID 45th TH 38th MY 25th SG 2nd
Pillar score rank out (100 best) of 140
Overall 62.1 56th Institutions 48.3 101st Infrastructure 59.4 92nd ICT adoption 54.8 67th Macroeconomic Stability 90.0 43rd Health 67.6 101st Education and Skills 62.9 67th Product Market 56.9 60th Labor Market 64.5 36th Financial System 67.9 39th Market Size 67.9 32nd Business Dynamism 65.8 39th Innovation Capacity 37.2 67th
Ease of Doing Business Ranking (EODB)The Philippines still needs to improve the ease of doing business in the country. The World Bank’s Ease of Doing Business Report 2019 ranks the Philippines 124th out 190 countries, (within the upper 60% of countries in terms of ease of doing business.)
country/Region Rank(out of 190) ScoreMalaysia 15 80.6Thailand 27 78.5Indonesia 73 67.96East Asia & Pacific NA 63.4Philippines 124 57.7Lao PDR 154 51.3
pillar Score (100 best)
Rank out of 190
Overall Ease of Doing Business 56.7 124
Starting a Business 72.0 166
Dealing with Construction permits 68.6 94
Getting Electricity 87.5 29
Registering Property 57.5 116
Getting Credit 5.0 184
Protecting Minority Investors 43.3 132
Paying Taxes 71.8 94
Trading Across Borders 69.9 104
Enforcing Contracts 46.0 151
Resolving Insolvency 55.2 63
22Freepik. (2016). Country Flags. Retrieved from: https://www.flaticon.com/packs/country-flags/223Philippine Statistics Authority (2017). Philippine Population Surpassed the 100 Million Mark. Retrieved from: https://psa.gov.ph/content/philippine-population-
surpassed-100-million-mark-results-2015-census-population
ph Global competitiveness Index Score
Institutions
Overall Infrastructure
Ict adoption
labor market
market Size
macroeconomicStability
FinancialSystem
Business Dynamism
Innovationcapacity
Education andSkills
productmarket
health
Score (100 best)
100.0
80.0
60.0
40.0
20.0
0.0
EODB category Scores (100 best)of DoingBusiness
Starting aBusiness
Dealing withConstruction
permits
GettingElectricity
RegisteringProperty
GettingCredit
ProtectingMinorityInvestors
TradingAcross
Borders
EnforcingContracts
ResolvingInsolvency
Paying Taxes
100.0
80.0
60.0
40.0
20.0
0.0
philippine international economic outlook 2018
7 | DFA - Office of International Economic Relations
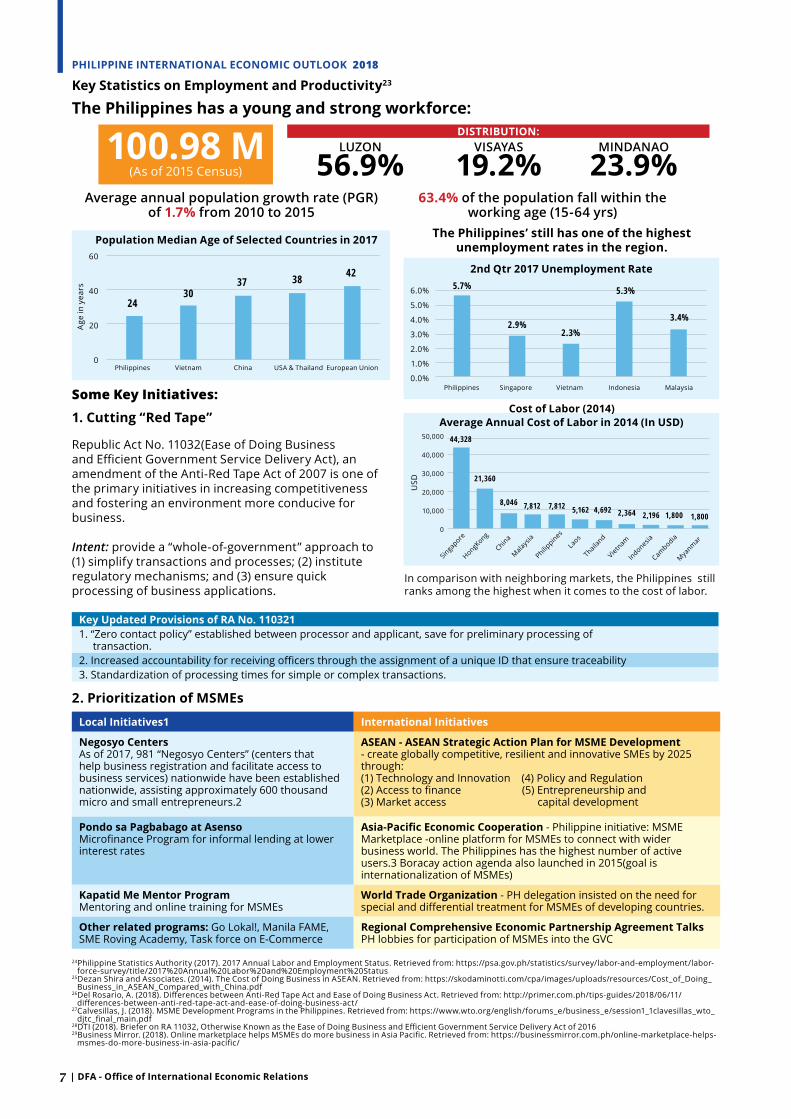
the philippines has a young and strong workforce:
1. cutting “Red tape”
Republic Act No. 11032(Ease of Doing Business and Efficient Government Service Delivery Act), an amendment of the Anti-Red Tape Act of 2007 is one of the primary initiatives in increasing competitiveness and fostering an environment more conducive for business.
Intent: provide a “whole-of-government” approach to (1) simplify transactions and processes; (2) institute regulatory mechanisms; and (3) ensure quick processing of business applications.
2. prioritization of mSmEs
some Key initiatives:
the philippines’ still has one of the highest unemployment rates in the region.
In comparison with neighboring markets, the Philippines still ranks among the highest when it comes to the cost of labor.
100.98 m(As of 2015 Census)
Average annual population growth rate (PGR) of 1.7% from 2010 to 2015
DIStRIButIOn:LUzOn
56.9%VISAyAS
19.2%MInDAnAO
23.9%63.4% of the population fall within the
working age (15-64 yrs)
key updated provisions of RA no. 1103211. “Zero contact policy” established between processor and applicant, save for preliminary processing of transaction.2. Increased accountability for receiving officers through the assignment of a unique ID that ensure traceability3. Standardization of processing times for simple or complex transactions.
local Initiatives1 International Initiatives
negosyo centersAs of 2017, 981 “Negosyo Centers” (centers that help business registration and facilitate access to business services) nationwide have been established nationwide, assisting approximately 600 thousand micro and small entrepreneurs.2
ASEAn - ASEAn Strategic Action plan for mSmE Development- create globally competitive, resilient and innovative SMEs by 2025 through:(1) Technology and Innovation (4) Policy and Regulation(2) Access to finance (5) Entrepreneurship and(3) Market access capital development
pondo sa pagbabago at AsensoMicrofinance Program for informal lending at lower interest rates
Asia-pacific Economic cooperation - Philippine initiative: MSME Marketplace -online platform for MSMEs to connect with wider business world. The Philippines has the highest number of active users.3 Boracay action agenda also launched in 2015(goal is internationalization of MSMEs)
kapatid me mentor programMentoring and online training for MSMEs
World trade Organization - PH delegation insisted on the need for special and differential treatment for MSMEs of developing countries.
Other related programs: Go Lokal!, Manila FAME, SME Roving Academy, Task force on E-Commerce
Regional comprehensive Economic partnership Agreement talksPH lobbies for participation of MSMEs into the GVC
24Philippine Statistics Authority (2017). 2017 Annual Labor and Employment Status. Retrieved from: https://psa.gov.ph/statistics/survey/labor-and-employment/labor-force-survey/title/2017%20Annual%20Labor%20and%20Employment%20Status
25Dezan Shira and Associates. (2014). The Cost of Doing Business in ASEAN. Retrieved from: https://skodaminotti.com/cpa/images/uploads/resources/Cost_of_Doing_Business_in_ASEAN_Compared_with_China.pdf
26Del Rosario, A. (2018). Differences between Anti-Red Tape Act and Ease of Doing Business Act. Retrieved from: http://primer.com.ph/tips-guides/2018/06/11/differences-between-anti-red-tape-act-and-ease-of-doing-business-act/
27Calvesillas, J. (2018). MSME Development Programs in the Philippines. Retrieved from: https://www.wto.org/english/forums_e/business_e/session1_1clavesillas_wto_djtc_final_main.pdf
28DTI (2018). Briefer on RA 11032, Otherwise Known as the Ease of Doing Business and Efficient Government Service Delivery Act of 201629Business Mirror. (2018). Online marketplace helps MSMEs do more business in Asia Pacific. Retrieved from: https://businessmirror.com.ph/online-marketplace-helps-
msmes-do-more-business-in-asia-pacific/
cost of labor (2014)
Philippines Vietnam China USA & Thailand European Union
Philippines
Philippines
SingaporeHongKong
ChinaM
alaysia
LaosThaila
ndVietn
amIn
donesiaCam
bodiaM
yanm
ar
Singapore Vietnam Indonesia Malaysia
Age
in y
ears
USD
60
40
20
0
6.0%
5.0%
4.0%
3.0%
2.0%
1.0%
0.0%
50,000
40,000
30,000
20,000
10,000
0
245.7%
44,328
21,360
8,046 7,812 7,812 5,162 4,692 2,364 2,196 1,800 1,800
2.9%2.3%
5.3%
3.4%
3037 38 42
population median Age of Selected countries in 2017
2nd Qtr 2017 unemployment Rate
Average Annual cost of labor in 2014 (In uSD)
key Statistics on Employment and productivity23

8DFA - Office of International Economic Relations |
phIlIppInE IntERnAtIOnAl EcOnOmIc OutlOOk 2018
Duterte Administration Flagship Infrastructure program: “Build Build Build”• Acceleration of spending on infrastructure to account for 5% of GDP through mobilization of public and private
partnerships, and foreign aid. • Share of expenditure allotted to public works is set to increase from 13.3% in 2018 to 14.8% in 2019. • As of 2017, there are 75 flagship infrastructure projects. • Proposed national budget in 2019 is PhP 3.76 trillion for infrastructure and education. Image Source: NEDA and PH APEC National Secretariat (2018)
4. Accelerate annual infrastructure spending to account for 5% of GDp, with public-private partnerships playing a key role.
30World Bank. (2018). Philippines Economic Update: Staying the course amid global uncertainty. Retrieved from: http://documents.worldbank.org/curated/en/209201538533339474/pdf/130421-PEU-October-2018-WEB3.pdf
31DPWH (2018). Office of the Undersecretary for International Economic Relations [Internal Source]32The World Bank Group. (2018). Agriculture, forestry and fishing, value added (% of GDP). Retrieved from: https://data.worldbank.org/indicator/NV.AGR.TOTL.ZS

philippine international economic outlook 2018
9 | DFA - Office of International Economic Relations
5. promote rural and value chain development toward increasing agricultural and rural enterprise productivity and rural tourism.
Agriculture Sector performanceCambodia is one of the leading countries in terms of agriculture’s share in overall production. The Philippines, experienced decline in value added of agriculture from 2009 onward.1
the philippine Rural Development project
The World Bank gave a satisfactory rating to the Philippine Rural Development Project (PRDP) of the Department of Agriculture. Under PRDP are strategic plans that regulate and consolidate the value chain commodities that will benefit Philippine provinces especially in meeting the demands of agriculture and fisheries sector.
The PRDP has launched 424 approved rural infrastructure sub-projects, 140 of which have already been completed. These include 84 Farm-to-Market Roads (FMRs) with an overall length of 355.59 Kilometers, 3 bridges, and 5 potable water supply systems.
6. Ensure security of land tenure to encourage investments, and address bottlenecks in land management and titling agencies
InItIAtIvES: 6.A national land Summit The inaugural National Land Summit was organized by the Department of Environment and
Natural Resources (DENR). Around 500 land management and titling agencies signed a Declaration of Support and Commitment, aiming to solve the bottlenecks in land administration and management.
6.B Rapid land tenure Appraisal (RltA)• Implemented by the DENR-Land Management Bureau• critical tool for achieving success on the socio-economic agenda number 6 • aims to assess land tenure situation in each barangay to determine number of workable lots
for titling”• aided by the use of a Consolidated Cadastral map (CCM), a digitalized map showing all the
lots in a barangay based on approved survey records
33 Philippine Statistics Authority. (2018). Selected Statistics on Agriculture. 34 Investment Priorities Plan. (2017). 35 The World Bank Group (2018). Philippines: Additional Funding to Boost Rural Development. Retrieved from: https://www.worldbank.org/en/news/press-
release/2018/01/12/philippines-additional-funding-to-boost-rural-development36 Department of Agriculture Philippine Rural Development Project. (2018). “Subproject by Stage as of November 22, 2018”. Retrieved from: http://prdp-mis.da.gov.ph/
web/Ibuild/stage37 DENR (2018). Land Summit Ends On A High Note With Commitments For More Efficient Titling. Retrieved from: http://www.denr.gov.ph/news-and-features/latest-
news/3820-land-summit-ends-on-a-high-note-with-commitments-for-more-efficient-titling.html38 DENR Land Management Bureau. “Briefing of Resource Speakers on the Implementation of the Rapid Land Tenure Appraisal”, 19 April 2018, Retrieved from: http://
lmb.gov.ph/index.php/resources/publications/90-resources/i-news/183-briefing-of-resource-speakers-on-the-implementation-of-the-rapid-land-tenure-appraisal 39NEDA. (2017). Socioeconomic Report 2017. Retrieved from: http://www.neda.gov.ph/
“The gross output in agriculture recorded a 3.96 percent expansion in 2017. All subsectors posted general output gains, except for fisheries.”33
The 2017 Investment Priorities Plan (link at the end of report) Details the agricultural areas recommended for investments. Some of these areas are commercial production of agricultural, fishery, and forestry products, improvement in infrastructure such as cold chain storage, packing centers, ice plants, and AAA slaughterhouses.34
Agriculturevalue of
production (billion uSD)
Growth (Jan-march ‘17 to ‘18)
total 4.1 1.8% Crops 2.2 2.1% Livestock 0.7 5.7% Poultry 0.7 5.2% Fisheries 0.6 -4.6%
Gross value Added of Agriculture (as share of GDp)
‘09 ‘10 ‘11 ‘12 ‘13 ‘14 ‘15 ‘16 ‘17
Philippines
Thailand
Vietnam
Indonesia
Cambodia
China
% o
f GD
P
40.0%
30.0%
20.0%
10.0%
0.0%
10DFA - Office of International Economic Relations |
phIlIppInE IntERnAtIOnAl EcOnOmIc OutlOOk 2018
7. Invest in human capital development, including health and education systems, and match skills and training to meet the demand of businesses and the private sector.
7.A. Quality of Education System
7.B Skills The Technical Education and Skills Development Authority (TESDA) has adopted a 17-Point Reform
and Development Agenda as its strategy to develop human capital and reduce social inequity. This strategy takes special focus on providing technical and skills training scholarships to marginalized sectors particularly for inmates and drug dependents, and links with other educational institutions and the agro-industry.
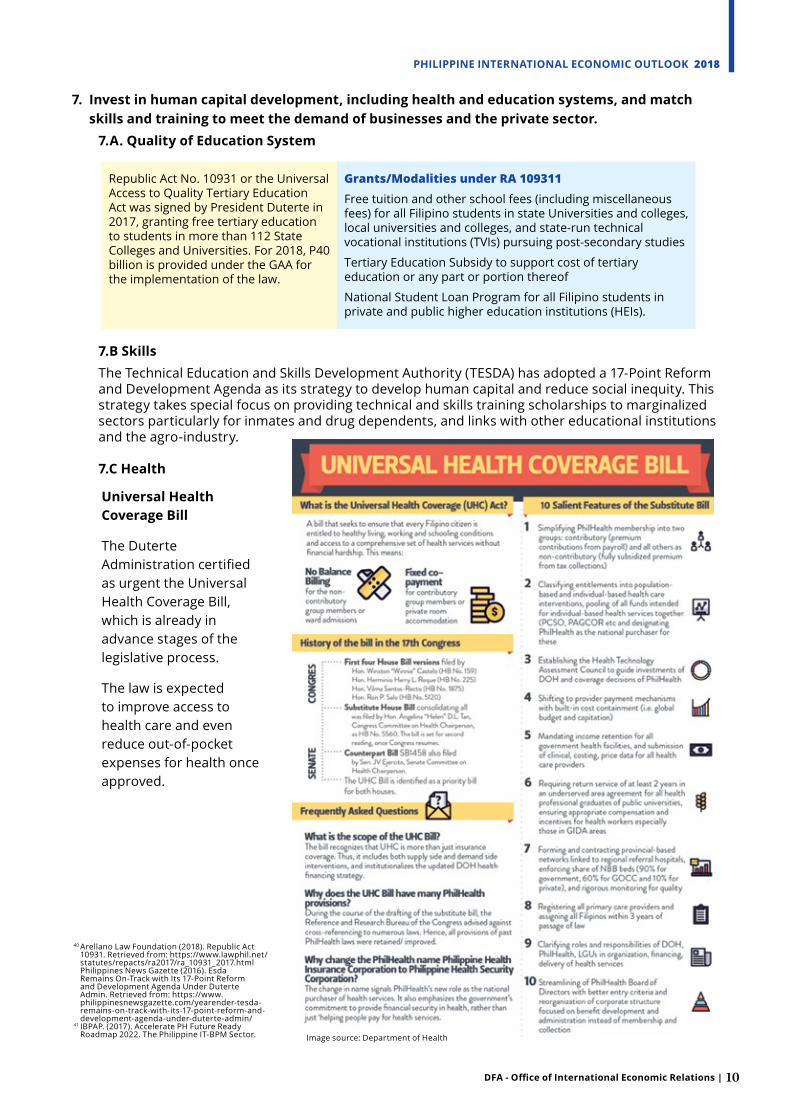
7.c health
Republic Act No. 10931 or the Universal Access to Quality Tertiary Education Act was signed by President Duterte in 2017, granting free tertiary education to students in more than 112 State Colleges and Universities. For 2018, P40 billion is provided under the GAA for the implementation of the law.
grants/modalities under ra 109311Free tuition and other school fees (including miscellaneous fees) for all Filipino students in state Universities and colleges, local universities and colleges, and state-run technical vocational institutions (TVIs) pursuing post-secondary studies
Tertiary Education Subsidy to support cost of tertiary education or any part or portion thereof
National Student Loan Program for all Filipino students in private and public higher education institutions (HEIs).
universal health coverage Bill
The Duterte Administration certified as urgent the Universal Health Coverage Bill, which is already in advance stages of the legislative process.
The law is expected to improve access to health care and even reduce out-of-pocket expenses for health once approved.
Image source: Department of Health
40 Arellano Law Foundation (2018). Republic Act 10931. Retrieved from: https://www.lawphil.net/statutes/repacts/ra2017/ra_10931_2017.html
Philippines News Gazette (2016). Esda Remains On-Track with Its 17-Point Reform and Development Agenda Under Duterte Admin. Retrieved from: https://www.philippinesnewsgazette.com/yearender-tesda-remains-on-track-with-its-17-point-reform-and-development-agenda-under-duterte-admin/
41 IBPAP. (2017). Accelerate PH Future Ready Roadmap 2022. The Philippine IT-BPM Sector.

philippine international economic outlook 2018
11 | DFA - Office of International Economic Relations
7.D Information technology – Business process management Industry (It-Bpm)
Worldwide IT-BPM sourcing market projected to be worth USD 249.4 billion in 2022 (5.8% growth from 2015 to 2022)
geographic summary: Philippine it-BPm industry (2016)
Philippines’ competitive edge in it-BPm Supply Demand
Latin America 9%Europe 11%Asia Pacific 73%
Americas 61.3%29.3% EMEA10.4% Asia Pacific
3rd largest English-speaking country, 12th most populous
500,000+college graduates per year, 93% literacy rate
Reliable power and building 100%-200% back-up
Offers a number of tax incentives for qualifying firms
kEy SERvIcES OFFERED By ph: 1. Contact Center and BPO2. IT Services3. Health information management Services4. Animation and Game Development5. Global In-house Centers
Labor cost among lowest in the world. No.1 in Voice: customer care, tech, financial services, sales, collections
Analytics and Knowledge Process Outsourcing capabilities
8. promote science, technology, and the creative arts to enhance innovation and creative capacity towards self-sustaining, inclusive development.
8.A Science and technology• The Duterte Administration continues to champion the country’s science and technology sector. • Harmonized National Research and Development Agenda by the Department of Science and
Technology (DOST), health, agriculture, natural resources, industry, energy and other sectors are fully supported through research and development (R&D).
• As of 2017, 1,154 R&D projects are being managed by DOST. R&D Centers are also being established in different regions across the country to help ensure nationwide access.
• The Philippines is also continuously developing its Space Technology Program, which launched its first satellite, Diwata 1 in 2016. Another launch is scheduled in 2018 for the country’s second satellite, Diwata 2.
• Republic Act 11035 otherwise known as the “Balik Scientist Act of 2016” was signed on 15 June 2018. The law provides for a comprehensive program to encourage Filipino experts in the fields of sciences and technology to return to the Philippines to do short to long term projects42.
8.B Innovationthe Global Innovation Index
The Global Innovation Index (GII) aims to capture the multi-dimensional facets of innovation, promoting long-term output growth, improved productivity, and job growth. The figure (right) shows its composites and corresponding scores for the Philippines, which ranked 73rd out of 126 economies.44
42 The World Bank Group (2018). The State of Social Safety Nets 2018. Retrieved from: https://openknowledge.worldbank.org/bitstream/handle/10986/29115/211254.pdf Department of Foreign Affairs and Trade (2017). Aid Program Performance Report 2016 to 2017. Retrieved from: https://dfat.gov.au/about-us/publications/Documents/philippines-appr-2016-17.pdf
43 Global Innovation index.(2018).History of the Global Innovation Index.Retrieved from: https://www.globalinnovationindex.org/about-gii44 Philippine News Agency, “PH Stays at Rank 73 in Global Innovation Index”. 11 July 2018. Retrieved from: http://www.pna.gov.ph/articles/1041099 45 Dutta, S., Lanvin, B., Wunsch-Vincent, S. (2018). The Global Innovation Index 2017. Retrieved from: https://www.globalinnovationindex.org/userfiles/file/reportpdf/gii-
full-report-2017.pdf46 Flemming, T.The Philippine Creative Economy: Toward a Baseline and a Programme. Tom Flemming Creative Consultancy
Office Space cost in 2014 in uSD0 200 400 600 800 1,000
235 Source: IBPAP 2017
258289306
343395
469959
9911,027China
BrazilIndia
IndonesiaPoland
MalaysiaMexico
ChileThailand
Philippines

12DFA - Office of International Economic Relations |
phIlIppInE IntERnAtIOnAl EcOnOmIc OutlOOk 2018
Benchmarks:Singapore 7th Vietnam 47th Thailand 51st
Indonesia 87th
*The Philippines leads Southeast Asia in ICT Services Exports.1
8.c promotion of Arts and creative Industries
Status of Philippine Creative Industry46
9. Improve social protection programs, including the government’s conditional cash transfer program, to protect the poor against instability and economic shocks.
9.A pOvERty AllEvIAtIOn In thE phIlIppInES: hOW WE cOmpARE
poverty Rates in Selected East Asian countries49
Innovation Composite Score (100 best)
Core Copyright Based Industries1
NCCA (2006)
DTI (2008)
DTI (2009)
Core CBI 323.8 187.8 272
Press & Literature
78.8 17.2 18.1
Motion, Picture & Video
1.4 8.2 59.9
Radio & TV 208.1 5.6 4.8
Photography 1.6 1.4 3.6
Software & Databases
15.7 118.2 130.3
Visual and Graphic Arts
0.01 0.7 0.5
Advertising 4.3 4.8 6
Core CBI as % of GDP
5.40% 2.40% 5.40%
• No formal definition for Creative Industries yet for the Philippines
• Creative industry initiatives largely remain decentralized with programs from both the private and public sector
• Data and information on creative market not yet established. Most relevant measure is the Annual Survey of Philippine Business and Industry (ASPBI) - Arts, Entertainment and Recreation Sector by the PSA
• There were three previous data consolidation attempts by the NCCA, DTI and IPOPHIL to measure the industry as defined in the table to the right
• In a Philippine government inter-agency meeting in 2018, representatives enumerated the following sectors under creative industry: “advertising, arts, architecture, design, fashion, film, music, performing arts, publishing, research & development, software, toys, games, TV, radio and video games, crafts and folk art, gastronomy arts, literature, media and many others.”1
• The DFA, in coordination with the National Commission for Culture and the Arts (NCCA) takes the lead in the promotion of the Creative Industry abroad. This is done through food, films, arts and visuals programs
• As of 2018, the DTI, with help from private sector partners, is developing a Creative Industry Roadmap
The Philippines experienced reduction in both poverty and extreme poverty, although at a slower pace compared to its neighbors. For the Philippines, the World Bank attributes these to three pivotal factors:
Source: World Bank estimates USD 1.90/day (extreme poverty) USD 3.20/day
country Start year End year Start year End yearChina (2005-2012) 18.8 1.9 43.5 20.2Indonesia (2006-2015 27.5 7.5 65.6 34.0Philippines (2006-2015) 14.5 6.6 38.4 27.0Thailand (2006-2013) 0.7 0.0 6.2 1.1Viet Nam(2006-2014) 19.5 2.8 51.3 11.6
1. The lower pace and less pro-poor pattern of growth
2. High inequality of income and wealth
3. Adverse impacts of natural disasters and conflict
47 DFA OUIER Cultural Diplomacy Unit. (2018). Information Kit.48 Mercado, P. (2018). Electronic Communication[Email]. 13 September 201849 The World Bank. (2018). Making Growth Work for the Poor. Retrieved from: http://documents.worldbank.org/curated/en/273631527594735491/pdf/126194-WP-
REVISED-OUO-9.pdf

philippine international economic outlook 2018
13 | DFA - Office of International Economic Relations
9.B kEy ph SOcIAl SAFEty nEt pROGRAmS
9.B.1 pantawid pamilyang pilipino program or 4ps
The Duterte Administration has continued to build on the gains of the past administration by championing the government’s conditional cash transfer program also known as “Pantawid Pamilyang Pilipino Program” (4Ps).
• Continues to be bedrock of administration’s social safety net
• Coverage expanded from 5 percent to more than 20 percent of the population since 2010
• Branded as “satisfactory” by the World Bank Group.
• In 2017, increased its monetary and non-monetary allotments (rice sacks) for its beneficiaries.50
Estimated General Impact51:• 1.5 million less poor Filipinos or an estimated poverty reduction impact of 1.4 percentage points
per year• 87% of 4Ps parents are now more optimistic about their situation and their children’s futures• Household heads, spouses, and other adults are more encouraged to work and set up their own
businesses
9.B.2 unconditional cash transfer program (uct)In 2018, the government implemented the unconditional cash transfer program, which provides a P200 monthly subsidy for the poorest families to mitigate the rising prices of goods and services as the initial impact of the Tax Reform for Acceleration and Inclusion (TRAIN) Law. The subsidy will increase to PhP 300 a month for 2019 and 2020.52
10. Strengthen implementation of the Responsible parenthood and Reproductive health law• The Duterte Administration signed
Executive Order No. 12 (EO.12): “Attaining and Sustaining ‘Zero Unmet Need for Modern Family Planning’ through the strict implementation of Republic Act 10354, or the ‘Reproductive Health Law”.
• Operationalized by the Department of Health (DOH) through its various programs and initiatives.
• According to the DOH, “Despite some setbacks in the implementation of the RA 10354, the modern Contraceptive Prevalence Rate (mCPR) rose from 43% in 2015 to 45% in 2016 or 5.7 million women using modern Family Planning methods in 2016” and “intensifies and accelerates the implementation of critical actions necessary to address the unmet need of Filipinos for modern family planning (mFP)”.
• From the 3rd quarter of 2016 to the 1st quarter of 2017 alone, approximately 3.4 million Family Planning users have benefited from the program.
50 Department of Health. (2017). A Performance Report of the Department of Health. Retrieved from: http://www.doh.gov.ph/sites/default/files/basic-page/First%20365%20Days.pdf
51 The World Bank Group. (2017). FAQs about the Pantawid Pamilyang Pilipino Program (4Ps). Retrieved from: https://www.worldbank.org/en/country/philippines/brief/faqs-about-the-pantawid-pamilyang-pilipino-program
52 Department of Social Welfare and Development. “DSWD to Begin Release of Unconditional Cash Transfer to 10 million Households by End of January”, 15 January 208. Retrieved from: https://www.dswd.gov.ph/dswd-to-begin-release-of-unconditional-cash-transfer-to-10-million-households-by-end-of-january/
53 Department of Health. (2017). “4th Annual RPRH Report”. Retrieved from: https://www.doh.gov.ph/sites/default/files/publications/4th%20Annual%20Report%20of%20the%20RPRH%20Law%20Implementation.pdf
54 Department of Health. “National Family Planning Program”. Retrieved from: https://www.doh.gov.ph/family-planning55 DTI (2018). Tradeline. Merchandise Balance. Retrieved from: http://www.tradelinephilippines.dti.gov.ph/web/tradeline-portal/merchandise-balance

14DFA - Office of International Economic Relations |
phIlIppInE IntERnAtIOnAl EcOnOmIc OutlOOk 2018
II. International Economic Relations
ii.a traDeII.A.1 kEy cOncEptS trade
• Change in ownership of material resources and services between one economy and another.
• Allows for (1) specialization of economies, (2) reduced prices through increased competition, (3) access to goods and services that otherwise are not locally available, and (4) innovation and technology transfer.
• Importance of trade to growth and development has been proven in theory, practice and research.
philippine trade in numbers
Trade as % of GDP (Trade-to-GDP ratio) is the most widely used measure of trade activity for an economy. The higher the ratio, the higher the share of trade in an economy.
Philippine Development Plan Export Revenue Target: uSD 130.8 billion by 2022
the philippine Export Development plan 2015 to 2017
key Export Sectors:1. Electronics2. Processed food and beverage3. Coconut oil4. Motor vehicle parts5 Computer and information related services6. Technical and trade related business services (both under Information Technology-Business Process Management)
Emerging Export Sectors:1. Activated carbon2. Chemicals3. Metal components4. Fresh and preserved fish
Definition59key Exports: “have one or more of the following features: US$1 billion export revenues in 2014; (ii) substantial adverse impact on local employment if the sector falters; and (iii) high growth potential /performance.”
Emerging Exports: “Products for which global demand has been increasing and for which Philippine export has been growing faster than world demand since 2006.”
Philippine Export Development Plan 2015-201722 JANUARY 2016
The PEDP, spearheaded by the Department of Trade and Industry (DTI), lays out a three-year multi-stakeholder plan to develop the competitiveness of the Philippine exports. PEDP focuses primarily on capacitating local export industries (the supply side of exports). Relevant portions for Philippine government agents based abroad: key and emerging sectors section. This section can provide focus for economic diplomacy and trade promotion activities (demand side of exports) so that initiatives for export supply and demand are synchronized.1The DTI will be releasing the new 2018 to 2022 PEDP in the near future.
56 OECD (2018), Trade in goods and services (indicator). doi: 10.1787/0fe445d9-en (Accessed on 25 November 2018)57 World Trade Organization. (2017). The WTO and the multilateral trading system. WTO ECampus Learning. 58 Department of Trade and Industry. Philippine Export Development Plan 2015-2017.

philippine international economic outlook 2018
15 | DFA - Office of International Economic Relations
II.A.2 tRADE In GOODS AnD SERvIcESTwo commonly used classifications of trade are (1) trade in goods (tangible products) and (2) trade in services (intangible products) .
II.A.2.1 tRADE In GOODS10 largest trade partners in 2017
Top Trading Partner: china (USD 25.4 billion)The top export destination: Japan, (USD 10.9 billion)Top import source: china (USD 17.5 billion)
Note: 10 largest trading partners account for uSD 128 billion or 78.9% of total trade.
philippine Export Growth
largest traded commodities by valueTop export: digital monolithic integrated circuits, (USD12.4 billion or 18% of total exports).Top import: petroleum oil products, (USD 6.4 billion or 6.7% of total imports).2017 trade balance: -27.4B (deficit)
• Philippine exports continue to rise.
• From USD 48.3(2011) to USD 68.7 billion (2017),
• 17.2% growth over a 6-year period.
total trade value: 164.8 Bvalue of Exports: 68.7 B value of Imports: 96.1 B
top Exports value (% of total) top Imports value
(% of total)
1. Digital monolithic integrated circuits 12.4B(18%) 1.Petroleum oils 6.4B(6.7%)
2. Semiconductors 4.7B(7%) 2.Digital monolithic integrated circuits 5.3B(5.6%)
3. Storage Units 3.3B(5%) 3. Materials and supplies for manufacture of semiconductors 4.0B(4.1%)
4. Electrical and Electronic Machinery 1.3B(2%) 4. Materials and supplies for manufacture of electrical equipment and machinery 2.3B(2.4%)
5. Joinery and carpentry of wood 1.1B(2%) 5. Light petroleum oils 2.2B(2.3%)
59 Department of Trade and Industry. Philippine Export Development Plan 2015-2017.60 World Trade Organization. (2017). The WTO and the multilateral trading system. WTO ECampus Learning. 61 Department of Trade and Industry. (2018). Tradeline Merchandise Balance. Retrieved from: http://www.tradelinephilippines.dti.gov.ph/web/tradeline-portal/
merchandise-balance62 Department of Trade and Industry. (2018). Tradeline Merchandise Balance. Retrieved from: http://www.tradelinephilippines.dti.gov.ph/web/tradeline-portal/
merchandise-balance
16DFA - Office of International Economic Relations |
phIlIppInE IntERnAtIOnAl EcOnOmIc OutlOOk 2018
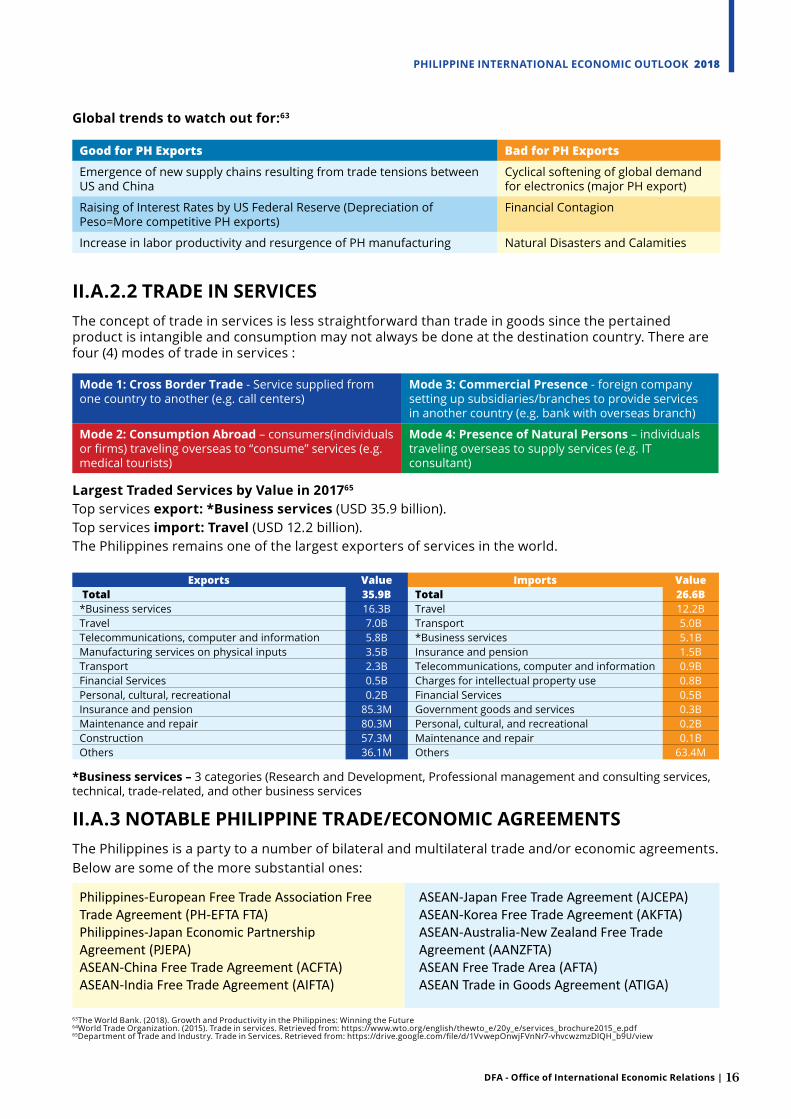
Global trends to watch out for:63
II.A.2.2 tRADE In SERvIcESThe concept of trade in services is less straightforward than trade in goods since the pertained product is intangible and consumption may not always be done at the destination country. There are four (4) modes of trade in services :
largest traded Services by value in 201765
Top services export: *Business services (USD 35.9 billion). Top services import: travel (USD 12.2 billion). The Philippines remains one of the largest exporters of services in the world.
good for PH exports Bad for PH exportsEmergence of new supply chains resulting from trade tensions between US and China
Cyclical softening of global demand for electronics (major PH export)
Raising of Interest Rates by US Federal Reserve (Depreciation of Peso=More competitive PH exports)
Financial Contagion
Increase in labor productivity and resurgence of PH manufacturing Natural Disasters and Calamities
mode 1: cross Border trade - Service supplied from one country to another (e.g. call centers)
mode 3: commercial presence - foreign company setting up subsidiaries/branches to provide services in another country (e.g. bank with overseas branch)
mode 2: consumption Abroad – consumers(individuals or firms) traveling overseas to “consume” services (e.g. medical tourists)
mode 4: presence of natural persons – individuals traveling overseas to supply services (e.g. IT consultant)
exports Value imports Value total 35.9B total 26.6B*Business services 16.3B Travel 12.2BTravel 7.0B Transport 5.0BTelecommunications, computer and information 5.8B *Business services 5.1BManufacturing services on physical inputs 3.5B Insurance and pension 1.5BTransport 2.3B Telecommunications, computer and information 0.9BFinancial Services 0.5B Charges for intellectual property use 0.8BPersonal, cultural, recreational 0.2B Financial Services 0.5BInsurance and pension 85.3M Government goods and services 0.3BMaintenance and repair 80.3M Personal, cultural, and recreational 0.2BConstruction 57.3M Maintenance and repair 0.1BOthers 36.1M Others 63.4M
*Business services – 3 categories (Research and Development, Professional management and consulting services, technical, trade-related, and other business services
II.A.3 nOtABlE phIlIppInE tRADE/EcOnOmIc AGREEmEntSThe Philippines is a party to a number of bilateral and multilateral trade and/or economic agreements. Below are some of the more substantial ones:
Philippines-European Free Trade Association Free Trade Agreement (PH-EFTA FTA)Philippines-Japan Economic Partnership Agreement (PJEPA)ASEAN-China Free Trade Agreement (ACFTA)ASEAN-India Free Trade Agreement (AIFTA)
ASEAN-Japan Free Trade Agreement (AJCEPA)ASEAN-Korea Free Trade Agreement (AKFTA)ASEAN-Australia-New Zealand Free Trade Agreement (AANZFTA)ASEAN Free Trade Area (AFTA)ASEAN Trade in Goods Agreement (ATIGA)
63The World Bank. (2018). Growth and Productivity in the Philippines: Winning the Future64World Trade Organization. (2015). Trade in services. Retrieved from: https://www.wto.org/english/thewto_e/20y_e/services_brochure2015_e.pdf65Department of Trade and Industry. Trade in Services. Retrieved from: https://drive.google.com/file/d/1VvwepOnwjFVnNr7-vhvcwzmzDlQH_b9U/view

philippine international economic outlook 2018
17 | DFA - Office of International Economic Relations
II.B. FOREIGn InvEStmEntSII.B.1 kEy cOncEptSThe two most widely used categories of cross-border investments are Portfolio (transactions involving debt or equity) and Direct (transactions which are not only monetary in nature, and wherein investors retain significant control over their investments). This report will focus more on the latter type.67
Growth of Foreign Direct Investment in the philippines
II.B.2 lARGESt SOuRcES OF FOREIGn DIREct InvEStmEntS
II.B.3 lARGESt FOREIGn InvEStmEntS InFlOWS (By SEctOR)Sectors which received largest Foreign Direct investment flows in 2017
Net foreign direct investment flows increased from +USD 3.7 billion in 2013 to +USD 10.1 billion in 2017, registering a significant growth (CAGR) of 28.5% over a four (4) year period.
The largest source of foreign direct investment in 2017 is the netherlands with approximately USD 1.6 billion of net investment flows. The united States follows with USD 472.6 million.
Electricity, gas, steam, and air conditioning supply received the largest net investment flow, amounting to USD 1.4 billion (13.8% share of total). This was closely followed by manufacturing, receiving a total of USD 1.2 billion net investment flows (11.6% of total).
countryNet Investment flow
(in millions UsD) % share of totalThe Netherlands 1,566.69 15.6%
USA 472.63 4.7%Kuwait 60.02 0.6%
Germany 44.38 0.4%Luxembourg 41.57 0.4%
China 28.79 0.3%Switzerland 13.09 0.1%
France 9.41 0.1%UK 9.40 0.1%
India 8.81 0.1%total 10,057
industry/sector net investment flow
share of total
Electricity, gas, steam and air conditioning supply 1,383.71 13.8%Manufacturing 1,166.02 11.6%Real estate activities 247.82 2.5%Construction 162.38 1.6%Financial and insurance activities 134.38 1.3%Professional, scientific and technical activities 65.83 0.7%Transportation and storage 49.49 0.5%Information and communication 37.77 0.4%Arts, entertainment and recreation 27.85 0.3%Human health and social work activities 21.30 0.2%
66 Eurostat. EU international trade in other business services. Retrieved from: https://ec.europa.eu/eurostat/statistics-explained/index.php/EU_international_trade_in_other_business_services#R.26D_services.2C_professional_and_management_consulting.2C_technical.2C_trade-related_and_other_business_services
67 International Monetary Fund. (2014). BPM6 compilation guide. Retrieved from: https://www.imf.org/external/pubs/ft/bop/2014/pdf/GuideFinal.pdf68 Bangko Sentral ng Pilipinas. (2018). Net foreign direct investments. Retrieved from: http://www.bsp.gov.ph/statistics/efs_bop2.asp69 Bangko Sentral ng Pilipinas. (2018). Net foreign direct investments. Retrieved from: http://www.bsp.gov.ph/statistics/efs_bop2.asp

18DFA - Office of International Economic Relations |
phIlIppInE IntERnAtIOnAl EcOnOmIc OutlOOk 2018
II.B.4 2017 philippine Investment priorities plan (Ipp)
II.c tOuRISmII.c.1 thE GROWInG tOuRISm SEctOR
The government has identified preferred investment activities in line with the President’s 10-point socioeconomic agenda, Ambisyon Natin 2040, and the Philippine Development Plan 2017-2022. These are enumerated in an annual listing of priority investment areas, titled, the Philippine Investment Priorities Plan (IPP). Below are the identified priority areas for investment.
preferred Investment Activities1. Agro Processing and Agriculture2. Strategic Services such as IT, telecommunications, digital technologies3. Healthcare Services4. Mass housing5. Infrastructure Projects 6. Innovation drivers such as Research and Development and inclusive business models7. Environment and energy
notes:1. More on the IPP can be found on the listed reference. 2. Not all sectors allow foreign investments. Some sectors prohibit or limit. (See Foreign Investment Negative List link on last page)72
Tourism is another bright spot in the economy. The Department of Tourism has reported 6.62 million inbound visitors in 2017, surpassing its target of 6.5 million and up by 10.6% from 5.96 million in 2016.
For 2017, earnings generated from tourism activities amounted to USD 6.7 billion. Receipts rose by 45.8% from the estimated expenditure of USD 4.9 billion in 2016. Target no. of arrivals for 2018 is 7.4 million.
the figure below highlights key stages in starting a business in the philippines.
Source: DTI-BOI (2018)
70 Bangko Sentral ng Pilipinas. (2018). Net foreign direct investments. Retrieved from: http://www.bsp.gov.ph/statistics/efs_bop2.asp71 2017 Philippine Investment Priorities Plan. Retrieved from: http://boi.gov.ph/ufaqs/boi-investment-priorities-plan/72 Executive Order. (2018). 11th Regular Foreign Negative Investment list. Retrieved from: http://www.officialgazette.gov.ph/downloads/2018/10oct/20181029-EO-65-
RRD.pdf

philippine international economic outlook 2018
19 | DFA - Office of International Economic Relations
II.c.2 10 lARGESt tOuRISm mARkEtS In 2017 (by number of tourist arrivals)
South korea remains the top source of foreign tourist arrivals in 2017, followed by china, uSA, Japan and Australia, respectively. Seven of the top ten sources come from the Asia-pacific region, with a combined number of 3.97 million visitors or 60% of the total number of foreign visitors in 2017.73
II.D Foreign Aid (Official Development Assistance [ODA])Indicative total ODA (loans and Grants) Ranking by Fund Source in millions uSD
II.E Economic Relations with Selected Regional Organizations Asia pacific Economic cooperation (ApEc)
The Asia-Pacific Economic Cooperation (APEC) is a regional economic forum established in 1989 with 21-member economies from the Asia-Pacific region. APEC is considered the most successful economic cooperation platform in the world, due to its non-binding nature and serves as an incubator for new ideas for economic development. APEC 2019 will be hosted by Chile and will have the theme, “Connecting People and Building the Future”, focusing on (1) Services and Digital Economy, (2) Connectivity for Inclusive Trade, and (3) Women and Economic Growth.74
Japan is the Philippines’ biggest donor, providing around USD 6.1 billion in total ODA.
fund source loan amount* grant amount total ODa % share rankJapan 5,962.62 141.33 6,103.94 40.26 1World Bank 3,094.21 33.43 3,127.64 20.63 2ADB 2,604.65 74.64 2,679.28 17.67 3USA - 806.76 806.76 5.32 4Korea 480.74 77.96 558.70 3.68 5Australia - 467.72 648.70 4.18 6United Nations System 112.12 254.77 389.79 2.51 7France 306.52 9.27 315.79 2.08 8AIIB 207.60 - 207.60 1.37 9EU - 167.39 167.39 1.10 10China 62.09 62.28 124.37 0.82 11Germany - 76.04 76.04 0.50 12OFID 51.61 - 51.61 0.34 13Italy 31.23 5.44 36.68 0.24 14Canada - 30.31 30.31 0.20 15Austria 24.44 - 24.44 0.16 16Spain - 9.30 9.30 0.06 17New Zealand - 7.97 7.97 0.05 18tOtal 12,937.82 2,224.60 15,162.42 100.00
*Loan amounts of non-USD denominated loans based on Q2 2018 average
73 Department of Tourism. (2018). Industry performance for travel and tourism. Retrieved from: http://www.tourism.gov.ph/industry_performance_dec_2017.aspx74 Yanez, R. (2018). APEC Chile 2019: Connecting people, building the future. Retrieved from: https://www.direcon.gob.cl/wp-content/uploads/2018/08/APEC-Chile-2019-
English-17.08.2018.pdf

20DFA - Office of International Economic Relations |
phIlIppInE IntERnAtIOnAl EcOnOmIc OutlOOk 2018
APEC is ending 2018 as a year where differing views on the region resulted in a lack of consensus to adopt a Leaders’ Declaration and Ministerial Statement – the first time no consensus was achieved among Economic Leaders. Nevertheless, lack of consensus need not overshadow work that continues to be done in the forum. The Philippines highlighted its support for the multilateral trading system, advocacy for inclusive globalization and preparations for the digital economy, in alignment with the APEC Internet and Digital Economy Roadmap (AIDER). The Philippines continues to champion the regional market access of Philippine MSMEs under the Boracay Action Agenda (BAA) adopted in 2015.
Meanwhile, work on formulating a new vision for APEC beyond the year 2020 is underway. The work of the APEC Post 2020 Vision Group (APEC AVG) started in Port Moresby in 2018. Each economy has appointed an expert to constitute the group that is tasked to recommend a new vision for APEC that continues the work under the Bogor Goals and incorporating other aspects in furtherance of regional economic cooperation – taking in consideration the impact of the fourth industrial revolution and the third unbundling of globalization.
As of 2017, APEC economies are responsible for 84% of the total trade of the Philippines worldwide. The APEC region is responsible for 60% of the global GDP, and covers 49% of world population. Total Philippine exports to APEC stood at USD 56.3 billion or 82% of total exports worldwide. Total imports from APEC economies was at USD 81.7 billion or 85% of total imports from Philippine trade partners.
APEC economies are responsible for 15% of total investments into the Philippines at USD 1.5 Billion (Net FDI flows as of 2017), and comprise 5,466,540 out of 6,620,908 (83%) of tourist arrivals in 2017.
the philippines’ value of traded Goods with Selected trading Blocks (2017)
Outlook for the Asia-pacific Region and ApEc Asia Pacific Region Expected Growth2018: 3.9% 2019: 3.7%risks to growth 1. Increased Protectionism and trade tensions2. Possible Slowdown in world trade growth3. Slowdown in Chinese economy4. Lack of political leadership5. Corruption
Asia Pacific economies projected to grow the fastest: Chile, Peru, Australia, Colombia, Mexico, Colombia Brunei (latter 3 are commodity rich economies)
the Bogor goals76Set of Goals for realizing free and open trade in the Asia Pacific agreed by APEC member economies in Bogor, Indonesia in 1994.
notable Progress:1. Tariff Reduction –from average of 16.9%(1989) to 5.3%(2017)2. Intellectual Property Rights improvement3. Average days to start a business – 37 (2006) to 12.4 (2017) in APEC economies4. Total Regional Trade Agreements signed:175(2017) from <10 (1989)
Stagnant/worse off areas:1. Prevalence of Foreign Ownership 5.3%(2008) to 4.9%(2017)
mixed results:1. Services Liberalization
75 Pedrosa, E. et al. (2018). State of the Region 2018-2019. Pacific Economic Cooperation Council76 APEC Policy Support Unit. (2018). APEC’s Bogor Goals Progress Report. Retrieved from: https://www.apec.org/Publications/2018/11/APEC-Bogor-Goals-Progress-
Report
WorldUSD 164.8
ApEc*USD 137.9 BASEAn+6
USD 100.4 B
ASEAnUSD 35.4 B
*Excludes:Laos,
Cambodia,Myanmar

philippine international economic outlook 2018
21 | DFA - Office of International Economic Relations
Blockchain77Arose from Bitcoin; Incorruptible digital public record of transactions populated by network members (.e.g. google spreadsheets)
Big Data78“The collection, storage, management, analysis and visualization of extensive, heterogenous datasets.”
Artificial intelligence79“Building machines which are capable of thinking like humans.”
internet of things“The concept of connecting any device with an on and off switch to the internet (or to each other)”4
II.F European union (Eu)trade Statistics (In billion uSD) Trade between the Philippines and the European Union grew by 5.3% over the last 5 years. This was mainly due to the increase in trade with vessels for transfer of goods and services and storage units, especially for exports.
top traded commoditiesTop Export: Digital monolithic integrated circuits Top Import: Aeroplanes and other aircrafttrade Balance: 2.9B (surplus)
year total trade
PH Exports
PH Imports
Balance of trade
2013 12.8 6.6 6.2 0.3
2014 14.3 6.7 7.6 -0.9
2015 13.8 7.2 6.7 0.5
2016 13.7 7.0 6.7 0.2
*2017 15.7 9.3 6.4 2.9
Growth 5.3% 9.2% 0.8%
*preliminary data. Figures in billion uSD
trade with World: 164.8 B Total Trade with EU 15.7 Billion Exports 9.3B Imports 6.4B
top Exports value (% of total) top Imports value
(% of total)
1.Digital monolithic integrated circuits 1.1B(15.6%) 1. Aeroplanes and other aircraft 0.6B(9.5%)
2. Semiconductor devices manufactured from materials on consignment basis
0.8B(11.7%) 2. Materials and supplies for manufacture of semiconductors
0.6B(8.3%)
3. Coconut (copra) oil, crude 0.5B(7.8%) 3. Medicaments consisting or mixed or unmixed products for therapeutic or prophylactic uses
0.3B(4.5%)
4. Vessels for the transport of goods and persons
0.3B(4.2%) 4. accessories and supplies for manufacture of semiconductors
0.3B(3.8)
5. Input or output units, whether or not containing storage units in the same housing
0.2B(2.7%) 5. Other parts of aeroplanes and helicopters
0.2B(2.6%)
Generalized System of preferences (GSp)
• A preferential tariff system that gives certified countries such as the Philippines tariff-free access to the EU market for over 6,000 product lines.
• The Philippines is the only ASEAN country with GSP+ status and has benefitted from GSP+ since 2014. 1
Benefits for the phTotal trade between Philippines and EU grew by 13.7% since 2015.
Philippine exports to the EU grew by 36% (year-on-year) making the EU, collectively, the second largest export destination. 2
77 Blockgeeks. (2018). What is Blockchain Technology? A Step-by-Step Guide For Beginners. Retrieved from: https://blockgeeks.com/guides/what-is-blockchain-technology/
78 International Telecommunications Union. (2015). ITU members agree international standard for Big Data. Retrieved from: http://www.itu.int/net/pressoffice/press_releases/2015/66.aspx#.XAt4JhMzZN0.
79 Marr, B. (2017). The Complete Beginners’ Guide to Artificial Intelligence. Retrieved from: https://www.forbes.com/sites/bernardmarr/2017/04/25/the-complete-beginners-guide-to-artificial-intelligence/#4751928e4a83
80 Morgan. J. (2018). A Simple Explanation Of ‘The Internet Of Things’. Retrieved from: https://www.forbes.com/sites/jacobmorgan/2014/05/13/simple-explanation-internet-things-that-anyone-can-understand/#6784fb981d09
81 Department of Trade and Industry. (2018). Market Profile: European Union. Retrieved from: http://tradelinephilippines.dti.gov.ph/web/tradeline-portal/market-profile
82 Board of Investments, Department of Trade and Industry (2018). Investment climate and business opportunities in the Philippines 83 EU-Philippines Business Network (2017). Advocacy papers. The EU and the Philippines: Partnering for progress and prosperity. EU-Philippines Business Network,
Makati City, Philippines.84 Department of Trade and Industry. “Philippines-European Free Trade Association (EFTA) Free Trade Agreement (FTA)”. Retrieved from https://www.dti.gov.ph/
international-commitments/bilateral-engagements/efta-fta
Feature ApEc Discussion topic: 3rd unbundling of Globalization – the Digital EconomyThe next wave that can reduce the cost of moving (1) goods, (2) ideas, and (3) people.
key components of the Digital Economy (“4 horsemen”)

22DFA - Office of International Economic Relations |
phIlIppInE IntERnAtIOnAl EcOnOmIc OutlOOk 2018
key Benefits of ph-EFtA FtA
States have a network of 28 FTAs with a total of 39 partners outside the European Union. ph-EFtA trade Relations in numbers
*All value of commodities in million USD
II.G philippines-European Free trade Association Free trade Agreement (ph-EFtA FtA)
Agreement entered into force in 01 June 2018. The Philippines ratified its free trade agreement with the European Free Trade Association EFTA, that includes the Switzerland Confederation, the Kingdom of Norway, the Republic of Iceland and the Principality of Liechtenstein.
through PH-efta fta, the Philippines…Is provided duty free market access for all industrial and fisheries tariff lines.
Is secured tariff concessions on substantially all Philippine agriculture exports to EFTA.
may qualify for zero tariffs for preparations of meat/fish, even if they are imported.
Will have entry and temporary presence of intra-corporate transferees (covering executives/managers and specialists) and business visitors allowed.
Between 2012 and 2017merchandise trade between ph and EFtA States increased by 2%-ph exports to EFtA states increased by 45%total value of trade in 2017: uSD 900 million
top ph Exports value (%) top ph Imports value (%)
Total Value 516 Total Value 384
Precious metals 266(52%) Pharmaceuticals 128(33%)
Electrical machinery 114(22%) Clocks and watches 51(13%)
Machinery and mechanical appliances 27(5%) Machinery and
mechanical appliances 30(8%)
Optical, surgical or medical instruments 27(5%) Electrical machinery 29(8%)
Seafood 12(2%) Seafood 18(5%)
85 Reith, S. & Stauffer, N. (2018). EFTA and the Philippines hold trade promotion seminars. Retrieved from: http://www.efta.int/Free-Trade/news/EFTA-and-Philippines-hold-trade-promotion-seminars-510701
86 Department of Trade and Industry. “Philippines-European Free Trade Association (EFTA) Free Trade Agreement (FTA)”. Retrieved from https://www.dti.gov.ph/international-commitments/bilateral-engagements/efta-fta
87 Boumphrey, S.(2014). Succeed in emerging markets: Selection, strategy and first steps. Euromonitor International. Retrieved from: https://go.euromonitor.com/succeed-emerging-markets-selection-strategy-first-steps.html
88 Department of Trade and Industry. (2018). Summary Reports. DTI Tradeline. Retrieved from: http://www.tradelinephilippines.dti.gov.ph/web/tradeline-portal/summary-reports
89 Boumphrey, S.(2014). Succeed in emerging markets: Selection, strategy and first steps. Euromonitor International. Retrieved from: https://go.euromonitor.com/succeed-emerging-markets-selection-strategy-first-steps.html

philippine international economic outlook 2018
23 | DFA - Office of International Economic Relations
III. Emerging Economic Relations
iii. Key cOncePts
The Philippines, as of 2018, has trading activities with more than 200 economies.88 In an attempt to streamline and focus discussions into a manageable number of high potential markets, the authors of this publication attempted to identify select countries and trading blocs based on certain evidence-based parameters.
iii. a emerging Bilateral trade Partners Analysis of selected emerging market indicators recommended by Boumphrey (2014) revealed the following 10 emerging trade partners, and corresponding data for each criterion used.
*In million USD, **In billion USD. Total PH Trade in 2016: USD 141.5 billionData Source: Department of Trade and Industry, World Bank, Philippine Statistics AuthorityForemost consideration is the country’s trade growth and value of traded merchandise with the Philippines.
Most of the criteria displayed are straightforward, with the exception of “Trade Value with Selected ASEAN neighbor”, which uses trade data of an ASEAN country with slightly similar products offered with the Philippines. This aims to serve as a proxy to indicate the accessibility of goods from one source to another.
iii.B africaTop PH trading partner in Africa is the Southern Region. This encompasses mostly South African Development Community (SADC) members among which are some of Africa’s largest economies (e.g. South Africa).
African market characteristics:• Region as a whole estimated to be World’s
second fastest growing economy by African Development Bank (projected to grow by 4.1% in 2019)
• Has several Regional Economic Communities (RECs)
“An emerging market strategy is a long term one, and step one on the path to success
is to choose wisely.” 87
MarketMerchandise Trade with PH Value in 2016*
Trade Growth with PH
(2011 to 2016)
Trade Value with Selected ASEAN
Neighbor*
Openness to trade (trade as
% of GDP)GDP ** GDP Growth
(2014 to 2017)
Population Size
(in million)Fiji 32.9 >1,000% 29.1 66.8% 5.1 8.2% 0.9Iraq 14.1 >1,000% 91.2 43.9% 197.7 4.9% 38.3Ukraine 232.7 >1,000% 872.6 82.6% 112.2 -5.4% 44.8Kuwait 1,050.0 >1,000% 414.8 74.3% 120.1 1.2% 4.1Malta 182.0 >1,000% 41.5 66.4% 12.5 22.8% 0.4Paraguay 7.9 906% 81.8 69.1% 29.7 7.9% 6.8Cambodia 38.1 246% 450.7 117.0% 22.2 22.3% 16.0Bulgaria 118.2 170% 119.9 112.8% 56.8 11.5% 7.1Nigeria 31.6 181% 1,598.8 24.5% 375.8 0.6% 190.8Romania 39.1 142% 134.6 74% 211.8 73.7% 19.6
ph trade with Different African Regions
2016 2017
PH Exports
PH Imports
PH Exports
PH Imports
total 268.3 130.0 195.7 174.9
Central 0.0 0.1 0.0 0.0
Eastern 15.4 33.0 22.5 23.3
Middle 3.4 7.1 4.1 20.5
Northern 30.4 25.4 32.6 69.9
Southern 119.5 41.0 119.4 56.6
Western 99.6 23.4 17.1 4.6
When selecting an emerging market, Boumphrey (2014) recommends looking at 4 major indicator categories:1. Market2. Population3. Access4. Business Environment *Entire report can be found through the link in section V
90 United Nations Economic Commission for Africa. (n.d.) Regional Economic Communities. Retrieved from: https://www.uneca.org/oria/pages/regional-economic-communities
91 Mutambara, T. (2013). Africa-Asia trade versus Africa’s trade with the North: Trends and trajectories. Retrieved from: https://www.ajol.info/index.php/aref/article/view/91063/80497

24DFA - Office of International Economic Relations |
phIlIppInE IntERnAtIOnAl EcOnOmIc OutlOOk 2018
recent Developments• Trade between Africa and Asia (mainly China, Japan, Korea),
is growing faster than the former’s trade with Europe, its traditional trading partner.
• Intra-African trade is growing the fastest. In 2018, the Continental Free Trade Agreement was signed by 44 African Nations. Commitment to cut tariffs on 90% of goods traded within the continent.
• Trade between Africa and the Philippines has generally decreased from USD 771 million (2013) to USD 370 (2017). This decrease warrants further study as Africa has a sizeable untapped market that could provide ample business opportunities.
iii.c south asiaselected south asian markets trade Data
2016 2017
PH Exports
PH Imports
PH Exports
PH Imports
total 268.3 1,643.2 195.7 1,930.8
Bangladesh 15.4 32.3 22.5 38.2India 3.4 1,064.5 4.1 1,482.8
Pakistan 30.4 110.3 32.6 211.5
Sri Lanka 119.5 17.5 119.4 16.7
Figures in million USD
Scandinavian markets and trade Data1
2016 2017
PH Exports
PH Imports
PH Exports
PH Imports
Sweden 22.1 122.0 36.3 135.5Norway 5.5 54.5 6.5 45.1
Denmark 36.7 128.3 36.0 149.7Finland 27.1 291.8 41.9 183.4
Figures in million USD
Trade between South Asia as a whole and the Philippines grew by 22% from USD 1.1 billion in 2013 to USD 2.6 billion in 2017. Most of this growth is due to import sourcing from South Asia. The table on the right further illustrates the breakdown of trade using the region’s 4 largest economies.
iii.D scandinavia• Scandinavia forms a cluster of some of the largest economies in Europe.• There is already increased access between the Philippines, and Norway and Sweden’s markets,
through the PH-EFTA FTA. • Region expected to grow 4% in 2018 and 2019
comparison of top ph Exports to Scandinavia with Other ASEAn countries
top imports from PH Value BenchmarkConsumer Goods 12.9 Vietnam (264.7)Capital Goods 8.3 Vietnam (684.2)Machinery and Electronics 33.1 Vietnam (681.1)
top imports from PH Value BenchmarkConsumer Goods 18.6 Vietnam (304.9)Machinery and Electronics 16.0 Malaysia (167.5)Capital Goods 15.0 Thailand (126.5)
top imports from PH Value BenchmarkConsumer Goods 21.4 Vietnam (268.4)Capital Goods 17.3 —Machinery and Electronics 14.7 Indonesia (57.2)
Figures on selected Scandinavian countries’ imports from the Philippines and the corresponding benchmark (highest import source from ASEAN in 2016) ASEAN country in 2016.
All figures are in million USD.
sweden
norway
Denmark
Recommended Areas of Research for Economic Diplomacy practitioners in Emerging markets
1. Nature of existing goods and services traded 2. Potential of other goods and services (match covered country’s top imports with Philippine’s top exports which have low market presence) 3. Presence of Philippine companies
4. Shipment cost to and from the Philippines5. Flight routes6. Culture, especially presence of Creatives (See Part I.8.C) 7. Growth of consumer size, particularly the middle class 8. Regulation, business registration processes, and incentives
Source: United Nations Economic Commission for Africa. (n.d.)
92 Department of Trade and Industry. (2018). Summary Reports. DTI Tradeline. Retrieved from: http://www.tradelinephilippines.dti.gov.ph/web/tradeline-portal/summary-reports
93 Department of Trade and Industry. (2018). Summary Reports. DTI Tradeline. Retrieved from: http://www.tradelinephilippines.dti.gov.ph/web/tradeline-portal/summary-reports
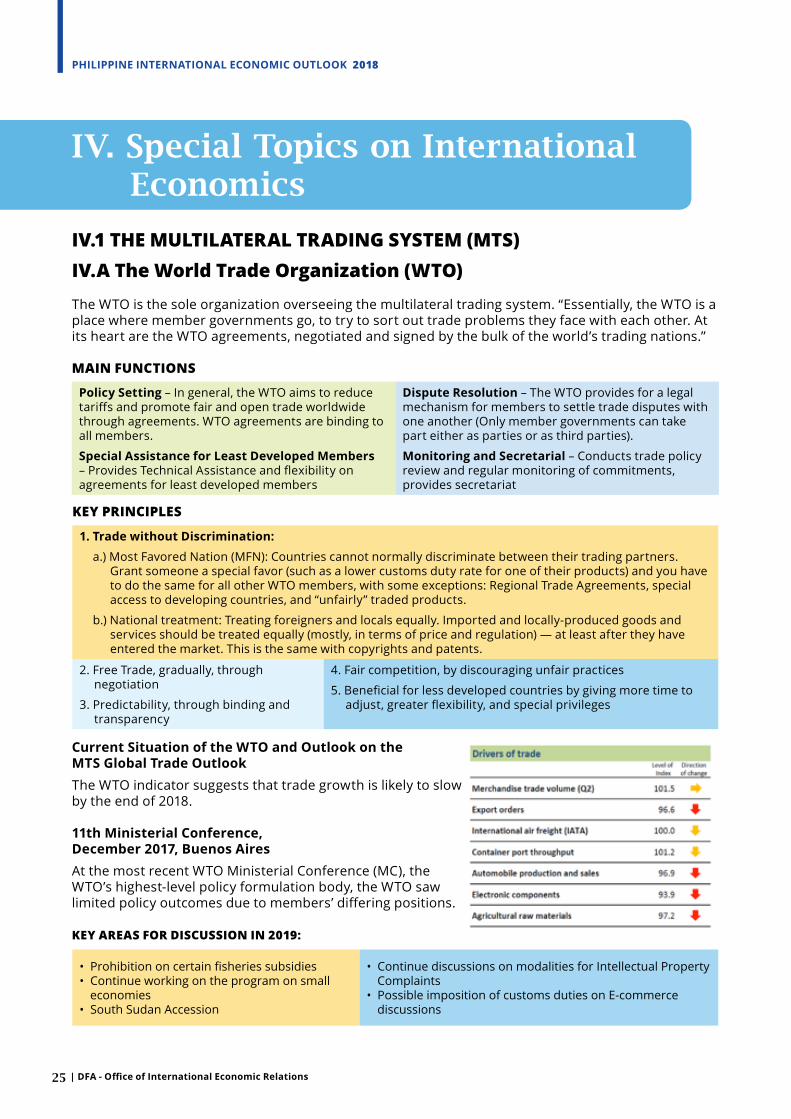
philippine international economic outlook 2018
25 | DFA - Office of International Economic Relations
IV. Special Topics on International Economics
iV.1 tHe mUltilateral traDing system (mts) iV.a the world trade Organization (wtO)The WTO is the sole organization overseeing the multilateral trading system. “Essentially, the WTO is a place where member governments go, to try to sort out trade problems they face with each other. At its heart are the WTO agreements, negotiated and signed by the bulk of the world’s trading nations.”
main fUnctiOns
policy Setting – In general, the WTO aims to reduce tariffs and promote fair and open trade worldwide through agreements. WTO agreements are binding to all members.
Special Assistance for least Developed members – Provides Technical Assistance and flexibility on agreements for least developed members
Dispute Resolution – The WTO provides for a legal mechanism for members to settle trade disputes with one another (Only member governments can take part either as parties or as third parties).
monitoring and Secretarial – Conducts trade policy review and regular monitoring of commitments, provides secretariat
Key PrinciPles
1. trade without Discrimination: a.) Most Favored Nation (MFN): Countries cannot normally discriminate between their trading partners.
Grant someone a special favor (such as a lower customs duty rate for one of their products) and you have to do the same for all other WTO members, with some exceptions: Regional Trade Agreements, special access to developing countries, and “unfairly” traded products.
b.) National treatment: Treating foreigners and locals equally. Imported and locally-produced goods and services should be treated equally (mostly, in terms of price and regulation) — at least after they have entered the market. This is the same with copyrights and patents.
2. Free Trade, gradually, through negotiation
3. Predictability, through binding and transparency
4. Fair competition, by discouraging unfair practices
5. Beneficial for less developed countries by giving more time to adjust, greater flexibility, and special privileges
current Situation of the WtO and Outlook on the mtS Global trade OutlookThe WTO indicator suggests that trade growth is likely to slow by the end of 2018.
11th ministerial conference, December 2017, Buenos Aires At the most recent WTO Ministerial Conference (MC), the WTO’s highest-level policy formulation body, the WTO saw limited policy outcomes due to members’ differing positions.
Key areas fOr DiscUssiOn in 2019:
• Prohibition on certain fisheries subsidies• Continue working on the program on small
economies • South Sudan Accession
• Continue discussions on modalities for Intellectual Property Complaints
• Possible imposition of customs duties on E-commerce discussions

26DFA - Office of International Economic Relations |
phIlIppInE IntERnAtIOnAl EcOnOmIc OutlOOk 2018
iV.B traDe tensiOnsthe Us-china trade war tensions
Possible implications on the Philippines• PH major supplier of electronics and machinery
products for both China and the US, with related products reaching more than 30% of the Philippines’ USD 57 billion total exports in 2016 (The US and China are among the top 3 Philippine trading partners).
• In the long run, the most notable impact of a trade war would be on the Philippines’ electronics industry.
• Overall, majority of the effects will be directly felt by the two countries’ economies, although global growth is expected to be reduced by 1 to 1.25%
• The Philippines, albeit not a direct participant, is deeply integrated in global value chains and will inevitably be affected.
• Further effects on the Philippine economy would depend on the goods that would be subject to tariffs and other trade barriers, as this would cause price fluctuations across the globe.
• However, effects on certain areas such as stock markets and currencies worldwide would be more immediately and significantly felt, as compared to goods and services.
94 SEBgroup. (2018). SEB: Nordic Outlook: Global economic strength despite political uncertainty. Retrieved from: https://sebgroup.com/press/press-releases/20182/seb-nordic-outlook-global-economic-strength-despite-political-uncertainty
95 The World Bank Group. (2018). World Integrated Trade Solutions. Retrieved from: https://wits.worldbank.org/96 World Trade Organization. (n.d.) What is the WTO?. Retrieved from: https://www.wto.org/english/thewto_e/whatis_e/tif_e/fact1_e.htm97 World Trade Organization. (2017) Introduction to the WTO. WTO ELearning.98 World Trade Organization. (n.d.) Principles of the Trading System. Retrieved from: https://www.wto.org/english/thewto_e/whatis_e/tif_e/fact2_e.htm99 World Trade organization. (2018). World Trade Outlook Indicator signals further loss of momentum in trade growth into Q4. Retrieved from: https://www.wto.org/
english/news_e/news18_e/wtoi_26nov18_e.htm100 Pedrosa, E. et al. (2018). State of the Region 2018-2019. Pacific Economic Cooperation Council
uS and china’s tariffs against each otheruS imports from china
chinese imports from uS
Tariffs alreadyappliedin 2018
Tariffs alreadyappliedin 2018
2017 total import of goods (most recent annual figure)
2017 total import of goods (most recent annual figure)
note: Data as of 24 September 2018
Source: US Census Bureau, BBC research
$53bn
$50bn
$200bn
$60bn
$506bn
$130bn
$267bn
Tariffs that tookeffect on24 Sept 2018
Tariffs that tookeffect on 24 Sept 2018
Threatenedadditionaltariffs
• Wide trade deficit between US and China in recent years has made President Trump believe China is “taking advantage” of the US and ordered a series of tariffs on goods from China, including machinery and components like semiconductors. First measures coming into effect mid-2018.
• China retaliated with its own series of tariffs on imports of soy beans, other agricultural products, automobiles, steel, aluminum, washing machines, and solar panels.
• The US was preparing to announce tariffs on all remaining Chinese products
• Talks between the US and China at the G20 Summit by the end of 2018 resulted in a 90-day moratorium on US’ further imposition of tariffs (estimated to be worth over USD 257 billion in Chinese goods). Both sides also agreed to “open up their markets”
• Additional US tariffs will push through if both parties do not reach an agreement by 90 days

philippine international economic outlook 2018
27 | DFA - Office of International Economic Relations
iV.c inflatiOn: an easing cOncern fOr 2019
Source: Department of Finance, Bangko Sentral ng Pilipinas
December 2018
Sources: DOF (August 2018); PSA (August 2018); BSP (August 2018)
6.7%
8.3%
5.8%
9.4%
6.0% 6.7%
5.3%
2.7% 2.3%
4.8%
6.5% 5.5%
2.9%
8.3%
4.2%
3.8%
3.8% 4.6%
3.2% 3.0%
1.4% 1.4%
1.8%
5.2%
4.0%
0%
2%
4%
6%
8%
10%
Infla2o
n Rate
Infla%on Rate
Infla2on Rate BSP Upper Threshold (4%) *projected
Office of International Economic Relations DFA ECONOMIC UPDATE: GOVERNMENT’S IMMEDIATE ACTION ON INFLATION
Main Causes of Inflation (Cost-‐Push and Demand-‐Pull Factors) Cost-‐Push (Supply Side) Demand-‐Pull (Demand Side)
1. External factors 1.1 Higher World Oil Prices due to US Sanctions on Iran (60.9 to 68.6 USD per barrel) 1.2 Peso depreciation from 50.3 to 53.5 per USD 2. Tax Reform (TRAIN) 2.1 Higher taxes on oil, cigarettes, and sweetened beverages 3. Rice Supply 4. Better Tobacco Tax Compliance 5. Vegetable supply and prices
1. Tax Reform (TRAIN) More disposable income for people due to lower income tax
Key Note: Government Economic Team expects inflation to peak in third quarter before tapering in latter part of year, and falling within target range of 2-‐4% in early 2019.
Government Measures to Manage Inflation: “The government efforts to tame inflation remain appropriate but must be delivered with greater sense of urgency” – DBM Secretary Benjamin Diokno 1. NFA Council authorized import of 5 million sacks of rice. Additional 5 million sacks to arrive early 2019. 2. DTI, NFA, PNP and NBI team formed to monitor NFA warehouses and outlets. 3. Efforts under way to streamline licensing procedures for NFA rice imports. 4. House and Senate approved single version of Rice Tariffication Bill. Bicameral Committee Report awaiting adoption by both houses. 5. BOC to prioritize release of essential food items in ports to increase supply and decrease prices. 6. Sugar Regulatory Administration to open sugar importation to direct users to reduce cost. 7. DA and DTI to facilitate direct selling from poultry producers to consumers. DA to provide cold storage.
In first 5 months of 2018, inflation… 1. averaged 4.8% (slightly higher than BSP’s target of 2-‐4%). It further increased in August to 6.4%; 2. has been moderate compared to the Philippines’ historical average (5-‐10%)
Top 10 items with Highest Inflation Rate from August 2017 to August 2018 Item % Inc. Item % Inc.
1. Tobacco 2. Vegetables 3. Corn 4. Fish 5. Non-‐Alcoholic Beverages
29.1% 19.2% 12.6% 12.4% 11.5%
6. Electricity, Gas, and Other Fuels 7. Sugar, Chocolate, Confectionery 8. Transport 9. Rice 10. Alcoholic Beverages
11.4% 9.1% 7.8% 7.1% 6.5%
Only 1/5th of the 28.3% tobacco products inflation is due to TRAIN; more tobacco companies are becoming compliant with tax payments, raising the prices of cigarettes. PhP5-‐6 compared to PhP3 per stick last year.
NFA did not buy enough palay during harvest season. It imported to fill gap, but importation has been delayed.
US Federal Reserve has been raising interest rates, resulting in USD appreciation against other currencies around the world; imports become more expensive while exports become cheaper.
1. Train contributed only 0.4 of 4.6% inflation in May 2. E.g. for every additional spending of PhP100, only PhP8.7 is due to TRAIN, while the remaining is due to world market price fluctuations. 3. TRAIN impact is limited to only a few food items
Additional income for all workers, approx. 90% of which is spent, making a small contribution to inflation.
Jan 2017
TRAIN Bill filed
Sep 2018
Dec 2017
Train Law
Signed
May 2017
House
Passed
Train Law
USD/barrel 53
.4
USD/barrel 49
.9
USD/barrel 60
.9
USD/barrel 68
.6
Vegetable price spikes attributed to typhoon season
Per DOF, suspending TRAIN means… 1. Inflation would not be that much lower. 2. 99% of workers will lose some PhP 12 billion, monthly additional take home pay 3. Almost PhP90 billion in tax revenues will not be generated 4. PhP27 billion less spending in social services 5. PhP63 billion less spending on infrastructure 6. Loss of 83,195 jobs in infrastructure
28DFA - Office of International Economic Relations |
phIlIppInE IntERnAtIOnAl EcOnOmIc OutlOOk 2018
v.A Data and Information
1. Philippine Import and Export Statistics (Source: Department of Trade and Industry)
http://www.tradelinephilippines.dti.gov.ph/web/tradeline-portal/merchandise-balance
2. Market Profile of Philippine Trade Partners (Source: Department of Trade and Industry)
http://www.tradelinephilippines.dti.gov.ph/web/tradeline-portal/market-profile)
3. Net Foreign Direct Investments (Source: Bangko Sentral ng Pilipinas)
http://www.bsp.gov.ph/statistics/efs_bop2.asp
4. Official Development Assistance (Source: National Economic Development Authority)
http://www.neda.gov.ph/2018/10/26/2018-oda-pipeline-with-status-3rd-quarter-2/
5. Ease of Doing Business Ranking (Source: World Bank Group)
http://www.doingbusiness.org/content/dam/doingBusiness/country/p/philippines/PHL.pdf
6. Philippines Tourism Statistics (Source: Department of Tourism)
http://www.tourism.gov.ph/industry_performance_dec_2017.aspx
6. Philippines Trade Policy Review (Source: World Trade Organization)
https://www.wto.org/english/tratop_e/tpr_e/g368_e.pdf
7. Tax Reform (Source: Department of Finance, National Tax Research Center, Investments Relations Office)
https://www.dof.gov.ph/taxreform/ http://www.ntrc.gov.ph/images/Publications/train/
tax-changes-you-need-to-know.pdf https://iro.ph/article_doc/64e4aa73_5%20DOF.pdf
v.B philippine Government plans and priorities
1. Ambisyon Natin 2040 (Source: National Economic Development Authority)
http://2040.neda.gov.ph/
2. Philippine Development Plan (Source: National Economic Development Authority)
http://www.neda.gov.ph/wp-content/uploads/2017/12/Abridged-PDP-2017-2022_Final.pdf
3. Philippine Export Development Plan 2015 – 2017 (Source: Export Development Council)
http://www.edc.net.ph/wp-content/uploads/2018/04/PEDP-2015-2017-FullText.pdf
4. Investment Priorities Plan 2017 (Source: DTI Board of Investments)
http://boi.gov.ph/ufaqs/boi-investment-priorities-plan/
5. Foreign Investment Negative List (Source: Official Gazette)
http://www.officialgazette.gov.ph/downloads/2018/10oct/20181029-EO-65-RRD.pdf
v.c Other References
1. Succeeding in Emerging Markets https://go.euromonitor.com/succeed-emerging-markets-
selection-strategy-first-steps.html
V. Useful References and Links

DEcEmBER 2018