OFFICE OF CIVILIAN RADIOACTIVE WASTE MANAGEMENT …
105
-- ---- OFFICE OF CIVILIAN RADIOACTIVE WASTE MANAGEMENT 1.OA QA SPECIAL INSTRUCTION SHEET Page: I of: I Complete Only Applicable Items This Is a placeholder page for records that cannot be scanned or microfilmed 2. Record Date 3. Accession Number 02/18/200 MoL . ;toooo ,,x. o.ao4c 4. Author Namelsl S. Author Organization SEDAT GOLUOGLU 6. Title EVALUATION OF CODISPOSAL VIABILITY FOR HEU OXIDE (SHIPPINGPORT PWR) DOE-OWNED FUEL 7. Document Number~s) S . Version TDR-EDC-NU-000003 |REV. 00 9. Dorcument Type 10. Medium REPORT OPTIC / Ph p e- t 11. Access Control Code PUB 12. Traceability Designator DC #23618 13. Comments THIS ISA ONE-OF-A-KIND DOCUMENT DUE TO THE COLOR GRAPHS WITHIN C 6 r - be Lo cutc cl 4hroLA"k 4 e Recorks Pre5s C! 'tr AP- 17.1 0.1 Rev. 06/30/1999 I \V-
Transcript of OFFICE OF CIVILIAN RADIOACTIVE WASTE MANAGEMENT …
- - ----
OFFICE OF CIVILIAN RADIOACTIVE WASTE MANAGEMENT 1.OA QA
SPECIAL INSTRUCTION SHEET Page: I of: IComplete Only Applicable Items
This Is a placeholder page for records that cannot be scanned or microfilmed2. Record Date 3. Accession Number02/18/200 MoL . ;toooo ,,x. o.ao4c4. Author Namelsl S. Author OrganizationSEDAT GOLUOGLU
6. TitleEVALUATION OF CODISPOSAL VIABILITY FOR HEU OXIDE (SHIPPINGPORT PWR) DOE-OWNED FUEL
7. Document Number~s) S . VersionTDR-EDC-NU-000003 |REV. 00
9. Dorcument Type 10. MediumREPORT OPTIC / Ph p e- t
11. Access Control CodePUB
12. Traceability DesignatorDC #23618
13. CommentsTHIS ISA ONE-OF-A-KIND DOCUMENT DUE TO THE COLOR GRAPHS WITHIN C 6 r -be Lo cutc cl4hroLA"k 4 e Recorks Pre5s C! 'tr
AP- 17.1 0.1 Rev. 06/30/1999
I \ V-
MOL. 20000227.0240
QA: QA
Civilian Radioactive Waste Management SystemManagement & Operating Contractor
Evaluation of Codisposal Viability for HEU Oxide (Shippingport PWR) DOE-Owned Fuel
TDR-EDC-NU-000003 REV 00
February 2000
Prepared for:
National Spent Nuclear Fuel Program1955 Fremont Ave, MS 3135Idaho Falls, ID 83415-1625
Prepared by:
Civilian Radioactive Waste Management SystemManagement & Operating Contractor
1211 Town Center DriveLas Vegas, NV 89144
Under Contract NumberDE-AC08-91RWO0134
-
DISCLAIMER
This report was prepared as an account of work sponsored by an agency of the United States Government. Neither
the United States Government nor any agency thereof, nor any of their employees, nor any of their contractors,
subcontractors or their employees, makes any warranty, express or implied, or assumes any legal liability or
responsibility for the accuracy, completeness, or any third party's use or the results of such use of any information,
apparatus, product, or process disclosed, or represents that its use would not infringe privately owned rights.
Reference herein to any specific commercial product, process, or service by trade name, trademark, manufacturer, or
otherwise, does not necessarily constitute or imply its endorsement, recommendation, or favoring by the United
States Government or any agency thereof or its contractors or subcontractors. The views and opinions of authors
expressed herein do not necessarily state or reflect those of the United States Government or any agency thereof.
TDR-EDC-NU-000003 REV 00 February 2000
Civilian Radioactive Waste Management SystemManagement & Operating Contractor
Evaluation of Codisposal Viability for HEU Oxide (Shippingport PWR) DOE-Owned Fuel
TDR-EDC-NU-000003 REV 00
February 2000
Prepared by:
Sedat GoluogluDOE Fuel Analysis, Waste Package Department
.2/4 8/20 0 0Date
Checked by:
44 P. 2Horia Raul RadulescuDOE Fuel Analysis, Waste Package Department
Date
Approved by:
J. Wesley Ddvis, LeadDOE Fuel Analysis, Waste Package Department
2-/',S 12 VDate
INTENTIONALLY LEFT BLANK
TDR-EDC-NU-000003 REV 00 February 2000
HISTORY OF CHANGE
Revision Number00
Description of ChangeInitial issue
TDR-EDC-NU-000003 REV 00 v February 2000
INTENTIONALLY LEFT BLANK
TDR-EDC-NU-000003 REV 00 vi February 2000
------ -.-
EXECUTIVE SUMMARY
INTRODUCTION
There are more than 250 forms of U.S. Department of Energy (DOE)-owned spent nuclear fuel(SNF). Due to the variety of the SNF, the National Spent Nuclear Fuel Program (NSNFP) hasdesignated nine representative fuel groups for disposal criticality analyses based on fuel matrix,primary fissile isotope, and enrichment. The Shippingport pressurized water reactor (PWR) fuelhas been designated as the representative fuel for the highly enriched uranium oxide (HEUoxide) fuel group, which is a uranium oxide clad with Zircaloy-4. The Shippingport PWR fuel is"9seed and blanket" type fuel. This technical document addresses the seed type fuel assembliesonly. The blankets will be shipped and handled as bare assemblies and use the same packagingassociated with either PWR or boiling water reactor (BWR) commercial fuels (DOE 1999a).Therefore, this report does not specifically address the disposal of blanket assemblies in theMonitored Geologic Repository (MGR). Demonstration that other fuels in this group arebounded by the Shippingport PWR analysis remains for the future before acceptance of thesefuel forms. The results of the analyses performed will be used to develop waste acceptancecriteria. The items that are important to safety are identified based on the analysis needs andresult sensitivities. Prior to acceptance of fuel from the HEU oxide fuel group for disposal, thesafety items for the fuel types that are being considered for disposal under the HEU oxide fuelgroup must be demonstrated to satisfy the conditions determined in this report.
The analyses have been performed by following the disposal criticality analysis methodology,which was documented in Disposal Criticality Analysis Methodology Topical Report (CRWMSM&O 1998a) submitted to the U.S. Nuclear Regulatory Commission. The methodology includesanalyzing the geochemical and physical processes that can breach the waste package and degradethe waste forms and other internal components, as well as the structural, thermal, and shieldinganalyses, and intact and degraded component criticality analyses. One or more addenda to thetopical report will be required to establish the critical limit for DOE SNF once sufficient criticalbenchmarks are identified and performed.
The waste package that holds the DOE SNF canister with Shippingport PWR HEU oxide fuelalso contains five high-level waste (HLW) glass pour canisters and a carbon steel basket. TheShippingport PWR DOE SNF canister is placed in a carbon steel support tube that becomes thecenter of the waste package (see Figure ES-1). The waste package carbon steel basket height is4,607 mm. The five HLW glass canisters are evenly spaced around the Shippingport PWR DOESNF canister. The Shippingport PWR DOE SNF canister is designed for one intact ShippingportPWR fuel assembly placed in the center position of the 2,681-mm-long stainless steel basket.The canister basket consists of a rectangular grid that is 208-mm square. The canister basketplate is stainless steel (Type 316L) with a 9.5 mm thickness.
The 5-DHLW/DOE Spent Fuel-Long waste package is based on the Viability Assessment designof waste packages. The outer barrier is made of corrosion-allowance material, 100-mmn thickcarbon steel. The corrosion-resistant inner barrier is fabricated from a 20-mm thick high-nickelalloy. Both the top and bottom lids are also based on the two-barrier principle and use the samematerials.
TDR-EDC-NU-000003 REV 00 vii February 2000
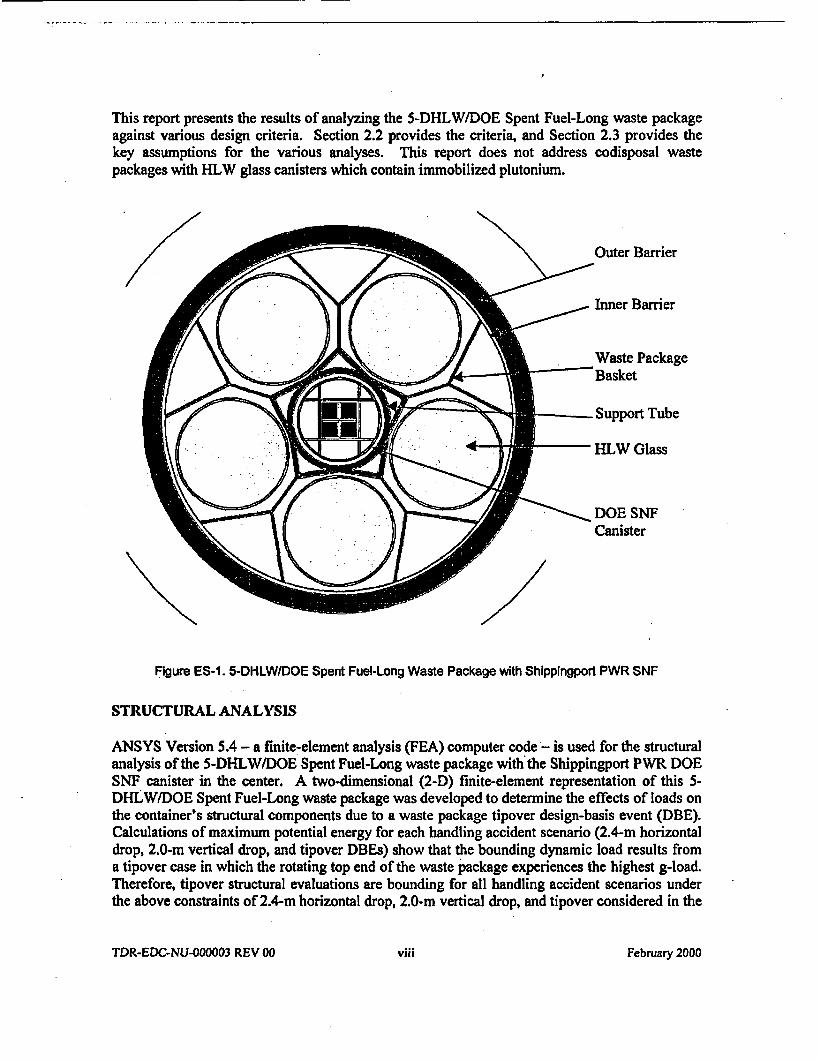
This report presents the results of analyzing the 5-DHLW/DOE Spent Fuel-Long waste packageagainst various design criteria. Section 2.2 provides the criteria, and Section 2.3 provides thekey assumptions for the various analyses. This report does not address codisposal wastepackages with HLW glass canisters which contain immobilized plutonium.
Figure ES-1. 5-DHLWIDOE Spent Fuel-Long Waste Package with Shippingport PWR SNF
STRUCTURAL ANALYSIS
ANSYS Version 5.4 - a finite-element analysis (FEA) computer code'- is used for the structuralanalysis of the 5-DHLW/DOE Spent Fuel-Long waste package with the Shippingport PWR DOESNF canister in the center. A two-dimensional (2-D) finite-element representation of this 5-DHLW/DOE Spent Fuel-Long waste package was developed to determine the effects of loads onthe container's structural components due to a waste package tipover design-basis event (DBE).Calculations of maximum potential energy for each handling accident scenario (2.4-m horizontaldrop, 2.0-m vertical drop, and tipover DBEs) show that the bounding dynamic load results froma tipover case in which the rotating top end of the waste package experiences the highest g-load.Therefore, tipover structural evaluations are bounding for all handling accident scenarios underthe above constraints of 2.4-m horizontal drop, 2.0-m vertical drop, and tipover considered in the
TDR-EDC-NU-000003 REV 00 viii February 2000
DBEs document (CRWMS M&O 1997e). The analyses assume that the MGR surface designwill prevent events which exceed these bounding assumptions.
The results show that the cavity between the Shippingport fuel assembly and the basket platesdoes not close, but on the contrary, becomes larger because of the dynamic load applied on thebottom plate by the Shippingport fuel assembly. Hence, there will be no interference betweenthe fuel assembly and the basket plates because of tipover DBE. The maximum stress in theDOE SNF canister structural components including internals is determined to be 217 MPa. Thismagnitude of stress is less than the tensile strength of 316L stainless steel, 483 MPa.
The calculations also show that the maximum bending stress on the base plate due to the weightof the structural components and the fuel is 55 MPa, which is less than the yield strength of 316Lstainless steel (172 MPa). Finally, the critical stress for buckling to take place on the spacercylinder is 1.43 GPa whereas the compressive stress is only 2.5 MPa. Therefore, theShippingport PWR fuel assembly will not be crushed within the basket structure.
THERMAL ANALYSIS
The FEA computer code used for the thermal analysis of the 5-DHLW/DOE Spent Fuel-Longwaste package with the Shippingport PWR DOE SNF canister in the center is ANSYS Version5.4. The maximum heat generation from a Hanford 15-foot HLW glass canister is projected tobe 2,540 watts (Taylor 1997). Although this maximum heat generation may be reduced, whichwill result in even lower temperatures than the temperatures calculated in this report, the analysiswas based on heat output of 2,540 watts. The thermal conductivity of the HLW glass isapproximated as that of pure borosilicate glass, while the properties of density and specific heatare approximated as those of Pyrex glass. Only the axial cross section of the waste package atthe center of the DOE SNF canister is represented in this 2-D calculation. The ShippingportPWR DOE SNF canister is analyzed with helium (He), nitrogen (N), and argon (Ar) as fill gases,while the waste package is filled with He.
Using conservative input values, the analyses show that the Shippingport PWR waste packagesatisfies all relevant governing criteria. The highest fuel temperature occurs with argon fill gasin the DOE SNF canister, and is 248.9 0C. The highest cladding temperature occurs with argonfill gas in the DOE SNF canister, and is 249.2 0C, which is below the design criterion of 350 'C.
SHIELDING ANALYSIS
The Monte Carlo particle transport code, MCNP, Version 4B2, is used to calculate average doserates on the surfaces of the waste package. Dose rate calculations were performed for a wastepackage containing Hanford HLW and Shippingport PWR fuel.
The highest dose rate of 10.3 rem/h is calculated on a radial outer surface segment of the wastepackage that contains the Shippingport PWR DOE SNF canister. The maximum dose rate on theouter surfaces of the waste package is below the criterion limit of 355 rem/h for the casesinvestigated by over a factor of 34. The dose rate from primary gamma rays dominates theneutron dose rate by approximately three orders of magnitude.
TDR-EDC-NU-000003 REV 00 1X February 2000
DEGRADATION AND GEOCHEMISTRY ANALYSES
The degradation analyses follow the general methodology developed for application to all wasteforms containing fissile material. This methodology evaluates potential critical configurationsfrom the intact (geometrically intact components but otherwise breached waste package toinclude water as moderator) waste package through the completely degraded waste package.The waste package design developed for the intact configuration is used as the starting point.Sequences of events and/or processes of component degradation are developed. Standardscenarios from the master scenario list in the topical report (CRWMS M&O 1998a) are refinedusing unique fuel characteristics. Potentially critical configurations are identified for furtheranalysis.
The EQ3/6 geochemistry code was used to determine the chemical composition of the soliddegradation products with particular emphasis on the chemical conditions that could lead to aloss of neutron absorbers from the waste package and that would allow the fissile materials toremain. The DOE SNF canister with Shippingport PWR fuel does not contain any strongneutron absorbers such as gadolinium. Boron, which is a burnable poison that is an integral partof the fuel, is neglected for criticality calculations.
EQ3/6 cases are constructed to span the range of possible fuel corrosion. The effects of steelcorrosion, glass degradation, and fluid influx rate on uranium oxide dissolution are alsoinvestigated. Uranium loss from the waste package varied from 0.06 to 100%, and was typicallycomplete if greater than neutral pH's existed for any appreciable amount of time. At a givenglass dissolution rate, uranium loss varies inversely with the influx of water.
INTACT AND DEGRADED COMPONENT CRITICALITY ANALYSES
The intact and degraded component criticality analyses consider a single Shippingport PWRassembly inside the DOE SNF canister, which contains a stainless steel Type 316L basket.Analyses consider optimum moderation, optimum distribution of fissile material and degradationproducts, and optimum reflection to determine the highest kff attainable by the system. Intactcases represent breached but otherwise intact waste package, DOE SNF canister, and fuelassembly. Degraded cases cover range of degradation of waste package internals, HLW glasscanisters, DOE SNF canister, and the fuel assembly.
The results from the intact and degraded component criticality analyses show that keff + 2a (95%confidence) are less than or equal to 0.93 for one Shippingport PWR assembly in the DOE SNFcanister. The configurations do not need any neutron absorber in the canister basket orelsewhere in the waste package, even without credit for burnable absorber (boron) that is presentin the fuel assembly.
CONCLUSIONS
In summary, the structural, thermal, and shielding criteria are met for a DOE SNF canistercontaining Shippingport PWR SNF. The waste package can contain one fuel assembly and falls
TDR-EDC-NU-000003 REV 00 x February 2000
below the interim critical limit of 0.93 without any neutron absorber in the DOE SNF canisterbasket or elsewhere in the waste package. With this design, there will be approximately 20 DOESNF canisters loaded with Shippingport PWR SNF (Core 2 Seed 2). This corresponds to 20waste packages.
TDR-EDC-NU-000003 REV 00 xi February 2000
INTENTIONALLY LEFT BLANK
TDR-EDC-NU-000003 REV 00 xii February 2000
CONTENTS
Page
EXECUTIVE SUMMARY .............................................................. vii
ACRONYMS AND ABBREVIATIONS .............................................................. xxi
1. INTRODUCTION AND BACKGROUND ................................................................ 11.1 OBJECTIVE .............................................................. 21.2 SCOPE .............................................................. 21.3 QUALITY ASSURANCE ............................................................... 3
2. DESIGN INPUTS ............................................................... 52.1 DESIGN PARAMETERS .............................................................. 5
2.1.1 Codisposal Waste Package ............................................................... 52.1.2 HLW Glass Pour Canisters .............................................................. 62.1.3 DOE SNF Canister .............................................................. 72.1.4 Shippingport PWR DOE SNF ............................................................. 112.1.5 Thermal .............................................................. 152.1.6 Shielding Source Term .............................................................. 172.1.7 Material Compositions .............................................................. 182.1.8 Degradation and Geochemistry .............................................................. 21
2.1.8.1 Physical and Chemical Form of Shippingport Waste Package ......... 212.1.8.2 Chemical Composition of J-13 Well Water ...................................... 222.1.8.3 Drip Rate of J-13 Well Water into a Waste Package ........................ 23
2.2 FUNCTIONS AND DESIGN CRITERIA . ............................................................. 242.2.1 Structural .............................................................. 242.2.2 Thermal .............................................................. 252.2.3 Shielding ........................... 252.2.4 Degradation and Geochemistry .......... ............... 252.2.5 Intact and Degraded Component Criticality ................................... 26
2.3 ASSUMPTIONS ........................................................ . 262.3.1 Structural............................................................................................................262.3.2 Thermal ......................................................... 272.3.3 Shielding ......................................................... 272.3.4 Degradation and Geochemistry ........................................................ 282.3.5 Intact and Degraded Component Criticality ................................... 29
2.4 BIAS AND UNCERTAINTY IN CRITICALITY CALCULATIONS .. 292.4.1 Benchmarks Related to Intact Waste Package Configurations . . 292.4.2 Benchmarks Related to Degraded Waste Package Configurations . . 302.4.3 Critical Limit ........................................................ 30
3. STRUCTURAL ANALYSIS ........................................................ 313.1 USE OF COMPUTER SOFTWARE ........................................................ 313.2 DESIGN ANALYSIS ......................................................... 31
TDR-EDC-NU-000003 REV 00 xiii February 2000
CONTENTS (Continued)
Page
3.3 CALCULATIONS AND RESULTS .......................................................... 313.3.1 Description of the Finite-element Representation ............................................. 313.3.2 Results of Structural Calculations .......................................................... 33
3.4 SUMMARY .......................................................... 34
4. THERMAL ANALYSIS ................... 354.1 USE OF COMPUTER SOFTWARE ............................................................. 354.2 THERMAL DESIGN ANALYSIS ............................................................. 354.3 CALCULATIONS AND RESULTS ............................................................. 354.4 SUMMARY ............................................................. 37
5. SHIELDING ANALYSIS ............................................................. 395.1 USE OF COMPUTER SOFTWARE .. ............................................................. 395.2 DESIGN ANALYSIS ............................................................. 395.3 CALCULATIONS AND RESULTS ............................................................. 395.4 SUMMARY ............................................................. 42
6. DEGRADATION AND GEOCHEMISTRY ANALYSES . . .................................................. 436.1 USE OF COMPUTER SOFTWARE ........................................................... 436.2 DESIGN ANALYSIS ... ....................................................... 43
6.2.1 Systematic Investigation of Degradation Scenarios and Configurations ... 436.2.1.1 Most Probable Scenario for Shippingport PWR SNF .516.2.1.2 Degraded DOE SNF Canister Basket and Intact SNF .526.2.1.3 Intact DOE SNF Canister and Degraded Waste Package
Internals .536.2.1.4 Degraded DOE SNF Canister and. Waste Package Internals . 536.2.1.5 Intact DOE SNF Canister and Waste Package Internals and
Degraded SNF .536.2.1.6 Intact Waste Package Internals and Degraded DOE SNF
Canister and SNF .536.2.1.7 Completely Degraded DOE SNF Canister and Waste Package
Internals .536.2.2 Basic Design Approach for Geochemical Analysis . ........................................... 54
6.3 CALCULATIONS AND RESULTS. ............................................................................ 546.3.1 Results of EQ6 Runs .................................................... 55
6.4 SUMMARY .................................................... 60
7. INTACT AND DEGRADED COMPONENT CRITICALITY ANALYSES .. 637.1 USE OF COMPUTER SOFTWARE .................... ................................... 637.2 DESIGN ANALYSIS ...................... 637.3 CALCULATIONS AND RESULTS - PART I: INTACT CRITICALITY
ANALYSIS.................................................................................................................... 637.4 CALCULATIONS AND RESULTS - PART II: DEGRADED COMPONENT
CRITICALITY ANALYSIS .................. 65
TDR-EDC-NU-000003 REV 00 AVY February 2000
CONTENTS (Continued)
Page
7.4.1 Intact SNF .............................................. 657.4.1.1 Degraded Guide Plates .............. ................................ 657.4.1.2 Clay Accum ulation Inside Canister .............................................. 667.4.1.3 Degraded DOE SNF Canister and Waste Package ............................ 67
7.4.2 Degraded Fuel Cluster ............................................... 687.4.2.1 Partially Degraded Fuel Cluster in the Intact DOE SNF
Canister ... 687.4.2.2 Partially Degraded Fuel Cluster in Degraded DOE SNF
Canister.............................................................................................. 697.4.2.3 Partially Degraded Fuel Cluster with Degraded Canister and
Degraded Waste Package .707.4.2.4 Fully Degraded Fuel in Degraded Canister and Degraded
Waste Package .717.5 SUMMARY................................................................................................................... 72
8. CONCLUSIONS..................................................................................................................... 738.1 STRUCTURAL ANALYSIS ........................................................... 738.2 THERMAL ANALYSIS ........................................................... 738.3 SHIELDING ANALYSIS ........................................................... 748.4 GEOCHEMISTRY ANALYSIS ................... ........................................ 748.5 INTACT AND DEGRADED COMPONENT CRITICALITY ANALYSES ............... 758.6 ITEMS IMPORTANT TO SAFETY ........................................................... 75
9. REFERENCES ........................................................... 779.1 DOCUMENTS CITED ........................................................... 779.2 STANDARDS................................................................................................................ 819.3 SOURCE DATA .............. 82
TDR-EDC-NU-000003 REV 00 xv February 2000
INTENTIONALLY LEFT BLANK
TDR-EDC-NU-000003 REV 00 xvi February 2000
FIGURES
Page
ES-1. 5-DHLW/DOE Spent Fuel-Long Waste Package with Shippingport PWR SNF ............. viii
2-1. Cross Section of 5-DHLW/DOE Spent Fuel-Long Waste Package .................. .................... 62-2. HLW Glass Pour Canister ............................................... ; 72-3. Plan View of the 18-in. DOE SNF Canister .............................................. 92-4. Cross Section of the Shippingport PWR DOE SNF Canister .............................................. 102-5. Isometric View of the Shippingport PWR DOE SNF Canister ........................................... 112-6. Shippingport C2 S2 SNF Assembly ............................................... 122-7. Shippingport C2 S2 SNF Sub-assembly Cross Section .............................................. 132-8. Fuel Plate .............................................. 15
3-1. Stresses in 5-DHLW/DOE Spent Fuel-Long Waste Package .............................................. 323-2. Stresses in the DOE SNF Canister .............................................. 34
4-1. Finite-element Representation of the 5-DHLW/DOE Spent Fuel-Long WastePackage................................................................................................................................ 36
4-2. Finite-element Representation of the Shippingport PWR C2 S2 SNF Assembly ............... 364-3. Axial Temperature Profile of the 5-DHLW/DOE Spent Fuel-Long Waste Package .......... 37
5-1. Vertical and Horizontal Cross Sections of MCNP Geometry Representation .......... .......... 405-2. Radial Surfaces and Segments of the Waste Package Used in Dose Rate
Calculations.......................................................................................................................... 41
6-1. Internal Criticality Master Scenarios, Part 1 ............................................................. 476-2. Internal Criticality Master Scenarios, Part 2 ............................................................. 486-3. Examples of Degraded Configurations from Class 1 .............................................. ............ 496-4. Examples of Degraded Configurations from Class 2 .......................................................... 496-5. Example of Degraded Configuration from Class 3 ............................................................. 496-6. Example of Degraded Configuration from Class 4 ............................................................. 506-7. Examples of Degraded Configurations from Class 5 .......................................................... 506-8. Example of Degraded Configuration from Class 6 ............................................................. 506-9. Predicted Accumulation of Iron Oxide Degradation Products over Time ........................... 576-10. Predicted Accumulation of Smectite Degradation Products over Time . . 586-11. Predicted Total Uranium Mass in Waste Package for Cases 1 and 29 . . 596-12. Predicted Total Uranium Mass in Waste Package for Cases 10 and 30 . . 60
7-1. Cross-sectional View of the 5-DHLWIDOE Spent Fuel-Long Waste Package .................. 647-2. Cross-sectional View of the Configuration with Degraded Guide Plates and Intact
SNF ............................................................. 667-3. Cross-sectional View of Clay-accumulated Configuration .................................. ............... 677-4. Cross-sectional View of the Intact Fuel Cluster in the Degraded Waste Package .............. 687-5. Partially Degraded Fuel Cluster in the Waste Package ....................................................... 69
TDR-EDC-NU-000003 REV 00 XVII February 2000
7-6. Partially Degraded Fuel Cluster in the Degraded Waste Package ....................................... 717-7. Fully Degraded Fuel Cluster Configuration ............ .................................... 72
TDR-EDC-NU-000003 REV 00 xvii February 2000
TABLES
Page
1-1. List of Supporting Documents ............................................................... 3
2-1. Codisposal Waste Package Dimensions and Material Specifications ................................... 62-2. Geometry and Material Specifications for HLW Glass Canisters ......................................... 72-3. Geometry and Material Specifications for the DOE SNF Canister ....................................... 82-4. Geometry and Material Specifications for the Shippingport C2 S2 Assembly ................... 142-5. Heat Output of Each Waste Package Component ............................................................... 162-6. Gamma and Neutron Sources of the Shippingport C2 SI Fuel Assembly at Year
2005 ................................................................ 172-7. Gamma Sources for HLW Glass Canisters at One Day Decay Time .................................. 182-8. Neutron Sources for HLW Glass Canisters at One Day Decay Time .................................. 182-9. Chemical Composition of ASTM B 575 (Alloy 22) ................................................ 192-10. Chemical Composition of ASTM A 516 Grade 70 Carbon Steel . ...................................... 192-11. Chemical Composition of Stainless Steel Type 304L .................................... 192-12. Chemical Composition of Stainless Steel Type 316L .................................... 202-13. Chemical Composition of SRS HLW Glass ........................................... 202-14. Steel Degradation Rates ............................................... 212-15. Glass Degradation Rates ............................................... 222-16. Shippingport PWR Characteristics and Degradation Rates . ............................... 222-17. Composition of J-13 Well Water ................................................. 23
3-1. Containment Structure Allowable Stress-limit Criteria ................................................ 31
4-1. Physical Locations of Nodes of Interest ............................................... 364-2. Peak Temperatures and Time of Occurrence for Each DOE SNF Canister Fill Gas .......... 37
5-1. Dose Rates on Waste Package Outer Radial Surface .......................................................... 425-2. Dose Rates on Waste Package Axial Surfaces ............................................................. 42
6-1. Materials and Thicknesses ............................................................. 526-2. Summary of Geochemistry Results ............................................................. 566-3. Chemical Composition of Post-Breach Clay .............................................. ............... 60
8-1. Shippingport PWR Codisposal Waste Package Thermal Results and GoverningCriteria................................................................................................................................ 74
TDR-EDC-NU-000003 REV 00 xix February 2000
INTENTIONALLY LEFT BLANK
TDR-EDC-NU-000003 REV 00 xxc February 2000
ACRONYMS AND ABBREVIATIONS
AP administrative procedureASM American Society f6r MetalsASME American Society of Mechanical EngineersASTM American Society for Testing and MaterialsBOL beginning of lifeBPVC Boiler and Pressure Vessel CodeBWR boiling water reactorCRWMS Civilian Radioactive Waste Management SystemCSCI Computer Software Configuration ItemDBE design basis eventDHLW defense high-level wasteDOE U.S. Department of EnergyFEA finite-element analysisHEU highly enriched uraniumHLW high-level wasteID inner diameterIP internal to the packagekeff effective multiplication factorLCE laboratory critical experimentLLNL Lawrence Livermore National LaboratoryM&O Management and Operating ContractorMGR Monitored Geologic RepositoryMTHM metric tons of heavy metalNSNFP National Spent Nuclear Fuel ProgramOD outer diameterPC personal computerPWR pressurized water reactorQARD Quality Assurance Requirements and DescriptionSCM Software Configuration ManagementSCR software change requestSDD system description documentSNF spent nuclear fuelSQR software qualification reportSRS Savannah River SiteSS stainless steelTBV to be verified2-D two-dimensional3-D three-dimensional
TDR-EDC-NU-000003 REV 00 xxi February 2000
INTENTIONALLY LEFT BLANK
TDR-EDC-NU-000003 REV 00 xxii Februamy 2000
1. INTRODUCTION AND BACKGROUND
There are more than 250 forms of U.S. Department of Energy (DOE)-owned spent nuclear fuel(SNF). Due to the variety of the spent nuclear fuel, the National Spent Nuclear Fuel Program(NSNFP) has designated nine representative fuel groups for disposal criticality analyses based onfuel matrix, primary fissile isotope, and enrichment. The Shippingport Pressurized WaterReactor (PWR) fuel has been designated as the representative fuel (DOE 1999a) for the HighlyEnriched Uranium Oxide Fuels (HEU oxide) fuel group. Demonstration that other fuels in thisgroup are bounded by the Shippingport PWR analysis remains for the future before acceptanceof these fuel forms. As part of the criticality licensing strategy, NSNFP has provided a revieweddata report (DOE 1999a) with traceable data for the representative fuel type. The results of theanalyses performed by using the information from this reviewed data report will be used todevelop waste acceptance criteria which must be met by all fuel forms within the HEU oxide fuelgroup including. Shippingport PWR SNF. The items that are important to safety are identifiedbased on analysis needs and result sensitivities. Prior to acceptance of the fuel from HEU oxidefuel group for disposal, the safety items of the fuel types that are being considered for disposalunder the HEU oxide fuel group must be demonstrated to satisfy the conditions set in Section8.6, Items Important to Safety.
The commercial development of PWR technology was based on the Nuclear Navy program. Thefirst reactor in this program was Shippingport. The Shippingport plant was a PWR design, basedon Argonne National Laboratory's submarine reactor technology, the capacity being 60 MWe. InDecember of 1957, the first large-scale nuclear power plant in the world began operating inShippingport, PA. This was the first commercial light water reactor plant, operating from 1958to 1982.
The analyses have been performed by following the disposal criticality analysis methodology,which was documented in the topical report, submitted to U.S. Nuclear Regulatory Commission(CRWMS M&O 1998a). The methodology includes analyzing the geochemical and physicalprocesses that can breach the waste package and degrade the waste forms as well as thestructural, thermal, shielding analyses, and intact and degraded component criticality analyses.Addenda to the topical report will be required to establish the critical limit for the DOE SNFonce sufficient critical benchmarks are identified and run. In this report, a conservative andsimplified bounding approach is employed to designate an interim critical limit
In this technical report, there are numerous references to "codisposal container" and "wastepackage." Since the use of these two terms may be confusing, a definition of the terms isincluded here:
"(Co)disposal container" means the container barriers or shells, spacing structures and baskets,shielding integral to the container, packing contained within the container, and other absorbentmaterials designed to be placed internal to the container or immediately surrounding the disposalcontainer (i.e., attached to the outer surface of the disposal container). The disposal container isdesigned to contain SNF and high-level waste (HLW), but exists only until the outer weld iscomplete and accepted. The disposal container does not include the waste form or the encasing
TDR-EDC-NU-000003 REV 00 I February 2000
containers or canisters (e.g., HLW pour canisters, DOE SNF codisposal canisters, multi-purposecanisters of SNF, etc.).
"Waste package" means the waste form and any containers (i.e., disposal container barriers andother canisters), spacing structures or baskets, shielding integral to the container, packingcontained within the container, and other absorbent materials immediately surrounding anindividual waste container placed internally to the container or attached to the outer surface ofthe disposal container. The waste package begins its existence when the outer lid weld of thedisposal container is complete and accepted.
"5-DHLW/DOE Spent Fuel-Long waste package" is the waste package that can accommodate a15-ft long (18-in. diameter) DOE SNF canister and five 15-ft HLW glass canisters.
1.1 OBJECTIVE
The objective of this report is to provide sufficient detail to establish the technical viability fordisposing of HEU oxide (Shippingport PWR) SNF in the potential Monitored GeologicRepository (MGR). This report sets limits and establishes values that if and when these limitsare met by a specific fuel type under the HEU oxide fuel group, the results for that fuel will bebounded by the results reported in this technical report.
Section 2, Design Inputs, describes the design basis, and identifies requirements andassumptions. Analytical results to demonstrate the adequacy of the design and evaluate thefeasibility of codisposing the HEU oxide (Shippingport PWR) SNF in the MGR are presented inSection 3 for Structural Analysis, Section 4 for Thermal Analysis, Section 5 for ShieldingAnalysis, Section 6 for Degradation and Geochemistry Analyses, and Section 7 for Intact andDegraded Component Criticality Analyses. For purposes of this report, these five items may becollectively designated as waste package performance. Section 8, Conclusions, provides theconnections between the design criteria and analytical results to establish technical viability. Inaddition, Section 8 gives recommendations regarding any additional needs for analysis ordocumentation. References are given in Section 9.
This technical document summarizes and analyzes the results of the detailed calculations thatwere performed in support of determining the evaluation of codisposal viability of HEU oxide(Shippingport PWR) fuel. These calculation documents and the section of this document inwhich they are summarized and analyzed are shown in Table 1-1.
1.2 SCOPE
This technical report Evaluation of Codisposal Viabilityfor HEU Oxide (Shippingport PWR)DOE-Owned Fuel evaluates and reports the performance of HEU oxide (Shippingport PWR)SNF in a waste package. This technical report summarizes the evaluation of viability of the 5-DHLW/DOE Spent Fuel-Long waste package design with HEU oxide (Shippingport PWR) SNF,which is the representative fuel for HEU oxide fuel group. The remaining fuels in the samegroup must be demonstrated to be bounded by the values. obtained from the reviewed data report,which is based on the Shippingport PWR SNF.
TDR-EDC-NU-000003 REV 00 2 Februamy 2000
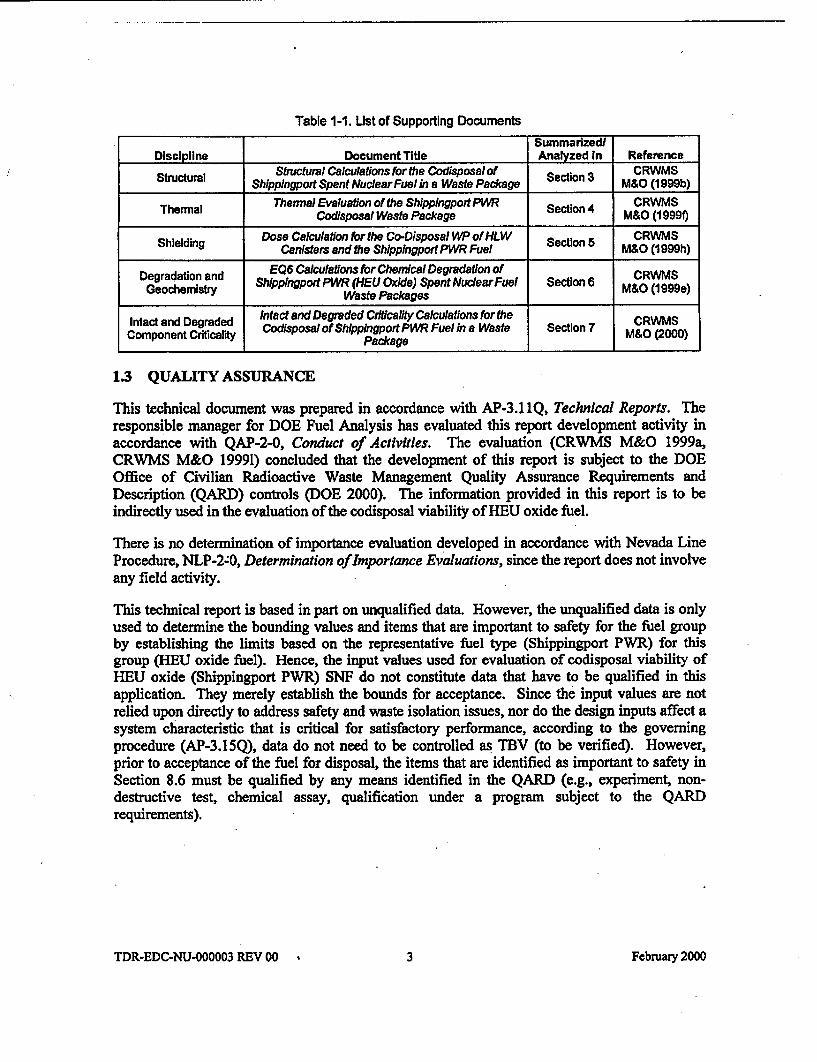
Table 1-1. List of Supporting Documents
Summarized/Discipline Document Title Analyzed In Reference
Sftructural Calculations for the Codisposal of CRWMSStructural Shlppingport Spent NuclearFuel in a Waste Package M&O (1999b)
Thermal Thermal Evaluation of the ShIpplngportPWR Secti 4 CRWMS_________________ Codisposal Waste Package M&O (19991)
ShelId-ng DoseCalculationfortheCo-DisposalWPofHLW S cti CRWMSShielding Canisters and the ShippingportPWR Fuel e on M&O (1999h)
Degradation and EQ6 Calculationsfor Chemical Degradation of CRWMSGeochemistry i Spent NuearFuel Section 6 M&O (1999e)
Waste Packages __________
Intactand Deraded Intact and Degraded Criticality Calculations for the WIIC pntact andiDegadedy Codisposal of ShippkngportPM Fuel in a Waste Section 7 MCRW2000
Component CriticafltyPackage MO(00
1.3 QUALITY ASSURANCE
This technical document was prepared in accordance with AP-3.1 1Q, Technical Reports. Theresponsible manager for DOE Fuel Analysis has evaluated this report development activity inaccordance with QAP-2-0, Conduct of Activities. The evaluation (CRWMS M&O 1999a,CRWMS M&O 19991) concluded that the development of this report is subject to the DOEOffice of Civilian Radioactive Waste Management Quality Assurance Requirements andDescription (QARD) controls (DOE 2000). The information provided in this report is to beindirectly used in the evaluation of the codisposal viability of HEU oxide fuel.
There is no determination of importance evaluation developed in accordance with Nevada LineProcedure, NLP-2-0, Determination of Importance Evaluations, since the report does not involveany field activity.
This technical report is based in part on unqualified data. However, the unqualified data is onlyused to determine the bounding values and items that are important to safety for the fuel groupby establishing the limits based on the representative fuel type (Shippingport PWR) for thisgroup (HEU oxide fuel). Hence, the input values used for evaluation of codisposal viability ofHEU oxide (Shippingport PWR) SNF do not constitute data that have to be qualified in thisapplication. They merely establish the bounds for acceptance. Since the input values are notrelied upon directly to address safety and waste isolation issues, nor do the design inputs affect asystem characteristic that is critical for satisfactory performance, according to the governingprocedure (AP-3.15Q), data do not need to be controlled as TBV (to be verified). However,prior to acceptance of the fuel for disposal, the items that are identified as important to safety inSection 8.6 must be qualified by any means identified in the QARD (e.g., experiment, non-destructive test, chemical assay, qualification under a program subject to the QARDrequirements).
TDR-EDC-NU-000003 REV 00 33 February 2000
INTENTIONALLY LEFT BLANK
TDR-EDC-NU-000003 REV 00 4 February 2000
2. DESIGN INPUTS
The data that were obtained from ASTM B 575-94, ASTM A 516/A 516M - 90, ASTM G 1-90,ASTM A 240/A 240M-97a, ASM (1990), ASTM A 276-91a, and ASME (1995) are consideredaccepted data. These references are standard handbooks, and due to the nature of these sources,the data in it are established fact and are therefore considered accepted. The data from otherreferences used as direct input are considered unqualified.
The number of digits in the values cited herein may be the result of a calculation or may reflectthe input from another source; consequently, the number of digits should not be interpreted as anindication of accuracy.
2.1 DESIGN PARAMETERS
Each of the following sections either describes the design of the waste package or identifies thebasis of major parameters.
2.1.1 Codisposal Waste Package
The codisposal waste package contains five HLW glass canisters surrounding a DOEstandardized 18-inch diameter SNF canister. The 5-DHLWIDOE Spent Fuel-Long wastepackage is based on the Viability Assessment (DOE 1998a) design of waste packages. Thebarrier materials of the waste package are typical of those used for commercial SNF wastepackages. The inner barrier is composed of 20 mm of high-nickel alloy ASTM B 575 (Alloy 22)and serves as a corrosion-resistant material. The outer barrier comprises 100 mm of carbon steel(ASTM A 516 Grade 70) and serves as a corrosion-allowance material (CRWMS M&O 1997a,pp. 56 and 72). The outside diameter of the waste package is 2,120 mm and the length of theinside cavity is 4,617 mm (CRWMS M&O 1998b), which is designed to accommodate Hanford15-foot HLW glass canisters. The lids of the inner barrier are 25 mm thick; those of the outerbarrier, 110 mm thick. There is a 30-mm gap between the inner and outer barrier upper lids.Each end of the waste package has a 225-mm long skirt. Table 2-1 summarizes the dimensionsand materials of the waste package.
The DOE SNF canister is placed in a 31.75-mm thick carbon steel (ASTM A 516 Grade 70)support tube with a nominal outer diameter of 565 mm. The support tube is connected to theinside wall of the waste package by a web-like structure of carbon steel (ASTM A 516 Grade 70)basket plates to support five long HLW glass canisters, as shown in Figure 2:1. The support tubeand the plates are 4,607 mm long.
TDR-EDC-NU-000003 REV 00 5s February 2000
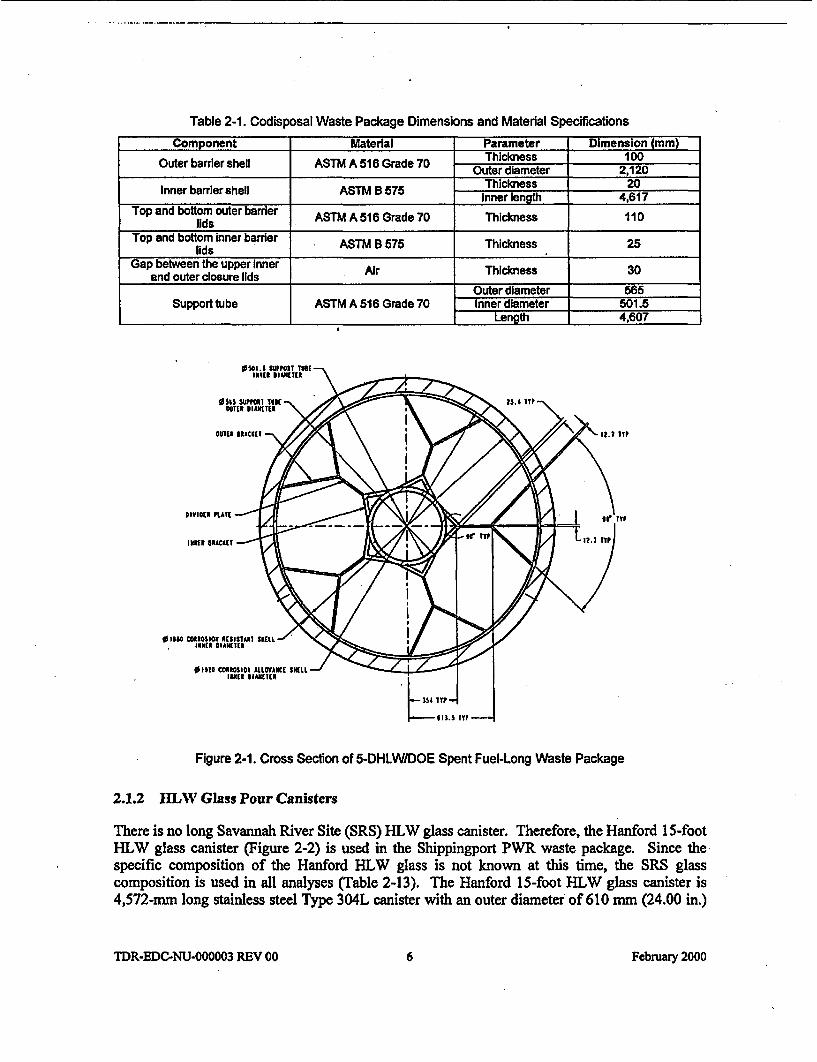
Table 2-1. Codisposal Waste Package Dimensions and Material Specifications
Component Material Parameter Dimension (mm)
Outer barrier shell ASTM A 516 Grade 70 Thickness 100Outer diameter 2,120
Inner barrier shell ASTM B 675 Thickness 20Inner length 4.617
Top and bottom outer barrier ASTM A 516 Grade 70 Thickness 110lids
Top and bottom Inner barrier ASTM B 675 Thickness 25lid s _ _ _ _ _ _ _ _ _ _ _ _ _ _ _ _ _ _ _ _ _ _ _ _ _ _ _ _ _ _ _ _ _
Gap between the upper Inner Air Thickness 30and outer closure lids Air Thickness 30
Outer diameter 565Support tube ASTM A 516 Grade 70 Inner diameter 501.5
__Length 4.607
0 is" C0al0SION MESISTAST 11KELLa11its SlANEIim
Figure 2-1. Cross Section of 5-DHLWIDOE Spent Fuel-Long Waste Package
2.1.2 IHLW Glass Pour Canisters
There is no long Savannah River Site (SRS) HLW glass canister. Therefore, the Hanford 15-footHLW glass canister (Figure 2-2) is used in the Shippingport PWR waste package. Since thespecific composition of the Hanford HLW glass is not known at this time, the SRS glasscomposition is used in all analyses (Table 2-13). The Hanford 15-foot HLW glass canister is4,572-mm long stainless steel Type 304L canister with an outer diameter of 610 mm (24.00 in.)
TDR-EDC-NU-000003 REV 00 6 February 2000
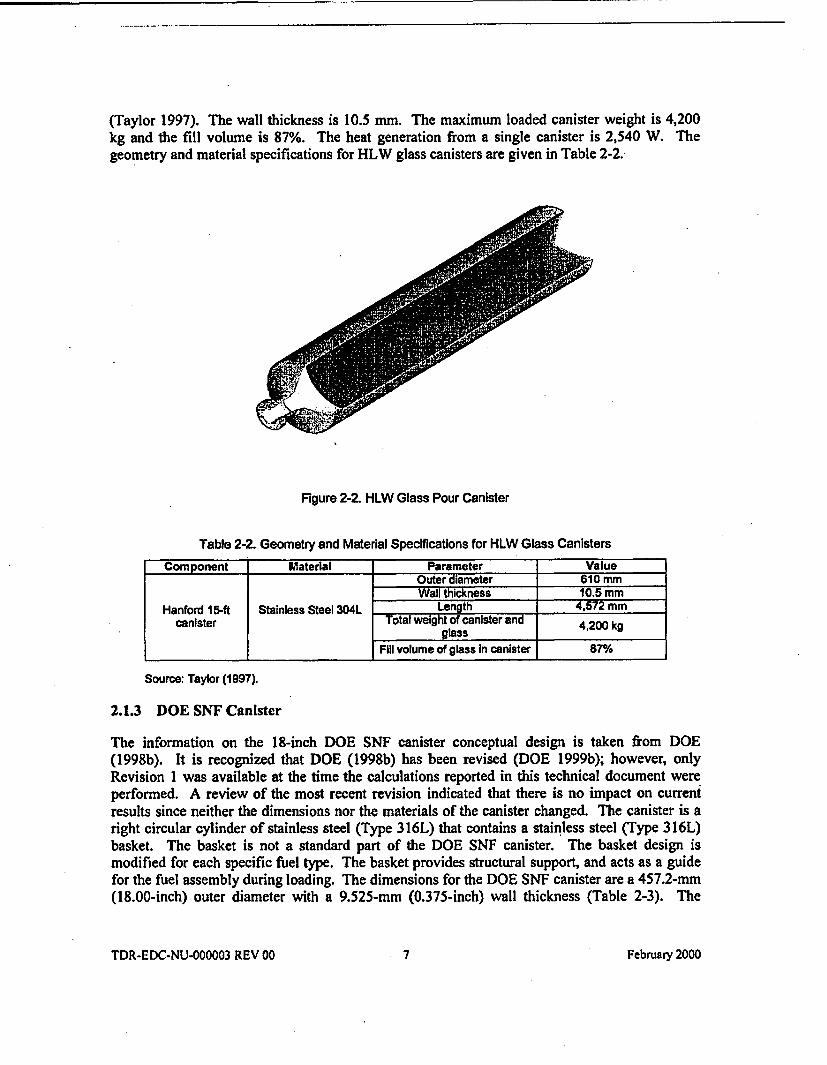
(Taylor 1997). The wall thickness is 10.5 mm. The maximum loaded canister weight is 4,200kg and the fill volume is 87%. The heat generation from a single canister is 2,540 W. Thegeometry and material specifications for HLW glass canisters are given in Table 2-2.
Figure 2-2. HLW Glass Pour Canister
Table 2-2. Geometry and Material Specifications for HLW Glass CanistersComponent Material Parameter Value
Outer diameter 610 mmWall thickness 10.5 mm
Hanford 15-ft Stainless Steel 304L Length 4,572 mmcanister Total weight of canister and 4,200 kg
Fill volume of glass in canister 87%
Source: Taylor (1997).
2.1.3 DOE SNF Canister
The information on the 18-inch DOE SNF canister conceptual design is taken from DOE(1998b). It is recognized that DOE (1998b) has been revised (DOE 1999b); however, onlyRevision I was available at the time the calculations reported in this technical document wereperformed. A review of the most recent revision indicated that there is no impact on currentresults since neither the dimensions nor the materials of the canister changed. The canister is aright circular cylinder of stainless steel (Type 316L) that contains a stainless steel (Type 316L)basket. The basket is not a standard part of the DOE SNF canister. The basket design ismodified for each specific fuel type. The basket provides structural support, and acts as a guidefor the fuel assembly during loading. The dimensions for the DOE SNF canister are a 457.2-mm(18.00-inch) outer diameter with a 9.525-mm (0.375-inch) wall thickness (Table 2-3). The
TDR-EDC-NU-000003 REV 00 7 February 2000
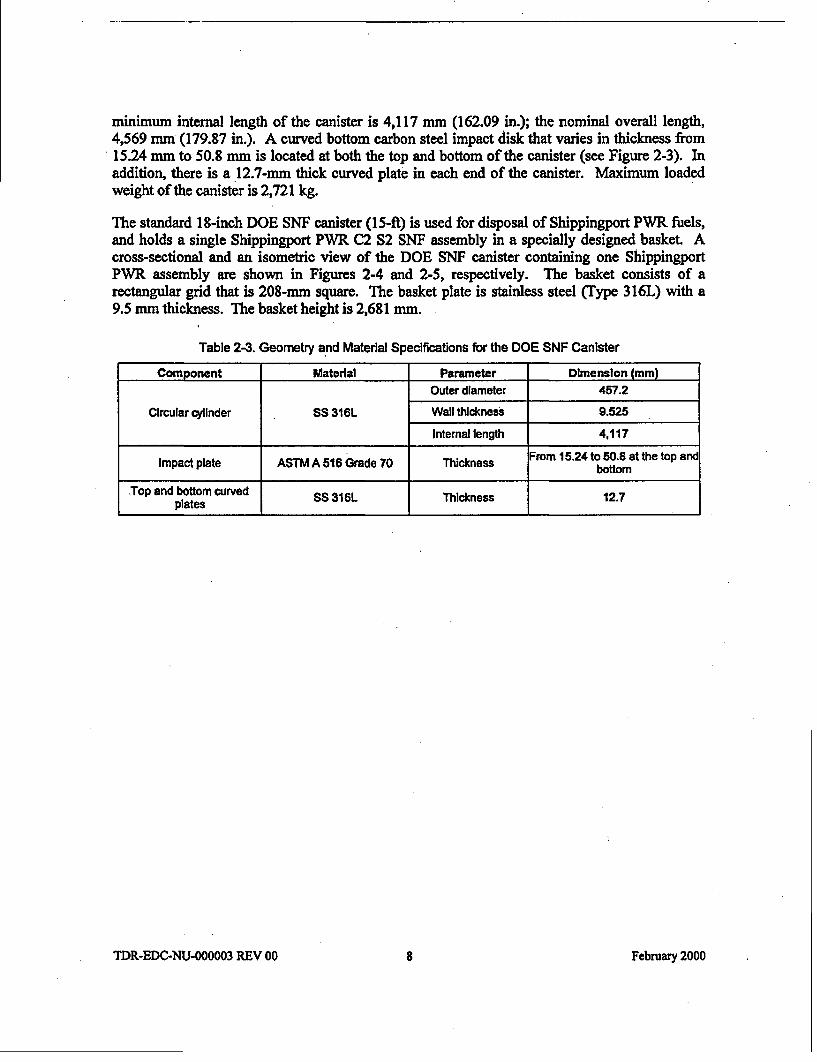
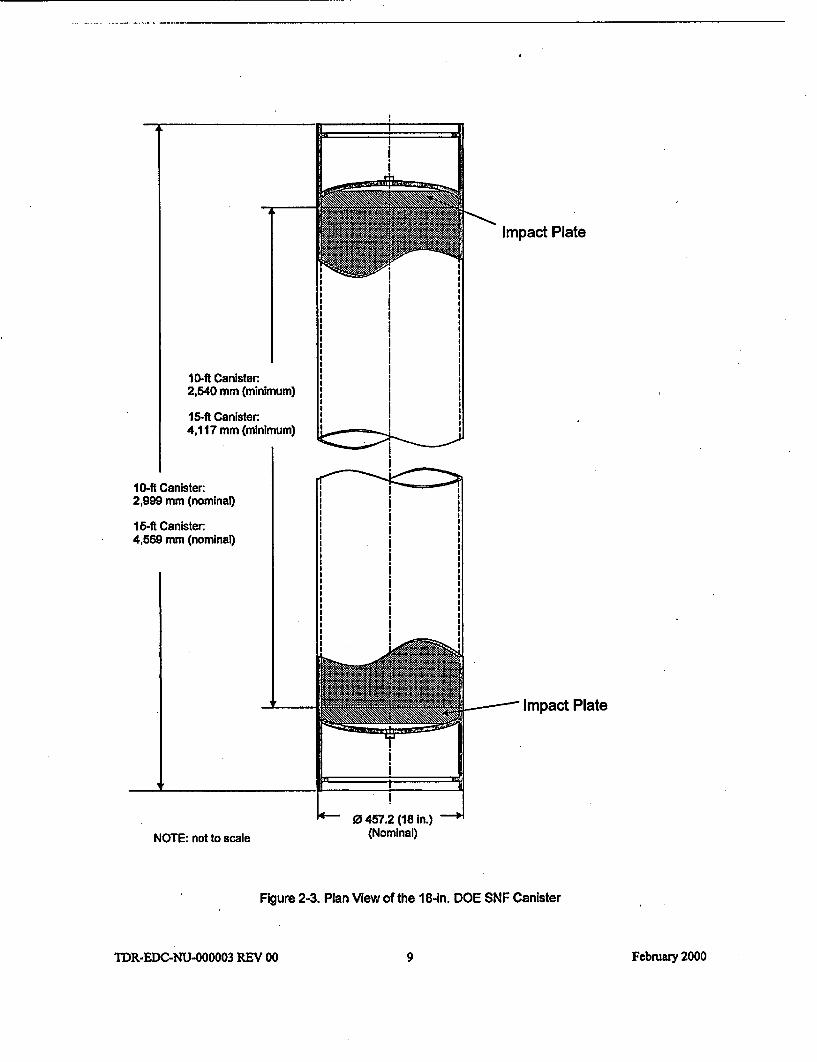
minimum internal length of the canister is 4,117 mm (162.09 in.); the nominal overall length,4,569 mm (179.87 in.). A curved bottom carbon steel impact disk that varies in thickness from15.24 mm to 50.8 mm is located at both the top and bottom of the canister (see Figure 2-3). Inaddition, there is a 12.7-mm thick curved plate in each end of the canister. Maximum loadedweight of the canister is 2,721 kg.
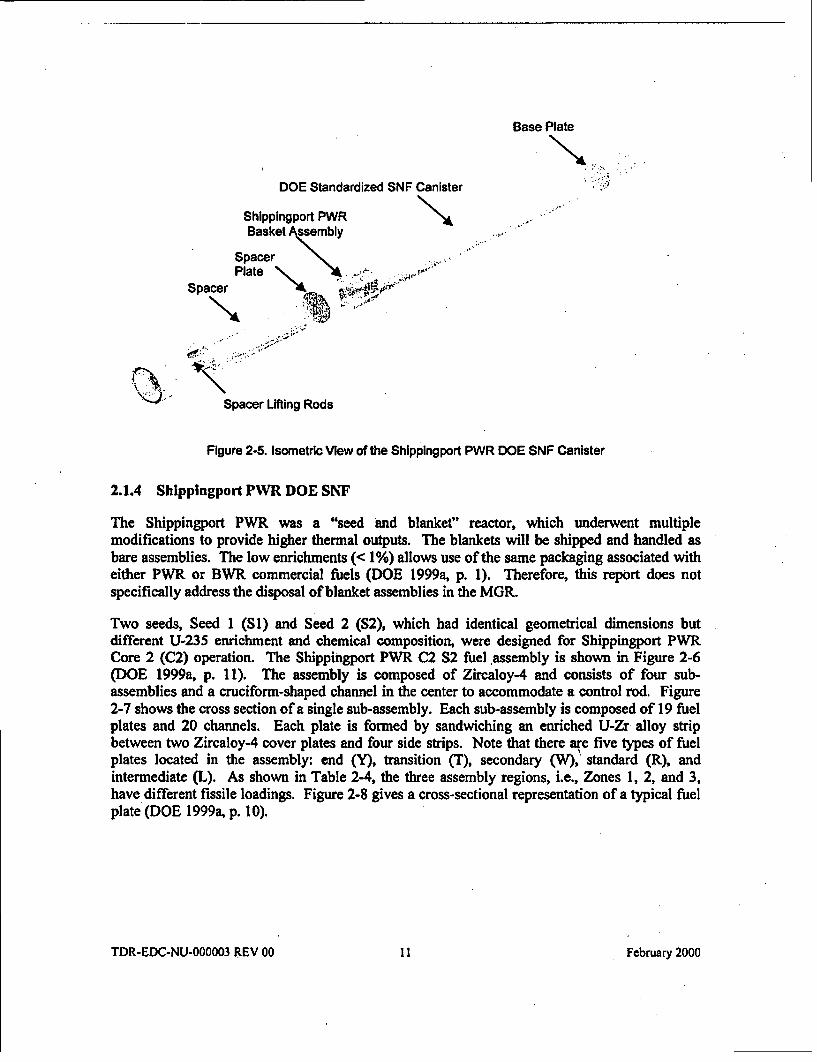
The standard 18-inch DOE SNF canister (15-ft) is used for disposal of Shippingport PWR fuels,and holds a single Shippingport PWR C2 S2 SNF assembly in a specially designed basket. Across-sectional. and an isometric view of the DOE SNF canister containing one ShippingportPWR assembly are shown in Figures 2-4 and 2-5, respectively. The basket consists of arectangular grid that is 208-mm square. The basket plate is stainless steel (Type 316L) with a9.5 mm thickness. The basket height is 2,681 mm.
Table 2-3. Geometry and Material Specifications for the DOE SNF Canister
Component Material Parameter Dimension (mm)Outer diameter 457.2
Circular cylinder SS 316L Wall thickness 9.525
Internal length 4.117
Impact plate ASTM A 516 Grade 70 Thickness From 15.24 to 50.8 at the top and
Top and bottom curved SS 316L Thickness 12.7plates _ _ _ _ _ _ _ _ _
TDR-EDC-NU-000003 REV 00 8 February 2000
I
;
II
II
II
II
II
II
II
II
IIII
10-ft Canister:2,540 mm (minimum)
15-Et Canister:4,117 mm (minimum)
I
10-ft Canister:2,999 mm (nominal)
15-ft Canister:4,569 mm (nominal)
_I
Impact Plate
---- Impact Plate
0 457.2 (18 In.)NOTE: not to scale (Nominal)
Figure 2-3. Plan View of the 1 84n. DOE SNF Canister
TDR-EDC-NU-000003 REV 00 9 February 2000
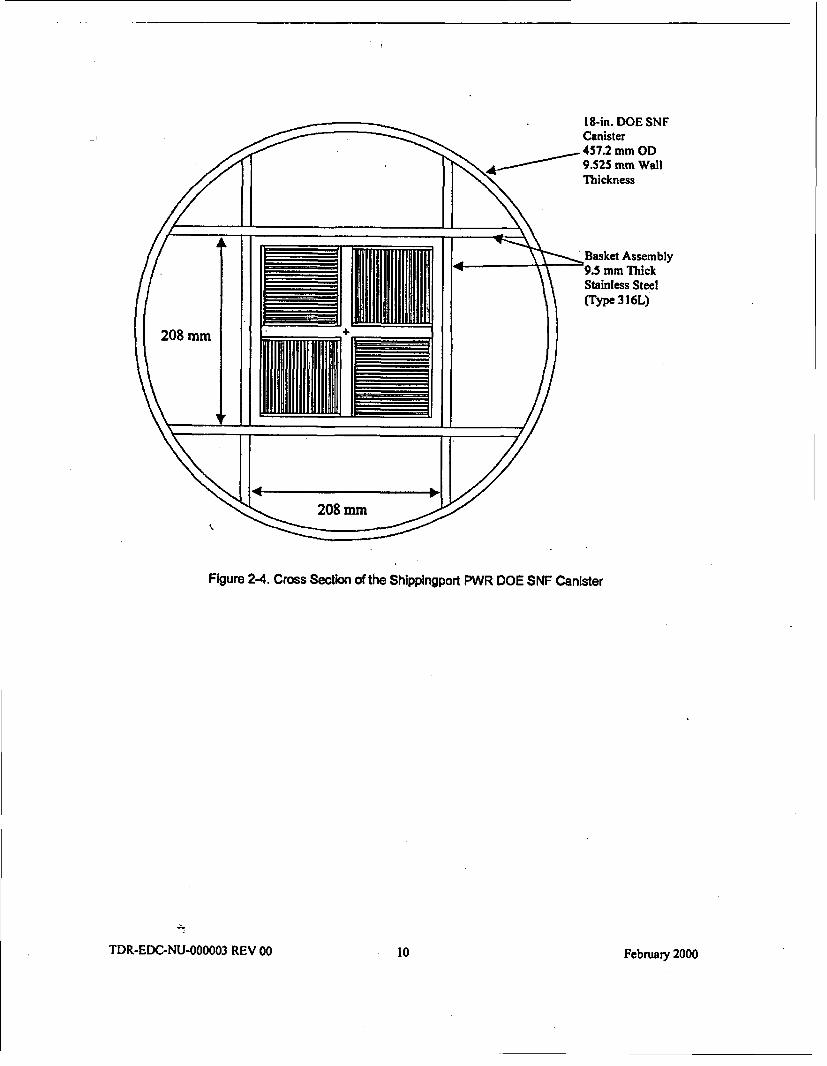
Figure 2-4. Cross Section of the Shippingport PWR DOE SNF Canister
TDR-EDC-NU.000003 REV 00 to February 2000
Base Plate
K.,DOE Standardized SNF Canister
Shippingport PWRBasket ssembly
SpacerPlate N
Spacer t4
Spacer Lifting Rods
Figure 2-5. Isometric View of the ShIppingport PWR DOE SNF Canister
2.1.4 Shippingport PWR DOE SNF
The Shippingport PWR was a "seed and blanket" reactor, which underwent multiplemodifications to provide higher thermal outputs. The blankets will be shipped and handled asbare assemblies. The low enrichments (< 1%) allows use of the same packaging associated witheither PWR or BWR commercial fuels (DOE 1999a, p. 1). Therefore, this report does notspecifically address the disposal of blanket assemblies in the MGR.
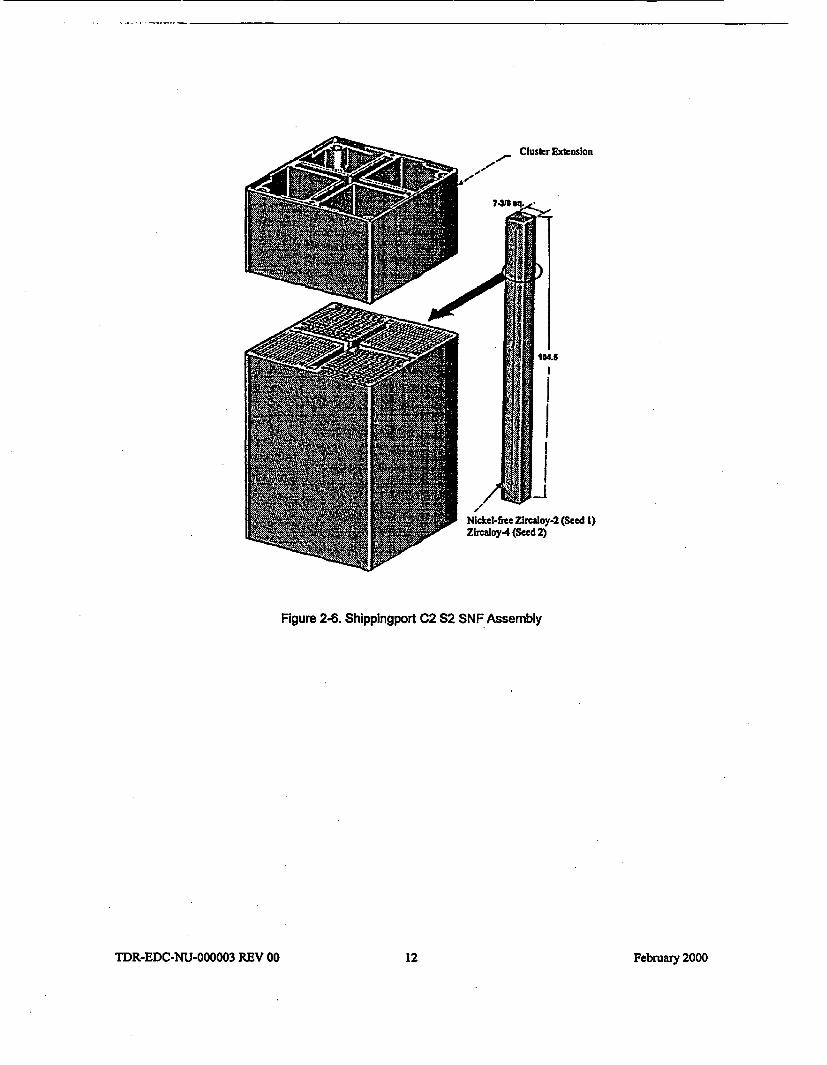
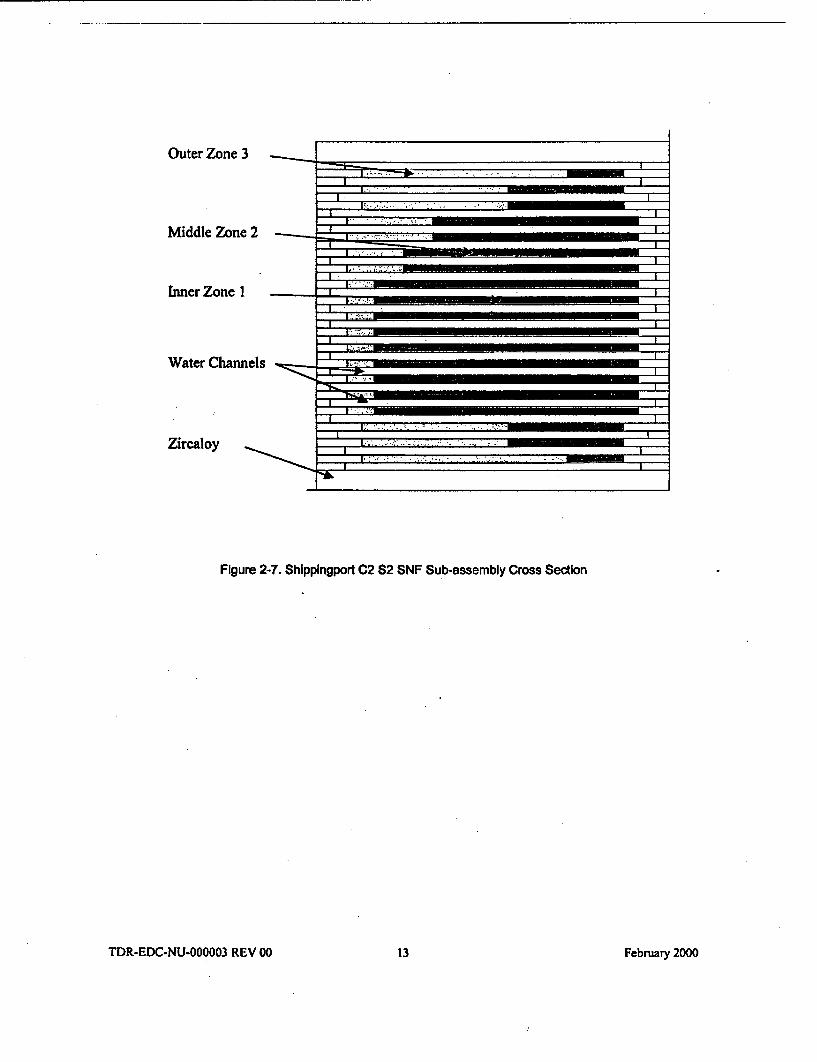
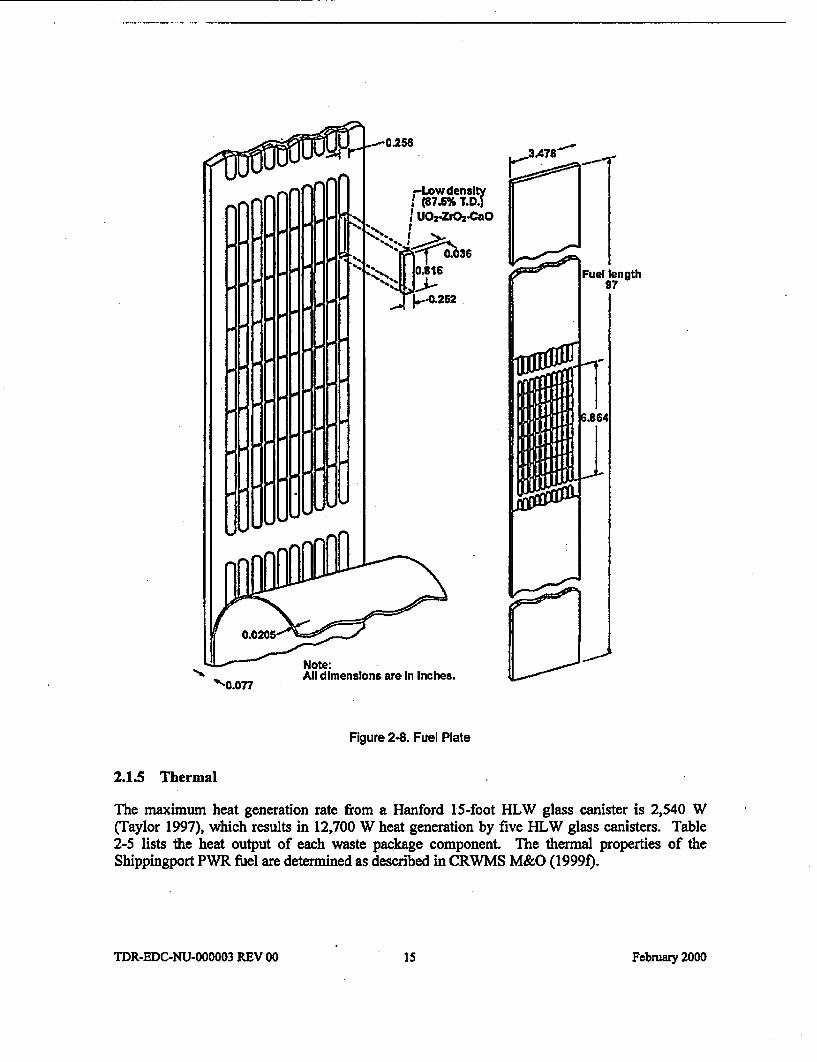
Two seeds, Seed 1 (S1) and Seed 2 (S2), which had identical geometrical dimensions butdifferent U-235 enrichment and chemical composition, were designed for Shippingport PWRCore 2 (C2) operation. The Shippingport PWR C2 S2 fuel assembly is shown in Figure 2-6(DOE 1999a, p. 11). The assembly is composed of Zircaloy-4 and consists of four sub-assemblies and a cruciform-shaped channel in the center to accommodate a control rod. Figure2-7 shows the cross section of a single sub-assembly. Each sub-assembly is composed of 19 fuelplates and 20 channels. Each plate is formed by sandwiching an enriched U-Zr alloy stripbetween two Zircaloy-4 cover plates and four side strips. Note that there are five types of fuelplates located in the assembly: end (Y), transition (T), secondary (W), standard (R), andintermediate (L). As shown in Table 2-4, the three assembly regions, i.e., Zones 1, 2, and 3,have different fissile loadings. Figure 2-8 gives a cross-sectional representation of a typical fuelplate (DOE 1999a, p. 10).
TDR-EDC-NU-000003 REV 00 it February 2000
..-Cluster Extension
Nickel-free Zircaloy-2 (Seed 1)Zircaloy-4 (Seed 2)
Figure 2-6. Shippingport C2 S2 SNF Assembly
TDR-EDC-NU-000003 REV 00 12 February 2000
Outer Zone 3
Middle Zone 2
Inner Zone 1
V. -- ha.
Water Channels
Zircaloy
Figure 2-7. Shippingport C2 82 SNF Sub-assembly Cross Section
TDR-EDC-NU-000003 REV 00 13 February 2000
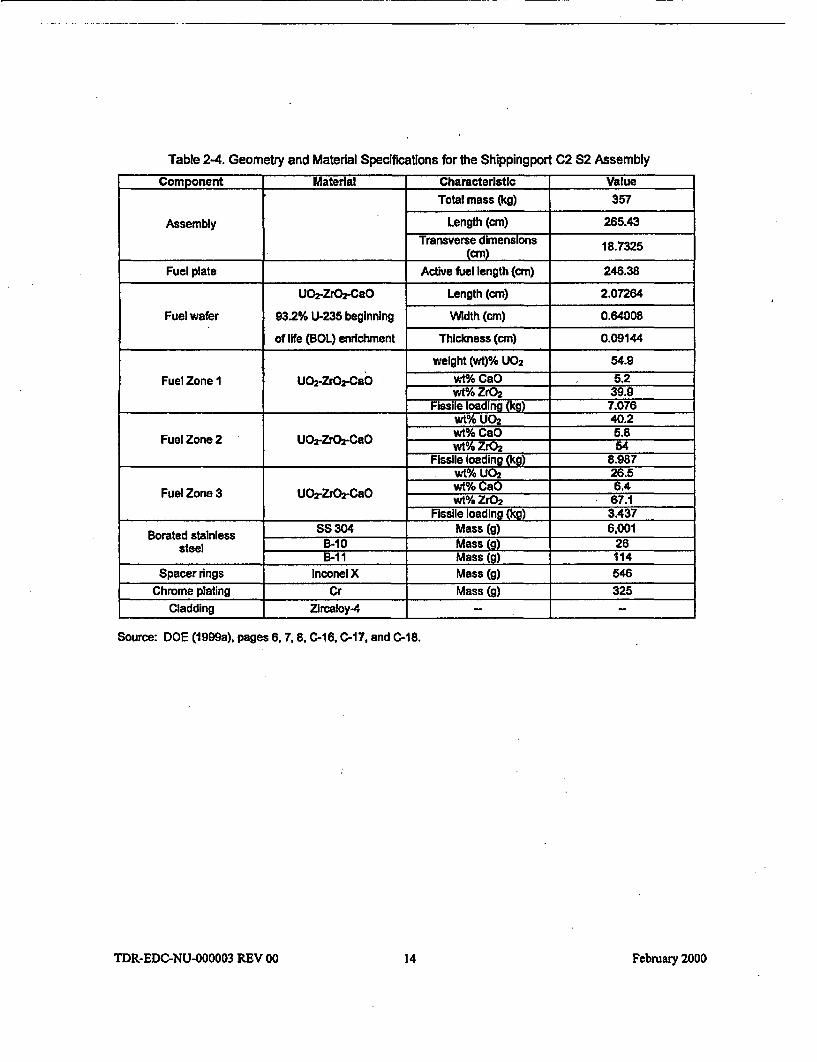
Table 2-4. Geometry and Material Specifications for the Shipping port C2 S2 Assembly
Component Material Characteristic ValueTotal mass (kg) 357
Assembly Length (cm) 265.43Transverse dimensions 18.7325
Fuel plate Active fuel length (cm) 246.38
U02-ZrO2CaO Length (cm) 2.07264
Fuel wafer 93.2% U-235 beginning Width (cm) 0.64008
of life (BOL) enrichment Thickness (cm) 0.09144
weight (wt)% U02 54.9Fuel Zone 1 UO2-ZrO2-CaO wt% CaO 5.2
wt% ZrO2 39.9Fissile loading (kg) 7.076
wt% U02 40.2Fuel Zone 2 UO2-ZrO2-C8O wt% CaO 5.8
Wt% ZrO2 54Fissile loading (kg) 8.987
wt% U02 26.5
Fuel Zone 3 UOZrO2-CaO wt% CsO, 674
Fissile loading (kg) 3.437
Borated stainless SS 304 Mass (g) 6.001steel B-10 Mass (g) 26
B-11 Mass (g) 114Spacer rings Inconel X Mass (g) 546
Chrome plating Cr Mass (g) 325Cadding Zircaloy-4 _
Source: DOE (1999a), pages 6. 7. 8. C-16, C-17, and C-18.
TDR-EDC-NU-000003 REV 00 14 February 200D
Note:'*-C0.077 All dimensions are In Inches.
Figure 248. Fuel Plate
2.1.5 Thermal
The maximum heat generation rate from a Hanford 15-foot HLW glass canister is 2,540 W(Taylor 1997), which results in 12,700 W heat generation by five HLW glass canisters. Table2-5 lists the heat output of each waste package component. The thermal properties of theShippingport PWR fuel are determined as described in CRWMS M&O (19991).
TDR-EDC-NU-000003 REV 00 15 February 2000
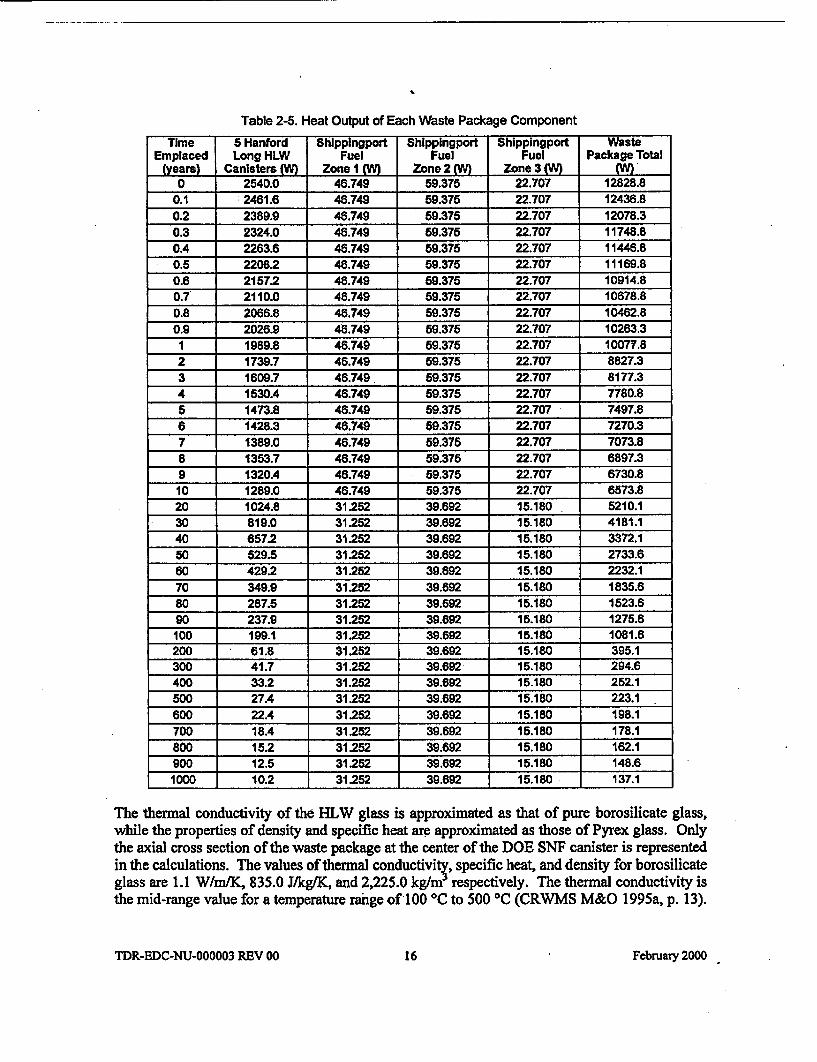
Table 2-5. Heat Output of Each Waste Package Component
Time S Hanford Shippingport Shippingport Shippingport WasteEmplaced Long HLW Fuel Fuel Fuel Package Total
(years) Canisters M Zone I (W) Zone 2 (W) Zone 3 (Wt) jo 2540.0 46.749 59.375 22.707 12828.8
0.1 2461.6 46.749 59.375 22.707 12436.80.2 2389.9 46.749 59.375 22.707 12078.30.3 2324.0 46.749 59.375 22.707 11748.80.4 2263.6 46.749 59.375 22.707 11446.80.5 2208.2 46.749 59.375 22.707 11169.80.6 2157.2 48.749 59.375 22.707 10914.80.7 2110.0 46.749 59.375 22.707 10678.80.8 2066.8 46.749 59.375 22.707 10462.80.9 2026.9 45.749 59.375 22.707 10263.31 1989.8 46.749 59.375 22.707 10077.82 1739.7 46.749 59.375 22.707 8827.33 1609.7 46.749. 59.375 22.707 8177.34 1530.4 46.749 59.375 22.707 7780.85 1473.8 48.749 59.375 22.707 7497.86 1428.3 48.749 59.375 22.707 7270.37 1389.0 46.749 59.375 22.707 7073.88 1353.7 48.749 59.375 22.707 6897.39 1320A 46.749 59.375 22.707 6730.810 1289.0 48.749 59.375 22.707 6573.820 1024.8 31.252 39.692 15.180 5210.130 819.0 31.252 39.692 15.180 4181.140 857.2 31.252 39.692 15.180 3372.150 529.5 31.252 39.692 15.180 2733.660 429.2 31.252 39.692 15.180 2232.170 349.9 31.252 39.892 15.180 1835.680 287.5 31.252 39.692 15.180 1523.690 237.9 31.252 39.6892 15.180 1275.6100 199.1 31.252 39.692 15.180 1081.6200 61.8 31.252 39.692 15.180 395.1300 41.7 31.252 39.692 15.180 294.6400 33.2 31.252 39.692 15.180 252.1500 27.4 31.252 39.692 15.180 223.1600 22.4 31.252 39.692 15.180 198.1700 18.4 31252 39.692 15.180 178.1800 15.2 31.252 39.692 15.180 162.1900 12.5 31252 39.692 15.180 148.61000 10.2 31252 39.692 15.180 137.1
The thermal conductivity of the HLW glass is approximated as that of pure borosilicate glass,while the properties of density and specific heat are approximated as those of Pyrex glass. Onlythe axial cross section of the waste package at the center of the DOE SNF canister is representedin the calculations. The values of thermal conductivity, specific heat, and density for borosilicateglass are 1.1 W/mfK, 835.0 J/kg/'K, and 2,225.0 kg/mr respectively. The thermal conductivity isthe mid-range value for a temperature range of 100 0C to 500 IC (CRWMS M&O 1995a, p. 13).
TDR-EDC-NU-000003 REV 00 16 February 2000
The density and specific heat are taken to be the same as that of Pyrex glass at 27 IC (300 K)(CRWMS M&O 1995a, p. 13).
2.1.6 Shielding Source Term
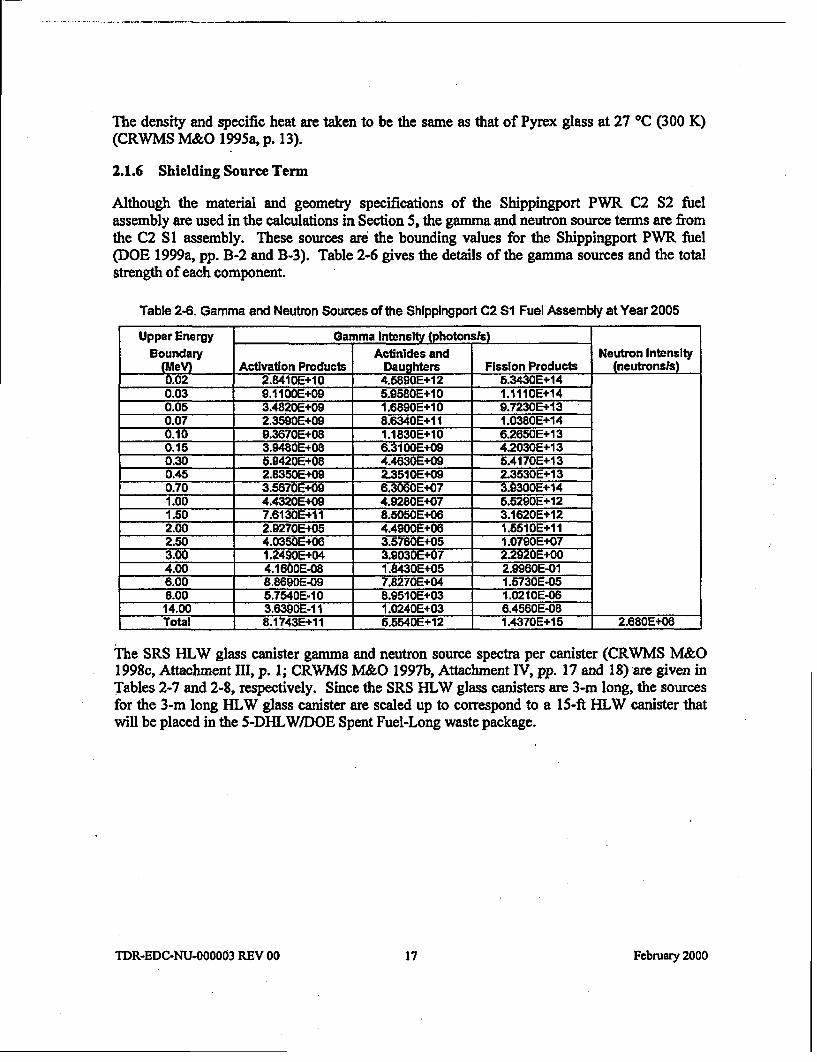
Although the material and geometry specifications of the Shippingport PWR C2 S2 fuelassembly are used in the calculations in Section 5, the gamma and neutron source terms are fromthe C2 SI assembly. These sources are the bounding values for the Shippingport PWR fuel(DOE 1999a, pp. B-2 and B-3). Table 2-6 gives the details of the gamma sources and the totalstrength of each component.
Table 2-6. Gamma and Neutron Sources of the Shippingport C2 SI Fuel Assembly at Year 2005
Upper Energy Gamma Intensity (photopsts)Boundary Atinides and Neutron Intensity
(MeY) Activation Products Daughters Fission Products (neutronsls)0.02 2.8410E+10 4.5890E+12 6.3430E+140.03 9.11 00E+09 5.9580E+10 1.1110E+140.05 3.4820E+09 1.6890E+10 9.7230E+130.07 2.3590E+09 8.6340E+11 1.0380E+140.10 9.3670E+08 1.1830E+10 6.2650E+130.15 3.M80E+08 6.3100E+09 4.2030E+130.30 5.9420E+08 4.4630E+09 5.4170E+130.45 2.8350E+09 2.3510E+09 2.3530E+130.70 3.5670E+09 6.3060E+07 3.9300E+141.00 4.4320E+09 4.9280E+07 5.5290E+121.50 7.6130E1+11 8.5050E+06 3.1620E+122.00 2.9270E+05 4.4900E+06 1.6510E+112.50 4.0350E+06 3.5760E+05 1.0790E+073.00 1.2490E+04 3.9030E+07 2.2920E+004.00 4.1600E-08 1.8430E+05 2.9960E-016.00 8.8690E-09 7.8270E+04 1.5730E-058.00 5.7540E-10 8.9510E+03 1.0210E-0614.00 3.8390E-11 1.0240E+03 6.4560E-08Total 8.1743E+11 5.5540E+12 1.4370E+15 2.680E+06
The SRS HLW glass canister gamma and neutron source spectra per canister (CRWMS M&O1998c, Attachment III, p. 1; CRWMS M&O 1997b, Attachment IV, pp. 17 and 18) are given inTables 2-7 and 2-8, respectively. Since the SRS HLW glass canisters are 3-m long, the sourcesfor the 3-m long HLW glass canister are scaled up to correspond to a 15-ft HLW canister thatwill be placed in the 5-DBLW/DOE Spent Fuel-Long waste package.
TDR-EDC-NU-000003 REV 00 17 February 2000
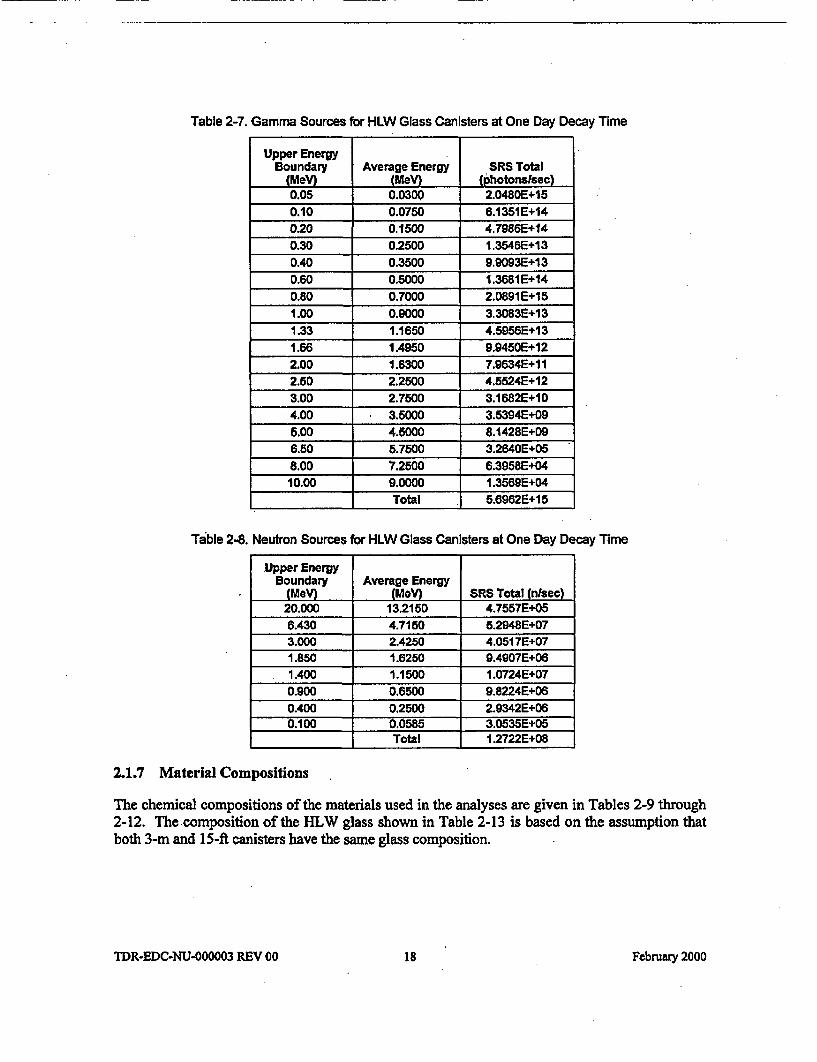
Table 2-7. Gamma Sources for HLW Glass Canisters at One Day Decay Time
Upper EnergyBoundary Average Energy SRS Total
(MeY) (MO (Photons/sec)0.05 0.0300 2.0480E+150.10 0.0750 6.1351E+140.20 0.1500 4.7986E+140.30 0.2500 1.3546E+130.40 0.3500 9.9093E+130.60 0.5000 1.3681E+140.80 0.7000 2.0891E+151.00 0.9000 3.3083E+131.33 1.1650 4.5956E+131.66 1.4950 9.9450E+122.00 1.8300 7.9634E+112.50 2.2500 4.5524E+123.00 2.7500 3.1682E+104.00 3.5000 3.5394E+095.00 4.5000 8.1428E+096.50 5.7500 3.2840E+058.00 7.2500 6.3958E+0410.00 9.0000 1.3569E+04
Total 5.6962E+1 5
Table 2-8. Neutron Sources for HLW Glass Canisters at One Day Decay Time
Upper EnergyBoundary Average Energy
(MeV) (MeV) SRS Total (nlsec)20.000 13.2150 4.7557E+056.430 4.7150 5.2948E+073.000 2.4250 4.0517E+071.850 1.6250 9.4907E+061.400 1.1500 1.0724E+070.900 0.6500 9.8224E+060.400 0.2500 2.9342E+060.100 0.0585 3.0535E+05
Total 1 .2722E+08
2.1.7 Material Compositions
The chemical compositions of the materials used in the analyses are given in Tables 2-9 through2-12. The composition of the HLW glass shown in Table 2-13 is based on the assumption thatboth 3-m and 15-ft canisters have the same glass composition.
TDR-EDC-NU-000003 REV 00 is February 2000
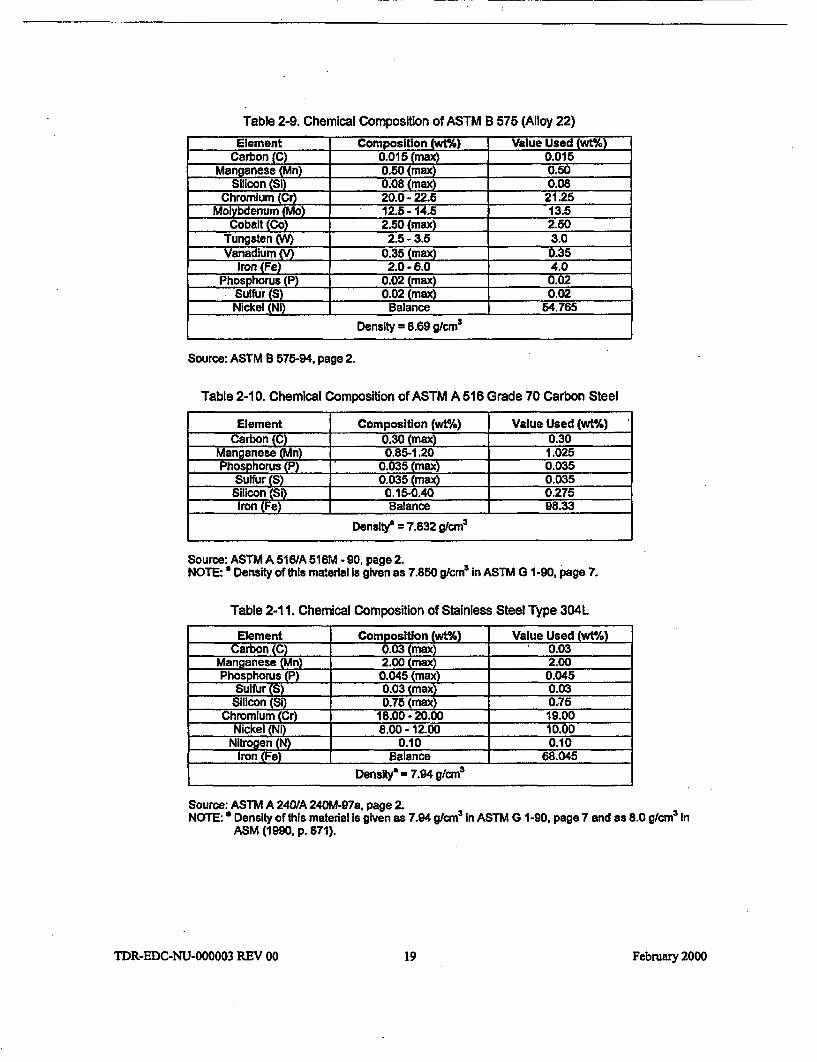
Table 2-9. Chemical Composition of ASTM B 575 (Alloy 22)
Element Composition (wt%) Value Used (wt%)Carbon (C) 0.015 (max) 0.015
Manganese (Mn) 0.50 (max) 0.50Silicon (S) 0.08 (max) 0.08
Chromium (Cr) 20.0- 22.5 21.25Molybdenum (Mo) 12.5- 14.5 13.5
Cobalt (Co) 2.50 (max) 2.50Tungsten OM 2.5- 3.5 3.0Vanadium (V) 0.35 (max) 0.35
Iron (Fe) 2.0- 6.0 4.0Phosphorus (P) 0.02 (max) 0.02
Sulfur (S) 0.02 (max) 0.02Nickel (Ni) Balance 54.765
Density = 8.69 g/cma
Source: ASTM B 575-94, page 2.
Table 2-10. Chemical Composition of ASTM A 516 Grade 70 Carbon Steel
Element Composition (wt%) Value Used (wtA)Carbon (C) 0.30 (max) 0.30
Manganese (Mn) 0.85-1.20 1.025Phosphorus (P) 0.035 (max) 0.035
Sulfur (S) 0.035 (max) 0.035Silicon (SI) 0.15-0.40 0.275Iron ( Balance 98.33
Density3 = 7.832 g/cm2
Source: ASTM A 516/A 51 6M - 90, page 2.NOTE: a Density of this material Is given as 7.850 glcm3 In ASTM G 1-90, page 7.
Table 2-11. Chemical Composition of Stainless Steel Type 304L
Element Composition (wt%) Value Used (wt%)Carbon (C) 0.03 (max) 0.03
Manganese (Mn) 2.00 (max) 2.00Phosphorns (P) 0.045 (max) 0.045
Sulfur (S) 0.03 (max) 0.03Silicon (Si) 0.75 (max) 0.75
Chromium (Cr) 18.00 -20.00 19.00Nickel (Ni) 8.00- 12.00 10.00
Nitrogen (N) 0.10 0.10Iron (Fe) Balance 68.045
Densty 7.94 g/cm3
Source: ASTM A 240/A 240M-97a, page 2.NOTE: * Density of this material Is given as 7.94 g/cm 3 in ASTM G 1-90, page 7 and as 8.0 g/cm3 in
ASM (1990, p. 871).
TDR-EDC-NU-000003 REV 00 19 February 2000
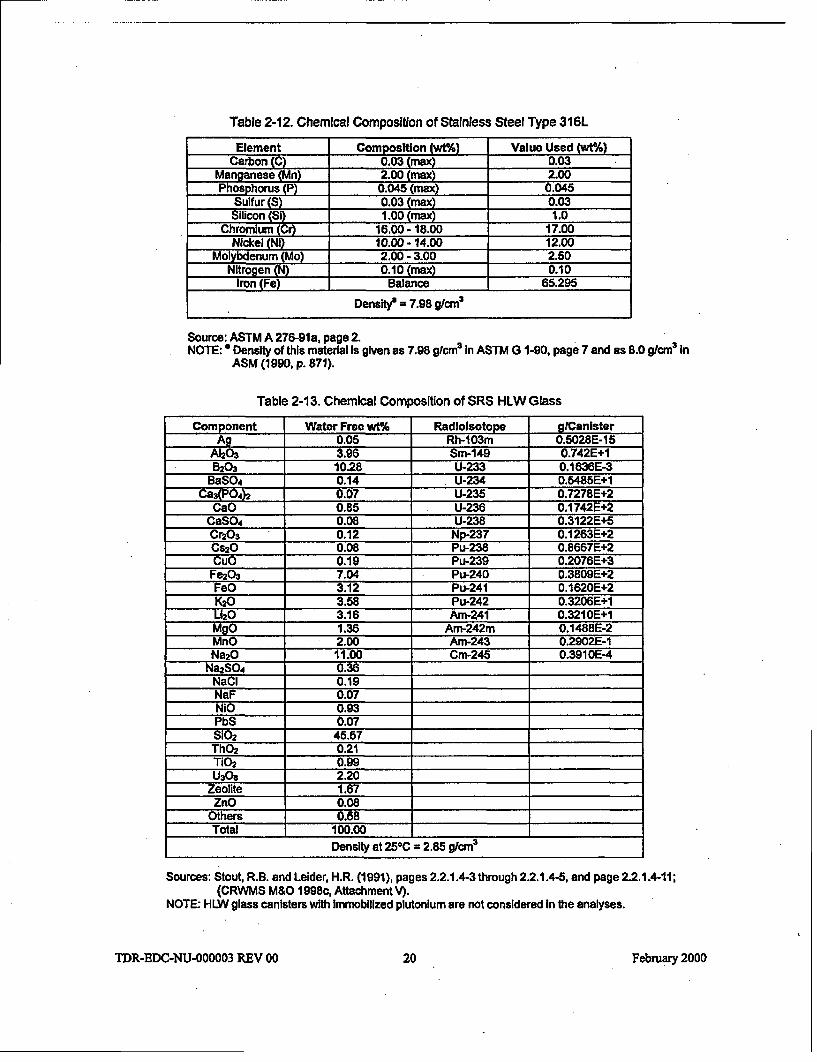
Table 2-12. Chemical Composition of Stainless Steel Type 316L
Element Composltion (wtV/) Value Used (wthA)Carbon (C) 0.03 (max) 0.03
Manganese Mn) 2.00 (max) 2.00Phosphorus (P) 0.045 (max) 0.045
Sulfur (S) 0.03 (max) 0.03Silicon (Si) 1.00 (max) 1.0
Chromium (Cr) 16.00- 18.00 17.00Nickel (Ni) 10.00- 14.00 12.00
Molybdenum (Mo) 2.00 -3.00 2.50Nitrogen (N) 0.10 (max) 0.10
Iron (Fe) Balance 65.295
Density' = 7.98 9/cm3
Source: ASTM A 276-91a, page 2.NOTE: * Density of this material Is given as 7.98 glcm3 In ASTM G 1-90, page 7 and as 8.0 glcma In
ASM (1990, p. 871).
Table 2-13. Chemical Composition of SRS HLW Glass
Component Water Free wtLh RadioIsotope glCanisterAg 0.05 Rh-103m 0.5028E-15
AI203 3.96 Sm-149 0.742E+1B203 1028 U-233 0.1636E-3
BaSO4 0.14 U-234 0.5485E+1Ca3(P94)2 0.07 U-235 0.7278E+2
CaO 0.85 U-236 0.1742E+2CaSO4 0.08 U-238 0.3122E+5Cr203 0.12 Np-237 0.1263E+2Cs2O 0.08 Pu-238 0.8667E+2CuO 0.19 Pu-239 02076E+3
Fe2 O3 7.04 Pu-240 0.3809E+2FeO 3.12 Pu-241 0.1620E+2K20 3.58 Pu-242 0.3206E+1L120 3.16 Am-241 0.3210E+1MgO 1.36 Am-242m 0.1488E-2MnO 2.00 Am-243 0.2902E-1Na2O 11.00 Cm-245 0.3910E-4
Na2SO4 0.36NaCI 0.19NaF 0.07NiO 0.93 _ _ _ _ _
PbS 0.07S10 2 45.57ThO2 0.21T10 2 0.99U308 2.20 - -_
Zeolite 1.67ZnO 0.08
Others 0.58 -Total 100.00
Density at 250C = 2.85 g/cr 3
Sources: Stout, R.B. and Leider, H.R. (1991), pages 2.2.1.4-3 through 2.2.1.4-5, and page 2.2.1.4-11;(CRWMS M&O 1998c, Attachment V).
NOTE: HLW glass canisters with Immobilized plutonium are not considered In the analyses.
TDR-EDC-NU-000003 REV 00 20 February 2000
2.1.8 Degradation and Geochemistry
This section identifies the degradation rate of the principal alloys, the chemical composition ofJ-13 well water, and the drip rate of J-13 well water into a waste package. These rates are usedin Section 6, Degradation and Geochemistry Analyses.
2.1.8.1 Physical and Chemical Form of Shippingport Waste Package
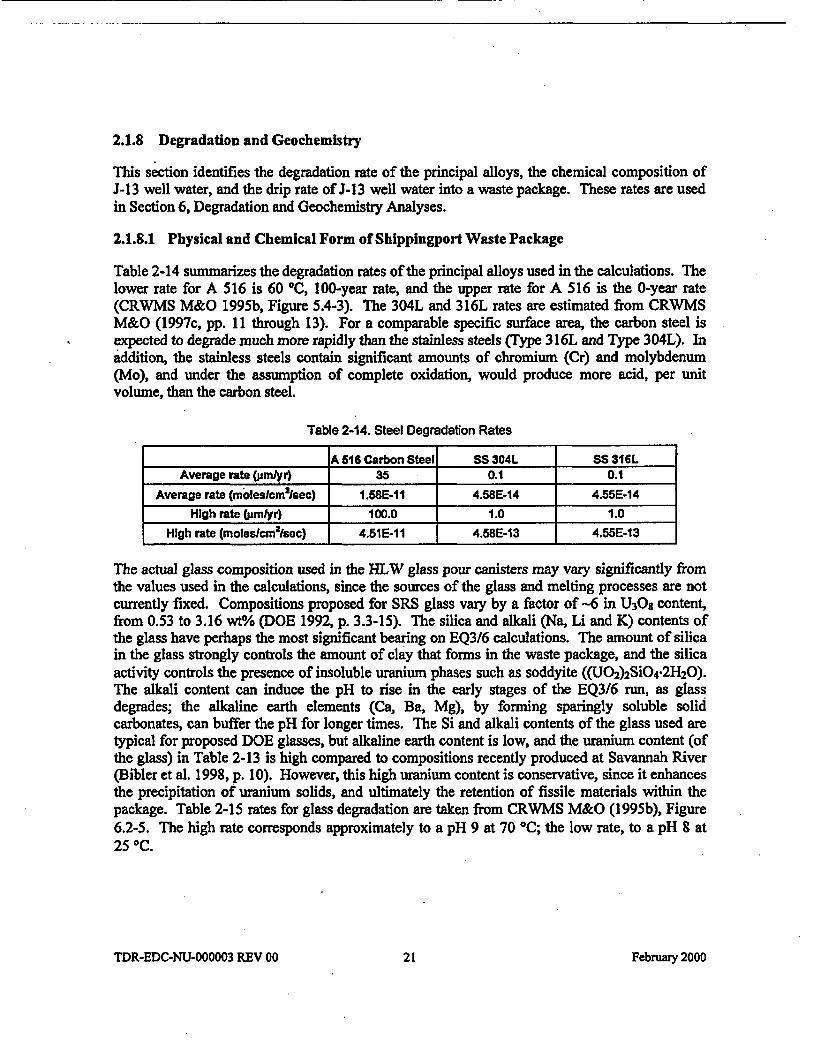
Table 2-14 summarizes the degradation rates of the principal alloys used in the calculations. Thelower rate for A 516 is 60 0C, 100-year rate, and the upper rate for A 516 is the 0-year rate(CRWMS M&O 1995b, Figure 5.4-3). The 304L and 316L rates are estimated from CRWMSM&O (1997c, pp. 11 through 13). For a comparable specific surface area, the carbon steel isexpected to degrade much more rapidly than the stainless steels (Type 316L and Type 304L). Inaddition, the stainless steels contain significant amounts of chromium (Cr) and molybdenum(Mo), and under the assumption of complete oxidation, would produce more acid, per unitvolume, than the carbon steel.
Table 2-14. Steel Degradation Rates
A 516 Carbon Steel SS 304L SS 316L
Average rate (Oamyr) 35 0.1 0.1
Average rate (moleslcm 2lsec) 1.58E-1 I 4.58E-14 4.55E-14
High rate (pmlyr) 100.0 1.0 1.0
High rate (moleslcm2lsec) 4.51E-11 4.58E-13 4.55E-13
The actual glass composition used in the HLW glass pour canisters may vary significantly fromthe values used in the calculations, since the sources of the glass and melting processes are notcurrently fixed. Compositions proposed for SRS glass vary by a factor of -6 in U30s content,from 0.53 to 3.16 wt% (DOE 1992, p. 3.3-15). The silica and alkali (Na, Li and K) contents ofthe glass have perhaps the most significant bearing on EQ3/6 calculations. The amount of silicain the glass strongly controls the amount of clay that forms in the waste package, and the silicaactivity controls the presence of insoluble uranium phases such as soddyite ((U02 )2SiO4-2H 20).The alkali content can induce the pH to rise in the early stages of the EQ316 run, as glassdegrades; the alkaline earth elements (Ca, Ba, Mg), by forming sparingly soluble solidcarbonates, can buffer the pH for longer times. The Si and alkali contents of the glass used aretypical for proposed DOE glasses, but alkaline earth content is low, and the uranium content (ofthe glass) in Table 2-13 is high compared to compositions recently produced at Savannah River(Bibler et al. 1998, p. 10). However, this high uranium content is conservative, since it enhancesthe precipitation of uranium solids, and ultimately the retention of fissile materials within thepackage. Table 2-15 rates for glass degradation are taken from CRWMS M&O (1995b), Figure6.2-5. The high rate corresponds approximately to a pH 9 at 70 'C; the low rate, to a pH 8 at25 0C.
TDR-EDC-NU-000003 REV 00 21 February 2000
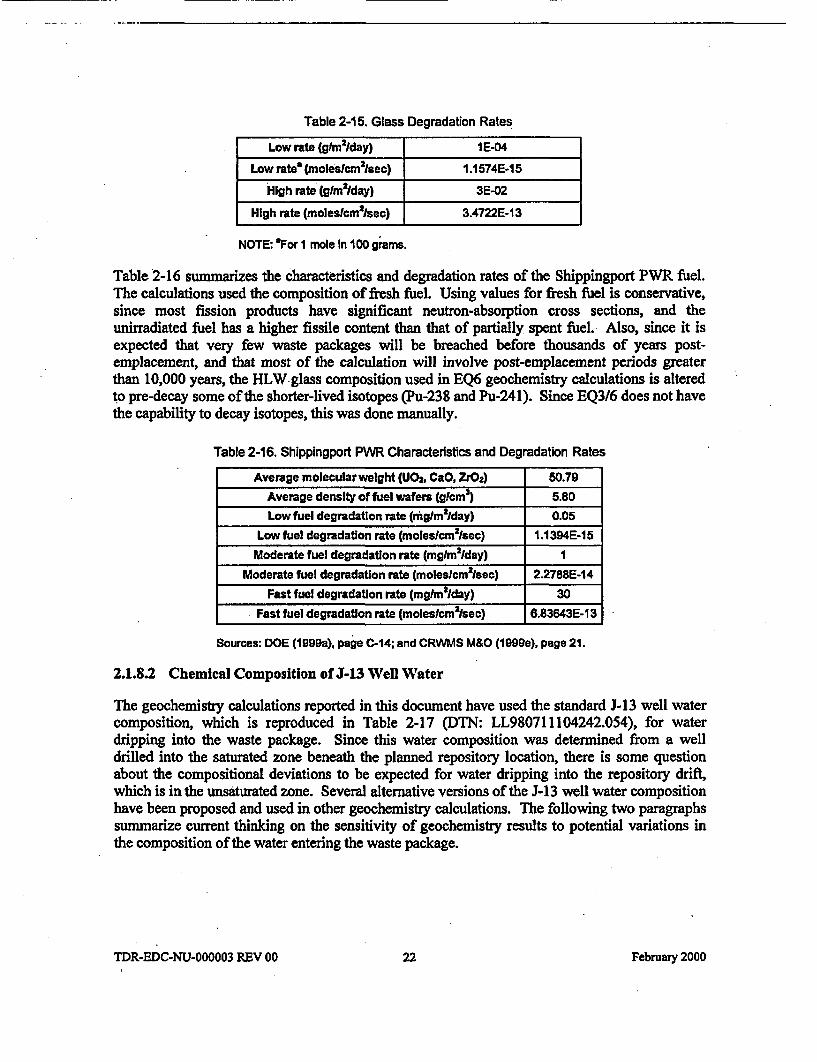
Table 2-15. Glass Degradation Rates
Low rate (glt 2/day) I E-04
Low ratea (moleslcm2lsec) 1.1574E-15
High rate (glm2lday) 3E-02
High rate (moleslcm2lsec) 3.4722E-13
NOTE: 'For I mole In 100 grams.
Table 2-16 summarizes the characteristics and degradation rates of the Shippingport PWR fuel.The calculations used the composition of fresh fuel. Using values for fresh fuel is conservative,since most fission products have significant neutron-absorption cross sections, and theunirradiated fuel has a higher fissile content than that of partially spent fuel. Also, since it isexpected that very few waste packages will be breached before thousands of years post-emplacement, and that most of the calculation will involve post-emplacement periods greaterthan 10,000 years, the HLW-glass composition used in EQ6 geochemistry calculations is alteredto pre-decay some of the shorter-lived isotopes (Pu-238 and Pu-241). Since EQ3/6 does not havethe capability to decay isotopes, this was done manually.
Table 2-16. ShIpplngport PWR Characteristics and Degradation Rates
Average molecular weight (UO&, CaO, ZrO2) 50.79
Average density of fuel wafers (gkm3) 5.80
Low fuel degradation rate (mngIrn2lday) 0.05
Low fuel degradation rate (moleslcm21sec) 1.1394E-15
Moderate fuel degradation rate (mglm 2lday) IModerate fuel degradation rate (moleslcm2lsec) 2.2788E-14
Fast fuel degradation rate (mgmtaiday) 30
Fast fuel degradation rate (moleskcm 2lsec) 6.83643E-13
Sources: DOE (1999a), page C-14; and CRWMS M&O (1999e), page 21.
2.1.8.2 Chemical Composition of J-13 Well Water
The geochemistry calculations reported in this document have used the standard J-13 well watercomposition, which is reproduced in Table 2-17 (DTN: LL980711104242.054), for waterdripping into the waste package. Since this water composition was determined from a welldrilled into the saturated zone beneath the planned repository location, there is some questionabout the compositional deviations to be expected for water dripping into the repository drift,which is in the unsaturated zone. Several alternative versions of the J-13 well water compositionhave been proposed and used in other geochemistry calculations. The following two paragraphssummarize current thinking on the sensitivity of geochemistry results to potential variations inthe composition of the water entering the waste package.
TDR-EDC-NU-000003 REV 00 22 February 2000
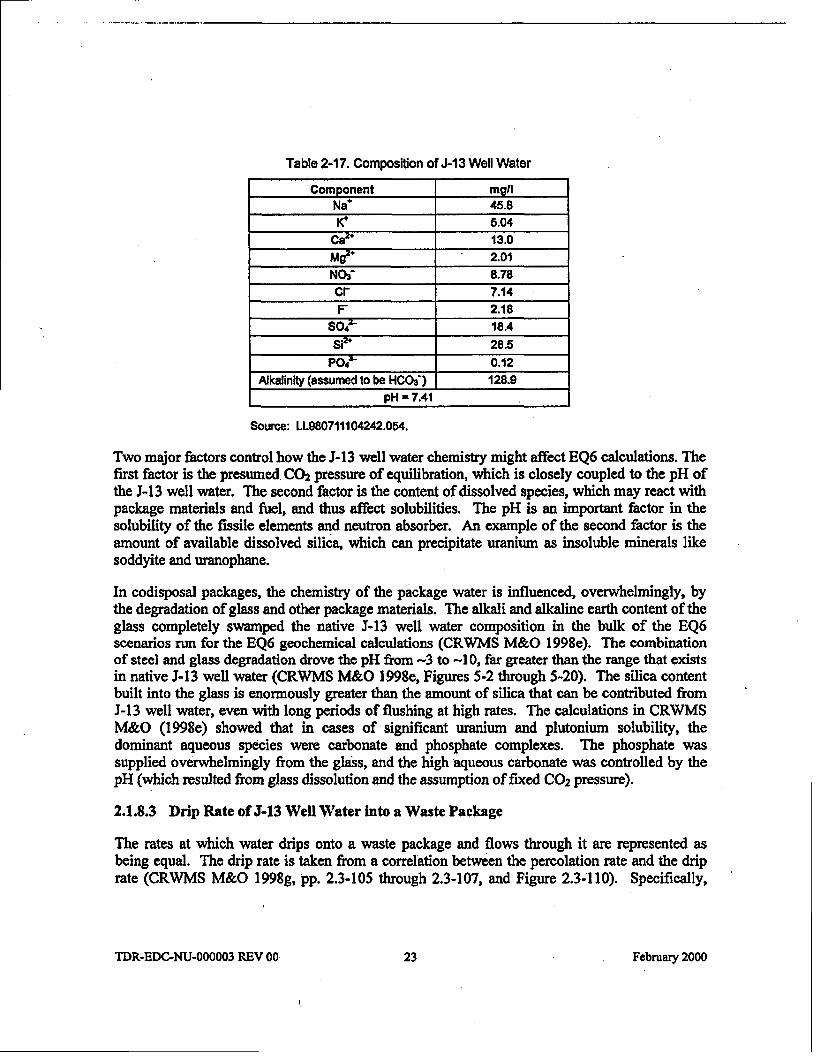
Table 2-17. ComposItion of J-13 Well Water
Component mgl lNa| 45.8K+ 5.04
Cae 13.0mg2+ 2.01NO3 8.78Cl- 7.14F 2.18
S04 18.4S12+ 28.5
PO-T 0.12Alkalinity (assumed to be HCOj ) 128.9
pH a 7.41
Source: LL980711104242.054.
Two major factors control how the J-13 well water chemistry might affect EQ6 calculations. Thefirst factor is the presumed CO2 pressure of equilibration, which is closely coupled to the pH ofthe J-13 well water. The second factor is the content of dissolved species, which may react withpackage materials and fuel, and thus affect solubilities. The pH is an important factor in thesolubility of the fissile elements and neutron absorber. An example of the second factor is theamount of available dissolved silica, which can precipitate uranium as insoluble minerals likesoddyite and uranophane.
In codisposal packages, the chemistry of the package water is influenced, overwhelmingly, bythe degradation of glass and other package materials. The alkali and alkaline earth content of theglass completely swamped the native J-13 well water composition in the bulk of the EQ6scenarios run for the EQ6 geochemical calculations (CRWMS M&O 1998e). The combinationof steel and glass degradation drove the pH from -3 to -10, far greater than the range that existsin native J-13 well water (CRWMS M&O 1998e, Figures 5-2 through 5-20). The silica contentbuilt into the glass is enormously greater than the amount of silica that can be contributed fromJ-13 well water, even with long periods of flushing at high rates. The calculations in CRWMSM&O (1998e) showed that in cases of significant uranium and plutonium solubility, thedominant aqueous species were carbonate and phosphate complexes. The phosphate wassupplied overwhelmingly from the glass, and the high aqueous carbonate was controlled by thepH (which resulted from glass dissolution and the assumption of fixed CO2 pressure).
2.1.8.3 Drip Rate of J-13 Well Water into a Waste Package
The rates at which water drips onto a waste package and flows through it are represented asbeing equal. The drip rate is taken from a correlation between the percolation rate and the driprate (CRWMS M&O 1998g, pp. 2.3-105 through 2.3-107, and Figure 2.3-110). Specifically,
TDR-EDC-NU-000003 REV 00 23 February 2000
percolation rates of 40 mm/yr and 8 mm/yr correlate with drip rates onto the waste package of0.15 m 3/yr and 0.015 m3/yr, respectively.
For the present study, the range of allowed drip rates is extended to include an upper value of 0.5m3/yr and a lower value of 0.0015 m3/yr. The upper value corresponds to the 95 percentile upperlimit for a percolation rate of 40 mm/yr (as determined in CRWMS M&O 1998g, pp. 2.3-105through 2.3-107),, and the lower value is simply 0.1 times the mean value for the present 8 mm/yrpercolation rate. These extreme values are used, because prior studies (CRWMS M&O 1998f,pp. 18 and 19) suggested that when ceramic waste forms are codisposed with glass, the greatestchance of Gd removal occurs when: (1) initial high drip rates cause glass leaching and removalof alkali and (2) subsequent low drip rates allow acid to build up from the degradation of thesteel. Although the waste package with Shippingport PWR fuel does not need any neutronabsorber, these extreme values were conservatively used.
2.2 FUNCTIONS AND DESIGN CRITERIA
The design criteria are based on DOE Spent Nuclear Fuel Disposal Container SystemDescription Document (CRWMS M&O 1998h), which is referred to as the SDD. The SDDnumbers, which follow, are paragraph numbers from that document. In this section, the keywaste package design criteria from the SDD are identified for the following areas: structural,thermal, shielding, intact criticality, degradation and geochemistry, and degraded componentcriticality.
2.2.1 Structural
2.2.1.1 "The disposal container shall retain the capability to be unloaded after the occurrence ofthe events listed in Section 1.2.2.1."
[SDD 1.2.1.17]
2.2.1.2 "The disposal container shall be designed to withstand transfer, emplacement, andretrieval operations without breaching."
[SDD 1.2.1.22]
2.2.1.3 "During the preclosure period, the disposal container, while in a vertical orientation,shall be designed to withstand a drop from a height of 2 m (6.6 ft) (TBV-245) withoutbreaching. (TBV-245)"
[SDD 1.2.2.1.3] [TBV-245]
2.2.1.4 "During the preclosure period, the disposal container, while in a horizontal orientation,shall be designed to withstand a drop from a height of 2.4 m (7.9 ft) (TB V-245) withoutbreaching. (TBV-245)"
[SDD 1.2.2.1.4] [TBV-245]
2.2.1.5 "During the preclosure period, the disposal container shall be designed to withstand atip over from a vertical position with slap down onto a flat, unyielding surface withoutbreaching. (TBV-245)"
[SDD 1.2.2.1.6] [TBV-245]
TDR-EDC-NU-000003 REV 00 24 February 2000
Calculations of maximum potential energy for each handling accident scenario (horizontal drop,vertical drop, and tipover design-basis events [DBEs]) showed that the bounding dynamic load isobtained from a tipover case in which the rotating top end of the waste package experiences thehighest g-load with maximum velocity of 9.5 m/sec (CRWMS M&O 1999b, p. 16). Themaximum velocities of the waste package for 2A. m horizontal and 2.0 m vertical drops are
approximately 6.86 m/sec (v = .gh, where g is the gravitational acceleration, and h is height)and 6.26 ni/sec, respectively. Therefore, tipover structural evaluations are bounding for allhandling accident scenarios considered in the SDD. Section 3.3 addresses these requirements.All other accident scenarios (from CRWMS M&O 1997e) are considered non-credible. Thisanalysis assumes that MGR surface design will prevent events that exceed the boundingassumptions made in deriving the conclusions in this report.
The tipover DBE may only take place during a waste package transfer operation from vertical tohorizontal (Oust after waste package closure) or horizontal to vertical (upon retrieval). Section 3,Structural Analysis, demonstrates that the waste package will not breach under such a handling-accident scenario.
2.2.2 Thermal
2.2.2.1 "The disposal container shall limit the zircaloy and stainless steel cladding temperatureto less than 350, 0C (TBV-241). Temperature of other types of DOE fuel cladding shallbe limited to (TBD-179) OC. Exceptions to these temperature limits are given inSection 1.2.2.1."
(SDD 1.2.1.8] [TBV-241][TBD-1791
2.2.2.3 "The disposal container shall be designed to have a maximum thermal output of 18 kW(1025 BTU/min.) (TBV-251) or less. This criteria identifies the primary disposalcontainer interface with the Ex-Container System."
[SDD 1.2.4.9] [TBV-251]
The criteria are met as described in Sections 4 and 8.2.
2.2.3 Shielding
"Disposal container design shall reduce the dose rate at all external surfaces of a loaded andsealed disposal container to 355 rem/hr (TBV-248) or less. This criteria identifies the primarydisposal container interface with the Waste Emplacement System and the Disposal ContainerHandling System."
[SDD 1.2.4.7] [TBV-248]
The criterion is met as described in Sections 5 and 8.3.
2.2.4 Degradation and Geochemistry
There are no degradation and geochemistry criteria in the SDD to address.
TDR-EDC-NU-000003 REV 00 25 February 2000
2.25 Intact and Degraded Component Criticality
2.2.5.1 "The disposal container provides sufficient criticality control during loading and after itis loaded with waste."
[SDD 1.1.3]
The function is met as described in Sections 7.3, 7.4, 7.5 and 8.5.
2.2.5.2 "During the preclosure period, the disposal container shall be designed such thatnuclear criticality shall not be possible unless at least two unlikely, independent, andconcurrent or sequential changes have occurred in the conditions essential to nuclearcriticality safety. The system must be designed for criticality safety assumingoccurrence of design basis events, including those with the potential for flooding thedisposal container prior to disposal container sealing (IBD-235) or misleadingcanisters (TBD-235). The calculated effective multiplication factor v must besufficiently below unity to show at least a five percent margin, after allowance for thebias in the method of calculation and the uncertainty in the experiments used to validatethe method of calculation."
[SDD 1.2.1.5][TBD-235]
As stated in Section 8.5, the results from the intact criticality analysis show that the requirementof k~ff plus bias and uncertainty less than or equal to 0.95 is satisfied.
2.3 ASSUMPTIONS
In the course of developing this document, assumptions are made regarding the waste packagestructural, thermal, shielding, intact criticality, degradation and geochemistry, and degradedcomponent criticality analyses. The list of the major assumptions that are essential to thistechnical document is provided below.
2.3.1 Structural
The assumptions in this section are used throughout Section 3.
2.3.1.1 The waste package containment barriers are assumed to have solid connections at theadjacent surfaces. The basis for this assumption is that the inner and outer barriers willbe either shrunk fit or the inner barrier will be weld clad onto the outer barrier innersurface (CRWMS M&O 1997a).
2.3.1.2 The target surface is conservatively assumed to be essentially unyielding by using alarge elastic modulus for the target surface compared to the waste package. The basisfor this assumption is that a bounding set of results is required in terms of stresses anddisplacements and it is known that the use of an essentially unyielding surface results inslightly higher stresses in the waste package.
TDR-EDC-NU-000003 REV 00 26 February 2000
2.3.2 Thermal
The assumptions in this section are used throughout Section 4.
2.3.2.1 The volumetric heat generation of the HLW and the Shippingport PWR C2 S2 SNFassembly is assumed constant over the axial and radial cross section of each heat-generating element. The basis of this assumption is the following: heat generation forthe HLW, which is geometrically uniform, does not exhibit any peaking behavior. Heatgenerating elements are dispersed (from vitrification) throughout the glass matrix. Inaddition, the Shippingport PWR C2 S2 SNF assembly has small heat generating fuelwafers distributed in axial and radial arrays. This even distribution of heat generatingelements would negate any thermal peaking effect.
2.3.2.2 Representing only conduction and radiant heat transfer inside the waste package isassumed to provide conservative results (higher temperature) for the calculations. Thebasis for this assumption is the following: fill gas within the waste package will allownatural convective heat transfer to exist. However, since only a few small enclosedbasket cavities exist and the temperature gradient in the enclosure is not significant,circulation of the fill gas is insignificant. Thus, the problem may be represented withonly the dominant heat transfer modes, with a negligible or conservative impact uponthe results.
2.3.2.3 It is assumed that a 2-D finite-element representation of a cross section at the midsectionof the waste package will be the hottest portion of the waste package. Inherent to thisassumption is that axial heat transfer does not significantly affect the solution. The basisfor this assumption is that the metal thermal conductivity and heat generationdistributions are such that axial heat transfer is very small or negligible at themidsection.
2.3.2.4 The surface temperature history of the 5-DHLWJDOE Spent Fuel-Long waste packageis assumed to be equivalent to the 12 PWR average waste package given in CRWMSM&O (1998d) (Scenario 3, WPI). The basis for this assumption is the similarity in thethermal decay heat curves for each waste package type. In addition, CRWMS M&O(1999m) performed a calculation of the Hanford long HLW waste package loaded withFast Flux Test Facility mixed oxide fuel. This calculation was performed with asimulated waste package surface temperature history (calculated from a curve fit) andthe surface temperature history of the 12 PWR average waste package. It was found thatusing the boundary conditions from the 12 PWR average waste package was slightlymore conservative (resulted in slightly higher temperatures).
2.3.3 Shielding
The assumptions in this section are used throughout Section 5.
2.3.3.1 The Shippingport PWR C2 S1 fuel assembly is homogenized inside its transversedimensions. The basis for this assumption is that the calculated surface dose rates willbe conservative, because the homogenization process essentially moves the radiation
TDR-EDC-NU-000003 REV 00 27 February 2000
source closer to the outer surfaces of the fuel assembly, allowing more particles to reachthe outer surface, and decreases the self-shielding of the fuel (CRWMS M&O 1998k, p.23).
2.3.3.2 A power peaking factor of 1.25 is used for the Shippingport PWR fuel source forbounding the axial source distribution. This value is based on the predicted heat profileshown in Creer et al. (1987, p. 3-29, Fig. 3-18). The basis for this is that the sourceterm, provided by a depletion calculation, was uniformly created within the fuel volumeand the axial source profile must be considered in shielding calculations.
2.3.3.3 The Watt fission neutron spectrum (Briesmeister 1997, p. 3-50) is used for theShippingport PWR neutron fuel-source distribution. This option assumes that the mostlikely neutron energy is about 1 MeV. The basis for this is that the resulting biologicalneutron dose is bounding, since the quality factor has the highest value for this energy(Briesmeister 1997, App. H, p. 5).
2.3.3.4 The neutron source intensity is nine and eight orders of magnitude smaller than thegamma source intensity for the Shippingport PWR fuel and HLW, respectively. Nocoupled neutron-photon calculation is performed. The basis for this is that the dose ratedue to secondary gamma rays is negligible.
2.3.4 Degradation and Geochemistry
The assumptions in this section are used throughout Section 6.
2.3.4.1 It is assumed that water may circulate sufficiently freely in the partially degraded wastepackage that all degraded solid products may react with each other through the aqueoussolution medium. The basis for this assumption is that this provides one bound for theextent of chemical interactions within the waste package.
2.3.4.2 It is assumed that the corrosion resistant material (inner barrier) of the waste packagewill react so slowly with the infiltrating water (and water already in the waste package)that it will have a negligible effect on the chemistry. The basis of this assumption is thefact that the corrosion resistant material is fabricated from Alloy 22, which corrodesvery slowly compared (1) to other reactants in the waste package, and (2) to the rate atwhich soluble corrosion products will likely be flushed from the waste package.
2.3.4.3 It is assumed that precipitated solids that are deposited remain in place and are notmechanically eroded or entrained as colloids in the advected water. The basis of thisassumption is that since dissolved fissile material may be adsorbed on colloids (clays,iron oxides) or precipitated as colloids during waste package degradation, it isconservative, for internal criticality, to assume that all precipitated solids, includingmobile colloids, will be deposited inside the waste package rather than transported out ofthe waste package.
2.3.4.4 It is assumed that over times of interest sufficient decay heat is retained within the wastepackage to cause convective circulation and mixing of the water inside the waste
TDR-EDC-NU-000003 REV 00 28 February 2000
package. The analysis that serves as the basis of this assumption is discussed inCRWMS M&O (1996, Attachment VI).
2.3.5 Intact and Degraded Component Criticality
The assumptions in this section are used throughout Section 7.
2.3.5.1 Beginning of life (BOL), pre-irradiation fuel compositions of Shippingport PWR SNFwere used for all calculations. The basis of this assumption is that for ShippingportPWR SNF, it is conservative to assume fresh fuel as it is more neutronically reactivethan spent fuel.
2.3.5.2 Burnable neutron absorber material (boron) in two end plates (referred to as "poisonwafers') of the fuel subassembly were represented as water. The basis of thisassumption is that it is conservative to neglect burnable neutron absorber material sinceit provides some additional amount of neutron absorption.
2.4 BIAS AND UNCERTAINTY IN CRITICALITY CALCULATIONS
The purpose of this section is to document the MCNP (CRWMS M&O 1998i), which isidentified as Computer Software Configuration Item (CSCI) 30033 V4B2LV, evaluations ofLaboratory Critical Experiments (LCEs) performed as part of the Disposal Criticality AnalysisMethodology program. Only LCEs relevant to Shippingport PWR fuel are studied. LCE'sresults listed in this section are given in CRWMS M&O (1999c) for the thermal compound HEUsystems and in CRWMS M&O (1999d) for the thermal solution uranium systems. The objectiveof this analysis is to quantify the MCNP Version 4B2 code system's ability to accuratelycalculate the effective neutron multiplication factor (keff) for various configurations. MCNP isset to use continuous-energy cross sections processed from the evaluated nuclear data filesENDF/B-V (Briesmeister 1997, App. G). These cross section libraries are part of the MCNPcode system that has been obtained from the Software Configuration Management (SCM) inaccordance with appropriate procedures. Each of the critical core configurations is simulated,and the results reported from the MCNP calculations are the combined average values of kfffrom the three estimates (collision, absorption, and track length) and the standard deviation ofthese results (c;) listed in the final generation summary in the MCNP output. When MCNPunderpredicts the experimental kff, the experimental uncertainty is added to the uncertainty at95% confidence from the MCNP calculation to obtain the bias. This bias along with the 5%margin (see Section 2.2.5.2) is used to determine the interim critical limit for all MCNPcalculations of the waste package with Shippingport PWR DOE SNF canister.
2.4.1 Benchmarks Related to Intact Waste Package Configurations
Several critical experiments with highly enriched fuel rods are relevant for the ShippingportPWR fuel with respect to intact criticality analyses: HEU-COMP-THERM-003, HEU-COMP-THERM-005, HEU-COMP-THERM-006, and HEU-COMP-THERM-007 (NEA 1998).
A series of critical experiments with water-moderated hexagonally-pitched lattices of highlyenriched fuel rods of cross-shaped cross section was performed over several years in the Russian
TDR-EDC-NU-000003 REV 00 29 February 2000
Research Center "Kurchatov Institute." The 22 experiments analyzed under this category in thisreport consist of the following:
1. Fifteen critical two-zone lattice experiments corresponding to different combinations ofinner and peripheral zones of cross-shaped fuel rods at two pitches. For detaileddescriptions of these experimental configurations see pages 2, and 7 through 14 of NEA(1998), HEU-COMP-THERM-003 (HCT-003).
2. One critical configuration of hexagonal pitched clusters of lattices of fuel rods withcopper (Cu) rods. Detailed experimental configuration descriptions are available onpages 2 through 8 of NEA (1998), HEU-COMP-THERM-005 (HCT-005).
3. Three critical configurations with uniform hexagonal lattices with pitch values of 5.6,10.0, and 21.13 mm. Detailed experimental configuration descriptions are available onpages 2, 5, and 6 of NEA (1998), HEU-COMP-THERM-006 (HCT-006).
4. Three critical configurations with double hexagonal lattices of fuel rods and zirconium(Zr) hydride rods. Detailed experimental configuration descriptions are available onpages 2 through 8 of NEA (1998), HEU-COMP-THERM-007 (HCT-007).
The pitch, number of rods, and number of fuel rods were the parameters that were varied. Themaximum bias for this set of calculations is 0.019 (CRWMS M&O 1999c, pp. 16 through 19,and 76).
2.4.2 Benchmarks Related to Degraded Waste Package Configurations
Critical experiments with HEU (approximately 90 wte/o) nitrate solution are described in detail inNEA (1998) (HEU-SOL-THERM-001, HEU-SOL-THERM-002, HEU-SOL-THERM-003).The concentration of fissile element in the solution, enrichment, reflector type and thickness,tank diameter, and solution height were among the parameters that were varied. The maximumbias for this set of experiments is 0.016 (CRWMS M&O 1997d, pp. 26 through 32; CRWMSM&O 1999d, pp. 14 through 18).
2.4.3 Critical Limit
The worst-case bias, calculated from the MCNP simulations of the experiments described inSections 2.4.1 and 2.4.2, is 0.02. This bias includes the bias in the method of calculation and theuncertainty in the experiments. Based on this bias, the interim critical limit is determined to be0.93 after a 5 percent margin; allowance for the bias in the method of calculation, and theuncertainty in the experiments used to validate the method of calculation. This interim criticallimit will be used until the addenda to the topical report is prepared to establish the final criticallimit.
TDR-EDC-NU-000003 REV 00 30 Febmary 2000 -
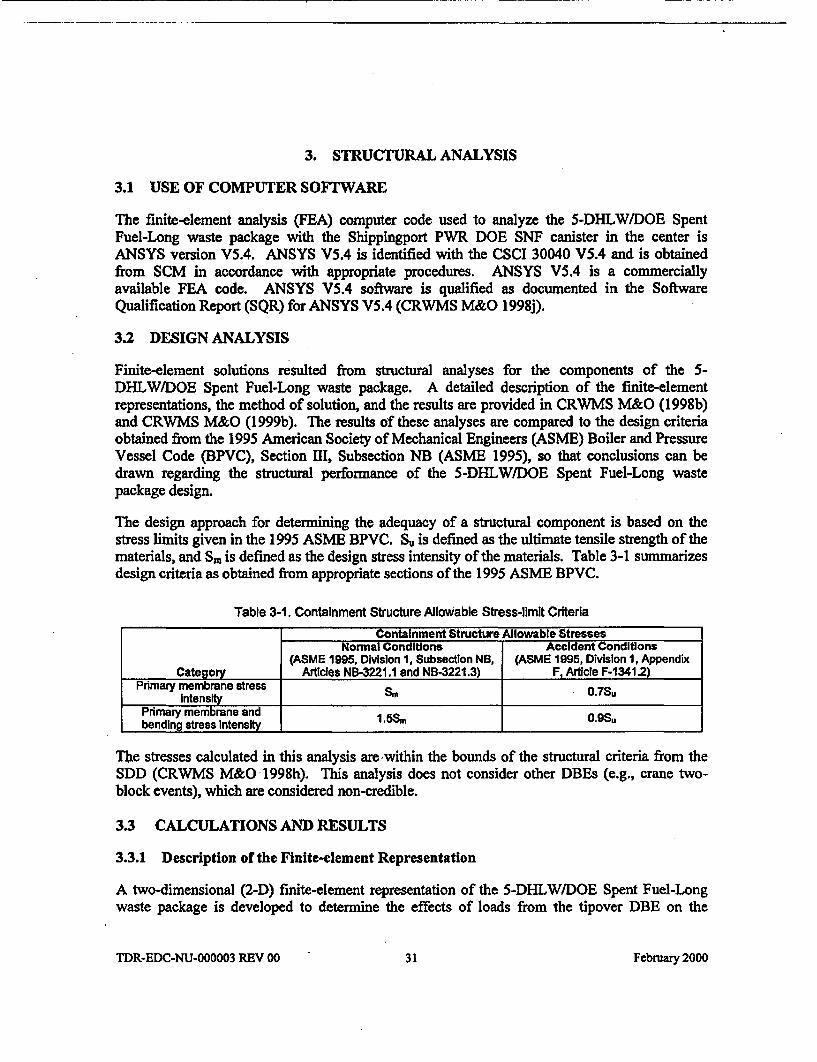
3. STRUCTURAL ANALYSIS
3.1 USE OF COMPUTER SOFTWARE
The finite-element analysis (FEA) computer code used to analyze the 5-DHLWIDOE SpentFuel-Long waste package with the Shippingport PWR DOE SNF canister in the center isANSYS version V5.4. ANSYS V5.4 is identified with the CSCI 30040 V5.4 and is obtainedfrom SCM in accordance with appropriate procedures. ANSYS V5.4 is a commerciallyavailable FEA code. ANSYS V5.4 software is qualified as documented in the SoftwareQualification Report (SQR) for ANSYS V5.4 (CRWMS M&O 1998j).
3.2 DESIGN ANALYSIS
Finite-element solutions resulted from structural analyses for the components of the 5-DHLWIDOE Spent Fuel-Long waste package. A detailed description of the finite-elementrepresentations, the method of solution, and the results are provided in CRWMS M&O (I 998b)and CRWMS M&O (1 999b). The results of these analyses are compared to the design criteriaobtained from the 1995 American Society of Mechanical Engineers (ASME) Boiler and PressureVessel Code (BPVC), Section III, Subsection NB (ASME 1995), so that conclusions can bedrawn regarding the structural performance of the 5-DHLW/DOE Spent Fuel-Long wastepackage design.
The design approach for determining the adequacy of a structural component is based on thestress limits given in the 1995 ASME BPVC. % is defined as the ultimate tensile strength of thematerials, and Sm is defined as the design stress intensity of the materials. Table 3-1 summarizesdesign criteria as obtained from appropriate sections of the 1995 ASME BPVC.
Table 3-1. Containment Structure Allowable Stress-limit Criteria
Containment Structure Allowable StressesNormal Conditions Accident Conditions
(ASME 1995, Division 1, Subsection NB, (ASME 1995, Division 1, AppendixCategory Articles NB-3221.1 and N13-3221.3) F, Article F-1341.2)
Primary membrane stress Sm 0.7S%intensity __ _ _ _ _ _ _ __ _
Primary membrane andbending stress Intensity I.5Sm O.9Su
The stresses calculated in this analysis are within the bounds of the structural criteria from theSDD (CRWMS M&O 1998h). This analysis does not consider other DBEs (e.g., crane two-block events), which are considered non-credible.
3.3 CALCULATIONS AND RESULTS
3.3.1 Description of the Finite-element Representation
A two-dimensional (2-D) finite-element representation of the 5-DHLW/DOE Spent Fuel-Longwaste package is developed to determine the effects of loads from the tipover DBE on the
TDR-EDC-NU-000003 REV 00 31 February 2000
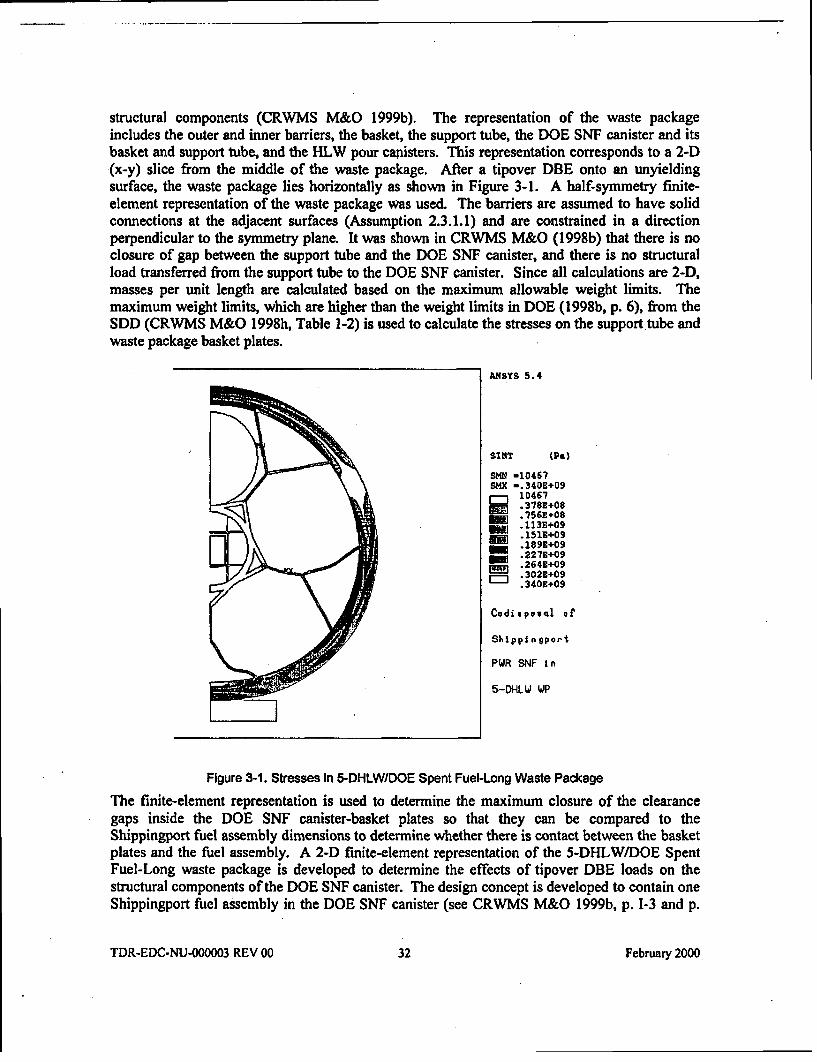
structural components (CRWMS M&O 1999b). The representation of the waste packageincludes the outer and inner barriers, the basket, the support tube, the DOE SNF canister and itsbasket and support tube, and the HLW pour canisters. This representation corresponds to a 2-D)(x-y) slice from the middle of the waste package. After a tipover DBE onto an unyieldingsurface, the waste package lies horizontally as shown in Figure 3-1. A half-symmetry finite-element representation of the waste package was used. The barriers are assumed to have solidconnections at the adjacent surfaces (Assumption 2.3.1.1) and are constrained in a directionperpendicular to the symmetry plane. It was shown in CRWMS M&O (1998b) that there is noclosure of gap between the support tube and the DOE SNF canister, and there is no structuralload transferred from the support tube to the DOE SNF canister. Since all calculations are 2-D,masses per unit length are calculated based on the maximum allowable weight limits. Themaximum weight limits, which are higher than the weight limits in DOE (1998b, p. 6), from theSDD (CRWMS M&O 1998h, Table 1-2) is used to calculate the stresses on the support tube andwaste package basket plates.
ANSYS 5.4
/ .)SINT (PK)
SMN -10467644X -. 340E+09
10467.378E+08.156E+08.113E+09.151E+09
_ l \ _~~~~~~~~~~~1 .19E+09
.264E+09I~J.302E+09
.340E+09
Codispoal ofr
Shitppi gport
PWR SNF in
5-DHLW WP
Figure 3-1. Stresses In 5-DHLWIDOE Spent Fuel-Long Waste Package
The finite-element representation is used to determine the maximum closure of the clearancegaps inside the DOE SNF canister-basket plates so that they can be compared to theShippingport fuel assembly dimensions to determine whether there is contact between the basketplates and the fuel assembly. A 2-D finite-element representation of the 5-DHLW/DOE SpentFuel-Long waste package is developed to determine the effects of tipover DBE loads on thestructural components of the DOE SNF canister. The design concept is developed to contain oneShippingport fuel assembly in the DOE SNF canister (see CRWMS M&O 1999b, p. I-3 and p.
TDR-EDC-NU-000003 REV 00 32 February 2000
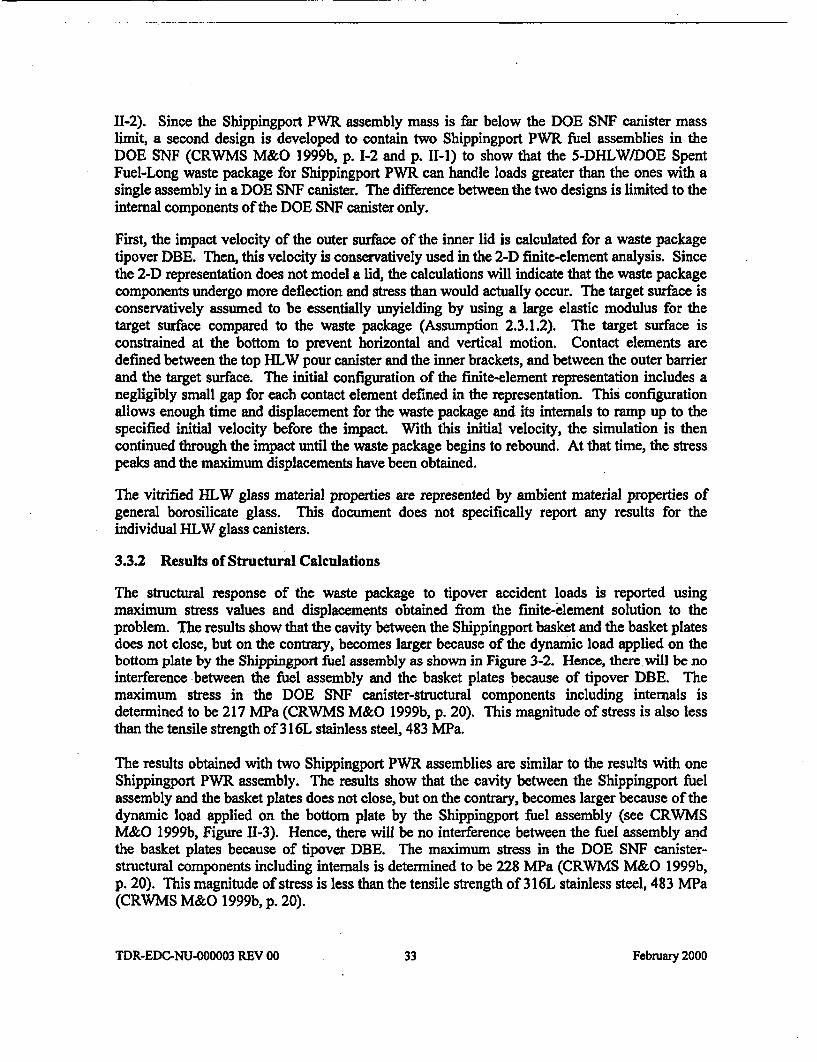
II-2). Since the Shippingport PWR assembly mass is far below the DOE SNF canister masslimit, a second design is developed to contain two Shippingport PWR fuel assemblies in theDOE SNF (CRWMS M&O 1999b, p. 1-2 and p. II-I) to show that the 5-DHLWIDOE SpentFuel-Long waste package for Shippingport PWR can handle loads greater than the ones with asingle assembly in a DOE SNF canister. The difference between the two designs is limited to theinternal components of the DOE SNF canister only.
First, the impact velocity of the outer surface of the inner lid is calculated for a waste packagetipover DBE. Then, this velocity is conservatively used in the 2-D finite-element analysis. Sincethe 2-D representation does not model a lid, the calculations will indicate that the waste packagecomponents undergo more deflection and stress than would actually occur. The target surface isconservatively assumed to be essentially unyielding by using a large elastic modulus for thetarget surface compared to the waste package (Assumption 2.3.1.2). The target surface isconstrained at the bottom to prevent horizontal and vertical motion. Contact elements aredefined between the top HLW pour canister and the inner brackets, and between the outer barrierand the target surface. The initial configuration of the finite-element representation includes anegligibly small gap for each contact element defined in the representation. This configurationallows enough time and displacement for the waste package and its internals to ramp up to thespecified initial velocity before the impact. With this initial velocity, the simulation is thencontinued through the impact until the waste package begins to rebound. At that time, the stresspeaks and the maximum displacements have been obtained.
The vitrified HLW glass material properties are represented by ambient material properties ofgeneral borosilicate glass. This document does not specifically report any results for theindividual HLW glass canisters.
3.3.2 Results of Structural Calculations
The structural response of the waste package to tipover accident loads is reported usingmaximum stress values and displacements obtained from the finite-element solution to theproblem. The results show that the cavity between the Shippingport basket and the basket platesdoes not close, but on the contrary, becomes larger because of the dynamic load applied on thebottom plate by the Shippingport fuel assembly as shown in Figure 3-2. Hence, there will be nointerference between the fuel assembly and the basket plates because of tipover DBE. Themaximum stress in the DOE SNF canister-structural components including internals isdetermined to be 217 MPa (CRWMS M&O 1999b, p. 20). This magnitude of stress is also lessthan the tensile strength of 316L stainless steel, 483 MPa.
The results obtained with two Shippingport PWR assemblies are similar to the results with oneShippingport PWR assembly. The results show that the cavity between the Shippingport fuelassembly and the basket plates does not close, but on the contrary, becomes larger because of thedynamic load applied on the bottom plate by the Shippingport fuel assembly (see CRWMSM&O 1999b, Figure II-3). Hence, there will be no interference between the fuel assembly andthe basket plates because of tipover DBE. The maximum stress in the DOE SNF canister-structural components including internals is determined to be 228 MPa (CRWMS M&O 1999b,p. 20). This magnitude of stress is less than the tensile strength of 316L stainless steel, 483 MPa(CRWMS M&O 1999b, p. 20).
TDR-EDC-NU-000003 REV 00 33 February 2000
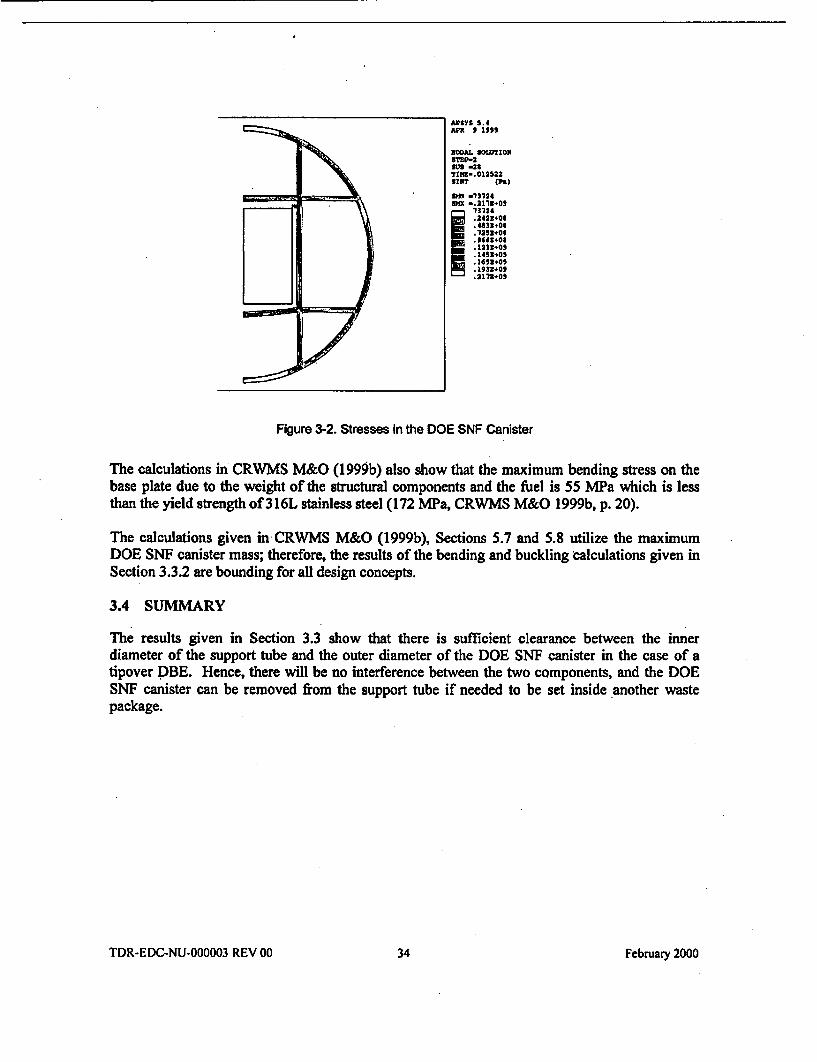
APSYS S54APSRs 1599
NODAL SOLUTIONBTRP-2SUB .237Ile- 012522SINWT aPd
_____________ 13fl~~~g .13724583 -.2113.05E 73124
.2423.00* 4832+08.725X.00.966Z.08
X 12t1.09.1453.05* 1693.09* 1933+01* 2173.09
Figure 3-2. Stresses In the DOE SNF Canister
The calculations in CRWMS M&O (1990b) also show that the maximum bending stress on thebase plate due to the weight of the structural components and the fuel is 55 MWa which is lessthan the yield strength of 316L stainless steel (172 MWa, CRWMS M&O 1999b, p. 20).
The calculations given in-CRWMIS M&O (1999b), Sections 5.7 and 5.8 utilize the maximumDOE SNF canister mass; therefore, the results of the bending and buckling calculations given inSection 3.3.2 are bounding for all design concepts.
3.4 SUMMARY
The results given in Section 3.3 show that there is sufficient clearance between the innerdiameter of the support tube and the outer diameter of the DOE SNF canister in the case of atipover DBE. Hence, there will be no interference between the two components, and the DOESNF canister can be removed from the support tube if needed to be set inside another wastepackage.
TDR-EDC-NU-000003 REV 00 34 February 2000
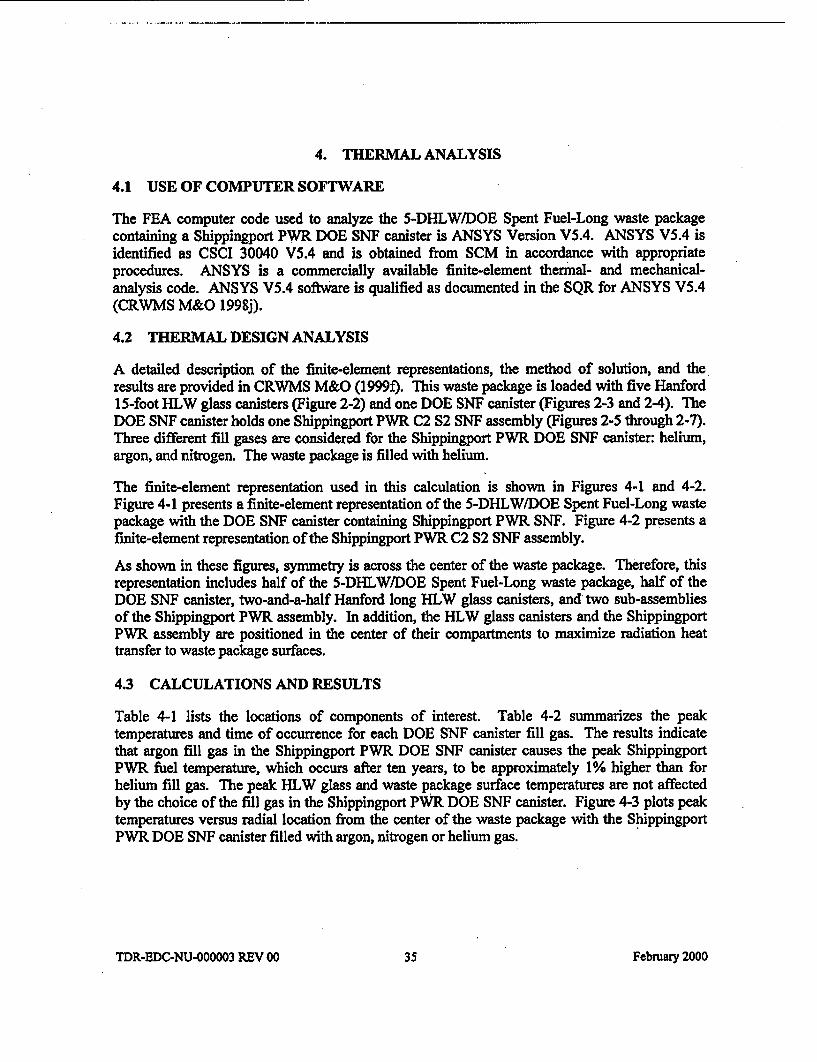
4. THERMAL ANALYSIS
4.1 USE OF COMPUTER SOFTWARE
The FEA computer code used to analyze the 5-DHLW/DOE Spent Fuel-Long waste packagecontaining a Shippingport PWR DOE SNF canister is ANSYS Version V5.4. ANSYS V5.4 isidentified as CSCI 30040 V5.4 and is obtained from SCM in accordance with appropriateprocedures. ANSYS is a commercially available finite-element thermal- and mechanical-analysis code. ANSYS V5.4 softw~are is qualified as documented in the SQR for ANSYS V5.4(CRWMS M&O 1998j).
4.2 THERMAL DESIGN ANALYSIS
A detailed description of the finite-element representations, the method of solution, and the.results are provided in CRWMS M&O (1999f). This waste package is loaded with five Hanford15-foot HLW glass canisters (Figure 2-2) and one DOE SNF canister (Figures 2-3 and 2-4). TheDOE SNF canister holds one Shippingport PWR C2 S2 SNF assembly (Figures 2-5 through 2-7).Three different fill gases are considered for the Shippingport PWR DOE SNF canister: helium,argon, and nitrogen. The waste package is filled with helium.
The finite-element representation used in this calculation is shown in Figures 4-1 and 4-2.Figure 4-1 presents a finite-element representation of the 5-DHLW/DOE Spent Fuel-Long wastepackage with the DOE SNF canister containing Shippingport PWR SNF. Figure 4-2 presents afinite-element representation of the Shippingport PWR C2 S2 SNF assembly.
As shown in these figures, symmetry is across the center of the waste package. Therefore, thisrepresentation includes half of the 5-DHLWIDOE Spent Fuel-Long waste package, half of theDOE SNF canister, two-and-a-half Hanford long HLW glass canisters, and two sub-assembliesof the Shippingport PWR assembly. In addition, the HLW glass canisters and the ShippingportPWR assembly are positioned in the center of their compartments to maximize radiation heattransfer to waste package surfaces.
4.3 CALCULATIONS AND RESULTS
Table 4-1 lists the locations of components of interest. Table 4-2 summarizes the peaktemperatures and time of occurrence for each DOE SNF canister fill gas. The results indicatethat argon fill gas in the Shippingport PWR DOE SNF canister causes the peak ShippingportPWR fuel temperature, which occurs after ten years, to be approximately 1% higher than forhelium fill gas. The peak HLW glass and waste package surface temperatures are not affectedby the choice of the fill gas in the Shippingport PWR DOE SNF canister. Figure 4-3 plots peaktemperatures versus radial location from the center of the waste package with the ShippingportPWR DOE SNF canister filled with argon, nitrogen or helium gas.
TDR-EDC-NU-000003 REV 00 35 February 2000
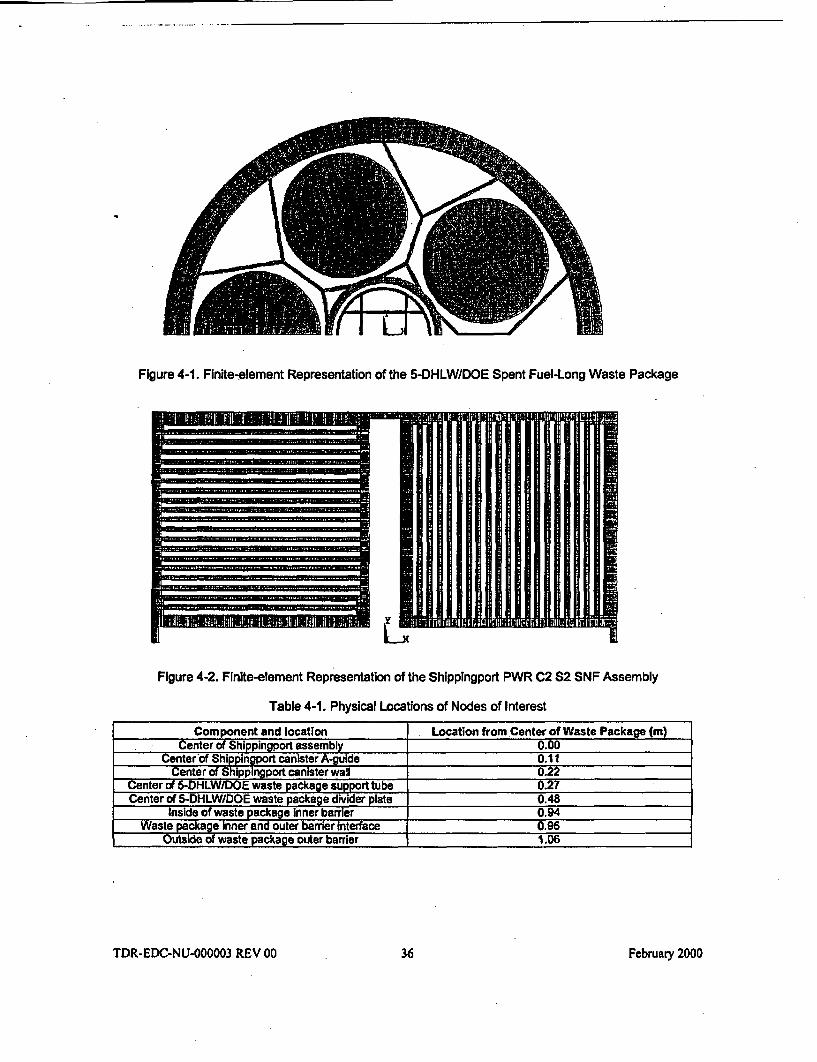
1,411 11 Li
Figure 4-1. Finite-element Representation of the 5-DHLW/DOE Spent Fuel-Long Waste Package
Figure 4-2. Finite-element Representation of the Shippingport PWR C2 S2 SNF Assembly
Table 4-1. Physical Locations of Nodes of Interest
Component and location Location from Center of Waste Package (m)Center of Shippingport assembly 0.00
Center of Shippingport canister A-guide 0.11Center of Shippingport canister wall 0.22
Center of 5-DHLW/DOE waste package support tube 0.27Center of 5-DHLW/DOE waste package divider pate 0.48
Inside of waste package Inner barrier 0.94Waste package Inner and outer barrier Interface 0.96
Outside of waste package outer barrier 1.06
TDR-EDC-NU-000003 REV 00 36 February 2000
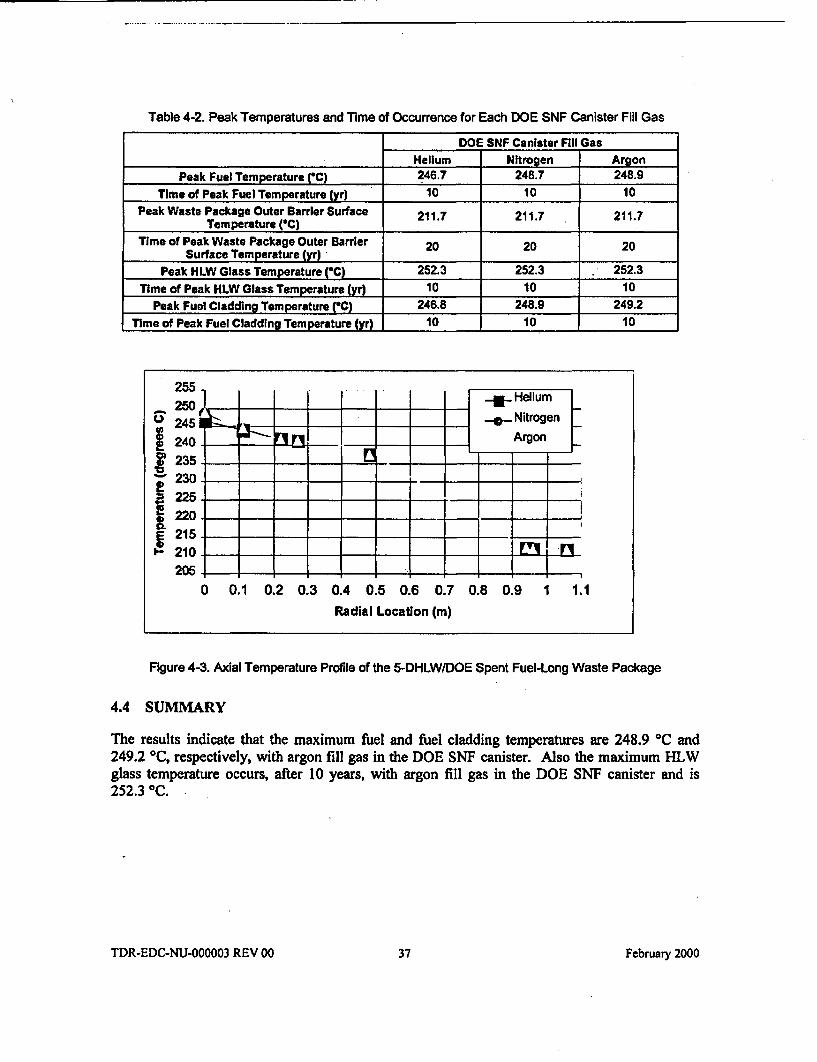
-- ------
Table 4-2. Peak Temperatures and Time of Occurrence for Each DOE SNF Canister Fill Gas
DOE SNF Canister Fill GasHelium Nitrogen Argon
Peak Fuel Temperature (C) 246.7 248.7 248.9Time of Peak Fuel Temperature lyr) 10 10 10
Peak Waste Package Outer Barrier Surface 211.7 211.7 211.7Temperature (TC) _11.7 2 11.7-
Time of Peak Waste Package Outer Barrier 20 20 20Surface Temperature (yr) _
Peak HLW Glass Temperature (IC) 252.3 252.3 : 252.3Time of Peak HLW Glass Temperature (yr) 10 10 10
Peak Fuel Cladding Temperature ('C) 246.8 248.9 249.2Time of Peak Fuel Cladding Temperature (yr) 10 10 10
Figure 4-3. Axial Temperature Profile of the 5-DHLWIDOE Spent Fuel-Long Waste Package
4.4 SUMMARY
The results indicate that the maximum fuel and fuel cladding temperatures are 248.9 'C and249.2 IC, respectively, with argon fill gas in the DOE SNF canister. Also the maximum HLWglass temperature occurs, after 10 years, with argon fill gas in the DOE SNF canister and is252.3 "C.
TDR-EDC-NU-000003 REV 00 37 February 2000
INTENTIONALLY LEFT BLANK
TDR-EDC-NU-000003 REV 00 38 February 2000
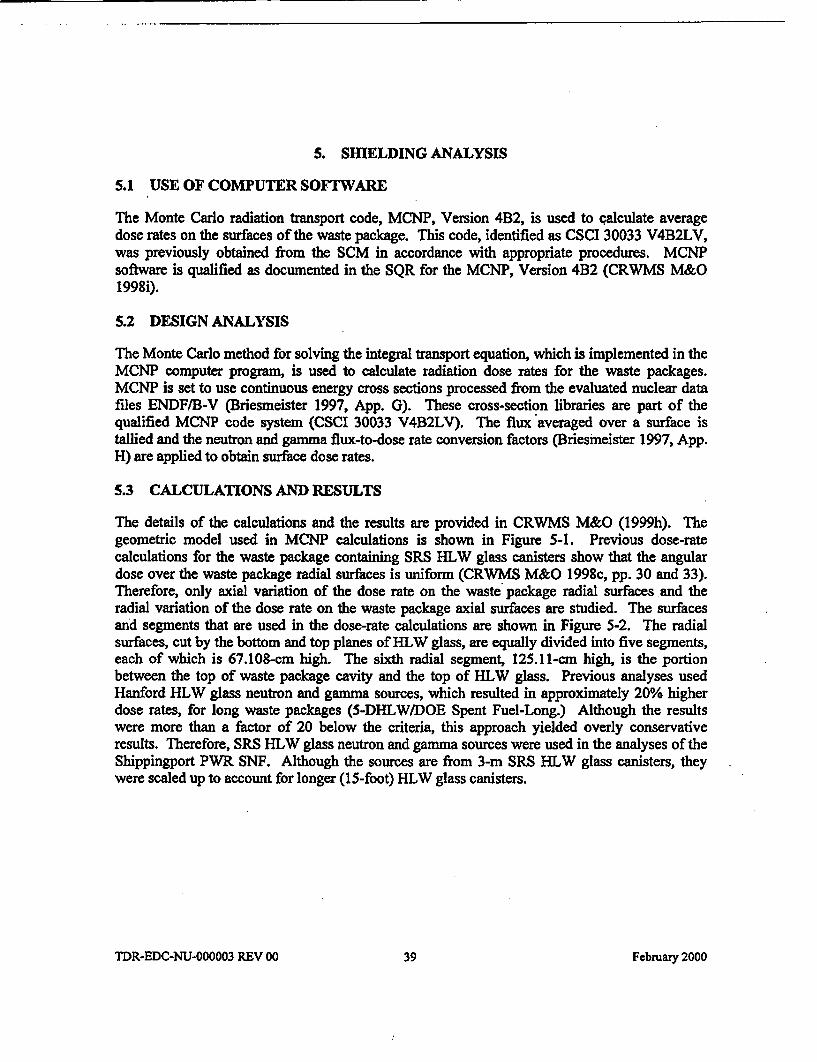
.1 ......
5. SHIELDING ANALYSIS
5.1 USE OF COMPUTER SOFTWARE
The Monte Carlo radiation transport code, MCNP, Version 4B2, is used to calculate averagedose rates on the surfaces of the waste package. This code, identified as CSCI 30033 V4B2LV,was previously obtained from the SCM in accordance with appropriate procedures. MCNPsoftware is qualified as documented in the SQR for the MCNP, Version 4B2 (CRWMS M&O1998i).
5.2 DESIGN ANALYSIS
The Monte Carlo method for solving the integral transport equation, which is implemented in theMCNP computer program, is used to calculate radiation dose rates for the waste packages.MCNP is set to use continuous energy cross sections processed from the evaluated nuclear datafiles ENDFIB-V (Briesmeister 1997, App. G). These cross-section libraries are part of thequalified MCNP code system (CSCI 30033 V4B2LV). The flux averaged over a surface istallied and the neutron and gamma flux-to-dose rate conversion factors (Briesmeister 1997, App.H) are applied to obtain surface dose rates.
5.3 CALCULATIONS AND RESULTS
The details of the calculations and the results are provided in CRWMS M&O (1999h). Thegeometric model used in MCNP calculations is shown in Figure 5-1. Previous dose-ratecalculations for the waste package containing SRS HLW glass canisters show that the angulardose over the waste package radial surfaces is uniform (CRWMS M&O 1998c, pp. 30 and 33).Therefore, only axial variation of the dose rate on the waste package radial surfaces and theradial variation of the dose rate on the waste package axial surfaces are studied. The surfacesand segments that are used in the dose-rate calculations are shown in Figure 5-2. The radialsurfaces, cut by the bottom and top planes of HLW glass, are equally divided into five segments,each of which is 67.108-cm high. The sixth radial segment, 125.11-cm high, is the portionbetween the top of waste package cavity and the top of HLW glass. Previous analyses usedHanford HLW glass neutron and gamma sources, which resulted in approximately 20% higherdose rates, for long waste packages (5-DHLW/DOE Spent Fuel-Long.) Although the resultswere more than a factor of 20 below the criteria, this approach yielded overly conservativeresults. Therefore, SRS HLW glass neutron and gamma sources were used in the analyses of theShippingport PWR SNF. Although the sources are from 3-m SRS HLW glass canisters, theywere scaled up to account for longer (15-foot) HLW glass canisters.
TDR-EDC-NU-000003 REV 00 39 February 2000
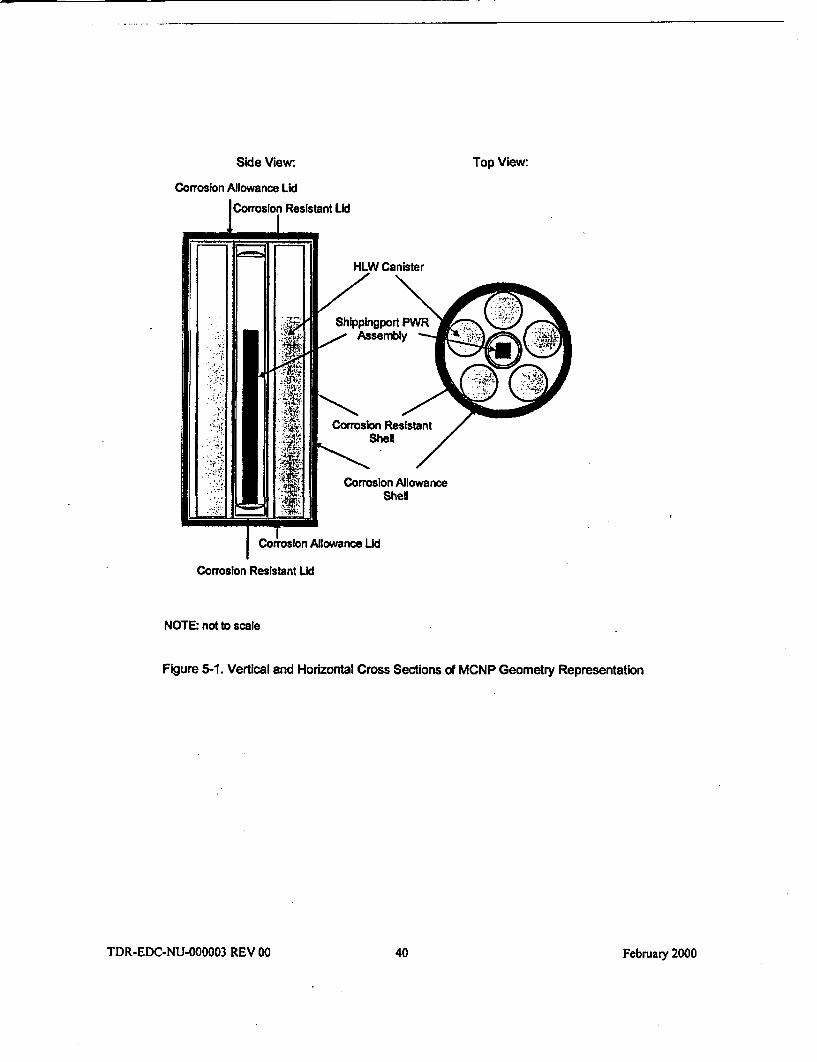
Side View.
Corrosion Allowance Lid
Top View:
Corrosion Resistant Lid
NOTE: not to scale
Figure 5-1. Vertical and Horizontal Cross Sections of MCNP Geometry Representation
TDR-EDC-NU-000003 REV 00 40 February 2000
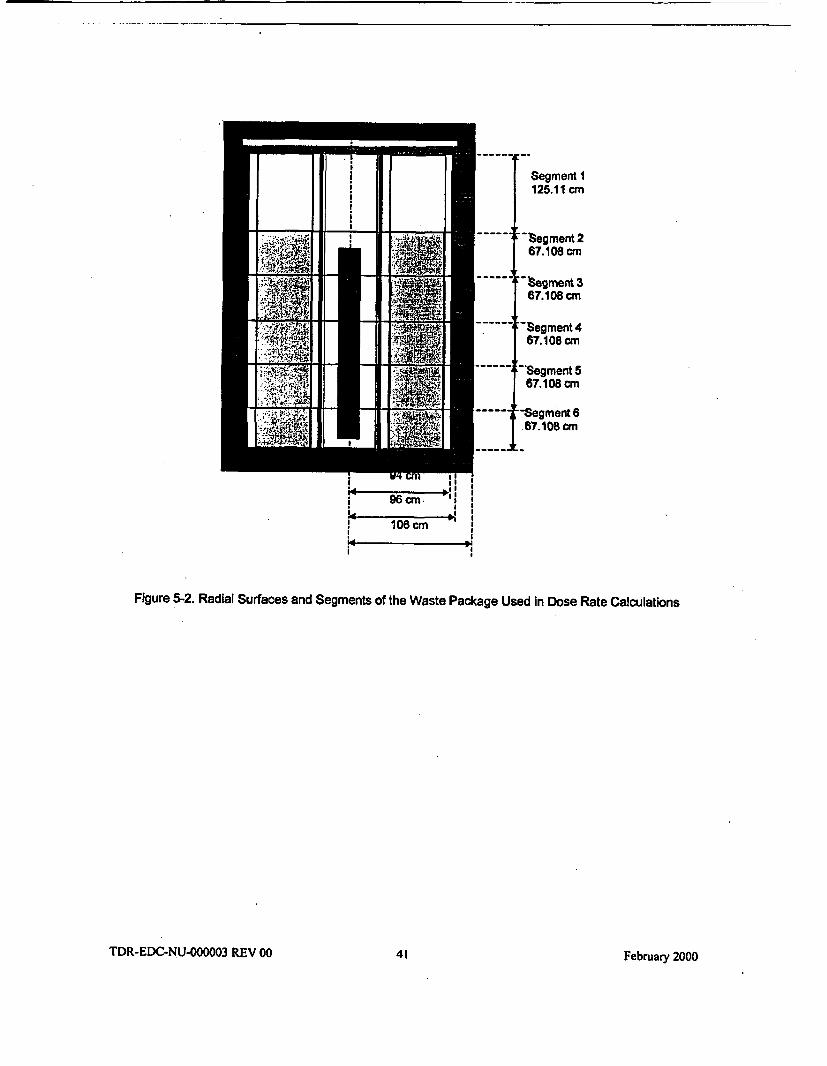
Segment 1125.11 cm
X -Segment 2
67.108 cmgg X~~~~-egment 4
67.1 08 cm-- Segment4567.108 cm
Figure RdaSraeanSegment e67.108 cm
gr6cm.
* 106 cm
Figure 5-2. Radial Surfaces and Segments of the Waste Package Used in Dose Rate Calculations
TDR-EDC-NU-000003 REV 00 41 February 2000
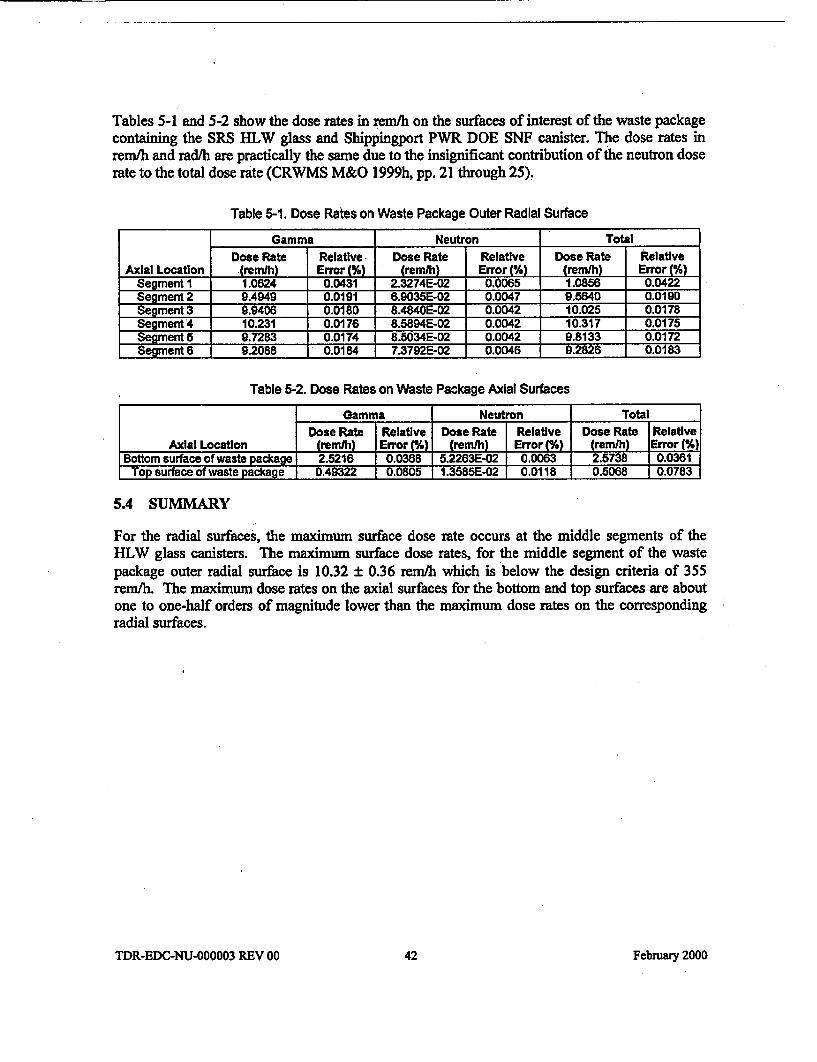
Tables 5-1 and 5-2 show the dose rates in rern/h on the surfaces of interest of the waste packagecontaining the SRS HLW glass and Shippingport PWR DOE SNF canister. The dose rates inrem/h and rad/h are practically the same due to the insignificant contribution of the neutron doserate to the total dose rate (CRWMS M&O 1999h, pp. 21 through 25).
Table 5-1. Dose Rates on Waste Package Outer Radial Surface
Gamma Neutron TotalDose Rate Relative Dose Rate Relative Dose Rate Relative
Axial Location (remth) Error (%) (remlh) Error (%) (remlh) Error (%)Segment 1 1.0624 0.0431 2.3274E-02 0.0065 1.0856 0.0422Segment 2 9.4949 0.0191 6.9035E-02 0.0047 9.5640 0.0190Segment 3 9.9406 0.0180 8.4840E-02 0.0042 10.025 0.0178Segment 4 10.231 0.0176 8.5894E-02 0.0042 10.317 0.01 75Segment 5 9.7283 0.0174 8.5034E-02 0.0042 9.8133 0.0172Segment 6 9.2088 0.0184 7.3792E-02 0.0046 9.2826 0.0183
Table 5-2. Dose Rates on Waste Package Axial Surfaces
Gamma Neutron TotalDose Rate Relative Dose Rate Relative Dose Rate Relative
Axial Location (remlh) Error M) (remlh) Error (%) (remlh) Error (%)Bottom surface of waste package 2.5216 0.0388 5.2263E-02 0.0063 2.5738 0.0361
Top surface of waste package 0.49322 0.0805 1.3585E-02 0.0118 0.5068 0.0783
5.4 SUMMARY
For the radial surfaces, the maximum surface dose rate occurs at the middle segments of theHLW glass canisters. The maximum surface dose rates, for the middle segment of the wastepackage outer radial surface is 10.32 ± 0.36 rem/h which is below the design criteria of 355rem/h. The maximum dose rates on the axial surfaces for the bottom and top surfaces are aboutone to one-half orders of magnitude lower than the maximum dose rates on the correspondingradial surfaces.
TDR-EDC-NU-000003 REV 00 42 February 2000
6. DEGRADATION AND GEOCHEMISTRY ANALYSES
6.1 USE OF COMPUTER SOFTWARE
The EQ3/6 software package identified as CSCI UCRL-MA-1 10662 V 7.2b, SCR: LSCRl98. Itwas obtained from the SCM in accordance with appropriate procedures. The major componentsof the EQ3/6 package include the following: EQ3NR, a speciation-solubility code; EQ316, areaction path code that calculates water/rock interaction or fluid mixing in either a pure reactionprogress mode or a time mode; EQPT, a data-file preprocessor; EQLIB, a supporting softwarelibrary; and several supporting thermodynamic data files. The software implements algorithmsdescribing thermodynamic equilibrium, thermodynamic disequilibrium and reaction kinetics.The supporting data files contain both standard-state and activity-coefficient-related data.
EQ3/6 calculates the irreversible reactions that occur between an aqueous solution and a set ofsolid, liquid, or gaseous reactants. The code can calculate fluid mixing and the consequences ofchanges in temperature. This code operates both in a pure reaction progress frame as well as in atime frame.
In this study, EQ3/6 is used to provide:
* A general overview of the nature of chemical reactions to be expected.
* The degradation products likely to result from corrosion of the TRIGA SNF andcanisters.
* An indication of the minerals, and their amounts, likely to precipitate within thewaste package.
The EQ316 calculations reported in this document used version 7.2b of the code, which isappropriate for the application, and were executed on Pentium series personal computer (PCs).The EQ3/6 package has been verified by its present custodian, Lawrence Livermore NationalLaboratory. The source codes were obtained from SCM in accordance with the OCRWMprocedure AP-SI.lQ. The code was installed on Pentium PCs according to an M&O-approvalInstallation and Test procedure (CRWMS M&O 1998m). The EQ316 version 7.2b is qualified asdocumented in the SQR for EQ3/6 V7.2b (CRWMS M&O 1998m). EQ3/6 V7.2b is alsoreferred to as EQ6.
6.2 DESIGN ANALYSIS
6.2.1 Systematic Investigation of Degradation Scenarios and Configurations
Degradation scenarios comprise a combination of features, events, and processes that result indegraded configurations to be evaluated for criticality. A configuration is defined by a set ofparameters characterizing the amount and physical arrangement, at a specific location, of thematerials that can significantly affect criticality (e.g., fissile materials, neutron-absorbing
TDR-EDC-NU-000003 REV 00 43 February 2000
materials, reflecting materials, and moderators). The variety of possible configurations is bestunderstood by grouping them into classes. A configuration class is a set of similarconfigurations whose composition and geometry is defined by specific parameters thatdistinguish one class from another. Within a configuration class the values of configurationparameters may vary over a given range.
A master scenario list and set of configuration classes relating to internal criticality is given inthe Disposal Criticality Analysis Methodology Topical Report (CRWMS M&O 1998a, pp. 3-2through 3-12) and also shown in Figures 6-1 and 6-2. This list was developed by a process thatinvolved workshops and peer review. The comprehensive evaluation of disposal criticality forany waste form must include variations of the standard scenarios and configurations to ensurethat no credible degradation scenario is neglected. All of the scenarios that can lead to criticalitybegin with the breaching of the waste package, followed by entry of the water, which eventuallyleads to degradation of the SNF and/or other internal components of the waste package. Thisdegradation may permit neutron absorber material to be mobilized (made soluble) and either beflushed out of the waste package or displaced from the fissile material, thereby increasing theprobability of criticality.
The standard scenarios for internal criticality divide into two groups:
1. When the waste package is breached only on the top, water flowing into the wastepackage builds up a pond. This pond provides water for moderation to support acriticality. Further, after a few hundred years of steady dripping, the water can overflowthrough the hole on the top of the waste package and flush out any dissolved degradationproducts.
2. When the waste package breach occurs on the bottom as well as the top, the water flowsthrough the waste package. This group of scenarios allows the soluble degradationproducts to be removed more quickly, but does not directly provide water for moderation.Criticality is possible, however, if the waste package fills with corrosion products thatcan add water of hydration and/or plug any holes in the bottom of the waste package.The waste package supports this latter behavior because the silica released by thedegrading HLW glass may form clay with enough water of hydration to supportcriticality.
The standard scenarios for the first group are designated IP- 1, -2, and -3 (IP stands for internal tothe package) according to whether the waste form degrades before the other waste packageinternal components, at approximately the same time (but not necessarily at the same rate), orlater than the waste package internal components. The standard scenarios for the second groupare designated IP-4, -5, or -6 based on the same criteria. The internal criticality configurationsresulting from these scenarios fall into six configuration classes described below (CRWMSM&O 1998a, pp. 3-10 through 3-12):
1. Basket is degraded but waste form is relatively intact and sits on the bottom of the wastepackage (or the DOE SNF canister), surrounded by, and/or beneath, the basket corrosionproducts (see Figure 6-3). This configuration class is reached from scenario IP-3.
TDR-EDC-NU-000003 REV 00 44 February 2000
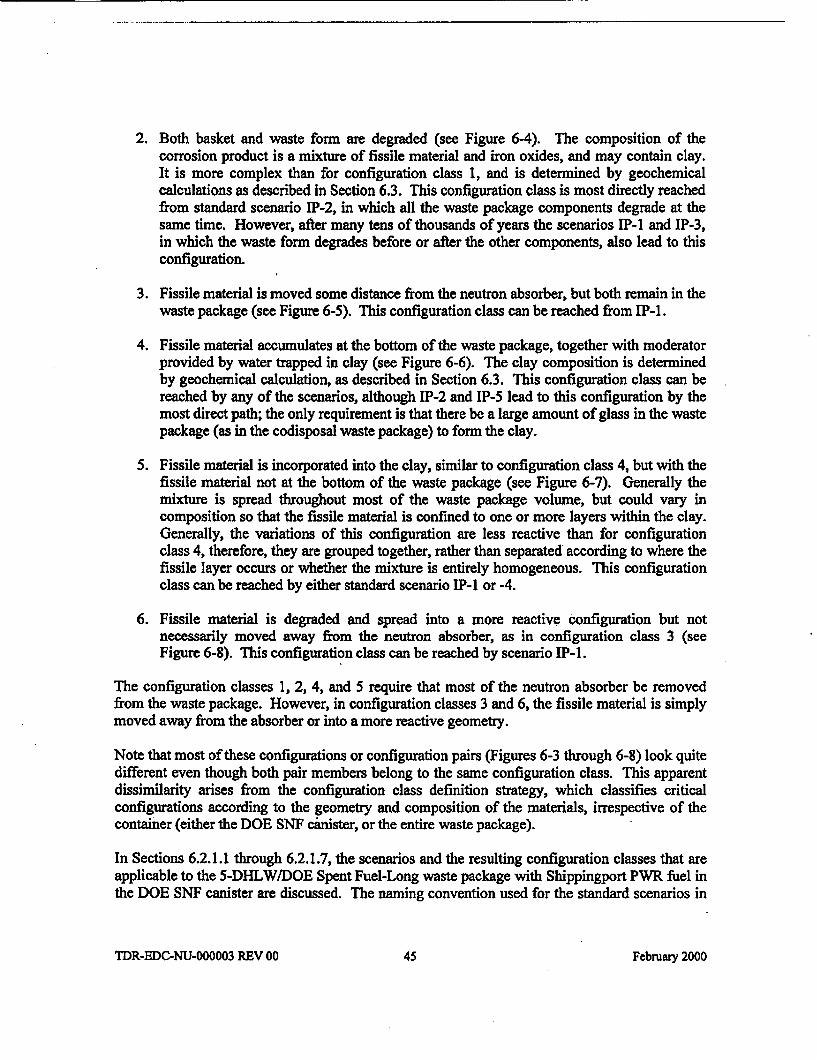
2. Both basket and waste form are degraded (see Figure 6-4). The composition of thecorrosion product is a mixture of fissile material and iron oxides, and may contain clay.It is more complex than for configuration class 1, and is determined by geochemicalcalculations as described in Section 6.3. This configuration class is most directly reachedfrom standard scenario IP-2, in which all the waste package components degrade at thesame time. However, after many tens of thousands of years the scenarios IP-1 and IP-3,in which the waste form degrades before or after the other components, also lead to thisconfiguration.
3. Fissile material is moved some distance from the neutron absorber, but both remain in thewaste package (see Figure 6-5). This configuration class can be reached from IP-1.
4. Fissile material accumulates at the bottom of the waste package, together with moderatorprovided by water trapped in clay (see Figure 6-6). The clay composition is determinedby geochemical calculation, as described in Section 6.3. This configuration class can bereached by any of the scenarios, although IP-2 and IP-5 lead to this configuration by themost direct path; the only requirement is that there be a large amount of glass in the wastepackage (as in the codisposal waste package) to form the clay.
5. Fissile material is incorporated into the clay, similar to configuration class 4, but with thefissile material not at the bottom of the waste package (see Figure 6-7). Generally themixture is spread throughout most of the waste package volume, but could vary incomposition so that the fissile material is confined to one or more layers within the clay.Generally, the variations of this configuration are less reactive than for configurationclass 4, therefore, they are grouped together, rather than separated according to where thefissile layer occurs or whether the mixture is entirely homogeneous. This configurationclass can be reached by either standard scenario IP-N or -4.
6. Fissile material is degraded and spread into a more reactive configuration but notnecessarily moved away from the neutron absorber, as in configuration class 3 (seeFigure 6-8). This configuration class can be reached by scenario IP-1.
The configuration classes 1, 2, 4, and 5 require that most of the neutron absorber be removedfrom the waste package. However, in configuration classes 3 and 6, the fissile material is simplymoved away from the absorber or into a more reactive geometry.
Note that most of these configurations or configuration pairs (Figures 6-3 through 6-8) look quitedifferent even though both pair members belong to the same configuration class. This apparentdissimilarity arises from the configuration class definition strategy, which classifies criticalconfigurations according to the geometry and composition of the materials, irrespective of thecontainer (either the DOE SNF canister, or the entire waste package).
In Sections 6.2.1.1 through 6.2.1.7, the scenarios and the resulting configuration classes that areapplicable to the 5-DHLWJDOE Spent Fuel-Long waste package with Shippingport PWR fuel inthe DOE SNF canister are discussed. The naming convention used for the standard scenarios in
TDR-EDC-NU-000003 REV 00 45 Februmry 2000
Sections 6.2.1.1 through 6.2.1.7 is slightly different from the convention used in the topicalreport (CRWMS M&O 1998a), which can be seen in Figures 6-1 and 6-2. The namingconvention used in these sections is based on CRWMS M&O (1999k), which containsrefinements to the configurations described in the topical report
TDR-EDC-NU-000003 REV 00 46 February 2000
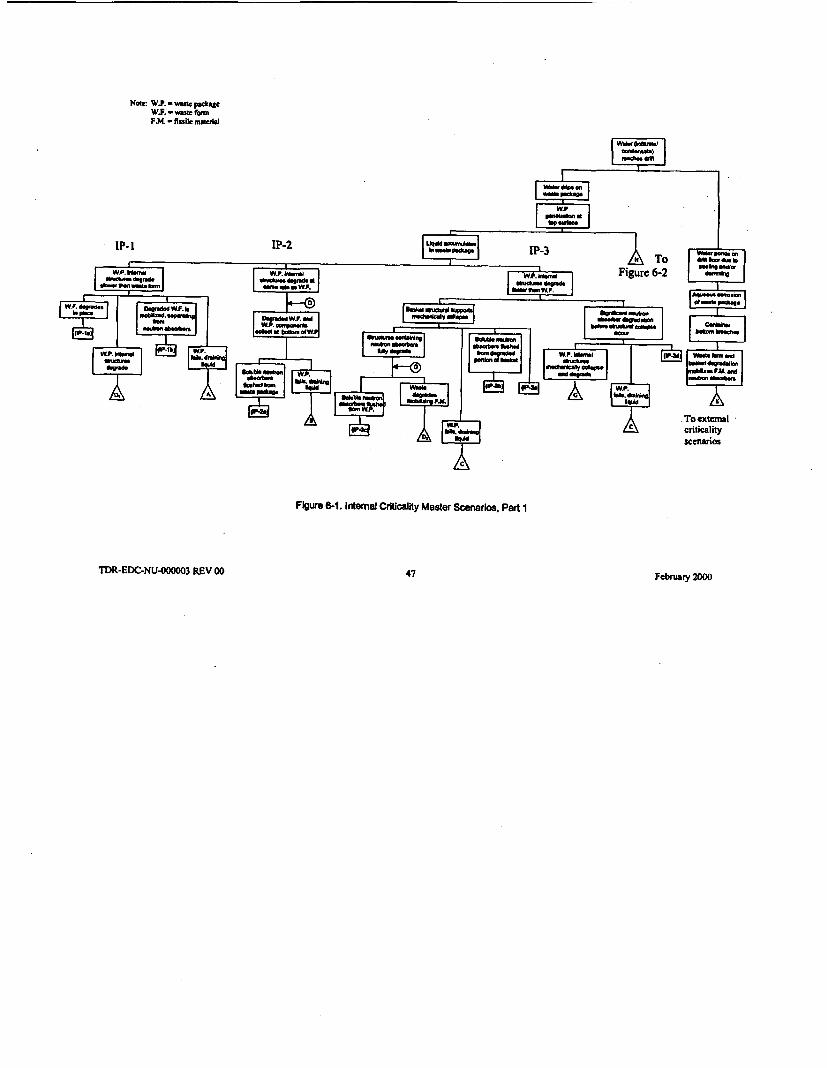
Nowe W.P. -wase packageW.F. - wale foremF.M. fitlle matuai
Ip.1 IP.2
To externalcriticalityscenarios
Figure 6-1. Internal Criticality Master Scenarios, Part 1
TDR-EDC-NUJ-000D03 REV 00 447 February 2000
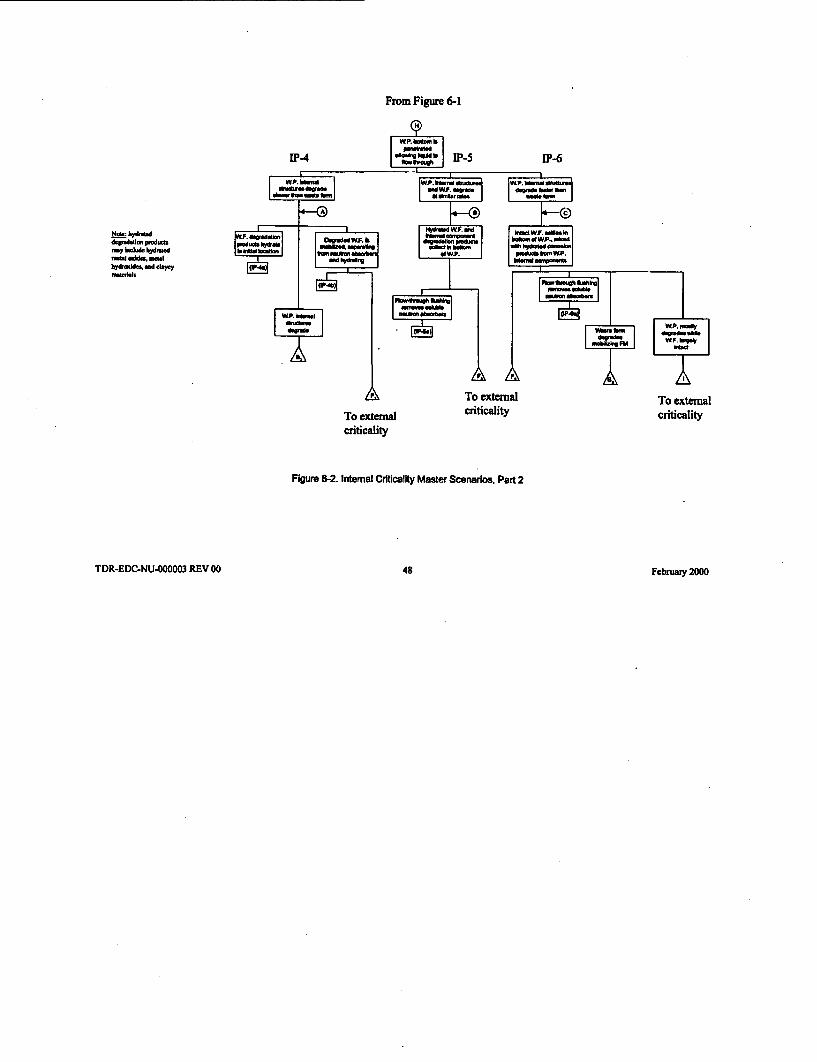
From Figure 6-1
dsgndid pYd*Uc Wm 1 we..
owiS f1 ti imehydr-MM F CU CUM~h
.WkIWy hh gmhydU .1i
X i ~~~To externalTo external criticalitycriticality
Figure 6-2. Internal Cditcality Master Scene rims, Part 2
To externalcriticality
TDR-EDC-NU-000003 REV 00 48 Febiua" 2000
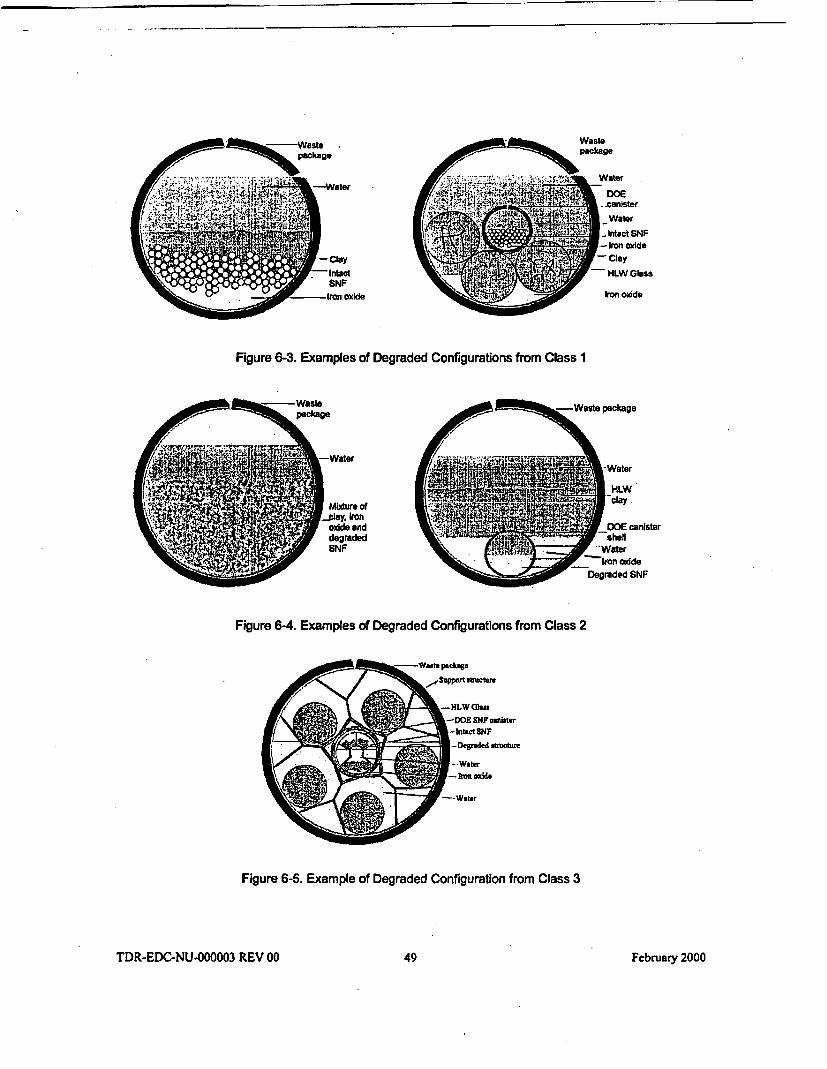
Ir o' lIon oxide N EL
Figure 6-3. Examples of Degraded Configurations from Class 1
Figure _4. waster oa
oxide and
Figure 6-4. Examples of Degraded Configurations from Class 2
canister
Figure 6-5. Example of Degraded Configuration from Class 3
TDR-EDC-NU-000003 REV 00 49 February 2000
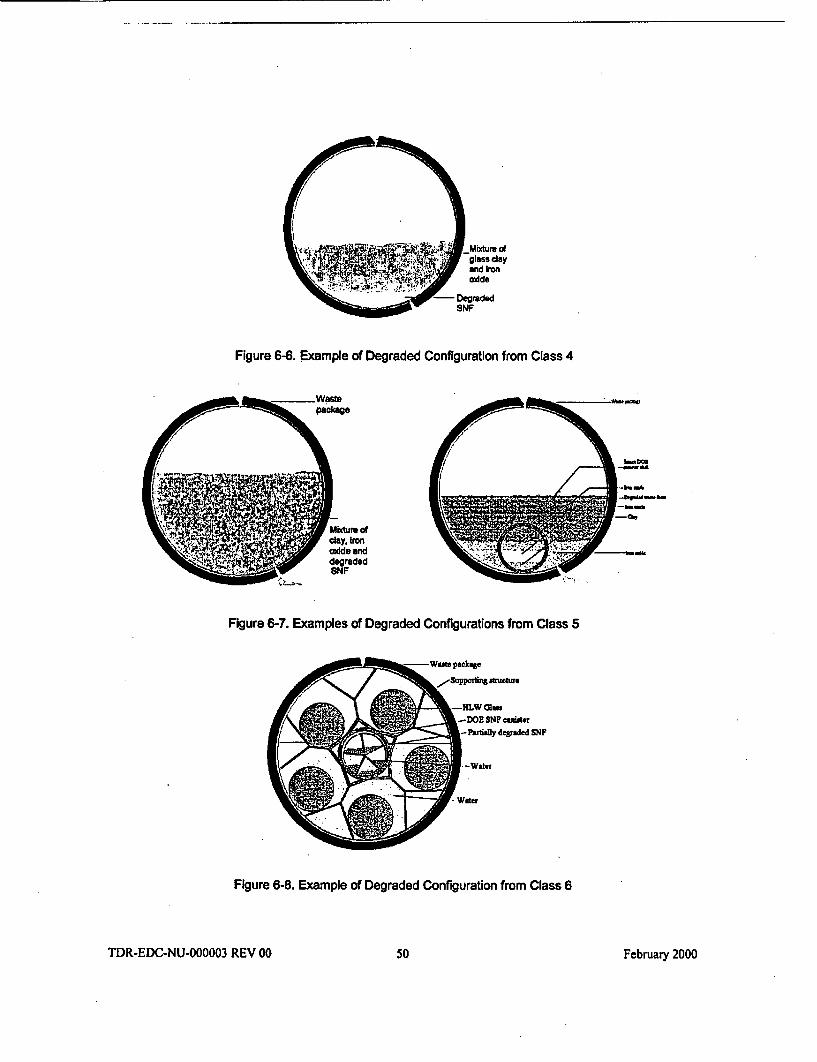
DegradedSNF
Figure 6-6. Example of Degraded Configuration from Class 4
___ Wase r __ 'A ~~~~package _
Mure of
~J" ¶j~ cocide anddegradedSNF
Figure 6-7. Examples of Degraded Configurations from Class 5
-DOE SN? cSante-eParrAy degtaded SNF
Figure6-8.Exam le oferadeConguranrom la-Wssr
Figure 6-8. Example of Degraded Configuration from Class 6
TDR-EDC-NU-000003 REV 00 50 February 2000
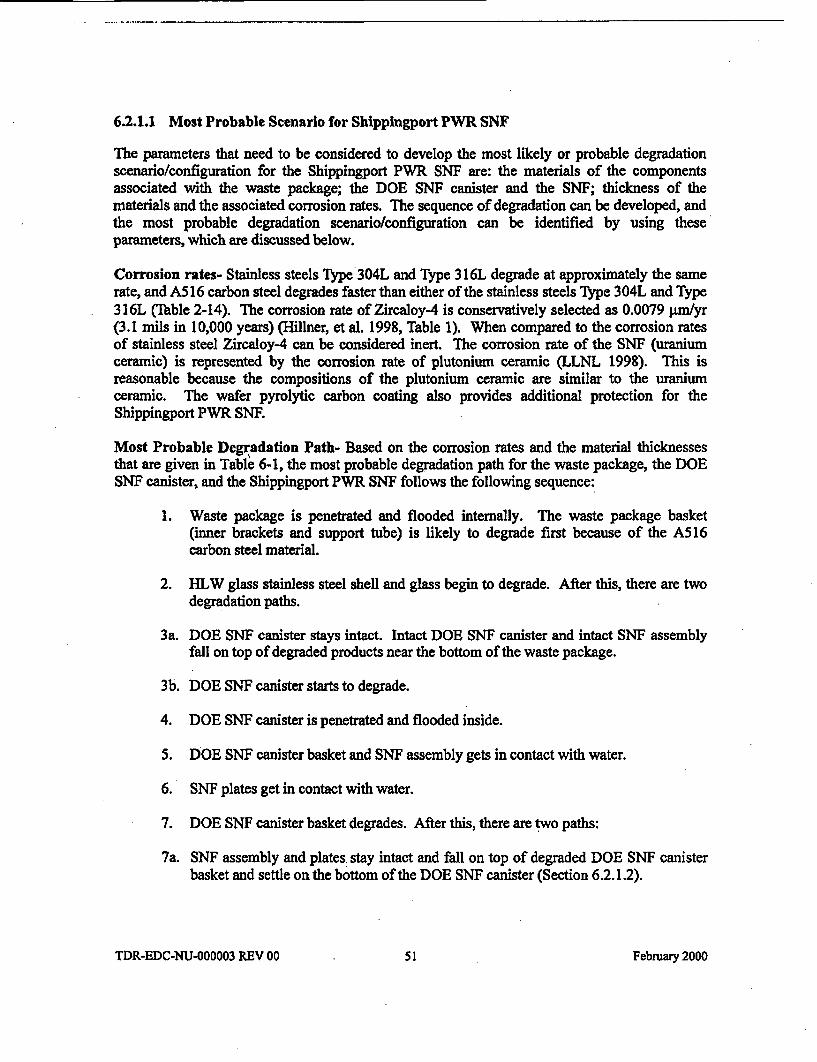
6.2.1.1 Most Probable Scenario for Shippingport PWR SNF
The parameters that need to be considered to develop the most likely or probable degradationscenario/configuration for the Shippingport PWR SNF are: the materials of the componentsassociated with the waste package; the DOE SNF canister and the SNF; thickness of thematerials and the associated corrosion rates. The sequence of degradation can be developed, andthe most probable degradation scenario/configuration can be identified by using theseparameters, which are discussed below.
Corrosion rates- Stainless steels Type 304L and Type 316L degrade at approximately the samerate, and A516 carbon steel degrades faster than either of the stainless steels Type 304L and Type316L (Table 2-14). The corrosion rate of Zircaloy-4 is conservatively selected as 0.0079 pm/yr(3.1 mils in 10,000 years) (Hillner, et al. 1998, Table 1). When compared to the corrosion ratesof stainless steel Zircaloy-4 can be considered inert. The corrosion rate of the SNF (uraniumceramic) is represented by the corrosion rate of plutonium ceramic (LLNL 1998). This isreasonable because the compositions of the plutonium ceramic are similar to the uraniumceramic. The wafer pyrolytic carbon coating also provides additional protection for theShippingport PWR SNF.
Most Probable Degradation Path- Based on the corrosion rates and the material thicknessesthat are given in Table 6-1, the most probable degradation path for the waste package, the DOESNF canister, and the Shippingport PWR SNF follows the following sequence:
1. Waste package is penetrated and flooded internally. The waste package basket(inner brackets and support tube) is likely to degrade first because of the A516carbon steel material.
2. HLW glass stainless steel shell and glass begin to degrade. After this, there are twodegradation paths.
3a. DOE SNF canister stays intact. Intact DOE SNF canister and intact SNF assemblyfall on top of degraded products near the bottom of the waste package.
3b. DOE SNF canister starts to degrade.
4. DOE SNF canister is penetrated and flooded inside.
5. DOE SNF canister basket and SNF assembly gets in contact with water.
6. SNF plates get in contact with water.
7. DOE SNF canister basket degrades. After this, there are two paths:
7a. SNF assembly and plates, stay intact and fall on top of degraded DOE SNF canisterbasket and settle on the bottom of the DOE SNF canister (Section 6.2.1.2).
TDR-EDC-NU.000003 REV 00 5l Februay 2000
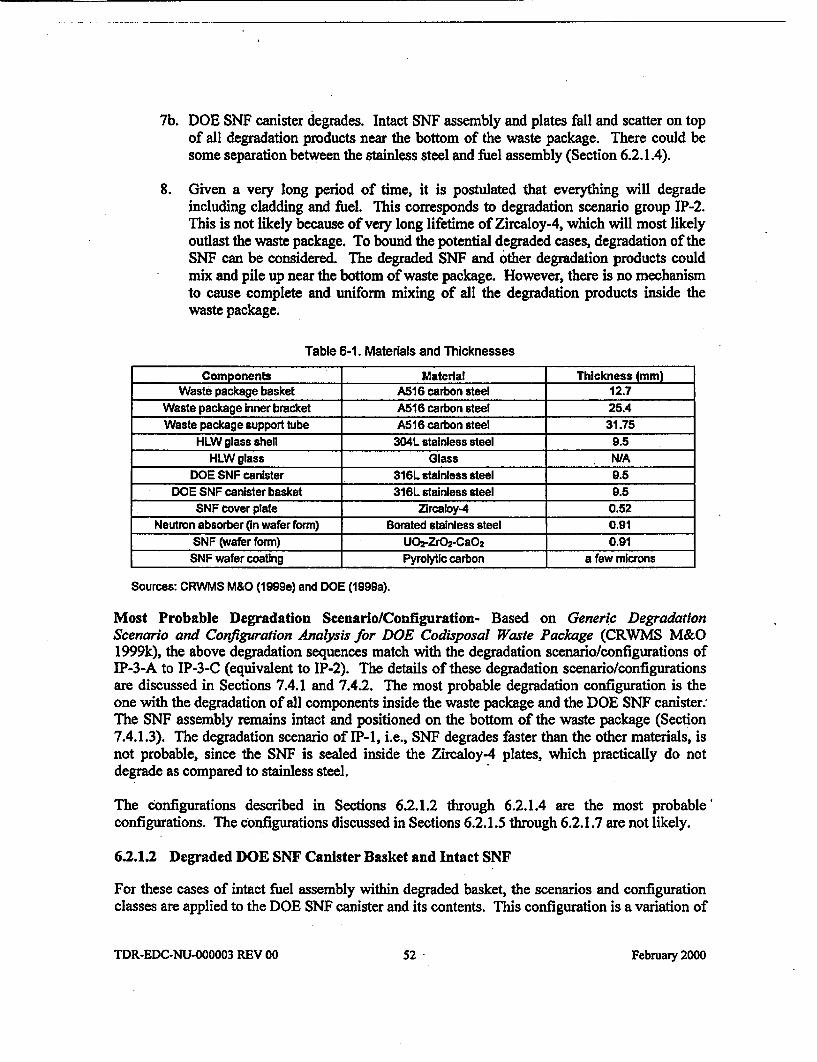
7b. DOE SNF canister degrades. Intact SNF assembly and plates fall and scatter on topof all degradation products near the bottom of the waste package. There could besome separation between the stainless steel and fuel assembly (Section 6.2.1.4).
8. Given a very long period of time, it is postulated that everything will degradeincluding cladding and fuel. This corresponds to degradation scenario group IP-2.This is not likely because of very long lifetime of Zircaloy-4, which will most likelyoutlast the waste package. To bound the potential degraded cases, degradation of theSNF can be considered. The degraded SNF and other degradation products couldmix and pile up near the bottom of waste package. However, there is no mechanismto cause complete and uniform mixing of all the degradation products inside thewaste package.
Table 6-1. Materials and Thicknesses
Components Material Thickness (mm)Waste package basket A516 carbon steel 12.7
Waste package inner bracket A516 carbon steel 25AWaste package support tube A516 carbon steel 31.75
HLW glass shell 304L stainless steel 9.5HLW glass Glass WNA
DOE SNF canister 316L stainless steel 9.5DOE SNF canister basket 316L stainless steel 9.5
SNF cover plate Zlrcaloy-4 0.52Neutron absorber (in wafer form) Borated stainless steel 0.91
SNF (wafer form) UO2-ZrO2-CaO 2 0.91SNF wafer coating Pyrolytic carbon a few microns
Sources: CRWMS M&O (1999e) and DOE (1999a).
Most Probable Degradation Scenario/Configuration- Based on Generic DegradationScenario and Configuration Analysis for DOE Codisposal Waste Package (CRWMS M&O1999k), the above degradation sequences match with the degradation scenario/configurations ofIP-3-A to IP-3-C (equivalent to IP-2). The details of these degradation scenario/configurationsare discussed in Sections 7.4.1 and 7.4.2. The most probable degradation configuration is theone with the degradation of all components inside the waste package and the DOE SNF canister:The SNF assembly remains intact and positioned on the bottom of the waste package (Section7.4.1.3). The degradation scenario of IP-1, i.e., SNF degrades faster than the other materials, isnot probable, since the SNF is sealed inside the Zircaloy-4 plates, which practically do notdegrade as compared to stainless steel.
The configurations described in Sections 6.2.1.2 through 6.2.1.4 are the most probableconfigurations. The configurations discussed in Sections 6.2.1.5 through 6.2.1.7 are not likely.
6.2.1.2 Degraded DOE SNF Canister Basket and Intact SNF
For these cases of intact fuel assembly within degraded basket, the scenarios and configurationclasses are applied to the DOE SNF canister and its contents. This configuration is a variation of
TDR-EDC-NU-000003 REV 00 52 February 2000
configuration class 1 and can be reached from standard scenario IP-3-A. The results of thecriticality calculations for this configuration are given in Section 7.4.1.1.
6.2.1.3 Intact DOE SNF Canister and Degraded Waste Package Internals
In this case, the concepts of scenario and configuration are applied to the entire waste package.The fuel assembly and the DOE SNF canister internals are intact. This configuration is avariation of configuration class 1 and can be reached from standard scenario IP-3-A. The resultsof the criticality calculations for this configuration are given in Section 7.4.1.2.
6.2.1.4 Degraded DOE SNF Canister and Waste Package Internals
In this case, the concepts of scenario and configuration are applied to the entire waste package.The DOE SNF canister, waste package internals, and HLW glass canisters are degraded. Thefuel assembly is intact. This configuration is achievable because of very low degradation rate ofZircaloy-4, which envelops and protects the fuel. This configuration is a variation ofconfiguration class 1 and can be reached from standard scenario IP-3-B. The results of thecriticality calculations for this configuration are given in Section 7.4.1.3.
6.2.1.5 Intact DOE SNF Canister and Waste Package Internals and Degraded SNF
For these cases of degraded fuel assembly within intact basket, the scenarios and configurationclasses are applied to the DOE SNF canister and its contents. This configuration is a variation ofconfiguration class 6 and can be reached from standard scenario IP-1-A. The results of thecriticality calculations for this configuration are given in Section 7.4.2.1.
6.2.1.6 Intact Waste Package Internals and Degraded DOE SNF Canister and SNF
For these cases of degraded fuel assembly within degraded basket, the scenarios andconfiguration classes are applied to the DOE SNF canister and its contents. This configuration isa variation of configuration class 3 and can be reached from standard scenario IP-1-B. Theresults of the criticality calculations for this configuration are given in Section 7.4.2.2.
6.2.1.7 Completely Degraded DOE SNF Canister and Waste Package Internals
In this case, the concepts of scenario and configuration are applied to the entire waste package.Degradation products from the DOE SNF canister and contents form a layer on the bottom of thewaste package. The degradation products (clay) from waste package internals and HLW glasscanisters form a layer above. This configuration is a variation of configuration class 2 and canbe reached from standard scenario IP-I-C and IP-2. The results of the criticality calculations forthis configuration are given in Sections 7.4.2.3 and 7.4.2.4.
TDR-EDC-NU-000003 REV 00 53 February 2000
6.2.2 Basic Design Approach for Geochemical Analysis
The method used for this analysis involves the steps described below.
1. Use the basic EQ3/6 capability to trace the progress of reactions as the chemistry evolves,including estimating the concentrations of material remaining in solution as well as thecomposition of precipitated solids. EQ3 is used to determine a starting fluid compositionfor a series of EQ6 calculations; it does not simulate reaction progress.
2. Evaluate available data on the range of dissolution rates for the materials involved, to beused as material/species input for each time step.
3. Use the "solid-centered flow-through" mode in EQ6. In this mode, an increment ofaqueous "feed" solution is added continuously to the waste package system, and a likevolume of the existing solution is removed. This mode simulates a continuously stirredtank reactor.
4. Determine the concentrations of fissile materials in solution as a function of time (fromthe output of EQ6-simulated reaction times up to 6-105 years).
5. Calculate the amount of fissile material released from the waste package as a function oftime, which thereby reduces the chance of criticality within the waste package.
6. Calculate the composition and amounts of solids (precipitated minerals or corrosionproducts and unreacted package materials).
Two approaches were used in the geochemistry analysis for Shippingport PWR SNF: single-stage and double-stage. In single-stage, all waste package internals including SNF come incontact with water and degrade simultaneously thereby exposing the fissile and neutron absorbermaterials to the degraded solutions, which could result in losing the fissile and/or neutronabsorber materials. The objective of the single-stage approach is to evaluate the effect ofdegraded products on the fissile and neutron absorber material, particularly the pH effect. Ingeneral, the single-stage cases are considered as the extreme or not probable cases due to the factthat all components are assumed to begin to degrade immediately after the waste package breachwithout considering the degradation sequences. In double-stage, the internals of waste packagedegrade first followed by the degradation of the DOE SNF canister and SNF. Therefore, themultiple-stage cases represent the most probable degradation scenarios. For most of the runs,only 1% of the fuel was exposed to the degraded environment due to the highly corrosionresistant Zircaloy-4 cladding. In some runs, 100% of the fuel was exposed.
6.3 CALCULATIONS AND RESULTS
The calculations begin by selecting representative values from known ranges for composition,amounts, and reaction rates of the various components of the 5-DHLW/DOE Spent Fuel-Longwaste package with DOE SNF canister containing Shippingport PWR SNF. Surface areas arecalculated based on the known package geometry. The input to EQ6 consists of the compositionof J-13 well water, together with a rate of influx to the waste package (Section 2.1.8.3).
TDR-EDC-NU-000003 REV 00 54 February 2000
Sometimes the degradation of the waste package is divided into stages (e.g., degradation ofHLW glass before breach, and exposure of the fuel assemblies and basket materials to the water).The EQ6 outputs include the compositions and amounts of solid products and the solutioncomposition. Details of the results are presented below. The calculation process is described inmore detail in CRWMS M&O (1999e).
Uranium and plutonium are quite soluble in alkaline, carbonate-rich solutions produced when theHLW glass degrades (solubility up to -10.1 molal [CRWMS M&O 1999e, p. 38]). A conditionof low pH might be produced as stainless steel degrades separately from the HLW glass. Toobtain sustained low-pH conditions, it is generally necessary to break the degradation processinto two. stages. The first stage involves an early breach of the 304L stainless steel canistersholding the HLW glass, followed by fast degradation of the HLW glass and removal of thealkaline components during a period of relatively high drip rate. In the second stage, the 316Lstainless steel DOE SNF canister breaches, exposing some of the Shippingport PWR (HEUoxide) fuel. In this second stage, the pH of the ambient solutions remains low (-5 to '-6), due inpart to the degradation of the stainless steel. To keep the pH low, the drip rate must be reducedfor the second stage.
6.3.1 Results of EQ6 Runs
In total, thirty cases of single- and double-stage EQ6 simulations were run. In these cases,degradation rates of steel, glass, and Shippingport PWR (HEU oxide) SNF, and water fluxeswere varied. Table 6-2 summarizes all the cases run, as well as total percentage of boron,uranium and plutonium loss at the end of the EQ6 runs. Note that although boron is included inthe calculations, the criticality calculations did not take any credit for its presence. This isconservative, and also realistic, consistent with Table 6-2 showing all but six cases losing almostall their boron.
Cases 1-20 and 25-30 are single-stage, and involve simultaneous exposure of the fuel and thepackage materials to J-13 well water. Cases 25 to 27 were done to consider the effect of thedegree of fuel exposure on reaction. Case 28 was done to determine if the alteration productdensity depended on the identity of the iron oxide that formed - hematite or goethite. This casewas just a first stage, with hematite suppressed (with goethite), run to the same ending time andrates as the first-stage run of Case 21,'wherein hematite was allowed to form. Cases 29 and 30were specifically done to assess the relative contribution of uranium from dissolving fuel andglass.
Cases 21-24 are double-stage runs in which J-13 well water first interacts with everything insidethe waste package except the SNF canister, followed in the second stage by interaction of theresulting fluids with the SNF. It is also assumed that Zr cladding would breach, exposing 1% ofthe fuel, just after the breach of the DOE SNF canister. In three of the double-stage runs (Cases22-24) hematite formation is suppressed and goethite is the major iron oxide formed. Bothhematite and goethite are products of steel corrosion with nearly equal thermodynamic stability.However, hematite is slightly more stable so it has been used for most of the cases considered inthis report.
TDR-EDC-NU-000003 REV 00 55 February 2000
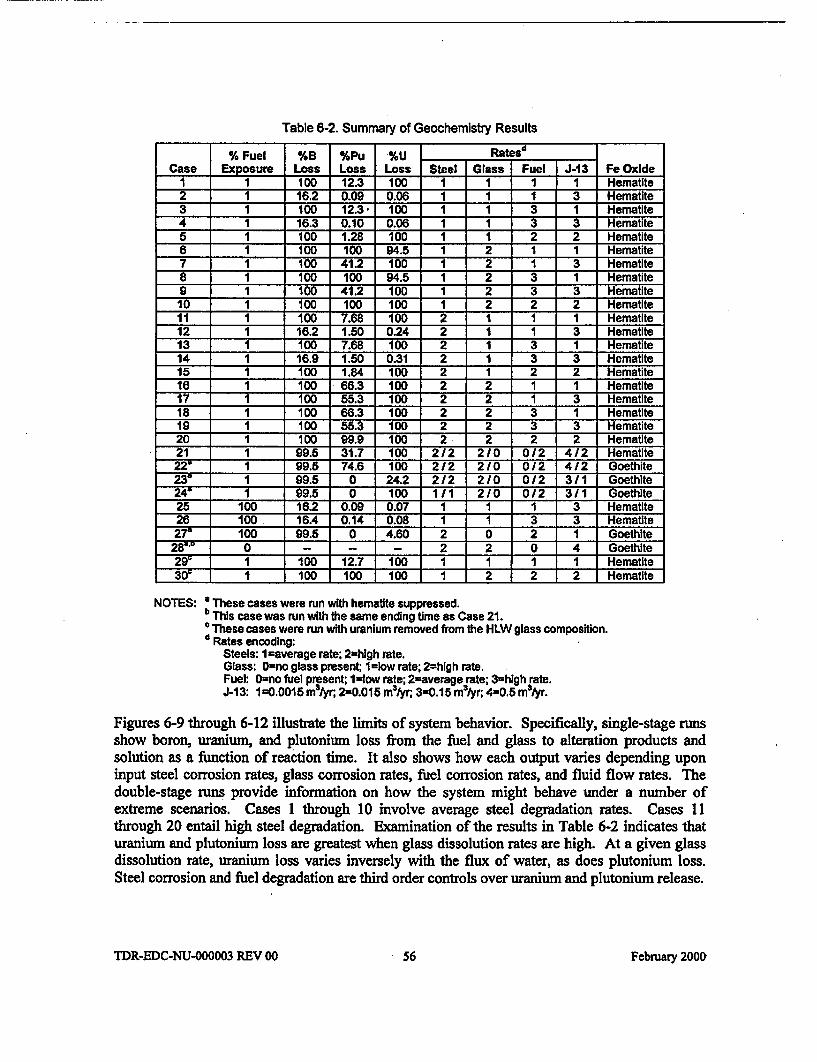
Table 6-2. Summary of Geochemistry Results
% Fuel %B %Pu %U RateOsCase Exposure Loss Loss Loss Steel Glass Fuel J-13 Fe Oxide
1 1 100 12.3 100 I 1 1 1 Hematite2 1 16.2 0.09 0.06 1 1 1 3 Hematite3 1 100 12.3 - 100 1 1 3 1 Hematite4 1 16.3 0.10 1 0.06 1 1 3 3 Hematite5 I 100 1.28 100 1 1 2 2 Hematite6 1 100 100 94.5 1 2 1 1 Hematite7 1 100 41.2 100 1 2 1 3 Hematite6 I 100 100 94.5 1 2 3 1 Hematite9 I1 100 41.2 100 1 2 3 3 Hematite10 1 100 100 100 1 2 2 2 Hematite11 I 100 7.68 100 2 1 1 1 Hematite12 1 16.2 1.50 0.24 2 1 1 3 Hematite13 1 100 7.68 100 2 1 3 1 Hematite14 1 16.9 1.50 0.31 2 1 3 3 Hematite15 100 1.84 100 2 1 2 2 Hematite16 1 100 66.3 100 2 2 1 1 Hematite17 1 100 55.3 100 2 2 1 3 Hematite18 1 100 66.3 100 2 2 3 1 Hematite19 1 100 55.3 100 2 2 3 3 Hematite20 ___ 100 99.9 100 2 2 2 2 HematUte21 1 99.5 31.7 100 2/2 210 0/2 4/2 Hematite22' 1 99.5 74.6 100 2/2 2/0 0/2 4/2 Goethite
1 99.6 0 24.2 2/2 2/0 0/2 3/1 Goethite24'___ 1 99.5 0 100 1/1 2/0 0/2 3/1 Goethite25 100 16.2 0.09 0.07 1 1 1 3 Hematite26 100 16A 0.14 0.08 1 1 3 3 Hematite2r 100 99.5 0 4.60 2 0 2 1 Goethite28': - 0 - - - 2 2 0 4 Goethite29'-- 1 100 12.7 100 1 1 1 1 Hematite30' 1 100 100 100 1 2 2 2 Hematite
NOTES: 'These cases were run with hematite suppressed.b This case was run with the same ending time as Case 21.a These cases were run with uranium removed from the HLW glass composition.d Rates encoding:
Steels: I =average rate; 2Thigh rate.Glass: 0=no glass present; 1=low rate; 2=hIgh rate.Fuel: 0=no fuel present; 1=10w rate; 2=average rate; 3=high rate.J-13: 1=0.0015 malyr; 2-0.015 m3/yr; 3=0.15 m3lyr; 4=0.5 m'tyr.
Figures 6-9 through 6-12 illustrate the limits of system behavior. Specifically, single-stage runsshow boron, uranium, and plutonium loss from the fuel and glass to alteration products andsolution as a function of reaction time. It also shows how each output varies depending uponinput steel corrosion rates, glass corrosion rates, fuel corrosion rates, and fluid flow rates. Thedouble-stage runs provide information on how the system might behave under a number ofextreme scenarios. Cases 1 through 10 involve average steel degradation rates. Cases I1through 20 entail high steel degradation. Examination of the results in Table 6-2 indicates thaturanium and plutonium loss are greatest when glass dissolution rates are high. At a given glassdissolution rate, uranium loss varies inversely with the flux of water, as does plutonium loss.Steel corrosion and fuel degradation are third order controls over uranium and plutonium release.
TDR-EDC-NU-000003 REV 00 56 Febnary 2000
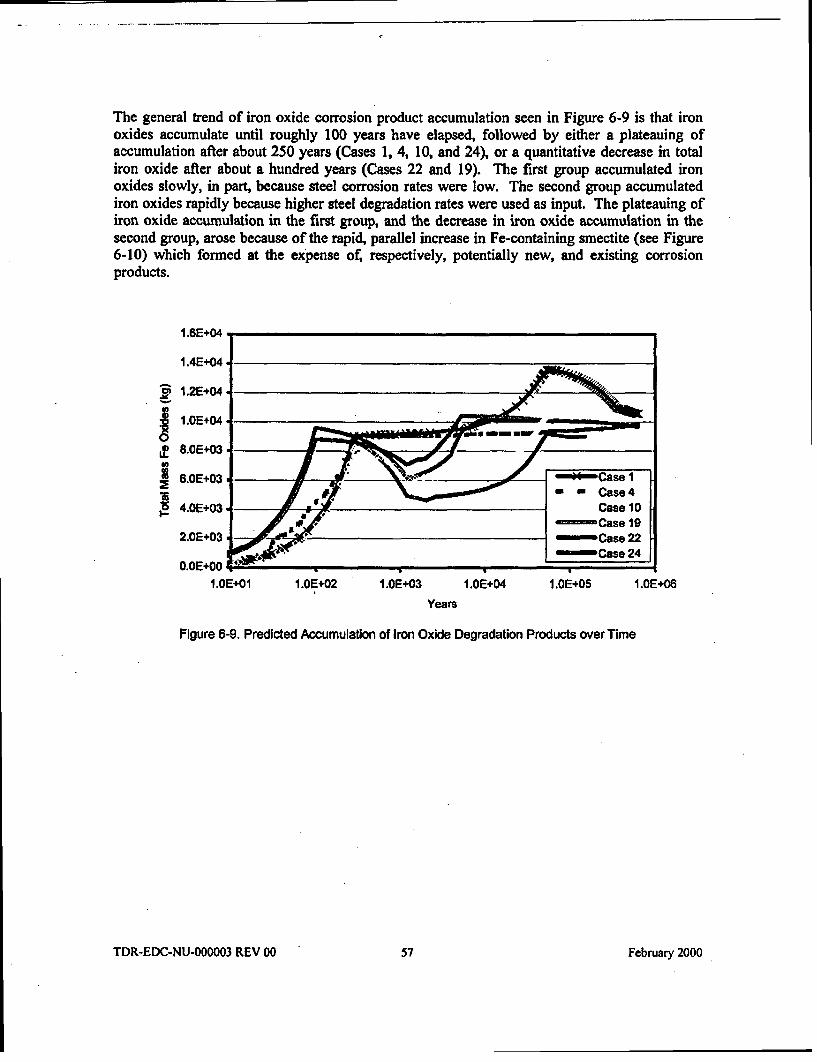
The general trend of iron oxide corrosion product accumulation seen in Figure 6-9 is that ironoxides accumulate until roughly 100 years have elapsed, followed by either a plateauing ofaccumulation after about 250 years (Cases 1, 4, 10, and 24), or a quantitative decrease in totaliron oxide after about a hundred years (Cases 22 and 19). The first group accumulated ironoxides slowly, in part, because steel corrosion rates were low. The second group accumulatediron oxides rapidly because higher steel degradation rates were used as input. The plateauing ofiron oxide accumulation in the first group, and the decrease in iron oxide accumulation in thesecond group, arose because of the rapid, parallel increase in Fe-containing smectite (see Figure6-10) which formed at the expense of, respectively, potentially new, and existing corrosionproducts.
a,
i-I-To
An_
O.OE+00 t 3 .I .OE+01 I1.OE.02 I .OE+03 I .OE.04 I1.OE.05 1.0E+06
Years
Figure 6-9. Predicted Accumulation of Iron Oxide Degradation Products over Time
TDR-EDC-NU-000003 REV 00 57 February 2000
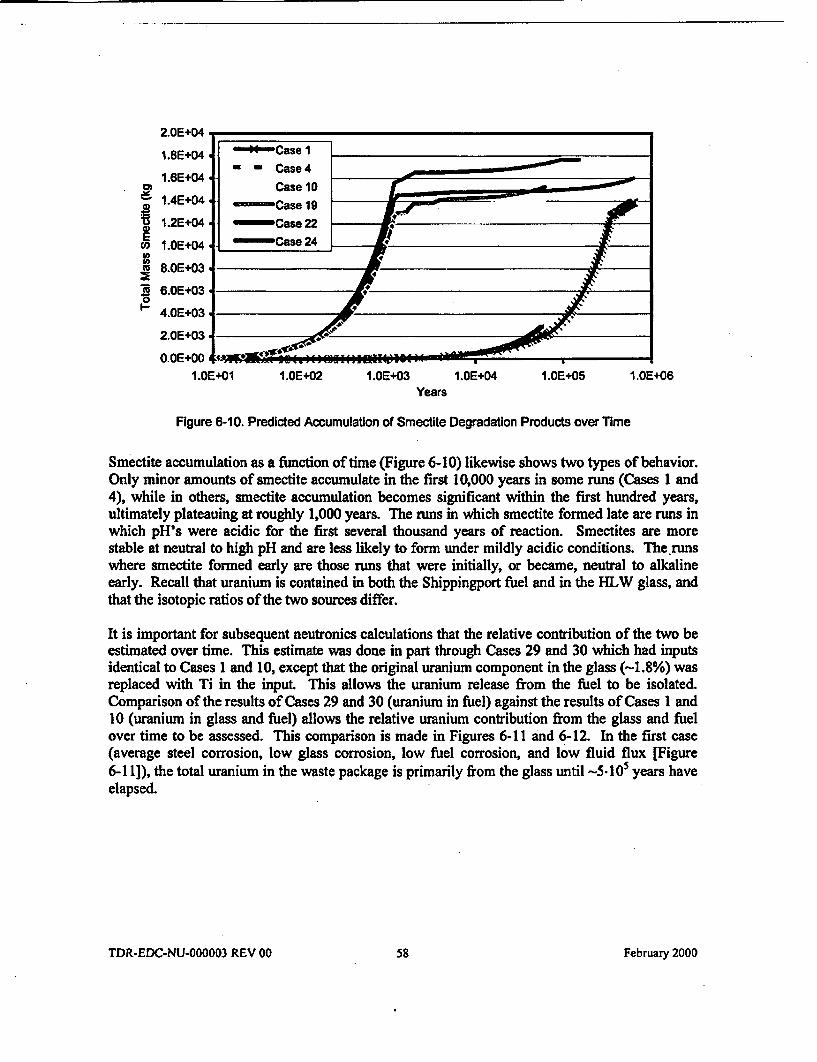
Case 10 rA1.4E+04 Case 19
1.2E+04 i - Case 22
X 1.OE+04 | I n Case 24*0?AE B.OE+03
S 6.OE+034.0E+03
2.OE.03 *
O.OE+OO a * ' _ 5-_ _1.OE+01 1.OE+02 1.OE+03 1.OE+04 1.0E+05 1.OE+06
Years
Figure 6-10. Predicted Accumulation of Smectite Degradation Products over Time
Smectite accumulation as a function of time (Figure 6-10) likewise shows two types of behavior.Only minor amounts of smectite accumulate in the first 10,000 years in some runs (Cases 1 and4), while in others, smectite accumulation becomes significant within the first hundred years,ultimately plateauing at roughly 1,000 years. The runs in which smectite formed late are runs inwhich pH's were acidic for the first several thousand years of reaction. Smectites are morestable at neutral to high pH and are less likely to form under mildly acidic conditions. The runswhere smectite formed early are those runs that were initially, or became, neutral to alkalineearly. Recall that uranium is contained in both the Shippingport fuel and in the HLW glass, andthat the isotopic ratios of the two sources differ.
It is important for subsequent neutronics calculations that the relative contribution of the two beestimated over time. This estimate was done in part through Cases 29 and 30 which had inputsidentical to Cases I and 10, except that the original uranium component in the glass (-1.8%) wasreplaced with Ti in the input. This allows the uranium release from the fuel to be isolated.Comparison of the results of Cases 29 and 30 (uranium in fuel) against the results of Cases 1 and10 (uranium in glass and fuel) allows the relative uranium contribution from the glass and fuelover time to be assessed. This comparison is made in Figures 6-11 and 6-12. In the first case(average steel corrosion, low glass corrosion, low fuel corrosion, and low fluid flux [Figure6-11]), the total uranium in the waste package is primarily from the glass until -5- 105 years haveelapsed.
TDR-EDC-NU-000003 REV 00 58 February 2000
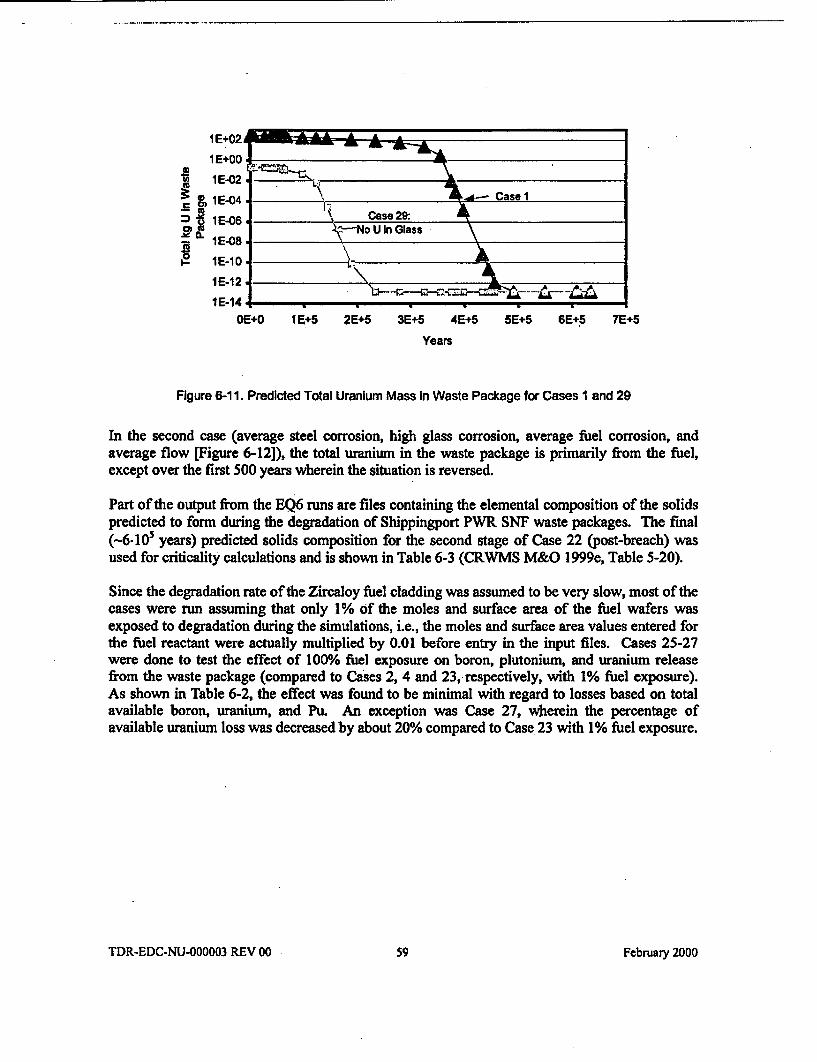
1 E02c 1E-04 - Ho CaseI
. t 6ST Case 29:1E-06 X No U In GlassIE-08
I IE-10 lIE-12
IE-14OE+O 1 E+5 2E+5 3E+5 4E+5 SE+5 6E+5 7E+5
Years
Figure 6-11. Predicted Total Uranium Mass in Waste Package for Cases 1 and 29
In the second case (average steel corrosion, high glass corrosion, average fuel corrosion, andaverage flow [Figure 6-12]), the total uranium in the waste package is primarily from the fuel,except over the first 500 years wherein the situation is reversed.
Part of the output from the EQ6 runs are files containing the elemental composition of the solidspredicted to form during the degradation of Shippingport PWR SNF waste packages. The final(-6-105 years) predicted solids composition for the second stage of Case 22 (post-breach) wasused for criticality calculations and is shown in Table 6-3 (CRWMS M&O 1999e, Table 5-20).
Since the degradation rate of the Zircaloy fuel cladding was assumed to be very slow, most of thecases were run assuming that only 1% of the moles and surface area of the fuel wafers wasexposed to degradation during the simulations, i.e., the moles and surface area values entered forthe fuel reactant were actually multiplied by 0.01 before entry in the input files. Cases 25-27were done to test the effect of 100%h fuel exposure on boron, plutonium, and uranium releasefrom the waste package (compared to Cases 2, 4 and 23, respectively, with 1% fuel exposure).As shown in Table 6-2, the effect was found to be minimal with regard to losses based on totalavailable boron, uranium, and Put. An exception was Case 27, wherein the percentage ofavailable uranium loss was decreased by about 20% compared to Case 23 with 1% fuel exposure.
TDR-EDC-NU-000003 REV 00 59 February 2000
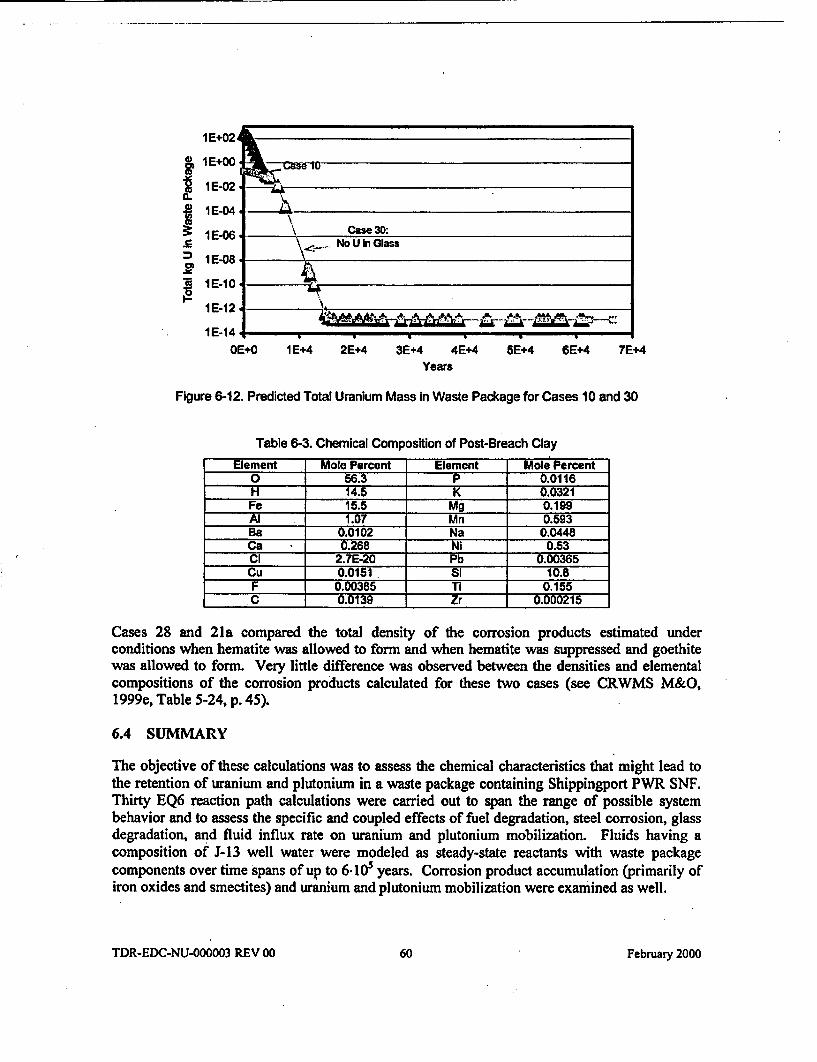
1E+00 se IV
i 1 E-02
~1E0
1 E-06 Case 30:£ \,:_ No U I Glass
I 1E-08
IE-121IE -1 2 | _ _ _ _ _ _ _ _ _ _ _ _ _ _ _ _ _ _ _ _ _ _ _ _ _
IE-14OE+O 1 E+4 2E+4 3E+4 4E+4 5E+4 6E+4 7E+4
Years
Figure 6-12. Predicted Total Uranium Mass in Waste Package for Cases 10 and 30
Table 6-3. Chemical Composition of Post-Breach Clay
Element Mole Percent Element Mole Percent0 56.3 P 0.0116H 14.5 K 0.0321Fe 15.5 Mg 0.199Al 1.07 Mn 0.593Ba 0.0102 Na 0.0448Ca 0.268 Ni 0.53Cl 2.JE-20 Pb 0.00365Cu 0.0151 Si 10.8F 0.00385 11 0.155C 0.0139 Zr 0.000215
Cases 28 and 21a compared the total density of the corrosion products estimated underconditions when hematite was allowed to form and when hematite was suppressed and goethitewas allowed to form. Very little difference was observed between the densities and elementalcompositions of the corrosion products calculated for these two cases (see CRWMS M&O,1999e, Table 5-24, p. 45).
6.4 SUMMARY
The objective of these calculations was to assess the chemical characteristics that might lead tothe retention of uranium and plutonium in a waste package containing Shippingport PWR SNF.Thirty EQ6 reaction path calculations were carried out to span the range of possible systembehavior and to assess the specific and coupled effects of fuel degradation, steel corrosion, glassdegradation, and fluid influx rate on uranium and plutonium mobilization. Fluids having acomposition of J-13 well water were modeled as steady-state reactants with waste packagecomponents over time spans of up to 6-105 years. Corrosion product accumulation (primarily ofiron oxides and smectites) and uranium and plutonium mobilization were examined as well.
TDR-EDC-NU-000003 REV 00 60 February 2000
The controls on uranium and plutonium release from the waste package can be summarized asfollows:
1. Uranium and plutonium loss are greatest when glass dissolution rates are high. Highglass dissolution and low water fluxes favor alkalinity buildup and the formation ofmobile actinide-carbonate complexes. Steel corrosion and fuel degradation are thirdorder controls over uranium and plutonium release.
2. Uranium loss from the waste package varied from 0.06% to 100% and was typicallycomplete if greater than neutral pH's (and attendant high alkalinity) existed for anyappreciable amount of time. At a given glass dissolution rate, uranium loss variesinversely with the flux of water. Immobilized uranium was modeled as occurring due tothe formation of the uranium-silicate, soddyite.
3. Plutonium loss was typically much less than uranium loss, though waste packageaccumulations were also quantitatively smaller than that observed for uranium.Plutonium accumulation was modeled as being due to formation of PuO2.
4. The relative contributions of uranium from glass and uranium from fuel are predicted tovary. Under conditions of average steel corrosion, low glass corrosion, low fuelcorrosion, and low fluid flux, the total uranium in the waste package is primarily from theglass until -5-105 years have elapsed. When average steel corrosion, high glasscorrosion, average fuel corrosion, and average flow are used as input, the total uranium inthe waste package is predicted to come primarily from the fuel, except over the first 500years wherein the glass contribution is greater.
As mentioned in the discussion of the calculation results above, the mobilities of uranium andplutonium are pH dependent. The degradation rates of waste package components, which affectacidity and alkalinity, as well as the flow rate of J-13 well water, will have a bearing on thepossibility for internal criticality.
The scenario for the double-stage cases matches with the generic scenario group of IP-3(CRWMS M&O 1999k), i.e., waste form degrade after the materials outside the DOE canisterdegrade. Thus, double-stage cases represent the most probable degradation scenario. Six caseswere run with one percent of the fuel exposed to degradation. In one of the four cases, 24% ofthe uranium originating from 1% of the fuel was flushed from the waste package, leaving 99% ofthe original fuel intact. In one multiple stage case, which was run with 100% fuel exposure, only5% of the total uranium was flushed from the waste package, leaving behind 95% of the originaluranium as a corrosion product in the waste package. The case with 100% fuel exposure,however, is not very probable due to the highly corrosion resistant Zr-4 cladding. In all double-stage cases, various degradation rates of the steel, and J-13 water were used with fuel and steeldegrading at a high rate.
TDR-EDC-NU-000003 REV 00 61 Februar 2000
INTENTIONALLY LEFT BLANK
TDR-EDC-NU-000003 REV 00 62 February 2000
7. INTACT AND DEGRADED COMPONENT CRITICALITY ANALYSES
7.1 USE OF COMPUTER SOFTWARE
The Monte Carlo code, MCNP, Version 4B2, is used to calculate the kff of the waste package.This code, identified as CSCI 30033 V4B2LV, was obtained from SCM in accordance withappropriate procedures, and is qualified as documented in the SQR for the MCNP, Version 4B2(CRWMS M&O 1998i).
7.2 DESIGN ANALYSIS
The calculation method used to perform the criticality calculations consisted of using the MCNPVersion 4B2 code (Briesmeister 1997) to calculate the kff for various geometrical configurationsof Shippingport PWR fuel in the 5-DHLW/DOE Spent Fuel-Long waste package. The kefresults represent the average combined collision, absorption, and track-length estimator from theMCNP calculations. The standard deviation (a) represents the standard deviation of kff aboutthe average combined collision, absorption, and track-length estimate due to the Monte-Carlo-calculation statistics. The calculations are performed using continuous energy cross-sectionlibraries that are part of the qualified MCNP code system (CSCI 30033 V4B2LV). Allcalculations are performed with fresh-fuel isotopics (Assumption 2.3.5.1). The DOE SNFcanister with Shippingport PWR fuel does not contain any strong neutron absorbers such asgadolinium. Boron, which is a burnable poison that is an integral part of the fuel, is neglected inall criticality calculations.
The issue of minor actinides, which are fast-fissionable and non-fissile, is investigated. Thecritical mass of neptunium (Np-237) moderated and reflected by granite is 45,000 g, and that foramericium (Am) at 10,000 years is 78,900 g (Allen 1978). The DOE SNF canister with oneShippingport PWR C2 S1 assembly has a total of approximately 38 g Pu-238 and 19 g Am-241,as a result of 426.4 MWd/kg exposure (DOE 1999a, Table B-3; Parrington et al. 1996, p. 9). Noappreciable amount of Np-237 was generated as a result of exposure (DOE 1999a, Table B-3).Due to these very low quantities (less than 0.1% of required minimum critical mass), these minoractinides do not present a potential for criticality, and therefore, have not been included in thecriticality calculations. The use of fresh fuel compositions and neglect of burnable neutronabsorber conservatively bounds any changes associated with bumup.
7.3 CALCULATIONS AND RE SULTS - PART I: INTACT CRITICALITY ANALYSIS
In this section, the criticality analyses for intact configurations are discussed. Although thecomponents (fuel plates, assembly, and DOE SNF canister) are considered structurally intact,water intrusion into the components is allowed to determine the highest kcff resulting fromoptimum moderation. It must be noted that no credit for burnable poison material (boron) istaken in any of the calculations that are analyzed in this section.
The intact canister with the intact fuel cluster is represented in the intact codisposal wastepackage as shown in Figure 7-1. The kff of the intact fuel cluster is calculated based on the fuel
TDR-EDC-NU-000003 REV 00 63 February 2000
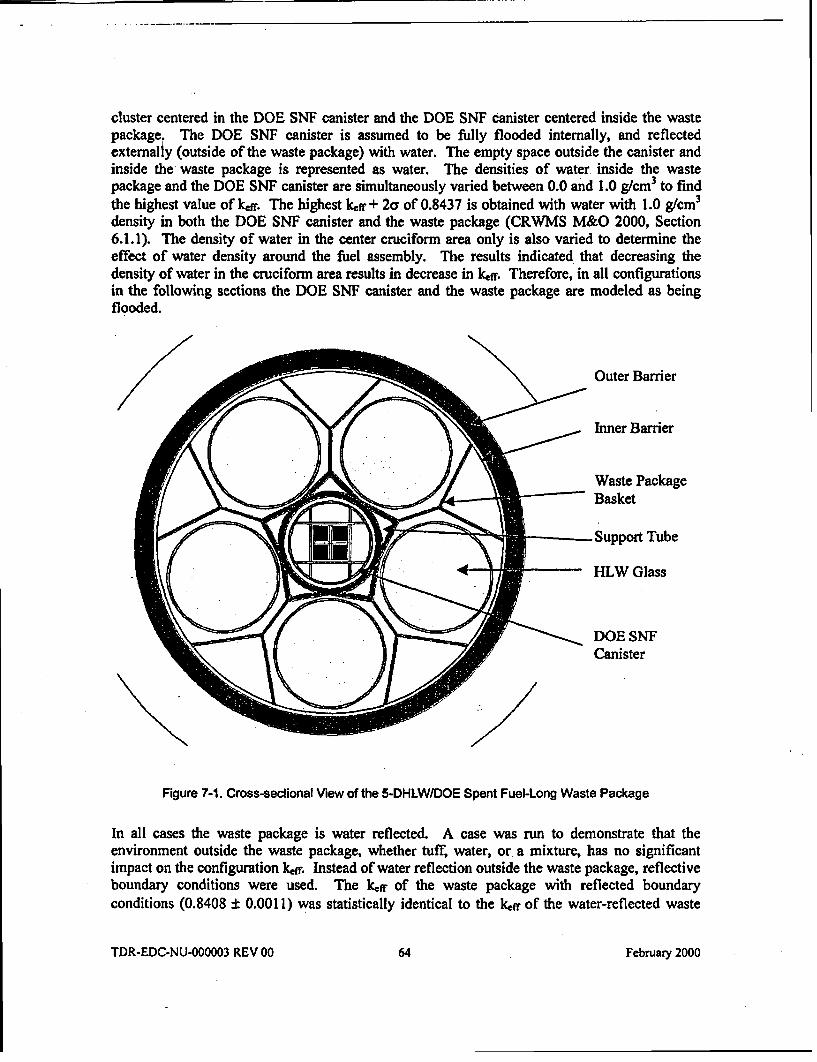
cluster centered in the DOE SNF canister and the DOE SNF canister centered inside the wastepackage. The DOE SNF canister is assumed to be fully flooded internally, and reflectedexternally (outside of the waste package) with water. The empty space outside the canister andinside the waste package is represented as water. The densities of water inside the wastepackage and the DOE SNF canister are simultaneously varied between 0.0 and 1.0 g/cm3 to findthe highest value of keff. The highest kfr + 2cr of 0.8437 is obtained with water with 1.0 g/Cm 3
density in both the DOE SNF canister and the waste package (CRWMS M&O 2000, Section6.1.1). The density of water in the center cruciform area only is also varied to determine theeffect of water density around the fuel assembly. The results indicated that decreasing thedensity of water in the cruciform area results in decrease in kff. Therefore, in all configurationsin the following sections the DOE SNF canister and the waste package are modeled as beingflooded.
Outer Barrier
Inner Barrier
Waste Package/ < . 3 ' / ~~~~~~~~~~~Basket
Support Tube
E&{ - At~~~~~~~~~~~L Glass
DOESNFCanister
Figure 7-1. Cross-sectional View of the 5-DHLW/DOE Spent Fuel-Long Waste Package
In all cases the waste package is water reflected. A case was run to demonstrate that theenvironment outside the waste package, whether tuff, water, or a mixture, has no significantimpact on the configuration lckf. Instead of water reflection outside the waste package, reflectiveboundary conditions were used. The kef of the waste package with reflected boundaryconditions (0.8408 ± 0.0011) was statistically identical to the kcff of the water-reflected waste
TDR-EDC-NU-000003 REV 00 64 February 2000
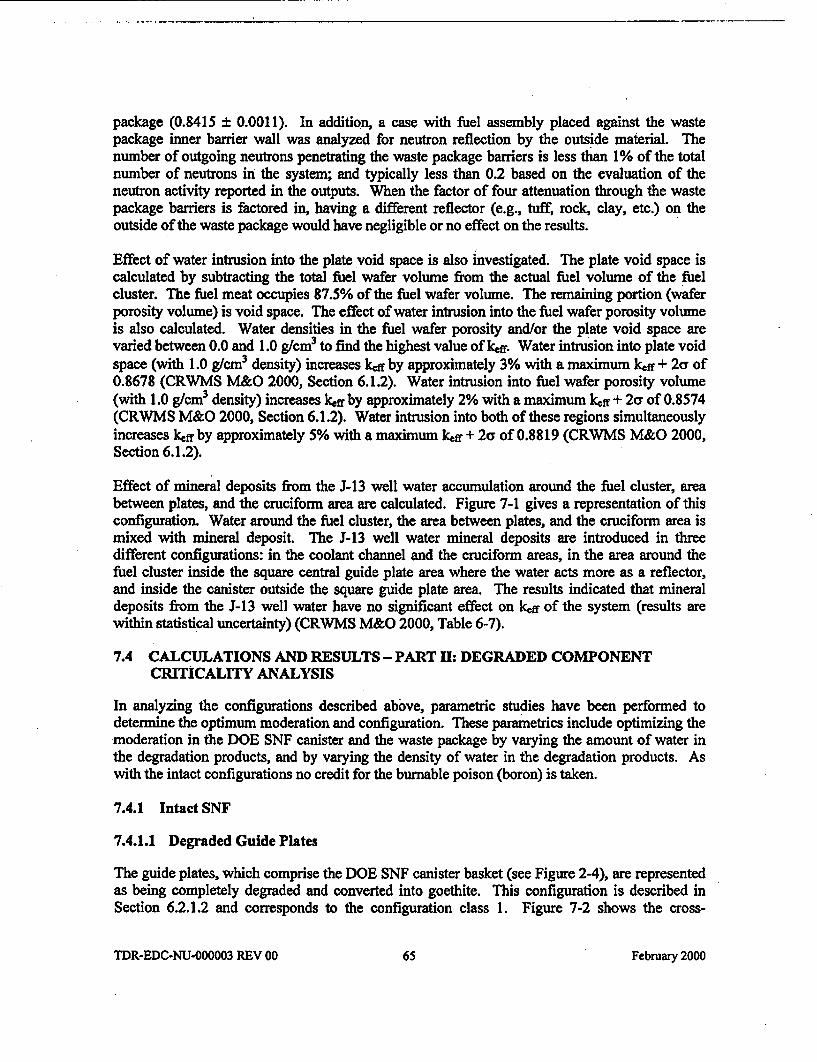
package (0.8415 ± 0.0011). In addition, a case with fuel assembly placed against the wastepackage inner barrier wall was analyzed for neutron reflection by the outside material. Thenumber of outgoing neutrons penetrating the waste package barriers is less than 1% of the totalnumber of neutrons in the system; and typically less than 0.2 based on the evaluation of theneutron activity reported in the outputs. When the factor of four attenuation through the wastepackage barriers is factored in, having a different reflector (e.g., tuff, rock, clay, etc.) on theoutside of the waste package would have negligible or no effect on the results.
Effect of water intrusion into the plate void space is also investigated. The plate void space iscalculated by subtracting the total fuel wafer volume from the actual fuel volume of the fuelcluster. The fuel meat occupies 87.5% of the fuel wafer volume. The remaining portion (waferporosity volume) is void space. The effect of water intrusion into the fuel wafer porosity volumeis also calculated. Water densities in the fuel wafer porosity and/or the plate void space arevaried between 0.0 and 1.0 g/cm3 to find the highest value of kcff. Water intrusion into plate voidspace (with 1.0 g/cm3 density) increases kff by approximately 3% with a maximum kff + 2a of0.8678 (CRWMS M&O 2000, Section 6.1.2). Water intrusion into fuel wafer porosity volume(with 1.0 gecm3 density) increases kff by approximately 2% with a maximum k.ff + 2ca of 0.8574(CRWMS M&O 2000, Section 6.1.2). Water intrusion into both of these regions simultaneouslyincreases kcff by approximately 5% with a maximum kcff + 2cr of 0.8819 (CRWMS M&O 2000,Section 6.1.2).
Effect of mineral deposits from the J-13 well water accumulation around the fuel cluster, areabetween plates, and the cruciform area are calculated. Figure 7-1 gives a representation of thisconfiguration. Water around the fuel cluster, the area between plates, and the cruciform area ismixed with mineral deposit. The J-13 well water mineral deposits are introduced in threedifferent configurations: in the coolant channel and the cruciform areas, in the area around thefuel cluster inside the square central guide plate area where the water acts more as a reflector,and inside the canister outside the square guide plate area. The results indicated that mineraldeposits from the J-13 well water have no significant effect on kcff of the system (results arewithin statistical uncertainty) (CRWMS M&O 2000, Table 6-7).
7.4 CALCULATIONS AND RESULTS - PART II: DEGRADED COMPONENTCRITICALITY ANALYSIS
In analyzing the configurations described above, parametric studies have been performed todetermine the optimum moderation and configuration. These parametrics include optimizing themoderation in the DOE SNF canister and the waste package by varying the amount of water inthe degradation products, and by varying the density of water in the degradation products. Aswith the intact configurations no credit for the burnable poison (boron) is taken.
7.4.1 Intact SNF
7.4.1.1 Degraded Guide Plates
The guide plates, which comprise the DOE SNF canister basket (see Figure 2-4), are representedas being completely degraded and converted into goethite. This configuration is described inSection 6.2.1.2 and corresponds to the configuration class 1. Figure 7-2 shows the cross-
TDR-EDC-NU-000003 REV 00 65 February 2000
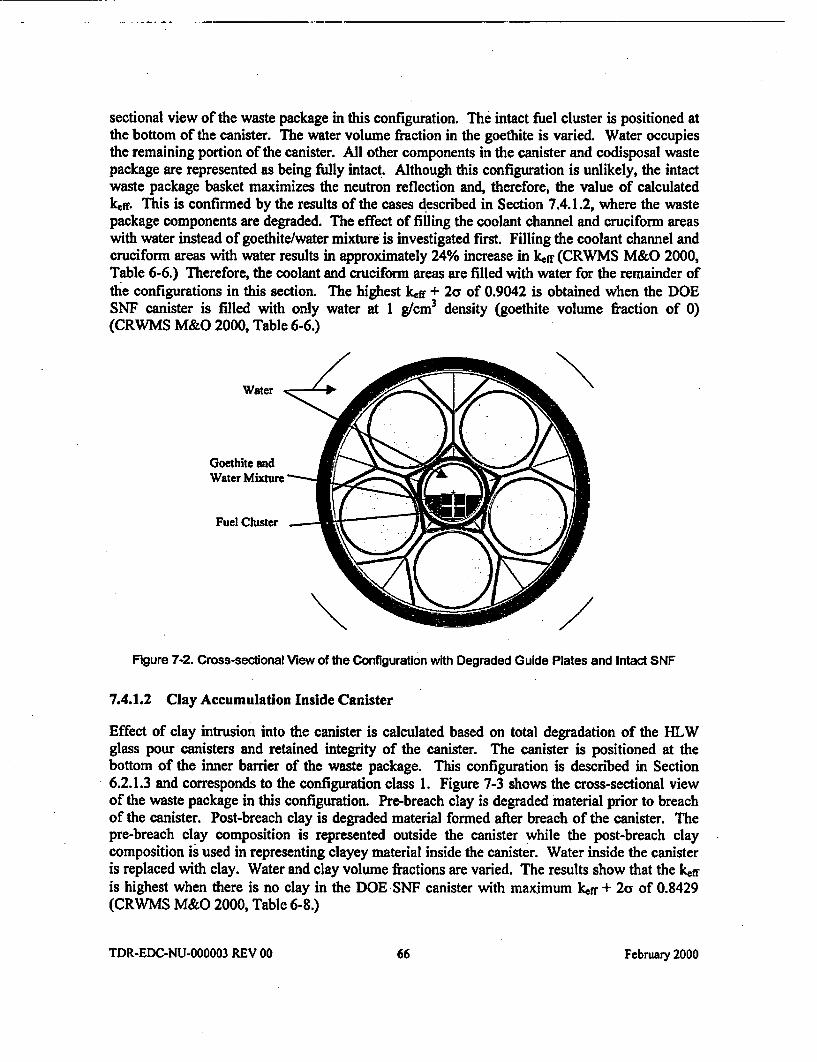
sectional view of the waste package in this configuration. The intact fuel cluster is positioned atthe bottom of the canister. The water volume fraction in the goethite is varied. Water occupiesthe remaining portion of the canister. All other components in the canister and codisposal wastepackage are represented as being fully intact. Although this configuration is unlikely, the intactwaste package basket maximizes the neutron reflection and, therefore, the value of calculatedkff. This is confirmed by the results of the cases described in Section 7.4.1.2, where the wastepackage components are degraded. The effect of filling the coolant channel and cruciform areaswith water instead of goethite/water mixture is investigated first. Filling the coolant channel andcruciform areas with water results in approximately 24% increase in keff (CRWMS M&O 2000,Table 6-6.) Therefore, the coolant and cruciform areas are filled with water for the remainder ofthe configurations in this section. The highest cff + 2a of 0.9042 is obtained when the DOESNF canister is filled with only water at 1 g/cm3 density (goethite volume fraction of 0)(CRWMS M&O 2000, Table 6-6.)
Water
Goethite andWater Mixture m
Fuel Cluster
Figure 7-2. Cross-sectional View of the Configuration with Degraded Guide Plates and Intact SNF
7.4.1.2 Clay Accumulation Inside Canister
Effect of clay intrusion into the canister is calculated based on total degradation of the HLWglass pour canisters and retained integrity of the canister. The canister is positioned at thebottom of the inner barrier of the waste package. This configuration is described in Section6.2.1.3 and corresponds to the configuration class 1. Figure 7-3 shows the cross-sectional viewof the waste package in this configuration. Pre-breach clay is degraded material prior to breachof the canister. Post-breach clay is degraded material formed after breach of the canister. Thepre-breach clay composition is represented outside the canister while the post-breach claycomposition is used in representing clayey material inside the canister. Water inside the canisteris replaced with clay. Water and clay volume fractions are varied. The results show that the k~ffis highest when there is no clay in the DOE SNF canister with maximum kff + 2a of 0.8429(CRWMS M&O 2000, Table 6-8.)
TDR-EDC-NU-000003 REV 00 66 February 2000
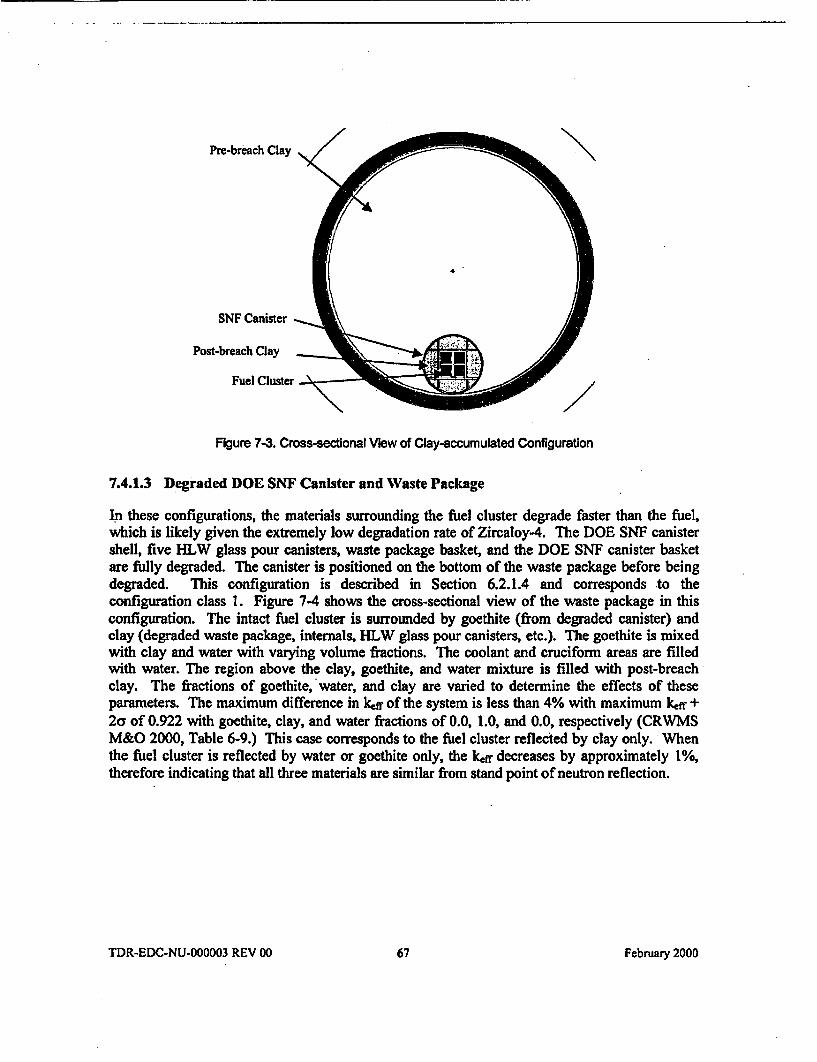
Pre-breach Clay
SNF Canister
Post-breach Clay
Fuel Cluster
Figure 7-3. Cross-sectional View of Clay-accumulated Configuration
7.4.1.3 Degraded DOE SNF Canister and Waste Package
In these configurations, the materials surrounding the fuel cluster degrade faster than the fuel,which is likely given the extremely low degradation rate of Zircaloy-4. The DOE SNF canistershell, five HLW glass pour canisters, waste package basket, and the DOE SNF canister basketare fully degraded. The canister is positioned on the bottom of the waste package before beingdegraded. This configuration is described in Section 6.2.1.4 and corresponds to theconfiguration class 1. Figure 7-4 shows the cross-sectional view of the waste package in thisconfiguration. The intact fuel cluster is surrounded by goethite (from degraded canister) andclay (degraded waste package, internals, HLW glass pour canisters, etc.). The goethite is mixedwith clay and water with varying volume fractions. The coolant and cruciform areas are filledwith water. The region above the clay, goethite, and water mixture is filled with post-breachclay. The fractions of goethite, water, and clay are varied to determine the effects of theseparameters. The maximum difference in kff of the system is less than 4% with maximum lcff +2a of 0.922 with goethite, clay, and water fractions of 0.0, 1.0, and 0.0, respectively (CRWMSM&O 2000, Table 6-9.) This case corresponds to the fuel cluster reflected by clay only. Whenthe fuel cluster is reflected by water or goethite only, the Icff decreases by approximately 1%,therefore indicating that all three materials are similar from stand point of neutron reflection.
TDR-EDC-NU-000003 REV 00 67 February 2000
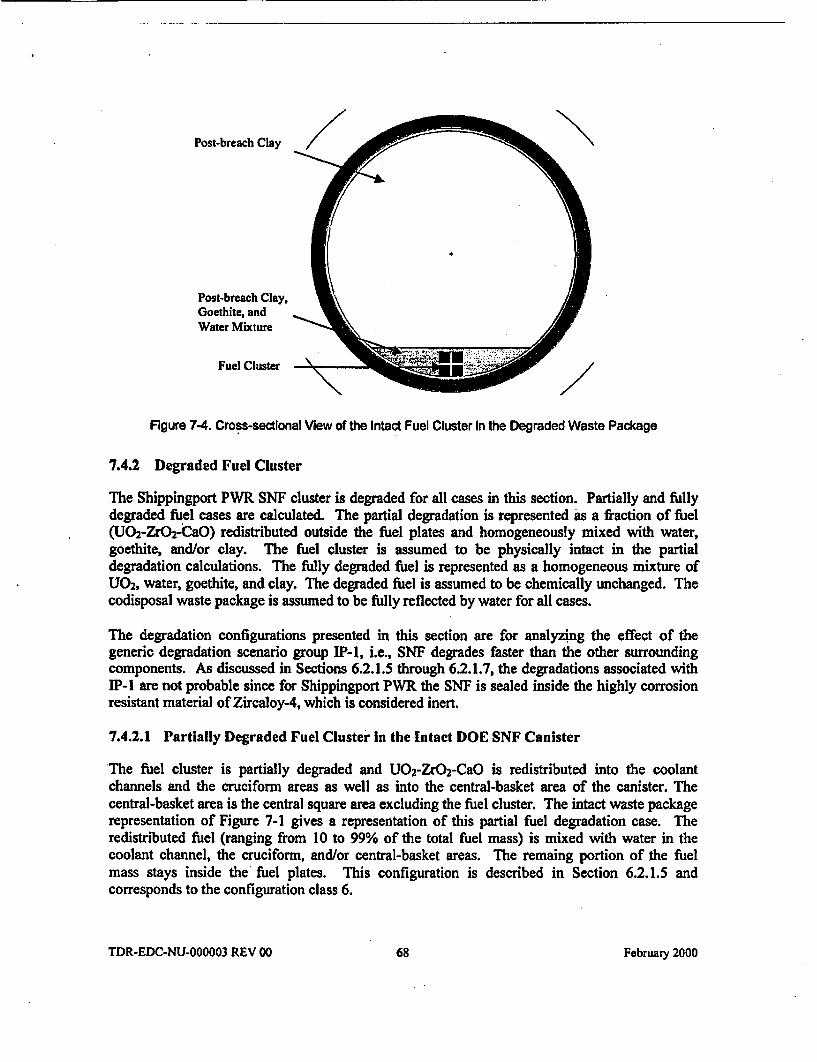
Post-breach Clay
Post-breach Clay,Goethite, andWater Mixture
Fuel Cluster
Figure 7-4. Cross-sectional View of the Intact Fuel Cluster In the Degraded Waste Package
7.4.2 Degraded Fuel Cluster
The Shippingport PWR SNF cluster is degraded for all cases in this section. Partially and fullydegraded fuel cases are calculated. The partial degradation is represented as a fraction of fuel(UO2-ZrO2-CaO) redistributed outside the fuel plates and homogeneously mixed with water,goethite, and/or clay. The fuel cluster is assumed to be physically intact in the partialdegradation calculations. The fully degraded fuel is represented as a homogeneous mixture ofU0 2, water, goethite, and clay. The degraded fuel is assumed to be chemically unchanged. Thecodisposal waste package is assumed to be fully reflected by water for all cases.
The degradation configurations presented in this section are for analyzing the effect of thegeneric degradation scenario group IP-1, i.e., SNF degrades faster than the other surroundingcomponents. As discussed in Sections 6.2.1.5 through 6.2.1.7, the degradations associated withIP-N are not probable since for Shippingport PWR the SNF is sealed inside the highly corrosionresistant material of Zircaloy-4, which is considered inert.
7.4.2.1 Partially Degraded Fuel Cluster In the Intact DOE SNF Canister
The fuel cluster is partially degraded and U02 -ZrO2 -CaO is redistributed into the coolantchannels and the cruciform areas as well as into the central-basket area of the canister. Thecentral-basket area is the central square area excluding the fuel cluster. The intact waste packagerepresentation of Figure 7-1 gives a representation of this partial fuel degradation case. Theredistributed fuel (ranging from 10 to 99% of the total fuel mass) is mixed with water in thecoolant channel, the cruciform, and/or central-basket areas. The remaing portion of the fuelmass stays inside the fuel plates. This configuration is described in Section 6.2.1.5 andcorresponds to the configuration class 6.
TDR-EDC-NU-000003 REV 00 68 February 2000
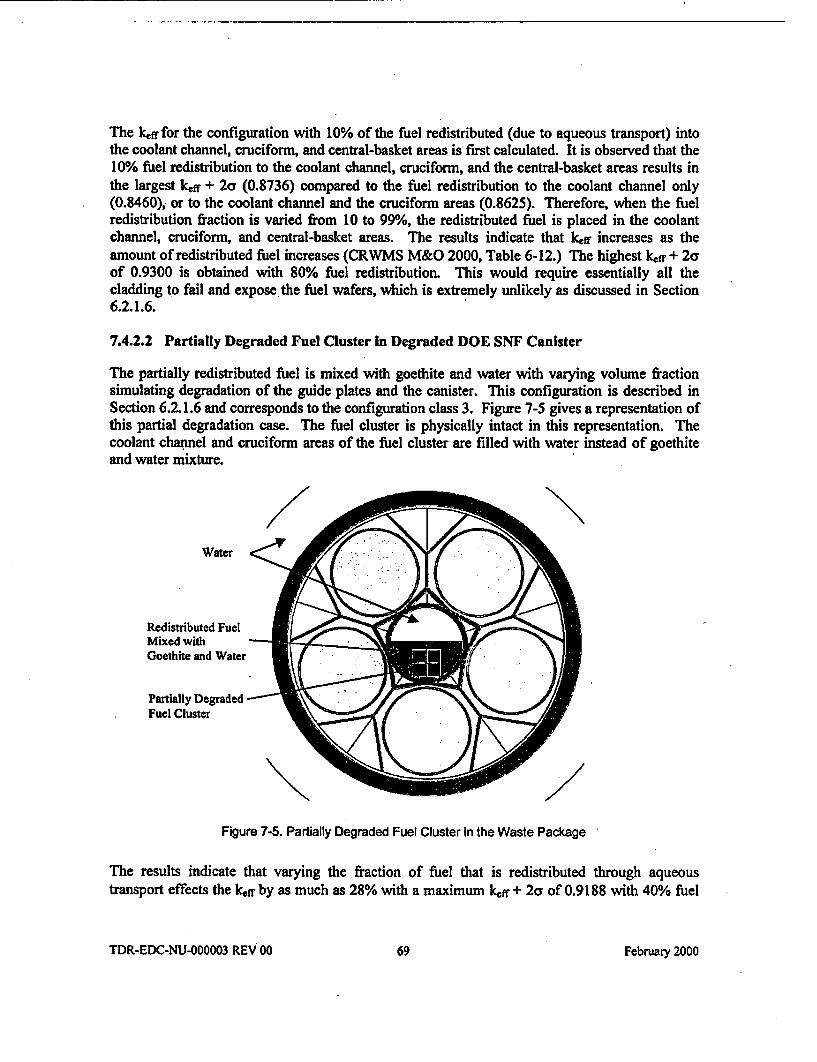
The k.fTfor the configuration with 10% of the fuel redistributed (due to aqueous transport) intothe coolant channel, cruciform, and central-basket areas is first calculated. It is observed that the10% fuel redistribution to the coolant channel, cruciform, and the central-basket areas results inthe largest keff + 2cr (0.8736) compared to the fuel redistribution to the coolant channel only(0.8460), or to the coolant channel and the cruciform areas (0.8625). Therefore, when the fuelredistribution fraction is varied from 10 to 99%, the redistributed fuel is placed in the coolantchannel, cruciform, and central-basket areas. The results indicate that kiff increases as theamount of redistributed fuel increases (CRWMS M&O 2000, Table 6-12.) The highest keff + 2crof 0.9300 is obtained with 80% fuel redistribution. This would require essentially all thecladding to fail and expose the fuel wafers, which is extremely unlikely as discussed in Section6.2.1.6.
7.4.2.2 Partially Degraded Fuel Cluster In Degraded DOE SNF Canister
The partially redistributed fuel is mixed with goethite and water with varying volume fractionsimulating degradation of the guide plates and the canister. This configuration is described inSection 6.2.1.6 and corresponds to the configuration class 3. Figure 7-5 gives a representation ofthis partial degradation case. The fuel cluster is physically intact in this representation. Thecoolant channel and cruciform areas of the fuel cluster are filled with water instead of goethiteand water mixture.
Water
Redistributed FuelMixed withGoethite and Water
Partially DegradedFuel Cluster
Figure 7-5. Partially Degraded Fuel Cluster in the Waste Package
The results indicate that varying the fraction of fuel that is redistributed through aqueoustransport effects the keff by as much as 28% with a maximum kff + 2cr of 0.9188 with 40% fuel
TDR-EDC-NU-000003 REV 00 69 February 2000
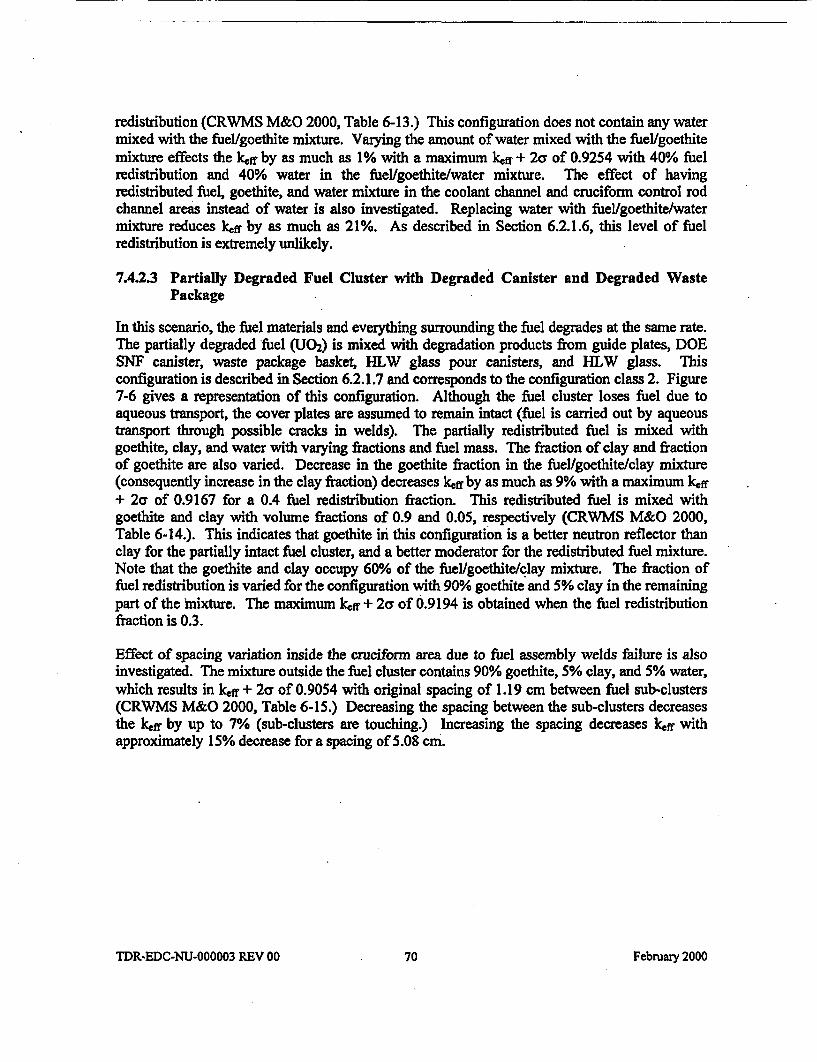
redistribution (CRWMS M&O 2000, Table 6-13.) This configuration does not contain any watermixed with the fuel/goethite mixture. Varying the amount of water mixed with the fuel/goethitemixture effects the kff by as much as 1% with a maximum k + 2a of 0.9254 with 40% fuelredistribution and 40% water in the fuel/goethite/water mixture. The effect of havingredistributed fuel, goethite, and water mixture in the coolant channel and cruciform control rodchannel areas instead of water is also investigated. Replacing water with fuel/goethite/watermixture reduces kff by as much as 21%. As described in Section 6.2.1.6, this level of fuelredistribution is extremely unlikely.
7.4.2.3 Partially Degraded Fuel Cluster with Degraded Canister and Degraded WastePackage
In this scenario, the fuel materials and everything surrounding the fuel degrades at the same rate.The partially degraded fuel (U0 2 ) is mixed with degradation products from guide plates, DOESNF canister, waste package basket, HLW glass pour canisters, and HLW glass. Thisconfiguration is described in Section 6.2.1.7 and corresponds to the configuration class 2. Figure7-6 gives a representation of this configuration. Although the fuel cluster loses fuel due toaqueous transport, the cover plates are assumed to remain intact (fuel is carried out by aqueoustransport through possible cracks in welds). The partially redistributed fuel is mixed withgoethite, clay, and water with varying fractions and fuel mass. The fraction of clay and fractionof goethite are also varied. Decrease in the goethite fraction in the fuel/goethite/clay mixture(consequently increase in the clay fraction) decreases kff by as much as 9% with a maximum kff+ 2a of 0.9167 for a 0.4 fuel redistribution fraction. This redistributed fuel is mixed withgoethite and clay with volume fractions of 0.9 and 0.05, respectively (CRWMS M&O 2000,Table 6-14.). This indicates that goethite in this configuration is a better neutron reflector thanclay for the partially intact fuel cluster, and a better moderator for the redistributed fuel mixture.Note that the goethite and clay occupy 60% of the fuelgoethitel/lay mixture. The fraction offuel redistribution is varied for the configuration with 90% goethite and 5% clay in the remainingpart of the mixture. The maximum kefr + 2a of 0.9194 is obtained when the fuel redistributionfraction is 0.3.
Effect of spacing variation inside the cruciform area due to fuel assembly welds failure is alsoinvestigated. The mixture outside the fuel cluster contains 90% goethite, 5% clay, and 5% water,which results in kff + 2cr of 0.9054 with original spacing of 1.19 cm between fuel sub-clusters(CRWMS M&O 2000, Table 6-15.) Decreasing the spacing between the sub-clusters decreasesthe kdr by up to 7% (sub-clusters are touching.) Increasing the spacing decreases kff withapproximately 15% decrease for a spacing of 5.08 cm.
TDR-EDC-NU-000003 REV 00 70 February 2000
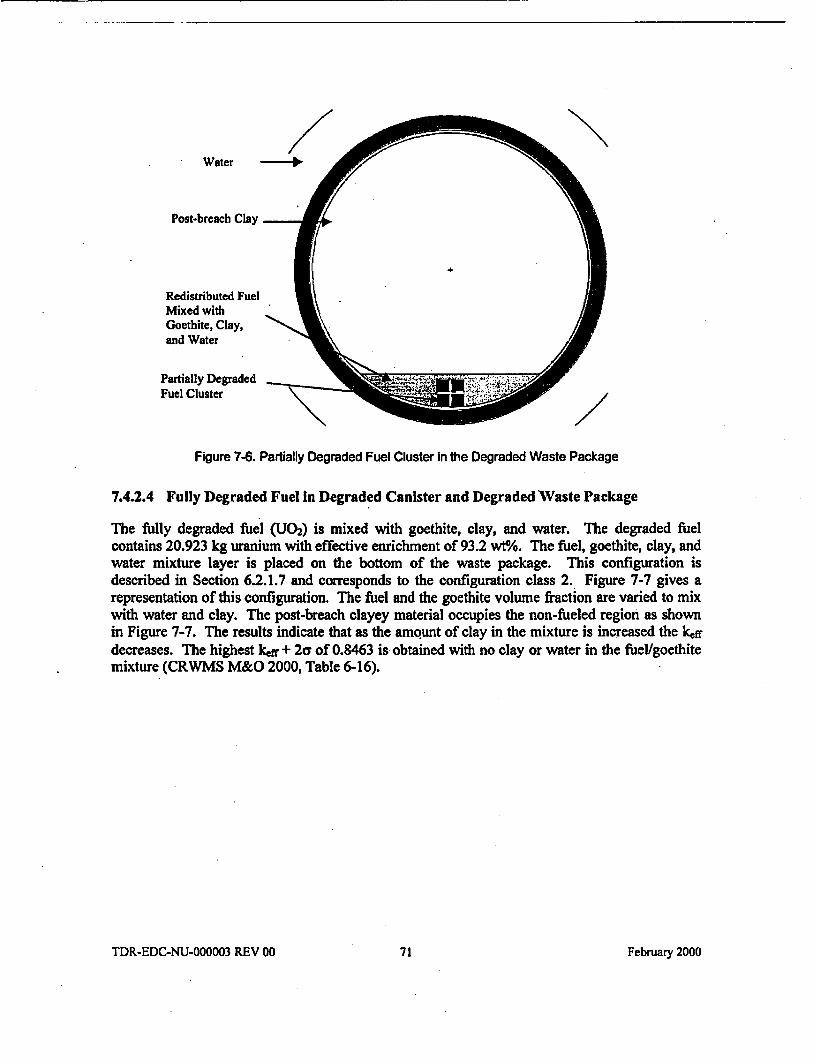
Water
Post-breach Clay
Redistributed FuelMixed wiho N/Goethite, Clay,and Water H
Partially Degraded ;4
Fuel Cluster
Figure 7-6. Partially Degraded Fuel Cluster in the Degraded Waste Package
7.4.2.4 Fully Degraded Fuel In Degraded Canister and Degraded Waste Package
The fully degraded fuel (U02 ) is mixed with goethite, clay, and water. The degraded fuelcontains 20.923 kg uranium with effective enrichment of 93.2 wt%. The fuel, goethite, clay, andwater mixture layer is placed on the bottom of the waste package. This configuration isdescribed in Section 6.2.1.7 and corresponds to the configuration class 2. Figure 7-7 gives arepresentation of this configuration. The fuel and the goethite volume fraction are varied to mixwith water and clay. The post-breach clayey material occupies the non-fueled region as shownin Figure 7-7. The results indicate that as the amount of clay in the mixture is increased the kiffdecreases. The highest kff + 2o of 0.8463 is obtained with no clay or water in the fuel/goethitemixture (CRWMS M&O 2000, Table 6-16).
TDR-EDC-NU-000003 REV 00 71 February 2000
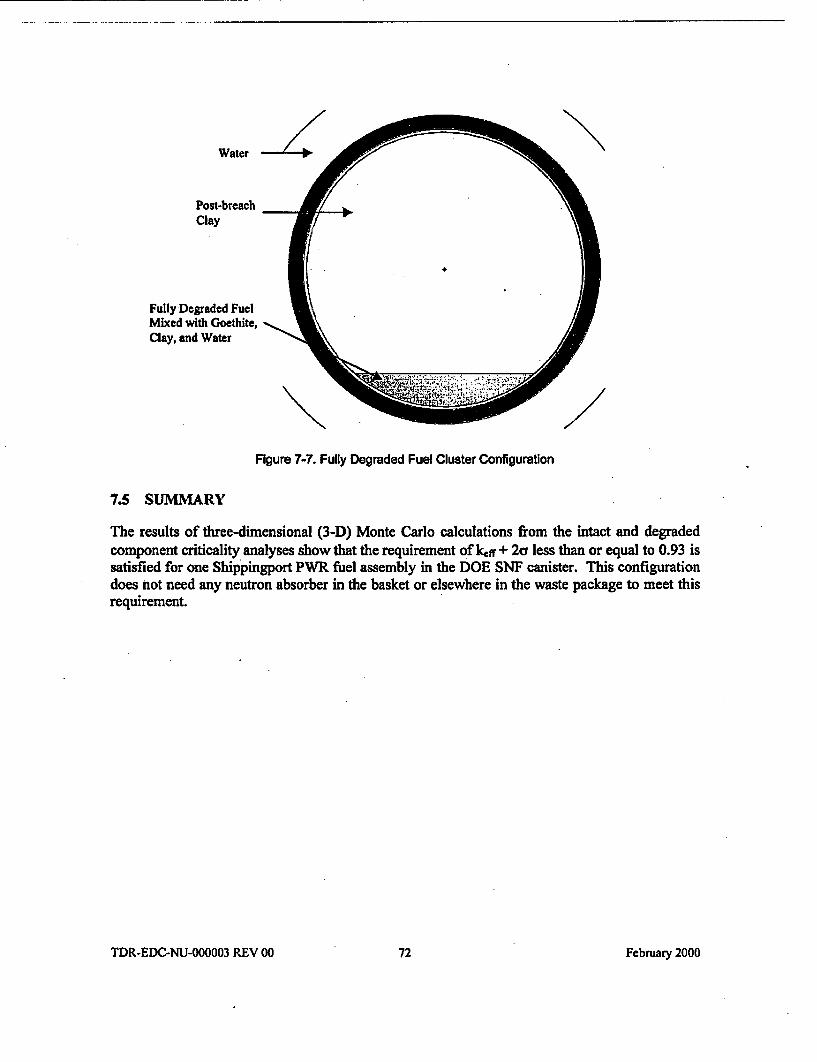
Water
Post-breach F/Clay
Fully Degraded FuelMixed with Goethite,Clay, and Water
Figure 7-7. Fully Degraded Fuel Cluster Configuration
7.5 SUMMARY
The results of three-dimensional (3-D) Monte Carlo calculations from the intact and degradedcomponent criticality analyses show that the requirement of k~fr + 2a less than or equal to 0.93 issatisfied for one Shippingport PWR fuel assembly in the DOE SNF canister. This configurationdoes not need any neutron absorber in the basket or elsewhere in the waste package to meet thisrequirement.
TDR-EDC-NU-000003 REV 00 72 February 2000
8. CONCLUSIONS
This document and its conclusions may be affected by technical product input information thatrequires confirmation. Any changes to the document or its conclusions that may occur as a resultof completing the confirmation activities will be reflected in subsequent revisions. The status ofthe input information quality may be confirmed by review of the Document Input ReferenceSystem database.
8.1 STRUCTURAL ANALYSIS
The results from the 2-D FEA calculations given in Section 3.3 show that there is sufficientclearance between the inner diameter of the support tube and the outer diameter of the DOE SNFcanister for the DOE SNF canister to be removed from the waste package after a tipover DBE,which results in the bounding dynamic load.
The maximum deformations in each component of the waste package are acceptable. The outerbarrier is directly exposed to a dynamic impact with an essentially unyielding surface.Therefore, local plastic deformations are unavoidable on the outer surface. Similarly, the basketsupport structure receives the direct impacts- of the pour canisters, which result in limitedpermanent deformations of the basket plates.
The results given in Section 3.3.2 show that there would be no interference between the fuelassembly and the basket structure inside the DOE SNF canister. Thus, the waste package will beable to be unloaded after a tipover DBE.
In the light of the above discussions, it is concluded that the performance of the 5-DHLW/DOESpent Fuel-Long waste package design is structurally acceptable when exposed to a tipoverevent, which is the bounding DBE within the criteria specified in the SDD, as long as the 2,721kg mass limit for the loaded DOE SNF canister is not exceeded.
The SDD criteria for structural calculations (SDD 1.2.2.1.3, SDD 1.2.2.1A, and SDD 1.2.2.1.6),cited in Section 2.2.1, have TBV-245. The analysis of the results indicates that the wastepackage will withstand the events mentioned in the structural criteria by meeting the limits by amargin of more than a factor of two. Therefore, the TBV-245 is non-critical and is not carriedthrough the conclusions in this section.
8.2 THERMAL ANALYSIS
Based on the 2-D FEA calculations given in Section 4, the Shippingport PWR waste packagesatisfies all relevant governing criteria, as listed in Table 8-1. The maximum temperatures areshown in Table 8-1. The HLW glass dominates the thermal heat output of the waste package.
TDR-EDC-NU-000003 REV 00 73 February 2000
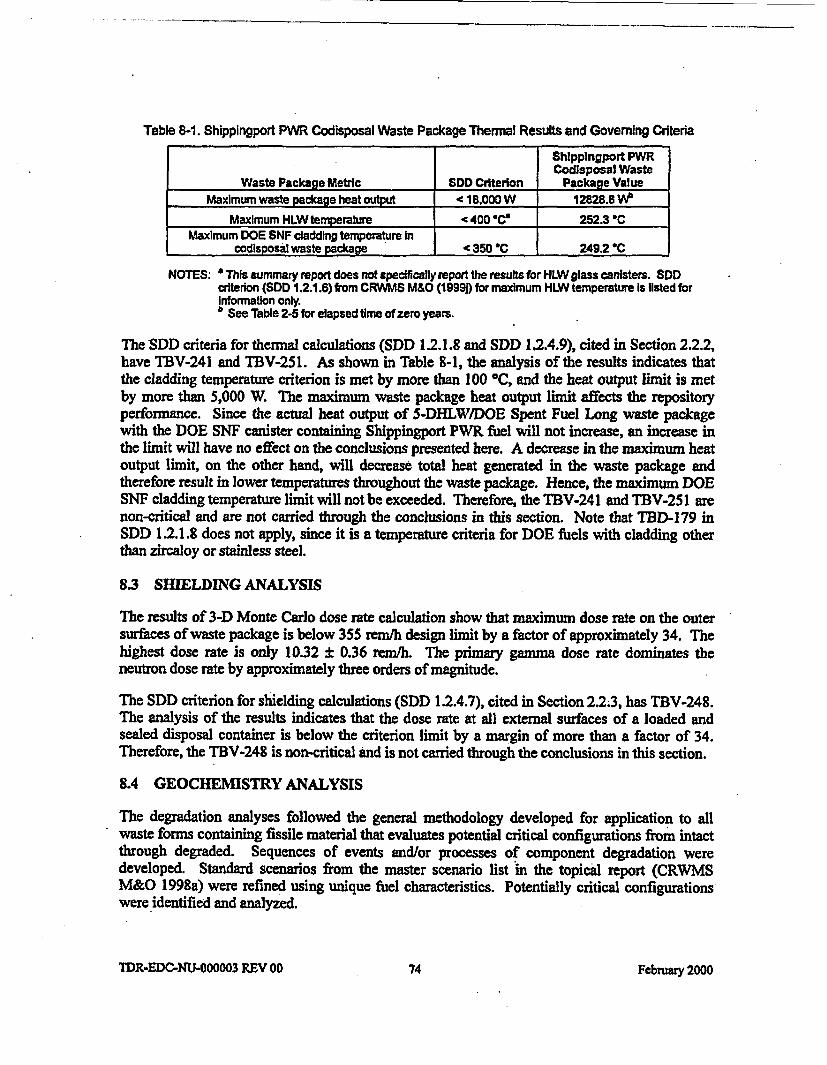
Table 8-1. Shippingport PWR Codisposal Waste Package Thermal Results and Governing Criteria
ShIppingport PWRCodisposal Waste
Waste Package Metric SDD Criterion Package ValueMaximum waste package heat output 'c 18,000 W 12828.8 W
Maximum HLW temperature '400 sC 252.3 *CMaximum DOE SNF cladding temperature In
codisposal waste package C 350 'C 2492 C
NOTES: * This summary report does not specifically report the results for HLW glass canisters. SDDcriterion (SDD 1.2.1.6) from CRWMS M&O (1999j) for maximum HLW temperature Is listed forInformation only.b See Table 2-5 for elapsed time of zero years.
The SDD criteria for thermal calculations (SDD 1.2.1.8 and SDD 1.2A.9), cited in Section 2.2.2,have TBV-241 and TBV-25 1. As shown in Table 8-1, the analysis of the results indicates thatthe cladding temperature criterion is met by more than 100 'C, and the heat output limit is metby more than 5,000 W. The maximum waste package heat output limit affects the repositoryperformance. Since the actual heat output of 5-DHLW/DOE Spent Fuel Long waste packagewith the DOE SNF canister containing Shippingport PWR fuel will not increase, an increase inthe limit will have no effect on the conclusions presented here. A decrease in the maximum heatoutput limit, on the other hand, will decrease total heat generated in the waste package andtherefore result in lower temperatures throughout the waste package. Hence, the maximum DOESNF cladding temperature limit will not be exceeded. Therefore, the TBV-241 and TBV-251 arenon-critical and are not carried through the conclusions in this section. Note that TBD-179 inSDD 1.2.1.8 does not apply, since it is a temperature criteria for DOE fuels with cladding otherthan zircaloy or stainless steel.
8.3 SHIELDING ANALYSIS
The results of 3-D Monte Carlo dose rate calculation show that maximum dose rate on the outersurfaces of waste package is below 355 rem/h design limit by a factor of approximately 34. Thehighest dose rate is only 10.32 ± 0.36 rem/h. The primary gamma dose rate dominates theneutron dose rate by approximately three orders of magnitude.
The SDD criterion for shielding calculations (SDD 1.2.4.7), cited in Section 2.2.3, has TBV-248.The analysis of the results indicates that the dose rate at all external surfaces of a loaded andsealed disposal container is below the criterion limit by a margin of more than a factor of 34.Therefore, the TBV-248 is non-critical and is not carried through the conclusions in this section.
8.4 GEOCHEMISTRY ANALYSIS
The degradation analyses followed the general methodology developed for application to allwaste forms containing fissile material that evaluates potential critical configurations from intactthrough degraded. Sequences of events and/or processes of component degradation weredeveloped. Standard scenarios from the master scenario list in the topical report (CRWMSM&O 1998a) were refined using unique fuel characteristics. Potentially critical configurationswere identified and analyzed.
TDR-EDC-NU-000003 REV 00 74 February 2000
When the glass is allowed to degrade rapidly, the alkaline conditions produce high uranium loss(up to 100%), reducing the chances of internal criticality.
8.5 INTACT AND DEGRADED COMPONENT CRITICALITY ANALYSES
All aspects of intact and degraded configurations, including optimum moderation conditions,water intrusion into the fuel plates, and positioning of the fuel assembly were investigated. Theresults of 3-D Monte Carlo calculations from the intact and degraded component criticalityanalyses show that the requirement of keff + 2a less than or equal to 0.93 is satisfied for oneShippingport PWR fuel assembly in the DOE SNF canister. This configuration does not needany neutron absorber in the basket or elsewhere in the waste package to meet this requirement.With this design, there will be approximately 20 DOE SNF canisters with Shippingport PWRSNF (C2 S2), which corresponds to 20 waste packages.
A number of parametric analyses were run to address or bound the configuration classesdiscussed in Section 6.2.1. These parametric analyses addressed identification of optimummoderation, optimun spacing, and optimum fissile concentration.
The results from the criticality analysis for the degraded DOE SNF canister (fissile materialdistributed in the waste package) indicate that the highest kff is achieved if the fuel and claylayers do not mix. Therefore, the amount of clay in the waste package has no effect on thebounding case, which is a layer of optimally moderated fuel not mixed with any clay. Althoughvarying the amount of water mixed with the fuel changes the kff, the peak kff + 2cr of the systemis less than 0.85, which is well below the interim critical limit.
The SDD criterion for criticality calculations (SDD 1.2.1.5), cited in Section 2.2.5, has TBD-235. Intact and degraded component criticality calculations include variations on moderatorsand moderator densities, which encompass flooding the waste package. Occurrence of designbasis events, including those with the potential for flooding the disposal container prior todisposal container sealing, is considered and analyzed by making very conservative assumptionsthrough many different intact and degraded configurations. Therefore, the TBD-235 is non-critical and is not carried through the conclusions in this section.
8.6 ITEMS IMPORTANT TO SAFETY
As part of the criticality licensing strategy, items that are important to safety will be identifiedduring evaluation of the representative fuel type designated by the NSNFP. As a result of theanalyses performed for the evaluation of the codisposal viability of HEU oxide (ShippingportPWR) DOE-owned fuel, several items are identified as important to safety. DOE SNF canistershell is naturally an item that is important to safety since it confines the fissile elements to aspecific geometry and location within the waste package. The basket that was designed for theDOE SNF canister containing the Shippingport PWR fuel is also an important safety item sinceit confines the fissile elements to a specific geometry and location within the DOE SNF canister.The DOE SNF canister basket also provides moderator displacement, and thermal neutronabsorption due to its high iron content. The DOE SNF canister loaded weight, which must beless than 2,721 kg, is also an important safety item.
TDR-EDC-NU-000003 REV 00 75 February 2000
The degraded configurations bound the other types of HEU oxide fuels as long as the limits onmass of uranium and its enrichment, and the linear density are not exceeded. As shown inSection 7, the degraded configurations with a partially degraded fuel assembly bound (morereactive than) the intact configurations. The degraded configurations include varying degrees ofdegradation resulting in many different geometric configurations and fissile distributions. Inaddition, Paxton et al. (1987, Fig. I 1, Fig. 12 and Fig. 13) indicates that as the density of the fuelregion decreases the radius of the fuel region must increase to sustain criticality. For a fixedamount of fuel and constant volume, this implies that as the density of the fuel decreases the fuelregion must become shorter and thicker (greater radius), which is a more favorable geometry, tomaintain the same k4 ff. If the amount of fuel also decreases, kff will decrease. Due to the fissilelimit, if the fuel length increases, either the density or the radius or both must decrease. If thedensity decreases (and the radius is kept constant), according to Paxton et al. (1987) the radiusmust increase to maintain the same kdr which conflicts with the requirement that the radius iskept constant Similarly, if the radius decreases (and the density is kept constant), then thedensity must increase to maintain the same kff which again conflicts with the requirement thatthe density is kept constant. If both radius and density decrease, then the system is less reactive.Therefore, longer fuels as well as the fuels with smaller density in this group are bounded by thisanalysis. If, however, the fuel is shorter than the Shippingport PWR SNF, then the linear densityof the fuel (g/cm) must be less than or equal to the linear density of the Shippingport PWR SNF.It is very unlikely that the fuel inventory in the HEU oxide fuel group will have any fuels thatwill exceed the linear density of the representative HEU oxide fuel, which is the ShippingportPWR SNF.
Hence, the total mass of fissile element (U-235) should not exceed the mass used in deriving theconclusions in this report, which is 19.5 kg of U-235 per DOE SNF canister, with total U-235 toU-238 ratio of 13.7 (93.5% enriched in U-235), or less. In addition, the linear density of the fuel(U-235) should not exceed 79 g/cm, which is calculated by dividing the total fuel mass (19.5 kgU-235) by the active fuel length (246.38 cm).
The shielding source terms and thermal heat output of the fuel assemblies must not exceed theones used in the analyses. Specifically, the total gamma sources from the HLW glass and thefuel assembly must not exceed 5.6962E+15 gammas/sec/canister and 1.4434E+15gammas/sec/assembly, respectively. HLW glass thermal output should be below the limitrequired by the applicable SDD, not to exceed 2,540 W per HLW glass canister. Alternatively, itmust be demonstrated that HLW glass canisters and/or fuel assemblies with higher shieldingsource terms or thennal heat outputs will not result in violation of the required criteria.
TDR-EDC-NU-000003 REV 00 76 Febnrumy 2000
9. REFERENCES
9.1 DOCUMENTS CITED
Allen, E.J. 1978. Criticality Analysis ofAggregations ofActinidesfrom Commercial NuclearWaste in Geological Storage. ORNLIM4-6458. Oak Ridge, Tennessee: Oak Ridge NationalLaboratory. TIC: 229251.
Bibler, N.E.; Ray, J.W.; Fellinger, T.L.; Hodoh, O.B.; Beck, R.S.; and Lien, O.G. 1998.Characterization of Radioactive Glass Currently Being Produced by the Defense WasteProcessing Facility at Savannah River Site.. WSRC-MS-97-00617. Aiken, South Carolina:Westinghouse Savannah River. TIC: 240859.
Briesmeister, J.F., ed. 1997. MCNP-A General Monte Carlo N-Particle Transport Code. LA-12625-M, Version 4B. Los Alamos, New Mexico: Los Alamos National Laboratory. ACC:MOL.19980624.0328.
Creer, J.M.; Michener, T.E.; McKinnon, M.A.; Tanner, JE.; Gilbert, E.R.; Goodman, R.L.;Dziadosz, D.A.; Moore, E.V.; McKay, H.S.; Batalo, D.P.; Schoonen, D.H.; Jensen, .M.F.; andMullen, C.K. 1987. The TN-24P PWR Spent-Fuel Storage Cask.: Testing and Analyses. EPRINP-5128. Palo Alto, California: Electric Power Research Institute. TIC: 228305.
CRWMS M&O (Civilian Radioactive Waste Management System Management and OperatingContractor) 1995a. Thermal Evaluation of the Conceptual DHLLWDisposal Container.BBACOOOOO-01717-0200-00002 REV 00. Las Vegas, Nevada: CRWMS M&O. ACC:MOL.19960626.0161.
CRWMS M&O 1995b. Total System Performance Assessment - 1995: An Evaluation of thePotential Yucca Mountain Repository. BOOOOOOOO-01717-2200-00136 REV 01. Las Vegas,Nevada:CRWMSM&O. ACC: MOL.19960724.0188.
CRWMS M&O 1996. Second Waste Package Probabilistic Criticality Analysis: Generation andEvaluation of Internal Criticality Configurations. BBAOOOOOO-01717-2200-00005 REV 00. LasVegas, Nevada: CRWMS M&O. ACC: MOL.19960924.0193.
CRWMS M&O 1997a. WastePackageMaterialsSelectionAnalysis. BBAOOOOOO-01717-0200-00020 REV 01. Las Vegas, Nevada: CRWMS M&O. ACC: MOL.19980324.0242.
CRWMS M&O 1997b. DHLW Canister Source Termsfor Waste Package Design.BBAOOOOO-01717-0200-00025 REV 00. Las Vegas, Nevada: CRWMS M&O. ACC:MOL.19970711.0019.
CRWMS M&O 1997c. Criticality Evaluation of Degraded Internal Configurations for the PWRAUCF WP Designs. BBAOOOOOO-01717-0200-00056 REV 00. Las Vegas, Nevada: CRWMSM&O. ACC: MOL.19971231.0251.
TDR-EDC-NU-000003 REV 00 77 February 2000
CRWMS M&O 1997d. MCNP Evaluation of Laboratory Critical Experiments: HomogeneousMixture Criticals. BBAOOOOOO-01717-0200-00045 REV 00. Las Vegas, Nevada: CRWMSM&O. ACC: MOL.19971230.0134.
CRWMS M&O 1997e. Waste Package Design Basis Events. BBAOOOOOO-01717-0200-00037REV 00. Las Vegas, Nevada: CRWMS M&O. ACC: MOL.19971006.0075.
CRWMS M&O 1998a. Disposal Criticality Analysis Methodology Topical Report. BOOOOOOOO-01717-5705-00095 REV 00. Las Vegas, Nevada: CRWMS M&O. ACC:MOL.19980918.0005.
CRWMS M&O 1998b. 5-High Level Waste DOE Spent Fuel Waste Package StructuralCalculations. BBAOOOOO-01717-0210-00021 REV 00. Las Vegas, Nevada: CRWMS M&O.ACC: MOL.19981006.0187.
CRWMS M&O 1998c. Dose Calculationsfor the Co-Disposal WP ofHL W Canisters and theFast Flux Test Facility (FFTF) Fuel. BBAOOOOOO-01 717-0210-00019 REV 00. Las Vegas,Nevada: CRWMS M&O. ACC: MOL.19990129.0075.
CRWMS M&O 1998d. Multiple WP Emplacement Thermal Response - Suite 1. BBAOOOOOO-01717-0210-00001 REV 00. Las Vegas, Nevada: CRWMS M&O. ACC:MOL.19980807.0311.
CRWMS M&O 1998e. EQ6 Calculationsfor Chemical Degradation of Fast Flux Test Facility(FFTFi) Waste Packages. BBAOOOOOO-01717-0210-00028 REV 00. Las Vegas, Nevada:CRWMS M&O. ACC: MOL.19981229.0081.
CRWMS M&O 1998f. EQ6 Calculationsfor Chemical Degradation of Pu-Ceramic WastePackages. BBAOOOOOO-01717-0210-00018 REV 00. Las Vegas, Nevada: CRWMS M&O.ACC: MOL. 19980918.0004.
CRWMS M&O 1998g. Complete Draft VA UZAbstractionlTest Document. BOOOOOOOO-01717-2200-00201. Las Vegas, Nevada: CRWMS M&O. ACC: MOL.19980428.0202.
CRWMS M&O 1998b. DOE Spent Nuclear Fuel Disposal Container System DescriptionDocument. BBAOOOOOO-01717-1705-00003 REV 00. Two volumes. Las Vegas, Nevada:CRWMSM&O. ACC: MOL.19981214.0036.
CRWMS M&O 1998i. Software Qualification Reportfor MCNP Version 4B2 A General MonteCarlo N-Particle Transport Code. CSCI: 30033 V4B2LV. DI: 30033-2003 Rev. 01. LasVegas, Nevada: CRWMS M&O. ACC: MOL.19980622.0637.
CRWMS M&O 1998;. Software Qualfication Reportfor ANSYS V5.4, A Finite Element Code.CSCI: 30040 V5.4. DI: 30040-2003, Rev. 00. Las Vegas, Nevada: CRWMS M&O. ACC:MOL.19980609.0847.
TDR-EDC-NU-000003 REV 00 78 February 2000
CRWMS M&O 1998k Calculation of the Effect ofSource Geometry on the 21-PWR WP DoseRates. BBACOOOOO-01717-0210-00004 REV 00. Las Vegas, Nevada: CRWMS M&O. ACC:MOL.19990222.0059.
CRWMS M&O 1998m. Software Qualification Report (SQR) Addendum to Existing LLNLDocument UCRL-AL-110662 PT IV Implementation of a Solid-Centered Flow-Through Modefor EQ6 Version 7.2B. CSCI: UCRL-MA-1 10662 V 7.2b. SCR: LSCR198. Las Vegas, Nevada:CRWMS M&O. ACC: MOL.19990920.0169.
CRWMS M&O 1999a. FY99 Criticality DOE SNF, 2101 9076 M3. Activity Evaluation, March5,1999. LasVegas,Nevada:CRWMSM&O.ACC: MOL.19990330.0477.
CRWMS M&O 1999b. Structural Calculationsfor the Codisposal of Shippingport SpentNuclear Fuel in a Waste Package. BBA000000-01717-0210-00050 REV 00. Las Vegas,Nevada: CRWMS M&O. ACC: MOL.19990505.0463.
CRWMS M&O 1999c. LCEfor Research Reactor Benchmark Calculations. B00000000-01717-0210-00034 REV 00. Las Vegas, Nevada: CRWMS M&O. ACC:MOL.19990329.0394.
CRWMS M&O 1999d. Laboratory Critical Experiment Reactivity Calculations. BOOOOOOOO-01717-0210-00018 REV 01. Las Vegas, Nevada: CRWMS M&O. ACC:MOL.19990526.0294.
CRWMS M&O 1999e. EQ6 Calculationsfor Chemical Degradation of ShIppingport PWR(HEU Oxide) Spent Nuclear Fuel Waste Packages. CAL-EDC-MD-000002 REV 00. LasVegas, Nevada: CRWMS M&O. ACC: MOL.19991220.0322.
CRWMS M&O 1999f. Thzermal Evaluation of the Shippingport PWR Codisposal WastePackage. BBAOOOOOO-01 717-0210-00053 REV 00. Las Vegas, Nevada: CRWMS M&O.ACC: MOL.19990609.0069.
CRWMS M&O 1999g. not used.
CRWMS M&O 1999h. Dose Calculationfor the Co-Disposal WP of HL W Canisters and theShippingport PWR Fuel. BBACOOOOO-01 717-0210-00012 REV 00. Las Vegas, Nevada:CRWMS M&O. ACC: MOL.19990517.0010.
CRWMS M&O 1999i. not used
CRWMS M&O 1999j. Defense High Level Waste Disposal Container System DescriptionDocument. SDD-DDC-SE-000001 REV 00. Las Vegas, Nevada: CRWMS M&O. ACC:MOL.19991217.0510.
CRWMS M&O 1999k Generic Degradation Scenario and Configuration Analysisfor DOECodisposal Waste Package. BBA000000-01717-0200-00071 REV 00. Las Vegas, Nevada:CRWMSM&O. ACC: MOL.19991118.0180.
TDR-EDC-NU-000003 REV 00 79 February 2000
CRWMS M&O 19991. DOE Spent Nuclear Fuel (SNF), 2101 2310 M1-M8 ActivityEvaluation, October 1, 1999. Las Vegas, Nevada: CRWMS M&O. ACC: MOL.19991001.0154.
CRWMS M&O 1999m. Thermal Evaluation of the FFTFCodisposal Waste Package.BBAAO0000-01717-0210-00012 REV 00. Las Vegas, Nevada: CRWMS M&O. ACC:MOL.19990505.0446.
CRWMS M&O 2000. Intact and Degraded Criticality Calculations for the Codisposal ofShippingport PWR Fuel in a Waste Package. CAL-EDC-NU-000002 REV 00. Las Vegas,Nevada: CRWMS M&O. ACC: MOL.20000209.0233.
DOE (U.S. Department of Energy) 1992. Characteristics ofPotental Repository Wastes.DOE/RW-01 84-RI. Volume 1. Washington, D. C.: U.S. Department of Energy, Office ofCivilian Radioactive Waste Management. ACC: HQO. 19920827.0001.
DOE 1998a. Preliminary Design Conceptfor the Repository and Waste Package. Volume 2 ofViabilityAssessment of a Repository at Yucca Mountain. DOE/RW-0508. Washington, DC:U.S. Department of Energy, Office of Civilian Radioactive Waste Management. ACC:MOL.19981007.0029.
DOE 1998b. "Design Specification." Volume 1 of Preliminary Design SpecificationforDepartment of Energy Standardized Spent Nuclear Fuel Canisters. DOE/SNF/REP-0 1, Rev. 1.Washington, DC: U.S. Department of Energy, Office of Spent Fuel Management and SpecialProjects. TIC: 241528.
DOE 1999a. Shippingport PWR (HEU Oxide) Fuel Characteristicsfor Disposal CriticalityAnalysis. DOE/SNF/REP-040, Rev. 0. Washington, DC: U.S. Department of Energy. TIC:243528.
DOE 1999b. "Design Specification." Volume 1 of Preliminapy Design SpecyficationforDepartmentofEnergyStandardizedSpentNuclearFuel Canisters. DOE/SNF/REP-011,Rev. 3.Washington, D.C.: U.S. Department of Energy, Office of Spent Fuel Management and SpecialProjects. TIC: 246602.
DOE 2000. Quality Assurance Requirements and Description. DOE/RW-0333P, Rev. 9.Washington, DC: U.S. Department of Energy, Office of Civilian Radioactive WasteManagement. ACC: MOL.19991028.0012.
Hillner, E.; Franldin, D.G.; and Smee, J.D. 1998. The Corrosion of Zircaloy-Clad FuelAssemblies in a Geologic Repository Environment. WAPD-T-3173. West Mifflin,Pennsylvania: Bettis Atomic Power Laboratory. TIC: 237127.
LLNL (Lawrence Livermore National Laboratory) 1998. Plutonium Immobilization ProjectDatafor Yucca Mountain Total Systems PerformanceAssessment, Rev. 1. PIP 98-012.Livermore, California: Lawrence Livermore National Laboratory. ACC: MOL.19980818.0349.
TDR-EDC-NU-000003 REV 00 so February 2000
NEA (Nuclear Energy Agency) 1998. International Handbook ofEvaluated Criticality SafetyBenchmark Experiments. NEA/NSC/DOC(95)03. Paris, France: Nuclear Energy Agency. TIC:243013.
Parrington, J.R.; Knox, H.D.; Brenaman, S.L.; Baum, E.M.; and Feiner, F. 1996. Nuclides andIsotopes, Chart of Nuclides. 15"h Edition. San Jose, California: General Electric Company andKAPL, Inc. TIC: 233705.
Paxton, H.C. and Pruvost, N.L. 1987. Critical Dimensions of Systems Containing 235U, 239Puand 233U LA-i 0860-MS. Los Alamos, New Mexico: Los Alamos National Laboratory. TIC:209447.
Stout, R.B. and Leider, HR., eds. 1991. Preliminary Waste Form Characteristics Report.Version 1.0. Livermore, California: Lawrence Livermore National Laboratory. ACC:MOL.19940726.0118.
Taylor, W.J. 1997. "Incorporating Hanford 15 Foot (4.5 meter) Canister into CivilianRadioactive Waste Management System (CRWMS) Baseline." Memorandum from W.J. Taylor(DOE) to J. Williams (Office of Waste Acceptance and Storage and Transportation), April 2,1997. ACC: HQP.19970609.0014.
9.2 STANDARDS
ASM International 1990. Properties and Selection: Irons, Steels, and High Performance Alloys.Volume 1 of Metals Handbook. 10th Edition. Metals Park, Ohio: ASM International. TIC:245666.
ASME. 1995. 1995 ASME Boiler and Pressure Vessel Code. New York, New York: AmericanSociety of Mechanical Engineers. Readily available.
ASTM A 240/A 240M-97a. 1997. Standard Specificationfor Heat-Resisting Chromium andChromium-Nickel Stainless Steel Plate, Sheet, and Stripfor Pressure Vessels. WestConshohocken, Pennsylvania: American Society for Testing and Materials. Readily available.
ASTM A 276-91a. 1991. Standard Specification for Stainless and Heat-ResistingSteel Barsand Shapes. Philadelphia, Pennsylvania: American Society for Testing and Materials. Readilyavailable.
ASTM A 516/A 516M-90. 1991. Standard Specif cation for Pressure Vessel Plates, CarbonSteel, for Moderate- and Lower-Temperature Service. Philadelphia, Pennsylvania: AmericanSociety for Testing and Materials. Readily available.
ASTM B 575-94. 1994. Standard Specification for Low-Carbon Nickel-Molybdenum-Chromium, Low-Carbon Nickel-Chromium-Molybdenum, and Low-Carbon Nickel-Chromium-Molybdenum-Tungsten Alloy Plate, Sheet, and Strip. Philadelphia, Pennsylvania: AmericanSociety for Testing and Materials. Readily available.
TDR-EDC-NU-000003 REV 00 91 February 2000
ASTM G 1-90 (Reapproved 1999). 1990. Standard Practice for Preparing Cleaning, andEvaluating Corrosion Test Specimens. Philadelphia, Pennsylvania: American Society forTesting and Materials. Readily available.
9.3 SOURCE DATA
LL980711104242.054. Report of the Committee to Review the Use of J-1 3 Well Water inNevada Nuclear Waste Storage Investigations. Submittal date: 08/05/1998.
TDR-EDC-NU-000003 REV 00 82 February 2000