Off-site Ratio Analysis for Insurance - AMF...Prudential Ratio Analysis for Insurance Financial...
49
Prudential Ratio Analysis for Insurance Financial Supervision Authority/World Bank Insurance Workshop Tirana, Albania December 5, 2006 Mr. Lalit Raina Mr. Rodney Lester Ms. Serap Oguz Gonulal Ms. Cara Zappala
Transcript of Off-site Ratio Analysis for Insurance - AMF...Prudential Ratio Analysis for Insurance Financial...
Prudential Ratio Analysisfor Insurance
Financial Supervision Authority/World Bank Insurance Workshop
Tirana, AlbaniaDecember 5, 2006
Mr. Lalit RainaMr. Rodney Lester
Ms. Serap Oguz GonulalMs. Cara Zappala

2
Course Contents
I. Supervisory ModelII. Solvency and EnforcementIII. Accounting ConceptsIV. IRIS Ratios for Albania

3
I. The Supervisory Model

4
Old StyleApproach
Evolution of Supervisory Approaches
Reconciliation of data, counting the securities, other detailed checking . . .
Find contraventions of the law,regardless of materiality ...
Source: L Savage

5
Risk BasedSupervision
Old StyleApproach
Evolution of Supervisory Approaches
Managementstyle, attitudeto risk, control environment, ...
Find contraventions of the law,regardless of materiality ...
BusinessStrategy
Reconciliation of data, counting the securities, other detailed checking . . .
Today we are concerned with assessing the degree of risk in the company's business operations – and how to reduce risk as required
6
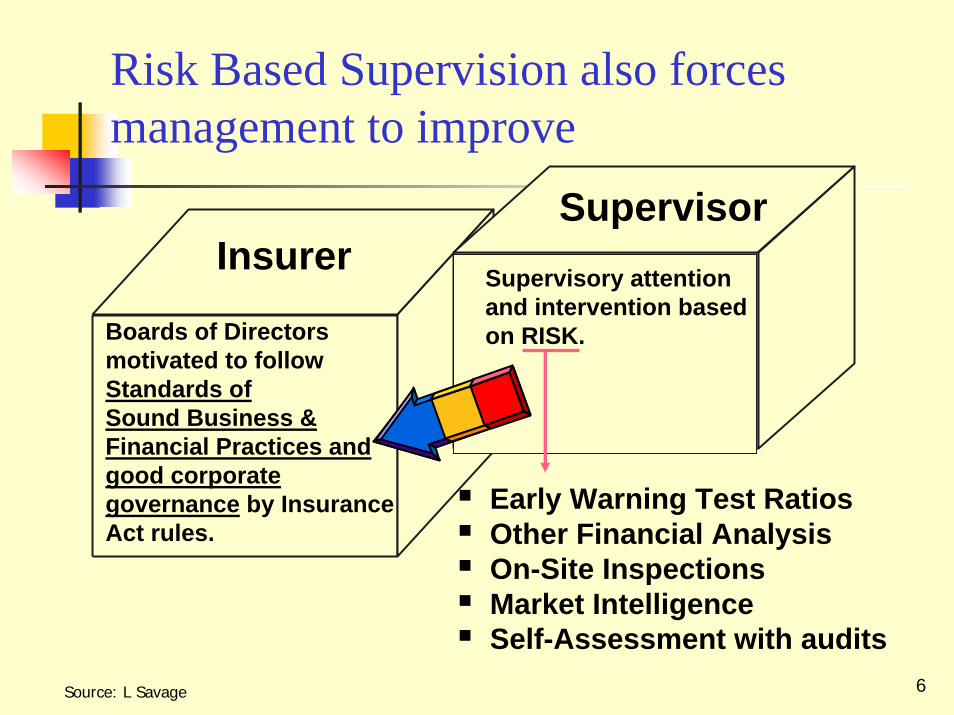
Boards of Directorsmotivated to followStandards ofSound Business & Financial Practices and good corporate governance by Insurance Act rules.
Supervisory attentionand intervention basedon RISK.
SupervisorInsurer
Early Warning Test RatiosOther Financial AnalysisOn-Site InspectionsMarket IntelligenceSelf-Assessment with audits
Risk Based Supervision also forces management to improve
Source: L Savage
7
Three fundamental stages of supervision
1. ‘Conducting off-site monitoring of financial condition using financial statement and market information analysis, and on-site examinations;
2. implementing corrective action plans for financially weakened companies; and
3. undertaking insolvency proceedings’

8
Two fundamental off-site tools
Early warning indicatorsOff-site monitoringGuiding on-site inspectionAdvising early intervention
Solvency measures Corrective action plansInsolvency proceedings

9
Some countries combine these into a regulatory ladder
Stage 0 - No problems/Normal activities Stage 1 - Early warning Stage 2 - Risk to financial viability or solvency Stage 3 - Future financial viability in serious doubt Stage 4 - Company not viable/Insolvency imminent
10
Early warning indicators – Off-site Analysis
IRIS, or Insurance Regulatory Information System -ratios A scoring system An insurer profile system
11
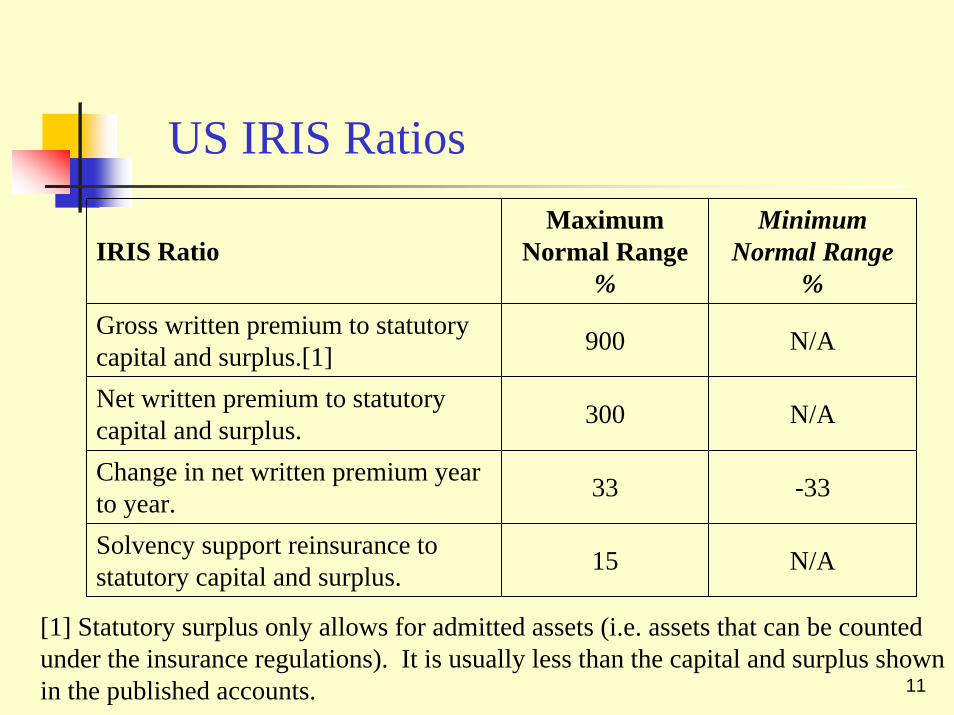
US IRIS Ratios
IRIS RatioMaximum
Normal Range%
Minimum Normal Range
%Gross written premium to statutory capital and surplus.[1] 900 N/A
Net written premium to statutory capital and surplus. 300 N/A
Change in net written premium year to year. 33 -33
Solvency support reinsurance to statutory capital and surplus. 15 N/A
[1] Statutory surplus only allows for admitted assets (i.e. assets that can be counted under the insurance regulations). It is usually less than the capital and surplus shown in the published accounts.

12
US IRIS Ratios (cont.)
IRIS Ratio Maximum Normal Range
%
Minimum Normal range
%
Two year operating ratio 100 N/A
Investment yield 10.0 4.5
Change in statutory capital and surplus
50 -10
Liabilities to liquid assets 105 N/A

13
US IRIS Ratios (cont.)IRIS Ratio Maximum
Normal Range %Minimum
Normal range %Gross amount due from agents divided by statutory capital and surplus.
40 N/A
One year development of claims provisions divided by statutory capital and surplus (i.e development of provisions ignoring the current underwriting year).
20 N/A
Two year development of claims provisions divided by surplus
20 N/A
Deficiency in claims provisions as % capital and surplus
25 N/A
14
On site inspection
Full scope – when an insurer is in serious trouble, but at least every 3 to 5 years:
Accounting methods and procedures, financial statement presentation.Validating figures provided in the insurer’s statutory returns to the insurance supervisor.Verifying the insurance company’s solvency.Determining whether the insurer has complied with the relevant laws and regulations.
15
On site inspection
Limited scope – a targeted inspection based on off site analysis and indication of potential distress
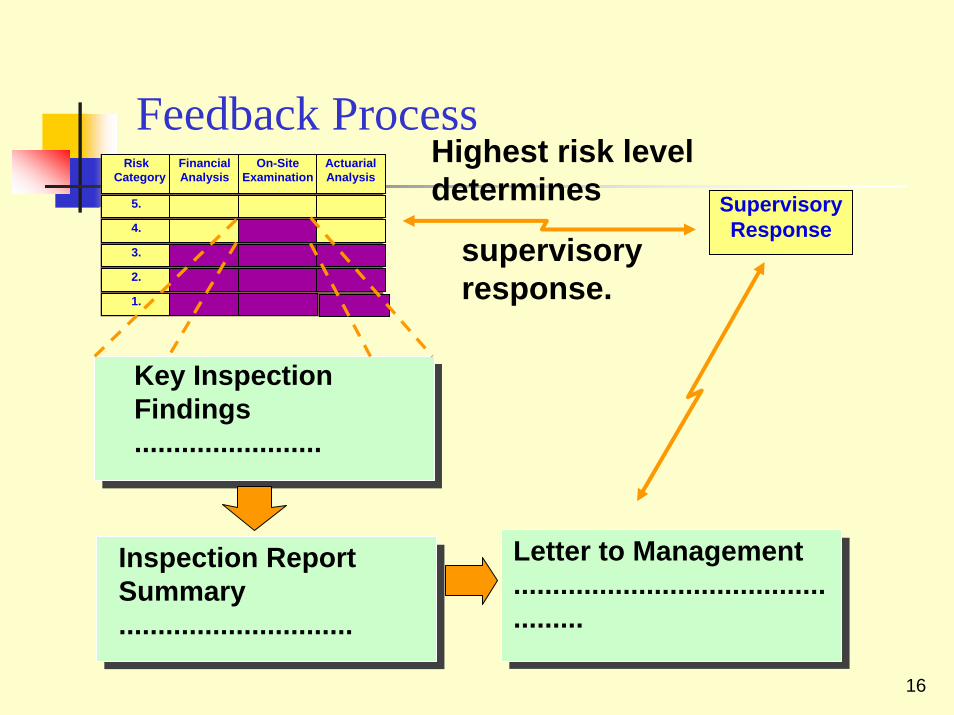
16
Risk Category
Financial Analysis
On-SiteExamination
ActuarialAnalysis
5.
4.
3.
2.
1.
SupervisoryResponse
Key Inspection Findings ........................
Inspection ReportSummary ..............................
Letter to Management.................................................
supervisoryresponse.
Highest risk level determines
Feedback Process
17
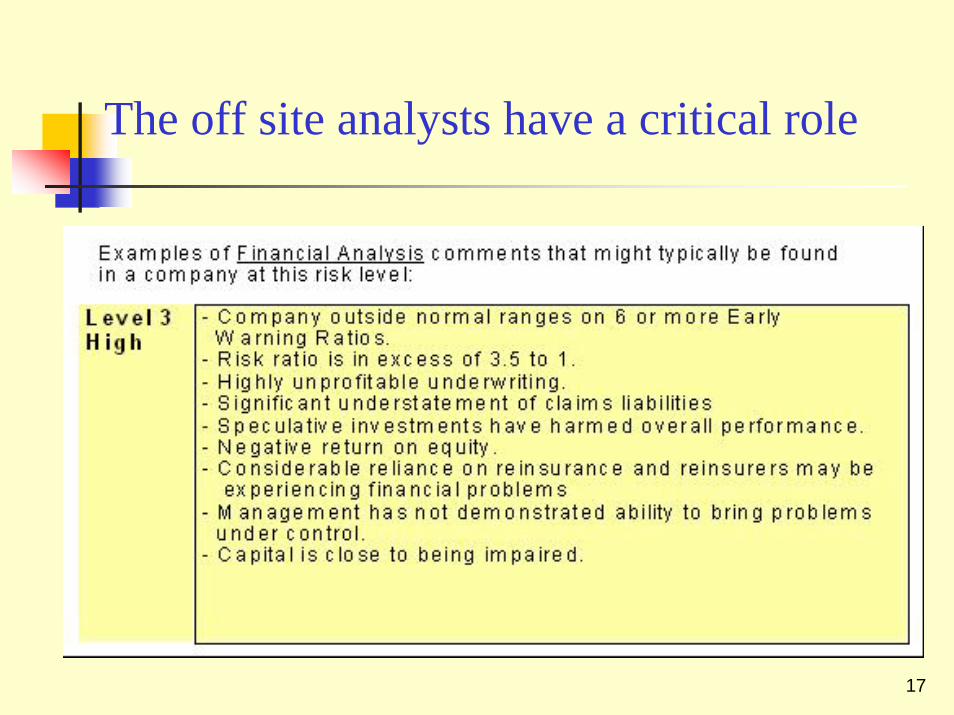
The off site analysts have a critical role

18
II. Solvency and Enforcement
19
Requirements of minimum statutory solvency
It is related to riskIt raises the safety net for insurersIt is consistent in applicationIt provides a legal basis for the supervisor to take enforcement action

20
Definition: Risk-based capital (RBC) represents an amount of capital based on an assessment of risks that a company should hold to protect customers against adverse developments.
Risk-based capital (RBC)

21
Items taken into account in determining risk based capital for non life insurers in the US R0 style risk – asset risk – associated entities
R1 style risk – asset risk – fixed income
R2 style risk – asset risk - equity
R3 style risk – asset risk - credit
R4 style risk – underwriting risk – provisions
R5 style risk – underwriting risk - premiums
Correlations between some of these risks that reduce the required level of capital
22
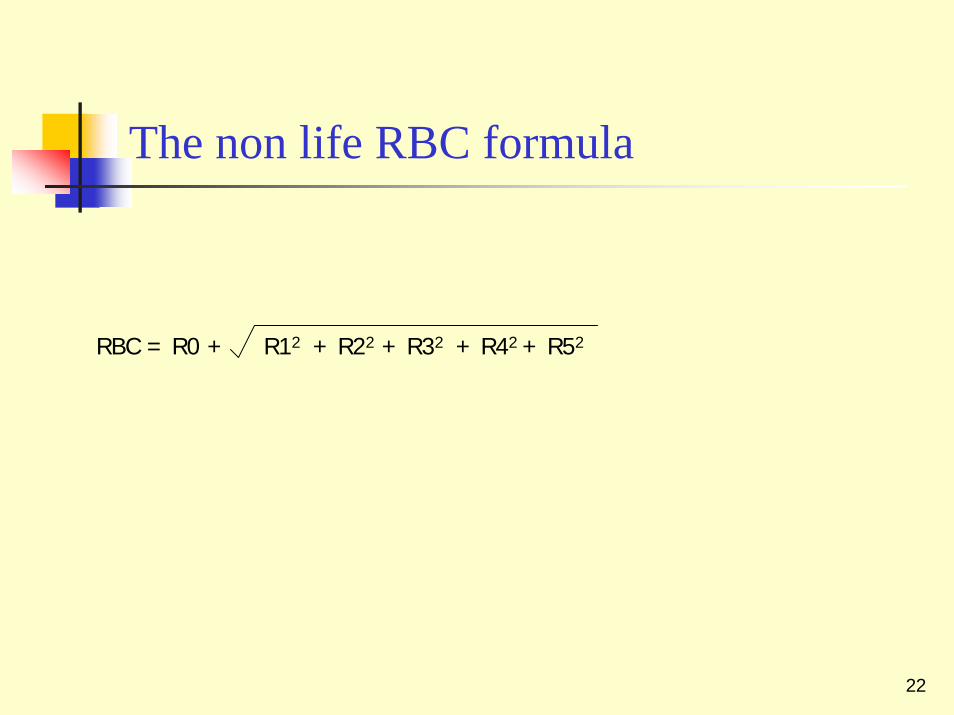
The non life RBC formula
RBC = R0 + R12 + R22 + R32 + R42 + R52

23
Comparing Risk under the US Capital Model
24
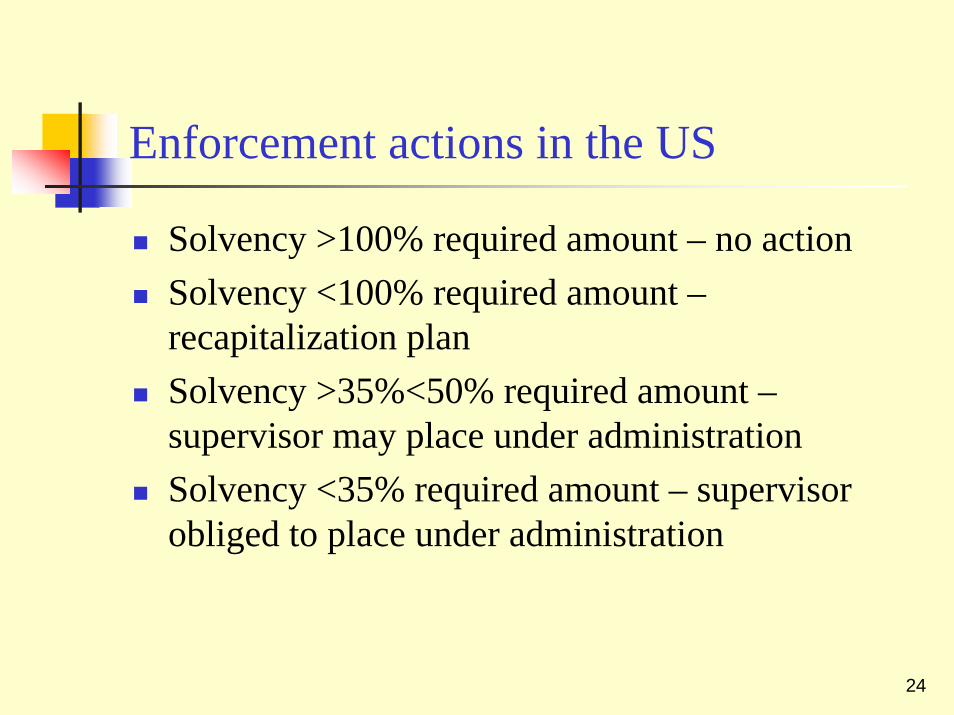
Enforcement actions in the US
Solvency >100% required amount – no actionSolvency <100% required amount –recapitalization planSolvency >35%<50% required amount –supervisor may place under administrationSolvency <35% required amount – supervisor obliged to place under administration

25
III. Accounting Concepts

26
Double entry accounting applies
Debits – assets and expenses – the business itselfCredits – revenues and liabilities – the resources provided to generate the assets – the claims of others on the businessEvery credit has a corresponding debit or a negative creditEvery debit has a corresponding credit or negative debit

27
As applied to insurance
Premium and technical provisions are credits
Claims and assets are debits

28
For example
Premium Written – P&L Cash at bank or receivable – B/S
100100
29
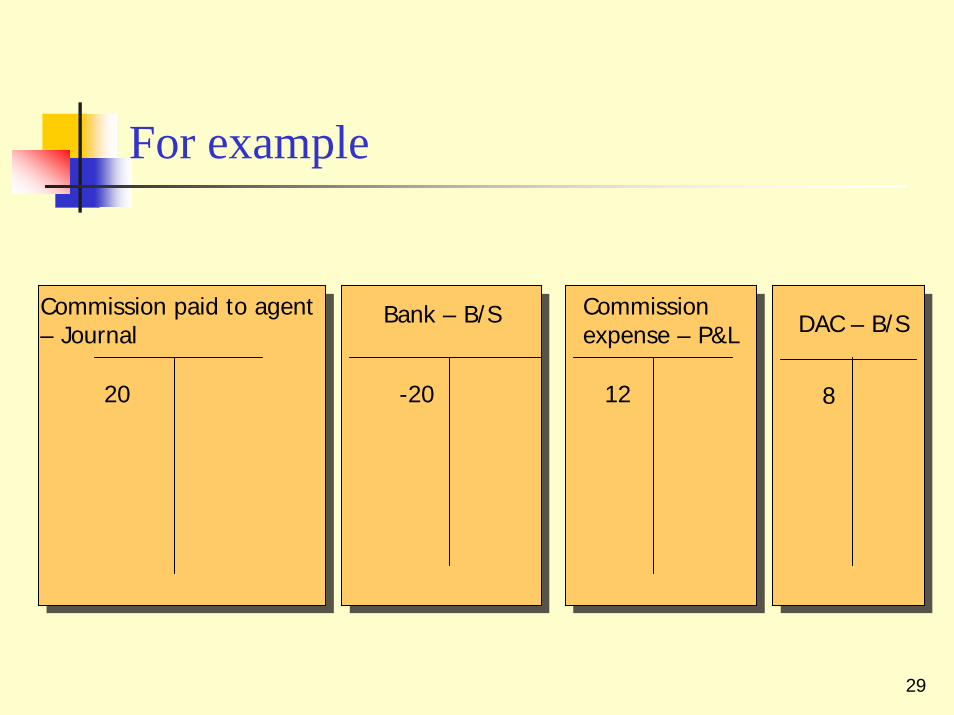
For example
Commission paid to agent – Journal
20
Bank – B/S
-20
Commission expense – P&L
12
DAC – B/S
8

30
Because of long operating cycles balance sheet items need to be created
Claims provisions EOY – B/S
120
Claims provisions BOY – B/S
100
Claims Expense
20

31
Thus accrual accounts need to be used
Earned premium = written premium + unearned premium provision in – unearned premium provision out
Claims incurred = claims paid + claims provisions out – claims provisions in

32
Technical provisions need to cover all future claims
Claims reportedClaims reported but not enough provisionClaims incurred but not reportedUnearned premium provisionUnexpired risk provision if unearned premium is inadequate

33
Reinsurance can affect the numbers in the short term
Surplus relief – Quota Share – generates exchange commissionExcess – helps to balance the portfolio and protect against catastropheSmall insurers can find it difficult to arrange reinsuranceNot all reinsurers are equalReinsurance can be abused

34
IV. IRIS Ratios for Albania
35
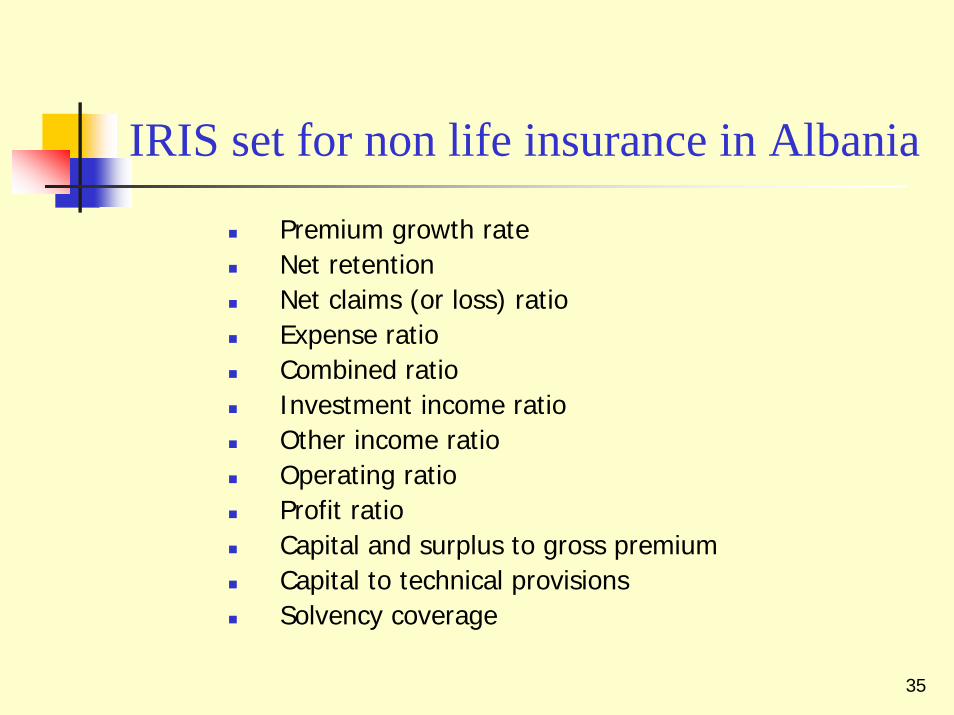
IRIS set for non life insurance in Albania
Premium growth rateNet retention Net claims (or loss) ratioExpense ratioCombined ratioInvestment income ratioOther income ratioOperating ratioProfit ratioCapital and surplus to gross premiumCapital to technical provisions Solvency coverage

36
Premium Growth Ratio
Premium growth rate
Net premium written prior year
Gross premium written current year
Gross premium written prior year
+
_÷
Change in net written premium

37
Net Retention Ratio
Retention ratio
Net written premium
Gross written premium
÷
38
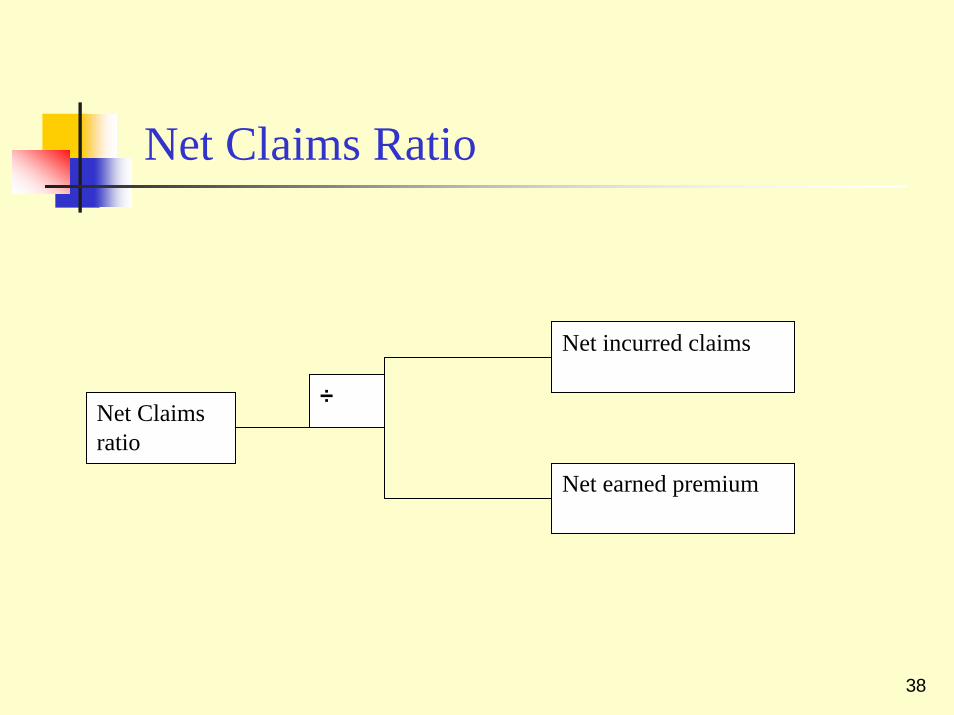
Net Claims Ratio
Net Claims ratio
Net incurred claims
Net earned premium
÷
39
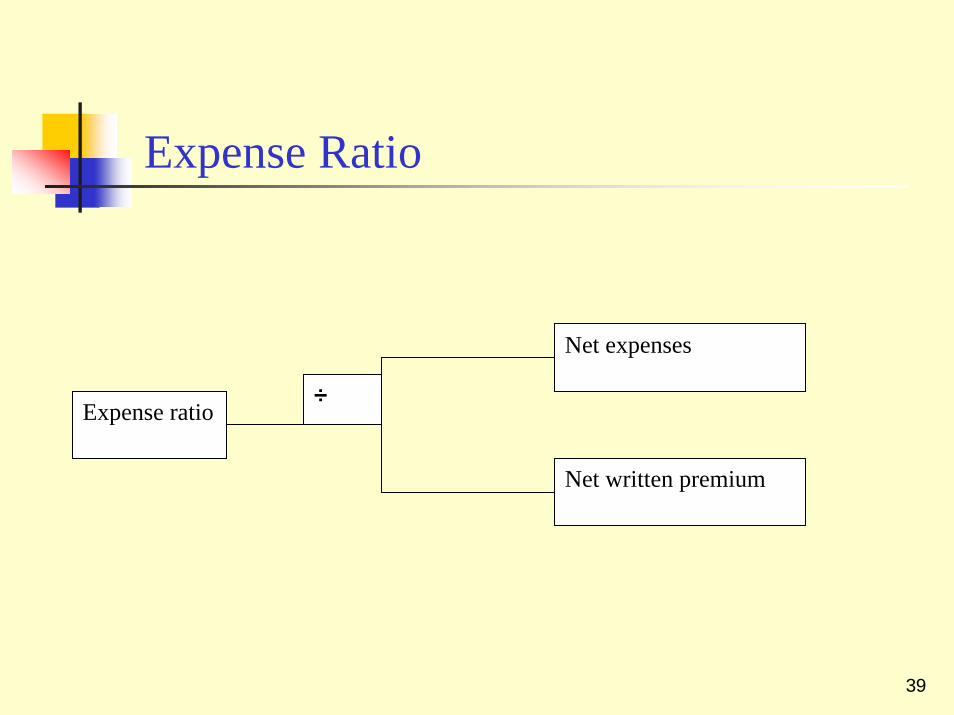
Expense Ratio
Expense ratio
Net expenses
Net written premium
÷
40
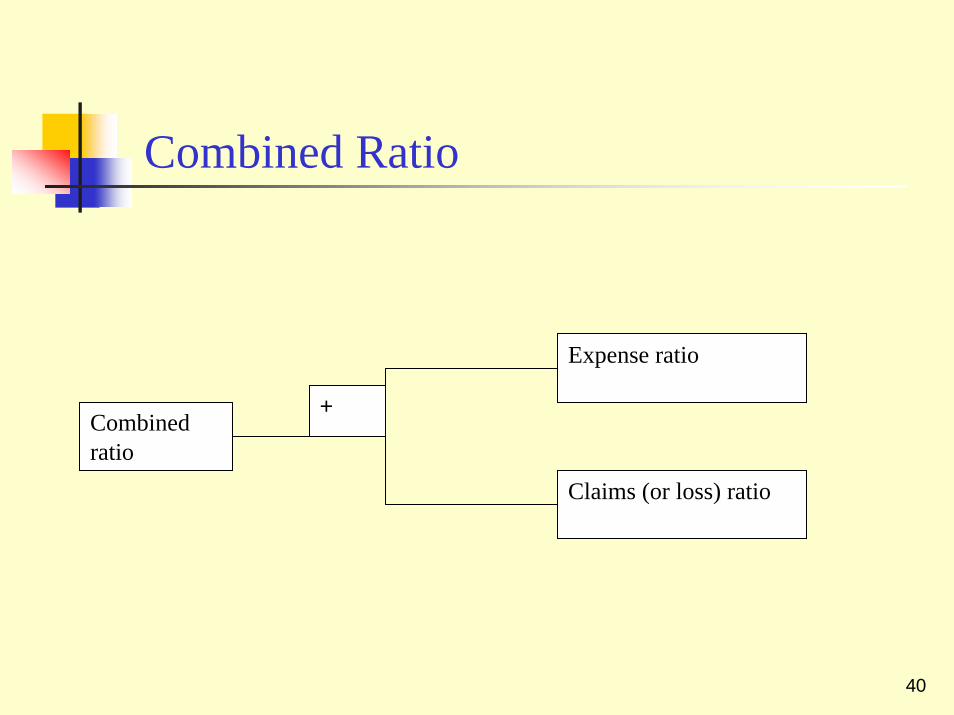
Combined Ratio
Combined ratio
Expense ratio
Claims (or loss) ratio
+

41
Investment Income Ratio
Investment income ratio
Investment Income
Net earned premium
÷

42
Other Income Ratio
Other income ratio
Other income
Net earned premium
÷

43
Operating Ratio
Combined ratio
Expense ratio
Claims (or loss) ratio
+
Investment income ratio
Other income ratio
+
_

44
Profit Ratio
Profit ratio
1
Operating ratio
_

45
Capital and Surplus to Gross Premium
Capital and surplus to gross premium (operating leverage)
Capital and surplus (shareholders funds)
Gross written premium
÷

46
Capital and Surplus to Technical Provisions
Capital and surplus to technical provisions
Capital and surplus (shareholders funds)
Technical provisions
÷
47
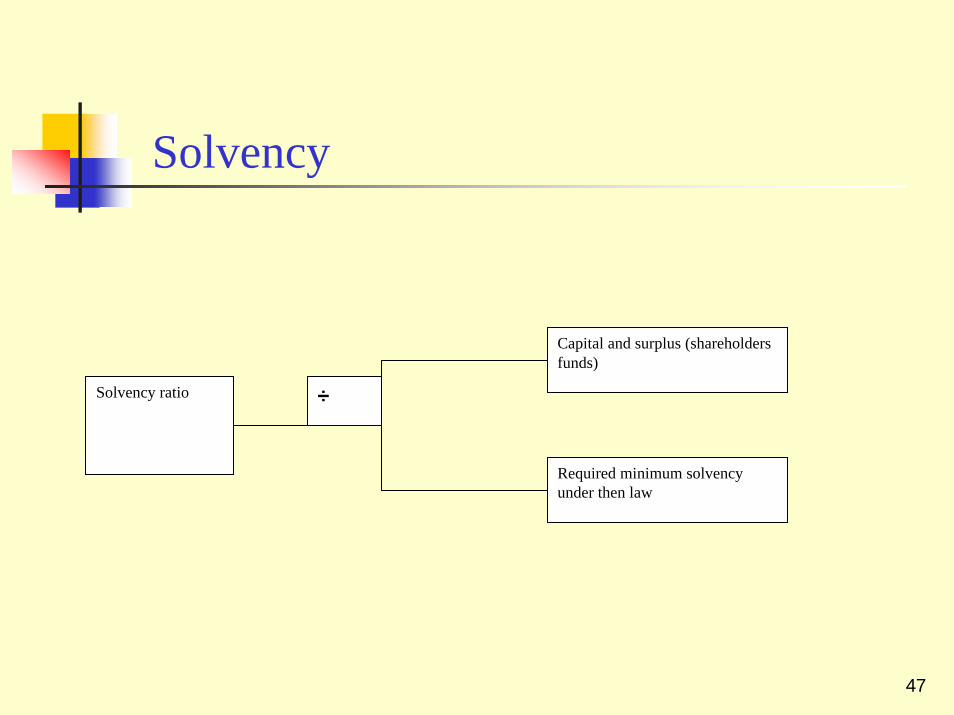
Solvency
Solvency ratio
Capital and surplus (shareholders funds)
Required minimum solvency under then law
÷

48
Normal Ranges – Developing CountryRatio High End % Low end %
Premium growth rate +40 -40
Net Retention 80 40
Expense 50 25
Net claims 80 50
Combined 105 85
Investment income 8 4
Other income 1 N/A
Operating 101 80
Profit 20 -1
Capital and surplus to GWP 50 20
Capital and surplus to technical provisions
30 10
Solvency 300 150

49
Information for the Test
Start time is 9:30 a.m.Estimated duration of 1 hour, with more time available if neededFormat is multiple choice Open bookPlease bring calculator