Off-Highway Vehicle Recreation in the ... - US - fs.fed.us Vehicle Recreation in the United ......
107
****************************************************************** ********************************************************************** Off-Highway Vehicle Recreation in the United States and its Regions and States: An Update National Report from the National Survey on Recreation and the Environment (NSRE) This is a RECSTATS Research Report in the IRIS Series 1 February, 2008 1 This report is provided to aid interested individuals and organizations gain access to statistics describing Off-Highway Vehicle (OHV) recreational use and users in the United States. The source of these statistics is the National Survey on Recreation and the Environment. Text has been kept to a minimum. The focus is on tabulated statistics in the numerous tables within. 1 The Internet Research Information Series (IRIS) is an internet accessible science report series covering outdoor recreation statistics (RECSTATS), wilderness research (WILDERNESS) and other human-dimension and demographics research (DEMOSTATS) related to natural resources. This research is a collaborative effort between the USDA Forest Service’s Southern Research Station and its Forestry Sciences Laboratory in Athens, Georgia; the University of Georgia in Athens; and the University of Tennessee in Knoxville, Tennessee.
Transcript of Off-Highway Vehicle Recreation in the ... - US - fs.fed.us Vehicle Recreation in the United ......

******************************************************************
**********************************************************************
Off-Highway Vehicle Recreation in the United States and its Regions and States: An Update National Report from the National Survey
on Recreation and the Environment (NSRE)
This is a RECSTATS Research Report in the IRIS Series1
February, 20081 This report is provided to aid interested individuals and organizations gain access to statistics describing Off-Highway Vehicle (OHV) recreational use and users in the United States. The source of these statistics is the National Survey on Recreation and the Environment. Text has been kept to a minimum. The focus is on tabulated statistics in the numerous tables within. 1 The Internet Research Information Series (IRIS) is an internet accessible science report series covering outdoor recreation statistics (RECSTATS), wilderness research (WILDERNESS) and other human-dimension and demographics research (DEMOSTATS) related to natural resources. This research is a collaborative effort between the USDA Forest Service’s Southern Research Station and its Forestry Sciences Laboratory in Athens, Georgia; the University of Georgia in Athens; and the University of Tennessee in Knoxville, Tennessee.

ii
Off-Highway Vehicle Recreation in the United States and its Regions and States:
A National Report from the National Survey on Recreation and the Environment (NSRE)
February, 2008
By:
H. Ken Cordell Carter J. Betz Gary T. Green
Becky Stephens2
2 The authors are Pioneering Scientist and Outdoor Recreation Planner, respectively, USDA Forest Service, Southern Research Station, Athens, GA; Assistant Professor, Warnell School for Forest Resources, University of Georgia, Athens; and Human Dimensions Lab Manager, University of Tennessee, Knoxville, Tennessee.

iii
Table of Contents Introduction.............................................................................................................................1 The Off-Highway Motorized Issue and Forest Service Regulations ..........................1 The Stakeholders.........................................................................................................3 Location ......................................................................................................................3 The NSRE Data Source ..............................................................................................4 This Report..................................................................................................................6 Section I: National Off-Highway Vehicle (OHV) Participation Statistics .............................8 Trend Overview ..........................................................................................................8 Vehicle Sales Trends...................................................................................................8 Vehicle Operator Trends.............................................................................................9 Trends by Demographic Characteristic ....................................................................10 Trends in Annual OHV Activity Days......................................................................15 Section II: Regional and State Off-Highway Vehicle (OHV) Participation.........................18 Regional OHV Participation .....................................................................................18 State OHV Participation ...........................................................................................19 OHV Demographic Characteristics by Region.........................................................25 Annual OHV Activity Days......................................................................................32 Section III: Segmenting Off-Highway Vehicle (OHV) Users ..............................................39 Analysis.....................................................................................................................39 Description of the OHV User Segments...................................................................44 Discussion.................................................................................................................46 Appendix Tables ...................................................................................................................48 Appendix 1: Sample size of people age 16 and older responding to questions about off-highway vehicle recreation, by demographic category and interview season, 1999-2007, United States .................................48 Appendix 2: Sample size of people age 16 and older who responded to question about off-highway vehicle annual activity days, by year of interview and demographic strata, 2001-2007, United States ...........................50 Appendix 3: Tables showing percent of population and number of people age 16 and older participating in off-highway vehicle recreation, by demographic category and state, 1999-2007 .................................................51

iv
Tables: Table 1-Number of new retail sales and estimated total number of off-highway vehicles in the United States, by OHV type, 1993-2006 ...................................8 Table 2-Percent of the U.S. population age 16 and older participating in off-highway vehicle recreation (with 95% confidence interval) by demographic category and interview season, 1999-2007 .....................................................12 Table 3-Nnumber of people age 16 and older (in 1000s) in the U.S. participating in off-highway vehicle recreation, by demographic category and interview season, 1999-2007..........................................................................................13 Table 4-Mean annual activity days (with 95% confidence intervals) of people age 16 and older in the United States who participated in off-highway vehicle recreation by year of interview and demographic category, 2001 and 2007 ........................16 Table 5-Percent of population (with 95% confidence intervals) and number of people age 16 and older participating in off-highway vehicle recreation and percent of U.S. total, by Region, 1999-2007..................................................................19 Table 6-Percent of population (with 95% confidence intervals) and number of people age 16 or older participating in off-highway vehicle recreation and percent of U.S. total by state, 1999-2007.......................................................................19 Table 7-Population and estimated number of participants ordered from highest to lowest by percentage of population participating (with 95% confidence interval) in off-highway vehicle recreation in the top 10 states ..........................................................22 Table 8-Percent of population and number of participants ordered from lowest to highest by percentage of population participating in off-highway vehicle recreation in the bottom 10 states.............................................................................23 Table 9-Percent of population and number of participants ordered from highest to lowest by the number of off-highway vehicle recreation participants in the top 10 states...23 Table 10-Percent of population and number of participants ordered from lowest to highest by the number of off-highway vehicle recreation participants in the bottom 10 states. ...................................................................................................................24 Table 11-Percent of population and estimated number of people age 16 and older participating in off-highway vehicle recreation, by demographic category, 1999-2007, North Region (n=27,153). .................................................................................26
v
Table 12-Percent of population and number of people age 16 and older participating in off-highway vehicle recreation, by demographic category, 1999-2007, South Region (n=22,072). .................................................................................27 Table 13-Percent of population and number of people age 16 and older participating in off-highway vehicle recreation, by demographic category, 1999-2007, Midwest Region (n=7,282)................................................................................28 Table 14-Percent of population and number of people age 16 and older participating in off-highway vehicle recreation, by demographic category, 1999-2007, West Region (n=6,357). ....................................................................................30 Table 15-Percent of population and number of people age 16 and older participating in off-highway vehicle recreation, by demographic category, 1999-2007, Pacific Region (n=9,684)...................................................................................31 Table 16-Mean annual activity days (with 95% confidence intervals) of people age 16 and older who participated in off-highway vehicle use, 2001-2007, North Region.............33 Table 17-Mean annual activity days (with 95% confidence intervals) of people age 16 and older who participated in off-highway vehicle use, 2001-2007, South Region.............34 Table 18-Mean annual activity days (with 95% confidence intervals) of people age 16 and older who participated in off-highway vehicle use, 2001-2007, Midwest Region. .......35 Table 19-Mean annual activity days (with 95% confidence intervals) of people age 16 and older who participated in off-highway vehicle use, 2001-2007, West Region..............36 Table 20-Mean annual activity days (with 95% confidence intervals) of people age 16 and older who participated in off-highway vehicle use, 2001-2007, Pacific Region. ..........38 Table 21-Demographic characteristics of the full NSRE sample, all OHV users, and the 5 OHV user segments (Age is in years. All other demographics are percentages.). ......40 Table 22-Outdoor recreation participation percentages for the full NSRE sample, all OHV users, and the 5 OHV user segments, by activity type..............................41

1
Off-Highway Vehicle Recreation in the United States and its Regions and States:
A National Report from the National Survey on Recreation and the Environment (NSRE)
Introduction
This report was prepared as an update to one released in 2005 to support the work of the Forest Service’s National Off-Highway Vehicle (OHV) Policy & Implementation Teams. Portions of the introductory text to this report are similar to the previous report because it is an update. The source of data is the National Survey on Recreation and the Environment (NSRE). NSRE data were collected between the fall of 1999 and mid-December, 2007. More about the NSRE can be found later in this report and at the following web site, www.srs.fs.fed.us/trends. Readers may note that detailed statistics describing off-highway vehicle users can be found in the Tables in the Appendix to this report. Tables are hyperlinked to the text and to the table of contents. The focus of this report is on tabulated statistics describing off-highway driving of motor vehicles as a recreational activity. We will refer to “off-highway” use to capture a broad band of motorized land-based uses that include backcountry roads, trails and cross-country riding. The report and tables included are provided as a self-help tool to aid interested parties in obtaining descriptive NSRE statistics about OHV users. Thus, extended text descriptions of the OHV user statistics presented in this report’s tables are not provided here. Text descriptions focusing on particular aspects of OHV recreation will be provided in later publications. The NSRE is a collaborative project between Forest Service Research and Development, the University of Georgia, and the University of Tennessee. Many other agencies and organizations also are partners in sponsoring the NSRE. The Off-Highway Motorized Issue and Forest Service Regulations In July of 2004, the USDA Forest Service published its draft rule regarding management of motorized vehicle use on National Forests. This draft rule addressed where and how off-highway vehicle (OHV) recreation use may occur. It tasked National Forest managers with examining and implementing clear and consistent agency policy concerning OHV uses. There has been considerable continuing concern about cross-country motorized vehicle use on National Forests, and as well on other public lands. The Chief of the Forest Service has noted that unmanaged recreation use, including motorized use, is one of the top four threats to the management and health of National Forests. Growing unmanaged recreation in recent years pushed the Agency toward a major effort to revise the Forest Service’s guidelines and
2
regulations for OHV management. The concerns were not only for the OHV use itself, but also for its effects on the condition of forest lands and wildlife, and on the experiences of non-motorized users. To provide background information for the study of management options being considered, a national report was produced and published in 20005 using NSRE data to describe the OHV recreationists potentially affected by revised regulations. In November 2005, after much study and public input, the Forest Service published final travel management regulations in the Federal Register (FR Vol. 70, No. 216-Nov. 9, 2005, pp 68264-68291). This final Travel Management Rule required designation of those roads, trails, and areas where motor vehicle use on National Forests was to be allowed. Designations were to be made by class of vehicle and by time of year. The ”final rule” prohibits use of motor vehicles off of designated roads and trails, and in areas generally not designated for motorized use. On some NFS lands long open to unrestricted motor vehicle travel, repeated use has resulted in numerous unofficial roads and trails. These routes generally developed without environmental analysis or public involvement. They do not have the same status as roads and trails included in the National Forest transportation system. Often, unauthorized routes are poorly located and can result in severe land, stream and habitat impacts. An unauthorized route can be designated for OHV use only after it has been added to the forest transportation system. Off-highway vehicles are popularly defined as: 1) 4-wheel drive jeeps, automobiles, pickups or sport utility vehicles; 2) motorcycles designed for cross-country use; 3) all-terrain vehicles, better known as ATVs and 4) other specially designed or modified off-road motor vehicles used in a wide variety of ways. (Although some observers and organizations include snowmobiles in their broad definition of OHVs, they are not included as OHVs for the purposes of this report. The NSRE has collected data and will publish another report specifically addressing snowmobiling as another widely popular motorized activity.) It is widely understood that OHVs are not only used for recreation, but also often used for business, commuting, and other work-related reasons. This is particularly the case for 4-wheel-drive highway vehicles, such as pickups and SUVs. This report, however, focuses only on recreational uses of OHVs. The best way to ascertain and estimate population-wide recreational use of OHVs is through a general population survey, such as the National Survey on Recreation and the Environment (NSRE). Although a person may own an OHV for many purposes, the NSRE asks specifically the question of whether an individual drove a 4-wheel drive, ATV, or motorcycle off-highway for recreation within the past year.

3
The Stakeholders As with any public land management issue, conflicts arise. This has been especially true regarding motorized recreation on public lands. One aspect of this conflict is between those wanting motorized access rights and those more interested in protection of wilderness areas and other wildlands. Legal precedent, user rights, land impacts and concern for the future are the bases for positions on both sides of this issue. An example of an OHV advocacy group is the BlueRibbon Coalition. The BlueRibbon Coalition has links to numerous other websites for reference and information on its own highly organized and in-depth website. The organization claims the position of Preserving our Natural Resources FOR the public instead of FROM the public. Website information provides relevant legal issues and actions, research papers and documents, and a BlueRibbon Coalition Visa® Credit Card is offered. The Wildlands Coalition to Prevent Roads (Wildlands CPR)(www.wildlandscpr.org), on the other hand, is indicative of the many organizations that oppose unmanaged OHV use, especially on ecologically sensitive lands. Other wilderness watch groups concerned about ecological integrity primarily include The Wilderness Society, Natural Trails and Waters Coalition, The Bluewater Network and Georgia Forestwatch, among many others. While the positions of interest groups may differ, they typically share the concern that OHV use be carried out responsibly. Differences usually pertain to specific issues or concerns over access. Other organizations and groups highly interested in policy formulation include OHV rider clubs, environmental groups, private property owners, and a wide variety of outdoor recreation enthusiasts. These may include backpackers, photographers, birders, other wildlife observers, hunters, equestrians, mountain bikers, climbers and hikers, among others. The recreational experiences that many people seek in natural environments can sometimes be incompatible with OHV and other motorized recreational uses. The challenge for public land managers is to address the needs and conflicting expectations of millions of people who use and enjoy the National Forests, while providing for the long-term sustainability of these lands. Location Currently, there is a wide range of information about services and areas for off-highway vehicle use throughout the United States. Typing “off-highway vehicle use” into any internet search engine turns up literally hundreds of sites promoting commercially outfitted OHV trips, maps, guided services, public land sites, regulations, safety information, vehicle choices, and other aspects of OHV recreation. There is a growing supply of private areas, such as New York’s Trail Pass system, privately owned but publicly managed areas such as West Virginia’s Hatfield-McCoy Trails (added to the National Recreation Trails System June 5th, 2004) and numerous city, county and state managed areas. An example is California’s State Vehicular Recreation Areas. A private example is Trail Pass MidSouth, a company supported solely by its riders and

4
affiliated clubs and dealers. This company arranges access with private land owners and manages a system of daily and annual fee passes to use trails on these lands. The amount of state and locally provided opportunities may range from none to ample, depending on which state is being observed. Federal agencies such as the Bureau of Land Management and the US Forest Service provide the majority of opportunities for OHV use and the demand for such use is growing rapidly in some areas faced with limited other opportunities. The National Park Service limits OHV access to routes over sand on National Seashores in the continental U.S. However, there is significant use in Alaskan national parks. Many conflicts concern the incidence of unmanaged OHV use and the resulting unauthorized roads and trails in undesignated areas. Cross-country trails created by repeated use can be seen on many of the state and federal lands across the country. These unauthorized and unmanaged trails have attracted significant amounts of press and a variety of attention from both users and resource managers. (An example is “Surge in Off-Roading Stirs Dust and Debate in West”, by Felicity Barringer and William Yardley, NYTimes, December 30, 2007.) The attention is usually contentious. The NSRE Data Source The data in this report covering OHV recreation are from the National Survey on Recreation and the Environment (NSRE). NSRE is a general population, random-digit-dialed household telephone survey designed to measure participation in outdoor recreation activities and people’s environmental behaviors and attitudes. The focus is on Americans age 16 and older. Between the fall of 1999 and mid-December 2007, nearly 92,000 people of this age range were interviewed for the NSRE. This most recent application of the NSRE is the eighth in the U. S. series of national recreation surveys. The first one was done in 1960. During this period, the survey was divided into 18 separate versions, each of which included different recreation activities and environmental issues. The NSRE is an on-going survey and is continuing at the time of this report. The NSRE is primarily sponsored by the USDA Forest Service, the University of Georgia, and the University of Tennessee. A number of other agencies and interests support this national research project intermittently. Depending on timing, the survey may address the data needs of several sponsoring agencies in a single survey cycle. At other times, it may meet the needs of just one agency. The Forest Service (Department of Agriculture) has interests in tracking outdoor recreation trends nationwide. The Bureau of Land Management and the National Park Service (Department of the Interior) have similar information needs. Other agencies, such as the National Oceanic and Atmospheric Administration (Department of Commerce), the United States Coast Guard, and the Environmental Protection Agency often also have similar general needs. At the same time, each of these agencies may have unique data needs driven by legislative mandates or policy assessments. State, local, and special purpose government agencies managing recreation, forests, parks, and other natural resources are also users of NSRE data and information. A number of states have made use of NSRE data as part of the demand-side analyses for their respective Statewide Comprehensive Outdoor Recreation Plans (SCORPs).

5
The ‘core’ of the NSRE is about recreational activity participation and personal demographics. All but three of the 18 versions included the following question: “Did you drive off-road for recreation in the last 12 months using a 4-wheel drive, ATV, or motorcycle?” Also asked was number of days on which off-highway driving occurred. The data generated by this question is the primary focus of this report. Altogether, nearly 71 thousand people age 16 and older responded to the above question about off-road recreational driving within the past 12 months. Since the wording referring to “off-road driving” is how it had been asked in our previous national surveys, it was kept for consistency across time. For this report, off-road and off-highway will be considered the same activity, although definitions of a road and a highway often differ. The large sample size for the NSRE provides sound statistical estimates, not only for the nation, but also for regions and states. No state had fewer than 500 respondents. The sample was also spread fairly evenly across years between 1999 and fall 2007 to allow tracking short-term trends in OHV participation. The National Survey on Recreation and the Environment (NSRE) is an ongoing series of surveys that began in 1960 as the National Recreation Survey (NRS). The Outdoor Recreation Resources Review Commission (ORRRC), established by Congress in 1958, conducted the first NRS. Four subsequent NRS surveys were conducted between 1965 and 1982. After that, financial constraints eliminated the next scheduled NRS and 10 years elapsed before the survey was again conducted, the 1994-1995 NSRE. This survey series has provided federal and state agencies, educational institutions, and the private sector with outdoor recreation trend and demand data on local, regional and national scales for almost 50 years. The NSRE is a general population, random-digit-dialed household telephone survey designed to measure the outdoor recreation and environmental attitudes of Americans. Surveying is accomplished by telephoning a random sample of telephone numbers. These numbers are selected to represent households and non-institutionalized residents of the United States, 16 years of age and older. The Human Dimensions Research Laboratory at the University of Tennessee-Knoxville, an on-going NSRE cooperator, conducts the survey using samples of household telephone numbers purchased from a private survey research-sampling firm. The survey instrument consists of a script used in computer-assisted telephone interviews. The primary objective of the NSRE is to examine trends in outdoor recreation participation that may occur anywhere in the United States, on public or private land or water. The survey is divided into separate versions, with each version comprised of three to five sections, or ‘modules.’ Modules vary in length and content from version to version, for example, asking about different recreation activities and/or environmental issues. Two modules appear in every version, however, and are referred to as the ‘core’ of the NSRE. These two core modules are recreational activity participation and personal demographics.

6
Many agencies and organizations are interested in the core recreation activity participation data. This information is used to establish a baseline of the percentage of the population engaging in a variety of recreation activities. Questions are compatible with previous National Recreation Surveys and used for participation trend analysis by activity. Some of the NSRE versions also follow up by asking about the number of days in the past 12 months on which the respondent participated in a given activity. This question is asked for only a subset of activities, not the full list of more than 80 recreation activities. Annual days of participation in a variety of recreation activities is an indicator of the intensity of participation across the United States by those who participate. Days of participation is used in recreation resource planning and research to define the size and distribution of outdoor recreation markets, and to model participation sensitivity to social and economic trends. The other core module, demographic information, is necessary to describe user and non-user populations and is included in all versions of the survey. These survey questions use the standard wording used by the Bureau of Census and by other federal agencies. Demographics is always the last section of questions asked. The structure of the demographics questions may vary, but what is included always matches that required by the Office of Management and Budget and is the same as used by the Bureau of Census. Interviews are restricted to an average length of 14 minutes. They often are less than 14 minutes. Time is kept short through use of computer-assisted telephone interviewing (CATI) data entry technology. CATI systems help minimize the amount of time a respondent will spend on the telephone by automatically skipping questions not relevant particularly to them. Further, CATI is of great benefit to the scientists, researchers, and other users in that it provides clean data and does not allow ineligible responses. One of the strengths of the NSRE is that there has been very little change in the survey instrument over time. This allows reliable trend analyses that otherwise would not be possible. The only other national survey that offers comparable long-term trend comparisons is the National Survey of Fishing, Hunting and Wildlife-Associated Recreation conducted for the U. S. Fish and Wildlife Service. This survey focuses on wildlife-related recreation and does not address the much broader listing of nature-based and other outdoor recreation activities needed across agencies and other interests. This Report The purpose of this report is primarily to provide tabulated statistics to help interested parties describe OHV recreational use, users, and trends in the United States. This report does not provide detailed text descriptions of the patterns, comparisons or trends emerging from the statistics. This is left for the reader. Later reports from these data will provide these descriptions. This report also does not provide information on where the OHV activity occurred, nor does it address the preferences of OHV users. This is beyond the purposes and design of the NSRE. Statistics describing frequency of OHV use are provided in terms of the number of activity days in which the respondent participated during the 12 months preceding the interview. In addition to participation estimates, this report also presents statistics describing five OHV market segments.

7
These segments identify groupings of OHV users who have similar demographic and recreational activity profiles. This report is organized into three sections and includes an extensive appendix containing detailed tables. Section I presents an overview of national OHV trends and population-wide participation. Particular attention is paid in this section to statistics describing the demographic characteristics of OHV users. Section II takes the analysis a step further by examining OHV users and participation across five regions of the country. Included is a brief look at state-by-state participation statistics. Greater detail concerning OHV users in each state is provided in the appendix. The final section, Section III, presents the results of a market segmentation analysis which identifies five generalized groups of OHV users.

8
Section I – National Off-Highway Vehicle (OHV) Participation Statistics
Trend Overview In 1960, when the first U.S. National Recreation Survey was done for the Outdoor Recreation Resources Review Commission, off-highway motorized recreation was not included as a recreational activity. There were, of course, many people who rode motorcycles on back country trails and used 4-wheel-drive vehicles (such as jeeps) to gain access to the back country, with and without roads. But there was no recognition of off-highway motorized recreation (then referred to as off-road driving) as a population-wide outdoor activity and the use levels were modest. However, OHV use is now recognized as one of the faster growing outdoor activities. Vehicle Sales Trends As the U.S. population has grown, so too has demand for outdoor recreation. A variety of statistical sources show that demand for OHV driving and riding grew especially fast in the 1990s, and in the first few years of this decade. For example, the Motorcycle Industry Council (MIC) is the primary trade organization that represents the ATV and motorcycle industries in the United States. The MIC makes periodic assessments of the number of new retail sales and the number of OHV units that exist in any given calendar year. This is done separately for ATVs and off-highway motor cycles. Another organization, the United Four-Wheel-Drive Association, represents 4-wheel drive owners and interests in the U.S. This organization does not attempt to track sales and total number of those vehicles in ownership. This is primarily due to the difficulty involved with tracking the very wide variety of makes, models, and manufacturers of 4-wheel drive vehicles. ATV and off-highway motorcycle sales, and total number of vehicles dating back to the mid-1990s, as reported by the MIC, are shown in Table 1. Table 1—Number of new retail sales and estimated total number of off-highway vehicles in the United States, by OHV type, 1993-2006 Statistic and Year
All-Terrain Vehicles (ATVs)
Off-Highway Motorcyles
Total
New Retail Sales 1995 277,800 90,700 368,600 1999 545,900 159,700 705,600 2003 799,400 314,000 1,113,400 2004 813,000 312,600 1,125,600 2005 780,500 306,600 1,087,100 2006 747,581 287,385 1,034,966

9
Statistic and Year
All-Terrain Vehicles (ATVs)
Off-Highway Motorcyles
Total
Total Number of Vehicles 1993 -- -- 2,920,000 1998 3,910,000 1,970,000 5,880,000 2001-2003 5,600,000 2,410,000 8,010,000Note: Total number of ATVs and off-highway motorcycles were not estimated separately in 1993. Source: Data presented by permission of Kathy Van Kleeck. Motorcycle Industry Council. Retail Sales Reports. Based on actual sales registrations from Arctic Cat, Bombardier, Honda, Kawasaki, KTM, Polaris, Suzuki, and Yamaha. Off-highway includes dual motorcycles. ATV unit population is from the U.S. Consumer Product Safety Commission, 2001 All-Terrain Vehicle ATV Exposure Survey. Off-highway motorcycle population is from the Motorcycle Industry Council, 2003 Motorcycle Statistical Annual. Further use or publication of these data is prohibited without permission from MIC. According to the MIC reports, OHV annual sales more than tripled to over 1.1 million vehicles between 1995 and 2003. Since 2003, however, sales have been flat, even dipping slightly in 2005, and again in 2006. The total number of OHVs in existence in the U.S. (previously purchased and newly purchased) grew nearly as fast as sales, increasing 174 percent between 1993 and 2003 (estimates of total number of OHVs have not been updated since 2003). In just 10 years, the total existing number of OHVs grew from fewer than three million vehicles to more than eight million in 2003. Sales in 2004 through 2006 totaled almost 3.25 million vehicles. If sales in 2007 were at least 1 million new vehicles, and assuming that 80 percent of all vehicles are still operable, there would be as many as 9.8 million ATVs and off-road motorcycles in the U. S. as of January 1, 2008. The number of ATVs in the United States represents about 70 percent of the total number of OHVs, not counting full-size, 4-wheel drive vehicles. Sales and popularity of Sport Utility Vehicles and other 4-wheel-drive vehicles (e.g., jeeps and automobiles) are undoubtedly much higher than that of ATVs and off-highway motorcycles. Their popularity has continued to grow among American consumers, although sales figures to document that trend are not readily available. As well, the impact of increasing gas prices on ownership of sport utility vehicles and other off-highway motor vehicles remain undocumented. Vehicle Operator Trends From 1982 to 2000-2001, driving motor vehicles ‘off-road’ became one of the fastest growing categories of outdoor activity in the country. During this period the estimated number of participants over 12 years old grew by more than 100 percent (Cordell et al. 2004, p. 37). The 1982 national survey asked about participation by people age 12 and older, so the 2000-2001 results, which focused on persons 16 and older, had to be adjusted to allow direct comparison. Earlier surveys also used the terminology “off road” to describe motorized use. Between the time of the NSRE conducted in 1994-1995 and the NSRE done in the fall of 1999 and summer 2000, there was a 32-percent increase in number of OHV operators participating in the activity. This represented growth from about 27.3 million OHV users in 1994-1995 to about 37.6 million in 1999-2000 (Cordell et al. 2004, p. 71). Growth continued from 1999-2000 to the
10
most recent NSRE interviewing period, the fall of 2007. Added were about 3 million OHV users. The proportion of people age 16 and older who said they participated in OHV recreation increased from 17.5 percent in 1999-2000 to a peak of 23.2 percent in fall 2002 through summer 2003. After this peak, percent of the population participating decreased somewhat to 19.2 percent in 2005-2007 (Table 2). There was a consistent upward trend in number of OHV participants across the four interviewing periods between 1999 and 2003. The estimated number of OHV participants increased 37 percent during this time, from 37.6 to 51.6 million people. A slight decrease was beginning to show in late 2003, however, a trend which continued through 2007. This estimated decrease in total number participating went from a high of 51.6 million in 2002-2003, to just over 44.4 million in 2005-2007 (Table 3). Based on the latest data (2005-2007), nearly one in five Americans (19.2 percent) age 16 and older participated one or more times in OHV recreation within the past year. While statistical surveys are always subject to error, the sizeable samples in each of the six interviewing seasons indicates relatively precise estimates with modest error ranges. (95 percent confidence is listed under each participation estimate in Table 2.) A pooled estimate of number of participants (combining NSRE 1999-2007 data with a sample size of more than 70,000 individuals) provided an estimate of 43 million OHV participants per year during this 8-year period (Table 3). This represented an average of 18.6 percent of the population annually between late 1999 and 2007 (top row in Table 2). Even though the number of people 16 or older decreased in the last few years, there still is a highly significant proportion of Americans who participate in off-highway recreational driving. Next we examine who the OHV participants are and how their demographic profiles have been changing. As will be shown, most participants have been and continue to be under 50, male, white and urban. As participation in the OHV activity continues to involve significant numbers of the population, it is important to understand the composition of OHV participants and whether this composition is changing over time. Trends by Demographic Characteristic Tables 2 and 3 show trends in percent of the population that participated in OHV recreation and the estimated number of participants, respectively, by demographic group and period in years. (Table A.1 in the Appendix lists the sample size of each demographic cell from which these estimates were drawn.) The participation rate and numbers of participants for the combined 1999-2007 survey periods appear in the next to last column, “Pooled sample: All years.” The last column indicates whether any of the percentages across the periods presented were significantly different at the 95-percent level of confidence. The participation percentages for different demographic groups and different time periods are compared in Table 2. The number of OHV participants in thousands for these different demographic groups and time periods are shown in Table 3. Demographic groups include age, sex, race, income, education and place of residence. (Demographic strata estimates may not sum exactly to the national totals because of the effects of weighting the sample data.)

11
Among race and ethnic groups, white and black Americans participated in OHV at essentially the same rate in 2005-2007 as they did in 1999-2000, with a spike upward around 2003. American Indians and Asian/Pacific Islanders showed a decrease in participation between fall 1999 and fall 2007 (as well, these two strata had the two smallest overall sample sizes). Most notably, Hispanics participated at more than twice the rate—26 percent—in 2007 as they did in 1999. Persons with family incomes over $150,000 showed the steepest drop in participation over the eight-year period, while those earning $25,000 to $50,000 rose the highest (Table 2). Every other demographic stratum, however, showed significant increases in OHV participation between 1999 and 2007 that mirrored the national growth rate of 19 percent. The three reported age groups each showed a modest increase in OHV participants during the time period. Looking at the pooled NSRE sample, almost 30 percent of people under age 30, just under 20 percent of people age 30 to 50, and close to 10 percent of people age 51 and older participate in OHV. Male OHV participation was not only significantly higher than that of females, but also grew much faster between 1999 and 2007, about 25 percent compared to 10 percent. More than 61 percent of OHV users are male (26.7 of 43 million users), based on the pooled sample (Table 3). Hispanic participation in OHV not only grew at by far the fastest rate—more than 160 percent—but also added more participants (just under 5 million) than any other racial or ethnic group. Both white and black participation peaked in 2002-2003 and returned to about the same rate in 2005-2007 as in 1999-2000. Nonetheless, whites, who comprise about 69 percent of the age 16+ population, accounted for 78 percent of all OHV users (Table 3). American Indians have the highest participation rate at over 27 percent, but given their relatively small population make up they only represent about 1 percent of OHV users. Individuals in the highest annual family income category of $150,000 had the largest participation rate in the pooled sample (25.7 percent), but had the steepest decline in participants—about 27 percent—between 1999-2000 and 2005-2007. The $25,000 to $49,999 family income category grew faster than all others at more than 30 percent. No other income group grew more than 12 percent. People with less than a high school education grew faster than any other category of educational attainment, about 22 percent between 1999 and 2007, an increase of almost 1.5 million people (Table 3). People with a post-graduate degree were the only group whose participation rate declined during that period. More than 60 percent of all OHV users in the pooled sample, however, were either high school graduates or those who had attended some college. Finally, OHV growth for both metropolitan and non-metropolitan residents closely approximated the national growth rate, about 2 percentage points between 1999 and 2007. More than three times as many of the ‘new’ users were from metropolitan areas as compared to non-metropolitan areas. However, the share of all OHV participants who live in metro areas (76 percent) is smaller than the proportion of metropolitan residents in the United States age 16 and older (83 percent). This is reflected in the higher participation rate in the pooled sample for non-metropolitan residents (26 percent) compared to metropolitan (17 percent) (Table 2).

12
Table 2—Percent of the U.S. population age 16 and older participating in off-highway vehicle recreation (with 95% confidence interval) by demographic category and interview season, 1999-2007.
Demo-graphic Strata
Fall 1999-
Summer 2000
Fall 2000-
Summer 2001
Fall 2001-
Summer 2002
Fall 2002-
Summer 2003
Fall 2003-
Summer 2005
Fall 2005- Fall 2007
Pooled sample:
All years
Statis-ticallysignifi-
cant differ-ence
All Groups
All people age 16+
17.5 (17.0, 18.0)
17.4 (16.9, 17.9)
18.1 (17.3, 18.8)
23.2 (22.3, 24.1)
22.3 (21.0, 23.7)
19.2 (18.2, 20.2)
18.6 (18.3, 18.9)
Yes
Under 30 27.6 (26.3, 28.9)
28.1 (26.8, 29.4)
27.0 (25.1, 28.8)
34.4 (32.1, 36.6)
32.2 (28.7, 35.6)
30.8 (27.3, 34.3)
29.0 (28.2, 29.7)
Yes
30-50 18.4 (17.6, 19.2)
17.8 (17.0, 18.5)
20.3 (19.1, 21.5)
23.1 (21.7, 24.5)
24.8 (22.5, 27.0)
23.5 (21.7, 25.3)
19.7 (19.2, 20.1)
Yes
Age
51 & older 8.5 (7.8, 9.2)
8.4 (7.8, 9.0)
8.4 (7.5, 9.3)
13.3 (12.1, 14.5)
12.7 (10.9, 14.4)
9.6 (8.5, 10.7)
9.3 (9.0, 9.7)
Yes
Male 22.1 (21.3, 23.0)
22.8 (22.0, 23.7)
22.3 (21.1, 23.5)
28.8 (27.3, 30.3)
27.2 (25.0, 29.4)
25.5 (23.8, 27.1)
23.7 (23.2, 24.2)
Yes Gender
Female 13.3 (12.7, 14.0)
12.7 (12.1, 13.3)
14.1 (13.2, 15.0)
18.1 (17.0, 19.2)
17.9 (16.2, 19.6)
13.7 (12.4, 14.9)
14.1 (13.7, 14.4)
Yes
White 19.8 (19.2, 20.4)
20.2 (19.7, 20.8)
21.7 (20.8, 22.6)
24.4 (23.4, 25.4)
24.5 (23.0, 26.1)
20.2 (19.1, 21.3)
21.0 (20.7, 21.4)
Yes
Black 11.0 (9.4, 12.6)
11.7 (10.1, 13.3)
11.5 (9.0, 14.0)
18.5 (15.1, 22.0)
14.4 (9.8, 18.9)
10.5 (7.1, 14.0)
12.4 (11.4, 13.3)
Yes
American Indian
28.5 (23.2, 33.8)
23.3 (18.6, 28.0)
24.0 (16.8, 31.3)
41.4 (31.5, 51.3)
28.8 (16.9, 40.7)
21.5 (10.7, 32.2)
27.2 (24.4, 30.0)
Yes
Asian/Pacific Islander
16.0 (12.1, 19.8)
10.2 (7.2, 13.2)
13.1 (7.8, 18.4)
13.0 (7.1, 18.9)
8.7 (1.5, 15.8)
8.4 (2.8, 14.1)
12.4 (10.5, 14.3)
No
Race/ Ethnicity
Hispanic 12.8 (11.0, 14.6)
11.2 (9.5, 12.8)
10.6 (8.6, 12.5)
24.3 (20.0, 28.6)
23.3 (17.0, 29.5)
26.4 (21.2, 31.7)
14.6 (13.5, 15.6)
Yes
$25,000 or less
12.3 (11.0, 13.5)
13.0 (11.8, 14.3)
10.6 (8.9, 12.4)
17.6 (15.2, 20.0)
18.3 (14.6, 22.1)
11.5 (9.2, 13.7)
13.1 (12.3, 13.8)
Yes
$25,000 to $49,999
19.3 (18.2, 20.5)
18.3 (17.1, 19.4)
20.8 (19.0, 22.7)
25.3 (23.2, 27.5)
26.4 (23.1, 29.7)
24.8 (22.3, 27.3)
20.7 (20.1, 21.4)
Yes
Annual family income
$50,000 to $74,999
22.0 (20.5, 23.5)
21.5 (20.0, 23.0)
22.5 (20.3, 24.7)
27.5 (25.1, 30.0)
24.3 (20.7, 27.8)
21.8 (19.1, 24.4)
22.8 (21.9, 23.6)
Yes

13
Demo-graphic Strata
Fall 1999-
Summer 2000
Fall 2000-
Summer 2001
Fall 2001-
Summer 2002
Fall 2002-
Summer 2003
Fall 2003-
Summer 2005
Fall 2005- Fall 2007
Pooled sample:
All years
Statis-ticallysignifi-
cant differ-ence
$75,000 to $99,999
22.8 (20.5, 25.1)
21.0 (19.0, 23.0)
26.2 (22.9, 29.4)
28.4 (25.2, 31.7)
29.5 (24.6, 34.3)
24.7 (21.3, 28.0)
24.1 (23.0, 25.3)
Yes
$100,000 to $149,999
21.6 (19.0, 24.2)
23.0 (20.5, 25.5)
23.0 (19.5, 26.5)
23.6 (20.0, 27.2)
25.5 (20.0, 31.0)
23.7 (20.1, 27.4)
22.9 (21.6, 24.3)
No
$150,000 or more
29.9 (25.9, 33.9)
24.3 (20.8, 27.8)
25.8 (20.9, 30.6)
27.4 (22.5, 32.3)
20.9 (14.3, 27.4)
21.3 (17.2, 25.5)
25.7 (23.9, 27.5)
Yes
Less than high school
15.7 (14.1, 17.2)
17.8 (16.2, 19.3)
15.4 (13.3, 17.6)
27.4 (23.9, 30.8)
23.7 (19.2, 28.2)
18.9 (14.9, 23.0)
18.2 (17.3, 19.1)
Yes
High school graduate
19.0 (17.9, 20.1)
18.2 (17.2, 19.2)
20.4 (18.9, 21.9)
23.4 (21.6, 25.3)
24.4 (21.4, 27.3)
20.1 (18.0, 22.3)
19.8 (19.2, 20.4)
Yes
Some college/tech. school
20.2 (19.2, 21.2)
19.6 (18.7, 20.6)
21.0 (19.5, 22.5)
22.8 (21.1, 24.4)
23.5 (21.0, 26.1)
21.4 (19.3, 23.5)
20.7 (20.2, 21.3)
Yes
Bachelors degree
15.3 (14.2, 16.5)
14.5 (13.5, 15.6)
17.4 (15.7, 19.0)
21.7 (19.8, 23.6)
18.3 (15.6, 20.9)
17.6 (15.6, 19.6)
16.6 (15.9, 17.2)
Yes
Education
Post-graduate degree
13.8 (12.4, 15.2)
12.0 (10.8, 13.3)
11.5 (9.8, 13.3)
13.8 (11.9, 15.7)
17.0 (13.8, 20.1)
12.6 (10.5, 14.7)
13.0 (12.3, 13.7)
Yes
Non-Metropolitan
24.2 (23.2, 25.2)
24.5 (23.6, 25.4)
25.0 (23.5, 26.4)
31.1 (29.3, 32.9)
34.2 (31.6, 36.9)
26.1 (23.5, 28.6)
25.8 (25.2, 26.3)
Yes Place of residence
Metropolitan 15.8 (15.2, 16.4)
15.5 (14.9, 16.1)
16.4 (15.5, 17.3)
21.5 (20.4, 22.5)
19.1 (17.5, 20.7)
17.7 (16.6, 18.8)
16.8 (16.5, 17.2)
Yes
Source: NSRE 1999-2004, Versions 1-16 except 3, 6, 12. NSRE 2005-2007, Versions 2 and 3. Table 3—Number of people age 16 and older (in 1000s) in the U.S. participating in off-highway vehicle recreation, by demographic category and interview season, 1999-2007.
Demo-graphic Strata
2006 Population
(1000s)
Fall '99-Summer
'00
Fall '00-Summer
'01
Fall '01-Summer
'02
Fall '02-Summer
'03
Fall '03- Summer
'05
Fall '05-Summer
'07
Pooled sample- all years
All Groups
All people age 16+
230,941,452 37,600.1 37,925.1 39,788.4 51,583.2 50,915.2 44,402.2 42,971.3
Under 30 57,969,975 14,876.4 15,243.9 14,770.7 19,032.4 18,315.1 17,842.4 16,797.8
30-50 89,147,422 16,300.8 15,825.4 18,155.6 20,679.5 22,149.0 20,950.5 17,543.0
Age
51 & older 83,824,055 6,155.0 6,224.9 6,387.1 10,317.9 10,332.2 8,020.5 7,816.4

14
Demo-graphic Strata
2006 Population
(1000s)
Fall '99-Summer
'00
Fall '00-Summer
'01
Fall '01-Summer
'02
Fall '02-Summer
'03
Fall '03- Summer
'05
Fall '05-Summer
'07
Pooled sample- all years
Male 112,569,091 23,021.9 24,090.4 23,835.6 31,151.4 30,196.6 28,672.5 26,653.3Gender
Female 118,372,362 14,768.3 14,243.6 16,011.7 20,682.2 20,913.0 16,182.8 16,637.6
White 159,235,219 30,588.5 31,423.5 33,799.0 38,206.2 38,855.6 32,157.7 33,481.2
Black 26,828,788 2,692.8 2,908.7 2,888.3 4,731.1 3,787.0 2,824.7 3,317.4
American Indian
1,658,307 418.9 349.2 368.1 646.2 468.0 355.8 451.0
Asian/ Pacific Islander
10,459,978 1,340.0 891.8 1,197.9 1,231.3 879.7 880.9 1,296.0
Race/ ethnicity
Hispanic 30,374,292 3,095.3 2,809.7 2,776.7 6,611.6 6,810.3 8,032.3 4,423.3
$25,000 or less
36,871,562 4,468.2 4,755.6 3,888.3 6,449.1 6,740.4 4,222.8 4,814.2
$25,000 to $49,999
51,606,361 9,844.8 9,315.2 10,652.1 12,976.7 13,575.5 12,796.0 10,694.7
$50,000 to $74,999
39,583,875 8,599.1 8,409.3 8,830.4 10,820.0 9,573.8 8,610.5 9,006.4
$75,000 to $99,999
22,184,406 4,987.2 4,605.9 5,745.4 6,252.9 6,515.4 5,471.5 5,354.6
$100,000 to $149,999
17,149,832 3,650.5 3,896.4 3,903.5 4,010.8 4,357.7 4,066.4 3,935.5
Annual family income
$150,000 or more
10,156,344 2,994.1 2,437.0 2,591.9 2,759.7 2,110.9 2,164.9 2,607.4
Less than high school
42,550,252 6,665.5 7,558.6 6,572.7 11,643.8 10,075.2 8,060.3 7,750.1
High school graduate
59,906,752 11,382.5 10,913.3 12,219.3 14,046.9 14,592.2 12,065.7 11,859.8
Some college/ tech. school
60,245,019 12,168.8 11,822.1 12,643.9 13,725.1 14,175.3 12,894.5 12,482.7
Bachelors degree
30,281,901 4,647.2 4,405.9 5,261.7 6,572.3 5,526.6 5,323.4 5,011.7
Education
Post-graduate degree
16,295,225 2,243.4 1,959.4 1,880.4 2,247.8 2,764.0 2,055.9 2,117.6
Place of residence
Nonmetro-politan
38,900,711 8,758.8 8,974.2 9,254.7 11,660.4 13,147.9 10,136.4 10,026.3

15
Demo-graphic Strata
2006 Population
(1000s)
Fall '99-Summer
'00
Fall '00-Summer
'01
Fall '01-Summer
'02
Fall '02-Summer
'03
Fall '03- Summer
'05
Fall '05-Summer
'07
Pooled sample- all years
Metro-politan
192,040,741 28,262.1 28,105.8 29,955.8 39,772.1 36,242.0 33,994.4 32,290.2
Source: 2006 Census Estimates Program (age, sex, race/ethnicity, residence: civilian, non-institutionalized population). 2000 Census, SF3 (education, income). NSRE 1999-2004, Versions 1-16 except 3, 6, 12. NSRE 2005-2007, Versions 2 and 3. Estimates are based on the following age 16+ populations (all in millions): 2000=214.0, 2001=217.5, 2002=220.2, 2003=222.6, 2004=228.0, 2006=230.9. Pooled NSRE sample is based on 2006 population. Notes: Race/ethnicity population does not include persons of 2 or more races. Population by income category is estimated based on population in families and average family size (2000 Census). Population for educational attainment is for age 18 and older (2000 Census). All others are age 16 and older. Trends in Annual OHV Activity Days In five of the 18 versions of the 1999-2007 NSRE that asked respondents if they had participated in OHV recreation during the past 12 months, a follow-up question was asked: “On how many different days did you drive off-road in the past 12 months?” Any part of a day when a person participated in OHV recreation was counted as 1 day. The total number of individuals responding to this question was 4,103. Of these, 1,650 were interviewed in 2001, 1,225 people in 2003, and 1,228 individuals during the years 2005 to 2007. (Not enough people were interviewed in the individual years between 2005 to 2007, so data for those three years were combined. See Appendix Table 2 for sample size for different years and by demographic strata.) Combining all of the interviews across the six years of interviewing resulted in an estimated average number of activity days per year by all OHV participants of 27.9 (line 1 of Table 4). In the period 2004 – 2007, annual days reached just over 31 per year, after having risen sharply from 2001 to 2003 (Table 4). The 2001 average may have been influenced downward somewhat by 9/11, although nine months of the year had already passed. The gain in annual OHV days from 2001 to 2007 represents a 42 percent increase overall. So while the national OHV participation rate appears to have peaked in 2003 (Table 2), the amount of OHV activity per participant has kept pace and even increased slightly. On average, individual OHV users spend between two and three days per month in the activity. American Indians and Asians/Pacific Islanders lacked a sufficient sample size to estimate annual activity days by year. (Some of the other minority strata also had relatively small sample sizes, which are reflected in wide interval estimates. Table 4 shows 95 percent confidence intervals around the mean of annual days for each year and for the full sample estimate.) By age group, mean OHV days increased slightly from 2001 to 2007 for people age 30 to 50 and moderately for people over age 50. However, days per year nearly doubled from 22 to 39 days annually for those under 30 (Table 4). Both males and females showed steady increases, with males participating about seven more days per year on average (pooled sample of all years). Activity days for White Americans increased modestly between 2001 and 2007, adding about 16 percent. Hispanics had very substantial gains in annual OHV days, however, these estimates are based on relatively small sample sizes (Table A.2), resulting in very wide confidence intervals around the two yearly estimates (Table 4). While average days dipped for people whose family income was

16
$25,000 to $49,999 and for those earning more than $100,000, they rose for people earning $50,000 to $100,000. Average days per year rose especially for people earning $25,000 or less. People who earned a post-graduate degree participated fewer days during each period from 2001 to 2007, while high school graduates and those attending some college or earning a bachelor’s degree stayed fairly constant at between 20 and 26 days. The least educated stratum, people with less than a high school education, saw a significant increase in annual days, as their mean days nearly tripled from about 23 to 62 per year. It is worth noting, however, that the latter estimate is based on a sample of just 88 respondents in 2005-2007 with less than a high school education. Metropolitan residents saw a larger increase in annual days from 2001 to 2007 than non-metropolitan residents, although in the pooled sample, non-metro dwellers participated about 8.5 days on average per year than metro residents. Table 4 – Mean annual activity days (with 95% confidence interval) of people age 16 and older in the United States who participated in Off-Highway Vehicle recreation by year of interview and demographic category, 2001-2007.
Demographic Strata 2001 2003 2005- 2007
Pooled sample: All years
Statisticallysignificantdifference
All Groups All people age 16+ 23.2 (20.8, 25.6)
30.7 (27.2, 34.3)
31.1 (27.3, 34.9)
27.9 (26.1, 29.8)
Yes
Under 30 22.1 (18.2, 25.9)
34.2 (27.0, 41.4)
39.0 (28.0, 50.0)
30.5 (26.7, 34.4)
Yes
30-50 23.8 (20.4, 27.3)
30.2 (25.2, 35.3)
25.4 (21.3, 29.5)
26.2 (23.8, 28.6)
No
Age
51 & older 23.6 (17.4, 29.8)
23.2 (17.9, 28.5)
29.2 (22.8, 35.5)
25.5 (22.0, 29.0)
No
Male 25.3 (22.0, 28.5)
32.5 (28.0, 37.0)
35.2 (29.8, 40.6)
30.5 (28.0, 33.0)
Yes Gender
Female 19.7 (16.3, 23.0)
28.2 (22.5, 33.8)
24.6 (19.4, 29.8)
23.9 (21.3, 26.6)
No
White 24.9 (22.2, 27.6)
31.1 (27.3, 34.8)
27.1 (23.7, 30.5)
27.4 (25.5, 29.2)
No
Black 13.6 (7.1, 20.2)
50.1 (21.7, 78.6)
26.4 (13.6, 39.2)
28.9 (18.3, 39.4)
Yes
American Indian 45.5 (8.0, 83.0)
---
Asian/Pacific Islander
15.6 (1.1, 30.1)
---
Race/ Ethnicity
Hispanic 15.7 (8.7, 22.6)
18.0 (11.2, 24.9)
52.7 (25.4, 80.1)
31.0 (20.9, 41.1)
Yes
$25,000 or less 20.1 (13.5, 26.7)
51.0 (33.8, 68.2)
36.9 (23.6, 50.3)
35.1 (28.0, 42.2)
Yes
$25,000 to $49,999 25.5 (20.4, 30.7)
23.7 (18.0, 29.4)
18.8 (14.4, 23.3)
22.6 (19.6, 25.5)
No
$50,000 to $74,999 21.6 (16.6, 26.6)
29.6 (23.0, 36.2)
24.4 (17.2, 31.5)
24.9 (21.4, 28.5)
No
$75,000 to $99,999 14.4 (10.3, 18.4)
31.3 (20.3, 42.3)
20.3 (14.9, 25.7)
21.6 (17.5, 25.7)
Yes
Annual family income
$100,000 to $149,999
30.1 (17.5, 42.7)
22.7 (17.2, 28.2)
21.9 (12.8, 31.1)
24.8 (19.1, 30.5)
No

17
Demographic Strata 2001 2003 2005- 2007
Pooled sample: All years
Statisticallysignificantdifference
$150,000 or more 33.7 (16.6, 50.8)
29.0 (12.7, 45.4)
20.3 (10.5, 30.0)
27.1 (19.2, 34.9)
No
Less than high school
22.9 (15.4, 30.3)
39.8 (25.3, 54.3)
61.6 (38.2, 85.0)
39.2 (31.1, 47.3)
Yes
High school graduate
24.7 (20.3, 29.0)
35.5 (28.1, 43.0)
25.7 (20.5, 30.8)
28.0 (24.8, 31.2)
No
Some college/tech. school
23.2 (19.1, 27.2)
24.4 (19.8, 29.0)
22.3 (16.7, 27.9)
23.2 (20.5, 25.9)
No
Bachelors degree 20.3 (15.1, 25.4)
22.4 (16.4, 28.3)
20.2 (15.1, 25.4)
21.0 (17.9, 24.1)
No
Education
Post-graduate degree
24.8 (15.0, 34.6)
20.6 (12.1, 29.1)
15.3 (9.9, 20.6)
20.3 (15.7, 24.9)
No
Non-Metropolitan 32.1 (27.5, 36.7)
33.8 (28.3, 39.3)
37.4 (30.4, 44.3)
34.2 (31.0, 37.4)
No Place of residence
Metropolitan 20.0 (17.2, 22.7)
29.7 (25.1, 34.3)
29.1 (24.5, 33.6)
25.8 (23.5, 28.1)
Yes
Source: NSRE 1999-2004, Versions 8, 10, & 15. NSRE 2005-2007, Versions 2 & 3. Estimates are statistically unreliable and thus not reported for demographic strata with a sample size of less than 30.

18
Section II – Regional and State Off-Highway Vehicle (OHV) Participation
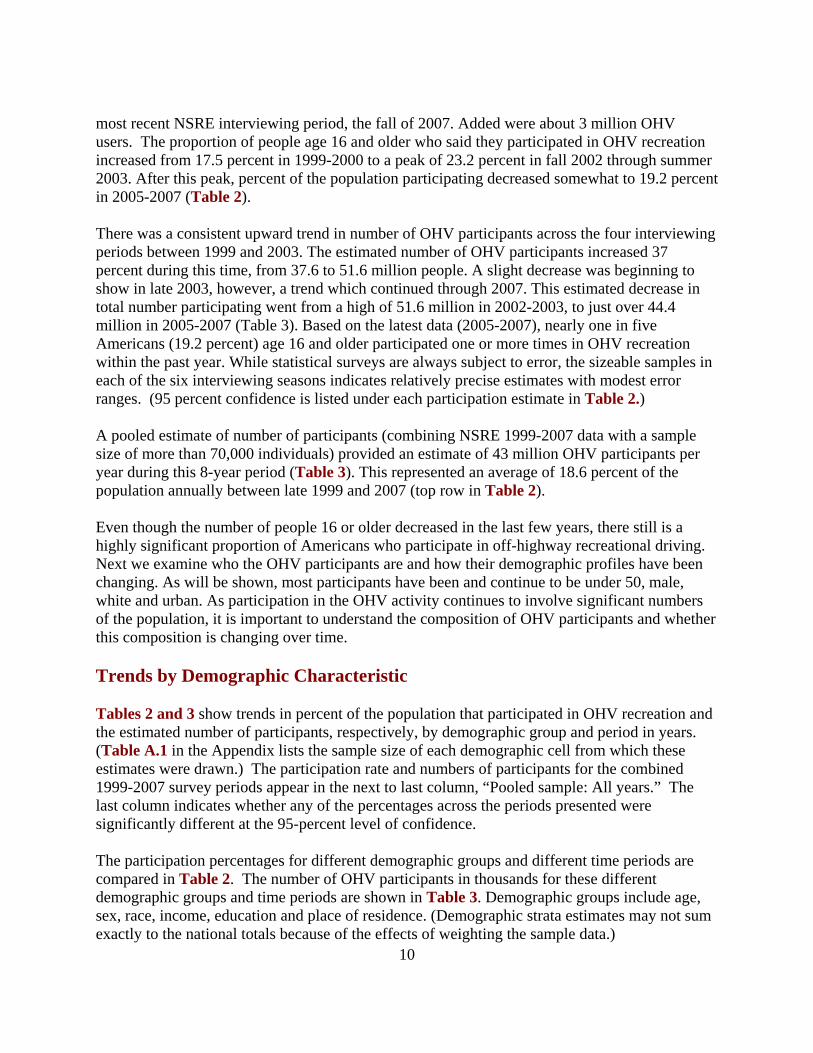
Regional OHV Participation Another important aspect of OHV recreation in the United States, in addition to describing the trends and characteristics of users, is the question of where OHV use is occurring. Nationwide, just under 19 percent of the population age 16 and older participated in OHV recreation one or more times during the year prior to their being interviewed. As expected, a considerable amount of variation exists in OHV participation across different regions of the country and even more so from state-to-state. Regions and states with relatively more public land (especially federal) and more undeveloped, private rural land provide more opportunities for OHV recreation. One would expect greater levels of opportunities to be reflected in greater levels of participation across regions and states. The same analysis of OHV participation by demographic category that was performed on the full national-level NSRE data set was repeated for each of five regions of the U.S., and for all 50 states. Regions were defined as: North: Connecticut, Delaware, District of Columbia, Illinois, Indiana, Maine, Maryland, Massachusetts, Michigan, New Hampshire, New Jersey, New York, Ohio, Pennsylvania, Rhode Island, Vermont, West Virginia, Wisconsin. South: Alabama, Arkansas, Florida, Georgia, Kentucky, Louisiana, Mississippi, North Carolina, Oklahoma, South Carolina, Tennessee, Texas, Virginia. Midwest: Iowa, Kansas, Minnesota, Missouri, Nebraska, North Dakota, South Dakota. West: Arizona, Colorado, Idaho, Montana, Nevada, New Mexico, Utah, Wyoming. Pacific: Alaska, California, Hawaii, Oregon, Washington. OHV participation rates ranged from a low of 16.0 percent in the North region to 28.1 percent in the West (Table 5). The Pacific and South were closest to the national rate, each with 18.7 percent participating. The Midwest exceeded the national percentage. Despite the North’s lower rate of participation, it still accounted for just under one-third of the 43 million U.S. OHV users due to its larger population. A slightly larger number of OHV users, 14.5 million, live in the South. The South is second largest in terms of population and together with the North comprises 70 percent of the U.S. population. These two eastern regions comprise just under 66 percent of OHV users nationwide. The West has the largest proportion of people who are OHV users by a wide margin, but with just 6.8 percent of the population 16 and older, it has an estimated 10.4 percent of all users. The Midwest, with a similar share of the U.S. population, has the smallest percentage of OHV users in the country, with less than 8 percent. The Pacific region has approximately 16 percent of both the U.S. population and OHV users.
19
Table 5 – Percent of population (with 95% confidence interval) and number of people age 16 and older participating in off-highway vehicle recreation and percent of U.S. total, by region, 1999-2007.
Region
Population age 16 &
older (1000s)
Percent of U.S. population age
16 & older Sample
size
Percent participating in OHV recreation
OHV Participants
(1000s)
Percent of Total U.S.
ParticipantsNorth 85,743.1 37.1 27,153 16.0
(15.5, 16.4) 13,826.7 32.2
South 76,997.3 33.3 22,072 18.7 (18.2, 19.2)
14,509.7 33.7
Midwest 15,436.7 6.7 7,282 20.6 (19.7, 21.5)
3,208.7 7.5
West 15,758.3 6.8 6,357 28.1 (27.0, 29.3)
4,475.2 10.4
Pacific 37,006.1 16.0 9,684 18.7 (17.9, 19.5)
6,973.5 16.2
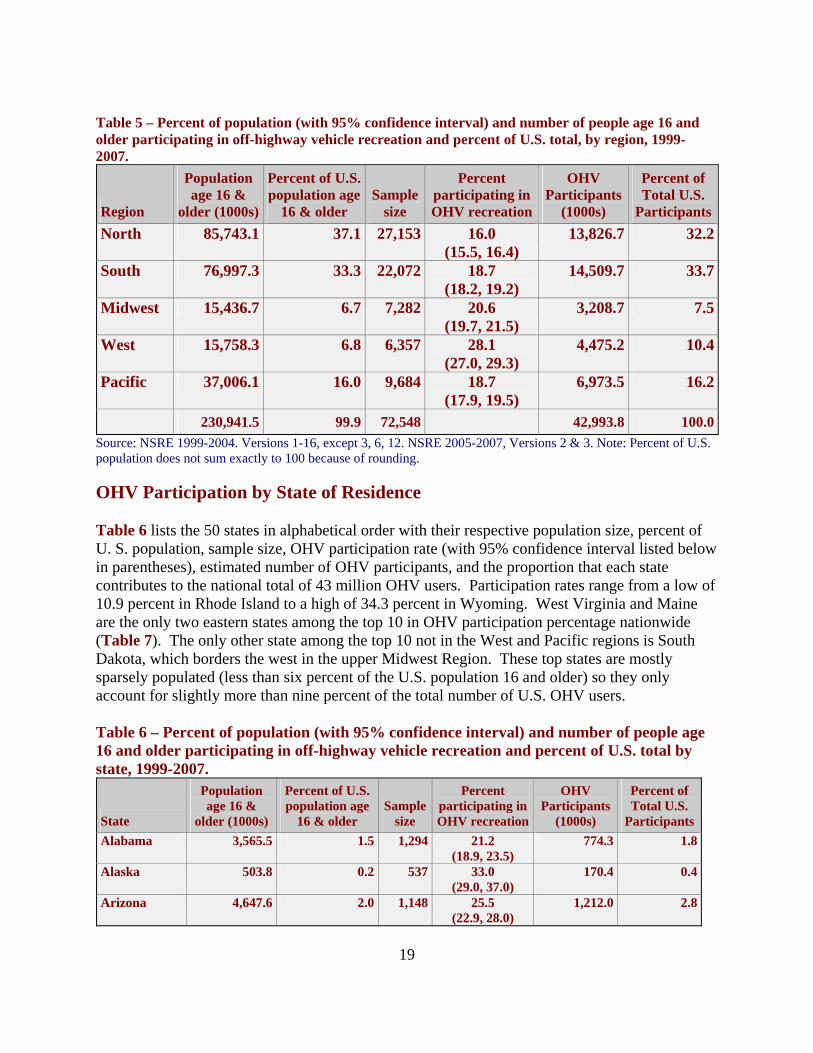
230,941.5 99.9 72,548 42,993.8 100.0Source: NSRE 1999-2004. Versions 1-16, except 3, 6, 12. NSRE 2005-2007, Versions 2 & 3. Note: Percent of U.S. population does not sum exactly to 100 because of rounding. OHV Participation by State of Residence Table 6 lists the 50 states in alphabetical order with their respective population size, percent of U. S. population, sample size, OHV participation rate (with 95% confidence interval listed below in parentheses), estimated number of OHV participants, and the proportion that each state contributes to the national total of 43 million OHV users. Participation rates range from a low of 10.9 percent in Rhode Island to a high of 34.3 percent in Wyoming. West Virginia and Maine are the only two eastern states among the top 10 in OHV participation percentage nationwide (Table 7). The only other state among the top 10 not in the West and Pacific regions is South Dakota, which borders the west in the upper Midwest Region. These top states are mostly sparsely populated (less than six percent of the U.S. population 16 and older) so they only account for slightly more than nine percent of the total number of U.S. OHV users. Table 6 – Percent of population (with 95% confidence interval) and number of people age 16 and older participating in off-highway vehicle recreation and percent of U.S. total by state, 1999-2007.
State
Population age 16 &
older (1000s)
Percent of U.S. population age
16 & older Sample
size
Percent participating in OHV recreation
OHV Participants
(1000s)
Percent of Total U.S.
Participants Alabama 3,565.5 1.5 1,294 21.2
(18.9, 23.5) 774.3 1.8
Alaska 503.8 0.2 537 33.0 (29.0, 37.0)
170.4 0.4
Arizona 4,647.6 2.0 1,148 25.5 (22.9, 28.0)
1,212.0 2.8

20
State
Population age 16 &
older (1000s)
Percent of U.S. population age
16 & older Sample
size
Percent participating in OHV recreation
OHV Participants
(1000s)
Percent of Total U.S.
Participants Arkansas 2,168.9 0.9 1,009 25.1
(22.4, 27.8) 557.1 1.3
California 27,609.2 12.0 6,090 17.6 (16.7, 18.6)
4,986.1 11.6
Colorado 3,661.5 1.6 1,131 26.9 (24.3, 29.6)
1,010.5 2.4
Connecticut 2,747.9 1.2 1,025 14.1 (12.0, 16.3)
397.8 0.9
Delaware 664.0 0.3 531 14.2 (11.2, 17.2)
96.5 0.2
District of Columbia
472.5 0.2 491 11.1 (8.3, 14.0)
53.9 0.1
Florida 14,339.7 6.2 2,950 13.8 (12.5, 15.1)
2,028.3 4.7
Georgia 7,084.6 3.1 1,899 18.2 (16.4, 19.9)
1,319.4 3.1
Hawaii 1,006.6 0.4 595 12.1 (9.5, 14.8)
124.9 0.3
Idaho 1,101.9 0.5 683 34.2 (30.6, 37.8)
386.4 0.9
Illinois 9,843.7 4.3 2,611 13.6 (12.3, 15.0)
1,374.1 3.2
Indiana 4,849.3 2.1 1,602 16.1 (14.3, 18.0)
801.5 1.9
Iowa 2,324.0 1.0 1,072 17.0 (14.8, 19.3)
405.9 0.9
Kansas 2,119.3 0.9 1,038 18.1 (15.7, 20.5)
392.9 0.9
Kentucky 3,275.8 1.4 1,406 22.6 (20.4, 24.8)
757.8 1.8
Louisiana 3,278.6 1.4 1,262 18.7 (16.6, 20.9)
629.5 1.5
Maine 1,062.8 0.5 689 26.8 (23.5, 30.2)
292.2 0.7
Maryland 4,356.7 1.9 1,312 14.3 (12.4, 16.2)
638.9 1.5
Massachusetts 5,089.1 2.2 1,543 12.7 (11.1, 14.4)
664.3 1.5
Michigan 7,807.9 3.4 2,321 20.0 (18.4, 21.7)
1,601.2 3.7
Minnesota 4,003.5 1.7 1,416 23.8 (21.5, 26.0)
974.8 2.3
Mississippi 2,208.4 1.0 1,094 22.3 (19.8, 24.8)
504.0 1.2
Missouri 4,530.4 2.0 1,644 19.6 (17.6, 21.5)
908.0 2.1
Montana 743.9 0.3 651 28.7 (25.2, 32.2)
219.0 0.5
Nebraska 1,355.7 0.6 836 17.6 (15.0, 20.2)
244.1 0.6

21
State
Population age 16 &
older (1000s)
Percent of U.S. population age
16 & older Sample
size
Percent participating in OHV recreation
OHV Participants
(1000s)
Percent of Total U.S.
Participants Nevada 1,902.5 0.8 677 23.9
(20.7, 27.2) 466.3 1.1
New Hampshire
1,040.7 0.5 597 20.2 (16.9, 23.5)
215.1 0.5
New Jersey 6,784.6 2.9 1,749 12.6 (11.0, 14.2)
875.1 2.0
New Mexico 1,484.0 0.6 740 27.3 (24.0, 30.5)
414.8 1.0
New York 15,116.2 6.5 3,765 12.9 (11.8, 13.9)
1,990.6 4.6
North Carolina
6,846.7 3.0 2,017 19.6 (17.9, 21.4)
1,378.3 3.2
North Dakota 501.7 0.2 620 25.4 (21.9, 28.9)
130.5 0.3
Ohio 8,911.1 3.9 2,579 15.6 (14.2, 17.1)
1,427.2 3.3
Oklahoma 2,748.2 1.2 1,082 24.7 (22.1, 27.3)
695.5 1.6
Oregon 2,905.5 1.3 1,037 22.2 (19.6, 24.8)
660.6 1.5
Pennsylvania 9,848.8 4.3 2,768 18.8 (17.4, 20.3)
1,899.8 4.4
Rhode Island 847.2 0.4 595 10.9 (8.4, 13.5)
94.9 0.2
South Carolina
3,358.7 1.5 1,131 18.5 (16.2, 20.8)
638.2 1.5
South Dakota 602.1 0.3 656 27.0 (23.6, 30.4)
166.5 0.4
Tennessee 4,696.5 2.0 1,559 18.9 (16.9, 20.9)
909.8 2.1
Texas 17,466.2 7.6 3,845 16.5 (15.3, 17.7)
2,957.4 6.9
Utah 1,814.6 0.8 800 32.5 (29.2, 35.8)
604.4 1.4
Vermont 501.4 0.2 534 18.2 (14.9, 21.5)
93.5 0.2
Virginia 5,959.5 2.6 1,524 19.1 (17.1, 21.1)
1,168.7 2.7
Washington 4,980.9 2.2 1,425 22.1 (19.9, 24.3)
1,126.7 2.6
West Virginia 1,455.6 0.6 902 33.7 (30.5, 36.8)
502.3 1.2
Wisconsin 4,343.7 1.9 1,539 20.4 (18.4, 22.4)
907.9 2.1
Wyoming 402.4 0.2 527 34.3 (30.2, 38.4)
141.3 0.3
230,941.6 100.3 72,548 42,991.2 99.9Source: NSRE 1999-2004. Versions 1-16, except 3, 6, 12. NSRE 2005-2007, Versions 2 & 3. Note: Percent of U.S. totals do not sum exactly to 100 because of rounding.

22
Table 7 – Population and estimated number of participants ordered from highest to lowest by percentage of population participating (with 95% confidence interval) in off-highway vehicle recreation in the top 10 states.
State
Population age 16 &
older (1000s)
Percent of U.S.
population age 16 &
older Sample
size
Percent participating
in OHV recreation
OHV Participants
(1000s)
Percent of Total U.S.
ParticipantsWyoming 402.4 0.2 527 34.3
(30.2, 38.4) 141.3 0.3
Idaho 1,101.9 0.5 683 34.2 (30.6, 37.8)
386.4 0.9
West Virginia 1,455.6 0.6 902 33.7 (30.5, 36.8)
502.3 1.2
Alaska 503.8 0.2 537 33.0 (29.0, 37.0)
170.4 0.4
Utah 1,814.6 0.8 800 32.5 (29.2, 35.8)
604.4 1.4
Montana 743.9 0.3 651 28.7 (25.2, 32.2)
219.0 0.5
New Mexico 1,484.0 0.6 740 27.3 (24.0, 30.5)
414.8 1.0
South Dakota 602.1 0.3 656 27.0 (23.6, 30.4)
166.5 0.4
Colorado 3,661.5 1.6 1,131 26.9 (24.3, 29.6)
1,010.5 2.4
Maine 1,062.8 0.5 689 26.8 (23.5, 30.2)
292.2 0.7
12,832.6 5.6 7,316 3,907.8 9.2Source: NSRE 1999-2004. Versions 1-16, except 3, 6, 12. NSRE 2005-2007, Versions 2 & 3. Eight of the 10 states with the lowest participation rates are in the East (Table 8). Only Hawaii and Illinois are outside that region. These 10 states, which include New York and Florida, make up one-quarter of the U.S. population age 16 and older and almost 18 percent of OHV users in the country. Not surprisingly, the ten states with the largest populations also have the most OHV users (Table 9). California has 4.99 million OHV users accounting for 11.6 percent of the U.S. total, which is more than 1.5 times the number of participants in second-ranked Texas. The 10 states with the largest number of participants account for 54 percent of the nation’s population age 16 and older and 49 percent of its OHV users. The 10 states with the smallest populations—eight of which have less than one million people age 16 and older, and the other two just over one million, account for a very small proportion (2.9%) of OHV users in the United States (Table 10). These 10 states also account for just 2.9 percent of the U.S. population age 16 and older. Five of those states are in the western regions, and five (including DC) are in the East.
23
Table 8—Percent of population and number of participants ordered from lowest to highest by percentage of population participating in off-highway vehicle recreation in the bottom 10 states.
State
Population age 16 &
older (1000s)
Percent of U.S.
population age 16 &
older Sample
size
Percent participating
in OHV recreation
OHV Participants
(1000s)
Percent of Total U.S.
ParticipantsRhode Island 847.2 0.4 595 10.9
(8.4, 13.5) 94.9 0.2
District of Columbia
472.5 0.2 491 11.1 (8.3, 14.0)
53.9 0.1
Hawaii 1,006.6 0.4 595 12.1 (9.5, 14.8)
124.9 0.3
New Jersey 6,784.6 2.9 1,749 12.6 (11.0, 14.2)
875.1 2.0
Massachusetts 5,089.1 2.2 1,543 12.7 (11.1, 14.4)
664.3 1.5
New York 15,116.2 6.5 3,765 12.9 (11.8, 13.9)
1,990.6 4.6
Illinois 9,843.7 4.3 2,611 13.6 (12.3, 15.0)
1,374.1 3.2
Florida 14,339.7 6.2 2,950 13.8 (12.5, 15.1)
2,028.3 4.7
Connecticut 2,747.9 1.2 1,025 14.1 (12.0, 16.3)
397.8 0.9
Delaware 664.0 0.3 531 14.2 (11.2, 17.2)
96.5 0.2
56,911.5 24.6 15,855 7,700.4 17.7Source: NSRE 1999-2004. Versions 1-16, except 3, 6, 12. NSRE 2005-2007, Versions 2 & 3. Table 9 – Percent of population and number of participants ordered from highest to lowest by the number of off-highway vehicle recreation participants in the top 10 states.
State
Population age 16 &
older (1000s)
Percent of U.S.
population age 16 &
older Sample
size
Percent participating
in OHV recreation
OHV Participants
(1000s)
Percent of Total U.S.
ParticipantsCalifornia 27,609.2 12.0 6,090 17.6
(16.7, 18.6) 4,986.1 11.6
Texas 17,466.2 7.6 3,845 16.5 (15.3, 17.7)
2,957.4 6.9
Florida 14,339.7 6.2 2,950 13.8 (12.5, 15.1)
2,028.3 4.7

24
State
Population age 16 &
older (1000s)
Percent of U.S.
population age 16 &
older Sample
size
Percent participating
in OHV recreation
OHV Participants
(1000s)
Percent of Total U.S.
ParticipantsNew York 15,116.2 6.5 3,765 12.9
(11.8, 13.9) 1,990.6 4.6
Pennsylvania 9,848.8 4.3 2,768 18.8 (17.4, 20.3)
1,899.8 4.4
Michigan 7,807.9 3.4 2,321 20.0 (18.4, 21.7)
1,601.2 3.7
Ohio 8,911.1 3.9 2,579 15.6 (14.2, 17.1)
1,427.2 3.3
North Carolina 6,846.7 3.0 2,017 19.6 (17.9, 21.4)
1,378.3 3.2
Illinois 9,843.7 4.3 2,611 13.6 (12.3, 15.0)
1,374.1 3.2
Georgia 7,084.6 3.1 1,899 18.2 (16.4, 19.9)
1,319.4 3.1
124,874.1 54.3 30,845 20,962.4 48.7Source: NSRE 1999-2004. Versions 1-16, except 3, 6, 12. NSRE 2005-2007, Versions 2 & 3. Note: Percent participating includes the 95% confidence interval in parentheses. Table 10 – Percent of population and number of participants ordered from lowest to highest by the number of off-highway vehicle recreation participants in the bottom 10 states.
State
Population age 16 &
older (1000s)
Percent of U.S.
population age 16 &
older Sample
size
Percent participating
in OHV recreation
OHV Participants
(1000s)
Percent of Total U.S.
ParticipantsDistrict of Columbia 472.5 0.2 491 11.1
(8.3, 14.0) 53.9 0.1
Vermont 501.4 0.2 534 18.2 (14.9, 21.5)
93.5 0.2
Rhode Island 847.2 0.4 595 10.9 (8.4, 13.5)
94.9 0.2
Delaware 664.0 0.3 531 14.2 (11.2, 17.2)
96.5 0.2
Hawaii 1,006.6 0.4 595 12.1 (9.5, 14.8)
124.9 0.3
North Dakota 501.7 0.2 620 25.4 (21.9, 28.9)
130.5 0.3
Wyoming 402.4 0.2 527 34.3 (30.2, 38.4)
141.3 0.3
South Dakota 602.1 0.3 656 27.0 (23.6, 30.4)
166.5 0.4
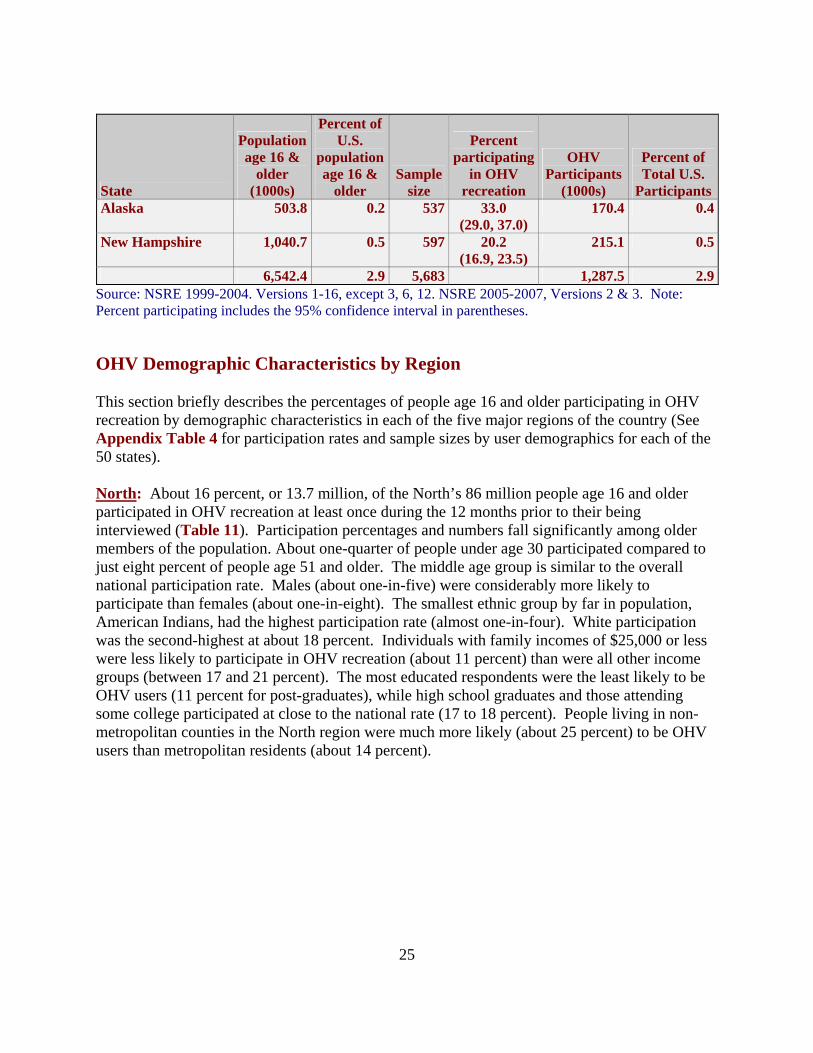
25
State
Population age 16 &
older (1000s)
Percent of U.S.
population age 16 &
older Sample
size
Percent participating
in OHV recreation
OHV Participants
(1000s)
Percent of Total U.S.
ParticipantsAlaska 503.8 0.2 537 33.0
(29.0, 37.0) 170.4 0.4
New Hampshire 1,040.7 0.5 597 20.2 (16.9, 23.5)
215.1 0.5
6,542.4 2.9 5,683 1,287.5 2.9Source: NSRE 1999-2004. Versions 1-16, except 3, 6, 12. NSRE 2005-2007, Versions 2 & 3. Note: Percent participating includes the 95% confidence interval in parentheses. OHV Demographic Characteristics by Region This section briefly describes the percentages of people age 16 and older participating in OHV recreation by demographic characteristics in each of the five major regions of the country (See Appendix Table 4 for participation rates and sample sizes by user demographics for each of the 50 states). North: About 16 percent, or 13.7 million, of the North’s 86 million people age 16 and older participated in OHV recreation at least once during the 12 months prior to their being interviewed (Table 11). Participation percentages and numbers fall significantly among older members of the population. About one-quarter of people under age 30 participated compared to just eight percent of people age 51 and older. The middle age group is similar to the overall national participation rate. Males (about one-in-five) were considerably more likely to participate than females (about one-in-eight). The smallest ethnic group by far in population, American Indians, had the highest participation rate (almost one-in-four). White participation was the second-highest at about 18 percent. Individuals with family incomes of $25,000 or less were less likely to participate in OHV recreation (about 11 percent) than were all other income groups (between 17 and 21 percent). The most educated respondents were the least likely to be OHV users (11 percent for post-graduates), while high school graduates and those attending some college participated at close to the national rate (17 to 18 percent). People living in non-metropolitan counties in the North region were much more likely (about 25 percent) to be OHV users than metropolitan residents (about 14 percent).

26
Table 11—Percent of population and number of people age 16 and older participating in off-highway vehicle recreation, by demographic category, 1999-2007, North Region (n=27,153).
Demographic Strata Population
(1000s) Sample
size Percent
participating Participants
(1000s)
All Groups All people age 16+ 85,743.1 27,153 16.0 13,699.2
Under 30 20,627.2 5,288 24.9 5,146.4
30-50 33,026.7 11,575 18.0 5,927.2
Age
51 & older 32,089.3 9,736 8.1 2,625.6
Male 41,346.3 11,760 19.9 8,261.5Gender
Female 44,396.9 15,324 12.2 5,437.7
White 64,538.5 22,792 17.6 11,354.7
Black 10,170.2 1,836 11.7 1,191.7
American Indian 239.9 265 23.1 55.4
Asian/Pacific Islander 3,309.6 357 14.8 488.9
Race/ ethnicity
Hispanic 6,802.7 1,096 10.8 735.2
$25,000 or less 12,507.8 3,060 11.4 1,429.8
$25,000 to $49,999 18,694.1 5,249 18.0 3,359.3
$50,000 to $74,999 15,678.5 3,988 19.3 3,022.1
$75,000 to $99,999 9,323.5 2,146 20.3 1,895.3
$100,000 to $149,999 7,429.9 1,698 19.7 1,460.5
Annual family income
$150,000 or more 4,382.1 972 20.8 913.6
Less than high school 14,869.1 2,200 15.2 2,264.0
High school graduate 24,975.4 7,272 17.9 4,479.0
Some college/tech. school 21,698.9 7,397 17.4 3,773.3
Bachelor's degree 11,889.1 5,838 14.0 1,663.4
Education
Post-graduate degree 7,041.5 4,035 10.7 756.0
Non-metropolitan 12,028.5 6,871 25.4 3,054.3Place of residence Metropolitan 73,714.6 20,282 14.4 10,644.9
Source: 2006 Census Estimates Program (age, sex, race/ethnicity, residence: civilian, non-institutionalized population); 2000 Census, SF3 (education, income); NSRE 1999-2004, Versions 1-16 except 3, 6, 12; and NSRE 2005-2007, Versions 2 & 3. Note: Estimates are statistically unreliable and thus not reported for demographic strata with a sample size of less than 30.
South: Just under 19 percent, or 14.4 million of the South’s 77 million people over 16, were OHV participants during the survey period (Table 12). People under age 30 (31 percent) were

27
about three times more likely to participate as people over age 50 (less than ten percent). Almost one-in-four males participated compared to 14 percent of females. Whites and American Indians had the highest participation rates (22 to 23 percent) among racial and ethnic groups. People earning $150,000 or more per year were the most likely to be OHV users (28 percent), while those earning $25,000 or less were the least likely (14 percent). Similar to the North, the most educated individuals were least likely to be OHV participants (15 percent). Non-metropolitan residents at 24 percent outpaced metropolitan residents at 17 percent. Table 12—Percent of population and number of people age 16 and older participating in off-highway vehicle recreation, by demographic category, 1999-2007, South Region (n=22,072).
Demographic Strata Population
(1000s) Sample
size Percent
participating Participants
(1000s)
All Groups All people age 16+ 76,997.3 22,072 18.7 14,375.9
Under 30 19,433.2 4,794 30.9 6,014.5
30-50 29,622.4 8,903 19.7 5,848.4
Age
51 & older 27,941.6 7,997 8.9 2,513.0
Male 37,445.2 9,362 24.2 9,028.0Gender
Female 39,552.1 12,639 13.5 5,347.9
White 50,233.5 17,333 21.9 11,008.3
Black 13,420.7 2,399 12.6 1,697.7
American Indian 509.9 308 22.6 115.3
Asian/Pacific Islander 1,820.6 167 13.0 237.2
Race/ethnicity
Hispanic 10,354.5 1,394 13.2 1,363.7
$25,000 or less 14,204.2 2,884 13.5 1,916.5
$25,000 to $49,999 18,055.6 4,421 21.5 3,885.0
$50,000 to $74,999 12,402.3 3,012 23.3 2,885.8
$75,000 to $99,999 6,312.1 1,607 24.2 1,526.7
$100,000 to $149,999 4,555.8 1,110 22.3 1,014.7
Annual family income
$150,000 or more 2,693.0 640 27.8 748.8
Less than high school 15,906.3 2,644 18.1 2,883.5
High school graduate 19,650.9 5,833 19.2 3,778.5
Some college/tech. school 19,093.9 6,503 20.4 3,893.9
Bachelor's degree 9,066.3 4,189 17.9 1,622.1
Education
Post-graduate degree 4,601.6 2,535 15.0 688.1

28
Demographic Strata Population
(1000s) Sample
size Percent
participating Participants
(1000s)
Non-metropolitan 16,108.7 8,834 23.8 3,827.8Place of residence Metropolitan 60,888.6 13,238 17.3 10,548.1
Source: 2006 Census Estimates Program (age, sex, race/ethnicity, residence: civilian, non-institutionalized population); 2000 Census, SF3 (education, income); NSRE 1999-2004, Versions 1-16 except 3, 6, 12; and NSRE 2005-2007, Versions 2 & 3. Note: Estimates are statistically unreliable and thus not reported for demographic strata with a sample size of less than 30. Midwest: Twenty-one percent, or 3.2 million of the Midwest’s 15.4 million residents, participated in OHV recreation (Table 13). The youngest age group (33 percent) was nearly three times more likely to participate as the oldest (11 percent). Males (27 percent) were much more likely to be users than females (15 percent), as were American Indians (39 percent) among racial and ethnic groups. Hispanics (19 percent) were more likely to participate in the Midwest region than in either of the eastern regions. Except for the lowest income group (14 percent), participation varied relatively little by income class with the upper middle income group making $75,000 to $99,999 annually having the highest rate (29 percent). Similar to the eastern regions, people with the most education were least likely to be OHV users (11 percent). Individuals with less than a high school education were most likely to participate (23 percent). Also, non-metropolitan residents (25 percent) participated in the Midwest at a higher rate than metropolitan dwellers (19 percent). Table 13—Percent of population and number of people age 16 and older participating in off-highway vehicle recreation, by demographic category, 1999-2007, Midwest Region (n=7,282).
Demographic Strata Population
(1000s)Sample
sizePercent
participating Participants
(1000s)
All Groups All people age 16+ 15,436.7 7,282 20.6 3,179.1
Under 30 3,915.4 1,432 32.5 1,272.4
30-50 5,744.4 2,981 21.7 1,245.5
Age
51 & older 5,776.9 2,764 11.4 661.2
Male 7,553.1 3,216 26.7 2,013.0Gender
Female 7,883.6 4,051 14.8 1,166.1
White 13,422.2 6,658 21.6 2,898.4
Black 850.5 168 7.0 59.2
American Indian 156.1 111 39.0 60.9
Asian/Pacific Islander 307.3 43 18.5 57.0
Race/ ethnicity
Hispanic 567.7 152 18.6 105.7
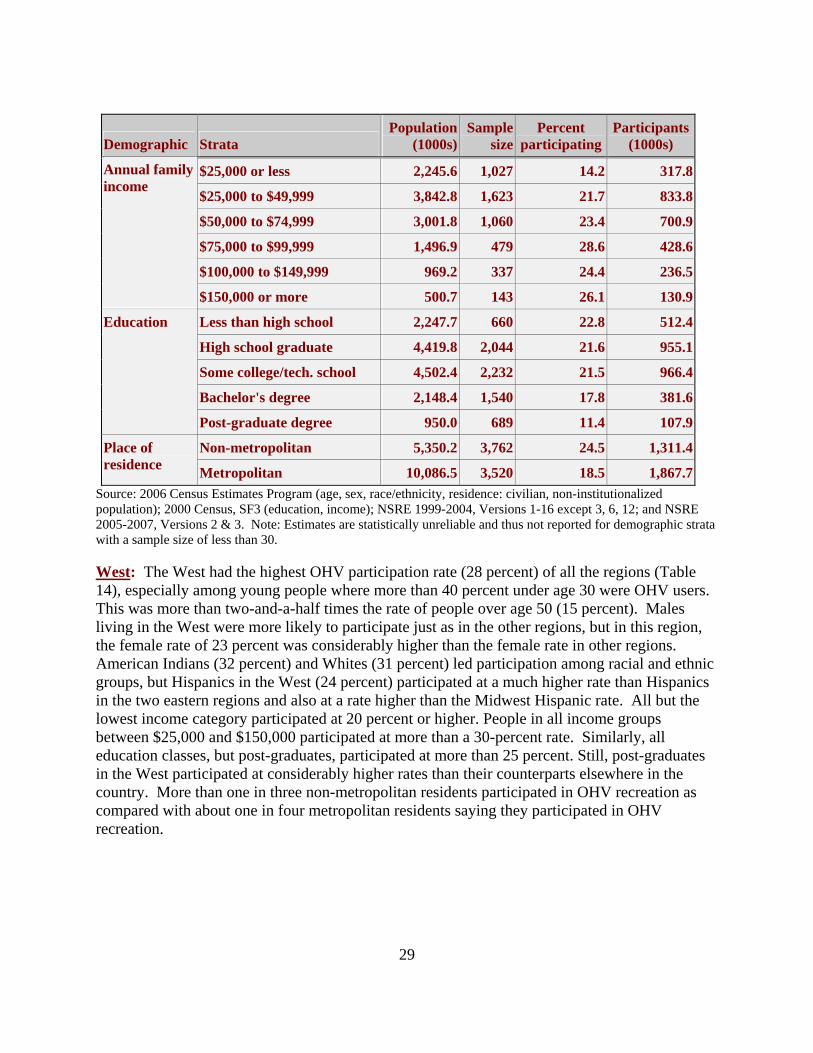
29
Demographic Strata Population
(1000s)Sample
sizePercent
participating Participants
(1000s)
$25,000 or less 2,245.6 1,027 14.2 317.8
$25,000 to $49,999 3,842.8 1,623 21.7 833.8
$50,000 to $74,999 3,001.8 1,060 23.4 700.9
$75,000 to $99,999 1,496.9 479 28.6 428.6
$100,000 to $149,999 969.2 337 24.4 236.5
Annual family income
$150,000 or more 500.7 143 26.1 130.9
Less than high school 2,247.7 660 22.8 512.4
High school graduate 4,419.8 2,044 21.6 955.1
Some college/tech. school 4,502.4 2,232 21.5 966.4
Bachelor's degree 2,148.4 1,540 17.8 381.6
Education
Post-graduate degree 950.0 689 11.4 107.9
Non-metropolitan 5,350.2 3,762 24.5 1,311.4Place of residence Metropolitan 10,086.5 3,520 18.5 1,867.7
Source: 2006 Census Estimates Program (age, sex, race/ethnicity, residence: civilian, non-institutionalized population); 2000 Census, SF3 (education, income); NSRE 1999-2004, Versions 1-16 except 3, 6, 12; and NSRE 2005-2007, Versions 2 & 3. Note: Estimates are statistically unreliable and thus not reported for demographic strata with a sample size of less than 30. West: The West had the highest OHV participation rate (28 percent) of all the regions (Table 14), especially among young people where more than 40 percent under age 30 were OHV users. This was more than two-and-a-half times the rate of people over age 50 (15 percent). Males living in the West were more likely to participate just as in the other regions, but in this region, the female rate of 23 percent was considerably higher than the female rate in other regions. American Indians (32 percent) and Whites (31 percent) led participation among racial and ethnic groups, but Hispanics in the West (24 percent) participated at a much higher rate than Hispanics in the two eastern regions and also at a rate higher than the Midwest Hispanic rate. All but the lowest income category participated at 20 percent or higher. People in all income groups between $25,000 and $150,000 participated at more than a 30-percent rate. Similarly, all education classes, but post-graduates, participated at more than 25 percent. Still, post-graduates in the West participated at considerably higher rates than their counterparts elsewhere in the country. More than one in three non-metropolitan residents participated in OHV recreation as compared with about one in four metropolitan residents saying they participated in OHV recreation.

30
Table 14—Percent of population and number of people age 16 and older participating in off-highway vehicle recreation, by demographic category, 1999-2007, West Region (n=6,357).
Demographic Strata Population
(1000s) Sample
size Percent
participating Participants
(1000s)
All Groups All people age 16+ 15,758.3 6,357 28.1 4,433.9
Under 30 4,250.2 1,340 40.7 1,728.1
30-50 6,017.0 2,603 31.2 1,880.8
Age
51 & older 5,491.1 2,332 15.0 824.9
Male 7,864.6 2,950 32.9 2,589.1Gender
Female 7,893.7 3,397 23.3 1,844.8
White 11,139.9 5,267 30.9 3,440.8
Black 462.2 102 11.5 53.3
American Indian 427.6 113 31.7 135.5
Asian/Pacific Islander 424.5 63 6.4 27.0
Race/ ethnicity
Hispanic 3,131.7 654 24.0 752.3
$25,000 or less 2,306.7 823 18.0 415.3
$25,000 to $49,999 3,515.7 1,492 30.2 1,060.5
$50,000 to $74,999 2,569.3 956 35.4 908.8
$75,000 to $99,999 1,368.4 427 41.2 563.2
$100,000 to $149,999 962.3 317 40.6 390.4
Annual family income
$150,000 or more 528.6 162 39.8 210.3
Less than high school 2,355.5 581 25.6 603.8
High school graduate 3,464.6 1,560 27.6 955.8
Some college/tech. school 4,448.4 2,016 33.3 1,479.6
Bachelor's degree 1,986.6 1,341 26.1 518.4
Education
Post-graduate degree 997.4 761 23.0 229.6
Non-metropolitan 3,089.9 2,619 34.5 1,065.3Place of residence Metropolitan 12,668.4 3,738 26.6 3,368.6
Source: 2006 Census Estimates Program (age, sex, race/ethnicity, residence: civilian, non-institutionalized population); 2000 Census, SF3 (education, income); NSRE 1999-2004, Versions 1-16 except 3, 6, 12; and NSRE 2005-2007, Versions 2 & 3. Note: Estimates are statistically unreliable and thus not reported for demographic strata with a sample size of less than 30.
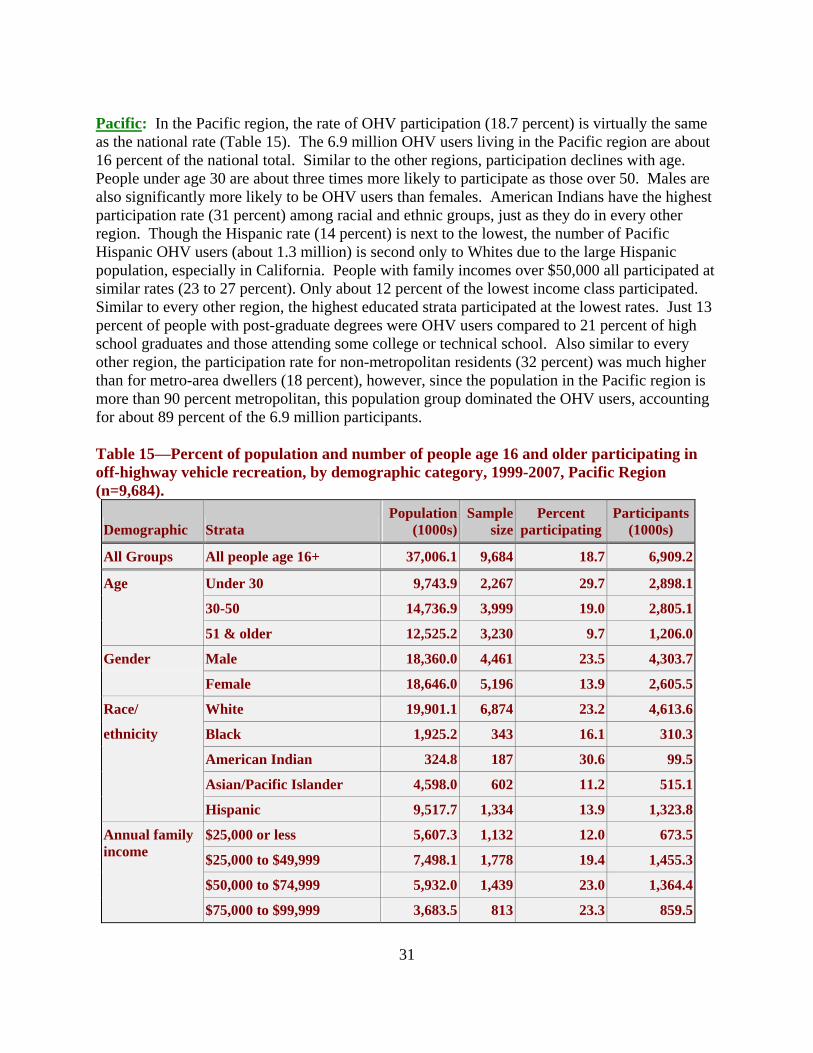
31
Pacific: In the Pacific region, the rate of OHV participation (18.7 percent) is virtually the same as the national rate (Table 15). The 6.9 million OHV users living in the Pacific region are about 16 percent of the national total. Similar to the other regions, participation declines with age. People under age 30 are about three times more likely to participate as those over 50. Males are also significantly more likely to be OHV users than females. American Indians have the highest participation rate (31 percent) among racial and ethnic groups, just as they do in every other region. Though the Hispanic rate (14 percent) is next to the lowest, the number of Pacific Hispanic OHV users (about 1.3 million) is second only to Whites due to the large Hispanic population, especially in California. People with family incomes over $50,000 all participated at similar rates (23 to 27 percent). Only about 12 percent of the lowest income class participated. Similar to every other region, the highest educated strata participated at the lowest rates. Just 13 percent of people with post-graduate degrees were OHV users compared to 21 percent of high school graduates and those attending some college or technical school. Also similar to every other region, the participation rate for non-metropolitan residents (32 percent) was much higher than for metro-area dwellers (18 percent), however, since the population in the Pacific region is more than 90 percent metropolitan, this population group dominated the OHV users, accounting for about 89 percent of the 6.9 million participants. Table 15—Percent of population and number of people age 16 and older participating in off-highway vehicle recreation, by demographic category, 1999-2007, Pacific Region (n=9,684).
Demographic Strata Population
(1000s)Sample
sizePercent
participating Participants
(1000s)
All Groups All people age 16+ 37,006.1 9,684 18.7 6,909.2
Under 30 9,743.9 2,267 29.7 2,898.1
30-50 14,736.9 3,999 19.0 2,805.1
Age
51 & older 12,525.2 3,230 9.7 1,206.0
Male 18,360.0 4,461 23.5 4,303.7Gender
Female 18,646.0 5,196 13.9 2,605.5
White 19,901.1 6,874 23.2 4,613.6
Black 1,925.2 343 16.1 310.3
American Indian 324.8 187 30.6 99.5
Asian/Pacific Islander 4,598.0 602 11.2 515.1
Race/
ethnicity
Hispanic 9,517.7 1,334 13.9 1,323.8
$25,000 or less 5,607.3 1,132 12.0 673.5
$25,000 to $49,999 7,498.1 1,778 19.4 1,455.3
$50,000 to $74,999 5,932.0 1,439 23.0 1,364.4
Annual family income
$75,000 to $99,999 3,683.5 813 23.3 859.5

32
Demographic Strata Population
(1000s)Sample
sizePercent
participating Participants
(1000s)
$100,000 to $149,999 3,232.6 686 24.1 779.3
$150,000 or more 2,052.0 446 27.2 557.6
Less than high school 7,171.7 938 17.9 1,286.6
High school graduate 7,396.1 1,974 20.9 1,545.7
Some college/tech. school 10,501.4 3,076 21.5 2,259.6
Bachelor's degree 5,191.5 2,128 15.4 800.1
Education
Post-graduate degree 2,704.6 1,404 12.5 338.2
Non-metropolitan 2,357.1 1,874 32.0 753.9Place of residence Metropolitan 34,649.0 7,810 17.7 6,155.3
Source: 2006 Census Estimates Program (age, sex, race/ethnicity, residence: civilian, non-institutionalized population); 2000 Census, SF3 (education, income); NSRE 1999-2004, Versions 1-16 except 3, 6, 12; and NSRE 2005-2007, Versions 2 & 3. Note: Estimates are statistically unreliable and thus not reported for demographic strata with a sample size of less than 30. Annual OHV Activity Days Data for calculating mean or average annual OHV activity days by demographic category are somewhat limited for the five regions because of limited NSRE sample size across regions. The sample for each region is sufficient, however, to estimate total user days, except for a few of the demographic strata. Because of limited samples, activity days analysis was not attempted at state level. The five tables (tables 16-20), that follow, report the average annual OHV days for each region overall and by demographic stratum along with the stratum sample size and the 95-percent confidence range. The confidence intervals shown are a function of both the stratum sample size and the variance of values (not shown) around the sample mean. For reference, the national mean based on 3,966 responses was 27.9 days annually (see line 1 of Table 4). The 95 percent confidence interval for the national sample was 26.1 to 29.8 days. The following text briefly describe annual OHV activity days for each region. North: The mean days for the North region was slightly less than the national mean at about 24 days of OHV activity per year (Table 16). People in this region under age 30 spent 31 days on average compared to 19 for people age 30-50. Males spent about four to five more days on average than females. Small sample size did not allow for any reliable estimates for American Indians and Asian/Pacific Islanders. The interval estimate for blacks includes a negative lower bound, which also indicates an unreliable estimate. The same was very nearly true for Hispanics (lower bound of 0.6 days). The lowest income class spent by far the most days (about 41), although the confidence interval is quite wide. There was also a large mean for persons with less than a high school education, whose 43 activity days per year were the highest, but based on a relatively small sample of 108 people. Non-metropolitan residents participated in OHV about four more days per year than metropolitan residents.

33
Table 16—Mean annual activity days (with 95% confidence intervals) of people age 16 and older who participated in off-highway vehicle recreation, 2001-2007, North Region.
Demographic Strata Sample
size 95% c.i.
lower boundMean annual
OHV days 95% c.i.
upper bound
All Groups All people age 16 & older 1,275 21.1 24.2 27.3
Under 30 354 22.1 31.3 40.530-50 617 15.5 18.5 21.4
Age
51 & older 292 17.1 21.7 26.3Male 755 21.7 25.9 30.1Gender
Female 520 16.7 21.4 26.0White 1,136 20.9 23.9 26.9Black 49 -4.1 32.3 68.8American Indian 18 . . .Asian/Pacific Islander 9 . . .
Race/ethnicity
Hispanic 36 0.6 13.7 26.8$25,000 or less 114 23.1 41.0 58.9$25,000 to $49,999 267 15.0 20.0 25.0$50,000 to $74,999 229 13.1 16.1 19.1$75,000 to $99,999 143 12.2 17.5 22.8$100,000 to $149,999 116 12.3 18.7 25.2
Annual family income
$150,000 or more 55 8.1 13.7 19.3Less than high school 108 15.7 42.5 69.3High school graduate 377 18.3 23.1 28.0Some college/tech. school 363 14.8 19.4 24.1Bachelor's degree 261 12.7 16.2 19.7
Education
Post-graduate degree 141 8.7 11.9 15.0Non-metropolitan 444 24.0 27.8 31.5Place of
residence Metropolitan 831 18.9 23.2 27.6
Source: NSRE 1999-2004, Versions 8, 10, & 15; and NSRE 2005-2007, Versions 2 & 3. Note: Estimates are statistically unreliable and thus not reported for demographic strata with a sample size of less than 30.

34
South: Average days among South region residents (37.2) were significantly higher than the national average (Table 17). Frequency of participation by age was about the same for the two younger age groups, about 38 to 40 days annually. Males participated on average about 11 more days per year than females, and Whites participated about 7 more days per year than Blacks. A very wide confidence interval for Hispanics’ days of participation renders its average of 74 days per year to be very suspect. Average days by income varied significantly with the $100,000 to $149,000 group averaging the highest with 35 days per year. A similar situation by educational attainment resulted in the two lowest education classes having the two highest means at about 56 and 36 days per year respectively. Non-metro and metro residents’ annual OHV days (about 37) were essentially the same. Table 17—Mean annual activity days (with 95% confidence intervals) of people age 16 and older who participated in off-highway vehicle recreation, 2001-2007, South Region.
Demographic Strata Sample
size 95% c.i.
lower boundMean annual
OHV days 95% c.i.
upper bound
All Groups All people age 16 & older 1,186 33.0 37.2 41.5
Under 30 348 28.6 39.4 50.2
30-50 555 32.7 37.9 43.2
Age
51 & older 275 23.4 29.8 36.2
Male 666 35.0 41.4 47.9Gender
Female 520 25.2 30.5 35.7
White 1,022 30.1 33.6 37.2
Black 78 7.6 26.3 45.1
American Indian 18 . . .
Asian/Pacific Islander 4 . . .
Race/ethnicity
Hispanic 50 12.1 74.6 137.1
$25,000 or less 124 27.7 43.0 58.3
$25,000 to $49,999 264 19.0 24.7 30.4
$50,000 to $74,999 191 25.5 33.2 40.8
$75,000 to $99,999 138 17.3 23.8 30.3
$100,000 to $149,999 83 21.6 35.2 48.9
Annual family income
$150,000 or more 57 20.8 28.8 36.8
Less than high school 140 27.7 55.6 83.5
High school graduate 295 28.1 35.9 43.7
Some college/tech. school 373 21.2 25.2 29.3
Education
Bachelor's degree 232 17.6 22.3 27.0

35
Demographic Strata Sample
size 95% c.i.
lower boundMean annual
OHV days 95% c.i.
upper bound
Post-graduate degree 129 21.8 29.6 37.4
Non-metropolitan 486 32.4 37.6 42.8Place of residence Metropolitan 700 30.8 37.1 43.4
Source: NSRE 1999-2004, Versions 8, 10, & 15; and NSRE 2005-2007, Versions 2 & 3. Note: Estimates are statistically unreliable and thus not reported for demographic strata with a sample size of less than 30. Midwest: The Midwest region had a sample size of just 411 respondents, thus reliable estimates of means by demographic strata are few. Overall, the region’s mean activity days (26.9) slightly trailed the national mean (Table 18). There was very little difference in annual OHV days by age, each participating about 27 days. Males (31) spent about 1.5 times as many days in OHV recreation than females (21). Non-metro residents participated much more frequently than metropolitan residents, about 17 days on average. Table 18—Mean annual activity days (with 95% confidence intervals) of people age 16 and older who participated in off-highway vehicle recreation, 2001-2007, Midwest Region.
Demographic Strata Sample
size 95% c.i.
lower boundMean annual
OHV days 95% c.i.
upper bound
All Groups All people age 16 & older
411 21.6 26.9 32.3
Under 30 119 13.8 26.6 39.5
30-50 187 20.0 27.1 34.2
Age
51 & older 103 18.6 26.6 34.6
Male 232 23.8 31.0 38.3Gender
Female 179 13.1 20.9 28.6
White 396 22.8 28.3 33.8
Black 1 . . .
American Indian 2 . . .
Asian/Pacific Islander 2 . . .
Race/ethnicity
Hispanic 7 . . .
$25,000 or less 43 7.4 16.7 26.1
$25,000 to $49,999 111 18.9 28.3 37.7
$50,000 to $74,999 68 14.1 30.3 46.4
$75,000 to $99,999 38 17.2 37.4 57.6
$100,000 to $149,999 26 . . .
Annual family income
$150,000 or more 12 . . .
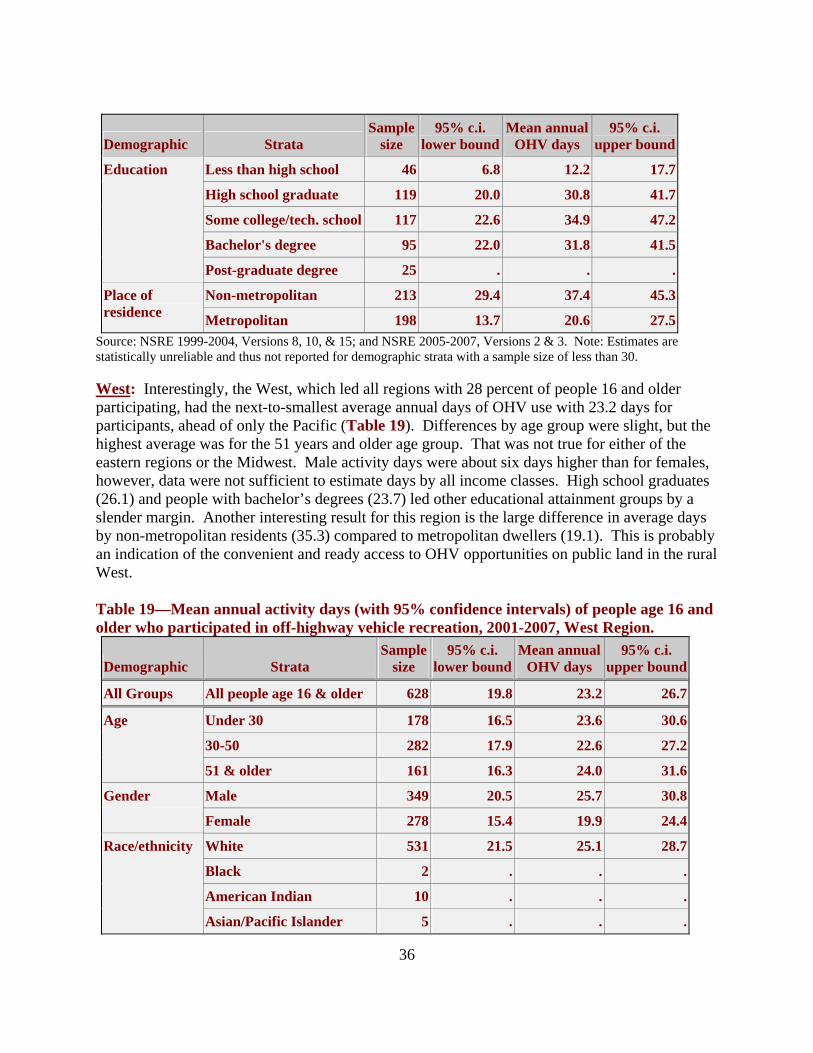
36
Demographic Strata Sample
size 95% c.i.
lower boundMean annual
OHV days 95% c.i.
upper bound
Less than high school 46 6.8 12.2 17.7
High school graduate 119 20.0 30.8 41.7
Some college/tech. school 117 22.6 34.9 47.2
Bachelor's degree 95 22.0 31.8 41.5
Education
Post-graduate degree 25 . . .
Non-metropolitan 213 29.4 37.4 45.3Place of residence Metropolitan 198 13.7 20.6 27.5
Source: NSRE 1999-2004, Versions 8, 10, & 15; and NSRE 2005-2007, Versions 2 & 3. Note: Estimates are statistically unreliable and thus not reported for demographic strata with a sample size of less than 30. West: Interestingly, the West, which led all regions with 28 percent of people 16 and older participating, had the next-to-smallest average annual days of OHV use with 23.2 days for participants, ahead of only the Pacific (Table 19). Differences by age group were slight, but the highest average was for the 51 years and older age group. That was not true for either of the eastern regions or the Midwest. Male activity days were about six days higher than for females, however, data were not sufficient to estimate days by all income classes. High school graduates (26.1) and people with bachelor’s degrees (23.7) led other educational attainment groups by a slender margin. Another interesting result for this region is the large difference in average days by non-metropolitan residents (35.3) compared to metropolitan dwellers (19.1). This is probably an indication of the convenient and ready access to OHV opportunities on public land in the rural West. Table 19—Mean annual activity days (with 95% confidence intervals) of people age 16 and older who participated in off-highway vehicle recreation, 2001-2007, West Region.
Demographic Strata Sample
size 95% c.i.
lower boundMean annual
OHV days 95% c.i.
upper bound
All Groups All people age 16 & older 628 19.8 23.2 26.7
Under 30 178 16.5 23.6 30.6
30-50 282 17.9 22.6 27.2
Age
51 & older 161 16.3 24.0 31.6
Male 349 20.5 25.7 30.8Gender
Female 278 15.4 19.9 24.4
White 531 21.5 25.1 28.7
Black 2 . . .
American Indian 10 . . .
Race/ethnicity
Asian/Pacific Islander 5 . . .

37
Demographic Strata Sample
size 95% c.i.
lower boundMean annual
OHV days 95% c.i.
upper bound
Hispanic 63 3.5 18.7 33.9
$25,000 or less 65 14.8 26.4 38.1
$25,000 to $49,999 138 15.0 21.3 27.6
$50,000 to $74,999 132 19.0 26.7 34.5
$75,000 to $99,999 61 10.4 15.2 20.0
$100,000 to $149,999 44 14.8 29.6 44.3
Annual family income
$150,000 or more 22 . . .
Less than high school 48 2.5 22.5 42.5
High school graduate 142 17.9 26.1 34.2
Some college/tech. school 225 17.0 21.1 25.2
Bachelor's degree 136 15.9 23.7 31.4
Education
Post-graduate degree 68 8.3 14.1 20.0
Non-metropolitan 281 29.4 35.3 41.2Place of residence Metropolitan 347 15.1 19.1 23.1
Source: NSRE 1999-2004, Versions 8, 10, & 15; and NSRE 2005-2007, Versions 2 & 3. Note: Estimates are statistically unreliable and thus not reported for demographic strata with a sample size of less than 30. Pacific: Mean OHV days in the Pacific region (22.2) were very close to the mean in the West, both of which trailed the national average (Table 20). Like the West, the highest average days was found for the 51 and older age group. Differences were slight by gender and income (which had wide confidence intervals due to relatively small sample sizes). High school graduates (25.4) and people with some college education (22.97) led the other three education groups, each of which averaged about 20 days per year. The Pacific was similar to the West in terms of metro versus non-metro average activity days. Non-metropolitan residents spent 34 days per year on average, almost three days per month. For metro area residents, the mean was just under 20 days. Like the West, greater availability of public land likely accounts for much higher number of days of OHV use by non-metropolitan residents.

38
Table 20—Mean annual activity days (with 95% confidence intervals) of people age 16 and older who participated in off-highway vehicle recreation, 2001-2007, Pacific Region.
Demographic Strata Sample
size 95% c.i.
lower boundMean annual
OHV days 95% c.i.
upper bound
All Groups All people age 16 & older 603 18.2 22.2 26.2
Under 30 197 13.5 21.4 29.4
30-50 267 17.0 22.4 27.9
Age
51 & older 136 16.8 25.0 33.3
Male 350 18.1 22.4 26.7Gender
Female 253 14.5 22.0 29.5
White 475 19.5 23.7 27.9
Black 18 . . .
American Indian 11 . . .
Asian/Pacific Islander 16 . . .
Race/ethnicity
Hispanic 68 4.0 12.8 21.5
$25,000 or less 53 7.2 21.9 36.6
$25,000 to $49,999 122 12.4 20.6 28.8
$50,000 to $74,999 91 12.3 21.5 30.6
$75,000 to $99,999 75 11.9 23.6 35.4
$100,000 to $149,999 62 10.0 21.6 33.2
Annual family income
$150,000 or more 39 7.9 26.4 44.9
Less than high school 64 6.7 19.9 33.2
High school graduate 140 17.0 25.4 33.7
Some college/tech. school 217 15.2 22.9 30.7
Bachelor's degree 117 12.9 20.0 27.1
Education
Post-graduate degree 57 11.5 19.9 28.2
Non-metropolitan 185 25.8 33.6 41.3Place of residence Metropolitan 418 14.9 19.5 24.1
Source: NSRE 1999-2004, Versions 8, 10, & 15; and NSRE 2005-2007, Versions 2 & 3. Note: Estimates are statistically unreliable and thus not reported for demographic strata with a sample size of less than 30.
39
Section III – Segmenting Off-Highway Vehicle (OHV) Users Stratifying off-highway vehicle users into smaller groups helps to better understand who is and who is not participating and where differences lay within the user population. One way of doing this is through a statistical technique known as disjoint cluster analysis. This type of analysis identifies groupings of OHV participants who are similar to one another in their recreation activities and demographics. Analysis The statistical analysis process examines the identity of each individual OHV user and assigns them to one and only one group, where members within a group are similar in characteristics. The characteristics examined fall into two broad categories: 1) demographics and 2) participation in 47 resource-based outdoor recreation activities. This analysis provides the researcher with an estimation of the number of user groups or segments that are interpretable. Usually, a number of different groupings are examined looking for a combination of groups which can be meaningfully interpreted. A descriptive name or label is typically then assigned to each of the defined segments. These names are meant to highlight the central similarities among members of each segment or group. Upon careful analysis, we selected five OHV user segments and labeled them as: Middle of the Roaders, Upper Middle Class Nature Lovers, Seniors, Middle Age Actives, and Young Adventure Seekers. A brief narrative describing each user group is provided in this section. The specific characteristics or variables upon which the OHV groups were based are listed in Table 21 (demographics) and Table 22 (recreation participation). Table 21 shows the proportions (except for age, which is mean years) within each demographic category for the five OHV user segments, and for comparison, also shows the proportions for all OHV users, and for all respondents to the NSRE survey. In each column of Table 21, the percentages sum down to 100 within each demographic group. Reading across the columns highlights the differences between the user segments—and how they compare to all OHV users and all NSRE respondents—for any given demographic stratum. The NSRE national sample was weighted using a process called post-stratification so that sample demographic proportions in age, sex, and race strata would closely approximate demographic strata in the 2000 Census. Further, weights adjusted the sample to be more in line with national proportions of educational attainment and the mix of urban/rural residents. There are some substantive differences in socio-economic characteristics of OHV users as compared to the national NSRE sample (Table 21). On average, OHV users are significantly younger, and more likely to be male, White, and rural (i.e., non-metropolitan) with slightly higher incomes. Their level of education closely mirrors that of the general population. They do not tend to be concentrated in any region of the country, except that percentages of the population participating tends to be lower in the North region and higher in the West region.
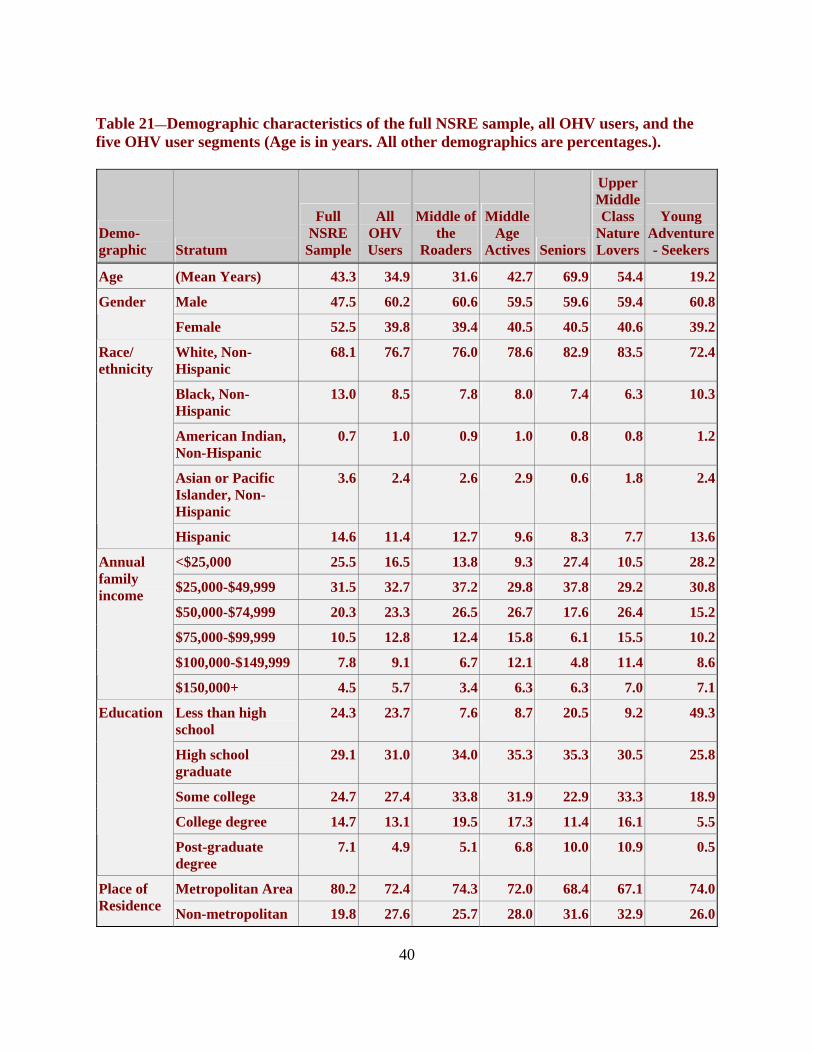
40
Table 21—Demographic characteristics of the full NSRE sample, all OHV users, and the five OHV user segments (Age is in years. All other demographics are percentages.).
Demo-graphic Stratum
Full NSRE
Sample
All OHV Users
Middle of the
Roaders
Middle Age
Actives Seniors
Upper Middle Class
Nature Lovers
Young Adventure- Seekers
Age (Mean Years) 43.3 34.9 31.6 42.7 69.9 54.4 19.2
Male 47.5 60.2 60.6 59.5 59.6 59.4 60.8Gender
Female 52.5 39.8 39.4 40.5 40.5 40.6 39.2
White, Non-Hispanic
68.1 76.7 76.0 78.6 82.9 83.5 72.4
Black, Non-Hispanic
13.0 8.5 7.8 8.0 7.4 6.3 10.3
American Indian, Non-Hispanic
0.7 1.0 0.9 1.0 0.8 0.8 1.2
Asian or Pacific Islander, Non-Hispanic
3.6 2.4 2.6 2.9 0.6 1.8 2.4
Race/ ethnicity
Hispanic 14.6 11.4 12.7 9.6 8.3 7.7 13.6
<$25,000 25.5 16.5 13.8 9.3 27.4 10.5 28.2
$25,000-$49,999 31.5 32.7 37.2 29.8 37.8 29.2 30.8
$50,000-$74,999 20.3 23.3 26.5 26.7 17.6 26.4 15.2
$75,000-$99,999 10.5 12.8 12.4 15.8 6.1 15.5 10.2
$100,000-$149,999 7.8 9.1 6.7 12.1 4.8 11.4 8.6
Annual family income
$150,000+ 4.5 5.7 3.4 6.3 6.3 7.0 7.1
Less than high school
24.3 23.7 7.6 8.7 20.5 9.2 49.3
High school graduate
29.1 31.0 34.0 35.3 35.3 30.5 25.8
Some college 24.7 27.4 33.8 31.9 22.9 33.3 18.9
College degree 14.7 13.1 19.5 17.3 11.4 16.1 5.5
Education
Post-graduate degree
7.1 4.9 5.1 6.8 10.0 10.9 0.5
Metropolitan Area 80.2 72.4 74.3 72.0 68.4 67.1 74.0Place of Residence Non-metropolitan 19.8 27.6 25.7 28.0 31.6 32.9 26.0

41
Demo-graphic Stratum
Full NSRE
Sample
All OHV Users
Middle of the
Roaders
Middle Age
Actives Seniors
Upper Middle Class
Nature Lovers
Young Adventure- Seekers
North 37.1 32.0 32.4 34.4 32.6 33.5 29.6
South 30.7 30.7 31.7 28.4 31.7 27.8 32.2
Midwest 8.1 9.0 7.9 8.7 10.2 10.0 9.2
West 8.5 12.7 12.8 13.2 11.7 14.1 11.9
Region
Pacific 15.7 15.7 15.3 15.4 13.8 14.5 17.1Source: NSRE 1999-2007. Sample sizes: Full sample=85,268; All OHV users=14,101; Cluster 1=3,743; Cluster 2=3,334; Cluster 3=964; Cluster 4=2,620; Cluster 5=3,440. Age is in years. All other demographics are percentages. In each column, percentages sum down to 100 within each demographic group. Table 22 shows participation rates for each of the 47 outdoor recreation activities across the five OHV user segments. As a whole, OHV users are more active in every single recreation activity relative to the general U.S. population age 16 and older (Table 22). For some activities, OHV users participate at more than twice the national rate. In particular, OHV users were about three times more likely to participate in the three types of hunting–big game, small game, and migratory bird–than was the general public. Following Table 22 is a brief synopsis describing each OHV user group or segment. Table 22—Outdoor recreation participation percentages for the full NSRE sample, all OHV users, and the five OHV user segments, by activity type.
Activity
Full NSRE
Sample
All OHV Users
Middle of the
Roaders
Middle Age
Actives Seniors
Upper Middle Class
Nature Lovers
Young Adventure -Seekers
Land-based Activities
Visit a wilderness or primitive area
36.2 58.1 57.8 58.7 45.5 54.0 55.3
Day hiking 35.4 47.9 48.0 51.2 33.2 47.7 41.1
Primitive camping 17.8 37.2 36.7 35.1 21.1 32.7 41.2
Mountain biking 22.0 34.4 37.4 33.9 15.2 24.7 41.7
Big game hunting 10.0 28.4 27.4 26.2 19.9 29.9 23.0
Small game hunting 8.3 23.2 21.4 20.0 15.3 21.5 21.7
Backpacking 11.4 19.9 21.7 20.3 7.4 15.7 22.3

42
Activity
Full NSRE
Sample
All OHV Users
Middle of the
Roaders
Middle Age
Actives Seniors
Upper Middle Class
Nature Lovers
Young Adventure -Seekers
Horseback riding on trails 8.7 16.8 14.2 16.0 7.5 11.7 20.4
Migratory bird hunting 2.7 7.9 6.8 6.2 3.5 7.5 8.3
Viewing/Learning Activities
Sightseeing 58.5 78.8 77.3 82.6 83.9 86.4 62.6
View/Photograph natural scenery
66.5 75.9 73.5 79.9 68.8 79.4 62.2
View/Photograph other wildlife (besides birds)
51.4 67.6 63.3 70.0 64.0 70.1 54.5
View/Photograph wildflowers, trees, etc.
51.1 57.3 52.5 62.9 56.1 62.8 41.2
Gather mushrooms, berries, etc. 32.5 52.0 48.0 52.8 45.9 51.3 46.5
View/Photograph fish 27.2 40.2 39.6 45.9 35.5 41.5 31.3
View/Photograph birds 37.9 40.7 35.1 44.5 47.7 52.0 23.7
Developed-setting Activities
Walk for pleasure 86.2 88.9 87.6 89.6 90.2 90.5 85.0
Family gatherings outdoors 76.2 84.9 86.0 85.7 79.2 82.5 83.9
Driving for pleasure 59.1 86.3 86.1 88.7 90.0 91.6 75.6
Visit nature centers, etc. 61.8 69.5 74.7 70.7 57.7 67.9 61.9
Picnicking 58.9 65.2 66.3 71.3 66.1 68.1 48.1
Visit historic sites 51.5 59.3 56.9 59.5 51.5 62.0 52.1
Developed camping 29.1 44.7 46.5 46.7 30.6 39.9 43.4
Visit prehistoric sites 22.6 30.3 29.0 31.2 24.2 33.6 27.1
Water-based Activities: Fishing
Warmwater fishing 24.5 44.6 45.4 43.0 32.8 39.5 43.7
Coldwater fishing 14.0 28.3 27.0 29.3 22.4 27.4 28.8
Saltwater fishing 10.3 16.3 17.2 17.9 12.9 17.0 16.7
Anadromous fishing 4.2 8.8 8.0 9.6 4.3 10.5 10.4
Water-based Activities: Non-motorized Boating
Rafting 10.7 21.4 20.0 20.0 4.5 12.4 31.1
Canoeing 11.2 18.3 16.5 18.4 8.5 12.1 21.3

43
Activity
Full NSRE
Sample
All OHV Users
Middle of the
Roaders
Middle Age
Actives Seniors
Upper Middle Class
Nature Lovers
Young Adventure -Seekers
Rowing 4.6 7.7 6.2 8.1 4.6 7.7 8.2
Sailing 6.0 7.0 5.8 7.1 4.1 5.4 9.0
Kayaking 4.8 6.7 6.1 6.4 2.4 4.5 9.6
Windsurfing 0.7 1.2 1.3 1.6 0.1 0.9 2.2
Water-based Activities: Motorized Boating
Motorboating 28.5 46.9 46.5 47.9 30.1 39.1 44.8
Waterskiing 8.7 19.8 20.3 16.8 4.0 8.4 30.6
Using personal watercraft 9.6 20.9 20.8 18.1 7.1 8.4 35.7
Water-based Activities: Swimming/diving
Swimming in lakes, streams, etc. 46.9 63.3 65.3 63.7 28.8 49.3 69.6
Visit a beach 46.6 55.8 58.6 57.3 33.9 48.8 57.7
Visit other waterside (besides beach)
28.8 41.9 43.0 41.8 22.1 32.1 43.0
Snorkeling 7.6 11.6 11.3 13.5 5.1 8.7 13.3
Scuba diving 2.0 4.2 5.0 4.4 2.6 3.5 5.3
Surfing 1.6 3.0 2.8 2.6 0.3 1.4 6.9
Snow/Ice Activities
Snowmobiling 6.0 16.4 16.8 14.3 6.5 11.5 19.8
Downhill skiing 9.2 14.8 13.8 15.2 3.0 6.9 19.8
Snowboarding 4.3 9.7 8.8 6.5 0.9 2.6 23.3
Cross-country skiing 4.8 6.7 4.6 6.8 3.1 6.0 5.9Source: NSRE 1999-2007. Sample sizes: Full sample=85,268; All OHV users=14,101; Cluster 1=3,743; Cluster 2=3,334; Cluster 3=964; Cluster 4=2,620; Cluster 5=3,440.
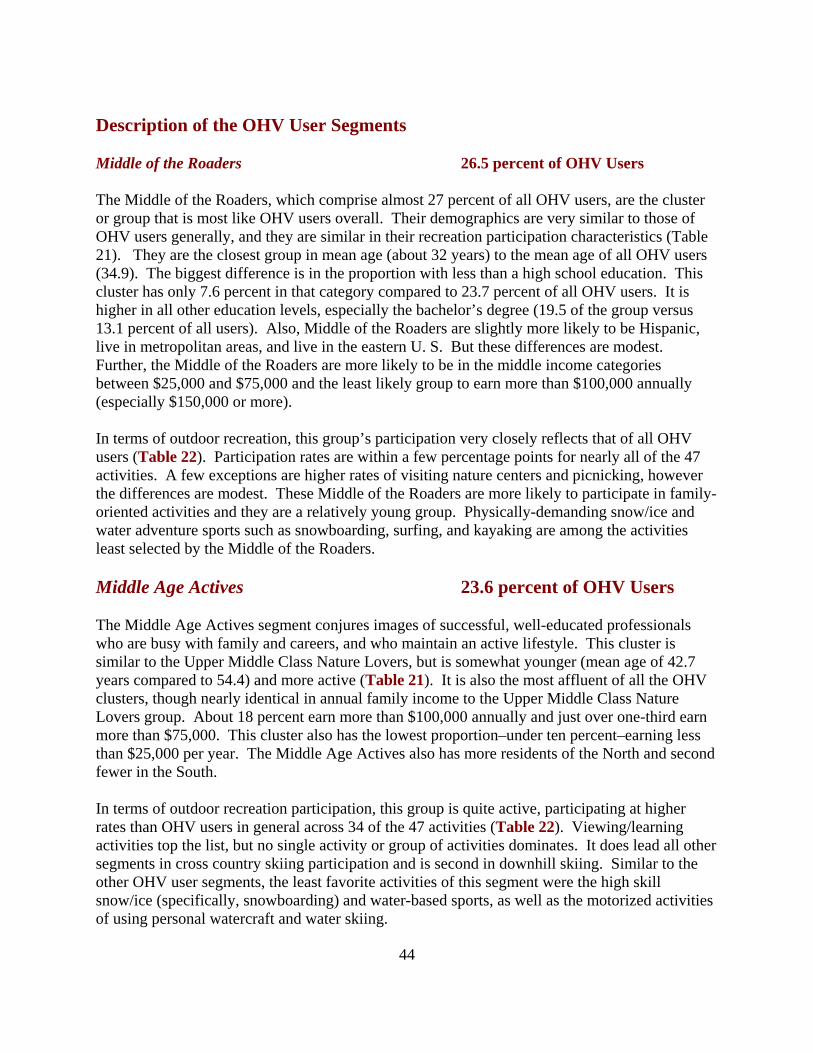
44
Description of the OHV User Segments Middle of the Roaders 26.5 percent of OHV Users The Middle of the Roaders, which comprise almost 27 percent of all OHV users, are the cluster or group that is most like OHV users overall. Their demographics are very similar to those of OHV users generally, and they are similar in their recreation participation characteristics (Table 21). They are the closest group in mean age (about 32 years) to the mean age of all OHV users (34.9). The biggest difference is in the proportion with less than a high school education. This cluster has only 7.6 percent in that category compared to 23.7 percent of all OHV users. It is higher in all other education levels, especially the bachelor’s degree (19.5 of the group versus 13.1 percent of all users). Also, Middle of the Roaders are slightly more likely to be Hispanic, live in metropolitan areas, and live in the eastern U. S. But these differences are modest. Further, the Middle of the Roaders are more likely to be in the middle income categories between $25,000 and $75,000 and the least likely group to earn more than $100,000 annually (especially $150,000 or more). In terms of outdoor recreation, this group’s participation very closely reflects that of all OHV users (Table 22). Participation rates are within a few percentage points for nearly all of the 47 activities. A few exceptions are higher rates of visiting nature centers and picnicking, however the differences are modest. These Middle of the Roaders are more likely to participate in family-oriented activities and they are a relatively young group. Physically-demanding snow/ice and water adventure sports such as snowboarding, surfing, and kayaking are among the activities least selected by the Middle of the Roaders. Middle Age Actives 23.6 percent of OHV Users The Middle Age Actives segment conjures images of successful, well-educated professionals who are busy with family and careers, and who maintain an active lifestyle. This cluster is similar to the Upper Middle Class Nature Lovers, but is somewhat younger (mean age of 42.7 years compared to 54.4) and more active (Table 21). It is also the most affluent of all the OHV clusters, though nearly identical in annual family income to the Upper Middle Class Nature Lovers group. About 18 percent earn more than $100,000 annually and just over one-third earn more than $75,000. This cluster also has the lowest proportion–under ten percent–earning less than $25,000 per year. The Middle Age Actives also has more residents of the North and second fewer in the South. In terms of outdoor recreation participation, this group is quite active, participating at higher rates than OHV users in general across 34 of the 47 activities (Table 22). Viewing/learning activities top the list, but no single activity or group of activities dominates. It does lead all other segments in cross country skiing participation and is second in downhill skiing. Similar to the other OHV user segments, the least favorite activities of this segment were the high skill snow/ice (specifically, snowboarding) and water-based sports, as well as the motorized activities of using personal watercraft and water skiing.

45
Seniors 6.8 percent of OHV Users The Seniors user group, which comprises just under seven percent of OHV users, is less then one-half the size of the next smallest group. It is characterized by two primary traits: advanced age of its members and less participation in outdoor recreation activities generally. Their average age of 70 years is more than twice that of the 34.9 years of all OHV users (Table 21). Group members are also more often White, live in non-metropolitan areas, and are fairly evenly distributed throughout the country, being just slightly less likely to live in the western U.S. This group also has more than twice as many people with post-graduate degrees and a smaller proportion with less than a high school education than OHV users as a whole. The Seniors have a large proportion (about 27 percent) of members earning $25,000 per year or less, but also has a slightly higher percentage earning in excess of $150,000 annually relative to all OHV users. Regarding outdoor recreation, this cluster participates more frequently than the overall group in just 7 of the 47 activities (Table 22). Only two activities (viewing/photographing birds and sightseeing) have participation rates substantially higher than OHV users in general. As expected, very few in this group participate in high-energy, high-skill sports. In three activities (snowboarding, surfing, and windsurfing) less than one percent of the Seniors participate, or less than 1/10th the rate of all OHV users. Upper Middle Class Nature Lovers 18.6 percent of OHV users The Upper Middle Class Nature Lovers with an average age of about 54 years, comprise about 19 percent of all OHV users. Individuals in this group have very nearly the same family highest incomes of the Middle Age Actives, especially in the top three income categories (Table 21). These two groups lead all others in income by a fairly wide margin. Just over one-third of this group has an annual family income greater than $75,000. It is also one of the more educated groups with more people having bachelor’s degrees or higher than either OHV users in general or the U.S. population. Individuals in this segment are more likely than all OHV users and any other segment to be White and live in non-metropolitan areas. Relative to other OHV users, Upper Middle Class Nature Lovers are more likely to participate in viewing/learning and other non-consumptive recreational activities, especially viewing and photographing birds and natural vegetation (Table 22). However, they do participate frequently in big game hunting and anadromous fishing. For the most part, however, their participation patterns are not substantially different from OHV users in general. This group tends to participate somewhat less in the more-active outdoor land and water-based activities. This is especially true for some adventure sports such as snowboarding, surfing, rafting, and motorized water sports, such as using personal watercraft and water skiing.

46
Young Adventure Seekers 24.4 percent of OHV Users Youth is the most distinguishing characteristic of the Young Adventure Seekers, who comprise just under one-fourth of OHV users. With a mean age of just over 19 years, this group is also predictably low in both advanced education (6 percent with a bachelor’s degree or higher) and annual family income—28.2 percent under $25,000 per year (Table 21). They are evenly distributed geographically, with a slightly higher share in the Pacific than other OHV users. They are also more likely than all but the Middle of the Roaders to be metropolitan residents, though the differences are modest. It is also the most racially diverse group, having higher proportions of Black, Hispanic, and American Indians than any other group. Besides their youth, the other outstanding characteristic of this cluster is its engagement in outdoor adventure and active water and snow/ice sports (Table 22). Along with its relatively lower levels of participation in viewing/learning activities, this group is almost the mirror image of all the other user segments with respect to outdoor recreation participation. Snowboarding and downhill skiing, surfing and windsurfing, motorized water sports, and rafting/floating recreation are all high relative to other OHV users. Conversely, the viewing/learning and more passive activities such as picnicking, sightseeing, and driving for pleasure, are the activities with the lowest participation rates by this group.
Discussion The dramatic growth and increasing diversity of our population will undoubtedly continue to be reflected in OHV participation trends into the foreseeable future. For instance, despite a recent dip in OHV sales, most likely related to increasing gas prices and ownership saturation, OHV’s still remain very popular. In particular, ATV sales account for more than 70 percent of the OHV market. There are approximately 44 million people, aged 16 years or older, who presently participate in OHV recreation. One-in-five Americans participated one or more times in OHV recreation within the past year. This interest in OHV recreation, overall, represents about an 18 percent increase in the number of OHV participants between 1999 and 2007. Population growth will most likely result in more OHV users in the future. However, while historically the vast majority of OHV participants have been under 50, male, White and urban, recent trends show increasing numbers of OHV participants who are between 30-50 years old, female, Hispanic or American Indian. The increasing diversity of our population is being somewhat mirrored by the increasing diversity of OHV users. Increasing gains in technology will most likely extend these trends as new OHV’s are produced that are more suitable for women or children, or which are more affordable for low income populations. At present, numbers of children aged 15 years or under who participate in OHV recreation remains relatively unknown. Hence, the current impact of this population of users on our public lands is an area of research that needs attention. Increasing urban and ex-urban sprawl and loss of open private lands will be important in the future OHV participants seek to gain access to our public lands, such as national forests, for

47
OHV recreation. Public land managers will not only be faced with increasing pressure from the numbers of OHV participants, but also additional demands for related services and facilities. Furthermore, as OHV participants increase, public land managers will need to consider how greater diversity of users will impact their currently offered services. For instance, part of the concern about OHV recreation is its resulting negative impacts to our public lands. This concern should prompt a need for greater environmental education and outreach services concerning minimizing environmental impacts. At present, very little of these outreach services or related literature are produced in bi-lingual languages (i.e., English and Spanish) or are aimed at our younger generations (i.e., under 16 years of age) or at women. Yet, the newer generations of OHV participants (e.g., Hispanics, younger children, women, etc) may turn out to be the most importance segments to reach. Increasing diversity will present many new challenges for public land managers, such as trying to identify innovative ways of reaching OHV participants. One target of outreach would be to better educate OHV users about available opportunities, benefits, and services. Changes in the composition of the population have led to varying values and preferences for different recreational and other public services. In all likelihood, greater diversity will make obsolete many of the marketing and outreach services successfully used in the past. An ability to group or cluster recreational users into discrete segments, as identified in this report, will be more important. Segmentation provides a deeper understanding of different OHV participants better enabling 1) better serving unique needs, 2) identification of potential OHV users; 3) more fully addressing people’s future recreational preferences; and 4) successfully marketing existing facilities and services. Gaining a deeper understanding of OHV participants’ recreational values and preferences is not an option for public land managers. It is a necessity for the future protection and sustainability of our public lands, such as national forests.
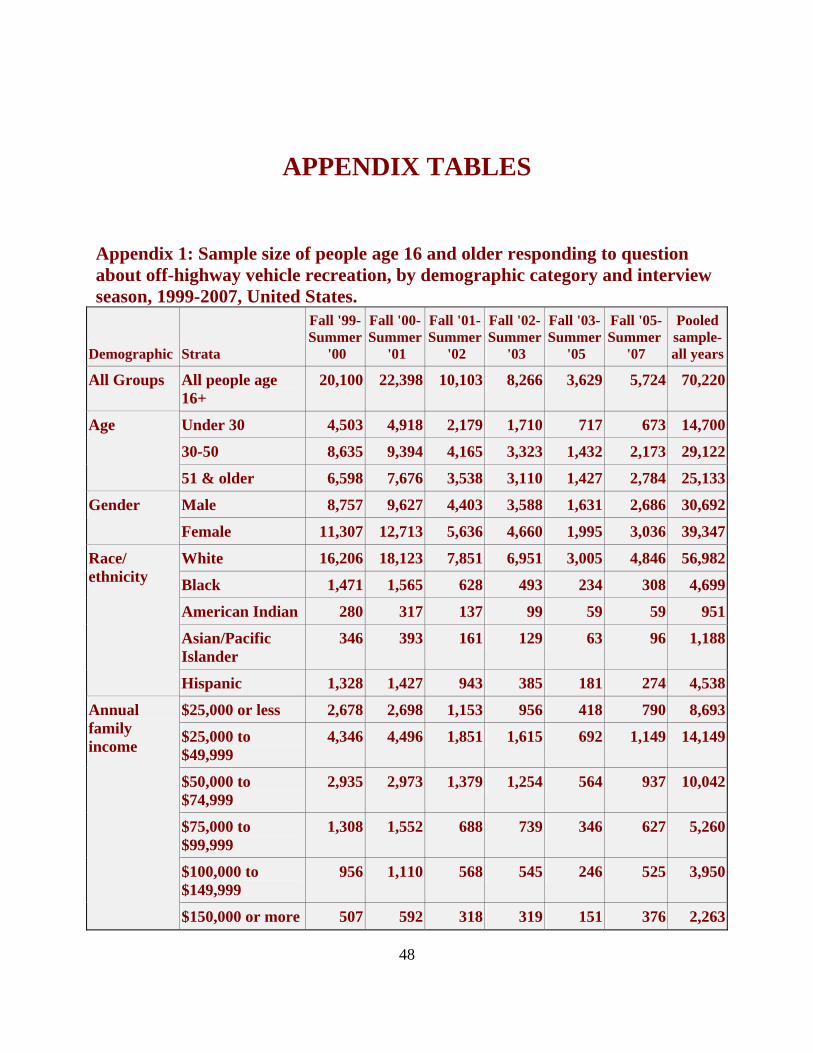
48
APPENDIX TABLES Appendix 1: Sample size of people age 16 and older responding to question about off-highway vehicle recreation, by demographic category and interview season, 1999-2007, United States.
Demographic Strata
Fall '99-Summer
'00
Fall '00-Summer
'01
Fall '01-Summer
'02
Fall '02-Summer
'03
Fall '03- Summer
'05
Fall '05-Summer
'07
Pooled sample- all years
All Groups All people age 16+
20,100 22,398 10,103 8,266 3,629 5,724 70,220
Under 30 4,503 4,918 2,179 1,710 717 673 14,700
30-50 8,635 9,394 4,165 3,323 1,432 2,173 29,122
Age
51 & older 6,598 7,676 3,538 3,110 1,427 2,784 25,133
Male 8,757 9,627 4,403 3,588 1,631 2,686 30,692Gender
Female 11,307 12,713 5,636 4,660 1,995 3,036 39,347
White 16,206 18,123 7,851 6,951 3,005 4,846 56,982
Black 1,471 1,565 628 493 234 308 4,699
American Indian 280 317 137 99 59 59 951
Asian/Pacific Islander
346 393 161 129 63 96 1,188
Race/ ethnicity
Hispanic 1,328 1,427 943 385 181 274 4,538
$25,000 or less 2,678 2,698 1,153 956 418 790 8,693
$25,000 to $49,999
4,346 4,496 1,851 1,615 692 1,149 14,149
$50,000 to $74,999
2,935 2,973 1,379 1,254 564 937 10,042
$75,000 to $99,999
1,308 1,552 688 739 346 627 5,260
$100,000 to $149,999
956 1,110 568 545 246 525 3,950
Annual family income
$150,000 or more 507 592 318 319 151 376 2,263

49
Demographic Strata
Fall '99-Summer
'00
Fall '00-Summer
'01
Fall '01-Summer
'02
Fall '02-Summer
'03
Fall '03- Summer
'05
Fall '05-Summer
'07
Pooled sample- all years
Less than high school
2,114 2,357 1,053 636 344 361 6,865
High school graduate
5,302 6,061 2,698 1,956 813 1,351 18,181
Some college/tech. school
6,150 6,544 2,815 2,436 1,080 1,521 20,546
Bachelor's degree 3,908 4,361 2,079 1,878 820 1,431 14,477
Education
Post-graduate degree
2,369 2,666 1,230 1,258 546 971 9,040
Non-metropolitan
6,839 8,123 3,517 2,546 1,246 1,117 23,388Place of residence
Metropolitan 13,261 14,275 6,586 5,720 2,383 4,607 46,832Source: NSRE 1999-2004, Versions 1-16 except 3, 6, 12; and NSRE 2005-2007, Versions 2 and 3. Notes: Race/ethnicity population does not include persons of 2 or more races. Population by income category is estimated based on population in families and average family size (2000 Census). Population for educational attainment is for age 18 and older (2000 Census). All others are age 16 and older.

50
Appendix 2: Sample size of people age 16 and older who responded to question about off-highway vehicle annual activity days, by year of interview and demographic strata, 2001-2007, United States.
Demographic Strata 2001 2003 2005 -2007
Pooled sample- all years
All Groups All people age 16 & older
1,650 1,225 1,228 4,103
Under 30 569 386 241 1,196
30-50 765 536 607 1,908
Age
51 & older 303 292 372 967
Male 950 692 710 2,352Gender
Female 699 533 518 1,750
White 1,427 1,053 1,080 3,560
Black 65 50 33 148
American Indian 29 16 14 59
Asian/Pacific Islander 18 8 10 36
Race/ethnicity
Hispanic 83 72 69 224
$25,000 or less 165 112 122 399
$25,000 to $49,999 383 255 264 902
$50,000 to $74,999 263 234 214 711
$75,000 to $99,999 142 132 181 455
$100,000 to $149,999 106 85 140 331
Annual family income
$150,000 or more 54 47 84 185
Less than high school 194 124 88 406
High school graduate 457 302 314 1,073
Some college/tech. school
553 379 363 1,295
Bachelor's degree 282 277 282 841
Education
Post-graduate degree 139 124 157 420
Non-metropolitan 745 508 356 1,609Place of residence Metropolitan 905 717 872 2,494
Source: 2000 Census of Population and Housing, Summary Files 1 (age, gender, race/ethnicity, residence) and 3 (education, income); NSRE 1999-2004, Versions 8, 10, & 15; and NSRE 2005-2007, Versions 2 & 3.

51
Appendix 3: Tables showing percent of population and number of people age 16 and older participating in off-highway vehicle recreation, by demographic category and state, 1999-2007.
Alabama (n=1,294)
Demographic Strata Population
(1000s) Sample
size Percent
participating Participants
(1000s)
All Groups All people age 16+ 3,565.5 1,294 21.2 755.7
Under 30 882.1 278 35.0 309.530-50 1,318.0 541 23.9 315.3
Age
51 & older 1,365.4 455 9.6 131.0Male 1,702.9 505 29.1 496.1Gender
Female 1,862.6 784 13.9 259.6White 2,527.6 1,014 27.3 689.4Black 884.6 207 6.6 58.4American Indian 18.1 24 . .Asian/Pacific Islander 33.2 9 . .
Race/ethnicity
Hispanic 75.9 29 . .$25,000 or less 797.7 179 12.5 99.4$25,000 to $49,999 923.1 252 28.0 258.7$50,000 to $74,999 607.5 187 24.4 148.1$75,000 to $99,999 286.0 92 47.9 137.1$100,000 to $149,999 184.7 61 42.3 78.1
Annual family income
$150,000 or more 97.1 29 . .Less than high school 835.4 164 16.6 139.1High school graduate 998.4 360 21.5 214.9Some college/tech. school 915.4 384 24.9 228.0Bachelor's degree 375.5 220 28.1 105.7
Education
Post-graduate degree 199.8 146 15.2 30.3Non-metropolitan 1,039.1 491 23.2 240.7Place of
residence Metropolitan 2,526.4 803 20.4 515.0
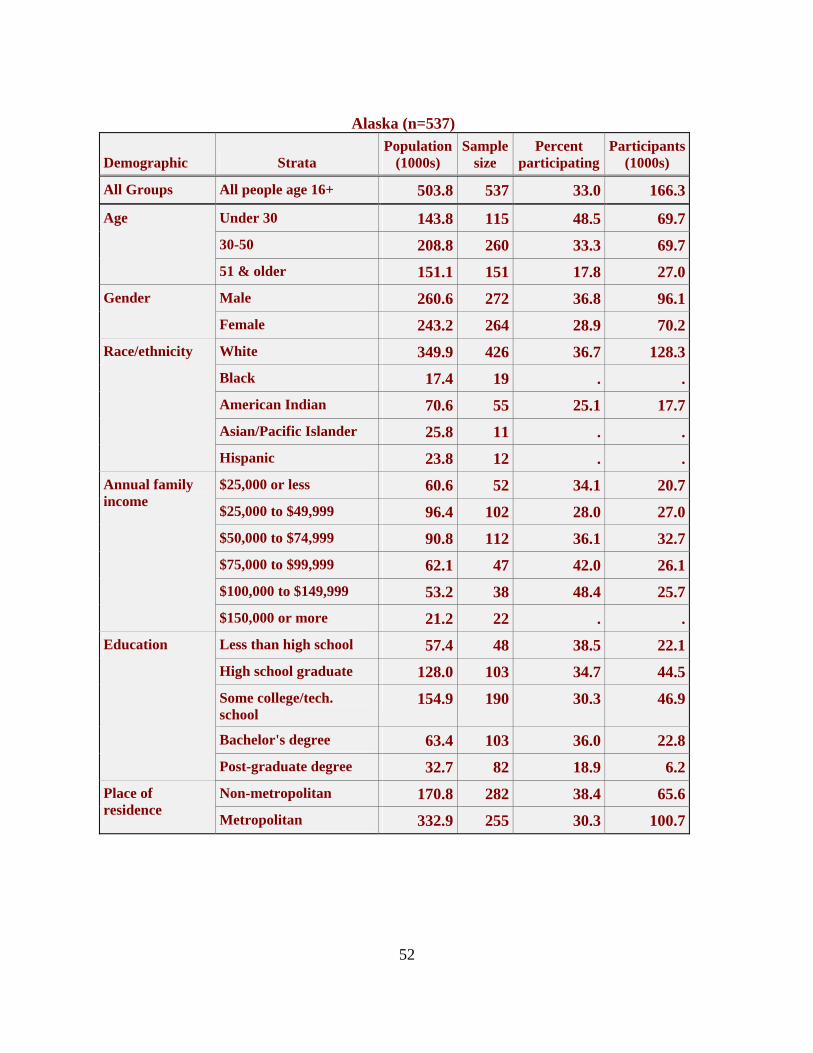
52
Alaska (n=537)
Demographic Strata Population
(1000s) Sample
size Percent
participating Participants
(1000s)
All Groups All people age 16+ 503.8 537 33.0 166.3
Under 30 143.8 115 48.5 69.730-50 208.8 260 33.3 69.7
Age
51 & older 151.1 151 17.8 27.0Male 260.6 272 36.8 96.1Gender
Female 243.2 264 28.9 70.2White 349.9 426 36.7 128.3Black 17.4 19 . .American Indian 70.6 55 25.1 17.7Asian/Pacific Islander 25.8 11 . .
Race/ethnicity
Hispanic 23.8 12 . .$25,000 or less 60.6 52 34.1 20.7$25,000 to $49,999 96.4 102 28.0 27.0$50,000 to $74,999 90.8 112 36.1 32.7$75,000 to $99,999 62.1 47 42.0 26.1$100,000 to $149,999 53.2 38 48.4 25.7
Annual family income
$150,000 or more 21.2 22 . .Less than high school 57.4 48 38.5 22.1High school graduate 128.0 103 34.7 44.5Some college/tech. school
154.9 190 30.3 46.9
Bachelor's degree 63.4 103 36.0 22.8
Education
Post-graduate degree 32.7 82 18.9 6.2Non-metropolitan 170.8 282 38.4 65.6Place of
residence Metropolitan 332.9 255 30.3 100.7

53
Arizona (n=1,148)
Demographic Strata Population
(1000s) Sample
size Percent
participating Participants
(1000s)
All Groups All people age 16+ 4,647.6 1,148 25.5 1,182.9
Under 30 1,217.2 225 39.2 477.330-50 1,752.5 431 31.5 551.1
Age
51 & older 1,677.8 474 9.2 154.5Male 2,310.0 524 27.5 636.6Gender
Female 2,337.6 623 23.3 546.3White 2,990.1 905 26.0 778.1Black 146.0 31 15.9 23.2American Indian 178.5 24 . .Asian/Pacific Islander 113.7 14 . .
Race/ethnicity
Hispanic 1,174.1 150 27.1 318.1$25,000 or less 701.8 136 16.1 113.0$25,000 to $49,999 987.0 244 21.9 216.6$50,000 to $74,999 680.9 164 27.2 185.1$75,000 to $99,999 364.4 90 36.6 133.4$100,000 to $149,999 265.5 62 42.7 113.2
Annual family income
$150,000 or more 153.5 31 36.1 55.4Less than high school 776.9 104 21.7 168.5High school graduate 930.8 274 30.3 282.2Some college/tech. school
1,264.9 362 26.6 336.9
Bachelor's degree 520.7 256 24.7 128.7
Education
Post-graduate degree 274.7 132 18.2 50.0Non-metropolitan 505.2 267 32.4 163.3Place of
residence Metropolitan 4,142.4 881 24.6 1,019.6
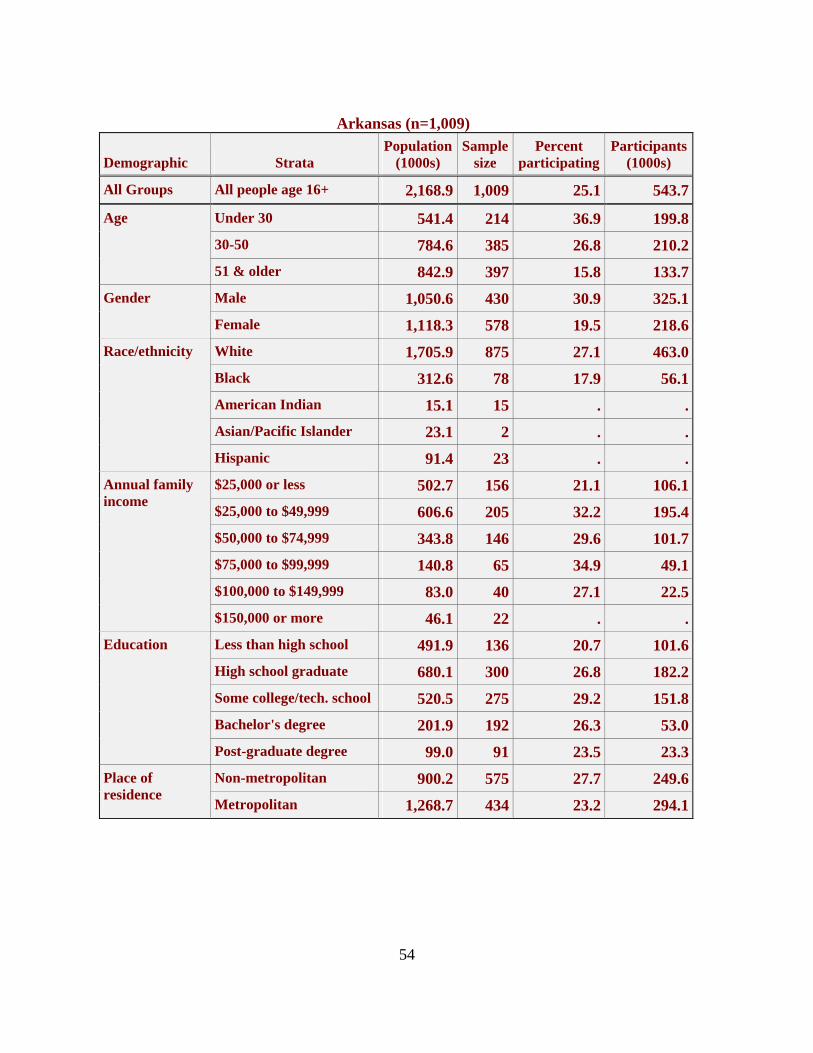
54
Arkansas (n=1,009)
Demographic Strata Population
(1000s) Sample
size Percent
participating Participants
(1000s)
All Groups All people age 16+ 2,168.9 1,009 25.1 543.7
Under 30 541.4 214 36.9 199.830-50 784.6 385 26.8 210.2
Age
51 & older 842.9 397 15.8 133.7Male 1,050.6 430 30.9 325.1Gender
Female 1,118.3 578 19.5 218.6White 1,705.9 875 27.1 463.0Black 312.6 78 17.9 56.1American Indian 15.1 15 . .Asian/Pacific Islander 23.1 2 . .
Race/ethnicity
Hispanic 91.4 23 . .$25,000 or less 502.7 156 21.1 106.1$25,000 to $49,999 606.6 205 32.2 195.4$50,000 to $74,999 343.8 146 29.6 101.7$75,000 to $99,999 140.8 65 34.9 49.1$100,000 to $149,999 83.0 40 27.1 22.5
Annual family income
$150,000 or more 46.1 22 . .Less than high school 491.9 136 20.7 101.6High school graduate 680.1 300 26.8 182.2Some college/tech. school 520.5 275 29.2 151.8Bachelor's degree 201.9 192 26.3 53.0
Education
Post-graduate degree 99.0 91 23.5 23.3Non-metropolitan 900.2 575 27.7 249.6Place of
residence Metropolitan 1,268.7 434 23.2 294.1
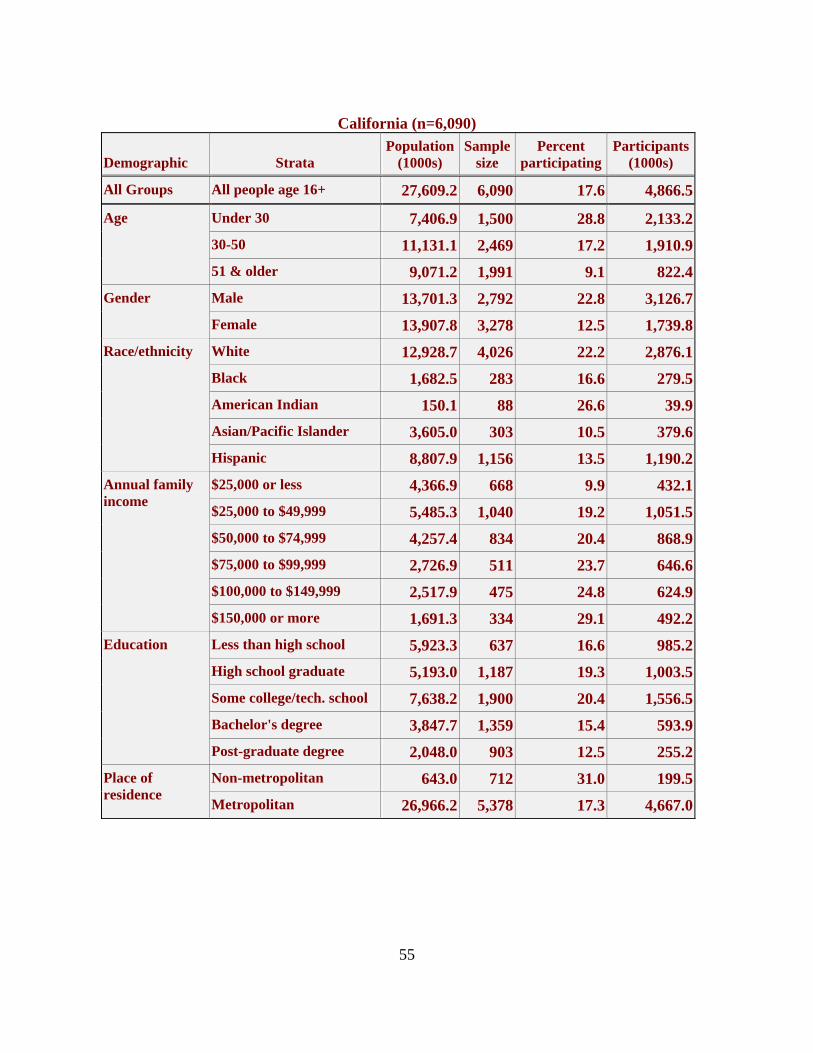
55
California (n=6,090)
Demographic Strata Population
(1000s) Sample
size Percent
participating Participants
(1000s)
All Groups All people age 16+ 27,609.2 6,090 17.6 4,866.5
Under 30 7,406.9 1,500 28.8 2,133.230-50 11,131.1 2,469 17.2 1,910.9
Age
51 & older 9,071.2 1,991 9.1 822.4Male 13,701.3 2,792 22.8 3,126.7Gender
Female 13,907.8 3,278 12.5 1,739.8White 12,928.7 4,026 22.2 2,876.1Black 1,682.5 283 16.6 279.5American Indian 150.1 88 26.6 39.9Asian/Pacific Islander 3,605.0 303 10.5 379.6
Race/ethnicity
Hispanic 8,807.9 1,156 13.5 1,190.2$25,000 or less 4,366.9 668 9.9 432.1$25,000 to $49,999 5,485.3 1,040 19.2 1,051.5$50,000 to $74,999 4,257.4 834 20.4 868.9$75,000 to $99,999 2,726.9 511 23.7 646.6$100,000 to $149,999 2,517.9 475 24.8 624.9
Annual family income
$150,000 or more 1,691.3 334 29.1 492.2Less than high school 5,923.3 637 16.6 985.2High school graduate 5,193.0 1,187 19.3 1,003.5Some college/tech. school 7,638.2 1,900 20.4 1,556.5Bachelor's degree 3,847.7 1,359 15.4 593.9
Education
Post-graduate degree 2,048.0 903 12.5 255.2Non-metropolitan 643.0 712 31.0 199.5Place of
residence Metropolitan 26,966.2 5,378 17.3 4,667.0
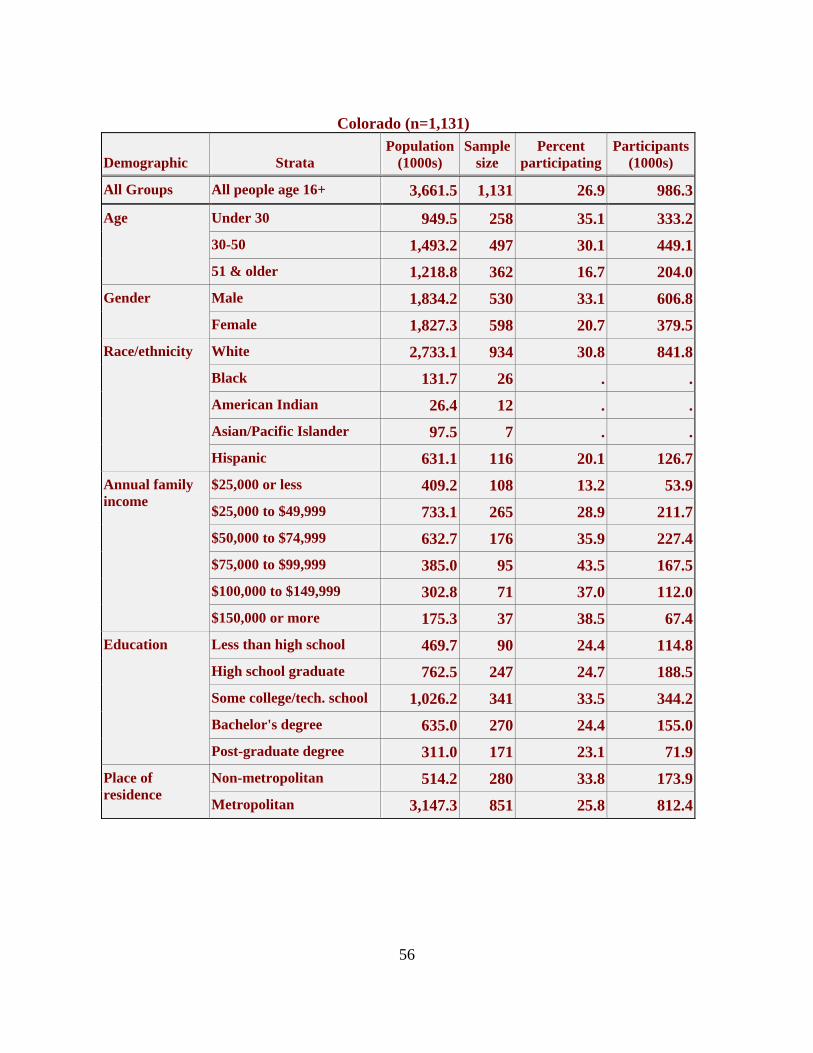
56
Colorado (n=1,131)
Demographic Strata Population
(1000s) Sample
size Percent
participating Participants
(1000s)
All Groups All people age 16+ 3,661.5 1,131 26.9 986.3
Under 30 949.5 258 35.1 333.230-50 1,493.2 497 30.1 449.1
Age
51 & older 1,218.8 362 16.7 204.0Male 1,834.2 530 33.1 606.8Gender
Female 1,827.3 598 20.7 379.5White 2,733.1 934 30.8 841.8Black 131.7 26 . .American Indian 26.4 12 . .Asian/Pacific Islander 97.5 7 . .
Race/ethnicity
Hispanic 631.1 116 20.1 126.7$25,000 or less 409.2 108 13.2 53.9$25,000 to $49,999 733.1 265 28.9 211.7$50,000 to $74,999 632.7 176 35.9 227.4$75,000 to $99,999 385.0 95 43.5 167.5$100,000 to $149,999 302.8 71 37.0 112.0
Annual family income
$150,000 or more 175.3 37 38.5 67.4Less than high school 469.7 90 24.4 114.8High school graduate 762.5 247 24.7 188.5Some college/tech. school 1,026.2 341 33.5 344.2Bachelor's degree 635.0 270 24.4 155.0
Education
Post-graduate degree 311.0 171 23.1 71.9Non-metropolitan 514.2 280 33.8 173.9Place of
residence Metropolitan 3,147.3 851 25.8 812.4
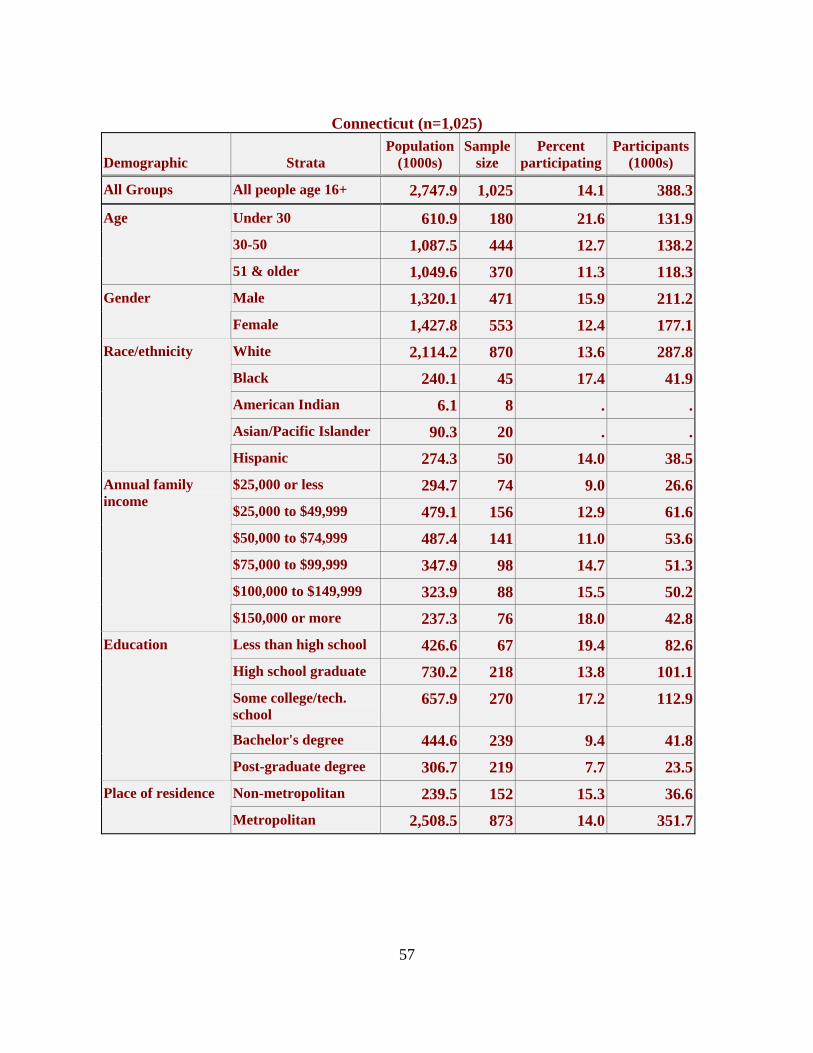
57
Connecticut (n=1,025)
Demographic Strata Population
(1000s) Sample
size Percent
participating Participants
(1000s)
All Groups All people age 16+ 2,747.9 1,025 14.1 388.3
Under 30 610.9 180 21.6 131.930-50 1,087.5 444 12.7 138.2
Age
51 & older 1,049.6 370 11.3 118.3Male 1,320.1 471 15.9 211.2Gender
Female 1,427.8 553 12.4 177.1White 2,114.2 870 13.6 287.8Black 240.1 45 17.4 41.9American Indian 6.1 8 . .Asian/Pacific Islander 90.3 20 . .
Race/ethnicity
Hispanic 274.3 50 14.0 38.5$25,000 or less 294.7 74 9.0 26.6$25,000 to $49,999 479.1 156 12.9 61.6$50,000 to $74,999 487.4 141 11.0 53.6$75,000 to $99,999 347.9 98 14.7 51.3$100,000 to $149,999 323.9 88 15.5 50.2
Annual family income
$150,000 or more 237.3 76 18.0 42.8Less than high school 426.6 67 19.4 82.6High school graduate 730.2 218 13.8 101.1Some college/tech. school
657.9 270 17.2 112.9
Bachelor's degree 444.6 239 9.4 41.8
Education
Post-graduate degree 306.7 219 7.7 23.5Non-metropolitan 239.5 152 15.3 36.6Place of residence
Metropolitan 2,508.5 873 14.0 351.7

58
Delaware (n=531)
Demographic Strata Population
(1000s) Sample
size Percent
participating Participants
(1000s)
All Groups All people age 16+ 664.0 531 14.2 94.2
Under 30 160.9 112 19.1 30.730-50 251.5 208 15.6 39.2
Age
51 & older 251.6 198 9.6 24.2Male 317.8 217 20.1 63.9Gender
Female 346.3 311 8.8 30.3White 476.1 448 15.9 75.6Black 127.1 37 8.2 10.5American Indian 2.1 7 . .Asian/Pacific Islander 18.5 7 . .
Race/ethnicity
Hispanic 35.0 16 . .$25,000 or less 80.8 55 6.9 5.6$25,000 to $49,999 137.2 100 15.3 20.9$50,000 to $74,999 118.4 83 24.0 28.4$75,000 to $99,999 72.1 41 11.1 8.0$100,000 to $149,999 57.3 37 24.7 14.2
Annual family income
$150,000 or more 28.0 22 . .Less than high school 106.3 56 9.2 9.8High school graduate 183.9 136 24.1 44.2Some college/tech. school
164.4 145 13.3 21.9
Bachelor's degree 86.1 118 7.7 6.6
Education
Post-graduate degree 48.9 67 5.9 2.9Non-metropolitan 139.0 184 16.2 22.5Place of residence
Metropolitan 525.1 347 13.6 71.7
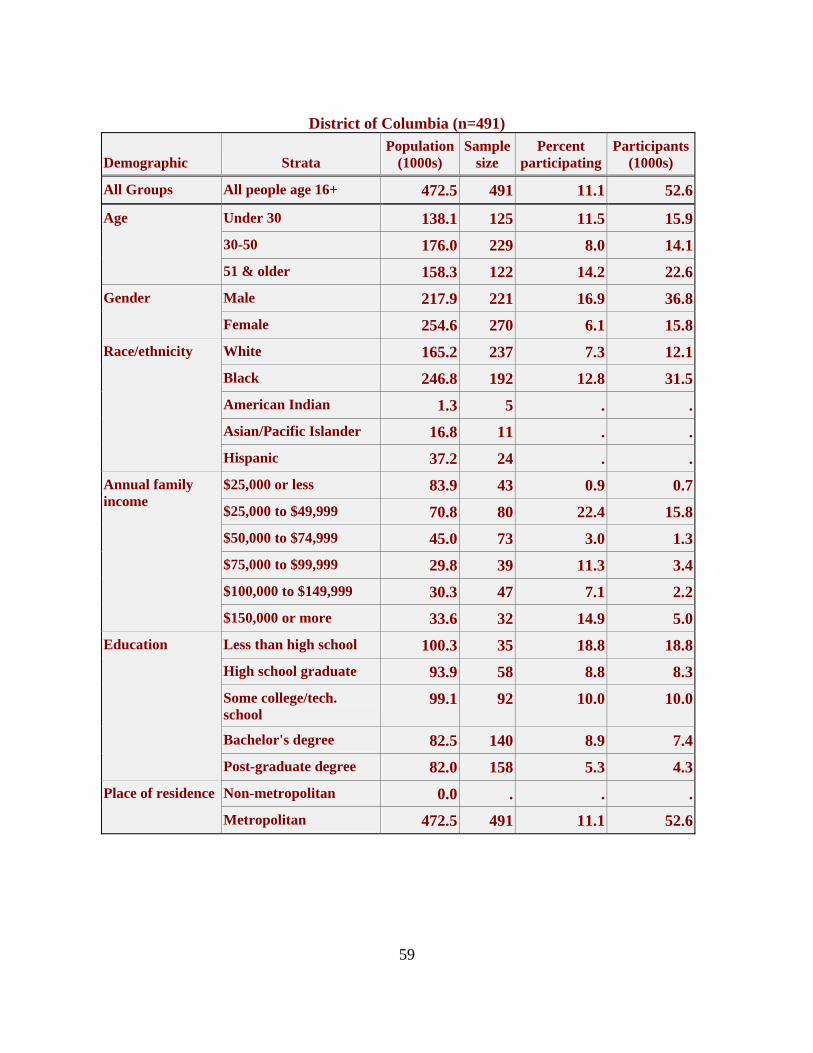
59
District of Columbia (n=491)
Demographic Strata Population
(1000s) Sample
size Percent
participating Participants
(1000s)
All Groups All people age 16+ 472.5 491 11.1 52.6
Under 30 138.1 125 11.5 15.930-50 176.0 229 8.0 14.1
Age
51 & older 158.3 122 14.2 22.6Male 217.9 221 16.9 36.8Gender
Female 254.6 270 6.1 15.8White 165.2 237 7.3 12.1Black 246.8 192 12.8 31.5American Indian 1.3 5 . .Asian/Pacific Islander 16.8 11 . .
Race/ethnicity
Hispanic 37.2 24 . .$25,000 or less 83.9 43 0.9 0.7$25,000 to $49,999 70.8 80 22.4 15.8$50,000 to $74,999 45.0 73 3.0 1.3$75,000 to $99,999 29.8 39 11.3 3.4$100,000 to $149,999 30.3 47 7.1 2.2
Annual family income
$150,000 or more 33.6 32 14.9 5.0Less than high school 100.3 35 18.8 18.8High school graduate 93.9 58 8.8 8.3Some college/tech. school
99.1 92 10.0 10.0
Bachelor's degree 82.5 140 8.9 7.4
Education
Post-graduate degree 82.0 158 5.3 4.3Non-metropolitan 0.0 . . .Place of residence
Metropolitan 472.5 491 11.1 52.6

60
Florida (n=2,950)
Demographic Strata Population
(1000s) Sample
size Percent
participating Participants
(1000s)
All Groups All people age 16+ 14,339.7 2,950 13.8 1,979.6
Under 30 3,200.3 594 22.2 710.330-50 5,206.8 1,083 17.2 899.2
Age
51 & older 5,932.6 1,205 6.2 370.0Male 6,969.4 1,293 16.1 1,120.5Gender
Female 7,370.3 1,647 11.6 859.1White 9,178.5 2,317 14.9 1,366.3Black 1,946.7 220 12.3 239.8American Indian 40.9 26 . .Asian/Pacific Islander 309.5 35 8.2 25.2
Race/ethnicity
Hispanic 2,747.9 273 11.2 308.4$25,000 or less 2,308.8 344 9.1 209.4$25,000 to $49,999 3,265.4 609 11.5 376.0$50,000 to $74,999 2,174.8 415 17.1 372.8$75,000 to $99,999 1,085.7 206 16.4 177.9$100,000 to $149,999 797.5 163 24.3 193.8
Annual family income
$150,000 or more 526.2 103 15.0 79.1Less than high school 2,593.9 273 13.6 353.7High school graduate 3,553.3 708 15.0 532.9Some college/tech. school
3,653.5 940 14.2 519.0
Bachelor's degree 1,650.2 597 12.6 207.5
Education
Post-graduate degree 897.0 383 11.9 106.6Non-metropolitan 902.6 692 17.4 156.2Place of residence
Metropolitan 13,437.1 2,258 13.6 1,823.4
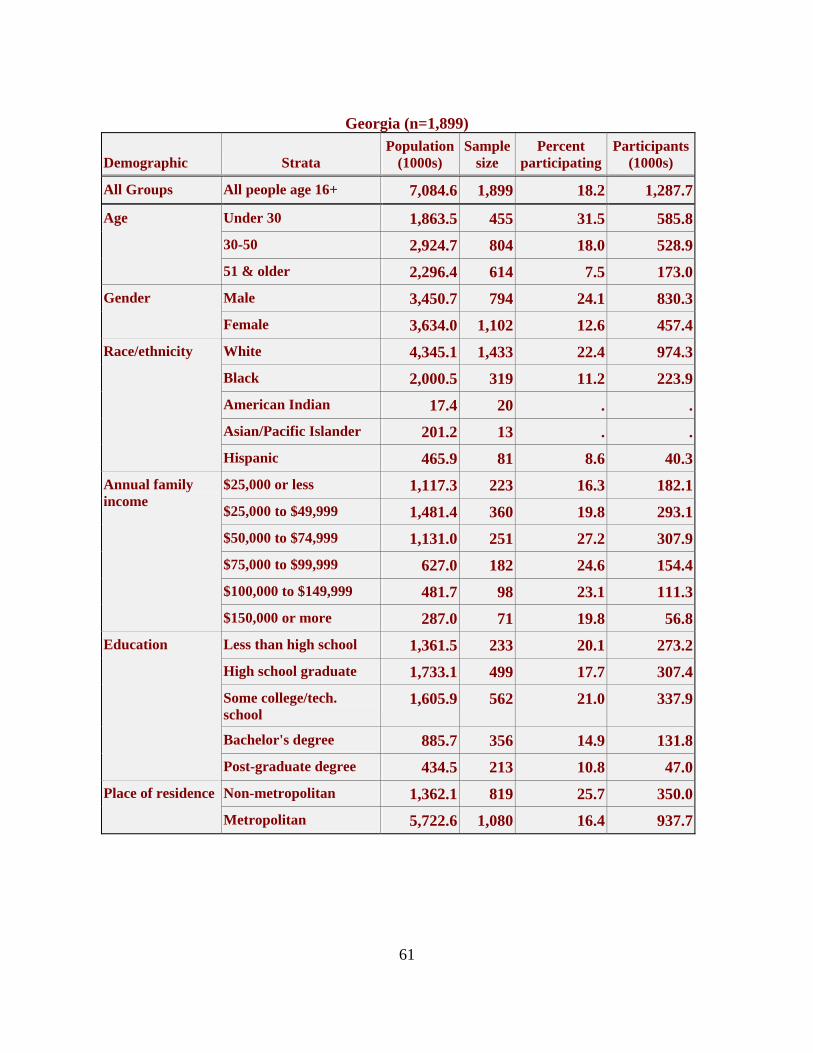
61
Georgia (n=1,899)
Demographic Strata Population
(1000s) Sample
size Percent
participating Participants
(1000s)
All Groups All people age 16+ 7,084.6 1,899 18.2 1,287.7
Under 30 1,863.5 455 31.5 585.830-50 2,924.7 804 18.0 528.9
Age
51 & older 2,296.4 614 7.5 173.0Male 3,450.7 794 24.1 830.3Gender
Female 3,634.0 1,102 12.6 457.4White 4,345.1 1,433 22.4 974.3Black 2,000.5 319 11.2 223.9American Indian 17.4 20 . .Asian/Pacific Islander 201.2 13 . .
Race/ethnicity
Hispanic 465.9 81 8.6 40.3$25,000 or less 1,117.3 223 16.3 182.1$25,000 to $49,999 1,481.4 360 19.8 293.1$50,000 to $74,999 1,131.0 251 27.2 307.9$75,000 to $99,999 627.0 182 24.6 154.4$100,000 to $149,999 481.7 98 23.1 111.3
Annual family income
$150,000 or more 287.0 71 19.8 56.8Less than high school 1,361.5 233 20.1 273.2High school graduate 1,733.1 499 17.7 307.4Some college/tech. school
1,605.9 562 21.0 337.9
Bachelor's degree 885.7 356 14.9 131.8
Education
Post-graduate degree 434.5 213 10.8 47.0Non-metropolitan 1,362.1 819 25.7 350.0Place of residence
Metropolitan 5,722.6 1,080 16.4 937.7
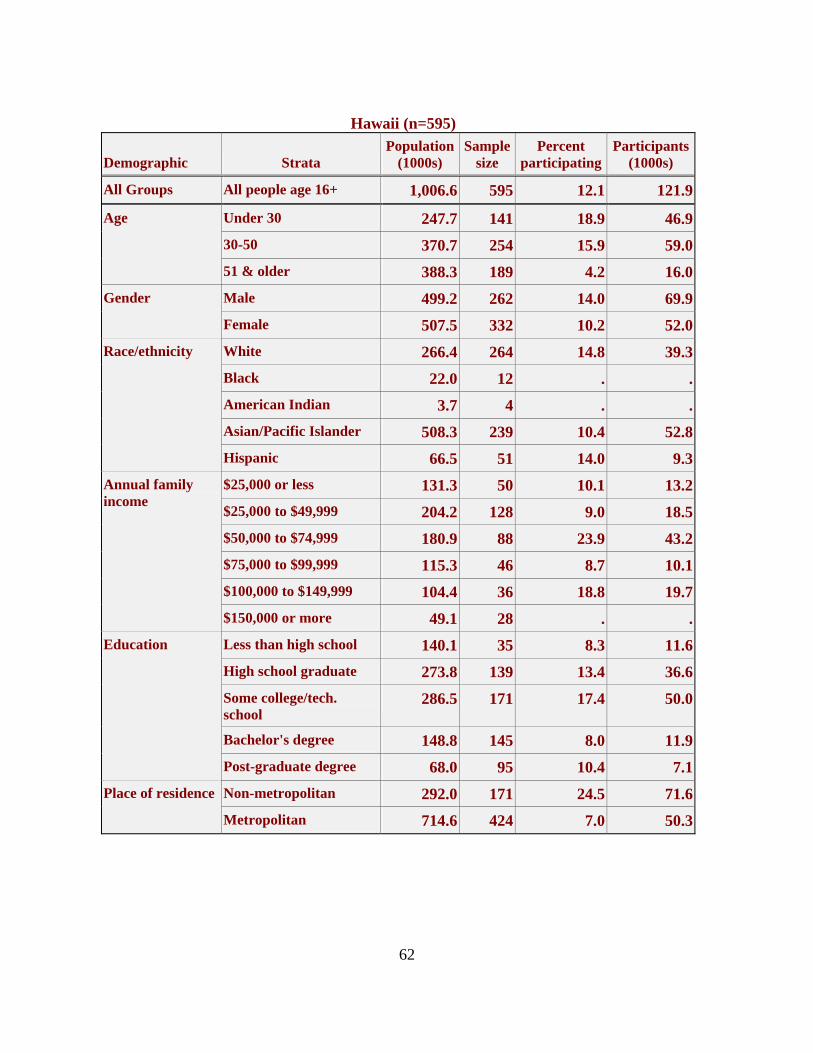
62
Hawaii (n=595)
Demographic Strata Population
(1000s) Sample
size Percent
participating Participants
(1000s)
All Groups All people age 16+ 1,006.6 595 12.1 121.9
Under 30 247.7 141 18.9 46.930-50 370.7 254 15.9 59.0
Age
51 & older 388.3 189 4.2 16.0Male 499.2 262 14.0 69.9Gender
Female 507.5 332 10.2 52.0White 266.4 264 14.8 39.3Black 22.0 12 . .American Indian 3.7 4 . .Asian/Pacific Islander 508.3 239 10.4 52.8
Race/ethnicity
Hispanic 66.5 51 14.0 9.3$25,000 or less 131.3 50 10.1 13.2$25,000 to $49,999 204.2 128 9.0 18.5$50,000 to $74,999 180.9 88 23.9 43.2$75,000 to $99,999 115.3 46 8.7 10.1$100,000 to $149,999 104.4 36 18.8 19.7
Annual family income
$150,000 or more 49.1 28 . .Less than high school 140.1 35 8.3 11.6High school graduate 273.8 139 13.4 36.6Some college/tech. school
286.5 171 17.4 50.0
Bachelor's degree 148.8 145 8.0 11.9
Education
Post-graduate degree 68.0 95 10.4 7.1Non-metropolitan 292.0 171 24.5 71.6Place of residence
Metropolitan 714.6 424 7.0 50.3

63
Idaho (n=683)
Demographic Strata Population
(1000s) Sample
size Percent
participating Participants
(1000s)
All Groups All people age 16+ 1,101.9 683 34.2 377.1
Under 30 301.4 153 40.7 122.730-50 406.1 295 40.1 162.9
Age
51 & older 394.4 233 23.2 91.5Male 551.4 310 44.1 243.1Gender
Female 550.5 372 24.3 134.0White 970.7 609 37.1 360.4Black 5.1 3 . .American Indian 13.2 13 . .Asian/Pacific Islander 13.2 6 . .
Race/ethnicity
Hispanic 88.5 28 . .$25,000 or less 184.5 108 21.8 40.1$25,000 to $49,999 291.6 172 36.8 107.4$50,000 to $74,999 184.2 98 52.1 96.0$75,000 to $99,999 83.3 29 . .$100,000 to $149,999 48.6 32 25.3 12.3
Annual family income
$150,000 or more 24.4 18 . .Less than high school 151.7 75 29.4 44.6High school graduate 268.7 185 37.4 100.5Some college/tech. school
329.5 200 37.8 124.6
Bachelor's degree 121.7 131 32.4 39.4
Education
Post-graduate degree 54.1 76 23.1 12.5Non-metropolitan 391.4 454 38.6 150.9Place of residence
Metropolitan 710.5 229 31.9 226.2

64
Illinois (n=2,611)
Demographic Strata Population
(1000s) Sample
size Percent
participating Participants
(1000s)
All Groups All people age 16+ 9,843.7 2,611 13.6 1,341.1
Under 30 2,526.2 565 23.6 596.630-50 3,853.7 1,110 13.9 535.4
Age
51 & older 3,463.9 896 6.0 209.1Male 4,792.9 1,109 18.2 873.4Gender
Female 5,050.8 1,499 9.2 467.7White 6,700.2 2,161 15.1 1,009.5Black 1,362.2 181 14.2 193.0American Indian 16.7 15 . .Asian/Pacific Islander 424.2 33 15.6 66.0
Race/ethnicity
Hispanic 1,270.9 161 7.3 93.1$25,000 or less 1,346.7 280 9.5 127.4$25,000 to $49,999 2,107.6 498 17.9 377.5$50,000 to $74,999 1,852.6 398 12.7 235.7$75,000 to $99,999 1,119.7 204 16.5 184.9$100,000 to $149,999 895.2 168 13.1 117.5
Annual family income
$150,000 or more 535.4 97 17.1 91.5Less than high school 1,770.1 210 13.3 235.5High school graduate 2,538.4 652 16.1 409.1Some college/tech. school
2,672.9 779 14.4 385.2
Bachelor's degree 1,430.0 587 12.4 177.1
Education
Post-graduate degree 768.7 352 7.0 54.0Non-metropolitan 1,301.3 648 22.2 288.4Place of residence
Metropolitan 8,542.4 1,963 12.3 1,052.7

65
Indiana (n=1,602)
Demographic Strata Population
(1000s) Sample
size Percent
participating Participants
(1000s)
All Groups All people age 16+ 4,849.3 1,602 16.1 782.3
Under 30 1,225.8 321 25.3 310.130-50 1,848.1 673 17.2 317.1
Age
51 & older 1,775.4 592 8.7 155.0Male 2,362.1 659 18.8 445.0Gender
Female 2,487.2 941 13.6 337.3White 4,143.9 1,446 17.5 724.7Black 393.8 65 11.2 44.2American Indian 11.9 12 . .Asian/Pacific Islander 65.5 13 . .
Race/ethnicity
Hispanic 200.5 33 9.1 18.2$25,000 or less 692.9 207 12.0 83.2$25,000 to $49,999 1,207.5 335 18.2 220.4$50,000 to $74,999 980.1 271 18.1 177.4$75,000 to $99,999 495.2 108 22.7 112.5$100,000 to $149,999 315.0 76 19.1 60.2
Annual family income
$150,000 or more 138.6 26 . .Less than high school 840.0 159 17.4 146.2High school graduate 1,632.5 515 15.7 256.0Some college/tech. school
1,238.4 482 17.5 217.2
Bachelor's degree 514.0 274 14.8 76.1
Education
Post-graduate degree 282.7 148 12.5 35.3Non-metropolitan 1,082.9 584 21.1 227.5Place of residence
Metropolitan 3,766.4 1,018 14.8 554.8

66
Iowa (n=1,072)
Demographic Strata Population
(1000s) Sample
size Percent
participating Participants
(1000s)
All Groups All people age 16+ 2,324.0 1,072 17.0 396.2
Under 30 576.1 205 32.4 186.830-50 833.7 429 18.1 150.6
Age
51 & older 914.3 425 6.4 58.8Male 1,136.2 455 22.0 249.8Gender
Female 1,187.9 615 12.3 146.4White 2,146.6 1,010 17.1 367.8Black 48.0 12 . .American Indian 6.6 3 . .Asian/Pacific Islander 35.7 10 . .
Race/ethnicity
Hispanic 73.8 21 . .$25,000 or less 331.0 130 13.7 45.4$25,000 to $49,999 632.1 259 17.5 110.7$50,000 to $74,999 483.3 146 21.9 105.6$75,000 to $99,999 212.8 68 25.0 53.1$100,000 to $149,999 119.4 48 17.1 20.5
Annual family income
$150,000 or more 58.0 14 . .Less than high school 318.7 96 17.6 56.0High school graduate 763.6 334 17.5 133.3Some college/tech. school
685.8 322 18.8 128.9
Bachelor's degree 300.8 211 15.4 46.3
Education
Post-graduate degree 125.0 90 9.5 11.9Non-metropolitan 1,050.6 617 17.0 178.9Place of residence
Metropolitan 1,273.4 455 17.1 217.3

67
Kansas (n=1,038)
Demographic Strata Population
(1000s) Sample
size Percent
participating Participants
(1000s)
All Groups All people age 16+ 2,119.3 1,038 18.1 383.5
Under 30 551.9 205 27.4 151.130-50 784.3 432 17.1 134.6
Age
51 & older 783.1 383 12.5 97.8Male 1,041.6 439 25.1 261.1Gender
Female 1,077.8 599 11.3 122.4White 1,762.6 931 19.6 345.1Black 114.1 29 . .American Indian 17.6 17 . .Asian/Pacific Islander 46.9 5 . .
Race/ethnicity
Hispanic 154.5 39 8.8 13.6$25,000 or less 307.7 136 7.7 23.8$25,000 to $49,999 543.7 204 18.4 100.0$50,000 to $74,999 418.7 185 21.1 88.4$75,000 to $99,999 211.8 71 23.7 50.2$100,000 to $149,999 134.5 59 19.6 26.4
Annual family income
$150,000 or more 71.6 25 . .Less than high school 297.7 83 23.1 68.8High school graduate 581.6 279 19.4 113.1Some college/tech. school
638.0 338 14.4 92.1
Bachelor's degree 310.0 219 19.6 60.7
Education
Post-graduate degree 149.9 104 7.2 10.8Non-metropolitan 784.3 538 21.4 168.5Place of residence
Metropolitan 1,335.0 500 16.1 215.0

68
Kentucky (n=1,406)
Demographic Strata Population
(1000s) Sample
size Percent
participating Participants
(1000s)
All Groups All people age 16+ 3,275.8 1,406 22.6 739.6
Under 30 800.7 269 40.3 322.830-50 1,245.8 619 23.9 297.7
Age
51 & older 1,229.2 500 9.7 119.1Male 1,585.9 579 28.4 450.5Gender
Female 1,689.8 824 17.1 289.1White 2,925.1 1,294 24.5 715.3Black 229.6 47 3.3 7.7American Indian 7.2 12 . .Asian/Pacific Islander 32.6 3 . .
Race/ethnicity
Hispanic 59.5 25 . .$25,000 or less 744.2 231 14.4 107.2$25,000 to $49,999 828.9 323 30.1 249.9$50,000 to $74,999 543.0 176 30.0 163.1$75,000 to $99,999 253.5 78 31.6 80.0$100,000 to $149,999 153.1 52 24.1 36.9
Annual family income
$150,000 or more 83.3 37 37.2 31.0Less than high school 785.7 195 19.4 152.7High school graduate 1,018.5 454 25.1 255.3Some college/tech. school
766.9 393 24.8 189.9
Bachelor's degree 293.1 206 23.8 69.8
Education
Post-graduate degree 183.8 141 13.6 25.0Non-metropolitan 1,417.9 845 30.3 428.8Place of residence
Metropolitan 1,857.9 561 16.7 310.8

69
Louisiana (n=1,262)
Demographic Strata Population
(1000s) Sample
size Percent
participating Participants
(1000s)
All Groups All people age 16+ 3,278.6 1,262 18.7 614.4
Under 30 878.1 325 32.2 283.030-50 1,202.4 497 18.9 226.9
Age
51 & older 1,198.1 420 8.7 104.5Male 1,571.4 506 25.2 394.8Gender
Female 1,707.3 754 12.9 219.6White 2,134.0 952 23.6 503.7Black 963.5 232 11.1 106.5American Indian 18.7 9 . .Asian/Pacific Islander 46.8 10 . .
Race/ethnicity
Hispanic 93.9 25 . .$25,000 or less 880.2 195 8.6 75.5$25,000 to $49,999 866.5 207 23.5 203.7$50,000 to $74,999 563.7 134 25.2 142.1$75,000 to $99,999 273.1 99 25.2 68.9$100,000 to $149,999 175.6 65 14.9 26.2
Annual family income
$150,000 or more 92.5 28 . .Less than high school 830.6 155 15.3 127.3High school graduate 1,043.1 362 17.7 184.2Some college/tech. school
830.8 363 25.9 215.1
Bachelor's degree 363.7 221 19.4 70.6
Education
Post-graduate degree 182.4 131 16.7 30.5Non-metropolitan 815.8 469 24.6 201.4Place of residence
Metropolitan 2,462.8 793 16.8 413.0

70
Maine (n=689)
Demographic Strata Population
(1000s) Sample
size Percent
participating Participants
(1000s)
All Groups All people age 16+ 1,062.8 689 26.8 285.2
Under 30 226.3 123 42.8 96.830-50 399.1 282 28.7 114.7
Age
51 & older 437.4 273 16.9 73.8Male 514.0 305 34.6 177.5Gender
Female 548.8 383 19.6 107.7White 1,024.1 646 27.3 279.1Black 7.2 5 . .American Indian 5.6 8 . .Asian/Pacific Islander 8.8 1 . .
Race/ethnicity
Hispanic 9.8 9 . .$25,000 or less 179.0 103 32.2 57.6$25,000 to $49,999 276.2 166 26.4 72.8$50,000 to $74,999 192.7 113 27.2 52.3$75,000 to $99,999 87.6 43 28.9 25.3$100,000 to $149,999 49.4 24 . .
Annual family income
$150,000 or more 25.4 6 . .Less than high school 149.2 58 33.0 49.2High school graduate 349.8 190 29.6 103.6Some college/tech. school
269.1 198 26.6 71.7
Bachelor's degree 136.5 145 17.5 23.9
Education
Post-graduate degree 69.3 92 19.2 13.3Non-metropolitan 444.1 392 31.4 139.2Place of residence
Metropolitan 618.7 297 23.6 146.0

71
Maryland (n=1,312)
Demographic Strata Population
(1000s) Sample
size Percent
participating Participants
(1000s)
All Groups All people age 16+ 4,356.7 1,312 14.3 623.6
Under 30 1,053.6 248 20.0 211.430-50 1,748.0 575 15.8 275.5
Age
51 & older 1,555.2 456 8.8 136.8Male 2,076.3 568 16.7 348.0Gender
Female 2,280.3 740 12.1 275.6White 2,629.4 965 15.8 415.3Black 1,215.5 215 10.7 130.1American Indian 11.2 12 . .Asian/Pacific Islander 219.1 33 24.6 53.8
Race/ethnicity
Hispanic 238.7 40 8.7 20.8$25,000 or less 476.9 109 9.9 47.1$25,000 to $49,999 809.9 240 13.8 112.0$50,000 to $74,999 780.0 197 17.3 135.2$75,000 to $99,999 539.5 116 10.9 58.9$100,000 to $149,999 487.3 116 18.6 90.6
Annual family income
$150,000 or more 278.4 86 21.6 60.1Less than high school 656.2 111 12.0 78.5High school graduate 1,064.9 271 18.7 198.8Some college/tech. school
1,075.3 348 13.1 140.4
Bachelor's degree 672.9 305 16.0 107.9
Education
Post-graduate degree 473.9 257 8.5 40.5Non-metropolitan 228.7 197 25.1 57.2Place of residence
Metropolitan 4,128.0 1,115 13.7 566.4

72
Massachusetts (n=1,543)
Demographic Strata Population
(1000s) Sample
size Percent
participating Participants
(1000s)
All Groups All people age 16+ 5,089.1 1,543 12.7 648.4
Under 30 1,206.1 274 22.3 268.730-50 1,988.9 676 14.2 283.5
Age
51 & older 1,894.1 554 5.0 96.2Male 2,430.5 680 16.2 394.2Gender
Female 2,658.6 860 9.5 254.2White 4,158.4 1,338 12.2 507.8Black 277.1 43 5.1 14.3American Indian 10.0 13 . .Asian/Pacific Islander 244.3 22 . .
Race/ethnicity
Hispanic 357.5 76 12.8 45.7$25,000 or less 614.5 134 7.2 44.5$25,000 to $49,999 919.1 274 11.6 106.3$50,000 to $74,999 896.1 250 13.9 124.7$75,000 to $99,999 626.7 137 22.8 143.2$100,000 to $149,999 554.4 115 11.7 64.6
Annual family income
$150,000 or more 349.6 79 11.4 39.9Less than high school 754.2 101 13.6 102.8High school graduate 1,319.3 311 15.2 200.3Some college/tech. school
1,274.7 373 13.9 176.7
Bachelor's degree 915.3 411 9.8 89.7
Education
Post-graduate degree 589.6 317 9.4 55.6Non-metropolitan 20.5 163 20.0 4.1Place of residence
Metropolitan 5,068.6 1,380 12.7 644.3

73
Michigan (n=2,321)
Demographic Strata Population
(1000s) Sample
size Percent
participating Participants
(1000s)
All Groups All people age 16+ 7,807.9 2,321 20.0 1,562.8
Under 30 1,907.9 433 30.6 583.230-50 2,997.4 939 23.5 706.2
Age
51 & older 2,902.5 911 9.4 273.4Male 3,801.3 1,005 26.0 985.4Gender
Female 4,006.5 1,305 14.4 577.4White 6,209.2 1,995 21.8 1,356.0Black 1,034.1 140 8.9 92.3American Indian 41.7 38 21.4 8.9Asian/Pacific Islander 180.2 18 . .
Race/ethnicity
Hispanic 264.3 56 30.3 80.0$25,000 or less 1,129.9 256 12.2 137.6$25,000 to $49,999 1,767.9 444 20.8 368.4$50,000 to $74,999 1,480.6 338 26.2 387.7$75,000 to $99,999 892.6 201 32.1 286.6$100,000 to $149,999 700.5 137 25.5 178.6
Annual family income
$150,000 or more 331.9 42 30.7 102.0Less than high school 1,283.1 212 17.3 222.3High school graduate 2,264.1 623 20.7 468.8Some college/tech. school
2,336.6 730 21.8 509.8
Bachelor's degree 940.2 431 19.9 186.7
Education
Post-graduate degree 521.8 293 17.7 92.3Non-metropolitan 1,451.3 699 29.1 422.4Place of residence
Metropolitan 6,356.6 1,622 18.0 1,140.4

74
Minnesota (n=1,416)
Demographic Strata Population
(1000s) Sample
size Percent
participating Participants
(1000s)
All Groups All people age 16+ 4,003.5 1,416 23.8 951.4
Under 30 1,008.6 234 34.2 345.230-50 1,559.6 624 24.8 386.5
Age
51 & older 1,435.3 533 15.3 219.8Male 1,974.3 671 30.1 593.6Gender
Female 2,029.2 741 17.7 357.8White 3,524.8 1,320 24.1 849.9Black 149.8 21 . .American Indian 39.3 13 . .Asian/Pacific Islander 127.3 9 . .
Race/ethnicity
Hispanic 127.2 25 . .$25,000 or less 433.5 147 17.0 73.7$25,000 to $49,999 845.3 296 22.9 193.3$50,000 to $74,999 813.1 224 27.1 220.2$75,000 to $99,999 470.9 119 30.4 143.2$100,000 to $149,999 330.6 79 25.3 83.5
Annual family income
$150,000 or more 174.4 43 18.3 32.0Less than high school 478.4 107 29.2 139.7High school graduate 1,032.4 332 23.6 244.0Some college/tech. school
1,209.6 434 27.7 335.3
Bachelor's degree 647.6 367 19.1 124.0
Education
Post-graduate degree 265.0 144 11.8 31.2Non-metropolitan 1,101.3 557 29.1 320.7Place of residence
Metropolitan 2,902.2 859 21.7 630.7

75
Mississippi (n=1,094)
Demographic Strata Population
(1000s) Sample
size Percent
participating Participants
(1000s)
All Groups All people age 16+ 2,208.4 1,094 22.3 491.9
Under 30 584.7 274 35.0 204.630-50 812.4 424 24.3 197.1
Age
51 & older 811.3 371 11.1 90.2Male 1,052.2 441 29.0 305.1Gender
Female 1,156.2 644 16.2 186.8White 1,365.5 794 27.0 369.2Black 766.3 247 15.9 121.5American Indian 9.3 14 . .Asian/Pacific Islander 17.3 1 . .
Race/ethnicity
Hispanic 38.4 19 . .$25,000 or less 588.4 160 9.6 56.3$25,000 to $49,999 588.3 224 30.6 180.3$50,000 to $74,999 351.9 134 32.5 114.4$75,000 to $99,999 153.8 60 41.7 64.2$100,000 to $149,999 88.6 43 23.7 21.0
Annual family income
$150,000 or more 47.4 18 . .Less than high school 566.7 153 19.7 111.5High school graduate 601.9 286 17.7 106.8Some college/tech. school
589.0 336 26.9 158.4
Bachelor's degree 208.4 189 31.0 64.6
Education
Post-graduate degree 104.2 106 21.3 22.2Non-metropolitan 1,243.3 712 24.3 302.5Place of residence
Metropolitan 965.1 382 19.6 189.4

76
Missouri (n=1,644)
Demographic Strata Population
(1000s) Sample
size Percent
participating Participants
(1000s)
All Groups All people age 16+ 4,530.4 1,644 19.6 886.2
Under 30 1,131.8 323 28.9 327.030-50 1,689.2 654 21.7 366.3
Age
51 & older 1,709.5 643 11.2 192.8Male 2,185.6 697 25.4 554.2Gender
Female 2,344.8 944 14.1 332.0White 3,810.3 1,444 22.0 839.2Black 478.9 85 6.6 31.5American Indian 20.2 28 . .Asian/Pacific Islander 66.3 12 . .
Race/ethnicity
Hispanic 111.6 27 . .$25,000 or less 773.8 264 11.9 92.4$25,000 to $49,999 1,151.1 356 22.0 253.5$50,000 to $74,999 808.0 228 18.9 153.0$75,000 to $99,999 398.8 106 25.2 100.5$100,000 to $149,999 262.9 83 27.0 70.9
Annual family income
$150,000 or more 137.4 30 21.3 29.2Less than high school 804.7 172 23.7 190.6High school graduate 1,348.8 482 21.6 291.2Some college/tech. school
1,189.6 490 18.6 221.7
Bachelor's degree 546.8 306 14.4 78.9
Education
Post-graduate degree 279.3 173 8.1 22.6Non-metropolitan 1,221.6 706 27.7 338.2Place of residence
Metropolitan 3,308.8 938 16.6 548.0
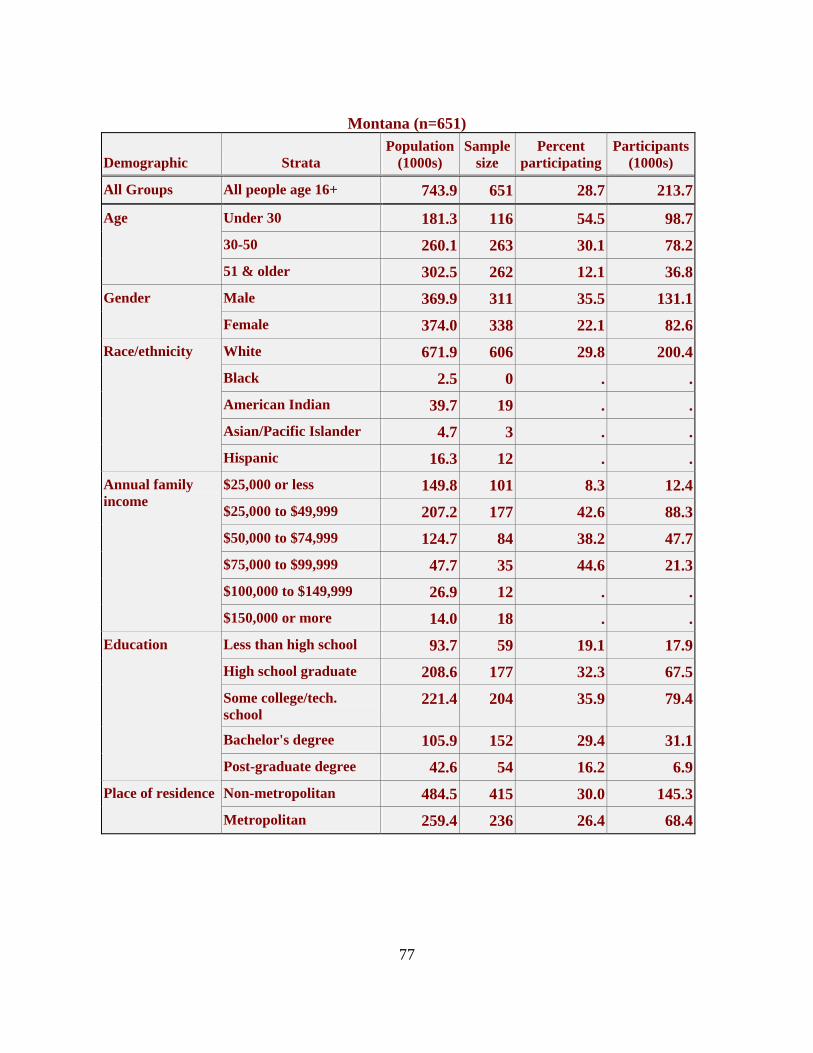
77
Montana (n=651)
Demographic Strata Population
(1000s) Sample
size Percent
participating Participants
(1000s)
All Groups All people age 16+ 743.9 651 28.7 213.7
Under 30 181.3 116 54.5 98.730-50 260.1 263 30.1 78.2
Age
51 & older 302.5 262 12.1 36.8Male 369.9 311 35.5 131.1Gender
Female 374.0 338 22.1 82.6White 671.9 606 29.8 200.4Black 2.5 0 . .American Indian 39.7 19 . .Asian/Pacific Islander 4.7 3 . .
Race/ethnicity
Hispanic 16.3 12 . .$25,000 or less 149.8 101 8.3 12.4$25,000 to $49,999 207.2 177 42.6 88.3$50,000 to $74,999 124.7 84 38.2 47.7$75,000 to $99,999 47.7 35 44.6 21.3$100,000 to $149,999 26.9 12 . .
Annual family income
$150,000 or more 14.0 18 . .Less than high school 93.7 59 19.1 17.9High school graduate 208.6 177 32.3 67.5Some college/tech. school
221.4 204 35.9 79.4
Bachelor's degree 105.9 152 29.4 31.1
Education
Post-graduate degree 42.6 54 16.2 6.9Non-metropolitan 484.5 415 30.0 145.3Place of residence
Metropolitan 259.4 236 26.4 68.4

78
Nebraska (n=836)
Demographic Strata Population
(1000s) Sample
size Percent
participating Participants
(1000s)
All Groups All people age 16+ 1,355.7 836 17.6 238.2
Under 30 353.2 203 30.7 108.430-50 496.6 312 17.3 85.8
Age
51 & older 506.0 313 8.6 43.9Male 666.3 358 21.7 144.6Gender
Female 689.4 475 13.5 93.6White 1,180.0 763 18.2 214.9Black 51.5 18 . .American Indian 9.8 9 . .Asian/Pacific Islander 22.7 5 . .
Race/ethnicity
Hispanic 82.4 28 . .$25,000 or less 200.6 134 16.6 33.3$25,000 to $49,999 356.0 192 21.0 74.7$50,000 to $74,999 270.3 108 20.6 55.6$75,000 to $99,999 122.5 50 24.7 30.3$100,000 to $149,999 77.4 32 27.8 21.5
Annual family income
$150,000 or more 36.1 14 . .Less than high school 180.8 85 17.9 32.3High school graduate 384.0 246 21.1 81.1Some college/tech. school
424.9 251 17.2 73.2
Bachelor's degree 192.2 171 12.2 23.5
Education
Post-graduate degree 79.7 71 10.6 8.5Non-metropolitan 584.6 464 22.9 134.0Place of residence
Metropolitan 771.1 372 13.5 104.2

79
Nevada (n=677)
Demographic Strata Population
(1000s) Sample
size Percent
participating Participants
(1000s)
All Groups All people age 16+ 1,902.5 677 23.9 455.1
Under 30 473.2 132 36.3 171.730-50 760.3 304 25.8 196.4
Age
51 & older 668.9 228 13.0 87.0Male 965.4 324 24.6 237.1Gender
Female 937.1 351 23.3 218.0White 1,195.0 517 30.9 369.0Black 131.2 25 . .American Indian 19.5 7 . .Asian/Pacific Islander 123.7 15 . .
Race/ethnicity
Hispanic 401.7 95 15.8 63.4$25,000 or less 221.3 70 21.7 48.1$25,000 to $49,999 374.3 146 26.8 100.2$50,000 to $74,999 299.8 110 22.1 66.2$75,000 to $99,999 159.3 61 41.1 65.5$100,000 to $149,999 108.7 46 43.7 47.5
Annual family income
$150,000 or more 57.1 21 . .Less than high school 312.8 76 24.5 76.6High school graduate 441.7 161 15.5 68.7Some college/tech. school
489.0 232 31.2 152.4
Bachelor's degree 164.7 129 25.8 42.4
Education
Post-graduate degree 80.3 67 23.7 19.0Non-metropolitan 200.3 163 44.9 89.9Place of residence
Metropolitan 1,702.2 514 21.5 365.2

80
New Hampshire (n=597)
Demographic Strata Population
(1000s) Sample
size Percent
participating Participants
(1000s)
All Groups All people age 16+ 1,040.7 597 20.2 209.9
Under 30 232.1 97 42.8 99.430-50 417.2 278 19.2 80.3
Age
51 & older 391.4 208 7.7 30.3Male 508.7 260 21.9 111.4Gender
Female 532.0 336 18.5 98.5White 982.4 557 20.2 198.2Black 8.8 2 . .American Indian 2.5 7 . .Asian/Pacific Islander 18.9 4 . .
Race/ethnicity
Hispanic 20.9 6 . .$25,000 or less 103.7 55 12.7 13.1$25,000 to $49,999 218.1 108 19.5 42.5$50,000 to $74,999 209.9 92 28.5 59.9$75,000 to $99,999 123.8 74 15.9 19.7$100,000 to $149,999 90.0 35 15.4 13.8
Annual family income
$150,000 or more 46.7 16 . .Less than high school 126.6 32 23.5 29.7High school graduate 277.1 143 24.4 67.6Some college/tech. school
278.2 158 20.2 56.1
Bachelor's degree 162.4 158 14.7 23.8
Education
Post-graduate degree 82.6 95 11.0 9.1Non-metropolitan 392.9 232 24.0 94.3Place of residence
Metropolitan 647.8 365 17.9 115.6

81
New Jersey (n=1,749)
Demographic Strata Population
(1000s) Sample
size Percent
participating Participants
(1000s)
All Groups All people age 16+ 6,784.6 1,749 12.6 854.1
Under 30 1,502.4 355 17.6 265.030-50 2,765.6 754 15.7 434.7
Age
51 & older 2,516.5 579 6.1 154.4Male 3,273.4 801 15.1 495.0Gender
Female 3,511.2 940 10.2 359.1White 4,368.8 1,327 13.6 592.5Black 861.0 171 11.1 95.3American Indian 10.5 10 . .Asian/Pacific Islander 497.2 57 16.6 82.4
Race/ethnicity
Hispanic 993.9 123 9.2 91.5$25,000 or less 770.7 120 8.3 63.7$25,000 to $49,999 1,224.0 211 12.1 148.4$50,000 to $74,999 1,174.5 233 15.0 176.0$75,000 to $99,999 866.5 189 17.1 148.4$100,000 to $149,999 862.1 191 20.7 178.3
Annual family income
$150,000 or more 592.1 114 16.5 97.6Less than high school 1,174.3 120 7.0 81.8High school graduate 1,847.5 396 13.6 251.0Some college/tech. school
1,546.6 448 16.6 256.0
Bachelor's degree 1,137.5 458 12.0 136.8
Education
Post-graduate degree 627.1 286 14.7 92.5Non-metropolitan 0.0 . . .Place of residence
Metropolitan 6,784.6 1,749 12.6 854.1

82
New Mexico (n=740)
Demographic Strata Population
(1000s) Sample
size Percent
participating Participants
(1000s)
All Groups All people age 16+ 1,484.0 740 27.3 404.8
Under 30 395.3 153 46.7 184.730-50 540.8 287 28.0 151.7
Age
51 & older 547.8 286 12.5 68.5Male 725.6 341 31.8 230.6Gender
Female 758.4 399 23.0 174.2White 688.0 497 27.5 189.2Black 28.0 11 . .American Indian 122.3 21 . .Asian/Pacific Islander 19.3 5 . .
Race/ethnicity
Hispanic 612.2 184 27.7 169.7$25,000 or less 344.5 123 20.7 71.2$25,000 to $49,999 369.5 175 29.2 108.0$50,000 to $74,999 217.5 95 37.2 80.9$75,000 to $99,999 109.2 34 42.3 46.2$100,000 to $149,999 71.3 35 29.3 20.9
Annual family income
$150,000 or more 36.6 16 . .Less than high school 292.1 86 22.3 65.0High school graduate 356.4 183 30.3 108.0Some college/tech. school
389.7 213 33.4 130.3
Bachelor's degree 160.8 144 26.9 43.2
Education
Post-graduate degree 112.5 104 16.2 18.3Non-metropolitan 518.6 408 23.2 120.3Place of residence
Metropolitan 965.3 332 29.5 284.5

83
New York (n=3,765)
Demographic Strata Population
(1000s) Sample
size Percent
participating Participants
(1000s)
All Groups All people age 16+ 15,116.2 3,765 12.9 1,942.8
Under 30 3,696.8 798 20.0 740.430-50 5,839.6 1,656 15.8 926.8
Age
51 & older 5,579.8 1,219 4.9 275.6Male 7,219.0 1,586 15.7 1,136.1Gender
Female 7,897.2 2,165 10.2 806.7White 9,425.4 2,797 15.3 1,439.7Black 2,172.7 361 9.6 208.8American Indian 45.0 39 21.9 9.9Asian/Pacific Islander 1,045.6 78 11.9 124.4
Race/ethnicity
Hispanic 2,292.7 340 8.5 194.5$25,000 or less 2,654.9 407 9.8 259.2$25,000 to $49,999 3,097.8 695 16.2 501.3$50,000 to $74,999 2,449.8 526 18.8 461.1$75,000 to $99,999 1,519.6 287 17.9 272.7$100,000 to $149,999 1,335.8 257 15.4 206.1
Annual family income
$150,000 or more 897.0 158 22.9 205.5Less than high school 3,047.8 303 9.7 295.3High school graduate 3,925.8 919 14.3 563.2Some college/tech. school
3,688.7 1,018 14.7 542.5
Bachelor's degree 2,143.4 785 12.8 274.9
Education
Post-graduate degree 1,496.7 692 10.9 163.4Non-metropolitan 1,230.1 623 24.5 301.3Place of residence
Metropolitan 13,886.1 3,142 11.9 1,641.5
84
North Carolina (n=2,017)
Demographic Strata Population
(1000s) Sample
size Percent
participating Participants
(1000s)
All Groups All people age 16+ 6,846.7 2,017 19.6 1,345.2
Under 30 1,661.3 408 34.1 566.830-50 2,693.9 797 21.0 566.8
Age
51 & older 2,491.6 786 8.4 211.6Male 3,312.7 867 27.1 900.2Gender
Female 3,534.0 1,142 12.6 445.0White 4,812.4 1,610 25.3 1,216.4Black 1,398.1 255 10.1 141.2American Indian 76.6 35 28.4 21.7Asian/Pacific Islander 124.1 13 . .
Race/ethnicity
Hispanic 388.4 70 6.7 26.1$25,000 or less 1,132.2 253 17.3 195.7$25,000 to $49,999 1,617.7 422 19.3 312.8$50,000 to $74,999 1,162.8 266 20.4 237.2$75,000 to $99,999 561.5 136 25.4 142.5$100,000 to $149,999 388.3 98 21.6 83.9
Annual family income
$150,000 or more 217.6 62 33.3 72.5Less than high school 1,362.4 250 18.7 255.2High school graduate 1,739.6 522 22.1 384.5Some college/tech. school
1,736.0 601 19.9 346.0
Bachelor's degree 867.7 396 20.2 175.2
Education
Post-graduate degree 382.3 222 14.5 55.6Non-metropolitan 2,109.4 998 22.1 466.1Place of residence
Metropolitan 4,737.3 1,019 18.5 879.1

85
North Dakota (n=620)
Demographic Strata Population
(1000s) Sample
size Percent
participating Participants
(1000s)
All Groups All people age 16+ 501.7 620 25.4 127.4
Under 30 138.3 121 40.5 56.030-50 169.8 264 27.5 46.7
Age
51 & older 193.6 226 12.8 24.7Male 250.7 296 32.3 80.9Gender
Female 251.0 322 18.6 46.5White 461.6 583 25.9 119.6Black 3.5 1 . .American Indian 22.0 13 . .Asian/Pacific Islander 3.8 2 . .
Race/ethnicity
Hispanic 7.3 6 . .$25,000 or less 90.2 106 13.8 12.5$25,000 to $49,999 144.7 153 29.1 42.2$50,000 to $74,999 97.9 82 30.4 29.8$75,000 to $99,999 37.0 35 46.0 17.0$100,000 to $149,999 20.7 14 . .
Annual family income
$150,000 or more 10.3 8 . .Less than high school 77.3 56 20.9 16.2High school graduate 131.4 166 24.6 32.3Some college/tech. school
177.9 194 32.4 57.6
Bachelor's degree 72.3 139 25.6 18.5
Education
Post-graduate degree 22.5 54 15.1 3.4Non-metropolitan 268.2 380 25.5 68.3Place of residence
Metropolitan 233.5 240 25.3 59.1
86
Ohio (n=2,579)
Demographic Strata Population
(1000s) Sample
size Percent
participating Participants
(1000s)
All Groups All people age 16+ 8,911.1 2,579 15.6 1,393.0
Under 30 2,158.9 487 29.4 635.330-50 3,353.4 1,090 17.2 575.3
Age
51 & older 3,398.8 961 5.4 182.4Male 4,290.1 1,084 20.4 874.2Gender
Female 4,621.0 1,489 11.2 518.8White 7,517.0 2,284 16.8 1,262.5Black 980.8 156 10.7 104.7American Indian 19.1 27 . .Asian/Pacific Islander 138.4 16 . .
Race/ethnicity
Hispanic 183.3 31 5.6 10.2$25,000 or less 1,388.3 346 13.6 189.0$25,000 to $49,999 2,208.7 558 13.1 290.1$50,000 to $74,999 1,754.0 366 19.1 335.0$75,000 to $99,999 926.4 183 20.3 188.4$100,000 to $149,999 616.9 120 22.6 139.6
Annual family income
$150,000 or more 306.9 75 20.2 61.9Less than high school 1,507.0 198 18.2 274.6High school graduate 3,004.1 837 17.4 522.0Some college/tech. school
2,315.2 690 14.7 339.6
Bachelor's degree 1,089.6 532 11.5 125.6
Education
Post-graduate degree 552.0 291 10.6 58.3Non-metropolitan 1,736.5 695 20.2 352.2Place of residence
Metropolitan 7,174.6 1,884 14.5 1,040.8

87
Oklahoma (n=1,082)
Demographic Strata Population
(1000s) Sample
size Percent
participating Participants
(1000s)
All Groups All people age 16+ 2,748.2 1,082 24.7 678.8
Under 30 721.0 243 38.0 273.730-50 990.9 421 25.1 249.3
Age
51 & older 1,036.2 400 15.0 155.8Male 1,339.6 461 30.6 410.2Gender
Female 1,408.6 618 19.1 268.6White 2,056.9 902 20.6 423.7Black 195.7 38 54.8 107.3American Indian 197.6 71 30.9 61.0Asian/Pacific Islander 48.2 7 . .
Race/ethnicity
Hispanic 160.8 34 35.7 57.4$25,000 or less 593.3 154 19.4 115.0$25,000 to $49,999 741.7 233 32.8 242.9$50,000 to $74,999 455.8 150 21.7 98.9$75,000 to $99,999 204.6 68 23.4 47.9$100,000 to $149,999 123.1 31 33.9 41.8
Annual family income
$150,000 or more 64.1 22 . .Less than high school 517.2 137 36.6 189.2High school graduate 804.1 299 21.5 172.7Some college/tech. school
772.6 316 19.7 151.9
Bachelor's degree 315.5 184 15.6 49.2
Education
Post-graduate degree 151.0 129 16.0 24.1Non-metropolitan 1,007.4 494 22.5 227.1Place of residence
Metropolitan 1,740.8 588 25.9 451.7

88
Oregon (n=1,037)
Demographic Strata Population
(1000s) Sample
size Percent
participating Participants
(1000s)
All Groups All people age 16+ 2,905.5 1,037 22.2 644.7
Under 30 706.3 210 26.3 185.430-50 1,078.4 413 23.8 256.2
Age
51 & older 1,120.8 397 18.1 203.1Male 1,433.6 478 26.4 378.0Gender
Female 1,471.9 556 18.2 266.7White 2,424.0 925 23.1 559.7Black 45.1 9 . .American Indian 32.2 14 . .Asian/Pacific Islander 109.4 17 . .
Race/ethnicity
Hispanic 245.8 52 23.9 58.8$25,000 or less 423.4 175 16.0 67.6$25,000 to $49,999 671.6 215 25.6 171.8$50,000 to $74,999 504.2 167 27.3 137.6$75,000 to $99,999 257.4 80 36.0 92.7$100,000 to $149,999 176.9 48 25.9 45.9
Annual family income
$150,000 or more 95.2 22 . .Less than high school 418.9 102 20.3 85.0High school graduate 687.3 227 24.5 168.7Some college/tech. school
883.7 329 26.5 234.3
Bachelor's degree 390.3 218 19.5 76.2
Education
Post-graduate degree 196.9 142 13.3 26.1Non-metropolitan 665.2 349 29.5 196.3Place of residence
Metropolitan 2,240.4 688 20.0 448.4

89
Pennsylvania (n=2,768)
Demographic Strata Population
(1000s) Sample
size Percent
participating Participants
(1000s)
All Groups All people age 16+ 9,848.8 2,768 18.8 1,854.2
Under 30 2,253.7 547 30.7 691.230-50 3,628.9 1,122 21.9 795.3
Age
51 & older 3,966.1 1,045 9.3 367.7Male 4,726.7 1,208 22.4 1,058.9Gender
Female 5,122.1 1,555 15.6 795.3White 8,260.9 2,461 19.4 1,601.9Black 933.2 155 18.7 174.9American Indian 13.6 11 . .Asian/Pacific Islander 227.1 21 . .
Race/ethnicity
Hispanic 355.5 44 15.5 55.1$25,000 or less 1,573.6 368 12.7 200.2$25,000 to $49,999 2,433.3 583 20.5 499.0$50,000 to $74,999 1,847.7 354 22.8 421.7$75,000 to $99,999 967.9 184 21.1 204.6$100,000 to $149,999 679.6 135 30.2 205.0
Annual family income
$150,000 or more 374.5 60 15.0 56.3Less than high school 1,717.9 243 19.8 340.7High school graduate 3,476.8 927 18.8 655.0Some college/tech. school
2,216.1 700 19.8 439.6
Bachelor's degree 1,250.2 538 18.5 231.5
Education
Post-graduate degree 701.1 309 12.3 86.0Non-metropolitan 1,576.3 646 29.7 467.2Place of residence
Metropolitan 8,272.4 2,122 16.8 1,387.0

90
Rhode Island (n=595)
Demographic Strata Population
(1000s) Sample
size Percent
participating Participants
(1000s)
All Groups All people age 16+ 847.2 595 10.9 92.6
Under 30 210.0 108 19.1 40.030-50 318.3 270 12.2 38.7
Age
51 & older 318.8 207 4.4 13.9Male 403.8 277 11.7 47.5Gender
Female 443.4 317 10.1 45.1White 696.7 519 11.8 82.1Black 38.2 14 . .American Indian 3.2 3 . .Asian/Pacific Islander 22.3 6 . .
Race/ethnicity
Hispanic 78.8 33 10.7 8.5$25,000 or less 130.7 59 8.1 10.6$25,000 to $49,999 177.0 106 13.6 24.0$50,000 to $74,999 158.5 82 12.2 19.3$75,000 to $99,999 91.9 54 27.0 24.8$100,000 to $149,999 67.1 38 16.5 11.0
Annual family income
$150,000 or more 33.8 22 . .Less than high school 173.0 43 10.1 17.5High school graduate 220.9 130 12.1 26.6Some college/tech. school
219.0 167 15.7 34.4
Bachelor's degree 119.7 139 6.1 7.3
Education
Post-graduate degree 68.3 110 6.3 4.3Non-metropolitan 0.0 84 15.9 0.0Place of residence
Metropolitan 847.2 511 10.9 92.6

91
South Carolina (n=1,131)
Demographic Strata Population
(1000s) Sample
size Percent
participating Participants
(1000s)
All Groups All people age 16+ 3,358.7 1,131 18.5 622.9
Under 30 830.4 224 31.4 261.130-50 1,251.1 477 16.9 210.7
Age
51 & older 1,277.2 408 11.9 151.1Male 1,612.4 467 24.9 400.6Gender
Female 1,746.2 662 12.8 222.3White 2,264.2 860 20.6 465.7Black 918.8 208 14.7 135.2American Indian 11.5 12 . .Asian/Pacific Islander 38.8 6 . .
Race/ethnicity
Hispanic 104.6 18 . .$25,000 or less 636.4 143 10.9 69.5$25,000 to $49,999 820.6 213 21.6 177.0$50,000 to $74,999 574.5 176 25.2 144.9$75,000 to $99,999 273.3 80 12.8 34.9$100,000 to $149,999 174.3 45 19.8 34.5
Annual family income
$150,000 or more 89.9 25 . .Less than high school 719.0 124 21.6 155.0High school graduate 901.8 305 15.6 140.6Some college/tech. school
824.0 329 18.7 154.4
Bachelor's degree 377.9 210 16.9 64.0
Education
Post-graduate degree 180.2 143 21.3 38.4Non-metropolitan 820.9 452 16.9 137.9Place of residence
Metropolitan 2,537.8 679 19.1 485.0

92
South Dakota (n=656)
Demographic Strata Population
(1000s) Sample
size Percent
participating Participants
(1000s)
All Groups All people age 16+ 602.1 656 27.0 162.5
Under 30 155.7 141 46.7 72.830-50 211.2 266 27.9 58.9
Age
51 & older 235.1 241 13.1 30.8Male 298.5 300 34.2 102.2Gender
Female 303.6 355 19.8 60.3White 536.3 607 25.9 138.8Black 4.7 2 . .American Indian 40.6 28 . .Asian/Pacific Islander 4.6 0 . .
Race/ethnicity
Hispanic 10.8 6 . .$25,000 or less 108.9 110 23.8 26.0$25,000 to $49,999 169.8 163 23.7 40.2$50,000 to $74,999 110.4 87 31.4 34.7$75,000 to $99,999 43.1 30 43.7 18.8$100,000 to $149,999 23.7 22 . .
Annual family income
$150,000 or more 12.8 9 . .Less than high school 90.1 61 26.8 24.2High school graduate 178.0 205 26.6 47.4Some college/tech. school
176.7 203 28.1 49.6
Bachelor's degree 78.6 127 24.3 19.1
Education
Post-graduate degree 28.7 53 35.2 10.1Non-metropolitan 338.6 500 27.2 92.0Place of residence
Metropolitan 263.5 156 26.7 70.5

93
Tennessee (n=1,559)
Demographic Strata Population
(1000s) Sample
size Percent
participating Participants
(1000s)
All Groups All people age 16+ 4,696.5 1,559 18.9 888.0
Under 30 1,141.1 289 32.7 372.430-50 1,791.9 654 20.3 363.2
Age
51 & older 1,763.5 595 8.7 152.4Male 2,266.4 694 26.2 592.7Gender
Female 2,430.1 864 12.2 295.3White 3,729.2 1,333 21.4 798.8Black 728.1 133 9.0 65.8American Indian 13.0 21 . .Asian/Pacific Islander 61.3 7 . .
Race/ethnicity
Hispanic 131.4 30 11.9 15.7$25,000 or less 907.5 206 15.9 144.4$25,000 to $49,999 1,206.9 332 23.5 283.6$50,000 to $74,999 801.3 232 29.1 233.5$75,000 to $99,999 373.0 100 11.0 41.1$100,000 to $149,999 244.4 80 12.8 31.2
Annual family income
$150,000 or more 141.9 41 24.8 35.2Less than high school 1,037.8 205 17.9 185.8High school graduate 1,363.0 446 20.6 281.1Some college/tech. school
1,122.4 450 21.2 237.8
Bachelor's degree 512.2 264 14.3 73.2
Education
Post-graduate degree 256.7 171 15.3 39.4Non-metropolitan 1,281.2 631 27.9 357.2Place of residence
Metropolitan 3,415.3 928 15.5 530.8

94
Texas (n=3,845)
Demographic Strata Population
(1000s) Sample
size Percent
participating Participants
(1000s)
All Groups All people age 16+ 17,466.2 3,845 16.5 2,886.4
Under 30 4,862.6 915 27.8 1,349.830-50 7,021.1 1,572 15.6 1,097.7
Age
51 & older 5,582.5 1,287 7.8 438.9Male 8,632.6 1,656 21.3 1,837.9Gender
Female 8,833.6 2,169 11.9 1,048.5White 9,047.4 2,670 21.0 1,900.9Black 1,958.6 277 13.3 261.2American Indian 67.3 39 16.7 11.2Asian/Pacific Islander 600.2 46 5.3 31.7
Race/ethnicity
Hispanic 5,660.4 724 12.5 706.4$25,000 or less 3,205.5 475 13.5 434.1$25,000 to $49,999 3,869.0 728 17.7 686.4$50,000 to $74,999 2,682.8 523 21.1 565.1$75,000 to $99,999 1,479.2 301 19.7 290.7$100,000 to $149,999 1,144.5 247 20.0 228.4
Annual family income
$150,000 or more 683.1 130 34.3 234.2Less than high school 3,800.2 474 15.0 570.0High school graduate 3,798.3 892 17.8 676.8Some college/tech. school
4,277.5 1,139 18.6 796.7
Bachelor's degree 2,115.9 839 15.6 329.6
Education
Post-graduate degree 985.9 438 14.5 142.7Non-metropolitan 2,280.7 993 18.4 419.5Place of residence
Metropolitan 15,185.5 2,852 16.3 2,466.9

95
Utah (n=800)
Demographic Strata Population
(1000s) Sample
size Percent
participating Participants
(1000s)
All Groups All people age 16+ 1,814.6 800 32.5 589.9
Under 30 627.6 208 36.4 228.730-50 659.2 306 39.3 258.9
Age
51 & older 527.7 279 19.3 102.3Male 904.9 355 39.6 357.9Gender
Female 909.7 445 25.5 232.0White 1,531.3 720 33.3 510.2Black 14.6 5 . .American Indian 20.1 6 . .Asian/Pacific Islander 49.5 10 . .
Race/ethnicity
Hispanic 183.0 46 31.8 58.2$25,000 or less 228.9 101 22.4 51.2$25,000 to $49,999 445.9 185 34.1 152.1$50,000 to $74,999 352.7 126 41.7 147.2$75,000 to $99,999 183.5 53 40.7 74.6$100,000 to $149,999 120.8 39 58.3 70.4
Annual family income
$150,000 or more 59.2 16 . .Less than high school 209.7 51 37.6 78.8High school graduate 382.0 184 28.8 110.2Some college/tech. school
596.5 288 36.9 220.3
Bachelor's degree 228.2 160 24.3 55.4
Education
Post-graduate degree 100.0 101 31.0 31.0Non-metropolitan 204.6 224 44.3 90.7Place of residence
Metropolitan 1,610.0 576 31.0 499.2

96
Vermont (n=534)
Demographic Strata Population
(1000s) Sample
size Percent
participating Participants
(1000s)
All Groups All people age 16+ 501.4 534 18.2 91.3
Under 30 115.5 77 21.8 25.230-50 186.1 230 24.2 45.0
Age
51 & older 199.9 220 10.5 21.0Male 244.4 236 23.6 57.8Gender
Female 257.0 297 13.1 33.5White 481.3 495 18.9 90.8Black 3.0 3 . .American Indian 1.9 9 . .Asian/Pacific Islander 5.4 4 . .
Race/ethnicity
Hispanic 5.5 9 . .$25,000 or less 71.3 82 16.6 11.9$25,000 to $49,999 126.6 127 21.6 27.3$50,000 to $74,999 95.6 78 20.2 19.3$75,000 to $99,999 46.1 36 7.0 3.2$100,000 to $149,999 28.5 20 . .
Annual family income
$150,000 or more 15.1 14 . .Less than high school 64.6 36 18.9 12.2High school graduate 148.0 136 23.2 34.4Some college/tech. school
124.3 143 19.1 23.7
Bachelor's degree 79.3 137 13.4 10.6
Education
Post-graduate degree 45.1 76 7.2 3.2Non-metropolitan 336.3 378 20.3 68.2Place of residence
Metropolitan 165.2 156 14.0 23.1

97
Virginia (n=1,524)
Demographic Strata Population
(1000s) Sample
size Percent
participating Participants
(1000s)
All Groups All people age 16+ 5,959.5 1,524 19.1 1,140.7
Under 30 1,466.0 306 29.5 431.930-50 2,378.7 629 22.7 539.0
Age
51 & older 2,114.8 559 8.1 169.8Male 2,898.5 669 23.8 690.4Gender
Female 3,061.0 851 14.7 450.3White 4,141.9 1,279 21.0 868.5Black 1,117.6 138 14.8 165.0American Indian 17.1 10 . .Asian/Pacific Islander 284.4 15 . .
Race/ethnicity
Hispanic 336.0 43 15.7 52.8$25,000 or less 789.8 165 9.2 72.5$25,000 to $49,999 1,239.4 313 22.2 275.5$50,000 to $74,999 1,009.6 222 19.0 191.6$75,000 to $99,999 600.7 140 29.5 177.0$100,000 to $149,999 517.2 87 18.9 97.8
Annual family income
$150,000 or more 316.7 52 32.1 101.5Less than high school 1,004.1 145 19.2 192.7High school graduate 1,415.8 400 20.3 286.9Some college/tech. school
1,479.3 415 19.9 293.8
Bachelor's degree 898.8 315 18.0 162.0
Education
Post-graduate degree 544.7 221 15.3 83.2Non-metropolitan 864.8 663 27.9 241.7Place of residence
Metropolitan 5,094.7 861 17.6 899.0

98
Washington (n=1,425)
Demographic Strata Population
(1000s) Sample
size Percent
participating Participants
(1000s)
All Groups All people age 16+ 4,980.9 1,425 22.1 1,099.7
Under 30 1,239.3 301 38.5 476.130-50 1,947.8 603 23.9 465.5
Age
51 & older 1,793.9 502 8.8 158.1Male 2,465.3 657 25.8 636.0Gender
Female 2,515.6 766 18.4 463.7White 3,932.2 1,233 24.1 948.2Black 158.3 20 . .American Indian 68.1 26 . .Asian/Pacific Islander 349.4 32 25.9 90.7
Race/ethnicity
Hispanic 373.8 63 9.9 36.9$25,000 or less 625.1 187 16.3 101.7$25,000 to $49,999 1,040.6 293 21.2 220.3$50,000 to $74,999 898.7 238 25.4 228.0$75,000 to $99,999 521.8 129 18.2 95.1$100,000 to $149,999 380.2 89 14.5 55.2
Annual family income
$150,000 or more 195.1 40 23.8 46.5Less than high school 632.0 116 25.3 160.1High school graduate 1,114.0 318 27.2 303.1Some college/tech. school
1,538.0 486 23.6 363.1
Bachelor's degree 741.4 303 12.1 89.7
Education
Post-graduate degree 359.0 182 11.9 42.7Non-metropolitan 623.7 360 30.4 189.4Place of residence
Metropolitan 4,357.3 1,065 20.9 910.3
99
West Virginia (n=902)
Demographic Strata Population
(1000s) Sample
size Percent
participating Participants
(1000s)
All Groups All people age 16+ 1,455.6 902 33.7 490.2
Under 30 328.1 164 48.5 159.430-50 516.4 375 44.2 228.4
Age
51 & older 611.0 353 16.7 102.5Male 705.3 386 43.1 303.9Gender
Female 750.3 515 24.9 186.3White 1,375.1 835 34.9 480.0Black 45.7 13 . .American Indian 3.3 18 . .Asian/Pacific Islander 9.8 2 . .
Race/ethnicity
Hispanic 12.7 14 . .$25,000 or less 385.6 163 23.9 92.3$25,000 to $49,999 413.5 214 38.7 160.0$50,000 to $74,999 224.9 132 43.4 97.6$75,000 to $99,999 94.6 43 71.0 67.2$100,000 to $149,999 50.4 26 . .
Annual family income
$150,000 or more 25.6 14 . .Less than high school 343.5 96 27.5 94.3High school graduate 545.7 334 35.7 194.6Some college/tech. school
324.7 237 36.1 117.3
Bachelor's degree 118.4 129 41.1 48.7
Education
Post-graduate degree 74.2 88 22.1 16.4Non-metropolitan 654.1 580 36.8 240.9Place of residence
Metropolitan 801.4 322 31.1 249.3

100
Wisconsin (n=1,539)
Demographic Strata Population
(1000s) Sample
size Percent
participating Participants
(1000s)
All Groups All people age 16+ 4,343.7 1,539 20.4 886.1
Under 30 1,073.9 274 26.6 285.930-50 1,650.9 664 23.3 385.2
Age
51 & older 1,618.9 572 13.3 215.0Male 2,141.7 687 26.5 567.3Gender
Female 2,201.9 848 14.5 318.8White 3,810.1 1,411 21.6 824.3Black 222.7 38 13.0 29.0American Indian 34.2 23 . .Asian/Pacific Islander 77.3 11 . .
Race/ethnicity
Hispanic 171.0 31 11.2 19.2$25,000 or less 529.8 199 9.9 52.3$25,000 to $49,999 1,020.0 354 23.5 240.2$50,000 to $74,999 930.7 261 26.6 247.4$75,000 to $99,999 475.6 109 22.8 108.5$100,000 to $149,999 286.4 68 19.9 56.9
Annual family income
$150,000 or more 132.1 33 31.9 42.1Less than high school 628.5 120 18.1 113.9High school graduate 1,352.3 476 21.8 295.0Some college/tech. school
1,197.7 419 24.8 296.6
Bachelor's degree 566.9 312 18.8 106.8
Education
Post-graduate degree 250.9 185 9.4 23.5Non-metropolitan 1,203.6 614 25.6 308.2Place of residence
Metropolitan 3,140.1 925 18.4 577.9

101
Wyoming (n=527)
Demographic Strata Population
(1000s) Sample
size Percent
participating Participants
(1000s)
All Groups All people age 16+ 402.4 527 34.3 137.9
Under 30 104.5 95 55.9 58.330-50 144.7 220 27.5 39.8
Age
51 & older 153.2 208 26.0 39.7Male 203.3 255 40.1 81.6Gender
Female 199.1 271 28.3 56.3White 359.7 479 36.5 131.4Black 3.2 1 . .American Indian 8.0 11 . .Asian/Pacific Islander 3.0 3 . .
Race/ethnicity
Hispanic 24.8 23 . .$25,000 or less 66.6 76 27.8 18.5$25,000 to $49,999 107.1 128 30.7 32.9$50,000 to $74,999 76.9 103 40.3 31.0$75,000 to $99,999 35.9 30 38.1 13.7$100,000 to $149,999 17.8 20 . .
Annual family income
$150,000 or more 8.3 5 . .Less than high school 48.8 40 47.8 23.3High school graduate 113.9 149 23.7 27.0Some college/tech. school
131.1 176 40.2 52.7
Bachelor's degree 49.6 99 28.0 13.9
Education
Post-graduate degree 22.3 56 41.6 9.3Non-metropolitan 280.0 408 38.0 106.6Place of residence
Metropolitan 122.4 119 25.6 31.3Source: 2006 Census Estimates Program (age, sex, race/ethnicity, residence: civilian, non-institutionalized population); 2000 Census, SF3 (education, income); NSRE 1999-2004, Versions 1-16 except 3, 6, 12; and NSRE 2005-2007, Versions 2 & 3. Note: Estimates are statistically unreliable and thus not reported for demographic strata with a sample size of less than 30.