OFDM BASED RF AND OPTICAL WIRELESS SYSTEMS
151
The Pennsylvania State University The Graduate School College of Engineering OFDM BASED RF AND OPTICAL WIRELESS SYSTEMS A Dissertation in Electrical Engineering by Bilal A. Ranjha © 2014 Bilal A. Ranjha Submitted in Partial Fulfillment of the Requirements for the Degree of Doctor of Philosophy December 2014
Transcript of OFDM BASED RF AND OPTICAL WIRELESS SYSTEMS

The Pennsylvania State University
The Graduate School
College of Engineering
OFDM BASED RF AND OPTICAL WIRELESS SYSTEMS
A Dissertation in
Electrical Engineering
by
Bilal A. Ranjha
© 2014 Bilal A. Ranjha
Submitted in Partial Fulfillment
of the Requirements
for the Degree of
Doctor of Philosophy
December 2014

ii
The dissertation of Bilal A. Ranjha was reviewed and approved* by the following:
Mohsen Kavehrad
W. L. Weiss chair Professor of Electrical Engineering
Dissertation Advisor
Chair of Committee
Kenneth W. Jenkins
Professor of Electrical Engineering
Julio Urbina
Associate Professor of Electrical Engineering
Jian Xu
Associate Professor of Engineering Science & Mechanics
and Adjunct Professor of Electrical Engineering
Kultegin Aydin
Professor of Electrical Engineering
Head of the Department of Electrical Engineering
*Signatures are on file in the Graduate School.

iii
Abstract
Orthogonal frequency division multiplexing (OFDM) is currently being used predominantly in
radio frequency (RF) mobile broadband communication systems because of its ability to combat
inter-symbol interference (ISI) and robustness against frequency selective fading caused by
multipath wireless channel. Wireless mobile standards like 3G and 4G long term evolution
(LTE) use orthogonal frequency division multiple access (OFDMA) as a
multiplexing/modulation scheme. Despite its many advantages like single tap frequency domain
equalization and fast discrete time implementation, OFDM suffers from certain disadvantages
like high peak-to-average power ratio (PAPR) and high sensitivity to carrier frequency offset
(CFO). Although OFDM has solved problems like multipath fading but it cannot solve the
emerging problems like scarcity of RF spectrum for mobile wireless broadband applications.
Optical wireless (OW) communication has recently gained a lot of attention as a candidate to
complement RF communication. It offers advantages like virtually infinite bandwidth, data
security and use of low cost transmitters and receivers like solid state light emitting diodes
(LEDs) and optical detectors. OFDM is also being considered as a candidate for visible light
communication (VLC) as it offers robustness against multipath caused by diffuse indoor OW
channel. One way to realize VLC is intensity modulation direct detection (IM/DD).
Although the major difference between RF and OW based OFDM lies in the front end of
transmitter and receiver, but due to the unipolar nature of optical intensity in IM/DD system,
methods of generating baseband OFDM signal, techniques to reduce PAPR and timing
synchronization schemes for RF cannot be directly applied to optical OFDM systems and
therefore must be revisited.

iv
Therefore, in this thesis, we will first look into the interference caused by CFO in RF based
OFDMA system and will analyze the characteristics of this interference for two mapping
subcarrier strategies. We will explicitly calculate SINR expression for OFDMA based systems
and analyze two types of symbol mapping strategies and characterize interferences due to CFO
for each scheme.
We will also develop some techniques to reduce high PAPR in OFDM based OW systems since
the non-linear characteristics of LED transmitters can severely affect system performance. We
will look into various precoding based PAPR reduction techniques. We will then analyze
performance of various OFDM based OW schemes in multipath diffuse indoor wireless channel.
We will compare performance of conventional schemes with a precoded version.
We will then describe in detail our newly proposed power and spectrally efficient hybrid
asymmetrically clipped optical orthogonal frequency division multiplexing (HACO-OFDM)
system and compare its performance with previously proposed schemes.
Finally, we will present details of our newly proposed timing synchronization scheme for power
efficient asymmetrically clipped (AC) OW OFDM systems. Detailed performance analysis will
be presented and a comparison will be developed. Simulation results show that our proposed
scheme outperforms all other timing synchronization techniques and exhibits perfect accuracy
even at very low signal-to-noise ratio (SNR). Besides performance, our scheme works perfectly
for multiple AC OW which proves its high versatility.

v
TABLE OF CONTENTS
List of Figures ............................................................................................................................. viii
List of Tables ............................................................................................................................... xii
Acknowledgments ...................................................................................................................... xiii
Chapter 1 Introduction ........................................................................................................... 1
1.1 OFDM Based LTE System ............................................................................................. 1
1.2 The Problem of Spectrum Scarcity ................................................................................. 3
1.3 How RF is Different than VLC with IM/DD .................................................................. 5
1.4 Applications of VLC ....................................................................................................... 5
1.5 Challenges in VLC .......................................................................................................... 7
1.6 OFDM and OFDMA for VLC IM/DD System............................................................... 9
1.7 Objectives and Contributions ........................................................................................ 10
1.8 Organization .................................................................................................................. 11
1.9 Nomenclature ................................................................................................................ 13
Chapter 2 RF and IM/DD Optical Wireless OFDM Systems ........................................... 14
2.1 Basic OFDM System .................................................................................................... 14
2.2 System Operation .......................................................................................................... 16
2.3 Discrete Time Implementation of OFDM..................................................................... 17
2.4 Drawbacks of OFDM .................................................................................................... 19
2.5 Orthogonal Frequency Division Multiple Access (OFDMA) ...................................... 20
2.6 OFDM Based OW Systems .......................................................................................... 21 2.6.1 ACO-OFDM ............................................................................................................. 22
2.6.2 PAM-DMT ................................................................................................................ 24 2.6.3 DHT-OFDM ............................................................................................................. 26
Chapter 3 Interference Analysis of Interleaved and Localized Mapping ........................ 28
3.1 Introduction ................................................................................................................... 28
3.2 OFDMA System Model ................................................................................................ 29
3.3 Subcarrier Mapping ...................................................................................................... 33
3.4 Interleaved Frequency Division Multiple Access (IFDMA) ........................................ 35

vi
3.5 Localized Frequency Division Multiple Access (LFDMA) ......................................... 40
3.6 Simulation Results ........................................................................................................ 41
3.7 Discussion ..................................................................................................................... 43
Chapter 4 Precoding and PAPR Reduction in AC OFDM OW Systems ........................ 45
4.1 Introduction ................................................................................................................... 45
4.2 Precoding Based Optical OFDM System Model .......................................................... 47
4.3 Precoding Schemes ....................................................................................................... 50 4.3.1 DFT Precoding .......................................................................................................... 51 4.3.2 Zadoff-Chu Sequence Precoding .............................................................................. 51
4.3.3 Discrete Cosine Transform (DCT) Precoding .......................................................... 52
4.4 Simulation Results and Discussion ............................................................................... 53
4.5 Conclusions ................................................................................................................... 58
Chapter 5 Performance of AC OFDM Systems in Multipath Channel ........................... 59
5.1 Introduction ................................................................................................................... 59
5.2 Precoding Based OW OFDM System Model ............................................................... 60
5.3 Multipath Indoor Channel ............................................................................................. 62
5.4 Frequency Domain Equalization (FDE) ....................................................................... 64
5.5 Analytical BER Performance Results ........................................................................... 65
5.6 Electrical and Optical Performance Metrics ................................................................. 67
5.7 Clipping and PAPR Reduction ..................................................................................... 68
5.8 Simulation Results ........................................................................................................ 69
5.8.1 Performance of Precoding Schemes in AWGN ........................................................ 70 5.8.2 Performance of Precoding Schemes in Multipath Indoor Channel .......................... 71
5.8.3 Performance of Precoding Schemes with Clipping .................................................. 75
5.9 Conclusions ................................................................................................................... 78
Chapter 6 Hybrid ACO-OFDM Based IM/DD OW System ............................................. 79
6.1 Introduction ................................................................................................................... 80
6.2 Hybrid ACO-OFDM ..................................................................................................... 81
6.3 PDF of HACO-OFDM .................................................................................................. 85
6.4 PAPR of HACO-OFDM ............................................................................................... 87
6.5 Simulation Results ........................................................................................................ 88 6.5.1 Comparison with Conventional ACO-OFDM and PAM-DMT ............................... 88
6.6 Comparison with ADO-OFDM .................................................................................... 93
6.7 Conclusions ................................................................................................................... 97

vii
Chapter 7 Timing Synchronization for AC OFDM OW Systems .................................... 98
7.1 Introduction ................................................................................................................... 98
7.2 RF Based Timing Synchronization Methods ................................................................ 99 7.2.1 Schmidl’s Method ..................................................................................................... 99
7.2.2 Park’s Method ......................................................................................................... 101 7.2.3 Tian’s Method ......................................................................................................... 102
7.3 New Timing Synchronization Scheme for AC OFDM Systems ................................ 103 7.3.1 Symbol Timing Estimation for ACO-OFDM ......................................................... 103 7.3.2 Symbol Timing Estimation for PAM-DMT ........................................................... 106
7.3.3 Symbol Timing Estimation for DHT Based OFDM ............................................... 107
7.4 Effect of Sampling Phase Offset ................................................................................. 108
7.5 Multipath Channel Model ........................................................................................... 110
7.6 Mean and Variance of New Timing Synchronization Method ................................... 111
7.7 Simulation Results ...................................................................................................... 113
7.8 Conclusions ................................................................................................................. 119
Chapter 8 Conclusions and Future Work ......................................................................... 121
8.1 Future Work ................................................................................................................ 122
References .................................................................................................................................. 124

viii
List of Figures
Figure 1-1. DOW configuration ..................................................................................................... 8
Figure 1-2. Multiple copies of a transmitted pulse arriving at the receiver at different times. ....... 9
Figure 2-1. A simple continuous time OFDM (a) transmitter and (b) receiver ............................ 15
Figure 2-2. Discrete time implementation of OFDM (a) Transmitter and (b) Receiver ............... 18
Figure 2-3. A generalized block diagram of Asymmetric clipped based OFDM systems ........... 24
Figure 3-1. OFDMA uplink communication system .................................................................... 30
Figure 3-2. Interleaved Mapping .................................................................................................. 34
Figure 3-3. Localized Mapping..................................................................................................... 34
Figure 3-4. Total Interference in OFDMA system with Interleaved and Localized mapping. Q =
4, N=512, M = 128 ........................................................................................................................ 42
Figure 3-5. ICI in OFDMA system with Interleaved and Localized mapping. Q = 4, N= 512, M =
128................................................................................................................................................. 42
Figure 3-6. MUI in OFDMA system with Interleaved and Localized mapping. Q = 4, N = 512, M
= 128 ............................................................................................................................................. 43
Figure 4-1. Precoding based optical OFDM system model with clipping. ................................... 47
Figure 4-2. A typical LED non-Linear Voltage-Current V-I Characteristics. The curve shows
non-linear relationship between forward current and forward voltage. ........................................ 49
Figure 4-3. Transfer characteristics of OPTEK, OVSPxBCR4 1-Watt white LED. Typical
operating region is between 2.9 to 4 volts. ................................................................................... 49
Figure 4-4. CCDF curves for PAPR of ACO-OFDM and DFT precoded ACO-OFDM for 4-, 16-
and 64-QAM. ................................................................................................................................ 54
Figure 4-5. CCDF curves for PAPR of ACO-OFDM and DFT precoded ACO-OFDM for 4-, 16-
and 64-QAM. ................................................................................................................................ 55
Figure 4-6. CCDF curves for PAPR of ACO-OFDM and DCT precoded ACO-OFDM for 4-, 16-
and 64-QAM. ................................................................................................................................ 55
Figure 4-7. CCDF curves for PAPR of ACO-OFDM and DCT precoded ACO-OFDM for 4-, 16-
and 64-QAM. ................................................................................................................................ 56
Figure 4-8. CCDF curves for PAPR of ACO-OFDM and ZC precoded ACO-OFDM for 4-, 16-
and 64-QAM. ................................................................................................................................ 56
Figure 4-9. CCDF curves for PAPR of ACO-OFDM and ZC precoded ACO-OFDM for 4-, 16-
and 64-QAM. ................................................................................................................................ 57
Figure 4-10. CCDF curves for PAPR of PAM-DMT and DFT precoded PAM-DMT for 4-, 16-
and 64-QAM. ................................................................................................................................ 57
Figure 4-11. CCDF curves for PAPR of PAM-DMT and DFT precoded PAM-DMT for 4-, 16-
and 64-QAM. ................................................................................................................................ 58

ix
Figure 5-1. A baseband AC based optical OFDM system diagram. ............................................. 61
Figure 5-2. Impulse response for various locations of the source with fixed receiver position. . 63
Figure 5-3. ZF-FDE for precoding based ACO-OFDM and PAM-DMT. ................................... 64
Figure 5-4. BER performance of ACO-OFDM, DCT-, DFT-, and ZC-precoded ACO-OFDM in
AWGN channel ............................................................................................................................. 70
Figure 5-5. BER performance of PAM-DMT and DCT precoded PAM-DMT for 4-, 8-, 16 and
32-PAM in AWGN channel.......................................................................................................... 71
Figure 5-6. Electrical bit energy to noise power ratio required for BER of for ACO-OFDM
in multipath channel with ZF-FDE equalization for (a) (b) ........................................ 72
Figure 5-7. Optical bit energy to noise power ratio required for BER of 410 for ACO-OFDM in
multipath channel with ZF-FDE equalization for (a) 1h t (b) 3h t ............................................ 72
Figure 5-8. Electrical bit energy to noise power ratio required for BER of for PAM-DMT in
multipath channel with ZF-FDE equalization for (a) (b) ............................................ 73
Figure 5-9. Optical bit energy to noise power ratio required for BER of for PAM-DMT in
multipath channel with ZF-FDE equalization for (a) (b) ............................................ 74
Figure 5-10. BER and PAPR performance of ACOFDM with additional clipping in AWGN
channel. (a) BER performance (b) PAPR for 4-QAM. ................................................................. 75
Figure 5-11. BER and PAPR performance of DCT precoded ACOFDM with additional clipping
in AWGN channel. (a) BER performance. (b) PAPR for 4-QAM. .............................................. 76
Figure 5-12. BER and PAPR performance of PAMDMT with additional clipping in AWGN
channel. (a) BER performance. (b) PAPR for 4-PAM. ................................................................ 77
Figure 5-13. BER and PAPR performance of DCT precoded PADMT with additional clipping in
AWGN channel. (a) BER performance. (b) PAPR for 4-PAM. ................................................... 77
Figure 6-1. Block diagram of baseband HACO-OFDM transmitter and receiver. ....................... 81
Figure 6-2. Simulation results showing ACO-OFDM clipping noise only falls on the even
subcarriers when only odd subcarriers are modulated. ................................................................. 82
Figure 6-3. Simulation results showing PAM-DMT clipping noise only falls on the real part of
each modulated subcarrier when only complex part is modulated by real symbols. .................... 83
Figure 6-4. Comparison of theoretical and simulated PDF and CDF of HACO-OFDM (a) PDF
(b) CDF. ........................................................................................................................................ 87
Figure 6-5. BER performance of ACO-OFDM and HACO-OFDM for 4-, 16-, 64- and 256-QAM
system. .......................................................................................................................................... 89
Figure 6-6. BER performance of conventional PAMDMT and HACO-PAMDMT for 4-, 8-, 6-
and 32-PAM system. ..................................................................................................................... 90
Figure 6-7. BER performance of conventional PAM-DMT with half subcarriers and PAM-DMT
block in HACO-OFDM. ............................................................................................................... 91
410
1h t 3h t
410
1h t 3h t
410
1h t 3h t

x
Figure 6-8. CCDF curves for PAPR of ACO-OFDM, PAM-DMT and HACO schemes for (4-
QAM, 4-PAM) and (16-QAM, 16-PAM). .................................................................................... 92
Figure 6-9. PDF comparison of HACO-OFDM and ACO-OFDM systems. ............................... 92
Figure 6-10. Comparison of ( )b opt
oBER
E
N for HACO-OFDM for various proportions of optical
power and for different M-QAM constellations used by ACO-OFDM. ...................................... 94
Figure 6-11. Comparisons of ( )b opt
oBER
E
N versus bit rate/normalized bandwidth for HACO-
OFDM and ADO-OFDM for various proportions of optical power and for different
constellations. The minimum value of ( )b opt
oBER
E
N is shown for each constellation combination.
....................................................................................................................................................... 95
Figure 7-1. Average of Schmidl’s and Park’s timing metrics with modified training symbol
suitable for ACO-OFDM in the absence of AWGN and multipath............................................ 101
Figure 7-2. Average of Tian’s timing metrics in the absence of AWGN and multipath. ........... 103
Figure 7-3. ACO-OFDM bipolar and clipped signal showing negative values of first half are
available in the second half of clipped signal (N=128). ............................................................. 104
Figure 7-4. Average of timing metrics using proposed method in the absence of AWGN and
multipath for ACO-OFDM and PAM-DMT systems. ................................................................ 105
Figure 7-5. PAM-DMT bipolar and clipped signal showing that image of negative values in first
half is available in second half (N=128). .................................................................................... 106
Figure 7-6. ACO-OFDM bipolar and clipped signal showing negative values of first half are
available in the second half of clipped signal (N=128). ............................................................. 108
Figure 7-7. Average of timing metrics using proposed method in the absence of AWGN and
multipath for DHT based OFDM and ACO-OFDM system. ..................................................... 109
Figure 7-8. Average of timing metrics with variable number of subcarriers used in the absence of
AWGN and multipath for ACO-OFDM systems. ...................................................................... 110
Figure 7-9. Accuracy of various timing synchronization methods in AWGN channel with no
multipath. L=N/2 for ACO-OFDM and L=N/2-1 for PAM-DMT is used. ................................ 114
Figure 7-10. Accuracy of various timing synchronization methods in multipath channel. L=N/2
for ACO-OFDM and L=N/2-1 for PAM-DMT is used. ............................................................. 115
Figure 7-11. Accuracy of proposed timing synchronization method using various correlation
lengths for ACO-OFDM in AWGN channel with no multipath................................................. 116
Figure 7-12. Accuracy of proposed timing synchronization method using various correlation
lengths for PAM-DMT in AWGN channel with no multipath. .................................................. 116
Figure 7-13. Accuracy of proposed timing synchronization method using various correlation
lengths for DHT based OFDM in AWGN channel with no multipath. ...................................... 117

xi
Figure 7-14. Variance of various timing synchronization methods in AWGN channel at correct
timing instance. ........................................................................................................................... 118
Figure 7-15. Variance of various timing synchronization methods in multipath channel at correct
timing instance. ........................................................................................................................... 118

xii
List of Tables
Table 5-1. List of parameters to generate Multipath impulse response. ....................................... 70
Table 6-1. List of parameters to generate figure 6-10. ................................................................. 96

xiii
Acknowledgments
I am very grateful to my thesis adviser Prof. Mohsen Kavehrad for his advice and support. I feel
honored to become part of his research group and work under his supervision. His advice has
always served as light of knowledge and has led me do creative work.
I would like to thank Professors Kenneth Jenkins, Urbina Julio and Jian Xu for taking the time to
participate as committee members and providing me valuable feedback on my work.
I would also like to thank all of my colleagues in CICTR who have always provided me critical
feedback on my work that has tremendously helped me in improving my thesis.
Finally, I would like to thank all the staff in electrical engineering department who has been very
helpful during the course of my PhD.

1
Chapter 1
Introduction
Wireless mobile communications over the last decade has become an integral part of our daily
life. Since its inception, a great amount of research work has been done on improving wireless
technology and making it more viable for every day usage. With the advent of high speed
processors, these mobile wireless technologies are able to utilize more efficient communication
techniques that can deliver very high data rates in harsh channel conditions. OFDM is one of
these efficient technologies that is currently being used in many wireless standards like LTE,
DVB, WiMax and WiFi etc. Due to its ability to counter multipath effects and combat inter-
symbol interference [1], OFDM is able to deliver high data rates in multipath fading channels.
1.1 OFDM Based LTE System
OFDM was first introduced in 3rd
generation partnership project 3GPP - LTE systems as a
modulation and multiplexing scheme. The physical layer modulation schemes used in LTE are
single carrier frequency division multiplexing (SC-FDMA) in the uplink and OFDMA in the
downlink. SC-FDMA is a precoded version of OFDMA where the input symbols are first
precoded with discrete Fourier transform (DFT) and the resulting frequency domain vector forms
the input to OFDMA block [2].
In RF wireless mobile communication, transmitted signal from base station (BS) or user terminal
(UT) reaches the receiver through multiple paths due to reflections from surrounding buildings
and other infrastructure. Due to constructive and destructive addition on multiple copies of

2
transmitted signal, the received signal amplitude shows fluctuations. This variation in amplitude
is known as multipath fading. Especially in case of high data rate communication system,
multipath fading can severely degrade performance of the system. Conventional cellular systems
use single carrier modulation schemes which require time domain equalization at the receiver to
combat fading. As the system data rates increase, equalizers become more and more complex.
Thus for very high data rate system, traditional time domain equalizers cannot be deployed in
wireless receivers due to high computational complexity. Especially for LTE systems with very
high data rates, time domain equalization becomes impractical. In OFDM based systems,
equalization is performed in the frequency domain which greatly simplifies channel
compensation process. Although OFDM was first introduced few decades ago but its usage in
wireless devices could not have been possible at that time because of its computational
requirements. With the availability of high performance digital signal processors (DSP), now it
can be easily implemented using fast Fourier transform (FFT) algorithms.
With OFDMA in downlink, data to and from multiple users can be directed on individual
subcarriers. This allows a more efficient use of available radio resources than other multiplexing
schemes.
Although OFDM offers many advantages, but it suffers from a number of problems like high
sensitivity to carrier CFO, sensitivity to sampling clock phase offset and high PAPR. CFO
caused by mismatch of transmitter and receiver carrier frequencies can result in interference
between adjacent subcarriers and therefore degrade system performance. To avoid this problem,
LTE systems uses different data mapping strategies that maps data for each user onto various

3
subcarriers. We will investigate the interference caused by each strategy by varying the CFO and
compare their performance.
1.2 The Problem of Spectrum Scarcity
Tremendous growth in RF wireless applications has made RF spectrum highly cluttered and has
left no room for more RF application [3]. Therefore, in order to meet the growing demand for
high speed wireless broadband access, researchers around the world are challenged to find
another medium of communication that can fill this gap and can complement RF
communications.
One potential candidate for such a medium is optical spectrum. Both visible and invisible parts
of optical spectrum lie in THz range are available as unregulated spectrum bands. Therefore,
either visible or invisible light like Infrared (IR), ultraviolet (UV) etc, can be used for today’s
wireless communications applications. Communications using IR has already been in use for a
while in applications like TV’s remote control and other short range applications. Majority of the
communication applications utilizing part of optical spectrum are either low data or for rate short
distance communication. But recently, due to the availability of high speed solid state visible
light and IR LEDs, more attention is being paid towards developing high speed data
communication application using optical spectrum.
VLC [4] has recently gained a lot of attention as one of the candidates for indoor wireless
communications. VLC offers features like

4
1. Energy efficiency: Dual purpose usage of indoor lights for lightning and
communications can save extra energy required for communications. Therefore, no extra
energy is required for VLC.
2. Data security: Visible light cannot penetrate through walls and other obstacle. Therefore
all the communications happening inside a room or office that utilizes VLC stays within
the room. This ensures security of communications which is not possible with RF
wireless.
3. Zero interference with RF sensitive equipment: Since VLC uses visible light for
communication, therefore, it offers zero interference with RF sensitive equipment. This is
very useful in places like hospitals where RF wireless is not allowed or its usage is
restricted due potential interference with sensitive health monitoring equipment.
4. Beam steering: unlike RF which requires relatively complex and expensive equipment to
steer RF beam, light can be easily directed or steered using inexpensive optics. Besides
steering, light can be easily split into multiple beams using extremely low cost optical
equipment.
Due to these advantages and features offered by VLC, industries around the globe have started
investing in VLC. This has opened new doors of research and started a new era of wireless
communications.

5
1.3 How RF is Different than VLC with IM/DD
In this thesis, we will focus on VLC systems using IM/DD. In IM/DD systems, light intensity
rather than phase is modulated by baseband electrical signal. Intensity of light cannot be negative
which poses a strict requirement of unipolar input modulating signal. This is one of the major
differences between RF wireless and VLC IM/DD wireless system. Therefore, due to unipolar
nature of modulating signal, methods of generating baseband modulating signal especially for
OFDM output signal, PAPR reduction techniques and timing synchronization methods need to
be revisited. New techniques need to be developed which are tailored specifically to unipolar
signals. We cannot simply apply RF wireless techniques to VLC systems.
1.4 Applications of VLC
Reduction in size of cells in mobile wireless communication has resulted in manifold increase in
system capacity, spectral efficiency and throughput. Further reduction in cell size can possibly
result in femto- and pico-cells that can open the doors for VLC integration into the existing
wireless mobile network. Therefore, by adapting VLC to existing standards like 3GPP [5], we
can offload large amount of RF traffic from RF wireless mobile network and use OW to provide
broadband access to users. Only front end of typical VLC systems need to adapt to the wireless
standard and use the same upper protocol layers. This can significantly enhance system capacity
without requiring any more expensive and cluttered RF spectrum. Therefore, our future
implementation of VLC should focus more on following same system architecture as of 3GPP
standard which will enable easy integration of VLC into the existing standards.
Besides possible integration into future wireless mobile networks, VLC can be used in so many
other applications like

6
1. Indoor navigation: VLC can play a vital role in providing indoor navigation where GPS
signals are either weak or unavailable. Large Commercial centers, Parking lots and
warehouses are typical examples where VLC can provide navigation to users.
2. Short range machine to machine communications: Due to low cost of VLC front
ends, VLC systems can be easily integrated into machines for inter-machine
communications. For example VLC systems embedded in cars can easily provide
information to drivers that can help avoid accidents, collisions etc.
3. Museums: Museums can use the already available lightning infrastructure to transit
valuable information about the displayed items. This can help increase security of items
and can provide extra information for automated tours.
4. Hospitals: one of the very important areas of application of VLC is RF restricted areas.
Hospitals usually do not allow RF operation due to RF sensitive health equipment.
Therefore in such places VLC can further enhance communications infrastructure without
interfering with any of the RF equipment.
5. Underwater communications: RF and sound waves may not be the best medium for
underwater communications. VLC on the other hand is considered to provide high speed
wireless connectivity underwater. Although VLC may face many challenges in this area
but it’s another viable option for underwater communications especially under good
propagation conditions.

7
1.5 Challenges in VLC
Although VLC can provide many benefits and advantages, but it also suffers from a lot of
challenges and problems like
1. Uplink: One of the major challenges in VLC is the uplink. Using the same VL band in
both uplink and downlink can result in significant interference. Therefore, some
mechanism must be used to separate the two beams and still be able to communicate
without interference. This can be achieved either using a time division duplexing (TDD)
or wavelength division duplexing (WDD).
2. LED Non linearity: For VLC systems using LED as a front end transmitter, non-
linearity of LED I-V characteristics can pose great problems. This is due to the fact that
non-linearity can cause distortion to input signals with wide dynamic range. This is
especially the case with multicarrier signal. To avoid this distortion, several solution have
been proposed like pre-distortion, linearization and precoding of input symbols to reduce
PAPR.
3. Mobility: one of the fundamental requirements for VLC to be able to complement RF in
indoor environment is mobility. Users of wireless mobile devices are usually allowed to
move within coverage area. Therefore practical VLC systems must be able to provide
uninterrupted link to the mobile users. Since light beam follows a straight path and if
obstructed, mobile users will lose their connections. Therefore, several solutions have
been proposed for this problem. One way to tackle this problem is to use a diffuse optical
wireless (DOW) configuration [6]. In this configuration, the transmitter is designed to

8
have a broad field of view (FOV) and allow multiple reflections from walls and other
objects. Figure 1-1 shows such configuration. In this way, if a an object or other user
blocks one path of transmission from transmitter, reflections from other paths will still be
able to reach the receiver and thus enable uninterrupted communication. One of the major
drawbacks of DOW configuration is multipath dispersion. Due to multipath, multiple
copies of the transmitted signals from multiple paths arrive at the receiver at different
times. The resulting signal at the receiver will be sum of the received copies as shown in
Figure 1-2.
Rx
Ceiling
Tx
Figure 1-1. DOW configuration
The summation will distort the signal and cause performance degradation. One way to
counter this problem is to use an equalizer at the receiver which can efficiently equalize
the multipath effects of channel. At very high data rates, designing such an equalizer
becomes difficult. Dispersion in OW results in signal distortion which reduces system
bandwidth, attainable data rates and increased link losses. In the next section, we will
discuss OFDM OW system that offers solution to this dispersion problem.

9
Figure 1-2. Multiple copies of a transmitted pulse arriving at the receiver at different times.
1.6 OFDM and OFDMA for VLC IM/DD System
Due to real and unipolar nature of output signal in IM/DD VLC systems, we can only use
modulations schemes that output real and positive signal. But as discussed in previous section, in
DOW configuration and at very high data rates, equalization becomes a huge problem. Without
equalization, system performance will severely degrade. Therefore, to effectively counter
multipath effects and dispersion, OFDM has been proposed for VLC. Therefore, as discussed
earlier, OFDM systems for VLC IM/DD have to be redesigned and RF methodologies cannot be
directly applied due to the complex output signal generated by RF based OFDM system.
In order to generate a real output, Hermition symmetry is required for input data. To make output
signal positive, various methods have been proposed that will be discussed later in this thesis.
Various multiple access schemes have been used for RF based systems like TDMA, CDMA etc.
to serve multiple users. For VLC based systems, since OFDM is one viable and efficient
modulation strategy, therefore using OFDMA would be the right choice for multiple access as it
will not require any extra hardware to implement these techniques. Therefore, looking into
OFDMA from VLC perspective is also important.

10
1.7 Objectives and Contributions
The main objective of our research work is to analyze and solve some of the important problems
faced by OFDM based RF and OW systems. More specifically this research work will focus on
CFO sensitivity of RF based OFDM: Effect of CFO on the performance of OFDMA
based systems.
Characteristics of Interference: Analyzing and characterizing interference due to each
mapping strategy i.e. localized and interleaved mapping schemes. Interference
characteristics of each mapping scheme are important in design of systems.
Introduction to OFDM based OW systems: A brief overview of OFDM based OW
wireless systems. Methods of generating various types of OFDM output signals and their
characteristics. More specifically we will focus on power efficient OFDM based OW
systems. Since OW systems are gaining a lot of attention and are proposed to be a good
alternative to RF indoor wireless systems, therefore designing power efficient OFDM
based systems will greatly enhance broadband access to mobile users and will have a
great economic impact on the wireless industry.
Precoding techniques for PAPR reduction in OW systems: In this work, we will
investigate some precoding techniques to reduce the PAPR of the OFDM output and
compare their PAPR performance with non precoded OFDM output signal.
BER performance of precoding based optical OFDM system: We will analyze
performance of precoding based OW OFDM system in AWGN and multipath indoor
channel. This will show us impact of precoding on performance of the OW OFDM
system in different channels conditions.

11
Hybrid asymmetrically clipped optical (HACO) OFDM system: In this thesis, we propose
a new scheme called HACO-OFDM system that uses both even and odd subcarriers for
data transmission and does not require any DC bias. This scheme is not only spectrally
efficient but also offers power efficiency.
Timing synchronization schemes for asymmetrically clipped (AC) optical OFDM: We
will present a novel timing synchronization scheme that is not only suitable for all AC
optical OFDM systems but also outperforms all other previously proposed schemes.
Unlike other schemes that are tailored to a specific AC based OFDM system, our scheme
is generic and does not requires specific output signal format and with minor
modification works for all systems.
1.8 Organization
Our thesis is organized as follows.
Chapter 2 gives an overview of OFDM based LTE and optical wireless systems. More
specifically we will present block diagrams for OFDMA and SC-FDMA systems that are used in
downlink and uplink in LTE. In the second half, we will also presents details of AC optical
OFDM systems including system block diagrams and will show methods to generate output
signal for each technique.
In chapter 3, we will discuss interference characteristics of two prominent mapping schemes for
OFDMA based LTE systems. We will derive an analytical expression for SINR of OFDMA
output signal for each mapping strategy. Based on the analytical results and simulation, we will
plot interference seen by receiver due to each mapping strategy in the presence of CFO.

12
In chapter 4, we will look into two power efficient OFDM based OW systems. We will discuss
the non-linear characteristics of an LED that poses great problem to OFDM output signal due to
its multicarrier nature and high PAPR. We will analyze performance of precoding techniques to
reduce PAPR of optical OFDM signal. The difference between RF and OW OFDM system will
also be discussed.
Chapter 5 gives detailed analysis of BER performance of precoding based optical OFDM
systems in AWGN and multipath channels. More specifically we will analyze BER performance
of AC optical OFDM systems. We will present analytical and simulation results and compare
performance in both environments.
Chapter 6 will present a newly proposed power and spectrally efficient HACO-OFDM system. In
this system, we will transmit data using both even and odd subcarriers and use interference
cancellation at the receiver to recover data on even subcarriers. Unlike other schemes, no DC
bias is required in this system which makes it more power efficient.
In chapter 7, we finally present a novel timing synchronization scheme that works for all AC
optical OFDM systems. Our scheme is not only computationally efficient but also outperforms
all other previously proposed schemes. It gives perfect accuracy at very low SNR which was not
possible with any other technique.
Chapter 8 concludes this thesis with summary of our research and possible future work.

13
1.9 Nomenclature
AC Asymmetrically Clipped
ACO Asymmetrically Clipped Optical
CFO Carrier Frequency Offset
DC Direct Current
DOW Diffuse Optical Wireless
HACO Hybrid asymmetrically clipped Optical
LOS Line of sight
LTE Long Term Evolution
LED Light Emitting Diode
MIMO Multiple Input Multiple Output
OFDM Orthogonal Frequency Division Multiplexing
OFDMA Orthogonal Frequency Division Multiple Access
OW Optical Wireless
PAPR Peak to Average Power
RF Radio frequency
SCFDMA Single carrier Frequency Division Multiple Access

14
Chapter 2
RF and IM/DD Optical Wireless OFDM Systems
Today OFDM has been used in a number of modern RF communication systems because of its
promising performance in harsh channel environments. In wireline guided application e.g.
Digital subscriber line (DSL), in wireless broadcast systems like digital audio and video
broadcasting (DAB and DVB) and in Wireless Local Area Network (WLAN) and in LTE system
etc. In this chapter, we will give a brief introduction to basic OFDM communication system and
OFDMA based multi-user system. Major drawbacks of this communication technology will also
be discussed. In the second half, we will give an overview of OW OFDM systems. Detailed
system diagrams will be presented and method of generating the output signal will be discussed.
2.1 Basic OFDM System
The basic idea behind OFDM is to transmit serial stream of data on N multiple parallel channels
of narrow bandwidth [1]. This is in contrast to the conventional serial data transmission system
where each symbol occupies the entire available bandwidth and is transmitted for ST symbol
period. Thus in OFDM each data symbol is transmitted for longer duration B ST NT where BT is
block period.
By transmitting data in parallel we can alleviate a number of problems that we faced in serial
data transmission systems. In parallel transmission, each stream occupies a small portion of
available bandwidth. Usually the bandwidth is divided into N non overlapping subchannels. To

15
obtain more spectral efficiency the subchannels are allowed to overlap with an orthogonally
constraint so that data modulated on individual channels can be easily recovered at the receiver.
Parallel transmission causes a fade to spread over many symbols that are not adjacent. Thus, a
burst error caused by Rayleigh fading is randomized over several symbols improving the bit
error performance of the system. The main advantage of the OFDM parallel transmission is that
each symbol is transmitted for a longer duration which makes the transmission less sensitive to
delay spread.
Encoder
Serial to parallel
Converter
(SP)
0cos 2 f t
0sin 2 f t
1sin 2 Nf t
1cos 2 Nf t
0a
0b
1Na
1Nb
AdderBit stream
( )s t
i i id a jb Power
Amplifier
(a)
( )r tFilter
0cos 2 f t
0sin 2 f t
1sin 2 Nf t
1cos 2 Nf t
0a
0b
1ˆ
Na
1ˆ
Nb
Detector
&
Parallel to Serial
converterˆ ˆˆi i id a jb
DecoderBit stream
.
.
.
.
( )n t
(b)
Figure 2-1. A simple continuous time OFDM (a) transmitter and (b) receiver

16
2.2 System Operation
A simple continuous time OFDM communication system block diagram is shown in Figure 2-1.
Serial data stream is input to the encoder that produces the complex symbols id according to the
modulation scheme used. The complex data symbol can be represented by
i i id a jb (2-1)
where i ia and b are real values that represent the in-phase and quadrature components
respectively. In conventional serial data transmission system the transmitted signal would be
represented by
( ) cos( ) sin( ) ( )i c i c S
i
D t a t b t g t iT (2-2)
In OFDM the baseband data waveform is represented by
1
2
,
0
( ) ( )k
Nj f t
i k B
i k
s t d e g t iT
(2-3)
where ( )g t is a pulse, usually rectangular in shape given by
1, 0( )
0,
Bt Tg t
elsewhere
(2-4)
Where k Bf k T is the frequency of the thk subcarrier from the set of subcarriers
2, 0,1,...., 1kj f t
e k N
and N data symbols are transmitted in parallel during the thi block.
The subcarrier spacing is chosen as 1 Bf T Hz. This spacing makes the adjacent subcarriers to
overlap while satisfying the orthogonality condition which makes the recovery/demodulation of
each subcarrier easier at the receiver.

17
The frequency domain representation of one block of OFDM data can be obtained using the
Fourier Transform of 0th
block
1
2
0,
0
, 0k
Nj f t
k
k
s t d e g t for i
1
2
0,
0
12 2
0,
0
k
B
Nj f t
k
k
Nj f T
k BBk
S f F s t
F d e g t
ke d sinc f TT
(2-5)
The expression shows that in frequency domain the subcarriers will be tightly packed and
overlapping but will not be interfering at the k Bf k T spacing where one subcarrier will have
peak while all other will be zero. Thus we see that OFDM transmits N data symbols in parallel
using multiple carrier frequencies with narrow bandwidths.
2.3 Discrete Time Implementation of OFDM
To implement an OFDM system in continuous time we need multiple modulators and filters that
increase the equipment complexity. Multiple banks of correlators required at the receiver make it
very difficult to be realized practically. However, a great amount of equipment reduction can be
obtained by implementing OFDM modulation using IFFT. It can be seen mathematically that a
baseband OFDM waveform is in fact IFFT of original waveform followed by a D/A conversion.
Mathematically
1
2
0,
0
k
Nj f t
k
k
s t d e
Sampling it at BmT
tN

18
12
0,
0
12
0,
0
|
k B
B
Nf mT N
k
k
Nkm N
t mT N k
k
s t d e
y m s t d e
(2-6)
where we see that the sequence y m is effectively the IFFT of the data vector ,i kd . When the
sequence y m is passed through a digital-to-analog (D/A) converter we get the same waveform
s t . At the receiver side, reverse operation is performed by first sampling the waveform s t
and then taking FFT of the samples which will give us the complex symbol estimates ,ˆ
i kd which
will be used to generate the serial bit stream that was originally transmitted. Mathematically
1
2
0,
0
1, 0,1,......, 1
Nj km N
k
m
d y m e k NN
(2-7)
Both FFT and IFFT can be implemented using computationally efficient computer algorithms.
Thus, a great amount of simplification is achieved by using these techniques as compared to
performing modulation/demodulation in continuous time using N oscillators.
QAM
Modulator
Bit streami i id a jb Serial To
parallel IFFT
y m
D/A
Converter
Power
Amplifier
Parallel
to Serial
cf
(a)
A/D
Converter
Serial To
parallel FFT
QAM
Demodulator
( )n t
Parallel
to Serial
cf
LPF
ˆid
y m
Bit stream
(b)
Figure 2-2. Discrete time implementation of OFDM (a) Transmitter and (b) Receiver

19
A system block diagram for discrete time implementation is given in Figure 2-2.
2.4 Drawbacks of OFDM
Although OFDM is being used in many RF applications and is being considered as a candidate
for high speed OW systems, it suffers from certain disadvantages [2] described below
High PAPR
Since OFDM is a multicarrier technique, output signal has a very high PAPR which requires a
very wide dynamic range liner power amplifier (PA). Designing linear power amplifiers with
wide dynamic range is very expensive. Therefore, the PAPR of the OFDM output signal has to
be reduced in order to use non-linear PA which is power efficient and inexpensive. High PAPR
is also a problem in OW communication which uses LEDs as a transmitter. This is due to the fact
that LED transfer characteristics are also non-linear. Therefore, some strategies have to be used
to reduce PAPR of the OFDM output signal for both RF and OW systems to design economical
communication systems.
Sensitivity to Carrier Frequency Offset (CFO)
The second major drawback of OFDM is its high sensitivity to CFO. In OFDM, individual
subcarriers are overlapping and orthogonal to each other. A slight difference in the carrier
frequency or sampling rate at the receiver will disturb orthogonally among the subcarriers and
will cause interference to neighboring subcarriers. This will reduce the Signal-to-Noise Ratio
(SNR) and will deteriorate system performance. CFO can occur in mobile receivers moving at
very high speed. High speed causes signal frequency to increase or decrease depending on the

20
direction of motion. If the receiver is moving towards the transmitter the frequency will increase
and if receiver is moving away from the transmitter the frequency will decrease. In either
scenario, CFO will occur as there will be shift in frequency of the received signal due to motion
of the mobile user. CFO has to be countered in an effective way in order to receive the signal
without interference.
CFO can also occur due to shift in the frequency of the local oscillator (LO) at the receiver. This
shift can be determined through training symbols and can be easily fixed. However, CFO
cancellation in case of Doppler is not an easy task. Especially at the base station where signal
from multiple users is received and each user is moving with a different velocity. Estimating the
Doppler shift for every user is very difficult. Therefore, some other strategies have to be
investigated to cancel the CFO at the receiver.
2.5 Orthogonal Frequency Division Multiple Access (OFDMA)
LTE uses OFDMA as a modulation and multiplexing scheme in the downlink. OFDMA is
nothing but multi-user OFDM where different users are assigned different set of subcarriers for
some specified time. A modified version of OFDMA is used in the uplink of LTE known as SC-
FDMA.
SCFDMA is DFT precoded OFDMA where the input symbols are not constellation symbols but
the coefficients of Fourier transform of constellation symbols. Thus, in a sense SCFDMA is a
DFT precoded OFDMA.

21
Commonly used mapping strategies include localized frequency division multiple access
(LFDMA) or interleaved frequency division multiple access (IFDMA). These mapping strategies
map the input symbols from a specific user to the allocated subcarriers. Each user is allocated
specific number and sequence of subcarriers to transmit information for a specific time. Each
mapping strategy has its own interference characteristics in the presence CFO. Therefore, an
important question is which mapping scheme performs better in the presence of CFO.
Performance of each mapping strategy in the presence of CFO is an important parameter in the
system design. We will address this question in the next chapter where we analyze each mapping
scheme for interference.
2.6 OFDM Based OW Systems
OFDM is also being considered as a candidate for indoor OW systems especially in intensity
modulated direct detection (IM/DD) systems and has gained significant attention because of the
multipath nature of indoor OW channel [7-10]. Multipath in an indoor environment causes
overlapping of light signal and results in signal distortion [11-12]. This severely degrades system
performance.
In RF based OFDM systems, output signal is bipolar and complex. This signal cannot be easily
transmitted in an OW system since light intensity cannot be negative and we cannot transmit a
complex signal using a single optical transmitter like LED [13]. Therefore, output OFDM signal
has to be made real and positive to make it suitable for optical transmission. Hermition
symmetric input data to OFDM block generates a real output signal. However, to make signal
positive several OFDM schemes have been proposed for intensity modulation direct detection
(IM/DD) OW systems. Among them, one is called DC-Biased OFDM [14] wherein we use a DC

22
bias to make the output signal positive. Other schemes involve clipping negative part of the
output signal. PAM-DMT [15] is one of these clipping based schemes where we modulate the
complex part of each subcarrier with a real symbol which will result in clipping noise to fall on
the real part of the same subcarrier. Another clipping based scheme known as asymmetrically
clipped optical OFDM (ACO-OFDM) uses only odd subcarriers modulated by complex
constellation symbols [16-17]. This will result in clipping noise to fall only on even subcarriers.
Therefore, in both clipping based strategies, the clipping noise is always orthogonal to the
transmitted symbols which will enable easy recovery of the desired data at the receiver. Another
technique called discrete Hartley transform (DHT) based optical OFDM [18] uses real input
symbols and generates a real bipolar output signal using Hartley transform. The characteristics of
output signal are similar to those in ACO-OFDM.
In our thesis, we will only focus on these three AC based OFDM techniques. A generic block
diagram of AC based OFDM system is shown in Figure 2-3. Only constellation mapping,
mapping and zero insertion, frequency to time transformation (FT), time to frequency (TF)
domain transformation and extract symbols block will perform different operations on the input
data for each scheme. Rest of the transmitter and receiver blocks will remain same.
2.6.1 ACO-OFDM
In this OFDM based system, data is transmitted in the forms of blocks of duration secT . Each
block consists of 4NM complex symbols drawn from a complex 2D constellation mapping
scheme like 4-, 16- or 64-QAM which will modulate only odd subcarriers in the first half of N
subcarriers. N is the total number of subcarriers available and is equal to the size of IFFT. In
ACO-OFDM, FT will perform IFFT operation on input data. The conjugate of these symbols

23
modulates the odd subcarriers of second half of N subcarriers to meet the Hermition symmetry
requirements. Therefore, the input data vector to the IFFT block will look like
* *
0 1 /2 1 /2 1 0[0, ,0, ,0,..., ,0, ,0,...., ]N NX X X X X X . Where k k kX a ib and ka , kb are real and imaginary
parts of the complex symbol respectively. The first (DC) and 2N nd subcarriers are set to zero to
obtain a real output signal. The time domain output signal is generated by taking the IFFT of the
input vector
1 2
0
1kN j nN
n k
k
x X eN
(2-8)
A Cyclic Prefix (CP) is added to this discrete time output signal. nx is bipolar and anti-
symmetric. We clip the negative part of this signal to generate a unipolar signal n cx given by
0
0 0
n n
n cn
x if xx
if x
(2-9)
n cx finally passes through a D/A converter to generate a continuous time domain signal and
ultimately modulates the intensity of the optical transmitter like LED. Clipping noise generated
by clipping negative half of time domain signal falls only on even subcarriers. Therefore, the
transmitted symbols are not affected by clipping noise which enables easy recovery of
transmitted data at the receiver.

24
Constellation
DeMapping
Constellation
DeMapping
S/P
Frequency to
time
Tranformation
(FT)
P/S
Add
Cyclic
Prefix
(CP)
D/A
Converter
Clip
negative
part
Mapping
/ Zero
Insertion
AWGN
w t
P/S
Time to
Frequency
Transformation
(TF)S/P
Remove
CPA/D
Converter
Extract
Useful
Symbols
Output
Bits
Channel h(t)
Constellation
Mapping
Constellation
Mapping
Figure 2-3. A generalized block diagram of Asymmetric clipped based OFDM systems
At the receiver, an optical detector converts the intensity into an electrical signal x t . This signal
gets corrupted by electronic noise generated by the electronic components and the ambient noise
from the surrounding light sources. This noise w t is usually modeled as additive white
Gaussian noise (AWGN). The noise corrupted signal is then passed through an A/D converter to
generate a discrete time signal nx .
n n ncx x w (2-10 )
where nw is discrete time version of AWGN. After removing CP, the TF block performs N-point
FFT operation on the input discrete time samples. The noise corrupted constellation symbols are
extracted from FFT output and de-mapped to generate the output bits.
2.6.2 PAM-DMT
In this OFDM based scheme, 2N
symbols drawn from a real mapping scheme like PAM are used
to modulate the complex part of each subcarrier. However, the DC and N/2nd
subcarrier are not
modulated to fulfill the Hermitian symmetry requirements. Therefore, the data vector forming
the input to FT block will be* * *
0 1 2 /2 1 /2 1 1 0[0, , , ,..., ,0, ,...., , ]N NY Y Y Y Y Y Y Y , where k kY ib and kb is the real

25
valued symbol drawn from a constellation like PAM. In PAM-DMT, FT will perform IFFT
operation on input data. The real part of each subcarrier is not modulated. The time domain real
output signal my is generated by taking IFFT of input vector.
2 2
2
2
2
1 2
0
1 12 2
0 0
12 2
0
*1
2 2
0
1
0
1
1
1
1
2sin 2
N N
N
N
N
kN j mN
m k
k
N kkj m j m
N Nk N k
k k
k kj m j m
N Nk k
k
k kj m j m
N Nk k
k
k
k
y Y eN
Y e Y eN
i b e b eN
i b e b eN
kb m
N N
0,1,2,....., 1m N
(2-11 )
my is an anti-symmetric signal and has the same information in both positive and negative parts.
Mathematically
2
2
1
0
1
0
2sin 2 0,1,2,....., 1
2sin 2
N
N
m N s k
k
k
k
m
ky b N s s N
N N
kb s
N N
y
(2-12 )
We can easily clip the negative part of the signal without losing any information. Therefore, after
adding a CP to the IFFT output, negative half of the signal is clipped. Clipping noise is found to
be falling over only on the real part of each subcarrier [15]. Thus, because of the orthogonality of
clipping noise, transmitted symbols remain uncorrupted by the noise and can be recovered easily
at the receiver.

26
The clipping operation is same as defined in previous section. The clipped output n cy is passed
through D/A converter to generate continuous time signal which finally modulates the intensity
of the optical modulator.
At the receiver side, we perform the reverse operations in a similar fashion to that of ACO-
OFDM to extract the useful data. The only difference being that at the output of TF block which
performs FFT operation, we only extract the imaginary part of the first half subcarriers.
The received signal at a specific subcarrier in the absence of any noise is given by
2 2
2 2
2
1 12 2
0 0
1 12 2
0 0
12 2
0
cos 2 sin 2
N N
N N
N
k kj m j N m
N Nk m N mc c
m m
k kj m j N m
N Nm mc c
m m
k kj m j m
N Nm mc c
m
m mc
Y y e y e
y e y e
y e y e
k ky m i m y
N N
2
2
2
1
0
1
0
1
0
cos 2 sin 2
cos 2 sin 2
cos 2 sin 2
N
N
N
cm
m m m mc c c cm
m m
m
k km m
N N
k ky y m i y y m
N N
k ky m i y m
N N
(2-13 )
(2-13) shows that clipping noise falls on the real part of each subcarrier and it actually gives
absolute value of transmitted time domain signal. This valuable information can be used to
improve overall SNR by few dB with some additional signal processing.
2.6.3 DHT-OFDM
In DHT based optical OFDM, a vector of length 2N of real symbols drawn from a real
constellation like M-PAM forms input to the FT block. In this scheme, FT block will perform

27
inverse fast Hartley transform (IFHT). According to [18], if the input symbols only modulate odd
indexed subcarriers, clipping noise will only fall on even indexed subcarriers. Therefore, the
input vector of length N is transformed to 0 1 /4 1 /4 2 1 2[0, ,0, ,..., ,0, ,...., ,0, ]N N N NX X X X X X X by zero
insertion block. However, we do not need conjugate of the input symbols since IFHT is a real
transform and will generate real signal with real input symbols. Therefore, the length of useful
input symbols is 2N . An N-point IFHT is performed on X to output a real bipolar signal.
1
0
1cos 2 sin 2
N
k
x n X k kn N kn NN
(2-14)
Remaining transmitter front end blocks perform the same operation on this bipolar signal as that
in ACO-OFDM and finally transmit it using an optical transmitter.
At the receiver, reverse operation is performed to recover transmitted bits. After removal of CP,
fast Hartley transform (FHT) is performed by TF block on the received signal which outputs
estimated transmitted symbols. DHT has a self-inverse property which enables us to use the
same software routines as used by transmitter.

28
Chapter 3
Interference Analysis of Interleaved and Localized Mapping
In this chapter, we analyze the effect of CFO of multiple users on the SINR of a single
user in OFDMA based uplink communication receiver. We will compute an explicit SINR
expression for two types of mapping strategies used in uplink OFDMA systems namely IFDMA
and LFDMA. SINR expressions in case of carrier frequency offset correction are also computed.
Using simulations, we have compared the total average interference due to different values of
CFO’s of multiple users for both mapping schemes. Simulation results also show that the
average value of inter-carrier interference (ICI) for localized mapping is higher than interleaved
mapping while the average value of multi-user interference (MUI) is higher for interleaved
mapping. Moreover, the average MUI for localized mapping is minimum at the center of band
and it increases as we move towards band edges. We also observe a flat response for ICI and
MUI for interleaved mapping
3.1 Introduction
As discussed in the previous chapter, one of the main disadvantages of OFDM system is its high
sensitivity to the carrier frequency offset [20]. This is due to the fact that the separation between
each subcarriers’ center frequency is the minimum required to achieve orthogonality. This is
where OFDMA differs from conventional multiplexing schemes. In traditional frequency
multiplexing schemes, each user is assigned a separate band that is not overlapping with other
bands allocated to other users. In contrast, OFDMA allocates each user different subcarriers that

29
have overlapping spectrum except at the center frequency and the separation between the center
frequencies is such that it satisfies minimum distance for orthogonality. Due to CFO, this
minimum separation is disturbed and all the subcarriers’ overlap at the subcarrier center
frequency which causes interference and as a result degrades the SNR. This CFO can occur due
to several reasons. It may be due to the relative motion of the receiver or due to the mismatch of
the local oscillator frequency at the receiver.
Sometimes it is possible to estimate the carrier frequency offset at the receiver and then apply it
to the received signal to compensate for the offset. In this case, the desired users’ interference
will be vanished but as we see in this paper, interference from other users caused by their CFO
still persists. This is another disadvantage of OFDMA system where we have to pay the price for
carrier frequency offsets of other users in uplink communication receiver.
3.2 OFDMA System Model
In an OFDM based transmission system, data is transmitted in the form of blocks. Each block of
data is generated in time domain using the IFFT of the input symbols. This IFFT operation is
equivalent to modulating different subcarriers by the input symbols and sampling them at
discrete instants. Thus in OFDM system in general, all the subcarriers are modulated by the data
symbols from the same user. However in an OFDMA system with Q users, each user is allotted
specific M number of subcarriers for a given time. Thus, in OFDMA, the output signal is
generated by taking N point IFFT of input data symbols where N = QM. A baseband
equivalent system model of OFDMA communication system is shown in Figure 3-1.

30
User Q
S/PSubcarrier
Mapping
IDFT
(N-point)
N>M
P/S
Add
Cyclic
Prefix
(CP)
D/A
Converter
Power
Amplifier
Input Bits
Constellation
Mapping
X k
User Q
S/PSubcarrier
Mapping
IDFT
(N-point)
N>M
P/S
Add
Cyclic
Prefix
(CP)
D/A
Converter
Power
Amplifier
Input Bits
Constellation
Mapping
X k
UE 1
UE 2
User Q
Remove
Cyclic
Prefix
(CP)
A/D
ConverterP/S
Subcarrier
DeMapping
FFT
(N-point) S/P
S/PSubcarrier
Mapping
IFFT
(N-point)P/S
Add
Cyclic
Prefix
(CP)
D/A
Converter
Power
Amplifier
Input Bits
Constellation
Mapping
X k
UE Q
Detector
Output Bits
User i
Base Station
hi(n)
CFO
X k
2 /1ij n Nic n e
N
Figure 3-1. OFDMA uplink communication system
Let the baseband signal (at the output of IFFT block) transmitted by user ‘i’ during first block be
given by
1
2 ( / )
0
1 Ni i j k N n
k
x n X k eN
(3-1)
where iX k are independent and identically distributed complex frequency domain input
symbols from thi user with 2
20,i i
XE X k and E X k , 2 ( / )j k N ne are complex
orthogonal subcarriers. Each subcarrier has a center frequency of k
B
kf k f
T , and
1
B
fT
is
the subcarrier spacing. BT is the block length of useful part of OFDM block and it doesn’t include
CP.
For an uplink OFDMA system, the signal at the input of the receiver is sum of the signals from
all users. Let’s assume that there are total of Q users in the system and they are perfectly

31
synchronized. Therefore the only error in this system is the CFO. After removing the CP, the
discrete time baseband signal for one block of OFDMA signal at the input of DFT is given by
1
( ) ( ) ( ) ( )Q
u u
u
r n y n c n z n
(3-2)
where u u uy n h n x n and * specifies linear convolution. u is the CFO of thu user
normalized by the f , ( )z n is complex zero-mean AWGN with variance2
z and uh n is the
channel impulse response (CIR) for thu user. We will assume that the channel uh n is
stationary (i.e. channel impulse response is time-invariant) over an OFDM block. We will
consider that u is not an integer multiple of f but it only takes values that are a fraction of
f , i.e. 0.5u . This is because an integer value of offset will not make any changes in SINR.
Therefore,
1
1
( ) ( ) ( ) ( )
( ) ( )
Qu u
u
Qu u u
u
r n y n c n z n
h n x n c n z n
(3-3)
where we have considered a causal CIR of length L (maximum propagation delay or delay
spread) such that 0 for and 0uh n n L n . We also assume that length of uh n is always
less than or equal to the CP (length L).
The received signal is then passed through N-point FFT block. At the output of FFT block we
have

32
1
1
1
( ) ( ) ( )
k N
Qu u
N
u
Qu u
u
Qu u u
u
R DFT r n
DFT y n c n z n
Y k C k Z k
H k X k C k Z k
(3-4)
where u u uY k H k X k and [ ]uH k is the frequency response of the channel uh n , [ ]uX k
represents complex frequency domain symbols, uC k is the frequency domain representation of
( )uc n of thu user and denotes circular convolution.
The N-point DFT of the ( )uc n which is of special interest is given by [20]
2 /
12 / 2 /
0
12 /
0
1
1
1
u
u
u
j N n
N
Nj N n j k N n
n
Nj k n N
n
C k DFT eN
e eN
eN
(3-5)
Using the geometric series sum
1
0
1
1
kkm
m
rr
r

33
2 /
2 /
/ / /
11
1
1
sin
sin /
u
u
u u u
u u u
u
j k N N
j k N
j k j k j k
j k N j k N j k N
j kuN
u
eC k
e
e e e
e e e
ke
N k N
(3-6)
With the assumption that uC k is periodic with a period N, the circular convolution can be
written as a linear convolution. Therefore, for a specific user ' 'i , the received signal i
kR can be
written as
1 1
0 0
Qi i i u u
k
u i
QN Ni i u u
s u i p
R Y k C k Y k C k Z k
Y k C k s Y k p C k p Z k
(3-7)
where 1C s C N s due to the periodicity. The value at a specific subcarrier ‘k = s’ is
given by
1 1
0
0QN N
i i i i i u u
b s u i p
R s Y s C Y b C s b Y p C s p Z s
(3-8)
3.3 Subcarrier Mapping
After taking FFT, we perform subcarrier de-mapping to obtain the data for a specific user. There
are different types of subcarrier mapping schemes proposed for OFDMA systems. In our analysis
we will consider two important mapping schemes which are IFDMA shown in Figure 3-2 and
the LFDMA shown in Figure 3-3. From Figure 3-2, we see that in IFDMA, a user is assigned
subcarriers that are uniformly scattered in the given band. All the adjacent subcarriers are
occupied by the different users. However, in LFDMA, as shown in Figure 3-3, a user is assigned

34
a contiguous chunk of subcarriers. There are no subcarriers that belong to other users lying
within that chunk. We will analyze the effect of CFO on OFDMA signal that utilizes both type of
mapping strategies and will derive SINR expressions as a function of CFO for both schemes.
Figure 3-2. Interleaved Mapping
Figure 3-3. Localized Mapping
-2 0 2 4 6 8 10 12 14 16 18 20-0.2
0
0.2
0.4
0.6
0.8
1
Frequency index
User 1
User 2
User 3
User 4
-2 0 2 4 6 8 10 12 14 16 18 20-0.2
0
0.2
0.4
0.6
0.8
1
Frequency
User 1
User 2
User 3
User 4

35
3.4 Interleaved Frequency Division Multiple Access (IFDMA)
First let’s consider the effect of CFO on an OFDMA system with interleaved mapping. In this
mapping strategy, thi user has subcarriers located only at index ( 1),s lQ i where
0,1,2,..., 1l M and 1,2,...,i Q whereas thu user’s subcarriers are located at index
( 1),p Q u where 0,1,2,..., 1M and 1,2,...,u Q . Therefore, subcarrier values for
thi user at thl index can be obtained as
1
0
1
0
( 1) 0 ( 1)
( 1) ( ) ( 1)
Mi i i i i
rr l
Q Mu u
u i
R l Y lQ i C Y rQ i C l r Q
Y Q u C l Q i u Z lQ i
(3-9)
From the above equation, we see that the first term is the original sample value attenuated by
0iC , the second term shows interference contribution of the other subcarriers from the same
user which is called ICI and the third is the interference from other users which is known as
MUI.
Therefore
ˆ
1
0
1
1 0
( 1)
( 1)
( 1)
( 1)
0
( )
AWGN
iR l
i i i
Mi i
rr l
ICI
Q Mu u
uu i
MUI
Z
l Y lQ i
Y rQ i
Y Q u
lQ i
R C
C l r Q
C l Q i u
(3-10)

36
To calculate the SINR, we compute the power of the desired signal and the power of Interference
(ICI + MUI) plus Noise. The SINR is given by
2
2
ˆ iE R l
SINRE ICI MUI Noise
(3-11)
For simplicity of notation assuming ( 1)l lQ i , the power of the desired signal can be
obtained as
22
2
2 22
ˆ 0
[ ] [ ] 0
0 [ ] [ ]
i i i
i i i
i i i
E R l E Y l C
E H l X l C
C E H l E X l
(3-12)
Assuming that the channel H[k] is independent of data symbols X[k], the above expectations can
be calculated as
21
2 2
0
1 12 2
0 0
1 1* 2 ( )
0 0
12
0
Lj m N
m
L Lj m N j n N
m n
L Lj m n N
m n
L
m
h
E H E h m e
E h m e h n e
E h m h n e
E h m
P
(3-13)
Similarly we have
2 2
XE X
Therefore

37
2 2
2ˆ 0i i i
h XE R l C P (3-14)
In the above equations, we have assumed that the channel ( )h n is uncorrelated with ( )h m and
data symbol X[k] is independent of X[s]. The symbols x and hP denote the average power of
X k and total average power of ( )h m respectively.
Interference plus Noise power
Assuming that the information symbols X k transmitted by each user and its channel impulse
response H k are independent of other user’s and the AWGN noise, the total interference plus
noise power will then be equal to the sum of the ICI power, MUI power and the noise power and
is given by
2 2 2 2E ICI MUI Noise E ICI E MUI E Noise (3-15)
These individual powers can be calculated as follows.
Power of ICI
Now using ( 1)r rQ i and ( 1)w wQ i , the power of ICI term can be calculated using
similar steps and is given by

38
2
*
1 12
0 0
1 1
0 0
1 22
0
2
0
.
[ ] [ ]
X
M Mi i i i
r wr l w s
M Mi i i i
r wr l w s
Mi i i
rr l
i i
h
r
E
E ICI E Y r C l r Q Y w C l w Q
Y r C l r Q Y w C l w Q
E H r E X r C l r Q
P C l r Q
1M
r l
(3-16)
Power of MUI
Assuming that users transmit data independently, the power of the MUI will be the sum of the
interference power contribution from each user, where the interference contribution from one
user can be calculated using the same procedure as of ICI and is given by
12 2 2
0
2
1 22
0
[ ( 1)] [ ( 1)]M
u u u
i
u
Mu u
h X
E MUI E H Q u E X Q u
C l Q i u
P C l Q i u
(3-17)
Where u
iMUI denotes the interference contribution from user ‘u’ to user ‘i’.
Noise Power
The power of the AWGN is given by

39
21
2 2
0
*1 1
2 2
0 0
1 1* 2 ( )
0 0
12
0
2
Nj kn N
n
N Nj kn N j kp N
n p
N Nj k n m N
n p
N
n
z
E Z k E z n e
E z n e z p e
E z n z p e
E z n
N
2 2
zE Z k (3-18)
In the above equations we have considered independent and uncorrelated AWGN samples values
( )z n and ( )z m such that
2
* ,
0 ,
z n mE z n z m
n m
Denoting
sin, ,
sin /
u i
u i
u i
l Q i uf l Q i u
N l Q i u N
(3-19)
Therefore the SINR as a function of i and u is given by

40
22
1 12 22 2 2
0 1 0
2 2
1 12 2 2 2 2
0 1 0
0( , )
0, ,0
0, , , 0,
i i
h x
i u QM Mi i u i
h X h X z
r ur l u i
i
i h x
QM Mi u
h X i h X u z
r ur l u i
C PSINR
P C l r Q P C l Q i u N
f P
P f l r Q P f l Q i u N
(3-20)
3.5 Localized Frequency Division Multiple Access (LFDMA)
Now let’s consider the effect of CFO on LFDMA system. In this mapping strategy, in contrast to
IFDMA, thi user has subcarriers located only at index ( 1) ,s l i M where 0,1,2,..., 1l M
and 1,2,...,i Q whereas thu user’s subcarriers are located at index ( 1) ,p u M where
0,1,2,..., 1M and 1,2,...,u Q . Therefore subcarrier values for thi user at thl index can be
obtained as
1
0
1
0
( 1) 0
( 1)
( 1) ( )
( 1)
i i i
Mi i
rr l
Q Mu u
u i
R l Y l i M C
Y r i M C l r
Y u M C l i u M
Z l i M
( 3-21)
We see that the above equation is very similar to what we had for IFDMA, therefore following
the same procedure as used for IFDMA, we can derive the SINR expression for LFDMA which
22
1 12 22 2 2
0 1 0
2 2
1 12 2 2 2 2
0 1 0
( , )0
( )
0, ,0
0, , , 0,
i u
i i
h x
QM Mi i u u
h X h X z
r ur l u i
i
i h x
QM Mi u
h X i h X u z
r ur l u i
SINRC P
P C l r P C l i u M N
f P
P f l r P f l i u M N
(3-22)

41
The only difference between the SINR expression for IFDMA and LFDMA is the index of
sin( )
sin( / )
x
x N term. This term will determine the Interference power contribution from the
subcarriers of the desired and other users.
3.6 Simulation Results
Consider an OFDMA system with Q = 4, N = 512, M =128. Assuming all users have same
average input symbol power and total average channel power equal to unity, i.e.
2
2 1u
u
XE X k and 1u
hP , we calculate the interference power seen by user 1 due
to the CFO of other users for three different cases. In case A, we take
1 2 3 4 0.01, 0.05, 0.02 and 0.04 . In case B, we consider
1 2 3 4 0.07, 0.04, 0.01 and 0.03 and finally we calculate the average
interference by choosing random values of CFO’s of all users ranging between −0.1 to 0.1 and
averaging them over 1000 iterations [22].
Figure 3-4 shows the total interference power seen by user 1 due to the CFO of all users. In this
case, there was no frequency offset correction for user 1. The figure shows that in case A,
interleaved mapping results in more interference than localized mapping. We also see that in the
former mapping strategy, the interference level seen by all subcarriers is almost a constant,
however in the latter mapping scheme, the interference varies across the subcarriers and is
minimum at the center of the allocated band and it increases as we move towards the edge of
the band. In case B, however we see that localized mapping results in more interference than
interleaved mapping. This is due to the fact that ICI in case B for localized mapping is much

42
higher than interleaved mapping. Therefore, the total interference is dominated by the ICI in
localized mapping causing the total interference to be higher than interleaved mapping.
Figure 3-4. Total Interference in OFDMA system with Interleaved and Localized mapping. Q = 4, N=512, M = 128
Figure 3-5. ICI in OFDMA system with Interleaved and Localized mapping. Q = 4, N= 512, M = 128

43
Figure 3-6. MUI in OFDMA system with Interleaved and Localized mapping. Q = 4, N = 512, M = 128
Finally we see that the total average interference power for both localized and interleaved
mapping is almost the same. Another interesting fact is that when we do not have CFOC, the ICI
is higher in localized mapping than in interleaved mapping. Figures 3-5 and 3-6 show ICI and
MUI respectively for the three different cases of CFO’s of other users.
3.7 Discussion
The interference pattern for both ICI and MUI, in Figure 3-5 and Figure 3-6 respectively, for
localized mapping can be explained through Figure 3-3. For ICI, we see that all the subcarriers of
the desired user lying between the edges have adjacent interfering subcarriers on both sides.
However those at the edges, they lack one subcarrier on either side. Since this adjacent subcarrier
contributes most of the interference power, therefore we see a drop in the interference level for t
he subcarriers at the edges. For MUI, on the other hand, we notice an opposite behavior. This is
due to the fact that the subcarriers of the desired user lying at the edges are closest to those of the
other users while those lying in the middle are farthest from the subcarriers of other users.

44
Therefore we see that the interference contribution from the subcarriers of other users is highest
at the edges due to their close proximity and it is lowest at the center. That is why we see a rise
in the MUI level as move towards the band edges and a drop as move away from the edges
towards the center of the desired band.

45
Chapter 4
Precoding and PAPR Reduction in AC OFDM OW Systems
In this chapter, we have analyzed different precoding based PAPR reduction techniques for AC
optical OFDM wireless communication systems. IM/DD is among the popular techniques for
optical wireless communication systems. But due to non-linear characteristics of optical
transmitters in IM/DD systems like LED, high PAPR input signals will suffer from distortion
due to clipping. OFDM systems suffer from high PAPR problem that can limit its performance in
IM/DD systems. Therefore, PAPR reduction techniques have to be employed. This chapter
analyzes precoding based PAPR reduction methods for ACO-OFDM and PAM-DMT. We have
used DFT coding, Zadoff-Chu Transform (ZCT) [24] and Discrete Cosine Transform (DCT) for
ACO-OFDM and only DCT for PAM-DMT since the modulating symbols are real. We have
compared performance of these precoding techniques using different QAM modulation schemes.
Simulation results have shown that both DFT and ZCT offer more PAPR reduction than DCT in
ACO-OFDM. For PAM-DMT, DCT precoding yields significant PAPR reduction compared to
conventional PAM-DMT signal. These precoding schemes also offer the advantage of zero
signaling overhead.
4.1 Introduction
IM/DD is among the popular modulation techniques for VLC. In IM/DD, we modulate the
Intensity of the optical signal by the input data at the transmitter and detect the intensity at the

46
receiver using a photo-detector. However IM/DD systems suffer from certain drawbacks like
reduction in SNR due to background/ambient light.
To reduce multipath dispersion in a DOW system, various techniques have been proposed.
Because of its high spectral efficiency, resistance to multipath and ease of implementation,
OFDM has been considered as promising technique for DOW communication systems. Apart
from the advantages, OFDM suffers from certain drawbacks. High PAPR is among the most
prominent disadvantages. Addition of large number of subcarriers results in high peaks in OFDM
signal which causes high PAPR. For an LED based optical wireless communication systems
using IM/DD, high PAPR can significantly deteriorate the system performance due to the non-
linear characteristic of LED.
High PAPR systems require high dynamic range and wide linear characteristics of transmitting
device to transmit signal without distortion. High dynamic range results in high cost and low
power efficiency of the transmitter. LED’s have a very limited linear region in their I-V curve
and low dynamic range. This limitation necessitates the input signal to have low PAPR. One way
to operate the LED in its linear region with a high PAPR input signal is to limit the signal peaks
that are exceeding the linear region by clipping. This clipping causes in-band and out-of-band
distortion and performance degradation. Therefore, to avoid distortion, PAPR of the input signal
has to be reduced.
Although a large number of PAPR reduction techniques have been proposed for RF based
OFDM systems [25-28] but we only see very limited literature about these techniques for optical

47
OFDM communication system. Therefore, in this chapter we will analyze some precoding based
PAPR reduction techniques for ACO-OFDM and PAM-DMT.
4.2 Precoding Based Optical OFDM System Model
A block diagram of a baseband precoding based AC optical OFDM system is shown in Figure.
4-1.
S/P Precoding
IFFT
(N-point)
P/S
Add
Cyclic
Prefix
(CP)
D/A
Converter
Input Bits
Constellation
Mapping
X k
Conj()
Clip
negative
part
Voltage
to
Current
V-to-I
LED
Bias
Optical Front End
Mapping
/ Zero
Insertion
Figure 4-1. Precoding based optical OFDM system model with clipping.
In precoding based OFDM systems, data is transmitted in blocks where each block represents
one OFDM symbol. In each block, a parallel stream of N input data symbols
0 1 1[ , ,....., ]T
NX X X X , where k k kX a ib and ka is the real part and kb is the imaginary part,
drawn from 2-D constellations like QPSK, 16- and 64- QAM are first precoded with the
precoding scheme giving an output vector pX = PX , where P is N N precoding matrix. The
precoded output symbols which will modulate the individual subcarriers form the input to the
IFFT block. In ACO-OFDM, only odd subcarriers are modulated by the complex input symbols.
Even subcarriers are not modulated and are set to zero. A Mapping/Zero Insertion block
performs input vector formatting prior to IFFT to achieve selective subcarrier modulation.
Therefore, the input data vector to IFFT block becomes
* *
,1 ,3 , 1 , 1 ,1[0, ,0, ....., ,0, ,0,...., ]T
p p p N p N pX X X X X X . A real valued output x n is generated by
performing 4N point IFFT on the conjugate symmetric data frame.

48
In PAM-DMT on the other hand, symbols from a real valued constellation like M-PAM are used
to modulate the complex part of each subcarrier. In precoding based OFDM systems, the real
valued data symbols are first precoded and then modulate complex part of each subcarrier. To
achieve this I-D subcarrier modulation, precoded input data vector is formatted by Mapping/Zero
insertion block which gives an output vector, 1
* *
,1 , 1 ,1[0, ....., ,0, ,...., ]p N
T
p p N pX X X XX , where
k kX iC and kC is the magnitude of the real symbol output from precoding block. A real valued
output x n is generated by performing 2N -point IFFT on the conjugate symmetric input data
frame.
The block of parallel real samples output from CP block is converted into a serial discrete-time
domain signal by a Parallel to Serial (P/S) converter. The signal is asymmetrically clipped by
clipping the negative part to produce an output signal which is strictly positive. The clipped
signal cx n finally modulates the intensity of the optical transmitter. Since CP is a copy of the
last L samples of the OFDM symbol, therefore we will not include this in our simulations since it
will not affect the PAPR analysis.
For an LED based OW transmitter, the clipped input signal has to be dc-biased to operate in the
linear region of the LED Current-Voltage (I-V) curve usually known as transfer characteristics.
A typical LED V-I curve is shown in Figure 4-2 and Figure 4.3. The V-I curve shows the
relationship between the forward voltage and forward current through LED. The bias point has to
be selected carefully in order to keep the signal variations within the linear region. The nonlinear
transfer characteristics also show that if the input signal exceeds the linear region, the output
current will be clipped which will distort the signal and generate out of band emissions. One

49
solution to avoid this problem is to reduce the overall intensity of the optical transmitter by
decreasing the input signal power. This will reduce the SNR at the receiver causing receiver
performance degradation. Other solution is to minimize the maximum value of peaks occurring
in the OFDM signal envelope without reducing the average power. This will decrease the PAPR
of the intensity modulating signal. It can be done by using various PAPR reduction techniques.
Figure 4-2. A typical LED non-Linear Voltage-Current V-I Characteristics. The curve shows non-linear relationship
between forward current and forward voltage.
Figure 4-3. Transfer characteristics of OPTEK, OVSPxBCR4 1-Watt white LED. Typical operating region is
between 2.9 to 4 volts.
0.2 0.3 0.4 0.5 0.6 0.7 0.8-0.02
-0.01
0
0.01
0.02
0.03
Forward Voltage VD
[Volts]
Fo
rwa
rd C
urr
en
t I D
[A
mp
]
Operating Region
2 2.5 3 3.5 4 4.5
0
0.1
0.2
0.3
0.4
0.5
Operating region
Forward Voltage VD [Volts]
Forw
ard
Curr
ent I D
[A
mps]
Operating point

50
PAPR is an important signal parameter that gives an estimate of the envelope variations of the
transmitted signal. These envelope variations are critical in the design of RF/Optical transmitter
front ends. For OFDM, PAPR is computed over one symbol [0, T] and is defined as [25]
2
0 2 1
2
max cn N
c
x nPAPR
E x n
(4-1)
Another important factor that is related to PAPR and also shows the characteristics of signal
envelope is Crest Factor (CF) which is also defined over one OFDM symbol [0, T] and is given
by
0 2 1
2
max cn N
c
x nCF
E x n
(4-2)
We will calculate the PAPR of the clipped signal cx n and compare it for various complex
digital constellations and for various precoding techniques.
4.3 Precoding Schemes
Although various PAPR reduction methods exist in literature but precoding offers certain
advantages over other techniques like it is signal independent, comparatively requires less
computational cost and does not need any signaling overhead. Precoding is a one shot process
wherein the input signal vector is pre-multiplied by a precoding matrix P given by

51
0,0 0,1 0, 1
1,0
1,0 1, 1
. .
. . . .
. . . . .
. . . . .
. . .
N
N N N
a a a
a
P
a a
(4-3)
where ,i ja represents an element of the thi row and thj column of P . This precoding matrix can be
generated in different ways depending on the precoding schemes. We will analyze three schemes
which are discussed below.
4.3.1 DFT Precoding
In this precoding method, a N N precoding matrix is generated that transforms the input data
vector to frequency domain. This matrix simply performs an FFT operation and can be generated
by
, , 0 1, 0 1kn
n k Na W where k N n N (4-4)
where n and k are the row and column index respectively. kn
NW is the thN root of unity. This
transformation generates a new frequency domain symbol vector of size 1N which is obtained
by pre-multiplying the input vector by P, i.e. p X PX .
4.3.2 Zadoff-Chu Sequence Precoding
These sequences are a class of generalized chirp like sequences that have ideal autocorrelation
properties. They also have a property of constant magnitude cross correlation. A Zadoff-Chu
sequence of length N is defined by

52
22
2
12
2
r kj qk
N
kk kr
j qkN
e N evena
e N odd
(4-5)
where 0,1,2,...., 1k N and r is the code index relatively prime to N. q is an integer. A
precoding matrix based on Zadoff-Chu sequences of size N N can be formed by
2
0 1 1
1 2 1
1 1
N
N N N
N N N
a a a
a a aP
a a
(4-6)
4.3.3 Discrete Cosine Transform (DCT) Precoding
DCT has a very good energy compaction property that makes it very attractive for precoding. Its
ability to represent the input signal with very few coefficients will result in an OFDM output
signal that has reduced PAPR. This reduction results from the fact that after DCT precoding, the
input vector to IFFT block has comparatively few high valued elements than the original input.
Although several definitions exists for a DCT but we will use the most popular one which is 1-D
DCT given by
1
0
2 2 1cos
2
N
n n k
k
kd X n
N N
(4-7)
where
10
2
1 1,2,...., 1
n
n
n N
A N N DCT precoding matrix P can be obtained from

53
,
2 2 1cos
2n k n
kP n
N N
(4-8)
where 0 1n N is the row and 0 1k N is the column index. The output of the precoder
is a 1N coded vector pX .
In case of ACO-OFDM, the input can be a complex data vector with real component of each
element denoted by Xreal and imaginary component represented by Ximag. In this case, the
precoded output is given by
p real imagDCT DCT X X X
For PAM-DMT, since the input data symbol vector X contains only real components as they are
drawn from a real mapping scheme like M-PAM, DCT precoding is one of the suitable schemes
which outputs real frequency coefficients. The precoding operation in matrix form can be written
as p X PX . The components of the output vector are purely real which is in contrast to the other
precoding schemes. These real precoded data symbols finally modulate the imaginary parts of
each subcarrier in OFDM. This is accomplished by the Mapping/Zero-Insertion block.
4.4 Simulation Results and Discussion
In this section, we compare the performance of various precoding techniques in reducing the
PAPR for two types of clipping based OW OFDM systems. In case of ACO-OFDM, input data
vector of length N=128 is generated by drawing symbols from QPSK, 16- and 64- QAM and 4N
= 512 point IFFT is used to generate the output OFDM signal. For PAM-DMT, input data
symbol vector of length is N = 128 is formed by drawing symbols from M-PAM where M = 4,
16 and 64 and IFFT size of 2N = 256 is used to generate the output time domain signal [29].

54
PAPR performance is usually shown using Complementary Cumulative Distribution Function
(CCDF) curves. These curves show the probability that PAPR is higher than a specified PAPRo
i.e. Pr (PAPR> PAPRo). These curves are obtained through extensive MATLAB simulations by
generating random input data for the different constellations.
Figure 4-4 and Figure 4-5 Show the CCDF comparison of PAPR for ACO-OFDM and DFT
precoded ACO-OFDM. The curves show that DFT precoding reduces the PAPR of ACO--
OFDM signal by few dB’s.
Figure 4-4. CCDF curves for PAPR of ACO-OFDM and DFT precoded ACO-OFDM for 4-, 16- and 64-QAM.
4 6 8 10 12 14 16 1810
-4
10-3
10-2
10-1
100
PAPRo (dB)
Pr[
PA
PR
> P
AP
Ro]
ACOFDM QAM
ACOFDM 16-QAM
ACOFDM 64-QAM
DFT ACOFDM QAM
DFT ACOFDM 16-QAM
DFT ACOFDM 64-QAM

55
Figure 4-5. CCDF curves for PAPR of ACO-OFDM and DFT precoded ACO-OFDM for 4-, 16- and 64-QAM.
Figure 4-6. and Figure. 4-7 show the CCDF comparison of PAPR for ACO-OFDM and DCT
precoded ACO-OFDM. The curves show that with DCT precoding, we see significant reduction
in the PAPR of ACO-OFDM signal.
Figure 4-6. CCDF curves for PAPR of ACO-OFDM and DCT precoded ACO-OFDM for 4-, 16- and 64-QAM.
4 6 8 10 12 14 16 18
0.1
0.2
0.3
0.4
0.5
0.6
0.7
0.8
0.9
1
PAPRo (dB)
Pr[
PA
PR
> P
AP
Ro]
ACOFDM QAM
ACOFDM 16-QAM
ACOFDM 64-QAM
DFT ACOFDM QAM
DFT ACOFDM 16-QAM
DFT ACOFDM 64-QAM
4 6 8 10 12 14 16 1810
-4
10-3
10-2
10-1
100
PAPRo (dB)
Pr[
PA
PR
> P
AP
Ro]
ACOFDM QAM
ACOFDM 16-QAM
ACOFDM 64-QAM
DCT ACOFDM QAM
DCT ACOFDM 16-QAM
DCT ACOFDM 64-QAM

56
Figure 4-7. CCDF curves for PAPR of ACO-OFDM and DCT precoded ACO-OFDM for 4-, 16- and 64-QAM.
Figure 4-8 and Figure 4-9 show the CCDF comparison of PAPR for ACO-OFDM and ZC
sequence precoded ACO-OFDM. The curves show that ZC sequences reduce the PAPR of the
asymmetrically clipped OFDM signal by approximately 3 dB at clipping level of 410 and thus
prove to be a promising PAPR reduction precoding technique.
Figure 4-8. CCDF curves for PAPR of ACO-OFDM and ZC precoded ACO-OFDM for 4-, 16- and 64-QAM.
4 6 8 10 12 14 16 18
0.1
0.2
0.3
0.4
0.5
0.6
0.7
0.8
0.9
1
PAPRo (dB)
Pr[
PA
PR
> P
AP
Ro]
ACOFDM QAM
ACOFDM 16-QAM
ACOFDM 64-QAM
DCT ACOFDM QAM
DCT ACOFDM 16-QAM
DCT ACOFDM 64-QAM
4 6 8 10 12 14 16 1810
-4
10-3
10-2
10-1
100
PAPRo (dB)
Pr[
PA
PR
> P
AP
Ro]
ACOFDM QAM
ACOFDM 16-QAM
ACOFDM 64-QAM
ZC-ACOFDM QAM
ZC-ACOFDM 16-QAM
ZC-ACOFDM 64-QAM
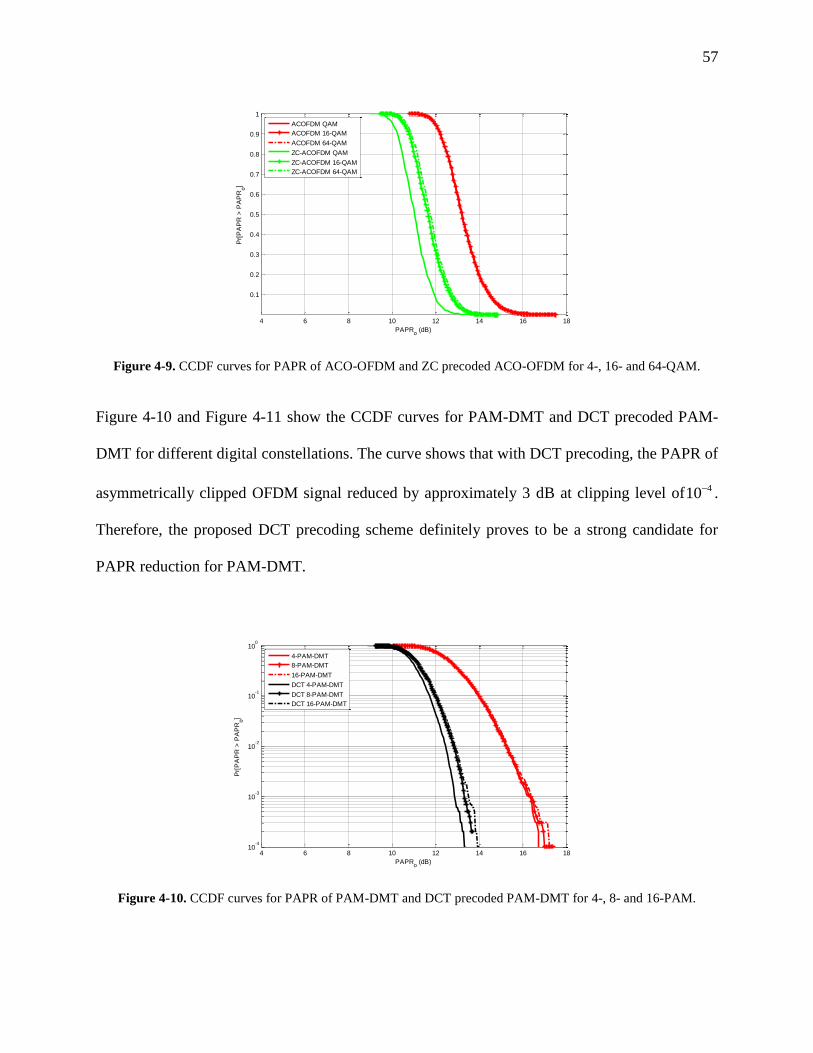
57
Figure 4-9. CCDF curves for PAPR of ACO-OFDM and ZC precoded ACO-OFDM for 4-, 16- and 64-QAM.
Figure 4-10 and Figure 4-11 show the CCDF curves for PAM-DMT and DCT precoded PAM-
DMT for different digital constellations. The curve shows that with DCT precoding, the PAPR of
asymmetrically clipped OFDM signal reduced by approximately 3 dB at clipping level of 410 .
Therefore, the proposed DCT precoding scheme definitely proves to be a strong candidate for
PAPR reduction for PAM-DMT.
Figure 4-10. CCDF curves for PAPR of PAM-DMT and DCT precoded PAM-DMT for 4-, 8- and 16-PAM.
4 6 8 10 12 14 16 18
0.1
0.2
0.3
0.4
0.5
0.6
0.7
0.8
0.9
1
PAPRo (dB)
Pr[
PA
PR
> P
AP
Ro]
ACOFDM QAM
ACOFDM 16-QAM
ACOFDM 64-QAM
ZC-ACOFDM QAM
ZC-ACOFDM 16-QAM
ZC-ACOFDM 64-QAM
4 6 8 10 12 14 16 1810
-4
10-3
10-2
10-1
100
PAPRo (dB)
Pr[
PA
PR
> P
AP
Ro]
4-PAM-DMT
8-PAM-DMT
16-PAM-DMT
DCT 4-PAM-DMT
DCT 8-PAM-DMT
DCT 16-PAM-DMT

58
Figure 4-11. CCDF curves for PAPR of PAM-DMT and DCT precoded PAM-DMT for 4-, 8- and 16-PAM.
4.5 Conclusions
In this chapter we have analyzed various precoding techniques for PAPR reduction in clipped
OW OFDM systems. We have used DFT precoding, Zadoff-Chu Sequence precoding and DCT
precoding techniques for ACO-OFDM and PAM-DMT systems. Both of these systems use
asymmetric clipping to make the intensity modulating signal positive. We have observed that for
ACO-OFDM, Zadoff-Chu precoding gives the maximum PAPR reduction of about 3 dB. In case
of PAM-DMT, DCT precoding reduces the PAPR of intensity modulating signal by about 3 dB
compared to uncoded PAM-DMT. These precoding schemes besides reducing the PAPR also
offer advantages like signal independence, low computational complexity and zero signaling
overhead. All these advantages and benefits make precoding as one of the most desirable PAPR
reduction technique.
4 6 8 10 12 14 16 18
0.1
0.2
0.3
0.4
0.5
0.6
0.7
0.8
0.9
1
PAPRo (dB)
Pr[
PA
PR
> P
AP
Ro]
4-PAM-DMT
8-PAM-DMT
16-PAM-DMT
DCT 4-PAM-DMT
DCT 8-PAM-DMT
DCT 16-PAM-DMT

59
Chapter 5
Performance of AC OFDM Systems in Multipath Channel
In this chapter, we have compared BER performance of precoding based ACO-OFDM and
PAM-DMT OW systems in AWGN and indoor multipath channel. Simulation and analytical
results show that precoding schemes like DFT, DC and ZC sequence does not affect the
performance of the OW systems in AWGN channel while it reduces the PAPR of OFDM output
signal. However, in multipath indoor channel, by using zero forcing frequency domain
equalization (ZF-FDE) precoding based systems give better BER performance than their
conventional counterparts. With additional clipping to further reduce the PAPR, precoding based
systems also show better BER performance compared to non-precoded systems when clipped
relative to the peak of non-precoded systems. Therefore, precoding based ACO-OFDM and
PAM-DMT systems offer better BER performance zero signaling overhead and low PAPR
compared to the conventional systems.
5.1 Introduction
Indoor and office environments comprise majority of broadband access technology deployments
and are considered as greatest potentials for OW systems. However, diffuse indoor
environments pose multipath signal transmission problem which causes signal dispersion due to
addition of multiple copies of signal. For a non-directed optical signal, this dispersion will result
in signal distortion which will severely degrade system performance.

60
In [29], we used various precoding based PAPR reduction schemes and analyzed their PAPR
reducing capabilities for OW systems. We used DFT, DCT and ZC sequences for ACO-OFDM
and DCT for PAM-DMT since the input symbols for PAM-DMT are drawn from a real
constellation. These precoding schemes have shown to reduce the PAPR of the output waveform
by a few dB. Further reduction in PAPR can also be achieved with additional clipping. However,
the impact of these precoding and additional clipping techniques on the BER performance has
yet to be studied for AWGN and indoor multipath channels for OW systems. These precoding
techniques offer zero signaling overhead and reduction in PAPR at the cost of slight increase in
computation.
5.2 Precoding Based OW OFDM System Model
A block diagram of AC optical OFDM system with precoding is shown in Figure 5-1. We will
use a discrete time baseband system model for both ACO-OFDM and PAM-DMT. In ACO-
OFDM, a vector of M input symbols drawn from a complex constellation like M-ary QAM
forms input to precoding block. A precoding matrix P transforms these input symbols to
precoded output Y=PX. These precoded symbols only modulate the odd subcarriers. A discrete
time output signal is generated by IFFT block. This time domain signal is then asymmetrically
clipped to generate a unipolar signal. This unipolar signal propagates through the channel h n
and is detected by an optical detector like a photodiode which converts it to an electrical signal
. The received signal is given by

61
cz t x t h t w t (5-1)
where represents discrete time samples of AWGN and * represents convolution operation.
The received signal is then sampled by A/D converter to obtain a discrete-time signal rx n . The
corresponding discrete version of CIR can be represented by h n . In case of AWGN channel
1 0
0 0
nh n
n
(5-2)
S/P
Precoding
P
IFFT
(N-point)
P/S
Add
Cyclic
Prefix
(CP)
D/A
Converter
Constellation
Mapping
X i
Conj()
Clip
negative
part
Mapping
/ Zero
Insertion
AWGN
w t
P/SDecoding
FFT
(N-point)
S/P
Remove
Cyclic
Prefix
(CP)
A/D
Converter
Constellation
DeMapping
X i Extract
Useful
Symbols
Y = PX
-1P
Output
Bits
Channel h(t)
Figure 5-1. A baseband AC based optical OFDM system diagram.
The precoded symbols are decoded by using inverse of the precoding matrix to obtain estimated
symbols. The estimated symbols are compared with transmitted symbols to get BER
performance of the system.
In PAM-DMT on the other hand, a vector of N input symbols drawn from a real constellation
like M-ary PAM modulates complex part of each subcarrier. Since we need real input symbols
for each subcarrier, therefore, for PAM-DMT we only use DCT precoding which will yield real

62
output coefficients for a real input vector. The precoding matrices can be generated using the
equations given in chapter 4.
5.3 Multipath Indoor Channel
Several techniques have been proposed to numerically generate impulse response of an indoor
multipath channel [30, 31] for OW systems. We will follow the method used in [30] in our
simulations. In LED based OW systems, the radiation intensity pattern of light generated by
LED is modeled as lambertian given by
1
cos2
ns
nR P
(5-3)
where ,2 2
is the angle between the source orientation vector and the receiver , and sP is
power emitted by source i.e. LED, and n is mode number of the radiation lobes which expresses
the source direction. In classical channel impulse response modeling approach, a light beam is
tracked from source to destination. For indoor environments, the light beam can bounce off from
many reflective surfaces and ultimately arrive at the receiver. Besides the reflected beams, the
LOS component will arrive at the receiver with some delay and attenuation and is given by
0
2
1;, , cos cos /
2
nRAnh t rect FOV t R c
R
S R (5-4)
where S and R are source and receiver parameters, the superscript 0 means that this is LOS
component with no reflections, specifies the angle between receiver orientation vector and the
source, RA is the receiver area, R is the distance between the source and the receiver, FOV is the
Field of View of receiver and c is the speed of light ( 83 10 m/s).

63
Some light beams will continue to reflect from other surfaces until their intensity becomes zero.
Therefore in this algorithm, the light beams arriving from source directly i.e. LOS, one, two and
other reflections are summed up to finally obtain the total impulse response.
0
; , ; ,k
k
h t S R h t S R
(5-5)
In our implementation, we placed the source at the ceiling of a room with dimensions
5 5 3m m m pointing downwards and receiver facing upwards at a height of 1m from ground.
The room surfaces are assumed to be diffusive in nature. The receiver FOV is assumed to be 60o
and detector area of 21cm . We will only add the light beams with at most 3 reflections and the
beams arriving directly through LOS. Figure 5-2 shows sample impulse responses generated by
changing the source location at three different places on the ceiling. The first peak shows the
LOS component.
Figure 5-2. Impulse response for various locations of the source with fixed receiver position.
0 0.1 0.2 0.3 0.4 0.5 0.6 0.7 0.8 0.9 1
x 10-7
0
0.2
0.4
0.6
0.8
No
rm. In
ten
sity
h1(t)
0 0.1 0.2 0.3 0.4 0.5 0.6 0.7 0.8 0.9 1
x 10-7
0
0.2
0.4
0.6
0.8
No
rm. In
ten
sity
h2(t)
0 1 2 3 4 5 6
x 10-8
0
0.5
1
Time(sec)
No
rm. In
ten
sity
h3(t)

64
5.4 Frequency Domain Equalization (FDE)
One of the advantages of OFDM based systems is the use of FDE [32, 33]. In this study, we will
assume that we have perfect knowledge of channel and we will use this information to equalize
received signal in frequency domain.
Decoding
FFT
(N-point)Extract
Useful
Symbols-1
P
ZF-FDE
1H k
YX Z
Figure 5-3. ZF-FDE for precoding based ACO-OFDM and PAM-DMT.
We denote H k as the channel transfer function value at subcarrier index k . In a simple linear
equalization scheme in which we try to nullify the channel effect on the information symbol
X k , the equalization coefficient at subcarrier index k turns out to be 1
C k H k
. This is
called Zero Forcing (ZF) equalization. For OFDM based OW system, ZF-FDE at the receiver is
illustrated in Figure 5-3. Because of its simplicity, we will use this ZF-FDE in our simulations to
evaluate the performance of ACO-OFDM and PAM-DMT systems.
In case of ACO-OFDM, symbols from FFT output are simply multiplied by the equalizer
coefficients and useful symbols are extracted. However in PAM-DMT, since symbols are drawn
from real constellation, the FFT output complex symbols should first be multiplied with the
equalizer coefficient and then complex part of the equalized symbols are extracted to obtain
estimated PAM symbol.

65
5.5 Analytical BER Performance Results
In this section we will derive analytical results for BER performance of precoding based OW
system. We will assume that AWGN has variance 2
0n N and the total average power of
channel impulse response is unity i.e.
12
0
1M
K
H K
. We will also consider total average
transmitted electrical power before clipping to be
2
1E x n . From (5-1) and Figure 5-3,
received symbol at the output of FFT at a specific subcarrier index K is given by
cZ k X k H k W k (5-6)
The noise variance at the output of FFT block will not change because of linearity of FFT
operation. Due to asymmetric clipping at transmitter, the power of each transmitted symbol
becomes half. In order to scale the power of each symbol to its original value, we will simply
scale Z k by a factor of 2. This will increase noise variance to2
0ˆ 4n N . After ZF-FDE, we get
1
Y X k W k H k
(5-7)
The noise variance at the output of ZF-FDE becomes 22 2
,ˆ
n FDE n H k . For ACO-OFDM and
PAM-DMT system without precoding, the electrical symbol energy to noise power ratio at the
output of ZF-FDE becomes
,
22
1
ˆ
s elec
o n
E
N H k
(5-8)
We see from the above equation that electrical symbol energy to noise power ratio depends on
subcarrier channel power. In case of M-QAM constellation mapping for ACO-OFDM system,
average Symbol Errol Rate (SER) for a specific subcarrier is given by [37]

66
,1 14 1
s elec
s
o
EP Q
M NM
(5-9)
However, in case of PAM-DMT, we will only extract the complex part of each subcarrier. In
case of M-PAM modulation for PAM-DMT system, the average SER will be given by
,2 11 s elec
s
o
EMP Q
M M N
(5-10)
By using gray coding, BER will become 2logb sP P M . In a precoded system, the equalized
symbols will be multiplied by the inverse of the precoding matrix used at the transmitter.
Therefore the noise variance at the output of decoding matrix will be given by
1
22 2
,
0
1ˆ
M
n decode n
K
H kM
. This is due to the fact that the noise samples remain uncorrelated
due to the unitary property of precoding matrices like DFT, DCT etc [38]. This expression shows
that the noise variance at the output of decoding matrix for each index will be the same.
Therefore, the SER for ACO-OFDM system using M-QAM constellation will become
,
, 122
0
14 1
1ˆ
s elec
s ACO M
n
K
EP Q
MH k
M
(5-11)
Similarly, for PAM-DMT, the SER for M-PAM constellation becomes
,
, 122
0
2 1
1ˆ
s elec
s PAM M
n
K
EMP Q
MH k
M
(5-12)
From the above two equations we observe that in case of AWGN channel,
1, 0,1,2,..., 1H K K M , therefore BER performance for ACO-OFDM will become

67
,
, 2
14 1
ˆ
s elec
s ACO
n
EP Q
M
and for PAM-DMT
,
, 2
2 1
ˆ
s elec
s PAM
n
EMP Q
M
. This shows
that in case of precoding in AWGN channel, system performance does not change and is same as
that of system without precoding.
5.6 Electrical and Optical Performance Metrics
In this chapter, we will also investigate impact of electrical to optical conversion of output
OFDM signal on the BER performance. To make a fair comparison between precoded and non-
precoded system, we will use normalized ,( )b opt
o
E
N where the average output optical power is set
to unity i.e. 1cE x n . We will obtain values of required normalized ,( )b opt
o
E
N for which
BER is 410
represented by
,( )b opt
o BER
E
N. We will plot our results for various values of bit
rate/ normalized bandwidth. The bandwidth is normalized with respect to of on off keying and is
defined as location of first spectral null. Therefore, for ACO-OFDM, the bit rate/normalized
bandwidth is given by 2log / 2 / 1 2 /M N . In ACO-OFDM, only ¼ of the total subcarriers
carry data excluding DC and N/2nd
subcarrier, therefore the factor ½ appears in the above
expression. M represents the M-ary QAM constellation size. For PAM-DMT, the spectral null
appears at the same location 1 2 / N as that of ACO-OFDM. However, since ½ of its total
subcarriers carry data excluding DC and N/2nd
subcarrier, therefore the bit rate /normalized
bandwidth is given by 2log / 1 2 /M N where M is the constellation size of M-ary PAM.

68
5.7 Clipping and PAPR Reduction
PAPR gives a measure of the signal variations relative to the average power. To efficiently
transmit the signal using an LED with non-linear I-V characteristics, we need to have a lower
PAPR.
In order to further improve PAPR of asymmetrically clipped signal, a simple clipping technique
can be used. With clipping we can bias LED at higher values resulting in higher intensity signal
and higher average output power. This will increase received SNR. However, due to clipping,
BER performance will deteriorate and degradation will depend upon the amount of clipping. To
see BER performance variation due to clipping for precoded and non-precoded systems, we will
clip signal relative to the peak of non-precoded ACO-OFDM and PAM-DMT signal respectively
for specific signal constellation.
1020logclip
clip
peak
VV dB
V
(5-13)
For a given dB amount of clipping, the clipping level of the output signal is chosen as
( )
2010clipV db
clip peakV V (5-14)
Where is the voltage level at which the output signal is clipped and is the peak value of
the non-precoded output signal for the same constellation. The clipping operation can be defined
as
c c clip
clip
cclip clip
x n if x n Vx n
V if x n V
(5-15)
clipV peakV

69
The clipped output signal modulates the intensity of optical transmitter. This criterion of clipping
is useful in choosing a specific bias point of an LED transmitter. Due to precoding, PAPR of the
output signal is already reduced and we see fewer peaks. Therefore the effect of clipping on the
BER performance of precoded signal will be less than on that of conventional asymmetrically
clipped signal.
5.8 Simulation Results
In this section, we present BER performance results for various precoding schemes used in
ACO-OFDM and PAM-DMT system. Extensive MATLAB based Monte Carlo simulations were
performed to obtain the results [39]. For ACO-OFDM, an input symbol vector of length N=128
is generated by drawing symbols from 4-, 16- and 64- QAM and 4N-point IFFT is performed to
get time domain output OFDM signal. In case of PAM-DMT, a vector of N = 256 real symbols
drawn from M-PAM is formed where M = 4, 8 and 16 and a 2N-point IFFT is used to generate
the output time domain signal. OFDM output sampling rate of 400Msamp/ssR was chosen for
both ACO-OFDM and PAM-DMT. The symbol rate for ACO-OFDM was 94MHzACOR and
178MHzPAM DMTR for PAM-DMT. The CP length of 32CPN was used and was chosen to be
always greater than the maximum delay spread of the worst possible channel. To compute the
PAPR of the OFDM output signal, an oversampling rate of 4 was used for precise calculation. In
order to simulate the multipath channel, we used a room with a source on the ceiling and receiver
at 1m height from the ground. Details of simulation parameters are listed in Table 5-1.

70
Table 5-1. List of parameters to generate Multipath impulse response.
Room Dimensions 5m*5m*3m
Reflectivity of each surface Ceiling: 0.9; walls: 0.8; floor: 0.3
Receiver location (2.5m, 2.5m, 1m)
Detector area 1cm2
Detector FOV Pi/2
Receiver sensitivity 1
Receiver direction (0, 0, 1)
Source location (H) (0.1m, 0.1m, 3m)
Source location (M) (0.1m, 0.2m, 3m)
Source location (L) (1m, 2m, 3m)
Source half-power angle Pi/3
Source direction (0, 0, -1)
Max number of reflections 3
5.8.1 Performance of Precoding Schemes in AWGN
Figure. 5-4 shows BER performance curves for ACO-OFDM, DCT, DFT and ZC sequence
precoded ACO-OFDM for 4-, 16-, 64-, 256- and 1024-QAM in AWGN channel. From the
figure, we see that BER performance of conventional ACO-OFDM and precoded systems for
respective QAM constellations are almost overlapping each other. Therefore, precoding does not
affect the BER performance in AWGN channel which proves our analytical result.
Figure 5-4. BER performance of ACO-OFDM, DCT-, DFT-, and ZC-precoded ACO-OFDM in AWGN channel
0 5 10 15 20 25 30 35 4010
-4
10-3
10-2
10-1
100
Eb,elec
/No
BE
R
4-QAM
16-QAM
64-QAM
256-QAM
1024-QAM
ACOFDM
DCT precoded ACOFDM
DFT precoded ACOFDM
ZC precoded ACOFDM

71
Figure 5-5 shows BER performance of PAM-DMT and DCT precoded PAM-DMT in AWGN
channel. We observe a similar trend that precoding does not affect system performance.
Figure 5-5. BER performance of PAM-DMT and DCT precoded PAM-DMT for 4-, 8-, 16 and 32-PAM in AWGN
channel.
5.8.2 Performance of Precoding Schemes in Multipath Indoor Channel
In this section, we will present BER performance results for ACO-OFDM and PAM-DMT
systems in multipath indoor channel with ZF-FDE. We will plot variation of for
various values of bit rate/normalized bandwidths. Figure 5-6 (a) shows BER performance of
ACOFDM in multipath channel with severe multipath and long delay spread. We observe
that by using ZF-FDE, precoding improves performance by 3dB than non-precoded system. We
also observe that both DCT and DFT precoding result in same performance. The performance
improvement is due to the fact that with precoding, the SNR for each subcarrier at the output of
0 5 10 15 20 25 30 3510
-4
10-3
10-2
10-1
100
Eb,elec
/No
BE
R
4-PAMDMT
DCT precoded 4-PAMDMT
8-PAMDMT
DCT precoded 8-PAMDMT
16-PAMDMT
DCT precoded 16-PAMDMT
32-PAMDMT
DCT precoded 32-PAMDMT
,( )b opt
o BER
E
N
1h t
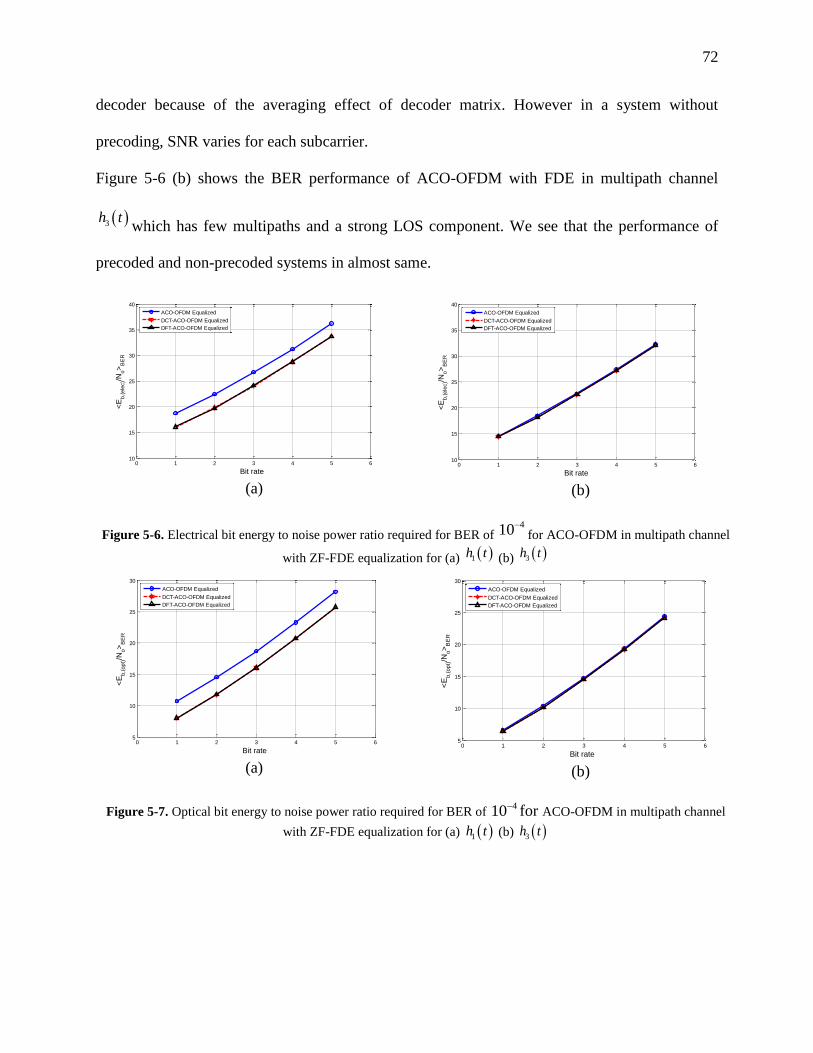
72
decoder because of the averaging effect of decoder matrix. However in a system without
precoding, SNR varies for each subcarrier.
Figure 5-6 (b) shows the BER performance of ACO-OFDM with FDE in multipath channel
which has few multipaths and a strong LOS component. We see that the performance of
precoded and non-precoded systems in almost same.
(a) (b)
Figure 5-6. Electrical bit energy to noise power ratio required for BER of for ACO-OFDM in multipath channel
with ZF-FDE equalization for (a) (b)
(a) (b)
Figure 5-7. Optical bit energy to noise power ratio required for BER of 410 for ACO-OFDM in multipath channel
with ZF-FDE equalization for (a) 1h t (b) 3h t
3h t
410
1h t 3h t
0 1 2 3 4 5 610
15
20
25
30
35
40
Bit rate
<E
b,(
ele
c)/N
o>
BE
R
ACO-OFDM Equalized
DCT-ACO-OFDM Equalized
DFT-ACO-OFDM Equalized
0 1 2 3 4 5 610
15
20
25
30
35
40
Bit rate
<E
b,(
ele
c)/N
o>
BE
R
ACO-OFDM Equalized
DCT-ACO-OFDM Equalized
DFT-ACO-OFDM Equalized
0 1 2 3 4 5 65
10
15
20
25
30
Bit rate
<E
b,(
opt)/N
o>
BE
R
ACO-OFDM Equalized
DCT-ACO-OFDM Equalized
DFT-ACO-OFDM Equalized
0 1 2 3 4 5 65
10
15
20
25
30
Bit rate
<E
b,(
opt)/N
o>
BE
R
ACO-OFDM Equalized
DCT-ACO-OFDM Equalized
DFT-ACO-OFDM Equalized

73
Figure 5-7(a) shows the BER performance of ACO-OFDM in multipath indoor channel
with ZF-FDE when average optical power was set to unity. The results again show that even in
optical domain the precoding based systems perform better than their non-precoded counterparts.
(a) (b)
Figure 5-8. Electrical bit energy to noise power ratio required for BER of for PAM-DMT in multipath
channel with ZF-FDE equalization for (a) (b)
Figure 5-8 (a) shows electrical bit energy to noise power ratio required for BER of 410 for PAM-
DMT in multipath channel 1h t with severe multipath and long delay spread. We observe that in
the presence of ZF-FDE, precoding gives better BER performance than non-precoded system.
We see a consistent 3db performance improvement with precoding.
1h t
410
1h t 3h t
1 2 3 4 5 615
20
25
30
35
Bit rate <
Eb,(
ele
c)/N
o>
BE
R
PAM-DMT Equalized
DCT-PAM-DMT Equalized
1 2 3 4 5 615
20
25
30
35
40
45
50
Bit rate
<E
b,(
ele
c)/N
o>
BE
R
PAM-DMT Equalized
DCT-PAM-DMT Equalized

74
(a) (b)
Figure 5-9. Optical bit energy to noise power ratio required for BER of for PAM-DMT in multipath channel
with ZF-FDE equalization for (a) (b)
Figure 5-8 (b) shows electrical bit energy to noise power ratio required for BER of 410 for
PAM-DMT in multipath channel 3h t with fewer multipath and strong LOS component. We
observe that in this case, both systems show similar performance.
Figure 5-9 (a) shows optical bit energy to noise power ratio required for BER of 410 for PAM-
DMT in multipath channel 1h t with severe multipath and long delay spread. We observe that in
the presence of ZF-FDE, precoding gives better BER performance than non-precoded system.
Again we see a performance difference of 3dB between precoded and non precoded systems.
Figure 5-9 (b) shows optical bit energy to noise power ratio required for BER of 410 for PAM-
DMT in multipath channel 3h t . In this case, both systems show same performance. Therefore,
in case of low multipath, both precoded and conventional ACO-OFDM and PAM-DMT systems
show identical performance.
410
1h t 3h t
1 2 3 4 5 65
10
15
20
25
30
Bit rate
<E
b,(
opt)/N
o>
BE
R
PAM-DMT Equalized
DCT-PAM-DMT Equalized
1 2 3 4 5 65
10
15
20
25
30
35
Bit rate
<E
b,(
opt)/N
o>
BE
R
PAM-DMT Equalized
DCT-PAM-DMT Equalized

75
5.8.3 Performance of Precoding Schemes with Clipping
Figure 5-10 shows BER performance of ACO-OFDM with additional clipping at the front end.
Results show that by clipping the unipolar signal 3dB relative to the peak, we can achieve a
sufficient reduction in PAPR as shown in Figure 5-10 (b) without significantly suffering from
BER performance degradation. However, to further reduce the PAPR, we can clip the output
signal by 6dB with noticeable degradation in BER.
Similarly, we see that by precoding the input symbols with DCT and clipping the output unipolar
signal by 3dB relative to the non-precoded unipolar ACO-OFDM signal peak, we see no BER
performance and PAPR difference compared to simple DCT precoded system. This is due to the
fact that the precoded output signal has less spikes and the average signal peak level is less than
that of conventional ACO-OFDM.
(a) (b)
Figure 5-10. BER and PAPR performance of ACOFDM with additional clipping in AWGN channel. (a) BER
performance (b) PAPR for 4-QAM.
0 5 10 15 20 25 30 35 4010
-4
10-3
10-2
10-1
100
Eb/N
o
BE
R
4-QAM 3db Clip
4-QAM 6db Clip
4-QAM 9db Clip
16-QAM 3db Clip
16-QAM 6db Clip
16-QAM 9db Clip
64-QAM 3db Clip
64-QAM 6db Clip
64-QAM 9db Clip
0 2 4 6 8 10 12 14 16 18 2010
-4
10-3
10-2
10-1
100
PAPRo (dB)
Pr[
PA
PR
> P
AP
Ro]
No Clipping (4-QAM)
3 db Clipping (4-QAM)
6 db Clipping (4-QAM)
9 db Clipping (4-QAM)

76
(a) (b)
Figure 5-11. BER and PAPR performance of DCT precoded ACOFDM with additional clipping in AWGN
channel. (a) BER performance. (b) PAPR for 4-QAM.
However if we clip signal by 6dB, we see BER performance degradation but with decrease in
PAPR of output signal. Figure 5-11 (a) and (b) show simulation results for clipping based DCT
precoded ACO-OFDM system in AWGN channel. We see a similar trend in the BER
performance and PAPR reduction in clipping based DFT and ZC sequence precoded ACO-
OFDM system.
Figure 5-12 (a) shows BER performance of unipolar PAMDMT with clipping at the front end.
Results show that by clipping the signal 3 dB relative to the peak, we can achieve a sufficient
reduction in PAPR as shown in Figure 5-12 (b) without significantly suffering from BER
performance degradation. However, to further reduce the PAPR, we can clip the output signal by
6 dB with noticeable degradation in BER.
Figure 5-13(a) shows the BER performance of DCT precoded PAM-DMT for different clipping
levels relative to the peak of conventional PAM-DMT. We see that the BER performance is not
severely affected when using 3dB clipping compared to that of simple PAM-DMT. This shows
0 5 10 15 20 25 30 35 4010
-4
10-3
10-2
10-1
100
Eb/N
o
BE
R
4-QAM 3db Clip
4-QAM 6db Clip
4-QAM 9db Clip
16-QAM 3db Clip
16-QAM 6db Clip
16-QAM 9db Clip
64-QAM 3db Clip
64-QAM 6db Clip
64-QAM 9db Clip
0 2 4 6 8 10 12 14 16 1810
-4
10-3
10-2
10-1
100
PAPRo (dB)
Pr[
PA
PR
> P
AP
Ro]
No Clipping (4-QAM)
3 db Clipping (4-QAM)
6 db Clipping (4-QAM)
9 db Clipping (4-QAM)

77
that we can bias the optical transmitter at least 3dB higher when using DCT precoding and still
achieve the same BER performance. This will enable us to transmit higher average power and
get better SNR at the receiver. However by clipping more than 3 dB, we see significant
degradation in BER performance. Figure 5-13 (b) shows the PAPR curves for DCT precoded
PAM-DMT scheme. We see that by simply clipping the signal by few dB, we can achieve
sufficient PAPR reduction without severely degrading the BER performance.
(a) (b)
Figure 5-12. BER and PAPR performance of PAM-DMT with additional clipping in AWGN channel. (a) BER
performance. (b) PAPR for 4-PAM.
(a) (b)
Figure 5-13. BER and PAPR performance of DCT precoded PAM-DMT with additional clipping in AWGN
channel. (a) BER performance. (b) PAPR for 4-PAM.
0 2 4 6 8 10 12 14 16 1810
-4
10-3
10-2
10-1
100
PAPRo (dB)
Pr[
PA
PR
> P
AP
Ro]
No Clipping (4-PAM)
3 db Clipping (4-PAM)
6 db Clipping (4-PAM)
9 db Clipping (4-PAM)
0 5 10 15 20 25 30 35 4010
-4
10-3
10-2
10-1
100
Eb/N
o
BE
R
4-PAM 3db Clip
4-PAM 6db Clip
4-PAM 9db Clip
8-PAM 3db Clip
8-PAM 6db Clip
8-PAM 9db Clip
16-PAM 3db Clip
16-PAM 6db Clip
16-PAM 9db Clip

78
5.9 Conclusions
In this work, we have compared the BER and PAPR performance of ACO-OFDM, precoding
based ACO-OFDM, PAM-DMT and precoding based PAM-DMT in AWGN and multipath
indoor channel environments. Simulation results show that in AWGN channel, the BER
performance curves for precoding based ACO-OFDM and PAM-DMT were almost identical to
that conventional ACO-OFDM and PAM-DMT respectively.
We also observed that precoding reduces PAPR of the output unipolar signal and PAPR can be
further reduced with additional clipping at the front end at the cost of some degradation in BER
performance, which depends on the amount of clipping. However, the effect of clipping on BER
was not severe for precoding based scheme as it showed better BER performance than their
conventional counterparts. Therefore, precoding based ACO-OFDM and PAM-DMT offer better
BER and PAPR performance as compared to the conventional schemes when clipped at the same
level relative to the peak of the non-precoded schemes.
In case of multipath channel, we observed that performance of both systems severely degrades in
case of higher delay spread. However, when we have perfect knowledge of CIR, by using ZF-
FDE, the precoding based systems perform 3dB better than their conventional counterparts.
Simulations results show the same trend both in electrical and optical domain. Therefore,
precoding not only improves PAPR but also offers better performance in multipath indoor
channel environments. Therefore, precoding which offers better BER and PAPR performance in
multipath environment can be a promising technique for future OFDM OW systems.

79
Chapter 6
Hybrid ACO-OFDM Based IM/DD OW System
In this chapter, we present our newly proposed HACO-OFDM system. This system uses
combination of ACO-OFDM and PAM-DMT techniques which can be used in IM/DD OW
system. In this hybrid scheme, ACO-OFDM symbols are transmitted using odd subcarriers while
PAM-DMT symbols use even subcarriers. The clipping noise is estimated at the receiver and
cancelled to recover the PAM-DMT symbols on the even subcarriers. This scheme does not
require any DC bias for transmission at the transmitter which makes this system very power
efficient and computationally cost effective. This also reduces the receiver complexity by
eliminating the DC canceller from the receiver. With this system, we can increase the data rate of
ACO-OFDM system by almost twice. In addition, there is no bandwidth penalty incurred as the
unused subcarriers are used for PAM-DMT within the given bandwidth. Extensive computer
simulations show that the BER performance of ACO-OFDM in AWGN environment is not
affected as the clipping noise from PAM-DMT modulated subcarriers falls only on the real part
of the same subcarrier leaving the odd subcarriers undisturbed. The BER performance of PAM-
DMT shows some degradation at low SNR but is identical to conventional scheme at higher
SNR. We also see a slight improvement in PAPR of the output signal. Therefore, advantages like
increased data rate, DC bias elimination, and no bandwidth and PAPR penalty make this scheme
very attractive for OW systems using IM/DD.

80
6.1 Introduction
In ACO-OFDM system, we only use half of the subcarriers which is spectrally very inefficient
strategy. To increase the data rate and improve spectrally efficiency, we propose using a hybrid
scheme which uses combination of both ACO-OFDM and PAM-DMT. In [19], it was shown that
we can regenerate the clipping noise at the receiver caused by clipping ACO-OFDM output
signal. This regenerated noise can be used to cancel the clipping noise on the even subcarriers.
This will enable us to use even subcarriers for data transfer which will improve the spectral
efficiency by twice. We propose using PAM-DMT to modulate the complex part of each even
subcarrier by a real symbol drawn from a real 1D constellation like PAM. Both signals have to
be generated on two different paths and finally added together after clipping their negative parts.
No DC bias addition is required at the transmitter which will make the transmitter very simple.
However, since we will be transmitting a combination of both ACO-OFDM and PAM-DMT
signal, only half of the power will be available to ACO-ODM signal. This will incur 3dB SNR
degradation at the receiver and thus the BER performance deterioration. This combination of
ACO-OFDM and PAM-DMT offers advantages like zero DC bias addition, higher data rates,
reduced system complexity and no increase in PAPR of the output signal. These features will
definitely make this scheme very attractive for future OW systems. In [34-35] a similar
technique has been proposed which uses a DC-bias OFDM on the second path of the transmitter
and a two-dimensional constellation mapping. As shown in [36], DC bias addition is not very
power efficient strategy and makes transmitter more complex. Therefore, in our proposed
schemes we try to reduce transmitter complexity by using one dimensional constellation and
improve the power efficiency by eliminating DC bias.

81
6.2 Hybrid ACO-OFDM
A simple block diagram of baseband HACO-OFDM [44] system is shown in the Figure 6-1. In
this scheme, we generate two separate blocks of asymmetrically clipped OFDM signal of
durationT and then combine them together to transmit as a single block. To generate the first
block, input data bits are mapped using a 2-D mapping scheme like M-QAM to obtain 4NM
input symbols which modulate the odd subcarriers in the OFDM block. The remaining
subcarriers are modulated with zeros. The input vector to the OFDM block takes the form
* *
0 1 /2 1 /2 1 0[0, ,0, ,0,..., ,0, ,0,...., ]ACO N NX X X X X X . The time domain output signal ,ACO mx is
asymmetrically clipped ,ACO m cx which will generate clipping noise/Interference ACOI on the even
subcarriers as shown in Figure 6-2.
S/PIDFT
(N-point)
Add
Cyclic
Prefix
(CP)
D/A
Converter
Constellation
Mapping
X i
Conj()
Mapping
/ Zero
Insertion
S/PIDFT
(N-point)
X i
Conj()
Mapping
/ Zero
Insertion
P/S
P/S
DFT
(N-point)S/P
Remove
Cyclic
Prefix
(CP)
A/D
Converter
IDFT
(N-point)
Clipping&
Noise
estimation
Detect
ACO-
OFDM
symbols
Subtract
noise
DFT
(N-point)
ACO-
OFDM
symbols
PAM-DMT
symbols
PAM
symbols
QAM
symbols
To optical
Modulator
Clip
negative
part
Clip
negative
part
Receiver
Transmitter
From
Photodetector
w tAWGN
Figure 6-1. Block diagram of baseband HACO-OFDM transmitter and receiver.
The second stream of inputs data bits are mapped using a 1-D constellation like M-PAM to
generate 1M PAM symbols which will modulate the complex part of each even subcarrier. The

82
input vector of symbols is represented by* *
0 1 /2 2 /2 2 0[0,0, ,0, ,0,..., ,0,0,0, ,0,...., ,0]PAM N NY Y Y Y Y Y . This
is in contrast to the conventional PAM-DMT scheme where complex part of all subcarriers is
modulated by PAM symbols. The output time domain signal ,PAM myobtained after taking the
IFFT of the input symbols is asymmetrically clipped ,PAM m cy which will create
noise/interference PAMI on the real part of each even subcarrier as shown in Figure 6-3.
Figure 6-2. Simulation results showing ACO-OFDM clipping noise only falls on the even subcarriers when only
odd subcarriers are modulated.
After clipping, it is added to the first block. A CP is added to the resulting combined clipped
signal mz . After passing through D/A converter, it finally modulates the intensity of the optical
transmitter like LED or laser.
0 5 10 15 20 25 30-3
-2
-1
0
1
2
3
Real (X
(K))
unclipped ACO-OFDM
clipped ACO-OFDM
0 5 10 15 20 25 30-3
-2
-1
0
1
2
3
Odd Subcarriers
Imag (
X(K
))
unclipped ACO-OFDM
clipped ACO-OFDM
0 5 10 15 20 25 30-3
-2
-1
0
1
2
3
Real (X
(K))
unclipped ACO-OFDM
clipped ACO-OFDM
0 5 10 15 20 25 30-3
-2
-1
0
1
2
3
Even Subcarriers
Imag (
X(K
))
unclipped ACO-OFDM
clipped ACO-OFDM

83
, ,
, , , ,
m ACO m PAM mc c
ACO m PAM m ACO m PAM m
z x y
x y i i
(6-1)
Where ,ACO mi represents noise added to the bipolar ACOFDM signal to get a clipped version and
,PAM mi represents noise added to the bipolar PAM-DMT signal to generate a clipped signal. Notice
that the clipping interference created on both paths will interfere only with even subcarriers. The
odd subcarriers will remain undisturbed. Therefore, we should expect to have same performance
of ACO-OFDM block in this Hybrid scheme as it is in conventional system. On the hand, due to
addition of clipping interference to the complex part of each even subcarrier, the performance of
PAM-DMT will deteriorate.
Figure 6-3. Simulation results showing PAM-DMT clipping noise only falls on the real part of each modulated
subcarrier when only complex part is modulated by real symbols.
At the receiver, the combined signal is detected by a photo-detector which converts it into an
electrical signal r t . Noise due to electrical components and ambient noise from surrounding
0 5 10 15 20 25 30-3
-2
-1
0
1
2
3
Real (X
(K))
unclipped PAM-DMT
clipped PAM-DMT
0 5 10 15 20 25 30-3
-2
-1
0
1
2
3
Imag (
X(K
))
Odd Subcarriers
unclipped PAM-DMT
clipped PAM-DMT
0 5 10 15 20 25 30-3
-2
-1
0
1
2
3
Real (X
(K))
unclipped PAM-DMT
clipped PAM-DMT
0 5 10 15 20 25 30-3
-2
-1
0
1
2
3
Imag (
X(K
))
Even Subcarriers
unclipped PAM-DMT
clipped PAM-DMT

84
which is modeled here as AWGN gets added to this signal [40]. The noise corrupted signal is
passed through an A/D converter which will give us a discrete time version given by mr
m m mr z w (6-2 )
where mw represents discrete time version of AWGN. We assume a perfect timing and frequency
domain equalization at the receiver. After removing the CP, the signal is fed to FFT block which
performs DFT operation to generate the frequency domain symbols kR, k k kR Z W where k is
the subcarrier index. , , , ,k even k odd k ACO k PAM kZ Z Z I I represents the subcarriers values at index k
and , ,k even k odd kW W W represents frequency domain representation of noise sample on even and
odd subcarriers respectively.
It is observed that the clipping operation causes the power of the M-QAM symbols in the odd
subcarriers to reduce by half. Therefore, to correctly estimate the received symbols, odd
subcarriers are simply multiplied by 2 to scale them properly for recovery and detection. In this
hybrid scheme, our first objective at the receiver is to correctly estimate the ACO-OFDM
symbols transmitted on odd subcarriers. This will help us regenerate an estimate of clipping
noise ,ˆ
ACO kI falling on the even subcarriers. Once we have the estimated clipping noise in the
frequency domain, we will subtract it from the received frequency domain symbols on the even
subcarriers and will extract the complex part to get an estimate of the PAM symbols.
, , , , , ,ˆ ˆ
even k even k ACO k PAM k even k ACO kZ Z I I W I (6-3 )
Estimate of PAM symbol is obtained by following operation
,
, , , ,
ˆ ˆ
ˆ
PAM even k
even k ACO k even k ACO kimag imag imag imag
Y imag Y
Y I W I
(6-4 )

85
Finally these estimated symbols will be used to detect the transmitted bits using a PAM
constellation de-mapper. Remember that the interference generated by clipping PAM-DMT
signal will only fall on real part of even subcarriers. Therefore, the final estimated PAM symbols
will be free from this interference.
6.3 PDF of HACO-OFDM
The Probability Density Function (PDF) of the combined signal can be derived using the
relationship given in (6-1). The output time domain signal from each IFFT block is obtained by
the addition of large number of subcarriers modulated by uniformly distributed random symbols
drawn from M-QAM or M-PAM constellations. Therefore as given in [41], the central limit
theorem can be applied and the real output signal samples of ACO-OFDM and PAM-DMT
follow a Gaussian distribution with zero mean. However after clipping, the PDF of clipped of
output signal samples will become a clipped Gaussian distribution [42] given by
2
22
1 1exp
222ACO
x
aa
af a u a a
(6-5 )
and
2
22
1 1exp
222PAM
bb
y
bf b u b b
(6-6 )
where 2 2
a band are the variances of the unclipped ACO-OFDM and PAMDMT signals given
by 2 2
a ACOE x m
and 2 2
b PAME x m
. From the equation , ,m ACO m PAM mc cz x y and
[42], the PDF of the combined signal can be obtained through the convolution of the two PDF’s.
Therefore, the PDF of unipolar time domain Intensity modulating signal is

86
2
22
2
22
2
22
2
2
0
1 1exp
222
1 0.5exp exp
2 2 2
1 1exp
222
exp2
HACO ACO PAM
aa
aa
z x y
x y
bb
a b b
f z
lu l l
l
f a f b
f l f z l dl
z lu z l z l dl
z ldl
2
2
2
22
0
0
0
2
0.5exp
220.25
a
bb
lz l dl
z ll dl l z l dl
(6-7 )
After some manipulation and using the following identity [42]
2
2
0
exp4
2 exp 2 22
u
x ux dx Q Q
(6-8 )
The above equation can be simplified as
2
2 2
4 2 2
2 2
2 2
exp2
exp 2 22
0.5 1 1exp exp 0.25
2 22
HACO
b
z
a b b b b
a ba b
zz z z z
f z Q Q
z zu z z
(6-9 )
Where we have used
2 2
22 22
a b
ba b
zand

87
(a) (b) Figure 6-4. Comparison of theoretical and simulated PDF and CDF of HACO-OFDM (a) PDF (b) CDF.
Figure 6-4 shows the simulated and theoretical PDF and CDF of HACO-OFDM signal. The
graph shows that the simulated and theoretical values are almost overlapping each other. Figure
6-5 also shows that the system is transmitting low optical power most of the time. This makes
this technique a very power efficient scheme.
6.4 PAPR of HACO-OFDM
OFDM is a multicarrier signal with inherently high PAPR due to addition of large number of
subcarriers. PAPR is the ratio of the peak signal power to the average signal power. For OFDM
based systems, PAPR is computed per block. PAPR performance of a system is usually
presented in terms of CCDF.
For a given system, a plot of CCDF of PAPR on Y-axis and the threshold on x-axis will be
obtained. The graph corresponding to systems which shows low CCDF value for a given
threshold shows better performance.
-1 0 1 2 3 4 5 6 7 8 9 100
0.1
0.2
0.3
0.4
0.5
0.6
Z
f Z(t
)(z)
simulation
theory
-1 0 1 2 3 4 5 6 7 8 9 100
0.2
0.4
0.6
0.8
1
Z
Pro
b[Z
< z
]
simulation
theory

88
6.5 Simulation Results
In this section, we present simulation results which show performance of the proposed HACO-
OFDM scheme and a comparison with conventional ACO-OFDM and PAM-DMT schemes [44].
In order to compute the performance of the proposed system in AWGN channel, we performed
extensive computer simulations and found the Bit Error Rate (BER) of individual blocks and
overall system. CCDF curves to evaluate PAPR performance of the combined signal were also
computed and comparison was developed. In computing PAPR of the output signal, we used an
oversampling rate of 4 to get accurate results. We used an IFFT size of 512N with 128M . For
the ACO-OFDM, we generated 128 symbols from M-QAM constellations like 4-, 16-, 64- and
256-QAM which formed input to the first IFFT block. Another 127 real symbols were generated
from M-PAM constellations which formed input to IFFT block in the second branch of the
hybrid systems. Difference between the transmitted and received bits was calculated and BER
curves were obtained for a given
( )b elec
o
E
N .
6.5.1 Comparison with Conventional ACO-OFDM and PAM-DMT
To compare performance of ACO-OFDM and PAMDMT blocks in hybrid schemes with their
conventional counterparts, we compute BER in terms of electrical bit energy to noise power ratio
( )b elec
o
E
N . Figure 6-5 shows BER performance of ACO-OFDM branch for various types of M-
QAM constellation like 4-, 16-, 64- and 256-QAM. From the figure, we notice that performance
of ACO-OFDM block is degraded by almost 3dB compared to the conventional systems. This is
due to the fact that in our proposed hybrid system, only half of the power is allocated to ACO-
OFDM symbols that modulate the odd subcarriers. The remaining half of the power is used by
PAMDMT symbols. Therefore, we expect a 3dB BER performance loss due to reduction in

89
available average transmitted power. However, we also notice that no performance degradation
is caused by any kind of clipping noise either due to clipping of signal in the first data branch or
second. This proves that ACO-OFDM symbols modulating odd subcarriers remain undisturbed
by any kind of clipping noise. Therefore, in reality, performance of ACO branch in hybrid
system remains same but due to reduced average transmitted power we see 3 dB degradation.
Hence, we can easily transmit symbols from a 2-D constellation on odd subcarriers without
suffering from any kind of clipping noise interference.
Figure 6-5. BER performance of ACO-OFDM and HACO-OFDM for 4-, 16-, 64- and 256-QAM system.
Figure 6-6 shows the BER performance of PAM-DMT block which is using even subcarriers for
data transmission. Performance curves were obtained with AWGN channel and for various types
of M-PAM constellation like 4-, 8-, 16- and 32-PAM. From the figure, we observe that BER
performance degrades by few dB at lower b oE N but it becomes identical to the conventional
PAM-DMT scheme at higher b oE N . The performance deterioration at lower b oE N is due to the
estimation noise incurred during ACO-OFDM symbol detection. However at higher b oE N , the
estimation noise is significantly reduced and thus we get an identical performance. We also
0 5 10 15 20 25 30 35 4010
-4
10-3
10-2
10-1
100
Eb/N
o
BE
R
ACO 4-QAM
ACO 16-QAM
ACO 64-QAM
ACO 256-QAM
HACO 4-QAM
HACO 16-QAM
HACO 64-QAM
HACO 256-QAM

90
observe that transmit power is halved for PAM-DMT symbols in this scheme but we do not see a
3dB performance penalty. This is due to the difference in the number of subcarriers modulated
by PAM symbols. In conventional PAM-DMT, imaginary part of all subcarriers except the DC
and N/2nd
are modulated but in our case, only imaginary part of even subcarriers is modulated.
This reduces the data rate by twice. Therefore, we have twice the power to transmit all even
subcarriers as compared to conventional scheme. On the other hand, the overall system power is
divided equally in HACO system between ACO-OFDM and PAM-DMT which will reduce the
transmit power for even subcarriers back to original value. Thus, we don’t see any BER
performance deterioration for PAM-DMT due to reduced total average transmit power.
Figure 6-6. BER performance of conventional PAMDMT and HACO-PAMDMT for 4-, 8-, 6- and 32-PAM system.
However, if we only modulate half of available subcarriers in conventional PAMDMT system
and compare its BER performance with PAM-DMT block in HACO-OFDM system, we will
definitely see a 3dB performance degradation using same data rate. This can be seen in Figure 6-
7, where we have plotted BER of conventional PAM-DMT system with only half subcarriers
0 5 10 15 20 25 30 3510
-4
10-3
10-2
10-1
100
Eb/N
o
BE
R
4-PAM-DMT
8-PAM-DMT
16-PAM-DMT
32-PAMDMT
4-PAM-DMT HACO
8-PAM-DMT HACO
16-PAM-DMT HACO
32-PAM-DMT HACO

91
modulated and BER of PAM-DMT block in HACO-OFDM system. We clearly see a 3 dB
difference in performance.
Figure 6-7. BER performance of conventional PAM-DMT with half subcarriers and PAM-DMT block in HACO-
OFDM.
Figure 6-8 shows the CCDF curves for PAPR of ACO-OFDM, PAM-DMT and the HACO-
OFDM scheme. From the figure, it is clear that addition of two individual schemes does not
cause a PAPR penalty. In fact, CCDF curves show that PAPR performance of the hybrid scheme
is slightly better than either of two subsystems. This reduction in PAPR can be attributed to the
fact that total average power of HACO system slightly increases due to addition of ACO-OFDM
and PAM-DMT signals. This can be seen in Figure 6-9, where we see probability of the HACO
signal having value equal to zero is 0.25 compared to 0.5 of its constituent subsystems. Also, we
observe there is a slight increase in the probability of HACO signal for lower values which
indicates increase in the average optical power of transmitted signal. This increase in average
power results in some PAPR improvement seen in Figure 6-8.
0 5 10 15 20 25 30 3510
-4
10-3
10-2
10-1
100
Eb(elec)
/No
BE
R
4-PAMDMT HACO
8-PAMDMT HACO
16-PAMDMT HACO
32-PAMDMT HACO
4-PAMDMT M=(N/4)
8-PAMDMT M=(N/4)
16-PAMDMT M=(N/4)
32-PAMDMT M=(N/4)

92
Figure 6-8. CCDF curves for PAPR of ACO-OFDM, PAM-DMT and HACO schemes for (4-QAM, 4-PAM) and
(16-QAM, 16-PAM).
Therefore, these results show that our hybrid scheme can increase data rate of conventional
ACO-OFDM system by almost twice without any loss of PAPR performance. The only penalty
to be paid is additional processing required at the receiver.
Figure 6-9. PDF comparison of HACO-OFDM and ACO-OFDM systems.
6 8 10 12 14 16 18 2010
-4
10-3
10-2
10-1
100
PAPRo (dB)
Pr[
PA
PR
> P
AP
Ro]
ACO-OFDM 4-QAM
4-PAM-DMT
4-HACO
ACO-OFDM 16-QAM
16-PAM-DMT
16-HACO
-1 0 1 2 3 4 5 6 7
0.1
0.2
0.3
0.4
0.5
0.6
Z
f Z(t
)(z)
HACO simulation
ACO-OFDM simulation
-1 0 1 2 3 4 5 6 70
0.1
0.2
0.3
0.4
0.5
0.6
Z
f Z(t
)(z)
HACO theory
ACO-OFDM theory

93
6.6 Comparison with ADO-OFDM
In order to make a fair comparison between performances of our hybrid scheme with ADO-
OFDM [34], we will compute BER performance in terms of normalized optical bit energy to
noise power( )b opt
o
E
N , where total average optical power is set to unity i.e. { } 1mE z . BER
performance of HACO system will vary depending upon the proportion of total optical power
allocated to ACO-OFDM and PAMDMT blocks. Therefore, we will first determine optimum
power allocation based on the lowest required( )b opt
oBER
E
N , which is defined as the value of
normalized( )b opt
o
E
N required for achieving 3BER 10 .
Both ACO-OFDM and PAM-DMT branches in HACO systems can use variable data rates,
therefore, we will develop performance comparison in terms of average bit rate to normalized
bandwidth. We will generate a graph which shows variations of ( )b opt
oBER
E
N with bit
rate/normalized bandwidth. Following [33], we will define system bandwidth as the position of
the first spectral null. In our analysis, we will also use normalized bandwidth which is defined as
system bandwidth normalized relative to on-off keying of the same data rate. Both ACO-OFDM
and PAM-DMT systems are OFDM based systems which have their first spectral nulls at
normalized frequency of 21
N
where N is size of IFFT/FFT used. Since both ACO-OFDM
and PAM-DMT blocks can use a different data rate, therefore we will use an average bit rate
given by 2 2log log / 2ACO PAMM M where ACOM and PAMM are the constellation sizes of M-
QAM and M-PAM mapping schemes. For ACO-OFDM system using 16-QAM and PAMDMT

94
using 16-PAM, the average bit rate per normalized bandwidth is given by
2 22log log / 2 / 1ACO PAMM M
N
.
Figure 6-10. Comparison of
( )b opt
oBER
E
Nfor HACO-OFDM for various proportions of optical power and for
different M-QAM constellations used by ACO-OFDM.
Figure 6-10 shows variation of
( )b opt
oBER
E
Nwhen optical power allocated to ACO-OFDM block
is varied from 0.1 to 0.9. In this case we have chosen a fixed 4-PAM constellation mapping for
PAM-DMT while using 4-, 16-, 64- and 256-QAM constellation for ACO-OFDM. The graph
shows that when ACO-OFDM is using 4-QAM with 4-PAM constellation used by PAM-DMT,
minimum values of
( )b opt
oBER
E
Ncan be achieved when proportion of optical power allocated to
ACO-OFDM is 0.4. Comparing with ADO-OFDM, we see that when same average bit
rate/normalized bandwidth is used, we need almost 5 dB more power than required by our
HACO scheme.
0.1 0.2 0.3 0.4 0.5 0.6 0.7 0.8 0.95
10
15
20
25
30
35
40
Proportion of Optical power on ACO-OFDM subcarriers
<E
b/N
o>
BE
R (
dB
)
ACO 4-QAM, PAMDMT 4-PAM
ACO 16-QAM, PAMDMT 4-PAM
ACO 64-QAM, PAMDMT 4-PAM
ACO 256-QAM, PAMDMT 4-PAM

95
Figure 6-11. Comparisons of
( )b opt
oBER
E
Nversus bit rate/normalized bandwidth for HACO-OFDM and ADO-
OFDM for various proportions of optical power and for different constellations. The minimum value of
( )b opt
oBER
E
Nis shown for each constellation combination.
Figure 6-11 shows ( )b opt
oBER
E
N versus average bit rate/normalized bandwidth for ADO-OFDM
and HACO-OFDM systems. The plots are obtained for lowest values of
( )b opt
oBER
E
Nfor a given
set of mapping schemes and distribution of optical power on both subsystems of HACO-OFDM
and ADO-OFDM. In each case, average optical power was set to unity with varying proportion
of optical power on ACO-OFDM and PAMDMT. From the plots we see that for average bit rate/
normalized bandwidth of 2, 3, 4 and 6 HACO-OFDM performs much better than ADO-OFDM.
However, for average bit rate/normalized bandwidth of 5, performance difference is not
significant.
1 2 3 4 5 6 7 85
10
15
20
25
30
Bit rate/Normalized bandwidth
<E
b/N
o>
BE
R (
dB
)
A B
C
D
E
ADO-OFDM
HACO-OFDM

96
Maximum performance difference occurs for average bit rate/normalized bandwidth of 2 where
HACO-OFDM requires 5dB less optical power to achieve 3BER 10 than ADO-OFDM.
The parameters used for obtaining
( )b opt
oBER
E
Nfor average bit rate/ normalized bandwidth
ranging from 2 to 6 for ADO-OFDM and HACO-OFDM are given in Table 6-1.
From the above two figures, we see that HACO-OFDM performs much better than ADO-OFDM
for a range of bit rate/ normalized bandwidth values. HACO-OFDM also does not require any
DC-bias at the transmitter as required by ADO-OFDM. This makes HACO-OFDM transmitter
much simpler than ADO-OFDM.
Table 6-1. List of parameters to generate Figure 6-10.
Bit Rate/Norm BW Parameters
2
ACO 4-QAM, DCO 4-QAM Bias = 5.5, ACO power = 0.2 (ADO)
ACO 4-QAM, PAM 4-PAM, ACO power = 0.4 (HACO)
3
ACO 16-QAM, DCO 4-QAM Bias = 5.1, ACO power = 0.4 (ADO)
ACO 16-QAM, PAM 4-PAM, ACO power = 0.6 (HACO)
4
ACO 64-QAM, DCO 4-QAM Bias = 4.3, ACO power = 0.6 (ADO)
ACO 64-QAM, PAM 4-PAM, ACO power = 0.8 (HACO)
5
ACO 256-QAM, DCO 4-QAM Bias = 3.9, ACO power = 0.7 (ADO)
ACO 64-QAM, PAM 16-PAM, ACO power = 0.4 (HACO)
6
ACO 256-QAM, DCO 16-QAM Bias = 6.46, ACO power = 0.5 (ADO)
ACO 256-QAM, PAM 16-PAM, ACO power = 0.6 (HACO)

97
6.7 Conclusions
In this chapter, we presented a hybrid asymmetrically clipped optical OFDM scheme that uses
combination of both ACO-OFDM and PAM-DMT techniques. Our system increases data rate of
conventional ACO-OFDM system by twice without any penalty in the BER performance of the
conventional scheme. The 3B penalty observed for ACO-OFDM block was due to only half the
available transmit power compared with conventional system. No other factor deteriorates ACO-
OFDM performance. Our system does not require any DC bias at the transmitter which makes it
power efficient and computationally less expensive. Zero DC bias at the transmitter also
eliminates the use of DC canceller at the receiver. On the other hand, noise cancellation at the
receiver does require extra processing which makes receiver more complex. Our computer
simulations also show that PAPR of hybrid signal is slightly less than individual constituent
systems comprising the hybrid scheme. This makes our scheme ever more power efficient
compared to other techniques. No additional bandwidth is required as the unused subcarriers are
used for PAM-DMT modulation which was previously left unused. Therefore, our proposed
system provides a very power efficient hybrid OFDM modulation technique that does not require
any DC-bias and it can be used in IM/DD optical wireless systems.

98
Chapter 7
Timing Synchronization for AC OFDM OW Systems
In this chapter, we present a robust timing synchronization scheme suitable for AC optical
OFDM based IM/DD wireless systems. Our proposed methods works perfectly for ACO-OFDM,
PAM-DMT and DHT based optical OFDM system. Currently available timing synchronization
methods for OFDM are either not suitable for asymmetric clipped OFDM techniques due to
unipolar nature of output signal or they perform poorly. Our proposed method is not only
suitable for AC OFDM schemes but also outperforms all other techniques. Simulations results
also show that our proposed method achieves perfect accuracy even at lower SNR. Besides
accuracy, our technique is also computationally efficient as it requires very few computations as
compared to legacy methods to achieve good accuracy.
7.1 Introduction
Due to high sensitivity of OFDM to carrier frequency offset and timing synchronization errors,
efficient timing synchronization and carrier frequency offset correction techniques need to be
used at the receiver for RF based systems. For IM/DD based OFDM systems, timing
synchronization errors can cause performance degradation and therefore requires an efficient
timing synchronization scheme that has high accuracy and is computationally efficient. It should
also be a generic scheme not tailored for a specific technique.

99
A large amount of material has been published on timing synchronization schemes for RF based
OFDM systems [45-50]. These techniques are not directly applicable to OFDM based IM/DD
systems because of the unipolar nature of output signal. Therefore, timing synchronization
schemes that are suitable for IM/DD systems need to be used. In this paper, we will focus on
timing synchronization for AC based OFDM systems. Recently some techniques have been
presented for timing synchronization for ACO-OFDM system [51-52]. The technique proposed
in [51] is tailored specifically to ACO-OFDM and may not work for other AC systems.
Detection accuracy of this scheme also depends on the choice of training symbol used. Some
training symbols may not give perfect accuracy even at high SNR without noise and multipath.
In [52], authors present a method that utilizes symmetry of ACO-OFDM time domain output
symbol with some additional redundancy. However, we cannot estimate channel using this
technique. In this paper, we present timing synchronization method that works perfectly for all
AC systems namely ACO-OFDM, PAM-DMT and DHT based optical OFDM and can also be
used for channel estimation simultaneously. Our technique not only gives best performance but
due to flexibility in size of correlation length, we can achieve perfect accuracy even with smaller
correlation length and at lower SNR.
7.2 RF Based Timing Synchronization Methods
In this section, we will discuss three previously proposed timing synchronization methods. Two
of these techniques were proposed for RF based OFDM and one for ACO-OFDM.
7.2.1 Schmidl’s Method
In [48], Schmidl presented a timing synchronization method based on autocorrelation of two
identical halves of OFDM training symbol. Such a training symbol can be generated by
modulating only even subcarriers with complex constellation symbols like M-QAM. The

100
resulting time domain training symbol will have two repeated halves [ ]A A excluding CP. Where
A represents first 2N samples of time domain output symbol. For a training symbol of length N,
Schmidl’s timing metric is
2
2
P dM d
R d
(7-1)
where
2 1
*
0
2N
n
r n d r n d NP d
and
2 1
2
0
2N
n
R r n d Nd
where r n presents discrete samples of the received signal and * represents complex conjugate.
Start of the training symbol is indicated by max of this timing metric. This timing metric suffers
from a plateau due to CP which results in some uncertainty in start of the training symbol.
Therefore, this technique will not predict start location of frame very accurately.
The above mentioned scheme cannot be directly applied to AC optical OFDM systems.
Therefore, a modified version wherein complex constellation symbols satisfying hermition
symmetry are used as input to IFFT block. This will generate real bipolar time domain signal
with same characteristics[ ]A A .

101
Figure 7-1. Average of Schmidl’s and Park’s timing metrics with modified training symbol suitable for ACO-
OFDM in the absence of AWGN and multipath.
7.2.2 Park’s Method
In [49], the author proposed a timing synchronization scheme that will ensure a sharp peak in the
timing metric to precisely indicate start of training symbol. To achieve this, a new time domain
training symbol was used which can be generated by modulating only even subcarriers with real
valued random symbols like M-PAM. Resulting time domain symbol will have a format
* *[ ]AB A B where A represents first 4N samples of this time domain training symbol and B
represents mirror image of A. The timing metric used by Park is
2
2
P dM d
R d
(7-2)
where
2 1
0
N
n
r d n r d nP d
and
2 1
2
0
N
n
R r d nd
-500 -400 -300 -200 -100 0 100 200 300 400 500-0.2
0
0.2
0.4
0.6
0.8
1
1.2
Time index d(in samples)
Ave
rage
of tim
ing
metr
ics
Modified Schmidls method
Modified Parks method

102
This timing metric will result is several sharp peaks one of which will occur at the correct
location of start of training symbol.
Just like Schmidl’s method, a modified version of this technique wherein real constellation
symbols satisfying Hermition symmetry are used to modulate only even subcarriers. This will
result in a time domain training symbol with format [ ]AB AB . A plot showing average of the
timing metric for Schmidl’s and parks method with modified training symbols is shown in Figure
7-1. We can see that Schmidl’s timing metrics shows a flat region during the length of CP of
training symbol. However, Parks method does not have this flat region but has four distinct
peaks one of which is at the correct timing instant.
7.2.3 Tian’s Method
Recently Tian [51] proposed a timing synchronization method tailored to ACO-OFDM system.
In this technique, a new time domain training symbol is used that has a format, where C
represents 4 1N samples of output training symbol. Such a training symbol can be produced by
modulating odd subcarriers with real constellation symbols and even subcarriers by zero. The
author presented several timing metrics but we will only present one metric for analysis and
comparison. This metric known as simple timing metric is given by
4 1
1
1
8 1
N
n
M r d n r d nN
d
(7-3)
Figure 7-2 shows average of simple timing metric. Since we are using total average electrical
power of unity for our analysis and comparison of various timing synchronization schemes,
therefore we will be using a factor of 8 1N in the numerator of the above metric. A total of
10,000 random training symbols were used with IFFT size of N = 256 and CP length of N/8. To

103
get more realistic results, each training symbol was followed and preceded by another random
ACO-OFDM symbol. The figure shows that besides the main peak at the correct timing instance
of d=N/2, there is another peak at d=0. The difference between these two peaks is not high which
can reduce correct detection probability especially at low SNR.
Figure 7-2. Average of Tian’s timing metrics in the absence of AWGN and multipath.
7.3 New Timing Synchronization Scheme for AC OFDM Systems
In this section, we present a new timing synchronization scheme that can be used for all AC
based OFDM systems. Although the fundamental approach used is same for all schemes but
some minor modifications are required in timing metrics and training symbol generation method
to make it suitable for each system. The details are given below.
7.3.1 Symbol Timing Estimation for ACO-OFDM
Our proposed method uses very important property of ACO-OFDM output waveforms which
have a format [ ]clip
C C as shown in Figure 7-3. This shows that the negative part of the first
2N samples of one symbol is present in the second 2N samples.
-500 -400 -300 -200 -100 0 100 200 300 400 500
0
0.2
0.4
0.6
0.8
1
1.2
Time index d(in samples)
Avera
ge o
f tim
ing m
etr
ics
Tians method

104
Figure 7-3. ACO-OFDM bipolar and clipped signal showing negative values of first half are available in the second
half of clipped signal (N=128).
Therefore, we can easily reconstruct a bipolar signal of length 2N with these two halves that
will be identical to the original unclipped bipolar signal of length 2N . The bipolar signal is
constructed as
BP clipr n C n C n
(7-4)
This reconstructed bipolar signal can be used to perform correlation with a local copy of training
symbol p n known at the receiver to correctly estimate starting location of OFDM symbols. We
will use timing metric given by
0 20 40 60 80 100 120-4
-3
-2
-1
0
1
2
3
4
Time Index (n)
ACO-OFDM Bipolar signal
Negative values 1st Half
Positive values 2nd Half
0 20 40 60 80 100 1200
0.5
1
1.5
2
2.5
3
3.5
4
Time Index (n)
Negative values 1st Half
Positive values 2nd Half

105
1
02
11,2,...,BP
L
n
NM d r n d p n d LL
(7-5)
where BPr n is the reconstructed bipolar received signal and p n is the local copy of the training
symbol. L is the cross-correlation length that can be set based on the desired performance. As
we will show later a higher value of L will give better performance. Maximum of this timing
metric will be used to find the starting location of OFDM training symbol. We will assume
throughout this paper that average output electrical power of ACO-OFDM output training
symbols before clipping is unity i.e. 2 1E p n .
Figure 7-4. Average of timing metrics using proposed method in the absence of AWGN and multipath for ACO-
OFDM and PAM-DMT systems.
A plot of average of this timing metric with 2NL for ACO-OFDM is shown in Figure 7-4. To
generate these results, a random sample of 10,000 training symbols was used preceded and
followed by a random ACO-OFDM symbol with CP. From the figure, we can clearly see that a
peak occurs at the correct location at 0d . There are two other negative peaks at 2d N and
-500 -400 -300 -200 -100 0 100 200 300 400 500-1
-0.8
-0.6
-0.4
-0.2
0
0.2
0.4
0.6
0.8
1
Time index d (in samples)
Ave
rage
of tim
ing
metr
ics
Proposed method for ACO-OFDM
Proposed method for PAM-DMT

106
2d N occurring before and after the main peak respectively. These are caused by the negative
correlation of first and second half of the reference signal with the received signal. Since we are
using maximum of the timing metric, therefore we will ignore those peaks as they will not cause
any uncertainty in the correct location identification. There is also a small peak occurring at
d N . This is due to the correlation of local training symbol with the CP of received training
symbol. The magnitude of this peak depends on the size of CP. Since CP length is usually small
compared to the length of useful part of symbol, therefore magnitude of this peak will be small
compared to the main peak and thus will not cause any uncertainty in correct location of
beginning of training symbol and will not result in erroneous detections.
7.3.2 Symbol Timing Estimation for PAM-DMT
Figure 7-5. PAM-DMT bipolar and clipped signal showing that image of negative values in first half is available in
second half (N=128).
0 20 40 60 80 100 120-4
-3
-2
-1
0
1
2
3
4
Time Index (n)
PAM-DMT Bipolar signal
Negative values 1st Half
Positive values 2nd Half
0 20 40 60 80 100 1200
0.5
1
1.5
2
2.5
3
3.5
4
Time Index (n)
Negative values 1st Half
Positive values 2nd Half

107
In PAM-DMT, the output waveform has format [0 0 ]mirror
clipC C
where C represents first
4 1N samples of the output PAM-DMT symbol. This is shown in Figure 7-5. In this case, the
second half contains mirror image of negative samples of the first half.
Therefore, the bipolar received signal can be reconstructed by
mirror
mirror
BPclip
r n C n C n (7-6)
This bipolar signal will be correlated with a local copy of training symbol to locate beginning of
OFDM training symbol. We will use the maximum of the same timing metric used by ACO-
OFDM given in (7-5) with the bipolar signal reconstructed using (7-6).
A plot of average of this timing metric for correlation length 12NL is shown in Figure 7-4.
From the figure, we see that there is only one peak at 0d that shows correct location of start of
OFDM training symbol. There is also a small peak occurring at d N . This is due to the
correlation of local training symbol with the CP of received training symbol. The properties of
this small peak are similar to those described in case of ACO-OFDM. Due to high difference in
the magnitude of these two positive peaks, we expect a high probability of correct detection
compared to other previously proposed techniques.
7.3.3 Symbol Timing Estimation for DHT Based OFDM
In DHT based OFDM, output waveform has same format as that of ACO-OFDM i.e. [ ]clip
C C.
This is shown in Figure 7-6 .Therefore, at the receiver we will reconstruct bipolar signal in same
way as was reconstructed in ACO-OFDM. Same timing metric will can be used for DHT based

108
OFDM system given in (9). A plot of average of this timing metric for 2NL is shown in
Figure 7-7. The figure shows that the average of timing metric for DHT based OFDM is identical
to ACO-OFDM.
Figure 7-6. ACO-OFDM bipolar and clipped signal showing negative values of first half are available in the second
half of clipped signal (N=128).
7.4 Effect of Sampling Phase Offset
Since our proposed timing metric uses correlation of received training symbol with a local copy,
therefore, a mismatch in sampling clock phase by a non-integer factor will result in performance
degradation. For ACO-OFDM and DHT based O-OFDM, although the second half is not the
mirror image of the negative part of first half, but due to its correlation with local copy of
training symbol which has a fixed phase offset, sampling clock phase offset will still cause
performance deterioration.
0 20 40 60 80 100 120-4
-3
-2
-1
0
1
2
3
4
Time Index (n)
DHT-OFDM Bipolar signal
Negative values 1st Half
Positive values 2nd Half
0 20 40 60 80 100 1200
0.5
1
1.5
2
2.5
3
3.5
4
Time Index (n)
Negative values 1st Half
Positive values 2nd Half

109
Figure 7-7. Average of timing metrics using proposed method in the absence of AWGN and multipath for DHT
based OFDM and ACO-OFDM system.
Figure 7-8 shows this performance degradation effect due to non-integral sampling clock phase
offset for ACO-OFDM. According to [51], this effect can be reduced by using some correlation
between the adjacent samples of the training symbols. This can be achieved by only modulating
lower subcarriers and setting higher subcarriers to zero. From the figure, we see that when we
only used lower half of all usable subcarriers, the peaks drop slowly to zero and it drops even
slower when we used lower quarter of available subcarriers. By comparing results for simple
timing metric in [51] and Figure 7-8, we see that the simple timing metric drops down to
uncorrelated level at sample offset of 0.5 from the correct sampling instant when all subcarriers
are used. However, using same number of subcarriers, our proposed timing metric drops to zero
at sampling offset of 1. At sampling offset of 0.5, our timing metric drops down to 0.56. This
-500 -400 -300 -200 -100 0 100 200 300 400 500-1
-0.8
-0.6
-0.4
-0.2
0
0.2
0.4
0.6
0.8
1
Time index (n)
Avera
ge o
f tim
ing m
etr
ics
Proposed method for DHT-OFDM
Proposed method for ACO-OFDM

110
shows that even with sampling phase offset of 0.5 our technique will still be able detect symbols
correctly. This shows the robustness of our timing scheme against sampling clock phase offsets.
For PAM-DMT, average of our proposed timing metric for non-integral sampling clock phase
offset shows identical results to that obtained for ACO-OFDM.
Figure 7-8. Average of timing metrics with variable number of subcarriers used in the absence of AWGN and
multipath for ACO-OFDM systems.
7.5 Multipath Channel Model
In our paper, we will use an exponential decay model [53] to simulate multipath channel effects.
This model given by
1
2
0
0,1,2,...., 1s
s
nt
Knt
n
eh n n K
e
(7-7)
-5 -4 -3 -2 -1 0 1 2 3 4 5-0.4
-0.2
0
0.2
0.4
0.6
0.8
1
1.2
Sample index (n)
Avg
of
tim
ing
me
tric
All subcarriers used in ACO-OFDM
Half subcarriers used in ACO-OFDM
Quarter subcarriers used in ACO-OFDM

111
Where st is time interval between OFDM samples and represents the decay time which
depends on the properties of the room. In our analysis, we will consider st which results in
impulse response of length 6K .
7.6 Mean and Variance of New Timing Synchronization Method
In this section, we will calculate mean and variance of our newly proposed timing
synchronization metric. As stated earlier, we will assume that average electrical power of output
symbol is unity. As described in [40], the output unclipped signal follows a Gaussian distribution
~ 0,1x n N with zero mean and unity variance 2 2 1xx nE Since we are computing
correlation of bipolar signal at the receiver, therefore electrical power not the optical power will
be used throughout our analysis.
The PDF of the reconstructed bipolar signal also follows a Gaussian distribution in the absence
of noise and multipath. This is due the symmetry property of asymmetrically clipped OFDM
signals generated. We know that for ACO-OFDM and DHT based optical OFDM
/ 2x x n Nn (7-8)
Similarly for PAM-DMT
x x N nn (7-9)
After clipping operation, a non-zero sample in first half will have a corresponding zero value in
the second half of the OFDM symbol. These sample values are dependent and identically
distributed with clipped Gaussian distribution. Due to this symmetry, dependence and

112
asymmetric clipping operation, the difference of corresponding two sample values will result in a
Gaussian distribution with zero mean and variance2 1x .
First we will compute mean of the timing metric in the absence of any noise or multipath. Mean
of our proposed timing metric is given as
1
0
1 L
BP
n
M d r n d p n dL
E E
(7-10)
At the correct timing instant, BPr n p n , therefore 2 1p n dE , therefore the mean of
our timing metric will be 1M dE .
For 2Nd we see two negative spike, this is due to the negative correlation of first and
second halves with the second and first half of received bipolar signal respectively. Since our
timing estimation method uses maximum of the timing metric, therefore these two negative
spikes will not cause any uncertainty in correct symbol location. There is another positive peak
occurring at d N which is due to the correlation of last samples of local sequence with CP of
the received bipolar signal. Exact theoretical expressions for variance of timing metric at these
three locations is not easy to derive due to complexity involved in deriving the PDF of
reconstructed bipolar signal. Therefore, computer simulations can be used to compute variance
of timing metrics at those locations.
For all other values of d, the sample values of BPr n and p n are independent, therefore
1
0
01
BP
L
n
M d r n d p n dE E EL
(7-11)
The variance of the timing metric at 0d can be computed as

113
1
2
20
var 01
varL
n
M p nL
(7-12)
We know that ~ 0,1p n N , therefore
12
0
L
n
p n
forms a Chi-Squared distribution with L degrees
of freedom [53]. Let us represent this RV as
12
0
L
n
C p n
where 2~C L .
Therefore
2
2
var 0
2
2
1var
1
M C
L
L
L
L
(7-13)
This shows that as we increase the correlation length, variance will decrease.
7.7 Simulation Results
We will evaluate performance of our proposed timing synchronization algorithm by generating
random AC based OFDM training symbols using computer simulations. We will use IFFT size
of N=256 with CP length of N/8. Both AWGN and multipath channels will be used. To generate
impulse response of an indoor multipath channel, we will use an exponential decay model
described earlier. All simulations results are obtained using random training symbol which are
assumed to be known at the receiver. For our proposed technique, we will present results for
various correlation lengths L. To show a comparison, we will also present results obtained from
the Parks and Tians timing synchronization methods discussed earlier. Our results will show
accuracy of each scheme versus SNR and variance of the timing metrics at the correct timing
instant with varying SNR.

114
Figure 7-9. Accuracy of various timing synchronization methods in AWGN channel with no multipath. L=N/2 for
ACO-OFDM and L=N/2-1 for PAM-DMT is used.
Figure 7-9 shows a comparison of accuracy of timing metrics for a given electrical SNR in
AWGN environment. Correct detection was based on the timing metric exceeding a specific
threshold value. From the figure, it is clear that out proposed timing metric outperforms all other
methods and achieves 100% accuracy even at very low SNR. This is due to bipolar signals used
in correlation to estimate the beginning of training symbol. Only at the correct symbol starting
point, we get maximum positive correlation value. At all other timing indices, correlation results
in some negative and positive values which results in cancellation and therefore we see low
correlation value. This cancellation was not possible in timing metrics using unipolar input
signals for correlation. In such schemes, correlation will only result in positive values. Therefore,
it can easily cause erroneous detection due to high correlation with non-training symbols. Hence,
for such a scheme, choice of training symbols is extremely important.
-10 -5 0 5 10 150
0.1
0.2
0.3
0.4
0.5
0.6
0.7
0.8
0.9
1
SNR (dB)
Pro
b[C
orr
ect fr
am
e d
ete
ction ]
Proposed method for ACO-OFDM
Proposed method for PAM-DMT
Tians method for ACO-OFDM
Parks method for ACO-OFDM

115
Figure 7-10. Accuracy of various timing synchronization methods in multipath channel. L=N/2 for ACO-OFDM
and L=N/2-1 for PAM-DMT is used.
Figure 7-10 shows accuracy of various timing synchronization methods with varying SNR in
multipath channel. Compared to its performance in AWGN, we see that our purposed scheme
does not show any degradation. However, other schemes require higher SNR to achieve the same
performance as shown with AWGN channel.
-10 -5 0 5 10 150
0.1
0.2
0.3
0.4
0.5
0.6
0.7
0.8
0.9
1
SNR (dB)
Pro
b[C
orr
ect fr
am
e d
ete
ction ]
Proposed method for ACO-OFDM
Proposed method for PAM-DMT
Tians method for ACO-OFDM
Parks method for ACO-OFDM

116
Figure 7-11. Accuracy of proposed timing synchronization method using various correlation lengths for ACO-
OFDM in AWGN channel with no multipath.
Figure 7-12. Accuracy of proposed timing synchronization method using various correlation lengths for PAM-DMT
in AWGN channel with no multipath.
-10 -5 0 5 10 150
0.2
0.4
0.6
0.8
1
SNR (dB)
Pro
b[C
orr
ect fr
am
e d
ete
ction ]
L = N/2
L = N/3
L = N/4
L = N/5
L = N/6
-10 -5 0 5 10 150
0.2
0.4
0.6
0.8
1
SNR
Pro
b[C
orr
ect fr
am
e d
ete
ction ]
L = N/2-1
L = N/3
L = N/4
L = N/5
L = N/6

117
In Figure 7-11 and Figure 7-12, we have presented a comparison of accuracy of our proposed
method for various correlation lengths for ACO-OFDM and PAM-DMT systems respectively.
From the figure, it is clear that higher correlation length results in better performance and thus
better accuracy at low SNR. However, higher correlation lengths also require more
computational resources and extra hardware that can increase receiver cost.
Figure 7-13. Accuracy of proposed timing synchronization method using various correlation lengths for DHT based
OFDM in AWGN channel with no multipath.
-10 -5 0 5 10 150
0.2
0.4
0.6
0.8
1
SNR (dB)
Pro
b[C
orr
ect fr
am
e d
ete
ction ]
L = N/2
L = N/3
L = N/4
L = N/5
L = N/5

118
Figure 7-14. Variance of various timing synchronization methods in AWGN channel at correct timing instance.
In figure 7-13, we have presented a similar comparison of accuracy timing accuracy of proposed
technique for DHT based OFDM system. We see a similar behavior that by increasing
correlation length we get a better accuracy.
Figure 7-15. Variance of various timing synchronization methods in multipath channel at correct timing instance.
-5 0 5 10 15 2010
-4
10-3
10-2
10-1
100
101
SNR (dB)
Va
ria
nce
Proposed Method for ACOFDM
Proposed Method for PAMDMT
Parks method
Tians method
-5 0 5 10 15 2010
-4
10-3
10-2
10-1
100
101
SNR (dB)
Variance
Proposed Method for ACOFDM
Proposed Method for PAMDMT
Parks method
Tians method

119
Figure 7-14 and Figure 7-15 show variance of the timing metric for various techniques with
varying SNR in AWGN and multipath channel respectively. The variance is calculated at the
correct timing instance. For each simulation run, a random training symbol was generated and
random noise was added at the receiver. We used L=N/2 for ACO-OFDM and L=N/2-1 for
PAM-DMT. For multipath channel, exponential decay model was used with st that
corresponds to K=6. From the figure, it is clear that our proposed timing synchronization method
shows lower variance in both AWGN and multipath channel and therefore performs better than
all other previously proposed techniques. From Figure 7-4, we also know there is a big
difference between the main peak at the correct location and other peak caused by CP in the
proposed timing metric of ACO-OFDM and PAM-DMT. Therefore, due to this big difference in
the magnitude of peaks, even if the variance of our proposed method were equal to the other
techniques, our proposed method would still have outperformed other counterparts.
7.8 Conclusions
In this chapter, we have presented a novel timing synchronization scheme that can be used to
estimate symbol timing for asymmetric clipping based OFDM systems using IM/DD. This
timing synchronization scheme can be applied to ACO-OFDM, PAM-DMT and DHT based
optical OFDM systems. Unlike other timing synchronization schemes, no special format of the
training symbols is used. Instead, regular OFDM symbols generated by asymmetric clipping
schemes are used. Our timing metric uses correlation of a local copy of the training symbol with
a bipolar signal reconstructed from unipolar received signal. The bipolar signal can be easily
constructed from unipolar signal due to the fact that output signal of asymmetric clipping
schemes carry positive and negative parts of first N/2 samples of time domain signal. Simulation
results show that our timing synchronization scheme not only outperforms all other available

120
techniques but also requires very low SNR to achieve 100% accuracy. Our timing
synchronization scheme also shows better performance for smaller correlation length and
achieves maximum accuracy at average comparatively lower SNR. Unlike other timing
synchronization techniques which are tailored to specific ACO-OFDM system, our technique is
more generic and can be easily used for various asymmetric clipping based OFDM optical
wireless systems.

121
Chapter 8
Conclusions and Future Work
In this research work, we have discussed various problems and challenges faced by OFDM based
RF and OW systems. Specifically, we investigated interference characteristics of two mapping
strategies used in RF LTE OFDMA system. OFDM systems are very sensitive to CFO, therefore,
for a robust system design, a mapping scheme that offers minimal interference due to CFO must
be used.
OFDM has also gained a lot of attention for OW systems. Although, OFDM baseband signal
generation methods are almost same in both RF and OW, but due to unipolar nature of optical
signal, some modifications are required in OW domain. Due to these modifications, algorithms
for timing synchronization, PAPR reduction etc. needs to be revisited for OW system. In this
thesis, we looked into some PAPR reduction strategies for OFDM based OW systems. Through
our work, we came up with precoding schemes that offer zero signaling overhead and also
reduce PAPR of optical OFDM signal at the cost of extra computation. We also investigated the
BER performance of these precoding schemes. Through our work, we found that these precoding
schemes not only reduce PAPR of optical OFDM signal but also give better BER performance
especially in case of multipath channel.
AC optical OFDM systems are power efficient but they are not spectrally efficient as they
sacrifice certain part of allocated bandwidth to achieve power efficiency. Therefore, through this

122
research, we came up with a HACO-OFDM system that offers high spectral and power
efficiency compared to the currently available systems. In this scheme, we use all the available
OFDM subcarriers and achieve high data rates compared to other techniques.
OFDM systems are very sensitive to timing errors. In RF domain, a large amount of research
work has been done on efficient timing synchronization schemes for OFDM. However, due to
unipolar nature of optical signal, same techniques may or may not work when applied to optical
systems. We investigated various RF based timing synchronization scheme and found that some
modifications are required to apply those techniques to optical systems. However, even with
these modifications, performance of those techniques was not good. Therefore, in this thesis we
proposed a novel timing synchronization schemes that not only works perfectly for all AC
optical OFDM systems but also outperforms previously available techniques. Our technique
offers perfect accuracy even at very low SNR. Besides accuracy, our technique is also very
computationally efficient.
8.1 Future Work
Further research work in OW technology can open more doors to high speed communications.
Possible future research topics can be
Investigation of more power and spectrally efficient OFDM systems that require less
computation
More efficient timing synchronization schemes that are robust and work for all optical
OFDM systems

123
PAPR reduction techniques for OFDM based OW systems which do not require any
overhead and extra computation
Bi-directional OW system design that offers mobility and high data rates comparable to
WiFi
Beam steering techniques that enable mobility and solve the blocking problems faced by
OW systems
Developing modulation techniques and front end devices to make future OW systems
compatible with RF wireless standards.

124
References
[1]. L. J. Cimini, “Analysis and simulation of a digital mobile channel using orthogonal
frequency division multiplexing,” IEEE Trans. Commun.,vol. 33, pp. 665–667, 1985.
[2]. J. Zyren, “Overview of 3GPP Long Term Evolution LTE physical layer,” White Paper,
Freescale, 2007.
[3]. M. Kavehrad, "Sustainable Energy-Efficient Wireless Applications Using Light," IEEE
Communications Magazine, pp. 66-73, Dec. 2010
[4]. Z. Zhou, M. Kavehrad and P. Deng, “Energy Efficient Lighting and Communications,”
Proc. SPIE 8282, Broadband Access Communication Technologies VI, Jan. 21, 2012
[5]. Burchardt, H.; Serafimovski, N.; Tsonev, D.; Videv, S.; Haas, H., "VLC: Beyond point-to-
point communication," Communications Magazine, IEEE , vol.52, no.7, pp.98,105, July
2014.
[6]. G. Yun, M. Kavehrad, “Spot Diffusing and Fly-Eye Receivers for Indoor Infrared
Wireless Communications," Proceedings of IEEE Wireless Communications
Conference, Vancouver, June 1992.
[7]. M.Z. Afgani, H. Haas, H. Elgala and D. Knipp, “Visible light Communication using
OFDM,” Testbeds and Research Infrastructure for the Development of Networks and
Communities, 2006. TRIDENTCOM 2006. 2nd International Conference on, vol., no,
pp.6, pp.-134.
[8]. H. Elgala, R. Mesleh, and H. Haas, "Practical considerations for indoor wireless optical
system implementation using OFDM," in Proc. of ConTEL, Zagreb, Croatia, 2009, pp. 25-
30.

125
[9]. J. Armstrong, “OFDM for optical communications,” J. Lightwave Technol., vol. 27, pp.
189–204, 2009.
[10]. M. Kavehrad, “Broadband room service by light,” Scientific American, pp 82-87, July
2007.
[11]. J.M. Kahn, J.M. Barry, M.D. Audeh, J.B. Carruthers, W.J Krause and G.W Marsh, "Non-
directed infrared links for high-capacity wireless LANs," Personal Communications, IEEE,
vol.1, no.2, pp.12, 2nd Qtr. 1994.
[12]. J. B. Carruthers and J. M. Kahn, “Multiple-subcarrier modulation for non-directed wireless
infrared communication,” IEEE J. Select. Areas Commun, vol. SAC-14, pp. 538-546, Apr.
1996.
[13]. H. Elgala, R. Mesleh and H. Haas, "A study of LED nonlinearity effects on optical
wireless transmission using OFDM," Wireless and Optical Communications Networks,
2009. WOCN '09. IFIP International Conference on, vol., no., pp.1-5, 28-30 April 2009.
[14]. O. Gonzalez, R. Perez-Jimenez, S. Rodriguez, J. Rabadan and A. Ayala, “Adaptive OFDM
system for communications over the indoor wireless optical channel”, IEE Proc. –
Optoelectronics, vol. 153, no. 4, pp. 139–144, 2006.
[15]. Sian C. Jeffrey, S. Randel, F. Breyer and A. M. J. Koonen, “PAM-DMT for Intensity
Modulated and Direct-Detection Optical Communication Systems,” IEEE Photonics
Technology Letters vol. 21, no. 23, pp. 1749–1751.
[16]. J. Armstrong and B. J. C. Schmidt, “Comparison of asymmetrically clipped optical OFDM
and DC-biased Optical OFDM in AWGN,” vol. 12, no. 5, pp. 343–345.

126
[17]. J. Armstrong, B. J.C. Schmidt, D. Kalra, H. A. Suraweera, and A. J. Lowery, "Performance
of asymmetrically clipped optical OFDM in AWGN for an intensity modulated direct
detection system," in Proc. of GLOBECOM 2006, San Francisco, CA, USA, pp. 1-5.
[18]. Moreolo, M.S.; Munoz, R.; Junyent, G., "Novel Power Efficient Optical OFDM Based on
Hartley Transform for Intensity-Modulated Direct-Detection Systems," Lightwave
Technology, Journal of , vol.28, no.5, pp.798,805, March 1, 2010
[19]. C. Liang, B. Krongold, and J. Evans, "Diversity combining for asymmetrically clipped
optical OFDM in IM/DD channels," in Proc. of IEEE GLOBECOM Honolulu, Hawaii,
2009.
[20]. J. Li, M. Kavehrad, “Effects of Time selective multipath fading on OFDM systems for
broadband mobile applications,” IEEE Commun. Letters, Vol. 3, pp. 332-334, Dec. 1999.
[21]. J. Lee, H.L Lou, J.M Cioffi, “Effect of carrier frequency offset on OFDM systems for
multipath fading channels,” in Proc. IEEE GLOBECOM 2004, pp.3721-3725.
[22]. B. A. Ranjha, M. I. S. Chaudhry and M. Kavehrad, “Interference Analysis of
Interleaved and Localized Mapping Schemes in OFDMA System with Carrier
Frequency Offset”, IEEE Military Communications Conference (MILCOM), 2012,
Orlando, FL, Oct 29-Nov 1.
[23]. B. A. Ranjha and M. Kavehrad, “Precoding techniques for PAPR reduction in
asymmetrically clipped OFDM Based optical wireless systems”, SPIE Photonics West,
San Francisco, CA, February 2-7, 2013.
[24]. S. Nobilet, J. F. Herald and D. Mottier, “Spreading Sequences for uplink and downlink
MC-CDMA Systems: PAPR and MAI minimization,” European Transactions on
Telecommunications, Volume 13, Issue 5, pages 465–474, September–October 2002.

127
[25]. S. H. Han and J. H. Lee, “An Overview of Peak-to-Average Power Ratio Reduction
Techniques for Multicarrier Transmission,” IEEE Wireless Commun., vol. 12, no. 2, April
2005, pp. 56–65.
[26]. S. H. Müller and J. B. Huber, “OFDM with Reduced Peak–to–Average Power Ratio by
Optimum Combination of Partial Transmit Sequences,” Elect. Lett., vol. 33, no. 5, Feb.
1997, pp. 368–69.
[27]. R. W. Bäuml, R. F. H. Fisher, and J. B. Huber, “Reducing the Peak-to-Average Power
Ratio of Multicarrier Modulation by Selected Mapping,” Elect. Lett., vol. 32, no. 22, Oct.
1996, pp. 2056–57.
[28]. X. Li and L. J. Cimini, Jr., “Effect of Clipping and Filtering on the Performance of
OFDM,” IEEE Commun. Lett., vol. 2, no. 5, May 1998, pp. 131–33.
[29]. B. A. Ranjha and M. Kavehrad, “Precoding techniques for PAPR reduction in
asymmetrically clipped OFDM Based optical wireless systems”, SPIE Photonics West,
San Francisco, CA, February 2-7, 2013.
[30]. Barry, J. and Kahn, J., et al, “Simulation of Multipath Impulse Response for Indoor
Wireless Optical Channels,” IEEE Journal on Selected Area in Communication, VOL: 11,
Issue: 3, pp. 367 – 379, (1993).
[31]. F.J. Lopez-Hernandez, R. Perez-Jimenez, and A. Santamaria, ‘‘Modified Monte Carlo
scheme for high-efficiency simulation of the impulse response on diffuse IR wireless
indoor channels,’’ Electron. Lett.34 ~ 19, 1819–1820 ~ 1998.
[32]. H. Sari, G. Karam, and I. Jeanclaude, "Transmission techniques for digital terrestrial TV
broadcasting", IEEE Commun. Mag., vol. 33, no. 2, pp. 100-109, Feb. 1995.

128
[33]. Acolatse, K.; Bar-Ness, Y.; Wilson, S.K., "SCFDE with space-time coding for IM/DD
optical wireless communication," Wireless Communications and Networking Conference
(WCNC), 2011 IEEE , vol., no., pp.1694,1699, 28-31 March 2011.
[34]. S. D. Dissanayake and J. Armstrong, "Novel techniques for combating DC-offset in
diversity combined ACO-OFDM," IEEE Communications Letters, 2011.
[35]. S. D. Dissanayake and J. Armstrong, “ Comparison of ACO-OFDM, DCO-OFDM and
ADO-OFDM in IM/DD systems, ”J. Lightwave Technol., vol. 31, no. 7, pp. 1063 – 1072,
2013.
[36]. J. Armstrong and A. J. Lowery, "Power efficient optical OFDM," Electronics Letters, vol.
42, pp. 370-372, 2006.
[37]. J. G. Proakis, Digital Communications. New York, McGraw Hill, 1995
[38]. Y. P Lin, S. M. Phong, “BER minimized OFDM systems with channel independent
precoders,” IEEE Transaction on signal processing, vol. 51, No. 9, pp. 2369-2380, Sep
2003.
[39]. Bilal Ranjha; Zhou Zhou and Mohsen Kavehrad,"Performance analysis of precoding-based
asymmetrically clipped optical orthogonal frequency division multiplexing wireless system
in additive white Gaussian noise and indoor multipath channel", Opt. Eng. 53(8), 086102
(Aug 11, 2014).
[40]. J. Kahn and J. Barry, “Wireless infrared communications,” Proceedings of the IEEE, vol.
85, no. 2, pp. 265–298, 1997.
[41]. X. Li, R. Mardling, and J. Armstrong, “Channel capacity of IM/DD optical communication
systems and of ACO-OFDM,” in Proc. IEEE Int. Conf. Communications, Glasgow, U.K.,
2007, pp. 2128–2133.
http://profiles.spiedigitallibrary.org/summary.aspx?DOI=10.1117%2f1.OE.53.8.086102&Name=Bilal+Ranjha

129
[42]. A. Papoulis, “Probability, Random Variables, and Stochastic Processes”, McGraw-Hill,
New York, 1965.
[43]. Gradshteyn and I. Ryzhik, “Table of Integrals, Series and Products,” 6th ed. New York,
NY, USA: Academic, 2000.
[44]. Ranjha, B., Kavehrad, M., "Hybrid asymmetrically clipped OFDM-based IM/DD optical
wireless system," Optical Communications and Networking, IEEE/OSA Journal of, vol.6,
no.4, pp.387,396, April 2014.
[45]. F. Classen and H. Meyr, “Synchronization algorithms for an OFDM system for mobile
communication,” ITG-Fachtagung, pp. 105–113, Oct. 26–28, 1994.
[46]. J.-J. van de Beek, M. Sandell, M. Isaksson, and P. B¨orjesson, “Low-complex frame
synchronization in OFDM systems,” in Proc. ICUPC, Nov. 6–10, 1995, pp. 982–986.
[47]. J. J. van de Beek, M. Sandell, and P. O. Borjesson, “ML estimation of time and frequency
offset in OFDM systems,” IEEE Trans. Signal Processing, vol. 45, pp. 1800-1805, July
1997.
[48]. T. Schmidl and D. Cox, “Robust frequency and timing synchronization for OFDM,” IEEE
Trans. Commun., vol. 45, pp. 1613-1621, Dec. 1997.
[49]. B. Park, H. Cheon, C. Kang, and D. Hong, “A novel timing estimation method for OFDM
systems,” IEEE Commun. Lett., vol. 7, pp. 239-241, May 2003.
[50]. H. Minn, V. K. Bhargava, and K. B. Letaief, “A robust timing and frequency
synchronization for OFDM systems,” IEEE Trans. Wireless Commun., vol. 2, pp. 822-839,
July 2003.
[51]. S. Tian, K. Panta, H. A. Suraweera, J. C. Schmidt, S. McLaughlin and J. Armstrong, “A
novel timing synchronization method for ACO-OFDM based optical wireless

130
communications,” IEEE Transactions on Wireless Communications, vol. 7, no. 12, pp
4958-4967, December 2008.
[52]. Freda, M. M.; Murray, J. M., "Low-complexity blind timing synchronization for ACO-
OFDM-based optical wireless communications," GLOBECOM Workshops (GC Wkshps),
2010 IEEE , vol., no., pp.1031,1036, 6-10 Dec. 2010
[53]. R. Walpole and R. Myers, Probability and Statistics for Engineers and Scientists. New
York: Macmillan, 1985.
[54]. V. Jungnickel, V. Pohl, S. Nonnig, and C. von Helmolt, “A physical model of the wireless
infrared communication channel,” IEEE J. Select.Areas Commun., vol. 20, pp. 631-640,
Apr. 2002.
[55]. T. Komine and M. Nakagawa, “Fundamental analysis for visible-light communication
system using LED lights,” IEEE Trans. Consumer Electron., vol. 50, no. 1, pp. 100–107,
Feb. 2004.
[56]. Y. Tanaka, T. Komine, S. Haruyama, and M. Nakagawa, "Indoor Visible Communication
Utilizing Plural White LEDs as Lighting;' in Proc. of the 12th IEEE International
Symposium on Personal, Indoor and Mobile Radio Communications, vol. 2, San Diego,
CA, USA, Sep. 30 - Oct. 3, 2001, pp. 81-85.
[57]. O. Gonzalez, R. Perez-Jimenez, S. Rodriguez, J. Rabadan, and A. Ayala, "OFDM
over indoor wireless optical channel," Optoelectronics, IEE Proceedings-, vol. 152, pp.
199-204, 2005.
[58]. F. R. Gfeller and U. Bapst, “Wireless in-house data communication via diffuse infrared
radiation,” in Proceedings of the IEEE, Nov. 1979, pp.1474–1486.

131
[59]. J. R. Barry, Wireless Infrared Communications. Boston, MA: Kluwer Academic Press,
1994.
[60]. D. Borah, A. Boucouvalas, C. Davis, S. Hranilovic, and K. Yiannopoulos, “A review of
communication-oriented optical wireless systems,” EURASIP Journal on Wireless
Communications and Networking, vol. 2012, article 91, 2012.
[61]. D. Wulich and G. Tsouri, "Is PAPR reduction always justified for OFDM?" in Proc.
of the 13th European Wireless Conference (EW), Paris, France, Apr. 1-4,2007.
[62]. J.-H. Kim, C. G. Lee, C. S. Park, S. Hann, and D.-H. Kim, "Visible Light
Communication at 20 Mb/s Using Illumination LEDs," in Proc. SPlE, vol. 6353, no. 40,
Gwangju, South Korea, Sep. 5, 2006.
[63]. H. Elgala, R. Mesleh, H. Haas, and B. Pricope, "OFDM Visible Light Wireless
Communication Based on White LEDs," in Proc. of the 64th IEEE Vehicular
Technology Conference (VTC), Dublin, Ireland, Apr. 22-25,2007.
[64]. P. Moose, "A Technique for Orthogonal Frequency Division Multiplexing Frequency
Offset Correction," IEEE Transactions on Communications, vol. 42, no. 10, pp. 2908-
2914, Oct. 1994
[65]. I. B. Djordjevic and B. Vasic, “100-Gb/s transmission using orthogonal frequency-division
multiplexing,” IEEE Photonics Technol. Lett., vol. 18, pp. 1576-1578, Aug. 2006.
[66]. A. C. Boucouvalas, “Challenges in optical wireless communication,” Optics and Photonics
News Mag., Aug. 2005.
[67]. M. Spetch, S. A. Fechtel, G. Fock, and H. Meyr, “Optimum receiver design for wireless
broad-band systems using OFDM - Part I,” IEEETrans. Commun., vol. 47, pp. 1668-1677,
Nov. 1999.

132
[68]. M. Spetch, S. A. Fechtel, G. Fock, and H. Meyr, “Optimum receiver design for OFDM-
based broadband transmission–part II: a case study,”IEEE Trans. Commun., vol. 49, pp.
571-578, Apr. 2001.
[69]. A. Fort, J. W. Weijers, V. Derudder, W. Eberle, and Bourdoux, “A performance and
complexity comparison of auto-correlation and cross-correlation for OFDM burst
synchronization,” in Proc. ICASSP 2003, Hong Kong, China, Apr. 2003, pp. 341-344.
[70]. H. Ochiai and H. Imai, “On the distribution of the peak-to-average power ratio in OFDM
signal,” IEEE Trans. Commun., vol. 49, pp. 282-289, Feb. 2001.
[71]. Y. Alqudah and M. Kavehrad, “MIMO Characterization of Indoor Wireless Optical Link
Using a Diffuse-Transmission Configuration”, IEEE Transactions on Communication,
VOL: 51, Issue: 9, pp. 1554 – 1560, Sept. 2003.
[72]. Fadlullah, J. and Kavehrad, M., “Indoor High-Bandwidth Optical Wireless Links for
Sensor Networks,” Journal of Lightwave Technology, Vol: 28, Issue: 21, pp. 3086 – 3094,
2010
[73]. S.K.Wilson and J.Armstrong, “Transmitter and receiver methods for improving
asymmetrically-clipped optical OFDM,” IEEE Transactions on Wireless Communications,
September 2009.
[74]. S. Weinstein and P. Ebert, “Data transmission by frequency-division multiplexing using
the discrete fourier transform,” IEEE Transactions on Communications, vol. 19, no. 5, pp.
628–634, October 1971.
[75]. R. N. Bracewell, “Discrete Hartley transform,” J. Opt. Soc. Amer., vol. 73, pp. 1832–1835,
Dec. 1983.

133
[76]. S. Hranilovic, “On the design of bandwidth efficient signaling for indoor wireless optical
channels,” International J. Commun. Syst., vol. 18, pp. 205-228, 2005.
[77]. J. M. Tang and K. A. Shore, “Maximizing the transmission performance of adaptively
modulated optical OFDM signals in multimode-fiber links by optimizing analog-to-digital
converters,” J. Lightwave Technol., vol.LT-25, pp. 787-798, Jan. 2006.
[78]. J. Grubor, S. Randel, K. D. Langer, and J. W. Walewski, “Broadband information
broadcasting using LED-based interior lighting,” J. Lightw. Technol., vol. 26, no. 24, pp.
3883–3892, Dec. 15, 2008.
[79]. S. C. J. Lee, F. Breyer, and S. Randel et al., “Discrete multitone modulation for
maximizing transmission rate in step-index plastic optical fibres,” J. Lightw. Technol., vol.
27, no. 11, pp. 1503–1513, Jun. 1, 2009.
[80]. K. Asadzadeh, A. Dabbo, and S. Hranilovic, “Receiver design for asymmetrically clipped
optical OFDM,” in Proc. IEEE GLOBECOM OWC Workshop, Houston, TX, USA, 2011.
[81]. K. Asadzadeh, A. A. Farid, and S. Hranilovic, “Spectrally factorized optical OFDM,” in
Proc. 12th Can. Workshop Inf. Theory (CWIT), Kelowna, BC, Canada, 2011, pp. 102–
105. D. J. F. Barros, S. K. Wilson, and J. M. Kahn, “Comparison of orthogonal frequency-
division multiplexing and pulse-amplitude modulation in indoor optical wireless links,”
IEEE Trans. Communications, vol.60, pp. 153–163, 2012.
[82]. J. Armstrong, B. J. C. Schmidt, D. Kalra, H. A. Suraweera, and A. J. Lowery,
"Performance of asymmetrically clipped optical OFDM in AWGN for an intensity
modulated direct detection system," presented at IEEE Globecom 2006, San Francisco,
2006.

134
[83]. S. Hranilovic and F. R. Kschischang, "Capacity bounds for power- and band-limited
optical intensity channels corrupted by Gaussian noise," IEEE Trans on Inf. Theory,
vol. 50, pp. 784-95, 2004.
[84]. R. You and J. M. Kahn, "Upper-bounding the capacity of optical IM/DD channels
with multiple-subcarrier modulation and fixed bias using trigonometric moment space
method," IEEE Transactions on Information Theory, vol. 48, pp. 514-23, 2002.
[85]. C. E. Shannon, "A mathematical theory of communication," Bell System Technical
Journal, vol. 27, pp. 379-423 and 623-656, 1948.
[86]. J. A. C. Bingham, “Multicarrier modulation for data transmission: An idea whose time has
come,” IEEE Commun. Mag., vol. 28, pp. 5–14, 1990.
[87]. J. Salz and S. B. Weinstein, “Fourier transform communication system,” in Proc. ACM
Symp. Problems Optim. Data Commun. Syst., Pine Mountain, GA, USA, 1969.
[88]. G. J. Foschini and M. J. Gans, “On limits of wireless communications in a fading
environment when using multiple antennas,” Wireless Pers. Commun., vol. 6, pp. 311–
335, 1998.
[89]. S. K. Wilson and J. Armstrong, “Digital modulation techniques for optical asymmetrically-
clipped OFDM,” in Proc IEEE Wireless Commun. Netw. Conf., Las Vegas, NV, USA,
2008, pp. 538–542.
[90]. N. Cvijetic, D. Qian, and T. Wang, “10 Gb/s free-space optical transmission using
OFDM,” presented at the Proc. OFC/NFOEC 2008, San Diego, CA, 2008, Paper, OTHD2.
[91]. N. Cvijetic and W. Ting, “WiMAX over free-space optics—Evaluating OFDM multi-
subcarrier modulation in optical wireless channels,” in Proc. IEEE Sarnoff Symp.,
Princeton, NJ, USA, 2006.

135
[92]. S. L. Jansen, I. Morita, T. C. W. Schenk, D. van den Borne, and H. Tanaka, “Optical
OFDM—A candidate for future long-haul optical transmission systems,” presented at the
Proc. OFC/NFOEC 2008, San Diego, CA, 2008, Paper, OMU3.
[93]. A. J. Paulraj, D. A. Gore, R. U. Nabar, and H. Bolcskei, “An overview of MIMO
communications—A key to gigabit wireless,” Proc. IEEE, vol. 92, pp. 198–218, 2004.
[94]. S. Jivkova and M. Kavehrad, “Shadowing and blockage in indoor optical wireless
communications,” in Proc. GLOBECOM 2003, pp. 3269–3273.
[95]. S. G. Wilson, M. Brandt-Pearce, C. Qianling, and J. H. Leveque, III, “Free-space optical
MIMO transmission with Q-ary PPM,” IEEE Trans. Commun., vol. 53, pp. 1402–1412,
2005.
[96]. H. A. Suraweera, K. R. Panta, M. Feramez, and J. Armstrong, “OFDM peak-to-average
power reduction scheme with spectral masking,” in Proc Commun. Syst., Netw. Digital
Signal Processing CSNDSP 2004, Newcastle upon Tyne, U.K., Jul. 20–22, 2004.
[97]. J. Armstrong, “Analysis of new and existing methods of reducing intercarrier interference
due to carrier frequency offset in OFDM,” IEEE Trans. Commun., vol. 47, pp. 365–369,
1999.
[98]. T. Pollet, M. Van Bladel, and M. Moeneclaey, “BER sensitivity of OFDM systems to
carrier frequency offset and Wiener phase noise,” IEEE Trans. Commun., vol. 43, pp. 191–
193, 1995.
[99]. D. Kim and G. L. Stüber, “Clipping noise mitigation for OFDM by decision-aided
reconstruction,” IEEE Commun. Lett., vol. 3, pp. 4–6, Jan. 1999.
[100]. C. Tellambura, “Phase optimization criterion for reducing peak-to-average power ratio
for OFDM,” IEE Electron. Lett., vol. 34, no. 32, pp. 169–170, Jan. 1998.

136
[101]. A. Bahai, M. Singh, A. Goldsmith, and B. Saltzberg, “A new approach to evaulating
clipping distortion in multicarrier systems,” IEEE J. Select. Areas Commun., vol. 20, pp.
1037–1045, June 2002.
[102]. D. Fraser, “Interpolation by the FFT revisited – an experimental investigation”,
IEEE Transactions on Acoustics, Speech and Signal Processing, vol 37, no 5, May
1989.
[103]. D. Dardari, V. Tralli, and A. Vaccari, "A theoretical characterization of nonlinear
distortion effects in OFDM systems", IEEE Transactions on Communications, Vol.48,
no. 10, October 2000, pp. 1755-1764.
[104]. Dardari, D., Tralli, V., and Vaccari, A.: ‘A theoretical characterization of nonlinear
distortion effects in OFDM systems’, IEEE Trans. Commun., 48, (10), pp. 1755–1764
[105]. B. R. Saltzberg, “Performance of an efficient parallel data transmission systems,"
IEEE Transactions on Communications Technology, vol. 9, pp. 723-728, Dec. 1967.
[106]. S. B. Weinstein and P. M. Ebert, ”Data transmission by frequency division
multiplexing using the discrete Fourier transform," IEEE Trans. Communications, vol.
19, issue: 5, pp. 628-634, Oct. 1971.
[107]. I. Kalet, “The multitone channel,” IEEE Transactions on Communications, vol. 37,
pp.119-124, February 1989.
[108]. B. Ai, Z. Yang, C. Pan, J. Ge, Y. Wang, Z. Lu, “On the synchronization techniques
for wireless OFDM systems,” IEEE Transactions on Broadcasting, vol. 52, issue 2,
pp: 236-244, June 2006.

137
[109]. J. Armstrong, T. Gill and C. Tellambura, “Performance of PCC-OFDM with overlapping
symbol periods in a multipath channel,” in Proc. IEEE GLOBECOM, November 2000, pp.
87-91.

Vita
Bilal A Ranjha
Bilal A Ranjha is currently a PhD student in Electrical Engineering Department at Pennsylvania
State University. He joined Center for Information and Communications Technology Research
(CICTR) under the supervision of Prof. Mohsen Kavehrad in 2010. He received his MS degree
in Electrical Engineering from Columbia University NY in 2010. His research interests include
digital communication systems, OFDM based wireless communication systems, SCFDMA,
signal processing for wireless communication, MIMO OFDM and optical wireless. He has been
a reviewer for various Journals in the field of optical wireless communications. His research
work has been published and presented in prestigious conferences and journals.