OFC 2004, Los Angeles, CA Restorable Mesh Network Design under Demand Uncertainty: Toward “Future...
12
OFC 2004, Los Angeles, CA Restorable Mesh Network Design under Demand Restorable Mesh Network Design under Demand Uncertainty: Uncertainty: Toward Toward “Future Proofed” “Future Proofed” Transport Investments Transport Investments Dion Leung, Wayne Grover Network Systems, TRLabs University of Alberta, Edmonton {dion.leung, grover}@trlabs.ca
-
date post
21-Dec-2015 -
Category
Documents
-
view
215 -
download
1
Transcript of OFC 2004, Los Angeles, CA Restorable Mesh Network Design under Demand Uncertainty: Toward “Future...
OFC 2004, Los Angeles, CA
Restorable Mesh Network Design under Demand Uncertainty:Restorable Mesh Network Design under Demand Uncertainty:Toward Toward “Future Proofed”“Future Proofed” Transport Investments Transport Investments
Dion Leung, Wayne GroverNetwork Systems, TRLabs
University of Alberta, Edmonton
{dion.leung, grover}@trlabs.ca

OFC 2004, Los Angeles, CA
N1 N2 N3 N4 N5 N6 N7 N8 N9
N1 - 6 4 7 1 5 4 2 1
N2 - - 7 5 5 7 4 1 6
N3 - - - 5 5 12 3 4 2
N4 - - - - 5 2 5 8 2
N5 - - - - - 9 7 2 6
N6 - - - - - - 3 4 5
N7 - - - - - - - 6 1
N8 - - - - - - - - 6
N9 - - - - - - - - -Actual Demand
Increasing Uncertainty in Demand ForecastIncreasing Uncertainty in Demand Forecast
Physical Topology
Optimize…
Deregulation?
New data applications?
Economic variability?Customer churn?
N1 N2 N3 N4 N5 N6 N7 N8 N9
N1 - 3 7 3 1 5 1 2 5
N2 - - 7 5 2 4 1 1 2
N3 - - - 10 5 15 3 4 8
N4 - - - - 6 9 2 2 3
N5 - - - - - 9 3 2 2
N6 - - - - - - 9 7 8
N7 - - - - - - - 3 2
N8 - - - - - - - - 6
N9 - - - - - - - - -Demand Forecast
Network Survivability:• span restoration • path protection
Minimum Cost Design
The min-cost design is no longer optimal…
?
OFC 2004, Los Angeles, CA
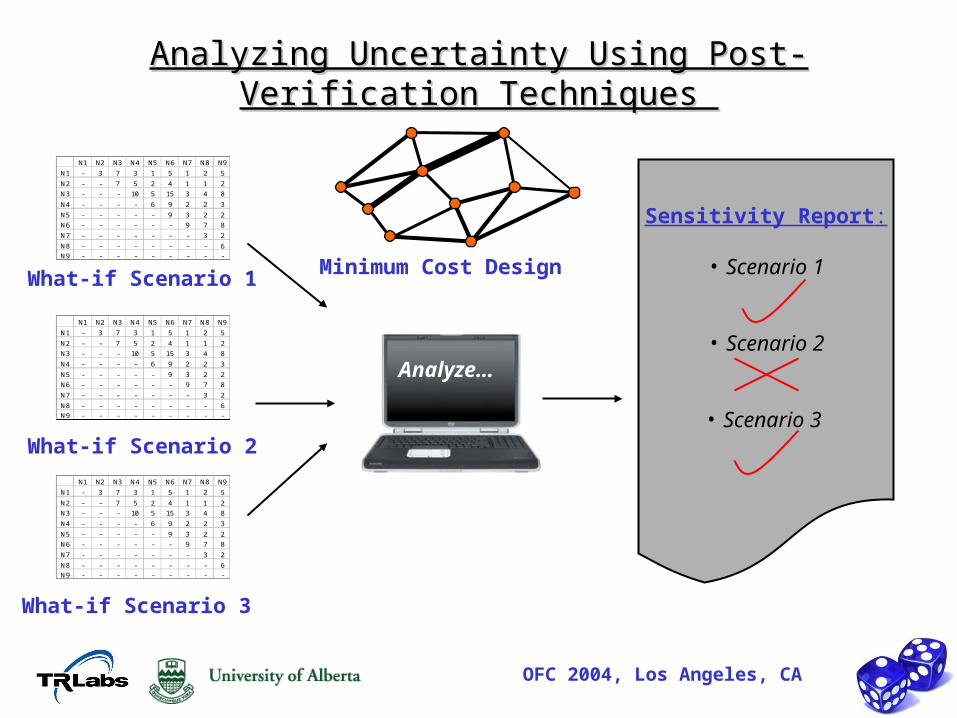
Analyzing Uncertainty Using Post-Verification Techniques Analyzing Uncertainty Using Post-Verification Techniques
Minimum Cost Design
Analyze…
N1 N2 N3 N4 N5 N6 N7 N8 N9
N1 - 3 7 3 1 5 1 2 5
N2 - - 7 5 2 4 1 1 2
N3 - - - 10 5 15 3 4 8
N4 - - - - 6 9 2 2 3
N5 - - - - - 9 3 2 2
N6 - - - - - - 9 7 8
N7 - - - - - - - 3 2
N8 - - - - - - - - 6
N9 - - - - - - - - -
What-if Scenario 1
N1 N2 N3 N4 N5 N6 N7 N8 N9
N1 - 3 7 3 1 5 1 2 5
N2 - - 7 5 2 4 1 1 2
N3 - - - 10 5 15 3 4 8
N4 - - - - 6 9 2 2 3
N5 - - - - - 9 3 2 2
N6 - - - - - - 9 7 8
N7 - - - - - - - 3 2
N8 - - - - - - - - 6
N9 - - - - - - - - -
N1 N2 N3 N4 N5 N6 N7 N8 N9
N1 - 3 7 3 1 5 1 2 5
N2 - - 7 5 2 4 1 1 2
N3 - - - 10 5 15 3 4 8
N4 - - - - 6 9 2 2 3
N5 - - - - - 9 3 2 2
N6 - - - - - - 9 7 8
N7 - - - - - - - 3 2
N8 - - - - - - - - 6
N9 - - - - - - - - -
What-if Scenario 2
What-if Scenario 3
Sensitivity Report:
• Scenario 1
• Scenario 2
• Scenario 3

OFC 2004, Los Angeles, CA
Re-define Capacity Planning as Two-stage Decision ProblemRe-define Capacity Planning as Two-stage Decision Problem
Conventional Design• Use a singlesingle best-guess
forecast for capacity planning
• A single-period planning problem
• Snapshot design optimal to a single moment in time
“Future-Proof” Design• Use multiplemultiple demand scenarios
(e.g. the what-if scenarios) to model demand uncertainty
• Consider “corrective” or recourserecourse action to cope with actual outcome
• Optimize both the presentpresent investment and the expected futurefuture outcomes
Present Investment Future Investment + Recourse

OFC 2004, Los Angeles, CA
Conventional Span-Restorable Capacity Design
Minimize1
( )S
j j jj
C s w
,
1
1,2,...,rQ
r q r
q
g d r D
, ,
1 1
1,2,...,rQD
r q r qj j
r q
w g j S
,1
1,2,...,iP
pi k i
p
f w i S
,1
( , ) 1, 2,..., ,iP
p pj i j i
p
s f i j S i j
Network Cost
Routability Constraint
>> All demands must be routed
Survivability Constraint
>> All demands must be restorable

OFC 2004, Los Angeles, CA
Expected Future Cost
, ,1 1
( ) ( )S U
j j k j kj k
P k R y z
, , ,1
( , ) 1,2,..., , ; 1, 2,...,iP
p pj j k i j i k
p
s z f i j S i j k U
““Future-Proof”Future-Proof” Survivable Network Design
Minimize1
( )S
j j jj
C s w
Initial Design Cost
,
1
1,2,..., ; 1, 2,...,rQ
r q rk k
q
g d r D k U
, ,,
1 1
1,2,..., ; 1, 2,...,rQD
r q r qj j k j k
r q
w y g j S k U
, ,1
1,2,..., ; 1, 2,...,iP
pi k i i k
p
f w y i S k U
Routability Constraint
>> All demands must be routed
Survivability Constraint
>> All demands must be restorable
Allow Recourse: Add Extra Capacity if Needed

OFC 2004, Los Angeles, CA
11 nodes, 26 spans
A Case Study on COST239 NetworkA Case Study on COST239 Network
k = 1
k = 20
P(k=1)
P(k=20)
20 Demand Scenarios Represent Alternate Futures
Prob(k)
For Span APresent Cost, Cspan A
Future Cost, Rspan A= Cspan A*X
For Span BPresent Cost, Cspan B
Recourse Cost, Rspan B*X

OFC 2004, Los Angeles, CA
Comparing Conventional and Future-Proof DesignsComparing Conventional and Future-Proof Designs
Conv. FP-SR Conv. FP-SR Conv. FP-SR Conv. FP-SR
Recourse Cost
Factor 1 * Cj 2 * Cj 3 * Cj 5 * Cj
Initial Cost
202185 203340 202185 644085 202185 703815 202185 789300
Expected Future Cost
407480 405713 814678 132257 1221759 121951 2037106 93781
TotalCost
609665 609053 1016863 776342 1423944 825766 2239291 883081
Difference 0.10% 23.65% 42.01% 60.56%

OFC 2004, Los Angeles, CA
0
200
400
600
800
1000
1200
1400
1600
200 300 400 500 600 700 800 900 1000
Initial Design Cost (in 1000's)
Init
ial +
Ex
pe
cte
d F
utu
re C
os
t (i
n 1
00
0's
)
Recourse = 0.5Recourse = 1Recourse = 2Recourse = 3Recourse = 5Recourse = 10Recourse = 30
Highest Recourse
Tradeoff between Present and Long Term CostsTradeoff between Present and Long Term Costs
Low Recourse

OFC 2004, Los Angeles, CA
Summary and Future WorkSummary and Future Work
• Propose a new approach to design mesh restorable networks under demand uncertaintydemand uncertainty (the model can also be easily adapted to other survivability schemes, such as p-cycles and path protection)
• Define the notion of recourserecourse and show the advantages of considering the design as a two-stagetwo-stage decision problem (possible to extend this problem to a multi-stage problem)
• Suggest a new design strategy of planning against uncertainty for future network planning toolsfuture network planning tools
Present Investment Future Investment + Recourse

OFC 2004, Los Angeles, CA
Illustration of Span (or Link) Restoration SchemeIllustration of Span (or Link) Restoration Scheme
• Localized restoration between the end nodes of the failed span
• Multiple restoration paths are used for a span failure
span X, w1 = 3
span Y, w2 = 5
1
2
12 3
2
Sharing of spare capacities